<strong>RISULTATI</strong> <strong>AL</strong> <strong>31</strong> <strong>DICEMBRE</strong> <strong>2007</strong>INTERNATION<strong>AL</strong> RETAIL BANKING & FINANCI<strong>AL</strong> SERVICES4Q07 4Q06 4Q07 / 3Q07 4Q07 / <strong>2007</strong> 2006 <strong>2007</strong> /In millions of euros 4Q06 3Q07 2006Revenues 2,028 1,904 +6.5% 2,012 +0.8% 7,955 7,374 +7.9%Operating Expenses and Dep. -1,250 -1,135 +10.1% -1,127 +10.9% -4,625 -4,205 +10.0%Gross Operating Income 778 769 +1.2% 885 -12.1% 3,330 3,169 +5.1%Provisions -482 -163 +195.7% -304 +58.6% -1,228 -722 +70.1%Operating Income 296 606 -51.2% 581 -49.1% 2,102 2,447 -14.1%Associated Companies 19 -9 n.s. 19 +0.0% 79 55 +43.6%Other Non Operating Items 16 3 n.s. 69 -76.8% 94 45 +108.9%Pre-Tax Income 3<strong>31</strong> 600 -44.8% 669 -50.5% 2,275 2,547 -10.7%Cost/Income 61.6% 59.6% +2.0 pt 56.0% +5.6 pt 58.1% 57.0% +1.1 ptAllocated Equity (Ebn) 8.0 7.2 +11.6%Pre-Tax ROE 28% 35% -7 ptExchange Rate Effects• USD/EUR: -10,9%/4Q06At constant scope and exchange rates/4Q06• Revenues: +9.9%• Operating expenses: +11.3% (+9.4% excluding restructuring costs)• GOI: +7.8% (+10.4% excluding restructuring costs)Cost of risk: +€<strong>31</strong>9mn/4Q06• BancWest: +€197mn, including a €171mn direct impact of the subprime mortgage crisis• Cetelem: +€88mn due to growing volumes in emerging markets, greater risk levels in Spainand a one-time €28mn write-back in 4Q06Cetelem4Q07 4Q06 4Q07 / 3Q07 4Q07 / <strong>2007</strong> 2006 <strong>2007</strong> /In millions of euros 4Q06 3Q07 2006Revenues 778 690 +12.8% 771 +0.9% 3,020 2,684 +12.5%Operating Expenses and Dep. -447 -430 +4.0% -411 +8.8% -1,675 -1,518 +10.3%Gross Operating Income 3<strong>31</strong> 260 +27.3% 360 -8.1% 1,345 1,166 +15.4%Provisions -189 -101 +87.1% -183 +3.3% -700 -520 +34.6%Operating Income 142 159 -10.7% 177 -19.8% 645 646 -0.2%Associated Companies 18 1 n.s. 16 +12.5% 74 52 +42.3%Other Non Operating Items -1 -1 +0.0% 1 n.s. 0 36 n.s.Pre-Tax Income 159 159 +0.0% 194 -18.0% 719 734 -2.0%Cost/Income 57.5% 62.3% -4.8 pt 53.3% +4.2 pt 55.5% 56.6% -1.1 ptAllocated Equity (Ebn) 2.2 1.9 +16.3%Pre-Tax ROE 33% 39% -6 ptAt constant scope and exchange rates/4Q06: Revenues: +11.3%; Operating expenses: +1.4%; GOI: +27.8%Revenues: +12.8%/4Q06• Continued fast-paced growth outside France, Revenues: +23.6%/4Q06• Pressure on margins in mature marketsOperating expenses: +4.0%/4Q06• +8.5%/4Q06 excluding restructuring costs posted in 4Q06 (18 M€)• Restructuring of the French network completed Cost of risk at 214 bp of risk weighted assets vs. 197 bp in 2006• Stability in France• Economic environment more difficult in Spain• Impact of the fast-paced volume growth in emerging markets22
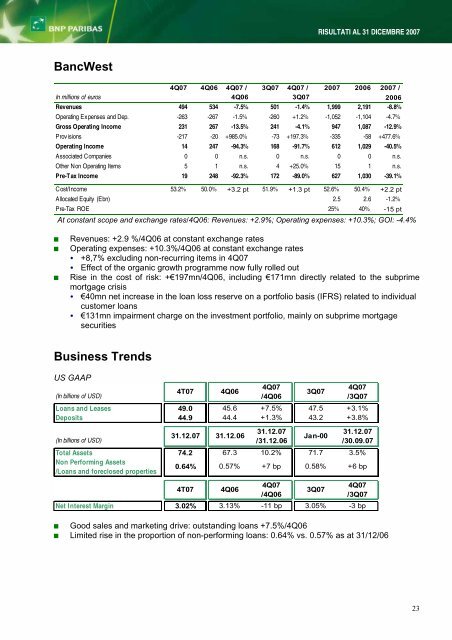
<strong>RISULTATI</strong> <strong>AL</strong> <strong>31</strong> <strong>DICEMBRE</strong> <strong>2007</strong>BancWest4Q07 4Q06 4Q07 / 3Q07 4Q07 / <strong>2007</strong> 2006 <strong>2007</strong> /In millions of euros 4Q06 3Q07 2006Revenues 494 534 -7.5% 501 -1.4% 1,999 2,191 -8.8%Operating Expenses and Dep. -263 -267 -1.5% -260 +1.2% -1,052 -1,104 -4.7%Gross Operating Income 2<strong>31</strong> 267 -13.5% 241 -4.1% 947 1,087 -12.9%Provisions -217 -20 +985.0% -73 +197.3% -335 -58 +477.6%Operating Income 14 247 -94.3% 168 -91.7% 612 1,029 -40.5%Associated Companies 0 0 n.s. 0 n.s. 0 0 n.s.Other Non Operating Items 5 1 n.s. 4 +25.0% 15 1 n.s.Pre-Tax Income 19 248 -92.3% 172 -89.0% 627 1,030 -39.1%Cost/Income 53.2% 50.0% +3.2 pt 51.9% +1.3 pt 52.6% 50.4% +2.2 ptAllocated Equity (Ebn) 2.5 2.6 -1.2%Pre-Tax ROE 25% 40% -15 ptAt constant scope and exchange rates/4Q06: Revenues: +2.9%; Operating expenses: +10.3%; GOI: -4.4%Revenues: +2.9 %/4Q06 at constant exchange ratesOperating expenses: +10.3%/4Q06 at constant exchange rates• +8,7% excluding non-recurring items in 4Q07• Effect of the organic growth programme now fully rolled outRise in the cost of risk: +€197mn/4Q06, including €171mn directly related to the subprimemortgage crisis• €40mn net increase in the loan loss reserve on a portfolio basis (IFRS) related to individualcustomer loans• €1<strong>31</strong>mn impairment charge on the investment portfolio, mainly on subprime mortgagesecuritiesBusiness TrendsUS GAAP4Q074Q074T07 4Q06 3Q07(In billions of USD) /4Q06 /3Q07Loans and Leases 49.0 45.6 +7.5% 47.5 +3.1%Deposits 44.9 44.4 +1.3% 43.2 +3.8%<strong>31</strong>.12.07 <strong>31</strong>.12.07<strong>31</strong>.12.07 <strong>31</strong>.12.06 Jan-00(In billions of USD) /<strong>31</strong>.12.06 /30.09.07Total Assets 74.2 67.3 10.2% 71.7 3.5%Non Performing Assets/Loans and foreclosed properties0.64% 0.57% +7 bp 0.58% +6 bp4T07 4Q064Q074Q073Q07/4Q06 /3Q07Net Interest Margin 3.02% 3.13% -11 bp 3.05% -3 bp Good sales and marketing drive: outstanding loans +7.5%/4Q06 Limited rise in the proportion of non-performing loans: 0.64% vs. 0.57% as at <strong>31</strong>/12/0623


