

Relatório anual 2008
Relatório anual 2008
Relatório anual 2008

You also want an ePaper? Increase the reach of your titles
YUMPU automatically turns print PDFs into web optimized ePapers that Google loves.
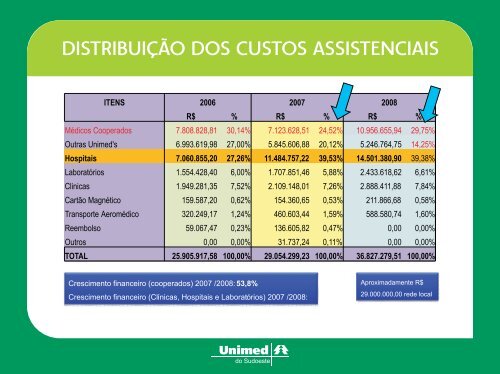
DISTRIBUIÇÃO DOS CUSTOS ASSISTENCIAIS<br />
ITENS 2006 2007 <strong>2008</strong><br />
R$ % R$ % R$ %<br />
Médicos Cooperados 7.808.828,81 30,14% 7.123.628,51 24,52% 10.956.655,94 29,75%<br />
Outras Unimed's 6.993.619,98 27,00% 5.845.606,88 20,12% 5.246.764,75 14,25%<br />
Hospitais 7.060.855,20 27,26% 11.484.757,22 39,53% 14.501.380,90 39,38%<br />
Laboratórios 1.554.428,40 6,00% 1.707.851,46 5,88% 2.433.618,62 6,61%<br />
Clinicas 1.949.281,35 7,52% 2.109.148,01 7,26% 2.888.411,88 7,84%<br />
Cartão Magnético 159.587,20 0,62% 154.360,65 0,53% 211.866,68 0,58%<br />
Transporte Aeromédico 320.249,17 1,24% 460.603,44 1,59% 588.580,74 1,60%<br />
Reembolso 59.067,47 0,23% 136.605,82 0,47% 0,00 0,00%<br />
Outros 0,00 0,00% 31.737,24 0,11% 0,00 0,00%<br />
TOTAL 25.905.917,58 100,00% 29.054.299,23 100,00% 36.827.279,51 100,00%<br />
Crescimento financeiro (cooperados) 2007 /<strong>2008</strong>: 53,8%<br />
Crescimento financeiro (Clínicas, Hospitais e Laboratórios) 2007 /<strong>2008</strong>:<br />
29,5%<br />
Aproximadamente R$<br />
29.000.000,00 rede local