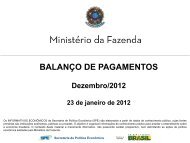
BALANÇO DE PAGAMENTOS Ç - Ministério da Fazenda
BALANÇO DE PAGAMENTOS Ç - Ministério da Fazenda
BALANÇO DE PAGAMENTOS Ç - Ministério da Fazenda

Create successful ePaper yourself
Turn your PDF publications into a flip-book with our unique Google optimized e-Paper software.
<strong>BALAN<strong>Ç</strong>O</strong> <strong>Ç</strong> <strong>DE</strong> <strong>PAGAMENTOS</strong><br />
Setembro/2012<br />
23 de outubro de 2012<br />
Os INFORMATIVOS ECONÔMICOS <strong>da</strong> Secretaria de Política Econômica (SPE) são elaborados a partir de <strong>da</strong>dos de conhecimento público, cujas fontes<br />
primárias p são instituições ç autônomas, públicas p ou priva<strong>da</strong>s. p O objetivo j é organizar g informações ç de conhecimento público p para p ampliar p o entendimento sobre<br />
a economia brasileira. O conteúdo deste material é meramente informativo, não possuindo caráter prospectivo, nem delimitando as ações de política<br />
econômica adota<strong>da</strong>s pelo <strong>Ministério</strong> <strong>da</strong> Fazen<strong>da</strong>.<br />
Secretaria de Política Econômica
Secretaria de Política Econômica<br />
RESULTADO DO <strong>BALAN<strong>Ç</strong>O</strong> <strong>DE</strong> <strong>PAGAMENTOS</strong><br />
(Valores mensais e acumulados no ano – US$ milhões)<br />
setembro t b<br />
2011 2012<br />
2012<br />
Mês Ac. no ano Mês Ac. no ano Projeção<br />
TRANSA<strong>Ç</strong>ÕES CORRENTES -2.234 -36.675 -2.596 -34.123 -53.000<br />
Balança aa ça co comercial e c a ( (FOB) O ) 3.073 30 3 23.060 3 060 2.556 556 15.724 5 18.000 8000<br />
Serviços -3.118 -28.072 -3.459 -29.460 -39.100<br />
Ren<strong>da</strong>s -2.429 -33.951 -1.823 -22.506 -34.700<br />
Transferências unilaterais correntes 240 2.289 130 2.119 2.800<br />
CONTA CAPITAL 181 1.111 114 -2.291 -2.000<br />
CONTA FINANCEIRA 3.244 93.841 2.512 58.563 77.700<br />
Investimento Direto 6.295 52.856 3.307 49.207 60.000<br />
Investimento em Carteira -399 30.819 405 6.224<br />
Outros Investimentos -2.650 10.192 -1.202 3.119<br />
ERROS E OMISSÕES -383 -1.688 53 815<br />
RESULTADO DO <strong>BALAN<strong>Ç</strong>O</strong> Memo:<br />
808 56 56.590 590 84 22 22.964 964<br />
Transações correntes/PIB (%) -2,12 -2,09 -2,31<br />
IED/PIB (%) 269 2,69 285 2,85 261 2,61<br />
Observação: em 2012, projeções do BC<br />
Fonte: BC Elaboração: MF/SPE<br />
2
Secretaria de Política Econômica<br />
400.000<br />
350.000<br />
300 300.000 000<br />
250.000<br />
200.000<br />
150.000<br />
100.000<br />
50.000<br />
0<br />
35.866 37.823 49.296 52.935 53.799<br />
RESERVAS INTERNACIONAIS<br />
Valores anuais – US$ milhões<br />
85.839<br />
193 783<br />
180.334 193.783<br />
238.520<br />
288.575<br />
352.012<br />
378.726<br />
2001 2002 2003 2004 2005 2006 2007 2008 2009 2010 2011 2012<br />
Obs.: para 2012, até setembro.<br />
Fonte: BC Elaboração: MF/SPE 3
Secretaria de Política Econômica<br />
TRANSA<strong>Ç</strong>ÕES CORRENTES<br />
(Valores mensais e acumulados no ano – US$ milhões)<br />
setembro<br />
2011 2012<br />
2012<br />
Mês Ac. no ano Mês Ac. no ano Projeção<br />
TRANSA<strong>Ç</strong>ÕES CORRENTES -2.234 -36.675 -2.596 -34.123 -53.000<br />
BBalança l comercial i l (FOB) 33.073 073 23 23.060 060 22.556 556 15 15.724 724 18 18.000 000<br />
Exportação de bens 23.285 189.999 19.998 180.596 248.000<br />
Importação de bens -20.212 -166.939 -17.442 -164.872 -230.000<br />
Serviços -3.118 -28.072 -3.459 -29.460 -39.100<br />
Receita 3.234 27.974 2.775 29.663<br />
Despesa -66.351 351 -56 56.046 046 -66.234 234 -59 59.123 123<br />
Ren<strong>da</strong>s -2.429 -33.951 -1.823 -22.506 -34.700<br />
Receita 924 8.185 624 9.156<br />
Despesa -3.353 -42.136 -2.447 -31.663<br />
Transferências unilaterais correntes 240 2.289 130 2.119 2.800<br />
Receita 381 3.646 306 3.410<br />
Despesa -141 -1.358 -176 -1.291<br />
Fonte: BC Elaboração: MF/SPE<br />
4
Secretaria de Política Econômica<br />
TRANSA<strong>Ç</strong>ÕES S <strong>Ç</strong>Õ S CO CORRENTES: S SERVI<strong>Ç</strong>OS S <strong>Ç</strong>OS SSELECIONADOS C O OS<br />
(Valores mensais e acumulados no ano – US$ milhões)<br />
setembro<br />
2011 2012<br />
Mês Ac. no ano Mês Ac. no ano<br />
Serviços -3.118 -28.072 -3.459 -29.460<br />
Transportes -783 -5.973 -740 -6.405<br />
Viagens internacionais -1.290 -11.345 -1.262 -11.338<br />
Computação p ç e informação ç<br />
-265 -2.922 -235 -2.879<br />
Royalties e licenças -283 -1.996 -348 -2.356<br />
Aluguel de equipamentos -1.398 1.398 -12.007 12.007 -1.529 1.529 -13.685 13.685<br />
Empresariais, profissionais e técnicos 1.115 8.204 728 8.741<br />
Demais -214 -2 -2.032 032 -73 -1 -1.538 538<br />
Fonte: BC Elaboração: MF/SPE<br />
5
Secretaria de Política Econômica<br />
TRANSA<strong>Ç</strong>ÕES CORRENTES: RENDAS<br />
(Valores mensais e acumulados no ano – US$ milhões)<br />
setembro<br />
2011 2012<br />
Mês Ac. no ano Mês Ac. no ano<br />
Ren<strong>da</strong>s -2.429 -33.951 -1.823 -22.506<br />
Ren<strong>da</strong> de investimento direto -1.659 -20.900 -1.367 -11.829<br />
Ren<strong>da</strong> de investimento em carteira -491 -8.956 -145 -7.167<br />
Ren<strong>da</strong> de outros investimentos (juros) (j )<br />
-340 -4.531 -342 -3.903<br />
Salário e ordenado 61 436 31 393<br />
Memo:<br />
LLucros e Di Dividendos id d -1.961 1961 -27.660 2 660 -1.129 1 129 -15.352 1 3 2<br />
Receita 203 1.080 39 4.224<br />
Despesa -2.164 -28.740 -1.168 -19.576<br />
Juros -529 -6.727 -726 -7.547<br />
Receita 653 6.599 548 4.478<br />
Despesa -1 -1.183 183 -13 -13.326 326 -1 -1.274 274 -12 -12.026 026<br />
Fonte: BC Elaboração: MF/SPE<br />
6
Secretaria de Política Econômica<br />
TRANSA<strong>Ç</strong>ÕES <strong>Ç</strong> CORRENTES<br />
(Valores anuais – US$ milhões)<br />
2007 2008 2009 2010 2011 2012<br />
TRANSA<strong>Ç</strong>ÕES CORRENTES 11.551 551 -28 -28.192 192 -24 -24.302 302 -47 -47.273 273 -52 -52.480 480 -49 -49.928 928<br />
Balança comercial (FOB) 40.032 24.836 25.290 20.147 29.807 22.471<br />
Exportação de bens 160.649 197.942 152.995 201.915 256.040 246.637<br />
Importação de bens -120.617 -173.107 -127.705 -181.768 -226.233 -224.166<br />
Serviços -13.219 -16.690 -19.245 -30.835 -37.952 -39.340<br />
Transportes -4.384 -4.994 -3.926 -6.407 -8.334 -8.766<br />
Viagens internacionais -3.258 -5.177 -5.594 -10.718 -14.709 -14.702<br />
Computação e informação -22.112 112 -2598 2.598 -2586 2.586 -33.296 296 -33.800 800 -3756 3.756<br />
Royalties e licenças -1.940 -2.232 -2.078 -2.453 -2.710 -3.070<br />
Aluguel de equipamentos -5.771 -7.808 -9.393 -13.752 -16.686 -18.364<br />
Empresariais, profissionais e técnicos 6.230 8.147 7.297 8.413 10.699 11.236<br />
Demais -1.984 -2.027 -2.966 -2.623 -2.411 -1.917<br />
Ren<strong>da</strong>s -29.291 -40.562 -33.684 -39.486 -47.319 -35.874<br />
Juros -7.305 -7.232 -9.069 -9.610 -9.719 -10.540<br />
Lucros e dividendos -22 22.435 435 -33 33.875 875 -25 25.218 218 -30 30.375 375 -38 38.166 166 -25 25.858 858<br />
Salário e ordenado 448 545 603 498 567 524<br />
Transferências unilaterais correntes 4.029 4.224 3.338 2.902 2.984 2.815<br />
Memo: Transações Correntes (% do PIB) 0,11% -1,71% 1,71% -1,49% 1,49% -2,20% 2,20% -2,12% 2,12% -2,15% 2,15%<br />
Obs.: para 2012, acumulado nos últimos 12 meses até setembro.<br />
Fonte: BC Elaboração: MF/SPE<br />
7
Secretaria de Política Econômica<br />
60,0<br />
40,0<br />
20 20,0 0<br />
0,0<br />
-20,0<br />
-40 -40,0 0<br />
-60,0<br />
TRANSA<strong>Ç</strong>ÕES CORRENTES - COMPONENTES<br />
(Saldos acumulados em 12 meses – US$ bilhões)<br />
set set set set set set set set set set set set<br />
01 02 03 04 05 06 07 08 09 10 11 12<br />
TRANSA<strong>Ç</strong>ÕES CORRENTES Balança comercial (FOB)<br />
Serviços Ren<strong>da</strong>s<br />
Fonte: BC Elaboração: MF/SPE<br />
22,5<br />
-35,9<br />
-39,3 39 3<br />
-49,9<br />
8
Secretaria de Política Econômica<br />
300,0<br />
250,0<br />
200 200,0 0<br />
150,0<br />
100,0<br />
50,0<br />
0,0<br />
set<br />
02<br />
BALAN<strong>Ç</strong>A <strong>Ç</strong> COMERCIAL<br />
(Valores acumulados em 12 meses – US$ bilhões)<br />
set<br />
03<br />
set<br />
04<br />
set<br />
05<br />
set<br />
06<br />
Fonte: BC Elaboração: MF/SPE<br />
set<br />
07<br />
set<br />
08<br />
set<br />
09<br />
set<br />
10<br />
Exportações de bens Importações de bens<br />
set 11 set<br />
12<br />
246,6<br />
224,2<br />
9
Secretaria de Política Econômica<br />
0,0<br />
-5,0<br />
-10,0<br />
-15,0<br />
-20,0<br />
-25,0 25 0<br />
-30,0<br />
-35,0 35,0<br />
-40,0<br />
-45,0<br />
SERVI<strong>Ç</strong>OS <strong>Ç</strong> E RENDAS<br />
(Saldos acumulados em 12 meses – US$ bilhões)<br />
SServiços i RRen<strong>da</strong>s d<br />
-50,0<br />
set 01 set 02 set 03 set 04 set 05 set 06 set 07 set 08 set 09 set 10 set 11 set 12<br />
Fonte: BC Elaboração: MF/SPE<br />
-35,9<br />
-39,3<br />
10
11 11,0 0<br />
6,0<br />
10 1,0<br />
-4,0<br />
-9,0 90<br />
-14,0<br />
-19,0 19 0<br />
Secretaria de Política Econômica<br />
set-01<br />
mar-02<br />
set-02<br />
SERVI<strong>Ç</strong>OS <strong>Ç</strong> SELECIONADOS<br />
(Saldos acumulados em 12 meses – US$ bilhões)<br />
mar-03<br />
set-03<br />
mar-04<br />
set-04<br />
mar-05<br />
set-05<br />
mar-06<br />
set-06<br />
mar-07<br />
set-07<br />
mar-08<br />
set-08<br />
mar-09<br />
set-09<br />
mar-10<br />
set-10<br />
Transportes Viagens internacionais<br />
mar-11<br />
set-11<br />
Aluguel de equipamentos Empresariais Empresariais, profissionais e técnicos<br />
Fonte: BC Elaboração: MF/SPE<br />
mar-12<br />
set-12<br />
11,24<br />
-8,77<br />
-14,70<br />
-18,36 18 36<br />
11
Secretaria de Política Econômica<br />
0,0<br />
-5,0<br />
-10,0<br />
-15,0<br />
-20,0<br />
-25,0<br />
-30,0<br />
-35,0<br />
-40,0<br />
Ren<strong>da</strong>s (Juros ( e Lucros e Dividendos) )<br />
(Saldos acumulados em 12 meses – US$ bilhões)<br />
Juros Lucros e dividendos L&D (Investimento ( Direto) ) L&D (Ações) ( ç )<br />
Fonte: BC Elaboração: MF/SPE<br />
‐7,83<br />
-10,54 10 54<br />
-18,03<br />
-25,86<br />
12
US$ (bilhhões)<br />
Secretaria de Política Econômica<br />
SALDO DA CONTA CORRENTE: EXPECTATIVAS <strong>DE</strong> MERCADO<br />
(mediana)<br />
-50,0 50 0<br />
-55,0<br />
-60,0<br />
-65,0<br />
-70,0<br />
-75,0<br />
-80,0<br />
out 11<br />
nov 11<br />
dez 11<br />
jan 12<br />
fev 12<br />
mar 12<br />
abr 12<br />
mai 12<br />
jun 12<br />
2012 2013<br />
jul 12<br />
ago 12<br />
set 12<br />
out 12<br />
-56,00<br />
-65,90<br />
Fonte: BCB. Elaboração: MF/SPE 13
Secretaria de Política Econômica<br />
CONTA CAPITAL E FINANCEIRA<br />
(Valores mensais e acumulados no ano – US$ milhões)<br />
setembro<br />
2011 2012<br />
Mês Ac. no ano Mês Ac. no ano<br />
CONTA CAPITAL E FINANCEIRA 3.425 94.952 2.627 56.272<br />
Conta Capital 181 1.111 114 -2.291<br />
Conta Financeira 3.244 93.841 2.512 58.563<br />
Investimento Direto 6.295 52.856 3.307 49.207<br />
Investimento brasileiro direto -10 2.470 -1.086 1.631<br />
Investimento estrangeiro direto 6.305 50.386 4.393 47.576<br />
Investimento em Carteira -399 30 30.819 819 405 66.224 224<br />
Investimento brasileiro em carteira 534 14.890 -578 -6.078<br />
Ações de companhias estrangeiras 542 8.575 -37 -1.536<br />
Títulos de ren<strong>da</strong> fixa LP e CP -9 6.314 -542 -4.541<br />
Investimento estrangeiro em carteira -933 15.930 983 12.301<br />
Ações de companhias brasileiras 409 5.956 -1.227 2.898<br />
Títulos de ren<strong>da</strong> fixa LP e CP -1.341 9.974 2.210 9.403<br />
Derivativos (líquido) -22 -27 27 3 13<br />
Ativos (líquido) 9 189 11 101<br />
Passivos (líquido) -11 -216 -8 -87<br />
Outros Investimentos -2.650 10.192 -1.202 3.119<br />
OOutros t investimentos i ti t brasileiros b il i -4.625 4 625 -33.380 33 380 -2.128 2 128 -13.318 13 318<br />
Outros investimentos estrangeiros (líquido) 1.976 43.573 926 16.437<br />
Fonte: BC Elaboração: MF/SPE<br />
14
Secretaria de Política Econômica<br />
INVESTIMENTO ESTRANGEIRO DIRETO (IED)<br />
(Valores mensais e acumulados no ano – US$ milhões)<br />
setembro<br />
2011 2012<br />
Mês Ac. no ano Mês Ac. no ano<br />
Investimento estrangeiro direto 6.305 50.386 4.393 47.576<br />
Participação no capital 5.364 40.210 2.875 37.762<br />
Ingresso 5978 5.978 52 52.129 129 3084 3.084 41 41.143 143<br />
Saí<strong>da</strong> -614 -11.919 -209 -3.381<br />
Empréstimo intercompanhia 941 10.176 1.518 9.814<br />
CCrédito édit 3268 3.268 25 25.734 734 2260 2.260 17 17.180 180<br />
Débito -2.327 -15.558 -742 -7.366<br />
Necessi<strong>da</strong>de de Financiamento Externo (NFE) -4.072 -13.711 -1.797 -13.453<br />
NFE=(Déficit em transações correntes)‐(IED)<br />
Fonte: BC Elaboração: MF/SPE<br />
15
Secretaria de Política Econômica<br />
INVESTIMENTO ESTRANGEIRO EM CARTEIRA<br />
(Valores mensais e acumulados no ano – US$ milhões)<br />
setembro<br />
2011 2012<br />
Mês Ac. no ano Mês Ac. no ano<br />
Investimento estrangeiro em carteira -933 15.930 983 12.301<br />
Títulos negociados no país e DR's -16 5.426 -491 6.993<br />
Ações de companhias brasileiras 409 5.956 -1.227 2.898<br />
Títulos de ren<strong>da</strong> fixa -425 -530 736 4.094<br />
Títulos negociados no exterior -917 917 10.504 1.474 5.309<br />
Bônus LP -594 -4.666 201 170<br />
Notes e commercial papers LP 60 18.666 1.273 5.263<br />
Títulos de ren<strong>da</strong> fixa CP -383 -3.496 0 -125<br />
DR’s são Depositary Receipts e representam as ações de companhias brasileiras negocia<strong>da</strong>s no<br />
exterior.<br />
Fonte: BC Elaboração: MF/SPE<br />
16
Secretaria de Política Econômica<br />
OUTROS INVESTIMENTOS ESTRANGEIROS<br />
(Valores mensais e acumulados no ano – US$ milhões)<br />
setembro<br />
2011 2012<br />
Mês Ac. no ano Mês Ac. no ano<br />
Outros investimentos estrangeiros g (líquido) ( q )<br />
1.976 43.573 926 16.437<br />
Créditos comerciais 3.969 22.244 -1.070 9.661<br />
Crédito comercial - fornecedores LP -96 -1.079 -39 -398<br />
Crédito comercial - fornecedores CP 3.351 18.712 -439 13.996<br />
Compradores 715 4.611 -593 -3.938<br />
Empréstimos ao Banco Central 0 0 0 0<br />
Empréstimos e financiamentos - demais setores -1.176 25.964 2.190 9.546<br />
Organismos e Agências 312 -1.732 666 2.352<br />
Empréstimos diretos 968 23.258 1.534 7.764<br />
Empréstimos e financiamentos CP -2.457 4.438 -10 -570<br />
Moe<strong>da</strong> e depósito -817 -4.635 -194 -2.770<br />
Fonte: BC Elaboração: MF/SPE<br />
17
Secretaria de Política Econômica<br />
INVESTIMENTOS ESTRANGEIROS<br />
Valores líquidos anuais – US$ milhões<br />
2007 2008 2009 2010 2011 2012<br />
Investimento estrangeiro direto 34.585 45.058 25.949 48.506 66.660 63.851<br />
Memo: NFE = TC - IED -36.136 -16.866 -1.646 -1.233 -14.180 -13.922<br />
IInvestimento ti t estrangeiro t i em carteira t i 48 48.104 104 -767 767 46 46.159 159 67 67.795 795 18 18.453 453 14 14.824 824<br />
Ações de companhias brasileiras 26.217 -7.565 37.071 37.671 7.174 4.117<br />
Títulos de ren<strong>da</strong> fixa (no país) 20.482 15.289 10.077 14.601 -61 4.564<br />
Títulos de ren<strong>da</strong> fixa (no exterior) 1.405 -8.491 -989 15.523 11.339 6.144<br />
Outros investimentos estrangeiros 31.683 8.143 14.076 41.543 46.796 19.661<br />
Crédito Comercial (1) 22 22.204 204 10 10.966 966 88.059 059 44.037 037 26 26.634 634 14 14.051 051<br />
Empréstimos Diretos de LP -6.062 2.583 -1.209 6.157 27.484 11.990<br />
Autori<strong>da</strong>de monetária -138 0 0 -4 0 0<br />
Demais (2) 15 15.680 680 -5.405 5 405 77.226 226 31 31.352 352 -7.322 7322 -6.380 6380<br />
(1) Inclui crédito comercial de fornecedores de CP e de LP e crédito comercial de compradores.<br />
(2) Inclui empréstimos de Organismos Organismos, Agências Agências, empréstimos diretos de curto prazo prazo, moe<strong>da</strong> e depósitos e outros passivos passivos.<br />
Observação: para 2012, valores acumulados em 12 meses até setembro.<br />
Fonte: BC Elaboração: MF/SPE<br />
18
Secretaria de Política Econômica<br />
70 70.000 000<br />
60.000<br />
50.000<br />
40.000<br />
30.000<br />
20.000<br />
10.000<br />
0<br />
INVESTIMENTO ESTRANGEIRO DIRETO<br />
Valores líquidos anuais – US$ milhões<br />
63 63.851 851<br />
2001 2002 2003 2004 2005 2006 2007 2008 2009 2010 2011 2012<br />
Obs.: para 2012, acumulado nos últimos 12 meses até setembro.<br />
Fonte: BC Elaboração: MF/SPE<br />
19
Secretaria de Política Econômica<br />
10.000<br />
5.000<br />
0<br />
-5.000<br />
-10.000<br />
-15.000 15 000<br />
-20.000<br />
-25.000<br />
-30.000<br />
-35.000<br />
-40.000<br />
NECESSIDA<strong>DE</strong> <strong>DE</strong> FINANCIAMENTO EXTERNO<br />
Valores líquidos anuais – US$ milhões<br />
NFE = TC - IED<br />
-13.922<br />
2001 2002 2003 2004 2005 2006 2007 2008 2009 2010 2011 2012<br />
Obs.: para 2012, acumulado nos últimos 12 meses até setembro.<br />
Fonte: BC Elaboração: MF/SPE<br />
20
US$ (bilhões)<br />
Secretaria de Política Econômica<br />
65,0<br />
60 60,0 0<br />
55,0<br />
50 50,0 0<br />
45,0<br />
40 40,0 0<br />
35,0<br />
11<br />
out<br />
EXPECTATIVAS <strong>DE</strong> MERCADO PARA<br />
O INVESTIMENTO ESTRANGEIRO DIRETO LÍQUIDO<br />
(mediana) – US$ bilhões<br />
11<br />
nov<br />
11<br />
dez<br />
12<br />
jan<br />
12<br />
fev<br />
mar 12<br />
Fonte: BC Elaboração: MF/SPE<br />
12<br />
abr<br />
12<br />
mai<br />
2012 2013<br />
12<br />
jun<br />
12<br />
jul<br />
12<br />
ago<br />
12<br />
set<br />
60,00<br />
59,68<br />
12<br />
out<br />
21
Secretaria de Política Econômica<br />
INVESTIMENTOS BRASILEIROS NO EXTERIOR<br />
(Valores mensais e acumulados no ano – US$ milhões)<br />
setembro<br />
2011 2012<br />
Mês Ac. no ano Mês Ac. no ano<br />
Investimentos brasileiros no exterior (líquido) -4.102 -16.020 -3.793 -17.765<br />
Investimento brasileiro direto -10 10 22.470 470 -1.086 1 086 1631 1.631<br />
Investimento brasileiro em carteira 534 14.890 -578 -6.078<br />
Ações de companhias estrangeiras 542 8.575 -37 -1.536<br />
Títulos de ren<strong>da</strong> fixa LP e CP -9 6.314 -542 -4.541<br />
Outros investimentos brasileiros -4.625 -33.380 -2.128 -13.318<br />
Dos quais: depósitos de bancos -2.757 -2.988 612 -2.652<br />
Fonte: BC Elaboração: MF/SPE<br />
22
50%<br />
45%<br />
40%<br />
35%<br />
30%<br />
25%<br />
20%<br />
15%<br />
10%<br />
Secretaria de Política Econômica<br />
5%<br />
0%<br />
POSI<strong>Ç</strong>ÃO INTERNACIONAL <strong>DE</strong> INVESTIMENTO<br />
PASSIVO EXTERNO LÍQUIDO (% do PIB)<br />
28,9%<br />
2002 2003 2004 2005 2006 2007 2008 2009 2010 2011 2012*<br />
*/ Estimativa para setembro/12.<br />
Fonte: BC Elaboração: MF/SPE<br />
23
Secretaria de Política Econômica<br />
100%<br />
90%<br />
80%<br />
70%<br />
60%<br />
50%<br />
40%<br />
30%<br />
20%<br />
10%<br />
0%<br />
26 26,4% 4% 26 26,5% 5%<br />
30,6%<br />
30,9%<br />
9,9%<br />
32,8%<br />
32,1%<br />
7,9%<br />
29,4%<br />
COMPOSI<strong>Ç</strong>ÃO DO PASSIVO EXTERNO<br />
27,8%<br />
13,1%<br />
32,7%<br />
22,4%<br />
24 24,1% 1%<br />
17 17,3% 3%<br />
36,1%<br />
14,2% 13,4% 11,0%<br />
21,5%<br />
25,1%<br />
18,0%<br />
39,2% 37,9%<br />
15,8%<br />
16,8%<br />
19,9%<br />
30,7% 39,6% 21,6%<br />
33,6%<br />
41,6%<br />
10,9% 11,0% 13,6% 13,2%<br />
17,2%<br />
34,9%<br />
37,1%<br />
15,0%<br />
29,1%<br />
16,4% 17,5%<br />
24,1% 23,3%<br />
44 44,9% 9% 45 45,9% 9% 45 45,9% 9%<br />
2001 2002 2003 2004 2005 2006 2007 2008 2009 2010 2011 2012*<br />
*/ Estimativa para setembro/12<br />
Investimento Direto Ações Ren<strong>da</strong> Fixa Outros Passivos<br />
Fonte: BC Elaboração: MF/SPE<br />
24
Secretaria de Política Econômica<br />
DÍVIDA EXTERNA<br />
US$ milhões<br />
2007 2008 2009 2010 2011 2012<br />
Dívi<strong>da</strong> Externa Bruta* (US$ bilhões) 193,2 198,3 198,2 256,8 298,2 309,2<br />
Pública (Part. %) 44,5 42,4 48,2 40,5 34,4 35,0<br />
Privado** Privado (Part (Part. %) 55 55,5 5 57 57,6 6 51 51,8 8 59 59,5 5 65 65,6 6 65 65,0 0<br />
Curto Prazo (Part. %) 20,1 18,4 15,6 22,3 13,5 12,0<br />
Médio e Longo Prazo (Part. %) 79,9 81,6 84,4 77,7 86,5 88,0<br />
Juros / Export. bens e serviços serviços*** (%) 8,3 6,8 7,7 5,8 5,3 4,9<br />
Dívi<strong>da</strong> Ext. Líq. (<strong>DE</strong>L)**** (US$ bilhões) -11,9 -27,7 -61,8 -50,6 -72,9 -90,8<br />
<strong>DE</strong>L / PIB (12 meses) -0,9 -1,7 -3,8 -2,4 -2,9 -3,9<br />
<strong>DE</strong>L / Export. po de be bens s e se serviços*** ços ( (12 m) ) -0,1 0, -0,1 0, -0,3 0,3 -0,2 0, -0,2 0, -0,3 0,3<br />
Reservas / Dívi<strong>da</strong> Ext. (%) 93,3 97,7 120,3 112,4 118,0 122,5<br />
(*) Exclui Empréstimos Intercompanhias.<br />
(**) Inclui Setor Público Financeiro.<br />
(***) PPara 2012 2012, valores l referentes f ao acumuladoem l d 12 meses até é setembro. b<br />
(****) Dívi<strong>da</strong> Externa Bruta menos Reservas internacionais, Créditos brasileiros no exterior e Haveres de bancos comerciais.<br />
Fonte: BC Elaboração: MF/SPE<br />
25
50<br />
40<br />
30<br />
20<br />
10<br />
0<br />
-10<br />
Secretaria de Política Econômica<br />
20,6<br />
11,2 1<br />
19966<br />
22,0<br />
19977<br />
14,1<br />
26,5 2<br />
19988<br />
19,5<br />
38, ,4<br />
19999<br />
*/ Estimativa para setembro/12<br />
29,7<br />
33,6<br />
DÍVIDA EXTERNA (% PIB) )<br />
20000<br />
26,5 2<br />
37,99<br />
2001<br />
29,4<br />
41,8 4<br />
20022<br />
32,7<br />
38,8<br />
20033<br />
27,3<br />
30,3<br />
20044<br />
20,4<br />
19,2<br />
11,5 1<br />
15,9<br />
Dívi<strong>da</strong> Externa Total / PIB Dívi<strong>da</strong> Externa Total Líqui<strong>da</strong> / PIB<br />
Fonte: BC Elaboração: MF/SPE<br />
20055<br />
20066<br />
6,9<br />
14,1<br />
20077<br />
(0,9)<br />
12,0<br />
20088<br />
(1,7)<br />
12,2 1<br />
(3,8)<br />
20099<br />
12,0<br />
(2,4)<br />
20100<br />
12,0<br />
(2,9)<br />
2011<br />
26<br />
13,3<br />
(3,9)<br />
20122*
Secretaria de Política Econômica<br />
TAXA <strong>DE</strong> ROLAGEM O G<br />
Empréstimos diretos e papéis de curto e longo prazos<br />
(Percentuais mensais e acumulados no ano)<br />
setembro<br />
Taxa de rolagem de Notes e Commercial Papers de LP e CP<br />
e de Empréstimos Diretos de LP<br />
400%<br />
300%<br />
200%<br />
100%<br />
0%<br />
*/ Estimativa para setembro/12<br />
Fonte: BC Elaboração: MF/SPE<br />
2011 2012<br />
Mês Ac. no ano Mês Ac. no ano<br />
144 144,8% 8% 320 320,0% 0% 367 367,4% 4% 219 219,9% 9%<br />
213,0%<br />
27
Secretaria de Política Econômica<br />
1,22<br />
18,1<br />
4,8<br />
Indicadores de Vulnerabili<strong>da</strong>de Externa<br />
29 2,9<br />
31,5<br />
15 1,5<br />
3,8 ,<br />
(% do PIB)<br />
42,9<br />
26 2,6<br />
20 2,0<br />
26,5<br />
5,3<br />
12,0 11,7<br />
16,3<br />
13,3<br />
‐6,8 ,<br />
‐6,0<br />
‐0,5<br />
‐4,0<br />
‐1,7 ‐1,7<br />
‐3,9<br />
‐2,15<br />
1974 1982 1987 1998 2008 2012<br />
Impacto do 1o<br />
choque do<br />
petróleo<br />
Crise <strong>da</strong> dívi<strong>da</strong> Moratória <strong>da</strong> Situação antes do<br />
externa dívi<strong>da</strong> externa fim do Plano Real<br />
Dívi<strong>da</strong> externa líqui<strong>da</strong>/PIB (%) - anual Dívi<strong>da</strong> externa total<br />
Reservas Internacionais Transações Correntes<br />
Fonte: BC Elaboração: MF/SPE<br />
Crise<br />
financeira<br />
internacional<br />
Situação Atual<br />
(Setembro/2012)<br />
28
Secretaria de Política Econômica<br />
<strong>BALAN<strong>Ç</strong>O</strong> <strong>Ç</strong> <strong>DE</strong> <strong>PAGAMENTOS</strong> – AGOSTO/2012<br />
RESUMO DOS RESULTADOS<br />
• Balanço de pagamentos de setembro/2012 superavitário em US$ 84 milhões.<br />
Resultado abaixo do registrado em agosto/2012: US$493 milhões<br />
• Transações ç correntes: déficit de US$2,6 , bilhões<br />
Resultado inferior ao registrado em setembro de 2011 (déficit de US$36,7 bi.),<br />
acumulando US$49,9 bilhões nos últimos 12 meses, equivalentes a 2,15% PIB.<br />
Transferências de ren<strong>da</strong> para o exterior: Remessas líqui<strong>da</strong>s de lucros e<br />
dividendos atingiram US$ 1,1 bilhão em setembro, abaixo do registrado em agosto<br />
(US$ 2,5 bilhões) e abaixo do resultado no mesmo período de 2011 (US$ 2,0<br />
bilhões). No acumulado do ano, o resultado registrado é quase a metade do<br />
acumulado em 2011: de US$27,7 bilhões para US$15,3 bi.<br />
Comércio de serviços: déficit de US$3,5 bilhões, abaixo do registrado em agosto<br />
(US$ 3,0 bilhões) e em set/2011 (US$ 3,1 bilhões).<br />
29
Secretaria de Política Econômica<br />
• Conta Capital e Financeira: superávit de US$2,6 bilhões<br />
IED: permanece como a principal fonte de financiamento: US$3,3 bilhões em<br />
setembro, inferior aos US$ 6,3 bilhões registrados em set/2011. Em 12 meses,<br />
atingiu US$63,8 bilhões (2,75% do PIB).<br />
Investimentos estrangeiros em ações: retorno de US$1,2 bilhões em set/2012,<br />
inferior à captação de US$409 milhões registra<strong>da</strong> em setembro/2011.<br />
Notes e commercial papers: ingressos líquidos de US$1,3 bilhão, acima dos US$60<br />
milhões registrados em set/2011.<br />
Investimentos estrangeiros em títulos de ren<strong>da</strong> fixa negociados no país: ingresso<br />
de US$736 milhões. No ano, a conta registra saldo positivo de US$4,1 bilhões, ao<br />
contrário do déficit no mesmo período de 2011 (US$530 $ milhões).<br />
Investimentos brasileiros no exterior: aplicações de US$3,8 bilhões.<br />
Dívi<strong>da</strong> externa total em setembro: US$309,2 bilhões (13,3% do PIB), abaixo do<br />
saldo <strong>da</strong>s reservas internacionais de US$378,7 bilhões (16,3% do PIB).<br />
30
Secretaria de Política Econômica