programa de reabilitação da área central de são paulo
programa de reabilitação da área central de são paulo
programa de reabilitação da área central de são paulo
You also want an ePaper? Increase the reach of your titles
YUMPU automatically turns print PDFs into web optimized ePapers that Google loves.
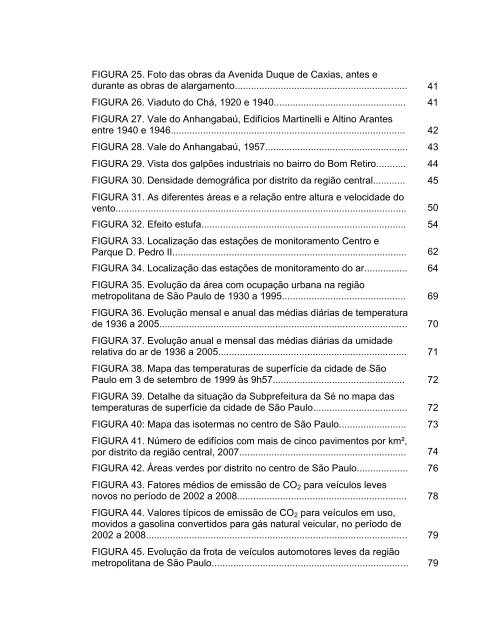
FIGURA 25. Foto <strong>da</strong>s obras <strong>da</strong> Aveni<strong>da</strong> Duque <strong>de</strong> Caxias, antes e<br />
durante as obras <strong>de</strong> alargamento................................................................<br />
FIGURA 26. Viaduto do Chá, 1920 e 1940................................................. 41<br />
FIGURA 27. Vale do Anhangabaú, Edifícios Martinelli e Altino Arantes<br />
entre 1940 e 1946.......................................................................................<br />
FIGURA 28. Vale do Anhangabaú, 1957..................................................... 43<br />
FIGURA 29. Vista dos galpões industriais no bairro do Bom Retiro........... 44<br />
FIGURA 30. Densi<strong>da</strong><strong>de</strong> <strong>de</strong>mográfica por distrito <strong>da</strong> região <strong>central</strong>............ 45<br />
FIGURA 31. As diferentes <strong>área</strong>s e a relação entre altura e veloci<strong>da</strong><strong>de</strong> do<br />
vento............................................................................................................ 50<br />
FIGURA 32. Efeito estufa............................................................................ 54<br />
FIGURA 33. Localização <strong>da</strong>s estações <strong>de</strong> monitoramento Centro e<br />
Parque D. Pedro II....................................................................................... 62<br />
FIGURA 34. Localização <strong>da</strong>s estações <strong>de</strong> monitoramento do ar................ 64<br />
FIGURA 35. Evolução <strong>da</strong> <strong>área</strong> com ocupação urbana na região<br />
metropolitana <strong>de</strong> São Paulo <strong>de</strong> 1930 a 1995..............................................<br />
FIGURA 36. Evolução mensal e anual <strong>da</strong>s médias diárias <strong>de</strong> temperatura<br />
<strong>de</strong> 1936 a 2005............................................................................................<br />
FIGURA 37. Evolução anual e mensal <strong>da</strong>s médias diárias <strong>da</strong> umi<strong>da</strong><strong>de</strong><br />
relativa do ar <strong>de</strong> 1936 a 2005......................................................................<br />
FIGURA 38. Mapa <strong>da</strong>s temperaturas <strong>de</strong> superfície <strong>da</strong> ci<strong>da</strong><strong>de</strong> <strong>de</strong> São<br />
Paulo em 3 <strong>de</strong> setembro <strong>de</strong> 1999 às 9h57.................................................<br />
FIGURA 39. Detalhe <strong>da</strong> situação <strong>da</strong> Subprefeitura <strong>da</strong> Sé no mapa <strong>da</strong>s<br />
temperaturas <strong>de</strong> superfície <strong>da</strong> ci<strong>da</strong><strong>de</strong> <strong>de</strong> São Paulo...................................<br />
FIGURA 40: Mapa <strong>da</strong>s isotermas no centro <strong>de</strong> São Paulo......................... 73<br />
FIGURA 41. Número <strong>de</strong> edifícios com mais <strong>de</strong> cinco pavimentos por km²,<br />
por distrito <strong>da</strong> região <strong>central</strong>, 2007.............................................................. 74<br />
FIGURA 42. Áreas ver<strong>de</strong>s por distrito no centro <strong>de</strong> São Paulo................... 76<br />
FIGURA 43. Fatores médios <strong>de</strong> emis<strong>são</strong> <strong>de</strong> CO2 para veículos leves<br />
novos no período <strong>de</strong> 2002 a 2008...............................................................<br />
FIGURA 44. Valores típicos <strong>de</strong> emis<strong>são</strong> <strong>de</strong> CO2 para veículos em uso,<br />
movidos a gasolina convertidos para gás natural veicular, no período <strong>de</strong><br />
2002 a 2008.................................................................................................<br />
FIGURA 45. Evolução <strong>da</strong> frota <strong>de</strong> veículos automotores leves <strong>da</strong> região<br />
metropolitana <strong>de</strong> São Paulo.........................................................................<br />
41<br />
42<br />
69<br />
70<br />
71<br />
72<br />
72<br />
78<br />
79<br />
79


