Nova publicação - Revista O Papel
Nova publicação - Revista O Papel
Nova publicação - Revista O Papel

Create successful ePaper yourself
Turn your PDF publications into a flip-book with our unique Google optimized e-Paper software.
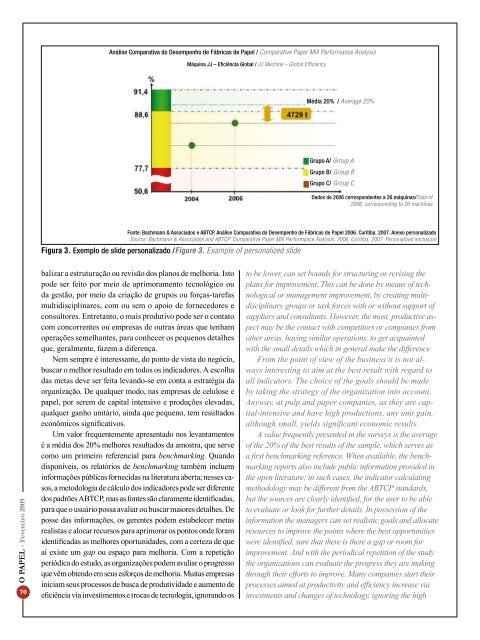
Análise Comparativa do Desempenho de Fábricas de <strong>Papel</strong> / Comparative Paper Mill Performance Analysis<br />
Máquina JJ – Eficiência Global / JJ Machine – Global Efficiency<br />
Média 20% / Average 20%<br />
Grupo A/ Group A<br />
Grupo B/ Group B<br />
Grupo C/ Group C<br />
Dados de 2006 correspondentes a 26 máquinas/Data of<br />
2006, corresponding to 26 machines<br />
Fonte: Bachmann & Associados e ABTCP. Análise Comparativa do Desempenho de Fábricas de <strong>Papel</strong> 2006. Curitiba. 2007. Anexo personalizado<br />
Source: Bachmann & Associados and ABTCP. Comparative Paper Mill Performance Analysis, 2006. Curitiba, 2007. Personalized enclosure<br />
Figura 3. Exemplo de slide personalizado /Figure 3. Example of personalized slide<br />
O PAPEL - Fevereiro 2009<br />
70<br />
balizar a estruturação ou revisão dos planos de melhoria. Isto<br />
pode ser feito por meio de aprimoramento tecnológico ou<br />
da gestão, por meio da criação de grupos ou forças-tarefas<br />
multidisciplinares, com ou sem o apoio de fornecedores e<br />
consultores. Entretanto, o mais produtivo pode ser o contato<br />
com concorrentes ou empresas de outras áreas que tenham<br />
operações semelhantes, para conhecer os pequenos detalhes<br />
que, geralmente, fazem a diferença.<br />
Nem sempre é interessante, do ponto de vista do negócio,<br />
buscar o melhor resultado em todos os indicadores. A escolha<br />
das metas deve ser feita levando-se em conta a estratégia da<br />
organização. De qualquer modo, nas empresas de celulose e<br />
papel, por serem de capital intensivo e produções elevadas,<br />
qualquer ganho unitário, ainda que pequeno, tem resultados<br />
econômicos significativos.<br />
Um valor frequentemente apresentado nos levantamentos<br />
é a média dos 20% melhores resultados da amostra, que serve<br />
como um primeiro referencial para benchmarking. Quando<br />
disponíveis, os relatórios de benchmarking também incluem<br />
informações públicas fornecidas na literatura aberta; nesses casos,<br />
a metodologia de cálculo dos indicadores pode ser diferente<br />
dos padrões ABTCP, mas as fontes são claramente identificadas,<br />
para que o usuário possa avaliar ou buscar maiores detalhes. De<br />
posse das informações, os gerentes podem estabelecer metas<br />
realistas e alocar recursos para aprimorar os pontos onde foram<br />
identificadas as melhores oportunidades, com a certeza de que<br />
aí existe um gap ou espaço para melhoria. Com a repetição<br />
periódica do estudo, as organizações podem avaliar o progresso<br />
que vêm obtendo em seus esforços de melhoria. Muitas empresas<br />
iniciam seus processos de busca de produtividade e aumento de<br />
eficiência via investimentos e trocas de tecnologia, ignorando os<br />
to be lower, can set bounds for structuring or revising the<br />
plans for improvement. This can be done by means of technological<br />
or management improvement, by creating multidisciplinary<br />
groups or task forces with or without support of<br />
suppliers and consultants. However, the most productive aspect<br />
may be the contact with competitors or companies from<br />
other areas, having similar operations, to get acquainted<br />
with the small details which in general make the difference.<br />
From the point of view of the business it is not always<br />
interesting to aim at the best result with regard to<br />
all indicators. The choice of the goals should be made<br />
by taking the strategy of the organization into account.<br />
Anyway, at pulp and paper companies, as they are capital-intensive<br />
and have high productions, any unit gain,<br />
although small, yields significant economic results.<br />
A value frequently presented in the surveys is the average<br />
of the 20% of the best results of the sample, which serves as<br />
a first benchmarking reference. When available, the benchmarking<br />
reports also include public information provided in<br />
the open literature; in such cases, the indicator calculating<br />
methodology may be different from the ABTCP standards,<br />
but the sources are clearly identified, for the user to be able<br />
to evaluate or look for further details. In possession of the<br />
information the managers can set realistic goals and allocate<br />
resources to improve the points where the best opportunities<br />
were identified, sure that there is there a gap or room for<br />
improvement. And with the periodical repetition of the study<br />
the organizations can evaluate the progress they are making<br />
through their efforts to improve. Many companies start their<br />
processes aimed at productivity and efficiency increase via<br />
investments and changes of technology, ignoring the high