BERPS Nordeste - Ministério da Previdência Social
BERPS Nordeste - Ministério da Previdência Social
BERPS Nordeste - Ministério da Previdência Social

You also want an ePaper? Increase the reach of your titles
YUMPU automatically turns print PDFs into web optimized ePapers that Google loves.
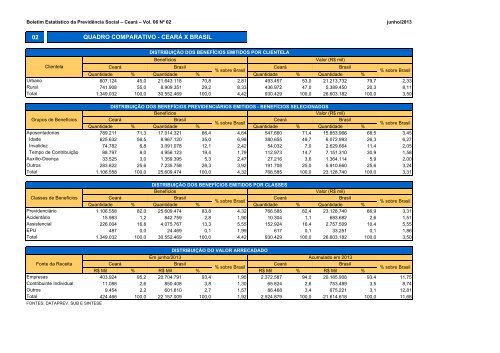
Boletim Estatístico <strong>da</strong> Previdência <strong>Social</strong> – Ceará – Vol. 06 Nº 02junho/201302QUADRO COMPARATIVO - CEARÁ X BRASILUrbanoRuralTotalClientelaDISTRIBUIÇÃO DOS BENEFÍCIOS EMITIDOS POR CLIENTELABenefíciosValor (R$ mil)CearáBrasilCearáBrasil% sobre BrasilQuanti<strong>da</strong>de % Quanti<strong>da</strong>de % Quanti<strong>da</strong>de % Quanti<strong>da</strong>de %% sobre Brasil607.124 45,0 21.643.118 70,8 2,81 493.457 53,0 21.213.732 79,7 2,33741.908 55,0 8.909.351 29,2 8,33 436.972 47,0 5.389.450 20,3 8,111.349.032 100,0 30.552.469 100,0 4,42 930.429 100,0 26.603.182 100,0 3,50Grupos de BenefíciosAposentadoriasI<strong>da</strong>deInvalidezTempo de ContribuiçãoAuxílio-DoençaOutrosTotalClasses de BenefíciosPrevidenciárioAcidentárioAssistencialEPUTotalDISTRIBUIÇÃO DOS BENEFÍCIOS PREVIDENCIÁRIOS EMITIDOS - BENEFÍCIOS SELECIONADOSBenefíciosValor (R$ mil)CearáBrasilCearáBrasil% sobre BrasilQuanti<strong>da</strong>de % Quanti<strong>da</strong>de % Quanti<strong>da</strong>de % Quanti<strong>da</strong>de %% sobre Brasil789.211 71,3 17.014.321 66,4 4,64 547.660 71,4 15.853.966 68,5 3,45625.632 56,5 8.967.120 35,0 6,98 380.655 49,7 6.072.993 26,3 6,2774.782 6,8 3.091.078 12,1 2,42 54.032 7,0 2.629.664 11,4 2,0588.797 8,0 4.956.123 19,4 1,79 112.973 14,7 7.151.310 30,9 1,5833.525 3,0 1.359.395 5,3 2,47 27.216 3,6 1.364.114 5,9 2,00283.822 25,6 7.235.758 28,3 3,92 191.708 25,0 5.910.660 25,6 3,241.106.558 100,0 25.609.474 100,0 4,32 766.585 100,0 23.128.740 100,0 3,31DISTRIBUIÇÃO DOS BENEFÍCIOS EMITIDOS POR CLASSESBenefíciosValor (R$ mil)CearáBrasilCearáBrasil% sobre BrasilQuanti<strong>da</strong>de % Quanti<strong>da</strong>de % Quanti<strong>da</strong>de % Quanti<strong>da</strong>de %% sobre Brasil1.106.558 82,0 25.609.474 83,8 4,32 766.585 82,4 23.128.740 86,9 3,3115.983 1,2 842.759 2,8 1,90 10.304 1,1 683.682 2,6 1,51226.004 16,8 4.075.767 13,3 5,55 152.924 16,4 2.757.509 10,4 5,55487 0,0 24.469 0,1 1,99 617 0,1 33.251 0,1 1,861.349.032 100,0 30.552.469 100,0 4,42 930.429 100,0 26.603.182 100,0 3,50Fonte <strong>da</strong> ReceitaEmpresasContribuinte IndividualOutrosTotalFONTES: DATAPREV, SUB E SINTESEDISTRIBUIÇÃO DO VALOR ARRECADADOEm junho/2013 Acumulado em 2013CearáBrasilCearáBrasil% sobre BrasilR$ Mil % R$ Mil % R$ Mil % R$ Mil %% sobre Brasil403.924 95,2 20.704.791 93,4 1,95 2.372.587 94,0 20.185.908 93,4 11,7511.088 2,6 850.408 3,8 1,30 65.824 2,6 753.489 3,5 8,749.454 2,2 601.810 2,7 1,57 86.468 3,4 675.221 3,1 12,81424.466 100,0 22.157.009 100,0 1,92 2.524.879 100,0 21.614.618 100,0 11,68