BERPS Nordeste - Ministério da Previdência Social
BERPS Nordeste - Ministério da Previdência Social
BERPS Nordeste - Ministério da Previdência Social

You also want an ePaper? Increase the reach of your titles
YUMPU automatically turns print PDFs into web optimized ePapers that Google loves.
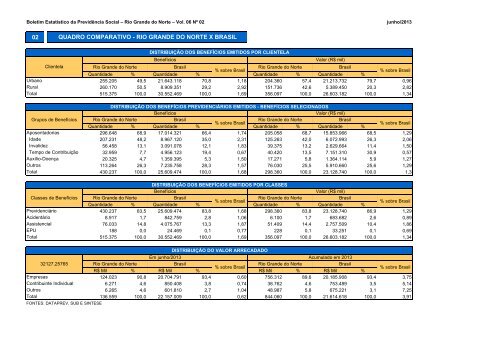
Boletim Estatístico <strong>da</strong> Previdência <strong>Social</strong> – Rio Grande do Norte – Vol. 06 Nº 02junho/201302QUADRO COMPARATIVO - RIO GRANDE DO NORTE X BRASILUrbanoRuralTotalClientelaDISTRIBUIÇÃO DOS BENEFÍCIOS EMITIDOS POR CLIENTELABenefíciosValor (R$ mil)Rio Grande do NorteBrasilRio Grande do NorteBrasil% sobre BrasilQuanti<strong>da</strong>de % Quanti<strong>da</strong>de % Quanti<strong>da</strong>de % Quanti<strong>da</strong>de %% sobre Brasil255.205 49,5 21.643.118 70,8 1,18 204.360 57,4 21.213.732 79,7 0,96260.170 50,5 8.909.351 29,2 2,92 151.736 42,6 5.389.450 20,3 2,82515.375 100,0 30.552.469 100,0 1,69 356.097 100,0 26.603.182 100,0 1,34Grupos de BenefíciosAposentadoriasI<strong>da</strong>deInvalidezTempo de ContribuiçãoAuxílio-DoençaOutrosTotalClasses de BenefíciosPrevidenciárioAcidentárioAssistencialEPUTotalDISTRIBUIÇÃO DOS BENEFÍCIOS PREVIDENCIÁRIOS EMITIDOS - BENEFÍCIOS SELECIONADOSBenefíciosValor (R$ mil)Rio Grande do NorteBrasilRio Grande do NorteBrasil% sobre BrasilQuanti<strong>da</strong>de % Quanti<strong>da</strong>de % Quanti<strong>da</strong>de % Quanti<strong>da</strong>de %% sobre Brasil296.648 68,9 17.014.321 66,4 1,74 205.058 68,7 15.853.966 68,5 1,29207.231 48,2 8.967.120 35,0 2,31 125.263 42,0 6.072.993 26,3 2,0656.458 13,1 3.091.078 12,1 1,83 39.375 13,2 2.629.664 11,4 1,5032.959 7,7 4.956.123 19,4 0,67 40.420 13,5 7.151.310 30,9 0,5720.325 4,7 1.359.395 5,3 1,50 17.271 5,8 1.364.114 5,9 1,27113.264 26,3 7.235.758 28,3 1,57 76.030 25,5 5.910.660 25,6 1,29430.237 100,0 25.609.474 100,0 1,68 298.360 100,0 23.128.740 100,0 1,3DISTRIBUIÇÃO DOS BENEFÍCIOS EMITIDOS POR CLASSESBenefíciosValor (R$ mil)Rio Grande do NorteBrasilRio Grande do NorteBrasil% sobre BrasilQuanti<strong>da</strong>de % Quanti<strong>da</strong>de % Quanti<strong>da</strong>de % Quanti<strong>da</strong>de %% sobre Brasil430.237 83,5 25.609.474 83,8 1,68 298.360 83,8 23.128.740 86,9 1,298.917 1,7 842.759 2,8 1,06 6.100 1,7 683.682 2,6 0,8976.033 14,8 4.075.767 13,3 1,87 51.409 14,4 2.757.509 10,4 1,86188 0,0 24.469 0,1 0,77 228 0,1 33.251 0,1 0,69515.375 100,0 30.552.469 100,0 1,69 356.097 100,0 26.603.182 100,0 1,3432127,25765EmpresasContribuinte IndividualOutrosTotalFONTES: DATAPREV, SUB E SINTESEDISTRIBUIÇÃO DO VALOR ARRECADADOEm junho/2013 Acumulado em 2013Rio Grande do NorteBrasilRio Grande do NorteBrasil% sobre BrasilR$ Mil % R$ Mil % R$ Mil % R$ Mil %% sobre Brasil124.023 90,8 20.704.791 93,4 0,60 756.312 89,6 20.185.908 93,4 3,756.271 4,6 850.408 3,8 0,74 38.762 4,6 753.489 3,5 5,146.265 4,6 601.810 2,7 1,04 48.987 5,8 675.221 3,1 7,25136.559 100,0 22.157.009 100,0 0,62 844.060 100,0 21.614.618 100,0 3,91