A EVOLUÃÃO DA INDÃSTRIA DE CELULOSE E ... - Revista O Papel
A EVOLUÃÃO DA INDÃSTRIA DE CELULOSE E ... - Revista O Papel
A EVOLUÃÃO DA INDÃSTRIA DE CELULOSE E ... - Revista O Papel

You also want an ePaper? Increase the reach of your titles
YUMPU automatically turns print PDFs into web optimized ePapers that Google loves.
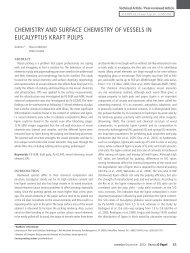
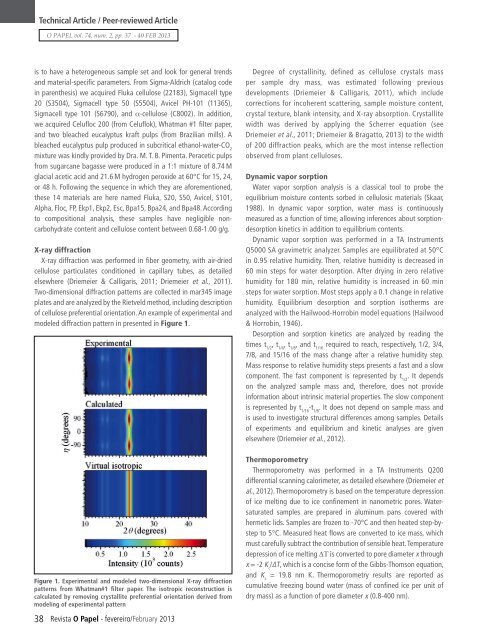
Technical Article / Peer-reviewed ArticleO PAPEL vol. 74, num. 2, pp. 37 - 40 FEB 2013is to have a heterogeneous sample set and look for general trendsand material-specific parameters. From Sigma-Aldrich (catalog codein parenthesis) we acquired Fluka cellulose (22183), Sigmacell type20 (S3504), Sigmacell type 50 (S5504), Avicel PH-101 (11365),Sigmacell type 101 (S6790), and α-cellulose (C8002). In addition,we acquired Celufloc 200 (from Celuflok), Whatman #1 filter paper,and two bleached eucalyptus kraft pulps (from Brazilian mills). Ableached eucalyptus pulp produced in subcritical ethanol-water-CO 2mixture was kindly provided by Dra. M. T. B. Pimenta. Peracetic pulpsfrom sugarcane bagasse were produced in a 1:1 mixture of 8.74 Mglacial acetic acid and 21.6 M hydrogen peroxide at 60°C for 15, 24,or 48 h. Following the sequence in which they are aforementioned,these 14 materials are here named Fluka, S20, S50, Avicel, S101,Alpha, Floc, FP, Ekp1, Ekp2, Esc, Bpa15, Bpa24, and Bpa48. Accordingto compositional analysis, these samples have negligible noncarbohydratecontent and cellulose content between 0.68‐1.00 g/g.X-ray diffractionX-ray diffraction was performed in fiber geometry, with air-driedcellulose particulates conditioned in capillary tubes, as detailedelsewhere (Driemeier & Calligaris, 2011; Driemeier et al., 2011).Two-dimensional diffraction patterns are collected in mar345 imageplates and are analyzed by the Rietveld method, including descriptionof cellulose preferential orientation. An example of experimental andmodeled diffraction pattern in presented in Figure 1.Figure 1. Experimental and modeled two-dimensional X-ray diffractionpatterns from Whatman#1 filter paper. The isotropic reconstruction iscalculated by removing crystallite preferential orientation derived frommodeling of experimental pattern38 <strong>Revista</strong> O <strong>Papel</strong> - fevereiro/February 2013Degree of crystallinity, defined as cellulose crystals massper sample dry mass, was estimated following previousdevelopments (Driemeier & Calligaris, 2011), which includecorrections for incoherent scattering, sample moisture content,crystal texture, blank intensity, and X-ray absorption. Crystallitewidth was derived by applying the Scherrer equation (seeDriemeier et al., 2011; Driemeier & Bragatto, 2013) to the widthof 200 diffraction peaks, which are the most intense reflectionobserved from plant celluloses.Dynamic vapor sorptionWater vapor sorption analysis is a classical tool to probe theequilibrium moisture contents sorbed in cellulosic materials (Skaar,1988). In dynamic vapor sorption, water mass is continuouslymeasured as a function of time, allowing inferences about sorptiondesorptionkinetics in addition to equilibrium contents.Dynamic vapor sorption was performed in a TA InstrumentsQ5000 SA gravimetric analyzer. Samples are equilibrated at 50°Cin 0.95 relative humidity. Then, relative humidity is decreased in60 min steps for water desorption. After drying in zero relativehumidity for 180 min, relative humidity is increased in 60 minsteps for water sorption. Most steps apply a 0.1 change in relativehumidity. Equilibrium desorption and sorption isotherms areanalyzed with the Hailwood-Horrobin model equations (Hailwood& Horrobin, 1946).Desorption and sorption kinetics are analyzed by reading thetimes t 1/2, t 1/4, t 1/8, and t 1/16required to reach, respectively, 1/2, 3/4,7/8, and 15/16 of the mass change after a relative humidity step.Mass response to relative humidity steps presents a fast and a slowcomponent. The fast component is represented by t 1/2. It dependson the analyzed sample mass and, therefore, does not provideinformation about intrinsic material properties. The slow componentis represented by t 1/16-t 1/8. It does not depend on sample mass andis used to investigate structural differences among samples. Detailsof experiments and equilibrium and kinetic analyses are givenelsewhere (Driemeier et al., 2012).ThermoporometryThermoporometry was performed in a TA Instruments Q200differential scanning calorimeter, as detailed elsewhere (Driemeier etal., 2012). Thermoporometry is based on the temperature depressionof ice melting due to ice confinement in nanometric pores. Watersaturatedsamples are prepared in aluminum pans covered withhermetic lids. Samples are frozen to -70°C and then heated step-bystepto 5°C. Measured heat flows are converted to ice mass, whichmust carefully subtract the contribution of sensible heat. Temperaturedepression of ice melting ∆T is converted to pore diameter x throughx = -2 K c/∆T, which is a concise form of the Gibbs-Thomson equation,and K c= 19.8 nm K. Thermoporometry results are reported ascumulative freezing bound water (mass of confined ice per unit ofdry mass) as a function of pore diameter x (0.8-400 nm).