planul regional de actiune pentru turism nord-est 2009-2013
planul regional de actiune pentru turism nord-est 2009-2013
planul regional de actiune pentru turism nord-est 2009-2013
- No tags were found...

Create successful ePaper yourself
Turn your PDF publications into a flip-book with our unique Google optimized e-Paper software.
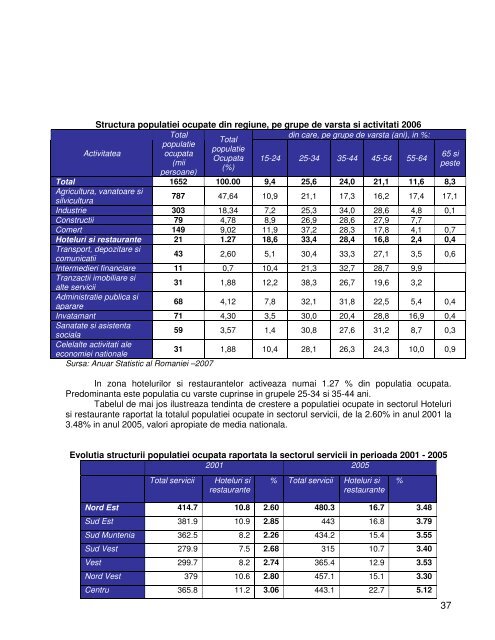
Structura populatiei ocupate din regiune, pe grupe <strong>de</strong> varsta si activitati 2006Totaldin care, pe grupe <strong>de</strong> varsta (ani), in %:TotalpopulatiepopulatieActivitatea ocupataOcupata 15-24 25-34 35-44 45-54 55-64(mii(%)persoane)65 sip<strong>est</strong>eTotal 1652 100.00 9,4 25,6 24,0 21,1 11,6 8,3Agricultura, vanatoare sisilvicultura787 47,64 10,9 21,1 17,3 16,2 17,4 17,1Industrie 303 18,34 7,2 25,3 34,0 28,6 4,8 0,1Constructii 79 4,78 8,9 26,9 28,6 27,9 7,7Comert 149 9,02 11,9 37,2 28,3 17,8 4,1 0,7Hoteluri si r<strong>est</strong>aurante 21 1.27 18,6 33,4 28,4 16,8 2,4 0,4Transport, <strong>de</strong>pozitare sicomunicatii43 2,60 5,1 30,4 33,3 27,1 3,5 0,6Intermedieri financiare 11 0,7 10,4 21,3 32,7 28,7 9,9Tranzactii imobiliare sialte servicii31 1,88 12,2 38,3 26,7 19,6 3,2Administratie publica siaparare68 4,12 7,8 32,1 31,8 22,5 5,4 0,4Invatamant 71 4,30 3,5 30,0 20,4 28,8 16,9 0,4Sanatate si asistentasociala59 3,57 1,4 30,8 27,6 31,2 8,7 0,3Celelalte activitati aleeconomiei nationale31 1,88 10,4 28,1 26,3 24,3 10,0 0,9Sursa: Anuar Statistic al Romaniei –2007In zona hotelurilor si r<strong>est</strong>aurantelor activeaza numai 1.27 % din populatia ocupata.Predominanta <strong>est</strong>e populatia cu varste cuprinse in grupele 25-34 si 35-44 ani.Tabelul <strong>de</strong> mai jos ilustreaza tendinta <strong>de</strong> cr<strong>est</strong>ere a populatiei ocupate in sectorul Hotelurisi r<strong>est</strong>aurante raportat la totalul populatiei ocupate in sectorul servicii, <strong>de</strong> la 2.60% in anul 2001 la3.48% in anul 2005, valori apropiate <strong>de</strong> media nationala.Evolutia structurii populatiei ocupata raportata la sectorul servicii in perioada 2001 - 20052001 2005Total serviciiHoteluri sir<strong>est</strong>aurante% Total servicii Hoteluri sir<strong>est</strong>aurante%Nord Est 414.7 10.8 2.60 480.3 16.7 3.48Sud Est 381.9 10.9 2.85 443 16.8 3.79Sud Muntenia 362.5 8.2 2.26 434.2 15.4 3.55Sud V<strong>est</strong> 279.9 7.5 2.68 315 10.7 3.40V<strong>est</strong> 299.7 8.2 2.74 365.4 12.9 3.53Nord V<strong>est</strong> 379 10.6 2.80 457.1 15.1 3.30Centru 365.8 11.2 3.06 443.1 22.7 5.1237