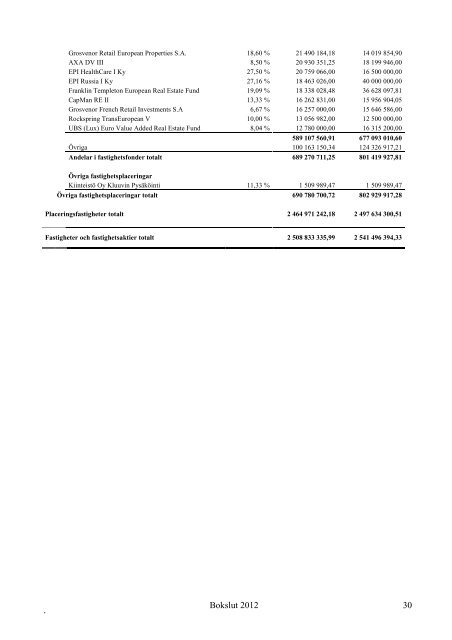
´ Grosvenor Retail European Properties S.A. 18,60 % 21 490 184,18 14 019 854,90 AXA DV III 8,50 % 20 930 351,25 18 199 946,00 EPI HealthCare I Ky 27,50 % 20 759 066,00 16 500 000,00 EPI Russia I Ky 27,16 % 18 463 026,00 40 000 000,00 Franklin Templeton European Real Estate Fund 19,09 % 18 338 028,48 36 628 097,81 CapMan RE II 13,33 % 16 262 831,00 15 956 904,05 Grosvenor French Retail Investments S.A 6,67 % 16 257 000,00 15 646 586,00 Rockspring TransEuropean V 10,00 % 13 056 982,00 12 500 000,00 UBS (Lux) Euro Value Added Real Estate Fund 8,04 % 12 780 000,00 16 315 200,00 589 107 560,91 677 093 010,60 Övriga 100 163 150,34 124 326 917,21 Andelar i fastighetsfonder totalt 689 270 711,25 801 419 927,81 Övriga fastighetsplaceringar Kiinteistö Oy Kluuvin Pysäköinti 11,33 % 1 509 989,47 1 509 989,47 Övriga fastighetsplaceringar totalt 690 780 700,72 802 929 917,28 Placeringsfastigheter totalt Fastigheter och fastighetsaktier totalt 2 464 971 242,18 2 497 634 300,51 2 508 833 335,99 2 541 496 394,33 <strong>Bokslut</strong> <strong>2012</strong> 30
6.11 De största aktieinnehaven 21) 31.12.<strong>2012</strong> Bokförings- dvs. gängse värde Anskaffningsvärde Namn Antal euro euroa Royal Dutch Shell PLC 3 307 393 86 886 052,52 89 329 441,13 Nokia OYJ 24 776 634 72 496 431,08 76 343 493,66 HSBC Holdings Plc 8 212 934 65 169 623,41 65 153 548,37 Kone OYJ 1 131 770 63 152 766,00 36 330 795,83 Sampo OYJ 2 552 530 62 128 580,20 45 316 751,80 Samsung Electronics Ltd 124 328 58 161 921,92 21 167 535,80 BHP Billiton Plc 2 208 695 57 748 468,48 43 214 065,32 Taiwan Semiconductor Manufacturing Co Ltd 22 712 551 57 545 148,53 30 950 795,92 Novartis AG 1 130 705 53 809 644,01 44 666 353,58 Nestle SA 1 016 104 50 165 505,63 35 623 587,78 Oversea-Chinese Banking Corp. Ltd 8 205 510 49 576 706,29 29 964 625,97 Roche Holding AG 301 409 45 966 958,75 40 710 722,11 QBE Insurance Group Ltd 5 228 422 44 877 708,61 55 174 463,57 Total SA 1 141 578 44 532 957,78 52 823 249,77 Metso OYJ 1 362 233 43 645 945,32 39 380 402,25 GlaxoSmithKline PLC 2 377 320 42 580 896,68 46 899 603,92 Fortum OYJ 2 951 403 41 762 352,45 60 516 649,22 Amer Sports OYJ 3 682 061 41 423 186,25 37 790 580,81 Wartsila OYJ 1 211 204 39 630 594,88 29 125 185,02 Vodafone Group PLC 20 739 143 39 249 609,56 46 714 467,46 Standard Chartered Plc 2 006 727 38 596 211,21 31 162 164,56 DBS Group Holdings Ltd 4 165 122 38 381 405,90 33 808 488,77 Nordea Bank AB 5 300 145 38 363 801,98 36 637 901,42 UPM-Kymmene OYJ 3 940 521 34 696 287,41 39 939 895,33 Sanofi 476 549 34 020 833,11 24 165 784,55 Cheung Kong Holdings Ltd 2 732 000 31 814 935,45 25 549 394,65 BASF SE 441 662 31 424 251,30 26 225 894,31 Unilever PLC 3 526 397 30 986 673,02 19 288 784,45 Nokian Renkaat OYJ 1 007 852 30 336 345,20 31 167 002,50 British American Tobacco PLC 1 024 278 29 552 180,38 17 327 798,65 AIA Group Ltd 9 504 000 28 134 240,57 20 409 325,24 Hong Kong & China Gas Co Ltd 13 565 934 28 077 824,92 14 704 187,08 ENI SpA 1 475 424 27 059 276,16 26 284 367,46 Swedish Match AB 1 064 120 27 055 579,59 31 118 948,80 Outotec OYJ 606 280 25 688 083,60 19 913 605,05 Rio Tinto Plc 590 000 25 543 747,32 18 736 434,53 Housing Development Finance Corp. 2 220 986 25 484 327,91 14 382 002,96 Axiata Group Berhad 15 288 500 24 989 958,41 17 677 456,71 Jardine Strategic Holdings Ltd 918 038 24 733 543,31 7 787 725,76 BG Group PLC 1 949 576 24 187 546,87 22 426 833,12 Stora Enso OYJ 4 605 001 24 153 230,25 27 798 103,48 Siemens AG 282 105 23 189 031,00 22 695 108,00 Allianz SE 213 348 22 358 870,40 16 605 701,26 SAP AG 368 299 22 352 066,31 17 511 060,53 ABB Ltd 1 419 401 22 045 865,43 17 803 458,75 CSL Ltd 515 363 21 874 369,50 10 169 256,99 Novo Nordisk A/S 174 604 21 448 139,12 7 071 003,72 Newcrest Mining Ltd 1 212 416 21 176 137,29 17 994 450,88 Sabmiller Plc 599 651 20 757 432,61 15 894 301,53 ´ <strong>Bokslut</strong> <strong>2012</strong> 31