yu issn 1450-863 x godina xiii broj 1 / 2011. - horizonti.ekfak.kg.ac.rs
yu issn 1450-863 x godina xiii broj 1 / 2011. - horizonti.ekfak.kg.ac.rs
yu issn 1450-863 x godina xiii broj 1 / 2011. - horizonti.ekfak.kg.ac.rs

You also want an ePaper? Increase the reach of your titles
YUMPU automatically turns print PDFs into web optimized ePapers that Google loves.
EKONOMSKI HORIZONTI, 2011, 13, (1)<br />
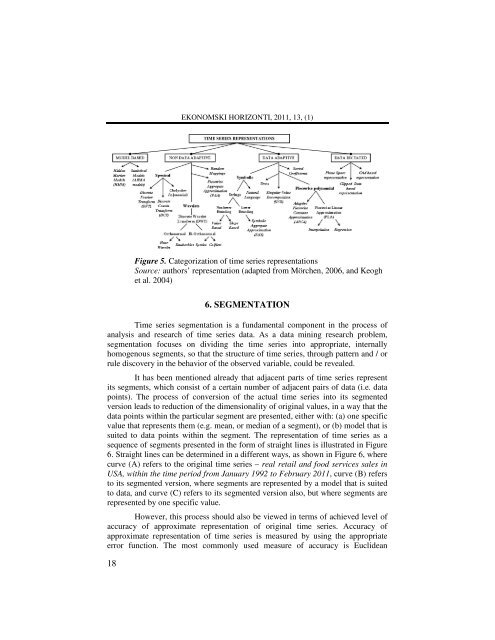
Figure 5. Categorization of time series representations<br />
Source: autho<strong>rs</strong>’ representation (adapted from Mörchen, 2006, and Keogh<br />
et al. 2004)<br />
18<br />
6. SEGMENTATION<br />
Time series segmentation is a fundamental component in the process of<br />
analysis and research of time series data. As a data mining research problem,<br />
segmentation focuses on dividing the time series into appropriate, internally<br />
homogenous segments, so that the structure of time series, through pattern and / or<br />
rule discovery in the behavior of the observed variable, could be revealed.<br />
It has been mentioned already that adj<strong>ac</strong>ent parts of time series represent<br />
its segments, which consist of a certain number of adj<strong>ac</strong>ent pai<strong>rs</strong> of data (i.e. data<br />
points). The process of conve<strong>rs</strong>ion of the <strong>ac</strong>tual time series into its segmented<br />
ve<strong>rs</strong>ion leads to reduction of the dimensionality of original values, in a way that the<br />
data points within the particular segment are presented, either with: (a) one specific<br />
value that represents them (e.g. mean, or median of a segment), or (b) model that is<br />
suited to data points within the segment. The representation of time series as a<br />
sequence of segments presented in the form of straight lines is illustrated in Figure<br />
6. Straight lines can be determined in a different ways, as shown in Figure 6, where<br />
curve (A) refe<strong>rs</strong> to the original time series – real retail and food services sales in<br />
USA, within the time period from January 1992 to February 2011, curve (B) refe<strong>rs</strong><br />
to its segmented ve<strong>rs</strong>ion, where segments are represented by a model that is suited<br />
to data, and curve (C) refe<strong>rs</strong> to its segmented ve<strong>rs</strong>ion also, but where segments are<br />
represented by one specific value.<br />
However, this process should also be viewed in terms of <strong>ac</strong>hieved level of<br />
<strong>ac</strong>cur<strong>ac</strong>y of approximate representation of original time series. Accur<strong>ac</strong>y of<br />
approximate representation of time series is measured by using the appropriate<br />
error function. The most commonly used measure of <strong>ac</strong>cur<strong>ac</strong>y is Euclidean