

Examining goods market integration - Ivie

Create successful ePaper yourself
Turn your PDF publications into a flip-book with our unique Google optimized e-Paper software.
4. Dataset<br />
We use a dataset referring to monthly exports from the UK for a sample period<br />
from January 1999 to January 2009 (henceforth, 1999m1-2009m1). We divide the<br />
analysis on pricing behavior into two types of automobile products (following the most<br />
detailed level of Combined Nomenclature sub-positions, that is, 8-digit classification<br />
level): gasoline-powered spark-ignition engines (87032319) and diesel-powered<br />
automobiles (87033219). From now on, we will refer to these types of automobiles as<br />
simply gasoline and diesel cars. We also consider non-automotive <strong>goods</strong> with the aim of<br />
controlling for a possible effect exerted by the creation of the euro area and other<br />
general European policies. In particular, we also take into account two popular products<br />
exported by the UK: malt Scotch whisky (22083032) and blended Scotch whisky<br />
(22083052). Together with gasoline and diesel cars, these whisky products are<br />
important UK exports. Thus, on the one hand, gasoline and diesel cars ranked first and<br />
second, respectively, on the list of UK vehicle exports to the EU over the period under<br />
consideration (out of a total of 279 products included in chapter 87). On the other hand,<br />
malt Scotch whisky and blended Scotch whisky also came first and second,<br />
respectively, on the list of UK beverages exported to the EU over the period under study<br />
(out of a total of 262 products included in chapter 22).<br />
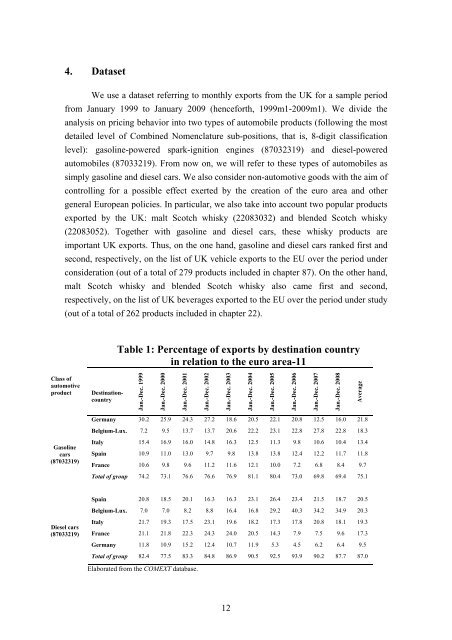
Table 1: Percentage of exports by destination country<br />
in relation to the euro area-11<br />
Class of<br />
automotive<br />
product<br />
Destinationcountry<br />
Jan.-Dec. 1999<br />
Jan.-Dec. 2000<br />
Jan.-Dec. 2001<br />
Jan.-Dec. 2002<br />
Jan.-Dec. 2003<br />
Jan.-Dec. 2004<br />
Jan.-Dec. 2005<br />
Jan.-Dec. 2006<br />
Jan.-Dec. 2007<br />
Jan.-Dec. 2008<br />
Average<br />
Germany 30.2 25.9 24.3 27.2 18.6 20.5 22.1 20.8 12.5 16.0 21.8<br />
Belgium-Lux. 7.2 9.5 13.7 13.7 20.6 22.2 23.1 22.8 27.8 22.8 18.3<br />
Gasoline<br />
cars<br />
(87032319)<br />
Italy 15.4 16.9 16.0 14.8 16.3 12.5 11.3 9.8 10.6 10.4 13.4<br />
Spain 10.9 11.0 13.0 9.7 9.8 13.8 13.8 12.4 12.2 11.7 11.8<br />
France 10.6 9.8 9.6 11.2 11.6 12.1 10.0 7.2 6.8 8.4 9.7<br />
Total of group 74.2 73.1 76.6 76.6 76.9 81.1 80.4 73.0 69.8 69.4 75.1<br />
Spain 20.8 18.5 20.1 16.3 16.3 23.1 26.4 23.4 21.5 18.7 20.5<br />
Belgium-Lux. 7.0 7.0 8.2 8.8 16.4 16.8 29.2 40.3 34.2 34.9 20.3<br />
Diesel cars<br />
(87033219)<br />
Italy 21.7 19.3 17.5 23.1 19.6 18.2 17.3 17.8 20.8 18.1 19.3<br />
France 21.1 21.8 22.3 24.3 24.0 20.5 14.3 7.9 7.5 9.6 17.3<br />
Germany 11.8 10.9 15.2 12.4 10.7 11.9 5.3 4.5 6.2 6.4 9.5<br />
Total of group 82.4 77.5 83.3 84.8 86.9 90.5 92.5 93.9 90.2 87.7 87.0<br />
Elaborated from the COMEXT database.<br />
12


