

Examining goods market integration - Ivie

Create successful ePaper yourself
Turn your PDF publications into a flip-book with our unique Google optimized e-Paper software.
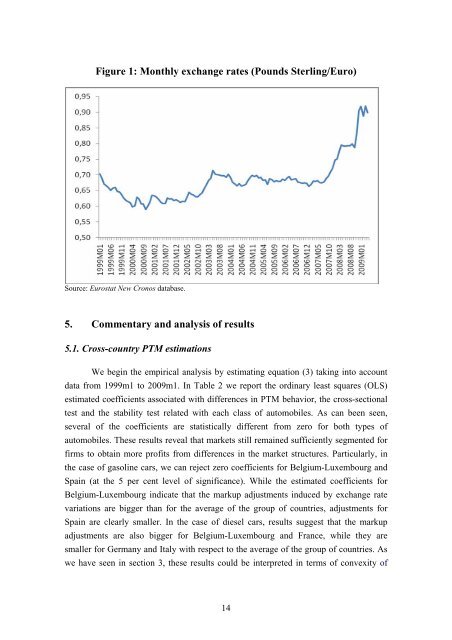
Figure 1: Monthly exchange rates (Pounds Sterling/Euro)<br />
Source: Eurostat New Cronos database.<br />
5. Commentary and analysis of results<br />
5.1. Cross-country PTM estimations<br />
We begin the empirical analysis by estimating equation (3) taking into account<br />
data from 1999m1 to 2009m1. In Table 2 we report the ordinary least squares (OLS)<br />
estimated coefficients associated with differences in PTM behavior, the cross-sectional<br />
test and the stability test related with each class of automobiles. As can been seen,<br />
several of the coefficients are statistically different from zero for both types of<br />
automobiles. These results reveal that <strong>market</strong>s still remained sufficiently segmented for<br />
firms to obtain more profits from differences in the <strong>market</strong> structures. Particularly, in<br />
the case of gasoline cars, we can reject zero coefficients for Belgium-Luxembourg and<br />
Spain (at the 5 per cent level of significance). While the estimated coefficients for<br />
Belgium-Luxembourg indicate that the markup adjustments induced by exchange rate<br />
variations are bigger than for the average of the group of countries, adjustments for<br />
Spain are clearly smaller. In the case of diesel cars, results suggest that the markup<br />
adjustments are also bigger for Belgium-Luxembourg and France, while they are<br />
smaller for Germany and Italy with respect to the average of the group of countries. As<br />
we have seen in section 3, these results could be interpreted in terms of convexity of<br />
14


