

New horizons alternative Asian markets – From OPPortUNITY to CONNECtivitY
1sxNzy1
1sxNzy1

Create successful ePaper yourself
Turn your PDF publications into a flip-book with our unique Google optimized e-Paper software.
There is a non-linear relationship between incomes and<br />
protein and fat consumption, as shown in the charts<br />
below. This highlights that it is worth looking not only<br />
at the level of incomes, but also the growth, when<br />
considering export opportunities for <strong>New</strong> Zealand.<br />
Protein and fat consumption across Asia<br />
Note that the curve was estimated from all countries while<br />
just 29 countries analysed are plotted.<br />
AVERAGE FAT CONSUMPTION BY COUNTRY<br />
160<br />
140<br />
120<br />
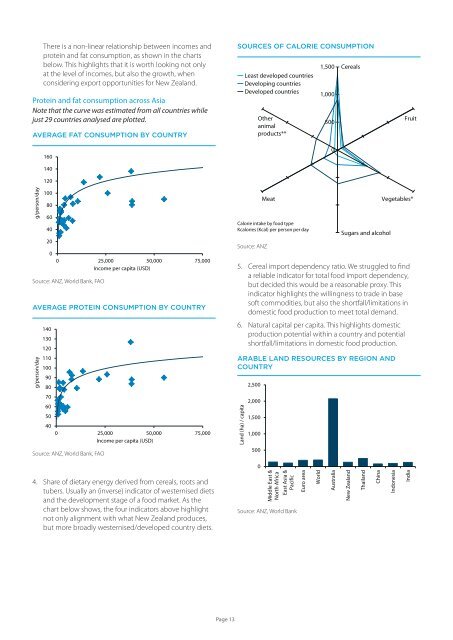
SOURCES OF CALORIE CONSUMPTION<br />
Least developed countries<br />
Developing countries<br />
Developed countries<br />
Other<br />
animal<br />
products**<br />
1,500<br />
1,000<br />
500<br />
0<br />
Cereals<br />
Fruit<br />
g/person/day<br />
100<br />
80<br />
60<br />
40<br />
20<br />
0<br />
0 25,000 50,000 75,000<br />
Income per capita (USD)<br />
Source: ANZ, World Bank, FAO<br />
AVERAGE PROTEIN CONSUMPTION BY COUNTRY<br />
140<br />
130<br />
120<br />
g/person/day<br />
110<br />
100<br />
90<br />
80<br />
70<br />
60<br />
50<br />
40<br />
0 25,000 50,000 75,000<br />
Income per capita (USD)<br />
Source: ANZ, World Bank, FAO<br />
5. Cereal import dependency ratio. We struggled <strong>to</strong> find<br />
a reliable indica<strong>to</strong>r for <strong>to</strong>tal food import dependency,<br />
but decided this would be a reasonable proxy. This<br />
indica<strong>to</strong>r highlights the willingness <strong>to</strong> trade in base<br />
soft commodities, but also the shortfall/limitations in<br />
domestic food production <strong>to</strong> meet <strong>to</strong>tal demand.<br />
6. Natural capital per capita. This highlights domestic<br />
production potential within a country and potential<br />
shortfall/limitations in domestic food production.<br />
ARABLE LAND RESOURCES BY REGION AND<br />
COUNTRY<br />
Land (ha) / capita<br />
2,500<br />
2,000<br />
1,500<br />
1,000<br />
500<br />
Meat<br />
Calorie intake by food type<br />
Kcalories (Kcal) per person per day<br />
Source: ANZ<br />
Sugars and alcohol<br />
Vegetables*<br />
0<br />
4. Share of dietary energy derived from cereals, roots and<br />
tubers. Usually an (inverse) indica<strong>to</strong>r of westernised diets<br />
and the development stage of a food market. As the<br />
chart below shows, the four indica<strong>to</strong>rs above highlight<br />
not only alignment with what <strong>New</strong> Zealand produces,<br />
but more broadly westernised/developed country diets.<br />
Middle East &<br />
North Africa<br />
East Asia &<br />
Pacific<br />
Source: ANZ, World Bank<br />
Euro area<br />
World<br />
Australia<br />
<strong>New</strong> Zealand<br />
Thailand<br />
China<br />
Indonesia<br />
India<br />
Page 13