

New horizons alternative Asian markets – From OPPortUNITY to CONNECtivitY
1sxNzy1
1sxNzy1

Create successful ePaper yourself
Turn your PDF publications into a flip-book with our unique Google optimized e-Paper software.
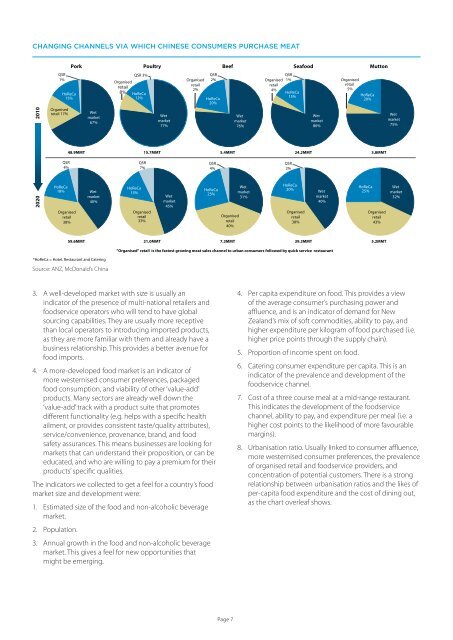
CHANGING CHANNELS VIA WHICH CHINESE CONSUMERS PURCHASE MEAT<br />
Pork<br />
Poultry<br />
Beef<br />
Seafood<br />
Mut<strong>to</strong>n<br />
2010<br />
QSR<br />
1%<br />
HoReCa<br />
15%<br />
Organised<br />
retail 17%<br />
Wet<br />
market<br />
67%<br />
QSR 3%<br />
Organised<br />
retail<br />
8% HoReCa<br />
12%<br />
Wet<br />
market<br />
77%<br />
Organised<br />
retail<br />
2%<br />
QSR<br />
2%<br />
HoReCa<br />
20%<br />
Wet<br />
market<br />
76%<br />
QSR<br />
Organised 1%<br />
retail<br />
4%<br />
HoReCa<br />
15%<br />
Wet<br />
market<br />
80%<br />
Organised<br />
retail<br />
5%<br />
HoReCa<br />
20%<br />
Wet<br />
market<br />
75%<br />
48.9MMT<br />
15.7MMT<br />
5.4MMT<br />
24.2MMT<br />
3.8MMT<br />
QSR<br />
4%<br />
QSR<br />
7%<br />
QSR<br />
4%<br />
QSR<br />
2%<br />
2020<br />
HoReCa<br />
18% Wet<br />
market<br />
40%<br />
Organised<br />
retail<br />
38%<br />
HoReCa<br />
15%<br />
Organised<br />
retail<br />
33%<br />
Wet<br />
market<br />
45%<br />
HoReCa<br />
25%<br />
Organised<br />
retail<br />
40%<br />
Wet<br />
market<br />
31%<br />
HoReCa<br />
20%<br />
Organised<br />
retail<br />
38%<br />
Wet<br />
market<br />
40%<br />
HoReCa<br />
25%<br />
Organised<br />
retail<br />
43%<br />
Wet<br />
market<br />
32%<br />
59.6MMT<br />
21.0MMT<br />
7.3MMT<br />
39.3MMT<br />
5.2MMT<br />
"Organised" retail is the fastest growing meat sales channel <strong>to</strong> urban consumers followed by quick service restaurant<br />
*HoReCa = Hotel, Restaurant and Catering<br />
Source: ANZ, McDonald’s China<br />
3. A well-developed market with size is usually an<br />
indica<strong>to</strong>r of the presence of multi-national retailers and<br />
foodservice opera<strong>to</strong>rs who will tend <strong>to</strong> have global<br />
sourcing capabilities. They are usually more receptive<br />
than local opera<strong>to</strong>rs <strong>to</strong> introducing imported products,<br />
as they are more familiar with them and already have a<br />
business relationship. This provides a better avenue for<br />
food imports.<br />
4. A more-developed food market is an indica<strong>to</strong>r of<br />
more westernised consumer preferences, packaged<br />
food consumption, and viability of other ‘value-add’<br />
products. Many sec<strong>to</strong>rs are already well down the<br />
‘value-add’ track with a product suite that promotes<br />
different functionality (e.g. helps with a specific health<br />
ailment, or provides consistent taste/quality attributes),<br />
service/convenience, provenance, brand, and food<br />
safety assurances. This means businesses are looking for<br />
<strong>markets</strong> that can understand their proposition, or can be<br />
educated, and who are willing <strong>to</strong> pay a premium for their<br />
products’ specific qualities.<br />
The indica<strong>to</strong>rs we collected <strong>to</strong> get a feel for a country’s food<br />
market size and development were:<br />
1. Estimated size of the food and non-alcoholic beverage<br />
market.<br />
2. Population.<br />
3. Annual growth in the food and non-alcoholic beverage<br />
market. This gives a feel for new opportunities that<br />
might be emerging.<br />
4. Per capita expenditure on food. This provides a view<br />
of the average consumer’s purchasing power and<br />
affluence, and is an indica<strong>to</strong>r of demand for <strong>New</strong><br />
Zealand’s mix of soft commodities, ability <strong>to</strong> pay, and<br />
higher expenditure per kilogram of food purchased (i.e.<br />
higher price points through the supply chain).<br />
5. Proportion of income spent on food.<br />
6. Catering consumer expenditure per capita. This is an<br />
indica<strong>to</strong>r of the prevalence and development of the<br />
foodservice channel.<br />
7. Cost of a three course meal at a mid-range restaurant.<br />
This indicates the development of the foodservice<br />
channel, ability <strong>to</strong> pay, and expenditure per meal (i.e. a<br />
higher cost points <strong>to</strong> the likelihood of more favourable<br />
margins).<br />
8. Urbanisation ratio. Usually linked <strong>to</strong> consumer affluence,<br />
more westernised consumer preferences, the prevalence<br />
of organised retail and foodservice providers, and<br />
concentration of potential cus<strong>to</strong>mers. There is a strong<br />
relationship between urbanisation ratios and the likes of<br />
per-capita food expenditure and the cost of dining out,<br />
as the chart overleaf shows.<br />
Page 7