

New horizons alternative Asian markets – From OPPortUNITY to CONNECtivitY
1sxNzy1
1sxNzy1

Create successful ePaper yourself
Turn your PDF publications into a flip-book with our unique Google optimized e-Paper software.
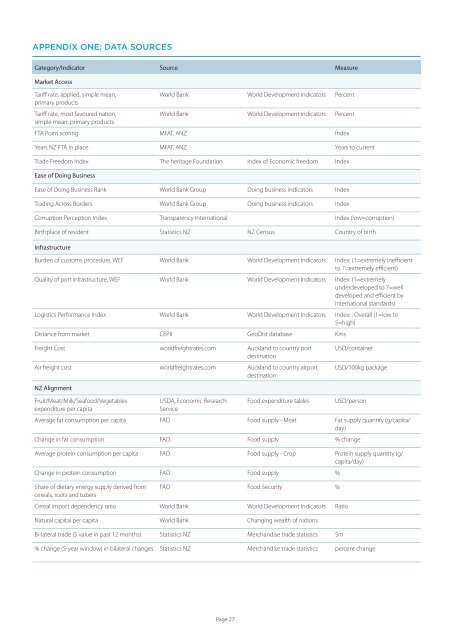
Appendix One: DATA Sources<br />
Category/Indica<strong>to</strong>r Source Measure<br />
Market Access<br />
Tariff rate, applied, simple mean,<br />
World Bank World Development Indica<strong>to</strong>rs Percent<br />
primary products<br />
Tariff rate, most favoured nation,<br />
World Bank World Development Indica<strong>to</strong>rs Percent<br />
simple mean, primary products<br />
FTA Point scoring MFAT, ANZ Index<br />
Years NZ FTA in place MFAT, ANZ Years <strong>to</strong> current<br />
Trade Freedom Index The heritage Foundation Index of Economic freedom Index<br />
Ease of Doing Business<br />
Ease of Doing Business Rank World Bank Group Doing business indica<strong>to</strong>rs Index<br />
Trading Across Borders World Bank Group Doing business indica<strong>to</strong>rs Index<br />
Corruption Perception Index Transparency International Index (low=corruption)<br />
Birthplace of resident Statistics NZ NZ Census Country of birth<br />
Infrastructure<br />
Burden of cus<strong>to</strong>ms procedure, WEF World Bank World Development Indica<strong>to</strong>rs Index: (1=extremely inefficient<br />
<strong>to</strong> 7=extremely efficient)<br />
Quality of port infrastructure, WEF World Bank World Development Indica<strong>to</strong>rs Index: (1=extremely<br />
underdeveloped <strong>to</strong> 7=well<br />
developed and efficient by<br />
international standards)<br />
Logistics Performance Index World Bank World Development Indica<strong>to</strong>rs Index: : Overall (1=low <strong>to</strong><br />
5=high)<br />
Distance from market CEPII GeoDist database Kms<br />
Freight Cost worldfreightrates.com Auckland <strong>to</strong> country port<br />
destination<br />
Air freight cost worldfreightrates.com Auckland <strong>to</strong> country airport<br />
destination<br />
NZ Alignment<br />
Fruit/Meat/Milk/Seafood/Vegetables<br />
expenditure per capita<br />
USDA, Economic Research<br />
Service<br />
Food expenditure tables<br />
USD/container<br />
USD/100kg package<br />
USD/person<br />
Average fat consumption per capita FAO Food supply - Meat Fat supply quantity (g/capita/<br />
day)<br />
Change in fat consumption FAO Food supply % change<br />
Average protein consumption per capita FAO Food supply - Crop Protein supply quantity (g/<br />
capita/day)<br />
Change in protein consumption FAO Food supply %<br />
Share of dietary energy supply derived from<br />
cereals, roots and tubers<br />
FAO Food Security %<br />
Cereal import dependency ratio World Bank World Development Indica<strong>to</strong>rs Ratio<br />
Natural capital per capita World Bank Changing wealth of nations<br />
Bi-lateral trade ($ value in past 12 months) Statistics NZ Merchandise trade statistics $m<br />
% change (5-year window) in bilateral changes Statistics NZ Merchandise trade statistics percent change<br />
Page 27