

New horizons alternative Asian markets – From OPPortUNITY to CONNECtivitY
1sxNzy1
1sxNzy1

You also want an ePaper? Increase the reach of your titles
YUMPU automatically turns print PDFs into web optimized ePapers that Google loves.
5. Trade freedom index from Heritage Foundation. Trade<br />
freedom is a composite measure of the absence of tariff<br />
and non-tariff barriers that affect imports and exports<br />
of goods and services. Its score is based on the tradeweighted<br />
average tariff rate and non-tariff barriers. The<br />
non-tariff barriers in a country’s trade policy regime<br />
are assessed using both qualitative and quantitative<br />
information. Restrictive rules that hinder trade vary<br />
widely, and their overlapping and shifting nature makes<br />
them difficult <strong>to</strong> gauge and assess the impact on<br />
restricting trade. The categories assessed were: quantity<br />
restrictions, price restrictions, regula<strong>to</strong>ry restrictions,<br />
investment restrictions, cus<strong>to</strong>ms restrictions and direct<br />
government intervention. Unfortunately the assessment<br />
applies <strong>to</strong> all goods and services, as opposed <strong>to</strong> just soft<br />
commodities, but it still provides a reasonable proxy of<br />
the relative trade barriers between countries.<br />
Key results<br />
Singapore, Brunei Darussalam and Hong Kong <strong>to</strong>ok out the<br />
<strong>to</strong>p three spots, as virtually no tariffs are applied <strong>to</strong> primary<br />
products and <strong>New</strong> Zealand has free trade agreements with<br />
all three countries. All three also ranked highly on the trade<br />
freedom index, with Singapore and Hong Kong taking out<br />
joint <strong>to</strong>p spot on this measure. Hong Kong ranked slightly<br />
below the other two as <strong>New</strong> Zealand’s free trade agreement<br />
has been in place for a shorter period of time and was not<br />
part of a wider agreement, but it does have synergies with<br />
the mainland China and Taiwan agreements. Taiwan <strong>to</strong>ok<br />
out fourth place with a free trade agreement now in place<br />
and it also ranked highly on the trade freedom index (3rd).<br />
The next most attractive countries were Indonesia,<br />
Philippines and Malaysia. We have free trade agreements<br />
with all these countries that are part of the wider ASEAN<br />
agreement, which has been in force for five and a half years<br />
(albeit Indonesia joined later). All four would drop down<br />
<strong>to</strong> middle of the table without free trade agreements in<br />
place as the tariff rates applied <strong>to</strong> primary products range<br />
between 4-10%.<br />
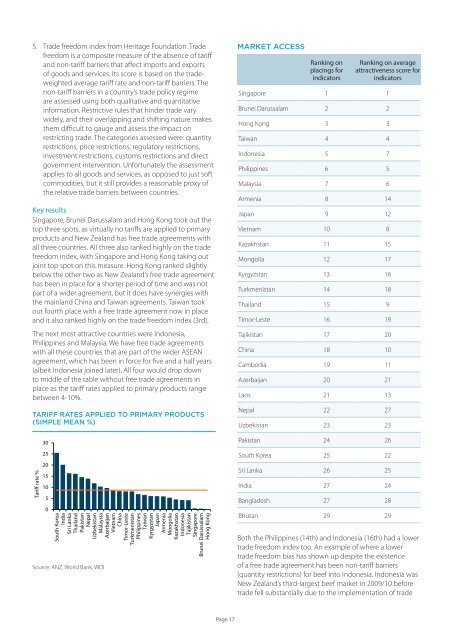
TARIFF RATES APPLIED TO PRIMARY PRODUCTS<br />
(simple mean %)<br />
Tariff rate %<br />
30<br />
25<br />
20<br />
15<br />
10<br />
5<br />
0<br />
South Korea<br />
India<br />
Sri Lanka<br />
Thailand<br />
Pakistan<br />
Nepal<br />
Uzbekistan<br />
Malaysia<br />
Azerbaijan<br />
Vietnam<br />
China<br />
Timor-Leste<br />
Turkmenistan<br />
Philippines<br />
Taiwan<br />
Kyrgyzstan<br />
Japan<br />
Armenia<br />
Mongolia<br />
Kazakhstan<br />
Indonesia<br />
Tajikistan<br />
Singapore<br />
Brunei Darussalam<br />
Hong Kong<br />
Source: ANZ, World Bank, WDI<br />
MARKET access<br />
Ranking on<br />
placings for<br />
indica<strong>to</strong>rs<br />
Ranking on average<br />
attractiveness score for<br />
indica<strong>to</strong>rs<br />
Singapore 1 1<br />
Brunei Darussalam 2 2<br />
Hong Kong 3 3<br />
Taiwan 4 4<br />
Indonesia 5 7<br />
Philippines 6 5<br />
Malaysia 7 6<br />
Armenia 8 14<br />
Japan 9 12<br />
Vietnam 10 8<br />
Kazakhstan 11 15<br />
Mongolia 12 17<br />
Kyrgyzstan 13 16<br />
Turkmenistan 14 18<br />
Thailand 15 9<br />
Timor-Leste 16 19<br />
Tajikistan 17 20<br />
China 18 10<br />
Cambodia 19 11<br />
Azerbaijan 20 21<br />
Laos 21 13<br />
Nepal 22 27<br />
Uzbekistan 23 23<br />
Pakistan 24 26<br />
South Korea 25 22<br />
Sri Lanka 26 25<br />
India 27 24<br />
Bangladesh 27 28<br />
Bhutan 29 29<br />
Both the Philippines (14th) and Indonesia (16th) had a lower<br />
trade freedom index <strong>to</strong>o. An example of where a lower<br />
trade freedom bias has shown up despite the existence<br />
of a free trade agreement has been non-tariff barriers<br />
(quantity restrictions) for beef in<strong>to</strong> Indonesia. Indonesia was<br />
<strong>New</strong> Zealand’s third-largest beef market in 2009/10 before<br />
trade fell substantially due <strong>to</strong> the implementation of trade<br />
Page 17