- Page 1 and 2:
Suomen tilastollinen vuosikirja Sta
- Page 3 and 4:
Tiedustelut - Förfrågningar - Inq
- Page 5 and 6:
Sisällys Innehåll Contents Alkusa
- Page 7 and 8:
Tietojen laatu Suomen tilastollinen
- Page 9 and 10:
Taulukkoluettelo Sivu Tabellförtec
- Page 11 and 12:
Taulukkoluettelo Sivu Tabellförtec
- Page 13 and 14:
Taulukkoluettelo Sivu Tabellförtec
- Page 15 and 16:
Taulukkoluettelo Sivu Tabellförtec
- Page 17 and 18:
Taulukkoluettelo Sivu Tabellförtec
- Page 19 and 20:
Taulukkoluettelo Sivu Tabellförtec
- Page 21 and 22:
Taulukkoluettelo Sivu Tabellförtec
- Page 23 and 24:
Taulukkoluettelo Sivu Tabellförtec
- Page 25 and 26:
Taulukkoluettelo Sivu Tabellförtec
- Page 27 and 28:
List of tables Page Page 61. Famili
- Page 29 and 30:
List of tables Page Page 251. New l
- Page 31 and 32:
List of tables Page Page 424. Indus
- Page 33 and 34:
List of tables Page Page 594. Waive
- Page 35 and 36:
Kartat - Kartor - Maps Väkiluvun m
- Page 37 and 38:
Kartat - Kartor - Maps Alle 15-vuot
- Page 39 and 40:
Kartat - Kartor - Maps Koulutustaso
- Page 41 and 42:
Kartat - Kartor - Maps Kunnallisvaa
- Page 43 and 44:
Kartat - Kartor - Maps Eniten ään
- Page 45 and 46:
Kartat - Kartor - Maps Kokonaishede
- Page 47 and 48:
Kartat - Kartor - Maps Bruttokansan
- Page 49 and 50:
Kartat - Kartor - Maps Kasvihuoneka
- Page 51 and 52:
Maantieteellisiä tietoja - Geograf
- Page 53 and 54:
Maantieteellisiä tietoja - Geograf
- Page 55 and 56:
Maantieteellisiä tietoja - Geograf
- Page 57 and 58:
Ympäristö ja luonnonvarat - Milj
- Page 59 and 60:
Ympäristö ja luonnonvarat - Milj
- Page 61 and 62:
Ympäristö ja luonnonvarat - Milj
- Page 63 and 64:
Ympäristö ja luonnonvarat - Milj
- Page 65 and 66:
Ympäristö ja luonnonvarat - Milj
- Page 67 and 68:
Ympäristö ja luonnonvarat - Milj
- Page 69 and 70:
Ympäristö ja luonnonvarat - Milj
- Page 71 and 72:
Ympäristö ja luonnonvarat - Milj
- Page 73 and 74:
Ympäristö ja luonnonvarat - Milj
- Page 75 and 76:
Väestö - Befolkning - Population
- Page 77 and 78:
Väestö - Befolkning - Population
- Page 79 and 80:
Väestö - Befolkning - Population
- Page 81 and 82:
Väestö - Befolkning - Population
- Page 83 and 84:
Väestö - Befolkning - Population
- Page 85 and 86:
Väestö - Befolkning - Population
- Page 87 and 88:
Väestö - Befolkning - Population
- Page 89 and 90:
Väestö - Befolkning - Population
- Page 91 and 92:
Väestö - Befolkning - Population
- Page 93 and 94:
Väestö - Befolkning - Population
- Page 95 and 96:
Väestö - Befolkning - Population
- Page 97 and 98:
Väestö - Befolkning - Population
- Page 99 and 100:
Väestö - Befolkning - Population
- Page 101 and 102:
Väestö - Befolkning - Population
- Page 103 and 104:
Väestö - Befolkning - Population
- Page 105 and 106:
Väestö - Befolkning - Population
- Page 107 and 108:
Väestö - Befolkning - Population
- Page 109 and 110:
Väestö - Befolkning - Population
- Page 111 and 112:
Väestö - Befolkning - Population
- Page 113 and 114:
Väestö - Befolkning - Population
- Page 115 and 116:
Väestö - Befolkning - Population
- Page 117 and 118:
Väestö - Befolkning - Population
- Page 119 and 120:
Väestö - Befolkning - Population
- Page 121 and 122:
Väestö - Befolkning - Population
- Page 123 and 124:
Väestö - Befolkning - Population
- Page 125 and 126:
Väestö - Befolkning - Population
- Page 127 and 128:
Väestö - Befolkning - Population
- Page 129 and 130:
Väestö - Befolkning - Population
- Page 131 and 132:
Väestö - Befolkning - Population
- Page 133 and 134:
Väestö - Befolkning - Population
- Page 135 and 136:
Väestö - Befolkning - Population
- Page 137 and 138:
Väestö - Befolkning - Population
- Page 139 and 140:
Väestö - Befolkning - Population
- Page 141 and 142:
Väestö - Befolkning - Population
- Page 143 and 144:
Väestö - Befolkning - Population
- Page 145 and 146:
Väestö - Befolkning - Population
- Page 147 and 148:
Väestö - Befolkning - Population
- Page 149 and 150:
Väestö - Befolkning - Population
- Page 151 and 152:
Väestö - Befolkning - Population
- Page 153 and 154:
Väestö - Befolkning - Population
- Page 155 and 156:
Väestö - Befolkning - Population
- Page 157 and 158:
Maa-, metsä- ja kalatalous - Jord-
- Page 159 and 160:
Maa-, metsä- ja kalatalous - Jord-
- Page 161 and 162:
Maa-, metsä- ja kalatalous - Jord-
- Page 163 and 164:
Maa-, metsä- ja kalatalous - Jord-
- Page 165 and 166:
Maa-, metsä- ja kalatalous - Jord-
- Page 167 and 168:
Maa-, metsä- ja kalatalous - Jord-
- Page 169 and 170:
Maa-, metsä- ja kalatalous - Jord-
- Page 171 and 172:
Maa-, metsä- ja kalatalous - Jord-
- Page 173 and 174:
Maa-, metsä- ja kalatalous - Jord-
- Page 175 and 176:
Maa-, metsä- ja kalatalous - Jord-
- Page 177 and 178:
Maa-, metsä- ja kalatalous - Jord-
- Page 179 and 180:
Maa-, metsä- ja kalatalous - Jord-
- Page 181 and 182:
Maa-, metsä- ja kalatalous - Jord-
- Page 183 and 184:
Maa-, metsä- ja kalatalous - Jord-
- Page 185 and 186:
Maa-, metsä- ja kalatalous - Jord-
- Page 187 and 188:
Yritykset - Företag - Enterprises
- Page 189 and 190:
Yritykset - Företag - Enterprises
- Page 191 and 192: Yritykset - Företag - Enterprises
- Page 193 and 194: Yritykset - Företag - Enterprises
- Page 195 and 196: Yritykset - Företag - Enterprises
- Page 197 and 198: Yritykset - Företag - Enterprises
- Page 199 and 200: Yritykset - Företag - Enterprises
- Page 201 and 202: Yritykset - Företag - Enterprises
- Page 203 and 204: Yritykset - Företag - Enterprises
- Page 205 and 206: Yritykset - Företag - Enterprises
- Page 207 and 208: Yritykset - Företag - Enterprises
- Page 209 and 210: Teollisuus - Industri - Manufacturi
- Page 211 and 212: Teollisuus - Industri - Manufacturi
- Page 213 and 214: Teollisuus - Industri - Manufacturi
- Page 215 and 216: Teollisuus - Industri - Manufacturi
- Page 217 and 218: Teollisuus - Industri - Manufacturi
- Page 219 and 220: Teollisuus - Industri - Manufacturi
- Page 221 and 222: Energia - Energi - Energy 179. Prim
- Page 223 and 224: Energia - Energi - Energy 180. Ener
- Page 225 and 226: Energia - Energi - Energy 184. Säh
- Page 227 and 228: Energia - Energi - Energy 188. Teol
- Page 229 and 230: Energia - Energi - Energy 190. Asui
- Page 231 and 232: Rakentaminen - Byggande - Construct
- Page 233 and 234: Rakentaminen - Byggande - Construct
- Page 235 and 236: Asuminen - Boende - Housing 199. Ra
- Page 237 and 238: Asuminen - Boende - Housing 202. As
- Page 239 and 240: Asuminen - Boende - Housing 205. As
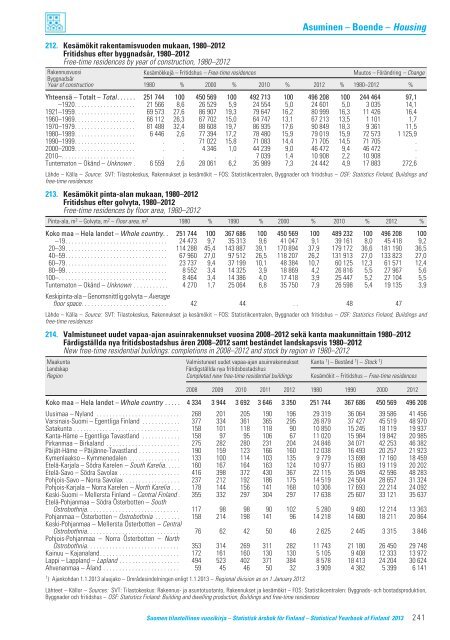
- Page 241: Asuminen - Boende - Housing 210. As
- Page 245 and 246: Asuminen - Boende - Housing 218. As
- Page 247 and 248: Asuminen - Boende - Housing 220. Va
- Page 249 and 250: Kauppa - Handel - Trade 223. Kaupan
- Page 251 and 252: Kauppa - Handel - Trade 223. (jatk.
- Page 253 and 254: Kauppa - Handel - Trade 224. Tukku-
- Page 255 and 256: Kauppa - Handel - Trade 227. Suurim
- Page 257 and 258: Kauppa - Handel - Trade 230. Tuonti
- Page 259 and 260: Kauppa - Handel - Trade 230. (jatk.
- Page 261 and 262: Kauppa - Handel - Trade 230. (jatk.
- Page 263 and 264: Kauppa - Handel - Trade 233. Tuonti
- Page 265 and 266: Kauppa - Handel - Trade 235. Tuonni
- Page 267 and 268: Kauppa - Handel - Trade 237. Tuonti
- Page 269 and 270: Kauppa - Handel - Trade 237. (jatk.
- Page 271 and 272: Kauppa - Handel - Trade 238. Tuonti
- Page 273 and 274: Rahoitus ja vakuutus - Finansiering
- Page 275 and 276: Rahoitus ja vakuutus - Finansiering
- Page 277 and 278: Rahoitus ja vakuutus - Finansiering
- Page 279 and 280: Rahoitus ja vakuutus - Finansiering
- Page 281 and 282: Rahoitus ja vakuutus - Finansiering
- Page 283 and 284: Rahoitus ja vakuutus - Finansiering
- Page 285 and 286: Rahoitus ja vakuutus - Finansiering
- Page 287 and 288: Rahoitus ja vakuutus - Finansiering
- Page 289 and 290: Rahoitus ja vakuutus - Finansiering
- Page 291 and 292: Liikenne ja matkailu - Transport oc
- Page 293 and 294:
Liikenne ja matkailu - Transport oc
- Page 295 and 296:
Liikenne ja matkailu - Transport oc
- Page 297 and 298:
Liikenne ja matkailu - Transport oc
- Page 299 and 300:
Liikenne ja matkailu - Transport oc
- Page 301 and 302:
Liikenne ja matkailu - Transport oc
- Page 303 and 304:
Liikenne ja matkailu - Transport oc
- Page 305 and 306:
Liikenne ja matkailu - Transport oc
- Page 307 and 308:
Liikenne ja matkailu - Transport oc
- Page 309 and 310:
Liikenne ja matkailu - Transport oc
- Page 311 and 312:
Liikenne ja matkailu - Transport oc
- Page 313 and 314:
Liikenne ja matkailu - Transport oc
- Page 315 and 316:
Kansantalous - Nationalräkenskaper
- Page 317 and 318:
Kansantalous - Nationalräkenskaper
- Page 319 and 320:
Kansantalous - Nationalräkenskaper
- Page 321 and 322:
Kansantalous - Nationalräkenskaper
- Page 323 and 324:
Kansantalous - Nationalräkenskaper
- Page 325 and 326:
Kansantalous - Nationalräkenskaper
- Page 327 and 328:
Kansantalous - Nationalräkenskaper
- Page 329 and 330:
Kansantalous - Nationalräkenskaper
- Page 331 and 332:
Kansantalous - Nationalräkenskaper
- Page 333 and 334:
Kansantalous - Nationalräkenskaper
- Page 335 and 336:
Julkinen talous - Offentlig ekonomi
- Page 337 and 338:
Julkinen talous - Offentlig ekonomi
- Page 339 and 340:
Julkinen talous - Offentlig ekonomi
- Page 341 and 342:
Julkinen talous - Offentlig ekonomi
- Page 343 and 344:
Julkinen talous - Offentlig ekonomi
- Page 345 and 346:
Julkinen talous - Offentlig ekonomi
- Page 347 and 348:
Julkinen talous - Offentlig ekonomi
- Page 349 and 350:
Julkinen talous - Offentlig ekonomi
- Page 351 and 352:
Julkinen talous - Offentlig ekonomi
- Page 353 and 354:
Julkinen talous - Offentlig ekonomi
- Page 355 and 356:
Julkinen talous - Offentlig ekonomi
- Page 357 and 358:
Julkinen talous - Offentlig ekonomi
- Page 359 and 360:
Julkinen talous - Offentlig ekonomi
- Page 361 and 362:
Julkinen talous - Offentlig ekonomi
- Page 363 and 364:
Julkinen talous - Offentlig ekonomi
- Page 365 and 366:
Julkinen talous - Offentlig ekonomi
- Page 367 and 368:
Julkinen talous - Offentlig ekonomi
- Page 369 and 370:
Julkinen talous - Offentlig ekonomi
- Page 371 and 372:
Julkinen talous - Offentlig ekonomi
- Page 373 and 374:
Julkinen talous - Offentlig ekonomi
- Page 375 and 376:
Julkinen talous - Offentlig ekonomi
- Page 377 and 378:
Työkokemus - Arbetserfarenhet Oppi
- Page 379 and 380:
Koulutus - Utbildning - Education 3
- Page 381 and 382:
Koulutus - Utbildning - Education 3
- Page 383 and 384:
Koulutus - Utbildning - Education 3
- Page 385 and 386:
Koulutus - Utbildning - Education 3
- Page 387 and 388:
Koulutus - Utbildning - Education 3
- Page 389 and 390:
Koulutus - Utbildning - Education 3
- Page 391 and 392:
Koulutus - Utbildning - Education 3
- Page 393 and 394:
Koulutus - Utbildning - Education 3
- Page 395 and 396:
Koulutus - Utbildning - Education 3
- Page 397 and 398:
Tiede, teknologia ja tietoyhteiskun
- Page 399 and 400:
Tiede, teknologia ja tietoyhteiskun
- Page 401 and 402:
Tiede, teknologia ja tietoyhteiskun
- Page 403 and 404:
Tiede, teknologia ja tietoyhteiskun
- Page 405 and 406:
Tiede, teknologia ja tietoyhteiskun
- Page 407 and 408:
Työmarkkinat - Arbetsmarknaden - L
- Page 409 and 410:
Työmarkkinat - Arbetsmarknaden - L
- Page 411 and 412:
Työmarkkinat - Arbetsmarknaden - L
- Page 413 and 414:
Työmarkkinat - Arbetsmarknaden - L
- Page 415 and 416:
Työmarkkinat - Arbetsmarknaden - L
- Page 417 and 418:
Työmarkkinat - Arbetsmarknaden - L
- Page 419 and 420:
Työmarkkinat - Arbetsmarknaden - L
- Page 421 and 422:
Työmarkkinat - Arbetsmarknaden - L
- Page 423 and 424:
Työmarkkinat - Arbetsmarknaden - L
- Page 425 and 426:
Työmarkkinat - Arbetsmarknaden - L
- Page 427 and 428:
Työmarkkinat - Arbetsmarknaden - L
- Page 429 and 430:
Palkat ja työvoimakustannukset - L
- Page 431 and 432:
Palkat ja työvoimakustannukset - L
- Page 433 and 434:
Palkat ja työvoimakustannukset - L
- Page 435 and 436:
Palkat ja työvoimakustannukset - L
- Page 437 and 438:
Palkat ja työvoimakustannukset - L
- Page 439 and 440:
Palkat ja työvoimakustannukset - L
- Page 441 and 442:
Palkat ja työvoimakustannukset - L
- Page 443 and 444:
Tulot ja kulutus - Inkomst och kons
- Page 445 and 446:
Tulot ja kulutus - Inkomst och kons
- Page 447 and 448:
Tulot ja kulutus - Inkomst och kons
- Page 449 and 450:
Tulot ja kulutus - Inkomst och kons
- Page 451 and 452:
Tulot ja kulutus - Inkomst och kons
- Page 453 and 454:
Tulot ja kulutus - Inkomst och kons
- Page 455 and 456:
Tulot ja kulutus - Inkomst och kons
- Page 457 and 458:
Tulot ja kulutus - Inkomst och kons
- Page 459 and 460:
Tulot ja kulutus - Inkomst och kons
- Page 461 and 462:
Tulot ja kulutus - Inkomst och kons
- Page 463 and 464:
Hinnat ja kustannukset - Priser och
- Page 465 and 466:
Hinnat ja kustannukset - Priser och
- Page 467 and 468:
Hinnat ja kustannukset - Priser och
- Page 469 and 470:
Hinnat ja kustannukset - Priser och
- Page 471 and 472:
Hinnat ja kustannukset - Priser och
- Page 473 and 474:
Hinnat ja kustannukset - Priser och
- Page 475 and 476:
Hinnat ja kustannukset - Priser och
- Page 477 and 478:
Hinnat ja kustannukset - Priser och
- Page 479 and 480:
Hinnat ja kustannukset - Priser och
- Page 481 and 482:
Hinnat ja kustannukset - Priser och
- Page 483 and 484:
Hinnat ja kustannukset - Priser och
- Page 485 and 486:
Sosiaaliturva - Socialskydd - Socia
- Page 487 and 488:
Sosiaaliturva - Socialskydd - Socia
- Page 489 and 490:
Sosiaaliturva - Socialskydd - Socia
- Page 491 and 492:
Sosiaaliturva - Socialskydd - Socia
- Page 493 and 494:
Sosiaaliturva - Socialskydd - Socia
- Page 495 and 496:
Sosiaaliturva - Socialskydd - Socia
- Page 497 and 498:
Sosiaaliturva - Socialskydd - Socia
- Page 499 and 500:
Sosiaaliturva - Socialskydd - Socia
- Page 501 and 502:
Sosiaaliturva - Socialskydd - Socia
- Page 503 and 504:
Sosiaaliturva - Socialskydd - Socia
- Page 505 and 506:
Terveys - Hälsa - Health 527. Olue
- Page 507 and 508:
Terveys - Hälsa - Health 530. Tupa
- Page 509 and 510:
Terveys - Hälsa - Health 534. Vapa
- Page 511 and 512:
Terveys - Hälsa - Health 537. Uude
- Page 513 and 514:
Terveys - Hälsa - Health 539. Amma
- Page 515 and 516:
Terveys - Hälsa - Health 543. Työ
- Page 517 and 518:
Terveys - Hälsa - Health 547. Hamm
- Page 519 and 520:
Terveys - Hälsa - Health 551. Ylei
- Page 521 and 522:
Terveys - Hälsa - Health 552. Lail
- Page 523 and 524:
Terveys - Hälsa - Health 555. Terv
- Page 525 and 526:
Terveys - Hälsa - Health 557. Erit
- Page 527 and 528:
Terveys - Hälsa - Health 560. Kuol
- Page 529 and 530:
Terveys - Hälsa - Health 561. Itse
- Page 531 and 532:
Kulttuuri ja viestintä - Kultur oc
- Page 533 and 534:
Kulttuuri ja viestintä - Kultur oc
- Page 535 and 536:
Kulttuuri ja viestintä - Kultur oc
- Page 537 and 538:
Kulttuuri ja viestintä - Kultur oc
- Page 539 and 540:
Kulttuuri ja viestintä - Kultur oc
- Page 541 and 542:
Kulttuuri ja viestintä - Kultur oc
- Page 543 and 544:
Kulttuuri ja viestintä - Kultur oc
- Page 545 and 546:
Kulttuuri ja viestintä - Kultur oc
- Page 547 and 548:
Kulttuuri ja viestintä - Kultur oc
- Page 549 and 550:
Oikeus - Rättsväsende - Justice 5
- Page 551 and 552:
Oikeus - Rättsväsende - Justice 5
- Page 553 and 554:
Oikeus - Rättsväsende - Justice 5
- Page 555 and 556:
Oikeus - Rättsväsende - Justice 5
- Page 557 and 558:
Oikeus - Rättsväsende - Justice 5
- Page 559 and 560:
Oikeus - Rättsväsende - Justice 5
- Page 561 and 562:
Oikeus - Rättsväsende - Justice 5
- Page 563 and 564:
Oikeus - Rättsväsende - Justice 6
- Page 565 and 566:
Oikeus - Rättsväsende - Justice 6
- Page 567 and 568:
Oikeus - Rättsväsende - Justice 6
- Page 569 and 570:
Oikeus - Rättsväsende - Justice 6
- Page 571 and 572:
Oikeus - Rättsväsende - Justice 6
- Page 573 and 574:
Vaalit ja yhteiskunnallinen päät
- Page 575 and 576:
Vaalit ja yhteiskunnallinen päät
- Page 577 and 578:
Vaalit ja yhteiskunnallinen päät
- Page 579 and 580:
Vaalit ja yhteiskunnallinen päät
- Page 581 and 582:
Vaalit ja yhteiskunnallinen päät
- Page 583 and 584:
Vaalit ja yhteiskunnallinen päät
- Page 585 and 586:
Ahvenanmaan maakunta - Landskapet
- Page 587 and 588:
Ahvenanmaan maakunta - Landskapet
- Page 589 and 590:
Ahvenanmaan maakunta - Landskapet
- Page 591 and 592:
Ahvenanmaan maakunta - Landskapet
- Page 593 and 594:
Ahvenanmaan maakunta - Landskapet
- Page 595 and 596:
Ulkomaat - Utlandet 648. (jatk. - f
- Page 597 and 598:
Ulkomaat - Utlandet 649. (jatk. - f
- Page 599 and 600:
Ulkomaat - Utlandet 649. (jatk. - f
- Page 601 and 602:
Ulkomaat - Utlandet 649. (jatk. - f
- Page 603 and 604:
Ulkomaat - Utlandet 650. EU-maiden
- Page 605 and 606:
Ulkomaat - Utlandet 650. (jatk. - f
- Page 607 and 608:
Ulkomaat - Utlandet 652. Suurimpien
- Page 609 and 610:
Ulkomaat - Utlandet 652. (jatk. - f
- Page 611 and 612:
Ulkomaat - Utlandet 652. (jatk. - f
- Page 613 and 614:
Ulkomaat - Utlandet 652. (jatk. - f
- Page 615 and 616:
Ulkomaat - Utlandet 652. (jatk. - f
- Page 617 and 618:
Ulkomaat - Utlandet 656. Eri uskont
- Page 619 and 620:
Ulkomaat - Utlandet 658. Väestö s
- Page 621 and 622:
Ulkomaat - Utlandet 660. Elävänä
- Page 623 and 624:
Ulkomaat - Utlandet 662. Pinta-alan
- Page 625 and 626:
Ulkomaat - Utlandet 662. (jatk.- fo
- Page 627 and 628:
Ulkomaat - Utlandet 664. Paperi, sa
- Page 629 and 630:
Ulkomaat - Utlandet 666. Energialä
- Page 631 and 632:
Ulkomaat - Utlandet 670. Sähkövoi
- Page 633 and 634:
Ulkomaat - Utlandet 672. Kasvihuone
- Page 635 and 636:
Ulkomaat - Utlandet 674. Yhdyskunta
- Page 637 and 638:
Ulkomaat - Utlandet 675. (jatk. - f
- Page 639 and 640:
Ulkomaat - Utlandet 675. (jatk. - f
- Page 641 and 642:
Ulkomaat - Utlandet 676. (jatk. - f
- Page 643 and 644:
Ulkomaat - Utlandet 677. (jatk. - f
- Page 645 and 646:
Ulkomaat - Utlandet 677. (jatk. - f
- Page 647 and 648:
Ulkomaat - Utlandet 679. Rautatiet,
- Page 649 and 650:
Ulkomaat - Utlandet 681. Tieliikenn
- Page 651 and 652:
Ulkomaat - Utlandet 683. Tietoliike
- Page 653 and 654:
Ulkomaat - Utlandet 685. Markkinahi
- Page 655 and 656:
Ulkomaat - Utlandet 686. Bruttokans
- Page 657 and 658:
Ulkomaat - Utlandet 688. Veroaste 1
- Page 659 and 660:
Ulkomaat - Utlandet 690. Asevoimat
- Page 661 and 662:
Ulkomaat - Utlandet 692. Työttöm
- Page 663 and 664:
Ulkomaat - Utlandet 695. Terveydenh
- Page 665 and 666:
Ulkomaat - Utlandet 697. Koulutus,
- Page 667 and 668:
Ulkomaat - Utlandet 699. Sanomalehd
- Page 669 and 670:
Mittayksikköjä - Måttenheter - U
- Page 671 and 672:
Mittayksikköjä - Måttenheter - U
- Page 673 and 674:
Tilastontuottajia - Statistikproduc
- Page 675 and 676:
Aakkosellinen hakemisto - toimialoi
- Page 677 and 678:
Aakkosellinen hakemisto - kotitalou
- Page 679 and 680:
Aakkosellinen hakemisto R Raaka-ain
- Page 681 and 682:
Aakkosellinen hakemisto Työpaikat
- Page 683 and 684:
Alfabetiskt register Sidnumren efte
- Page 685 and 686:
Alfabetiskt register - efter landsg
- Page 687 and 688:
Alfabetiskt register Inrikes omflyt
- Page 689 and 690:
Alfabetiskt register - medelpension
- Page 691 and 692:
Alfabetiskt register - arbetstimmar
- Page 693 and 694:
Index - violence 525-527, 549-551,
- Page 695 and 696:
Index - wages and salaries 186, 188
- Page 697 and 698:
Index Longitudes 53 Lutheran Nation
- Page 699 and 700:
Index Self-sufficiency in foodstuff
- Page 701:
Vuosikirjan tilastot piirtävät ta