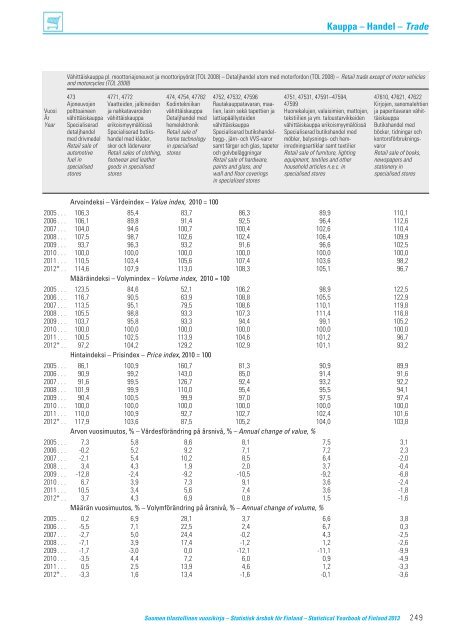
Kauppa – Handel – Trade Vähittäiskauppa pl. moottoriajoneuvot ja moottoripyörät (TOL 2008) – Detaljhandel utom med motorfordon (TOL 2008) – Retail trade except of motor vehicles and motorcycles (TOL 2008) 473 4771, 4772 474, 4754, 47782 4752, 47532, 47596 4751, 47531, 47591–47594, 47610, 47621, 47622 Ajoneuvojen Vaatteiden, jalkineiden Kodintekniikan Rautakauppatavaran, maa- 47599 Kirjojen, sanomalehtien Vuosi polttoaineen ja nahkatavaroiden vähittäiskauppa lien, lasin sekä tapettien ja Huonekalujen, valaisimien, mattojen, ja paperitavaran vähit- År vähittäiskauppa vähittäiskauppa Detaljhandel med lattiapäällysteiden tekstiilien ja ym. taloustarvikkeiden täiskauppa Year Specialiserad erikoismyymälöissä hemelektronik vähittäiskauppa vähittäiskauppa erikoismyymälöissä Butikshandel med detaljhandel Specialiserad butiks- Retail sale of Specialiserad butikshandel- Specialiserad butikshandel med böcker, tidningar och med drivmedel handel med kläder, home technology bygg-, järn- och VVS-varor möbler, belysnings- och hem- kontorsförbruknings- Retail sale of skor och lädervaror in specialised samt färger och glas, tapeter inredningsartiklar samt textilier varor automotive Retail sales of clothing, stores och golvbeläggningar Retail sale of furniture, lighting Retail sale of books, fuel in footwear and leather Retail sale of hardware, equipment, textiles and other newspapers and specialised goods in specialised paints and glass, and household articles n.e.c. in stationery in stores stores wall and floor coverings specialised stores specialised stores in specialised stores Arvoindeksi – Värdeindex – Value index, 2010 = 100 2005 . . . 106,3 85,4 83,7 86,3 89,9 110,1 2006 . . . 106,1 89,8 91,4 92,5 96,4 112,6 2007 . . . 104,0 94,6 100,7 100,4 102,6 110,4 2008 . . . 107,5 98,7 102,6 102,4 106,4 109,9 2009 . . . 93,7 96,3 93,2 91,6 96,6 102,5 2010 . . . 100,0 100,0 100,0 100,0 100,0 100,0 2011 . . . 110,5 103,4 105,6 107,4 103,6 98,2 2012* . . 114,6 107,9 113,0 108,3 105,1 96,7 Määräindeksi – Volymindex – Volume index, 2010 = 100 2005 . . . 123,5 84,6 52,1 106,2 98,9 122,5 2006 . . . 116,7 90,5 63,9 108,8 105,5 122,9 2007 . . . 113,5 95,1 79,5 108,6 110,1 119,8 2008 . . . 105,5 98,8 93,3 107,3 111,4 116,8 2009 . . . 103,7 95,8 93,3 94,4 99,1 105,2 2010 . . . 100,0 100,0 100,0 100,0 100,0 100,0 2011 . . . 100,5 102,5 113,9 104,6 101,2 96,7 2012* . . 97,2 104,2 129,2 102,9 101,1 93,2 Hintaindeksi – Prisindex – Price index, 2010 = 100 2005 . . . 86,1 100,9 160,7 81,3 90,9 89,9 2006 . . . 90,9 99,2 143,0 85,0 91,4 91,6 2007 . . . 91,6 99,5 126,7 92,4 93,2 92,2 2008 . . . 101,9 99,9 110,0 95,4 95,5 94,1 2009 . . . 90,4 100,5 99,9 97,0 97,5 97,4 2010 . . . 100,0 100,0 100,0 100,0 100,0 100,0 2011 . . . 110,0 100,9 92,7 102,7 102,4 101,6 2012* . . 117,9 103,6 87,5 105,2 104,0 103,8 Arvon vuosimuutos, % – Värdesförändring på årsnivå, % – Annual change of value, % 2005 . . . 7,3 5,8 8,6 8,1 7,5 3,1 2006 . . . -0,2 5,2 9,2 7,1 7,2 2,3 2007 . . . -2,1 5,4 10,2 8,5 6,4 -2,0 2008 . . . 3,4 4,3 1,9 2,0 3,7 -0,4 2009 . . . -12,8 -2,4 -9,2 -10,5 -9,2 -6,8 2010 . . . 6,7 3,9 7,3 9,1 3,6 -2,4 2011 . . . 10,5 3,4 5,6 7,4 3,6 -1,8 2012* . . 3,7 4,3 6,9 0,8 1,5 -1,6 Määrän vuosimuutos, % – Volymförändring på årsnivå, % – Annual change of volume, % 2005 . . . 0,2 6,9 28,1 3,7 6,6 3,8 2006 . . . -5,5 7,1 22,5 2,4 6,7 0,3 2007 . . . -2,7 5,0 24,4 -0,2 4,3 -2,5 2008 . . . -7,1 3,9 17,4 -1,2 1,2 -2,6 2009 . . . -1,7 -3,0 0,0 -12,1 -11,1 -9,9 2010 . . . -3,5 4,4 7,2 6,0 0,9 -4,9 2011 . . . 0,5 2,5 13,9 4,6 1,2 -3,3 2012* . . -3,3 1,6 13,4 -1,6 -0,1 -3,6 Suomen tilastollinen vuosikirja – Statistisk årsbok för <strong>Finland</strong> – Statistical <strong>Yearbook</strong> of <strong>Finland</strong> <strong>2013</strong> 249
Kauppa – Handel – Trade 223. (jatk. – forts. – cont.) Vähittäiskauppa pl. moottoriajoneuvot ja moottoripyörät (TOL 2008) – Detaljhandel utom med motorfordon (TOL 2008) – Retail trade except of motor vehicles and motorcycles (TOL 2008) 47641 47642 4773–4775 47761–47763 4777 47783 Vuosi Urheiluvälineiden Veneiden ja Apteekkien, terveydenhoito- Kukkien, kasvien, Kultasepänteosten Optisen alan År vähittäiskauppa veneilytarvikkeiden tarvikkeiden sekä kosmetiikka- siementen ja ja kellojen vähittäiskauppa Year Specialiserad vähittäiskauppa ja hygieniatuotteiden lannoitteiden vähittäiskauppa Specialiserad butikshandel med Specialiserad vähittäiskauppa vähittäiskauppa Specialiserad butikshandel med sportartiklar butikshandel Apotekshandel, specialiserad Specialiserad butiks- butikshandel med optiska artiklar Retail sale of med båtar och butikshandel med sjukvårds- handel med blommor ur, guldsmedsvaror Retail sale of sporting equipment båttillbehör artiklar, kosmetika och och andra växter, frön och smycken optical equipment in specialised Retail sale of boats hygienartiklar och gödselmedel Retail sale of in specialised stores and boating Retail sale of dispensing Retail sale of flowers, watches and stores accessories in chemists, medical goods plants, seeds and jewellery in specialised stores and cosmetic and toilet fertilisers in specialised stores articles in specialised stores specialised stores Arvoindeksi – Värdeindex – Value index, 2010 = 100 2005 . . . . . 76,7 109,6 88,2 81,9 81,5 79,1 2006 . . . . . 81,9 118,2 88,0 86,0 89,1 86,1 2007 . . . . . 88,5 137,3 92,8 95,4 94,2 89,8 2008 . . . . . 91,9 130,6 99,6 97,0 95,7 88,3 2009 . . . . . 94,3 99,0 100,0 97,8 93,1 95,1 2010 . . . . . 100,0 100,0 100,0 100,0 100,0 100,0 2011 . . . . . 99,7 107,1 102,0 100,2 102,7 102,8 2012* . . . . 107,3 105,3 106,5 99,7 102,7 98,5 Määräindeksi – Volymindex – Volume index, 2010 = 100 2005 . . . . . 77,6 120,3 79,0 84,6 105,3 68,1 2006 . . . . . 84,7 126,4 80,7 89,4 109,2 72,7 2007 . . . . . 91,3 142,0 89,1 99,5 111,8 75,8 2008 . . . . . 94,7 131,2 95,0 100,1 106,5 84,6 2009 . . . . . 96,1 97,2 96,4 98,7 99,8 96,4 2010 . . . . . 100,0 100,0 100,0 100,0 100,0 100,0 2011 . . . . . 100,0 103,4 104,7 103,6 90,7 101,7 2012* . . . . 106,3 99,1 111,4 102,4 83,0 99,8 Hintaindeksi – Prisindex – Price index, 2010 = 100 2005 . . . . . 98,8 91,1 111,6 96,8 77,4 116,2 2006 . . . . . 96,7 93,5 109,0 96,2 81,6 118,4 2007 . . . . . 96,9 96,7 104,2 95,9 84,3 118,5 2008 . . . . . 97,0 99,5 104,8 96,9 89,9 104,4 2009 . . . . . 98,1 101,9 103,7 99,1 93,3 98,7 2010 . . . . . 100,0 100,0 100,0 100,0 100,0 100,0 2011 . . . . . 99,7 103,6 97,4 96,7 113,2 101,1 2012* . . . . 100,9 106,3 95,6 97,4 123,7 98,7 Arvon vuosimuutos, % – Värdesförändring på årsnivå, % – Annual change of value, % 2005 . . . . . 3,6 8,8 6,0 1,7 5,3 3,1 2006 . . . . . 6,8 7,9 -0,2 4,9 9,4 8,8 2007 . . . . . 8,0 16,1 5,4 11,0 5,8 4,3 2008 . . . . . 4,0 -4,9 7,3 1,7 1,5 -1,7 2009 . . . . . 2,5 -24,2 0,4 0,8 -2,7 7,8 2010 . . . . . 6,1 1,0 0,0 2,2 7,5 5,1 2011 . . . . . -0,3 7,1 2,0 0,2 2,7 2,8 2012* . . . . 7,6 -1,7 4,4 -0,5 0,0 -4,2 Määrän vuosimuutos, % – Volymförändring på årsnivå, % – Annual change of volume, % 2005 . . . . . 3,9 6,7 3,8 3,0 3,3 2,3 2006 . . . . . 9,1 5,1 2,2 5,7 3,7 6,9 2007 . . . . . 7,9 12,4 10,4 11,3 2,4 4,2 2008 . . . . . 3,7 -7,6 6,5 0,6 -4,7 11,7 2009 . . . . . 1,5 -25,9 1,5 -1,4 -6,4 14,0 2010 . . . . . 4,0 2,9 3,7 1,3 0,2 3,7 2011 . . . . . 0,0 3,4 4,7 3,6 -9,3 1,7 2012* . . . . 6,2 -4,1 6,5 -1,2 -8,5 -1,9 250 Suomen tilastollinen vuosikirja – Statistisk årsbok för <strong>Finland</strong> – Statistical <strong>Yearbook</strong> of <strong>Finland</strong> <strong>2013</strong>
- Page 1 and 2:
Suomen tilastollinen vuosikirja Sta
- Page 3 and 4:
Tiedustelut - Förfrågningar - Inq
- Page 5 and 6:
Sisällys Innehåll Contents Alkusa
- Page 7 and 8:
Tietojen laatu Suomen tilastollinen
- Page 9 and 10:
Taulukkoluettelo Sivu Tabellförtec
- Page 11 and 12:
Taulukkoluettelo Sivu Tabellförtec
- Page 13 and 14:
Taulukkoluettelo Sivu Tabellförtec
- Page 15 and 16:
Taulukkoluettelo Sivu Tabellförtec
- Page 17 and 18:
Taulukkoluettelo Sivu Tabellförtec
- Page 19 and 20:
Taulukkoluettelo Sivu Tabellförtec
- Page 21 and 22:
Taulukkoluettelo Sivu Tabellförtec
- Page 23 and 24:
Taulukkoluettelo Sivu Tabellförtec
- Page 25 and 26:
Taulukkoluettelo Sivu Tabellförtec
- Page 27 and 28:
List of tables Page Page 61. Famili
- Page 29 and 30:
List of tables Page Page 251. New l
- Page 31 and 32:
List of tables Page Page 424. Indus
- Page 33 and 34:
List of tables Page Page 594. Waive
- Page 35 and 36:
Kartat - Kartor - Maps Väkiluvun m
- Page 37 and 38:
Kartat - Kartor - Maps Alle 15-vuot
- Page 39 and 40:
Kartat - Kartor - Maps Koulutustaso
- Page 41 and 42:
Kartat - Kartor - Maps Kunnallisvaa
- Page 43 and 44:
Kartat - Kartor - Maps Eniten ään
- Page 45 and 46:
Kartat - Kartor - Maps Kokonaishede
- Page 47 and 48:
Kartat - Kartor - Maps Bruttokansan
- Page 49 and 50:
Kartat - Kartor - Maps Kasvihuoneka
- Page 51 and 52:
Maantieteellisiä tietoja - Geograf
- Page 53 and 54:
Maantieteellisiä tietoja - Geograf
- Page 55 and 56:
Maantieteellisiä tietoja - Geograf
- Page 57 and 58:
Ympäristö ja luonnonvarat - Milj
- Page 59 and 60:
Ympäristö ja luonnonvarat - Milj
- Page 61 and 62:
Ympäristö ja luonnonvarat - Milj
- Page 63 and 64:
Ympäristö ja luonnonvarat - Milj
- Page 65 and 66:
Ympäristö ja luonnonvarat - Milj
- Page 67 and 68:
Ympäristö ja luonnonvarat - Milj
- Page 69 and 70:
Ympäristö ja luonnonvarat - Milj
- Page 71 and 72:
Ympäristö ja luonnonvarat - Milj
- Page 73 and 74:
Ympäristö ja luonnonvarat - Milj
- Page 75 and 76:
Väestö - Befolkning - Population
- Page 77 and 78:
Väestö - Befolkning - Population
- Page 79 and 80:
Väestö - Befolkning - Population
- Page 81 and 82:
Väestö - Befolkning - Population
- Page 83 and 84:
Väestö - Befolkning - Population
- Page 85 and 86:
Väestö - Befolkning - Population
- Page 87 and 88:
Väestö - Befolkning - Population
- Page 89 and 90:
Väestö - Befolkning - Population
- Page 91 and 92:
Väestö - Befolkning - Population
- Page 93 and 94:
Väestö - Befolkning - Population
- Page 95 and 96:
Väestö - Befolkning - Population
- Page 97 and 98:
Väestö - Befolkning - Population
- Page 99 and 100:
Väestö - Befolkning - Population
- Page 101 and 102:
Väestö - Befolkning - Population
- Page 103 and 104:
Väestö - Befolkning - Population
- Page 105 and 106:
Väestö - Befolkning - Population
- Page 107 and 108:
Väestö - Befolkning - Population
- Page 109 and 110:
Väestö - Befolkning - Population
- Page 111 and 112:
Väestö - Befolkning - Population
- Page 113 and 114:
Väestö - Befolkning - Population
- Page 115 and 116:
Väestö - Befolkning - Population
- Page 117 and 118:
Väestö - Befolkning - Population
- Page 119 and 120:
Väestö - Befolkning - Population
- Page 121 and 122:
Väestö - Befolkning - Population
- Page 123 and 124:
Väestö - Befolkning - Population
- Page 125 and 126:
Väestö - Befolkning - Population
- Page 127 and 128:
Väestö - Befolkning - Population
- Page 129 and 130:
Väestö - Befolkning - Population
- Page 131 and 132:
Väestö - Befolkning - Population
- Page 133 and 134:
Väestö - Befolkning - Population
- Page 135 and 136:
Väestö - Befolkning - Population
- Page 137 and 138:
Väestö - Befolkning - Population
- Page 139 and 140:
Väestö - Befolkning - Population
- Page 141 and 142:
Väestö - Befolkning - Population
- Page 143 and 144:
Väestö - Befolkning - Population
- Page 145 and 146:
Väestö - Befolkning - Population
- Page 147 and 148:
Väestö - Befolkning - Population
- Page 149 and 150:
Väestö - Befolkning - Population
- Page 151 and 152:
Väestö - Befolkning - Population
- Page 153 and 154:
Väestö - Befolkning - Population
- Page 155 and 156:
Väestö - Befolkning - Population
- Page 157 and 158:
Maa-, metsä- ja kalatalous - Jord-
- Page 159 and 160:
Maa-, metsä- ja kalatalous - Jord-
- Page 161 and 162:
Maa-, metsä- ja kalatalous - Jord-
- Page 163 and 164:
Maa-, metsä- ja kalatalous - Jord-
- Page 165 and 166:
Maa-, metsä- ja kalatalous - Jord-
- Page 167 and 168:
Maa-, metsä- ja kalatalous - Jord-
- Page 169 and 170:
Maa-, metsä- ja kalatalous - Jord-
- Page 171 and 172:
Maa-, metsä- ja kalatalous - Jord-
- Page 173 and 174:
Maa-, metsä- ja kalatalous - Jord-
- Page 175 and 176:
Maa-, metsä- ja kalatalous - Jord-
- Page 177 and 178:
Maa-, metsä- ja kalatalous - Jord-
- Page 179 and 180:
Maa-, metsä- ja kalatalous - Jord-
- Page 181 and 182:
Maa-, metsä- ja kalatalous - Jord-
- Page 183 and 184:
Maa-, metsä- ja kalatalous - Jord-
- Page 185 and 186:
Maa-, metsä- ja kalatalous - Jord-
- Page 187 and 188:
Yritykset - Företag - Enterprises
- Page 189 and 190:
Yritykset - Företag - Enterprises
- Page 191 and 192:
Yritykset - Företag - Enterprises
- Page 193 and 194:
Yritykset - Företag - Enterprises
- Page 195 and 196:
Yritykset - Företag - Enterprises
- Page 197 and 198:
Yritykset - Företag - Enterprises
- Page 199 and 200: Yritykset - Företag - Enterprises
- Page 201 and 202: Yritykset - Företag - Enterprises
- Page 203 and 204: Yritykset - Företag - Enterprises
- Page 205 and 206: Yritykset - Företag - Enterprises
- Page 207 and 208: Yritykset - Företag - Enterprises
- Page 209 and 210: Teollisuus - Industri - Manufacturi
- Page 211 and 212: Teollisuus - Industri - Manufacturi
- Page 213 and 214: Teollisuus - Industri - Manufacturi
- Page 215 and 216: Teollisuus - Industri - Manufacturi
- Page 217 and 218: Teollisuus - Industri - Manufacturi
- Page 219 and 220: Teollisuus - Industri - Manufacturi
- Page 221 and 222: Energia - Energi - Energy 179. Prim
- Page 223 and 224: Energia - Energi - Energy 180. Ener
- Page 225 and 226: Energia - Energi - Energy 184. Säh
- Page 227 and 228: Energia - Energi - Energy 188. Teol
- Page 229 and 230: Energia - Energi - Energy 190. Asui
- Page 231 and 232: Rakentaminen - Byggande - Construct
- Page 233 and 234: Rakentaminen - Byggande - Construct
- Page 235 and 236: Asuminen - Boende - Housing 199. Ra
- Page 237 and 238: Asuminen - Boende - Housing 202. As
- Page 239 and 240: Asuminen - Boende - Housing 205. As
- Page 241 and 242: Asuminen - Boende - Housing 210. As
- Page 243 and 244: Asuminen - Boende - Housing 215. Ki
- Page 245 and 246: Asuminen - Boende - Housing 218. As
- Page 247 and 248: Asuminen - Boende - Housing 220. Va
- Page 249: Kauppa - Handel - Trade 223. Kaupan
- Page 253 and 254: Kauppa - Handel - Trade 224. Tukku-
- Page 255 and 256: Kauppa - Handel - Trade 227. Suurim
- Page 257 and 258: Kauppa - Handel - Trade 230. Tuonti
- Page 259 and 260: Kauppa - Handel - Trade 230. (jatk.
- Page 261 and 262: Kauppa - Handel - Trade 230. (jatk.
- Page 263 and 264: Kauppa - Handel - Trade 233. Tuonti
- Page 265 and 266: Kauppa - Handel - Trade 235. Tuonni
- Page 267 and 268: Kauppa - Handel - Trade 237. Tuonti
- Page 269 and 270: Kauppa - Handel - Trade 237. (jatk.
- Page 271 and 272: Kauppa - Handel - Trade 238. Tuonti
- Page 273 and 274: Rahoitus ja vakuutus - Finansiering
- Page 275 and 276: Rahoitus ja vakuutus - Finansiering
- Page 277 and 278: Rahoitus ja vakuutus - Finansiering
- Page 279 and 280: Rahoitus ja vakuutus - Finansiering
- Page 281 and 282: Rahoitus ja vakuutus - Finansiering
- Page 283 and 284: Rahoitus ja vakuutus - Finansiering
- Page 285 and 286: Rahoitus ja vakuutus - Finansiering
- Page 287 and 288: Rahoitus ja vakuutus - Finansiering
- Page 289 and 290: Rahoitus ja vakuutus - Finansiering
- Page 291 and 292: Liikenne ja matkailu - Transport oc
- Page 293 and 294: Liikenne ja matkailu - Transport oc
- Page 295 and 296: Liikenne ja matkailu - Transport oc
- Page 297 and 298: Liikenne ja matkailu - Transport oc
- Page 299 and 300: Liikenne ja matkailu - Transport oc
- Page 301 and 302:
Liikenne ja matkailu - Transport oc
- Page 303 and 304:
Liikenne ja matkailu - Transport oc
- Page 305 and 306:
Liikenne ja matkailu - Transport oc
- Page 307 and 308:
Liikenne ja matkailu - Transport oc
- Page 309 and 310:
Liikenne ja matkailu - Transport oc
- Page 311 and 312:
Liikenne ja matkailu - Transport oc
- Page 313 and 314:
Liikenne ja matkailu - Transport oc
- Page 315 and 316:
Kansantalous - Nationalräkenskaper
- Page 317 and 318:
Kansantalous - Nationalräkenskaper
- Page 319 and 320:
Kansantalous - Nationalräkenskaper
- Page 321 and 322:
Kansantalous - Nationalräkenskaper
- Page 323 and 324:
Kansantalous - Nationalräkenskaper
- Page 325 and 326:
Kansantalous - Nationalräkenskaper
- Page 327 and 328:
Kansantalous - Nationalräkenskaper
- Page 329 and 330:
Kansantalous - Nationalräkenskaper
- Page 331 and 332:
Kansantalous - Nationalräkenskaper
- Page 333 and 334:
Kansantalous - Nationalräkenskaper
- Page 335 and 336:
Julkinen talous - Offentlig ekonomi
- Page 337 and 338:
Julkinen talous - Offentlig ekonomi
- Page 339 and 340:
Julkinen talous - Offentlig ekonomi
- Page 341 and 342:
Julkinen talous - Offentlig ekonomi
- Page 343 and 344:
Julkinen talous - Offentlig ekonomi
- Page 345 and 346:
Julkinen talous - Offentlig ekonomi
- Page 347 and 348:
Julkinen talous - Offentlig ekonomi
- Page 349 and 350:
Julkinen talous - Offentlig ekonomi
- Page 351 and 352:
Julkinen talous - Offentlig ekonomi
- Page 353 and 354:
Julkinen talous - Offentlig ekonomi
- Page 355 and 356:
Julkinen talous - Offentlig ekonomi
- Page 357 and 358:
Julkinen talous - Offentlig ekonomi
- Page 359 and 360:
Julkinen talous - Offentlig ekonomi
- Page 361 and 362:
Julkinen talous - Offentlig ekonomi
- Page 363 and 364:
Julkinen talous - Offentlig ekonomi
- Page 365 and 366:
Julkinen talous - Offentlig ekonomi
- Page 367 and 368:
Julkinen talous - Offentlig ekonomi
- Page 369 and 370:
Julkinen talous - Offentlig ekonomi
- Page 371 and 372:
Julkinen talous - Offentlig ekonomi
- Page 373 and 374:
Julkinen talous - Offentlig ekonomi
- Page 375 and 376:
Julkinen talous - Offentlig ekonomi
- Page 377 and 378:
Työkokemus - Arbetserfarenhet Oppi
- Page 379 and 380:
Koulutus - Utbildning - Education 3
- Page 381 and 382:
Koulutus - Utbildning - Education 3
- Page 383 and 384:
Koulutus - Utbildning - Education 3
- Page 385 and 386:
Koulutus - Utbildning - Education 3
- Page 387 and 388:
Koulutus - Utbildning - Education 3
- Page 389 and 390:
Koulutus - Utbildning - Education 3
- Page 391 and 392:
Koulutus - Utbildning - Education 3
- Page 393 and 394:
Koulutus - Utbildning - Education 3
- Page 395 and 396:
Koulutus - Utbildning - Education 3
- Page 397 and 398:
Tiede, teknologia ja tietoyhteiskun
- Page 399 and 400:
Tiede, teknologia ja tietoyhteiskun
- Page 401 and 402:
Tiede, teknologia ja tietoyhteiskun
- Page 403 and 404:
Tiede, teknologia ja tietoyhteiskun
- Page 405 and 406:
Tiede, teknologia ja tietoyhteiskun
- Page 407 and 408:
Työmarkkinat - Arbetsmarknaden - L
- Page 409 and 410:
Työmarkkinat - Arbetsmarknaden - L
- Page 411 and 412:
Työmarkkinat - Arbetsmarknaden - L
- Page 413 and 414:
Työmarkkinat - Arbetsmarknaden - L
- Page 415 and 416:
Työmarkkinat - Arbetsmarknaden - L
- Page 417 and 418:
Työmarkkinat - Arbetsmarknaden - L
- Page 419 and 420:
Työmarkkinat - Arbetsmarknaden - L
- Page 421 and 422:
Työmarkkinat - Arbetsmarknaden - L
- Page 423 and 424:
Työmarkkinat - Arbetsmarknaden - L
- Page 425 and 426:
Työmarkkinat - Arbetsmarknaden - L
- Page 427 and 428:
Työmarkkinat - Arbetsmarknaden - L
- Page 429 and 430:
Palkat ja työvoimakustannukset - L
- Page 431 and 432:
Palkat ja työvoimakustannukset - L
- Page 433 and 434:
Palkat ja työvoimakustannukset - L
- Page 435 and 436:
Palkat ja työvoimakustannukset - L
- Page 437 and 438:
Palkat ja työvoimakustannukset - L
- Page 439 and 440:
Palkat ja työvoimakustannukset - L
- Page 441 and 442:
Palkat ja työvoimakustannukset - L
- Page 443 and 444:
Tulot ja kulutus - Inkomst och kons
- Page 445 and 446:
Tulot ja kulutus - Inkomst och kons
- Page 447 and 448:
Tulot ja kulutus - Inkomst och kons
- Page 449 and 450:
Tulot ja kulutus - Inkomst och kons
- Page 451 and 452:
Tulot ja kulutus - Inkomst och kons
- Page 453 and 454:
Tulot ja kulutus - Inkomst och kons
- Page 455 and 456:
Tulot ja kulutus - Inkomst och kons
- Page 457 and 458:
Tulot ja kulutus - Inkomst och kons
- Page 459 and 460:
Tulot ja kulutus - Inkomst och kons
- Page 461 and 462:
Tulot ja kulutus - Inkomst och kons
- Page 463 and 464:
Hinnat ja kustannukset - Priser och
- Page 465 and 466:
Hinnat ja kustannukset - Priser och
- Page 467 and 468:
Hinnat ja kustannukset - Priser och
- Page 469 and 470:
Hinnat ja kustannukset - Priser och
- Page 471 and 472:
Hinnat ja kustannukset - Priser och
- Page 473 and 474:
Hinnat ja kustannukset - Priser och
- Page 475 and 476:
Hinnat ja kustannukset - Priser och
- Page 477 and 478:
Hinnat ja kustannukset - Priser och
- Page 479 and 480:
Hinnat ja kustannukset - Priser och
- Page 481 and 482:
Hinnat ja kustannukset - Priser och
- Page 483 and 484:
Hinnat ja kustannukset - Priser och
- Page 485 and 486:
Sosiaaliturva - Socialskydd - Socia
- Page 487 and 488:
Sosiaaliturva - Socialskydd - Socia
- Page 489 and 490:
Sosiaaliturva - Socialskydd - Socia
- Page 491 and 492:
Sosiaaliturva - Socialskydd - Socia
- Page 493 and 494:
Sosiaaliturva - Socialskydd - Socia
- Page 495 and 496:
Sosiaaliturva - Socialskydd - Socia
- Page 497 and 498:
Sosiaaliturva - Socialskydd - Socia
- Page 499 and 500:
Sosiaaliturva - Socialskydd - Socia
- Page 501 and 502:
Sosiaaliturva - Socialskydd - Socia
- Page 503 and 504:
Sosiaaliturva - Socialskydd - Socia
- Page 505 and 506:
Terveys - Hälsa - Health 527. Olue
- Page 507 and 508:
Terveys - Hälsa - Health 530. Tupa
- Page 509 and 510:
Terveys - Hälsa - Health 534. Vapa
- Page 511 and 512:
Terveys - Hälsa - Health 537. Uude
- Page 513 and 514:
Terveys - Hälsa - Health 539. Amma
- Page 515 and 516:
Terveys - Hälsa - Health 543. Työ
- Page 517 and 518:
Terveys - Hälsa - Health 547. Hamm
- Page 519 and 520:
Terveys - Hälsa - Health 551. Ylei
- Page 521 and 522:
Terveys - Hälsa - Health 552. Lail
- Page 523 and 524:
Terveys - Hälsa - Health 555. Terv
- Page 525 and 526:
Terveys - Hälsa - Health 557. Erit
- Page 527 and 528:
Terveys - Hälsa - Health 560. Kuol
- Page 529 and 530:
Terveys - Hälsa - Health 561. Itse
- Page 531 and 532:
Kulttuuri ja viestintä - Kultur oc
- Page 533 and 534:
Kulttuuri ja viestintä - Kultur oc
- Page 535 and 536:
Kulttuuri ja viestintä - Kultur oc
- Page 537 and 538:
Kulttuuri ja viestintä - Kultur oc
- Page 539 and 540:
Kulttuuri ja viestintä - Kultur oc
- Page 541 and 542:
Kulttuuri ja viestintä - Kultur oc
- Page 543 and 544:
Kulttuuri ja viestintä - Kultur oc
- Page 545 and 546:
Kulttuuri ja viestintä - Kultur oc
- Page 547 and 548:
Kulttuuri ja viestintä - Kultur oc
- Page 549 and 550:
Oikeus - Rättsväsende - Justice 5
- Page 551 and 552:
Oikeus - Rättsväsende - Justice 5
- Page 553 and 554:
Oikeus - Rättsväsende - Justice 5
- Page 555 and 556:
Oikeus - Rättsväsende - Justice 5
- Page 557 and 558:
Oikeus - Rättsväsende - Justice 5
- Page 559 and 560:
Oikeus - Rättsväsende - Justice 5
- Page 561 and 562:
Oikeus - Rättsväsende - Justice 5
- Page 563 and 564:
Oikeus - Rättsväsende - Justice 6
- Page 565 and 566:
Oikeus - Rättsväsende - Justice 6
- Page 567 and 568:
Oikeus - Rättsväsende - Justice 6
- Page 569 and 570:
Oikeus - Rättsväsende - Justice 6
- Page 571 and 572:
Oikeus - Rättsväsende - Justice 6
- Page 573 and 574:
Vaalit ja yhteiskunnallinen päät
- Page 575 and 576:
Vaalit ja yhteiskunnallinen päät
- Page 577 and 578:
Vaalit ja yhteiskunnallinen päät
- Page 579 and 580:
Vaalit ja yhteiskunnallinen päät
- Page 581 and 582:
Vaalit ja yhteiskunnallinen päät
- Page 583 and 584:
Vaalit ja yhteiskunnallinen päät
- Page 585 and 586:
Ahvenanmaan maakunta - Landskapet
- Page 587 and 588:
Ahvenanmaan maakunta - Landskapet
- Page 589 and 590:
Ahvenanmaan maakunta - Landskapet
- Page 591 and 592:
Ahvenanmaan maakunta - Landskapet
- Page 593 and 594:
Ahvenanmaan maakunta - Landskapet
- Page 595 and 596:
Ulkomaat - Utlandet 648. (jatk. - f
- Page 597 and 598:
Ulkomaat - Utlandet 649. (jatk. - f
- Page 599 and 600:
Ulkomaat - Utlandet 649. (jatk. - f
- Page 601 and 602:
Ulkomaat - Utlandet 649. (jatk. - f
- Page 603 and 604:
Ulkomaat - Utlandet 650. EU-maiden
- Page 605 and 606:
Ulkomaat - Utlandet 650. (jatk. - f
- Page 607 and 608:
Ulkomaat - Utlandet 652. Suurimpien
- Page 609 and 610:
Ulkomaat - Utlandet 652. (jatk. - f
- Page 611 and 612:
Ulkomaat - Utlandet 652. (jatk. - f
- Page 613 and 614:
Ulkomaat - Utlandet 652. (jatk. - f
- Page 615 and 616:
Ulkomaat - Utlandet 652. (jatk. - f
- Page 617 and 618:
Ulkomaat - Utlandet 656. Eri uskont
- Page 619 and 620:
Ulkomaat - Utlandet 658. Väestö s
- Page 621 and 622:
Ulkomaat - Utlandet 660. Elävänä
- Page 623 and 624:
Ulkomaat - Utlandet 662. Pinta-alan
- Page 625 and 626:
Ulkomaat - Utlandet 662. (jatk.- fo
- Page 627 and 628:
Ulkomaat - Utlandet 664. Paperi, sa
- Page 629 and 630:
Ulkomaat - Utlandet 666. Energialä
- Page 631 and 632:
Ulkomaat - Utlandet 670. Sähkövoi
- Page 633 and 634:
Ulkomaat - Utlandet 672. Kasvihuone
- Page 635 and 636:
Ulkomaat - Utlandet 674. Yhdyskunta
- Page 637 and 638:
Ulkomaat - Utlandet 675. (jatk. - f
- Page 639 and 640:
Ulkomaat - Utlandet 675. (jatk. - f
- Page 641 and 642:
Ulkomaat - Utlandet 676. (jatk. - f
- Page 643 and 644:
Ulkomaat - Utlandet 677. (jatk. - f
- Page 645 and 646:
Ulkomaat - Utlandet 677. (jatk. - f
- Page 647 and 648:
Ulkomaat - Utlandet 679. Rautatiet,
- Page 649 and 650:
Ulkomaat - Utlandet 681. Tieliikenn
- Page 651 and 652:
Ulkomaat - Utlandet 683. Tietoliike
- Page 653 and 654:
Ulkomaat - Utlandet 685. Markkinahi
- Page 655 and 656:
Ulkomaat - Utlandet 686. Bruttokans
- Page 657 and 658:
Ulkomaat - Utlandet 688. Veroaste 1
- Page 659 and 660:
Ulkomaat - Utlandet 690. Asevoimat
- Page 661 and 662:
Ulkomaat - Utlandet 692. Työttöm
- Page 663 and 664:
Ulkomaat - Utlandet 695. Terveydenh
- Page 665 and 666:
Ulkomaat - Utlandet 697. Koulutus,
- Page 667 and 668:
Ulkomaat - Utlandet 699. Sanomalehd
- Page 669 and 670:
Mittayksikköjä - Måttenheter - U
- Page 671 and 672:
Mittayksikköjä - Måttenheter - U
- Page 673 and 674:
Tilastontuottajia - Statistikproduc
- Page 675 and 676:
Aakkosellinen hakemisto - toimialoi
- Page 677 and 678:
Aakkosellinen hakemisto - kotitalou
- Page 679 and 680:
Aakkosellinen hakemisto R Raaka-ain
- Page 681 and 682:
Aakkosellinen hakemisto Työpaikat
- Page 683 and 684:
Alfabetiskt register Sidnumren efte
- Page 685 and 686:
Alfabetiskt register - efter landsg
- Page 687 and 688:
Alfabetiskt register Inrikes omflyt
- Page 689 and 690:
Alfabetiskt register - medelpension
- Page 691 and 692:
Alfabetiskt register - arbetstimmar
- Page 693 and 694:
Index - violence 525-527, 549-551,
- Page 695 and 696:
Index - wages and salaries 186, 188
- Page 697 and 698:
Index Longitudes 53 Lutheran Nation
- Page 699 and 700:
Index Self-sufficiency in foodstuff
- Page 701:
Vuosikirjan tilastot piirtävät ta