A conceptual model of the aquifer in Tiquipaya, Bolivia - KTH
A conceptual model of the aquifer in Tiquipaya, Bolivia - KTH
A conceptual model of the aquifer in Tiquipaya, Bolivia - KTH

Create successful ePaper yourself
Turn your PDF publications into a flip-book with our unique Google optimized e-Paper software.
2005-216<br />
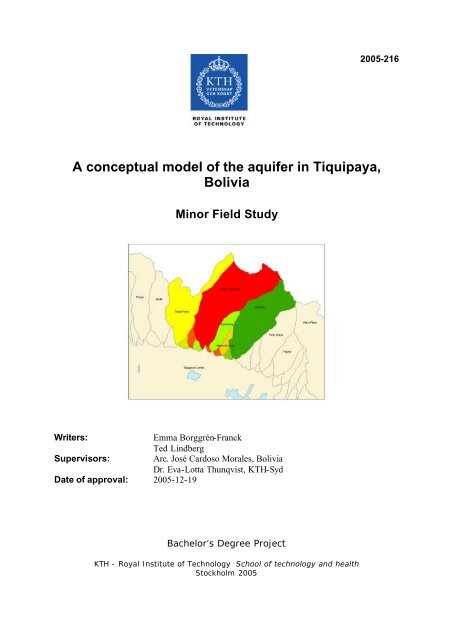
A <strong>conceptual</strong> <strong>model</strong> <strong>of</strong> <strong>the</strong> <strong>aquifer</strong> <strong>in</strong> <strong>Tiquipaya</strong>,<br />
<strong>Bolivia</strong><br />
M<strong>in</strong>or Field Study<br />
Writers: Emma Borggrén-Franck<br />
Ted L<strong>in</strong>dberg<br />
Supervisors: Arc. José Cardoso Morales, <strong>Bolivia</strong><br />
Dr. Eva-Lotta Thunqvist, <strong>KTH</strong>-Syd<br />
Date <strong>of</strong> approval: 2005-12-19<br />
Bachelor’s Degree Project<br />
<strong>KTH</strong> - Royal Institute <strong>of</strong> Technology School <strong>of</strong> technology and health<br />
Stockholm 2005
This study has been carried out with<strong>in</strong> <strong>the</strong> framework <strong>of</strong> <strong>the</strong> M<strong>in</strong>or Field Studies<br />
Scholarship Programme, MFS, which is funded by <strong>the</strong> Swedish International Development<br />
Cooperation Agency, Sida /Asdi.<br />
The MFS Scholarship Programme <strong>of</strong>fers Swedish university students an opportunity to carry<br />
out two months’ field work, usually <strong>the</strong> student’s f<strong>in</strong>al degree project, <strong>in</strong> a Third World<br />
country. The results <strong>of</strong> <strong>the</strong> work are presented <strong>in</strong> an MFS report which is also <strong>the</strong> student’s<br />
Master <strong>of</strong> Science Thesis. M<strong>in</strong>or Field Studies are primarily conducted with<strong>in</strong> subject areas <strong>of</strong><br />
importance from a development perspective and <strong>in</strong> a country where Swedish <strong>in</strong>ternational<br />
cooperation is ongo<strong>in</strong>g.<br />
The ma<strong>in</strong> purpose <strong>of</strong> <strong>the</strong> MFS Programme is to enhance Swedish university students’<br />
knowledge and understand<strong>in</strong>g <strong>of</strong> <strong>the</strong>se countries and <strong>the</strong>ir problems and opportunities. MFS<br />
should provide <strong>the</strong> student with <strong>in</strong>itial experience <strong>of</strong> conditions <strong>in</strong> such a country. Overall<br />
goals are to widen <strong>the</strong> Swedish human resources cadre for engagement <strong>in</strong> <strong>in</strong>ternational<br />
development cooperation and to promote scientific exchange between univeristies, research<br />
<strong>in</strong>stitutes and similar authorities <strong>in</strong> devop<strong>in</strong>g countries and <strong>in</strong> Sweden.<br />
The International Office at <strong>the</strong> Royal Institute <strong>of</strong> Technology, <strong>KTH</strong>, Stockholm,<br />
adm<strong>in</strong>isters <strong>the</strong> MFS Programme for <strong>the</strong> faculties <strong>of</strong> eng<strong>in</strong>eer<strong>in</strong>g and natural sciences <strong>in</strong><br />
Sweden.<br />
Sigrun Santesson<br />
Programme Officer<br />
MFS Programme<br />
International Office, MFS<br />
<strong>KTH</strong> L<strong>in</strong>dstedtsvägen 5, SE-100 44 Stockholm. Phone: +46 8 790 7183. Fax: +46 8 790 8192. E-mail: sigrun@kth.se<br />
www.kth.se/student/utlandsstudier/examensarbete/mfs<br />
Bachelor’s Degree Project - A <strong>conceptual</strong> <strong>model</strong> <strong>of</strong> <strong>the</strong> <strong>aquifer</strong> <strong>in</strong> <strong>Tiquipaya</strong>, <strong>Bolivia</strong> 2(52)<br />
<strong>KTH</strong> - Royal Institute <strong>of</strong> Technology - Stockholm 2005
Summary<br />
The area <strong>of</strong> study <strong>in</strong> this project is <strong>in</strong> <strong>Bolivia</strong>, South America. The specific area is <strong>the</strong><br />
Municipality <strong>of</strong> <strong>Tiquipaya</strong>, situated <strong>in</strong> Cochabamba valley. Cochabamba valley consists <strong>of</strong> a<br />
gently slop<strong>in</strong>g pla<strong>in</strong> bounded by steep slopes <strong>of</strong> <strong>the</strong> Cordillera. The vegetation <strong>in</strong> <strong>the</strong><br />
Cordillera is mostly high steppe and high mounta<strong>in</strong> prairie. The average annual precipitation<br />
is 600-1000 mm/ year. When it ra<strong>in</strong>s <strong>in</strong> <strong>the</strong> mounta<strong>in</strong> range <strong>the</strong> rivers flow down to <strong>the</strong> valley<br />
with high velocity and cause great problems with erosion.<br />
In <strong>the</strong> valley <strong>the</strong> average annual precipitation is 500 mm/year and <strong>the</strong> land use is mostly<br />
agricultural. Because <strong>of</strong> <strong>the</strong> <strong>in</strong>tense agriculture and <strong>the</strong> rapid population growth, Cochabamba<br />
Central Valley suffers a constant shortage <strong>of</strong> water. Different irrigation systems and<br />
groundwater from <strong>the</strong> <strong>aquifer</strong> supplies <strong>Tiquipaya</strong> with water.<br />
The <strong>aquifer</strong> <strong>in</strong> <strong>Tiquipaya</strong> is one out <strong>of</strong> three thick sedimentary bodies <strong>in</strong> <strong>the</strong> Central Valley.<br />
The <strong>aquifer</strong> is an alluvial fan delta and <strong>the</strong> thickness is approximately 500 m. It is recharged<br />
through <strong>in</strong>filtration from <strong>the</strong> mounta<strong>in</strong> rivers, precipitation on <strong>the</strong> valley area and by<br />
irrigation.<br />
The discharge from <strong>the</strong> <strong>aquifer</strong> consists <strong>of</strong> wells and spr<strong>in</strong>gs. There are 37 flow<strong>in</strong>g spr<strong>in</strong>gs <strong>in</strong><br />
<strong>Tiquipaya</strong> and <strong>the</strong>y have been <strong>in</strong> use for hundreds <strong>of</strong> years. Dur<strong>in</strong>g <strong>the</strong> last 10 years <strong>the</strong><br />
habitants have noticed a decreas<strong>in</strong>g amount <strong>of</strong> flow <strong>in</strong> <strong>the</strong> spr<strong>in</strong>gs. This <strong>in</strong>dicates that <strong>the</strong><br />
groundwater level is s<strong>in</strong>k<strong>in</strong>g. In order to f<strong>in</strong>d out whe<strong>the</strong>r or not <strong>the</strong> <strong>aquifer</strong> reserve is<br />
decreas<strong>in</strong>g a water balance is calculated. To estimate <strong>the</strong> recharge to <strong>the</strong> <strong>aquifer</strong> we had<br />
access to precipitation data, but we had to estimate <strong>the</strong> evapotranspiration and <strong>the</strong> percentage<br />
which <strong>in</strong>filtrates. Concern<strong>in</strong>g <strong>the</strong> discharge we had access to specific spr<strong>in</strong>g data over two<br />
areas and a list <strong>of</strong> registered wells. We know that <strong>the</strong>re are more wells <strong>the</strong>n <strong>the</strong> ones<br />
registered, but we did not know how many and what flow rate <strong>the</strong>y have. Based on <strong>the</strong><br />
exist<strong>in</strong>g data and our assumptions we have estimated a possible discharge for <strong>the</strong> <strong>Tiquipaya</strong><br />
area. To get a truthful picture <strong>of</strong> <strong>the</strong> reality, we have made three water balances based on<br />
different data and variations. The one we f<strong>in</strong>d most likely show that <strong>the</strong> <strong>aquifer</strong> is decreas<strong>in</strong>g.<br />
The <strong>aquifer</strong> is under a lot <strong>of</strong> environmental threats. The town <strong>of</strong> <strong>Tiquipaya</strong> is situated on <strong>the</strong><br />
<strong>aquifer</strong> and <strong>the</strong> town’s residual water is used as irrigation water without any treatment. Also<br />
<strong>the</strong> river beds, which are very permeable recharge zones, are be<strong>in</strong>g used as garbage heaps.<br />
Concern<strong>in</strong>g <strong>the</strong> <strong>aquifer</strong> <strong>the</strong> most impend<strong>in</strong>g problems are <strong>the</strong> use <strong>of</strong> residual water and <strong>the</strong><br />
garbage handl<strong>in</strong>g. To obta<strong>in</strong> a susta<strong>in</strong>able development <strong>the</strong> habitants' residual water and<br />
garbage have to be taken care <strong>of</strong>.<br />
As a conclusion we do not th<strong>in</strong>k that <strong>the</strong> actual situation <strong>in</strong> <strong>Tiquipaya</strong> is susta<strong>in</strong>able. The<br />
groundwater reserve is decreas<strong>in</strong>g and can not supply enough water for <strong>the</strong> municipality.<br />
If <strong>the</strong> agriculture stays as <strong>in</strong>tensive as it is today <strong>the</strong> municipality needs to supplement with<br />
water from watersheds outside <strong>of</strong> <strong>the</strong> Cochabamba Valley. This would also give <strong>the</strong> <strong>aquifer</strong> a<br />
chance to restore its reserve. The completion <strong>of</strong> <strong>the</strong> Misicuni project will hopefully provide<br />
<strong>Tiquipaya</strong> with <strong>the</strong> water supplement needed.<br />
In order to determ<strong>in</strong>e <strong>the</strong> exact extension and capacity <strong>of</strong> <strong>the</strong> <strong>aquifer</strong> more reliable data is<br />
needed. We recommend geophysical tests, drill<strong>in</strong>g and field <strong>in</strong>vestigations to obta<strong>in</strong> this data.<br />
Bachelor’s Degree Project - A <strong>conceptual</strong> <strong>model</strong> <strong>of</strong> <strong>the</strong> <strong>aquifer</strong> <strong>in</strong> <strong>Tiquipaya</strong>, <strong>Bolivia</strong> 3(52)<br />
<strong>KTH</strong> - Royal Institute <strong>of</strong> Technology - Stockholm 2005
Resumen<br />
El área de estudio de este proyecto es la municipalidad de <strong>Tiquipaya</strong>, situado en el valle<br />
central de Cochabamba, <strong>Bolivia</strong>. El valle central de Cochabamba consta de una llanura<br />
suavemente <strong>in</strong>cl<strong>in</strong>ada, limitada por las emp<strong>in</strong>adas montañas de la Cordillera. La vegetación en<br />
la Cordillera es pr<strong>in</strong>cipalmente estepa alta y pradera de montaña alta. La precipitación media<br />
anual es 600-1000 milímetros / año. Cuando llueve en la Cordillera los ríos fluyen al valle con<br />
una velocidad muy alta, causando grandes problemas con la erosión.<br />
En el valle la precipitación media anual es 500 milímetros / año y el uso de suelo es<br />
pr<strong>in</strong>cipalmente agrícola. Debido a la agricultura <strong>in</strong>tensa y el rápido crecimiento de población,<br />
el valle central de Cochabamba se ve constantemente afectado por una escasez de agua.<br />
Diferentes sistemas de irrigación y agua subterránea del acuífero <strong>in</strong>tentan proporcionar<br />
<strong>Tiquipaya</strong> con el agua.<br />
El acuífero en <strong>Tiquipaya</strong> es uno de tres cuerpos sedimentarios gruesos en el valle central. El<br />
acuífero es formada por depósitos aluviales que forman conos y abanicos con un espesor de<br />
500 m. El acuífero es recargado a través de <strong>in</strong>filtración de los ríos de montaña, de la<br />
precipitación sobre el valle y por la irrigación.<br />
La descaraga del acuífero consta de pozos y vertientes. Hay 37 vertientes fluyendo en<br />
<strong>Tiquipaya</strong> y han sido usados durante cientos de años. Durante los últimnos 10 años los<br />
habitantes han notado una dism<strong>in</strong>uación en el flujo de los vertientes. Esto <strong>in</strong>dica que el nivel<br />
estático de agua está hundiendo. Para entender si la reserva de acuífero está dism<strong>in</strong>uyendo o<br />
no, un balance hídrico es calculado. Para calcular la recarga del acuífero teníamos acceso à los<br />
datos de precipitación, pero tuvimos que calcular el evapotranspiración y los porcentajes que<br />
se <strong>in</strong>filtra. Al calcular la descarga teníamos acceso a datos específicos de los vertientes en dos<br />
áreas y una lista de pozos registrados. Sabemos que hay más pozos que los en la lista, pero no<br />
sabemos cuántos y qué flujo tienen. Basado en los datos existentes y nuestras suposiciones<br />
hemos calculado una descarga posible para la área de <strong>Tiquipaya</strong>. Para conseguir un <strong>model</strong>o<br />
s<strong>in</strong>cero de la realidad, hemos hecho tres balances de agua basados en diferentes datos y<br />
variaciónes. El balance que muestra que el acuífero está dism<strong>in</strong>uyendo es el más probable.<br />
Para el acuífero hay muchas amenazas ambientales. El pueblo de <strong>Tiquipaya</strong> está situado sobre<br />
el acuífero y el agua residual del pueblo es usada en la irrigación s<strong>in</strong> cualquier trato. También<br />
las zonas de recarga son muy sensatas y se estan usando los lechos del río como basurales.<br />
Con respecto al acuífero de agua subterránea los problemas más <strong>in</strong>m<strong>in</strong>entes son el uso del<br />
agua residual y el manejo de basura. Para obtener un desarrollo sostenible, los problemas de<br />
aguas residuales y basura tienen que ser solucionados.<br />
Como conclusión no pensamos que la situación actual en <strong>Tiquipaya</strong> sea sostenible. La reserva<br />
de agua subterránea está dism<strong>in</strong>uyendo y no puede proporcionar suficiente agua para la<br />
municipalidad.<br />
Si la agricultura se queda tan <strong>in</strong>tensiva como es hoy la municipalidad tiene que complementar<br />
con agua de aréas fuera del valle de Cochabamba. Esto también daría una oportunidad a la<br />
reserva del acuífero de restituirse. La term<strong>in</strong>ación del proyecto de Misicuni posiblemente<br />
sum<strong>in</strong>istrará <strong>Tiquipaya</strong> con el suplemento de agua necesitado.<br />
Para determ<strong>in</strong>ar la extensión exacta y la capacidad del acuífero datos más confiables son<br />
necesitados. Recomendamos pruebas ge<strong>of</strong>ísicas, pruebas de bombeo y <strong>in</strong>vestigaciones de<br />
campo para obtener estos datos.<br />
Bachelor’s Degree Project - A <strong>conceptual</strong> <strong>model</strong> <strong>of</strong> <strong>the</strong> <strong>aquifer</strong> <strong>in</strong> <strong>Tiquipaya</strong>, <strong>Bolivia</strong> 4(52)<br />
<strong>KTH</strong> - Royal Institute <strong>of</strong> Technology - Stockholm 2005
Summary............................................................................................................................... 3<br />
Resumen................................................................................................................................ 4<br />
Index <strong>of</strong> figures..................................................................................................................... 6<br />
Acknowledgement ................................................................................................................ 7<br />
Introduction.......................................................................................................................... 8<br />
Background ...................................................................................................................... 10<br />
Background on <strong>the</strong> municipality <strong>of</strong> <strong>Tiquipaya</strong>................................................................. 12<br />
Objectives......................................................................................................................... 13<br />
Limitations ....................................................................................................................... 14<br />
Sources <strong>of</strong> <strong>in</strong>formation..................................................................................................... 15<br />
Methodology <strong>of</strong> work....................................................................................................... 15<br />
Quantity............................................................................................................................... 16<br />
Groundwater recharge...................................................................................................... 16<br />
Description <strong>of</strong> <strong>the</strong> mounta<strong>in</strong> area ................................................................................. 16<br />
The recharge zone <strong>in</strong> <strong>the</strong> valley.................................................................................... 18<br />
Def<strong>in</strong>ition <strong>of</strong> <strong>the</strong> watersheds ........................................................................................ 19<br />
Dra<strong>in</strong>age for irrigation and domestic use ..................................................................... 20<br />
Metrological conditions................................................................................................ 21<br />
Evapotranspiration....................................................................................................... 23<br />
Infiltration and river flow............................................................................................. 23<br />
Groundwater discharge .................................................................................................... 25<br />
Description <strong>of</strong> <strong>the</strong> river bas<strong>in</strong> area ............................................................................... 25<br />
Discharge...................................................................................................................... 26<br />
Irrigation....................................................................................................................... 28<br />
Land use ....................................................................................................................... 28<br />
Stratigraphy.................................................................................................................. 28<br />
Water balance............................................................................................................... 30<br />
Conceptual <strong>model</strong>......................................................................................................... 32<br />
Quality ................................................................................................................................. 33<br />
Threats and pollution........................................................................................................ 33<br />
Irrigation with residual water ....................................................................................... 33<br />
The usage <strong>of</strong> fertilizers <strong>in</strong> <strong>the</strong> agriculture..................................................................... 33<br />
The usage <strong>of</strong> detergents................................................................................................ 33<br />
Residual products from chicha production and slaughter houses ................................ 34<br />
The Taquiña brewery................................................................................................... 35<br />
Garbage ........................................................................................................................ 35<br />
Sewage disposal system and latr<strong>in</strong>es............................................................................ 36<br />
Contam<strong>in</strong>ation due to traffic ........................................................................................ 36<br />
Water quality.................................................................................................................... 37<br />
Conclusions on water contam<strong>in</strong>ation........................................................................... 39<br />
Conclusion........................................................................................................................... 40<br />
Recommendations .............................................................................................................. 41<br />
Appendix ............................................................................................................................. 43<br />
Bachelor’s Degree Project - A <strong>conceptual</strong> <strong>model</strong> <strong>of</strong> <strong>the</strong> <strong>aquifer</strong> <strong>in</strong> <strong>Tiquipaya</strong>, <strong>Bolivia</strong> 5(52)<br />
<strong>KTH</strong> - Royal Institute <strong>of</strong> Technology - Stockholm 2005
Index <strong>of</strong> figures<br />
Fig 1: Map <strong>of</strong> Boliva. Departments & Elevations.<br />
(http://www.reliefweb.<strong>in</strong>t/rw/RWB.NSF/db900LargeMaps/SKAR64GEDC?OpenDoc<br />
ument)<br />
Fig 2: Map <strong>of</strong> South America.<br />
(http://aol.countrywatch.comaol_regions.asp/REGION=5)<br />
Fig 3: Satellite image <strong>of</strong> Cochabamba central valley. (Renner, S., Velasco, C., 2000)<br />
Fig 4: <strong>Tiquipaya</strong> district map with <strong>the</strong> districts affect<strong>in</strong>g <strong>the</strong> water balance marked red.<br />
(Negowat, 2005)<br />
Fig 5: <strong>Tiquipaya</strong> municipality border and <strong>the</strong> top <strong>of</strong> <strong>the</strong> mounta<strong>in</strong> range marked as <strong>the</strong><br />
waterdivider between <strong>the</strong> catchment areas. (Borggrén-Franck, L<strong>in</strong>dberg, 2005)<br />
Fig 6: Riverbed and semi-arid vegetation <strong>in</strong> <strong>the</strong> mounta<strong>in</strong>s <strong>of</strong> <strong>the</strong> Khora watershed.<br />
(Borggrén-Franck, L<strong>in</strong>dberg, 2005)<br />
Fig 7: Recharge zones <strong>in</strong> <strong>the</strong> valley and <strong>the</strong> rivers Tolavi, Khora and Taquiña. (Negowat,<br />
2005. Villa Nueva HIDROGEO)<br />
Fig 8: Watersheds affect<strong>in</strong>g <strong>the</strong> municipality <strong>of</strong> <strong>Tiquipaya</strong>. (Borggrén-Franck, L<strong>in</strong>dberg,<br />
2005)<br />
Fig 9: Map <strong>of</strong> communities <strong>in</strong> <strong>Tiquipaya</strong> and <strong>the</strong> rivers Tolavi, Khora and Taquiña.<br />
(Peñarrieta, R., Vega, D., 2004)<br />
Fig 10: Diagram <strong>of</strong> precipitation. (Promic)<br />
Fig 11: Diagram <strong>of</strong> average temperature. (Promic)<br />
Fig 12: Diagram <strong>of</strong> potential evaporation. (Promic)<br />
Fig 13: Satellite image <strong>of</strong> <strong>Tiquipaya</strong>´s valley area, show<strong>in</strong>g <strong>the</strong> municipality border and town<br />
centre (Borggrén-Franck, L<strong>in</strong>dberg, 2005)<br />
Fig 14: Location <strong>of</strong> wells and groundwater flow. (Negowat, 2005. Villa Nueva HIDROGEO)<br />
Fig 15: Map <strong>of</strong> land use <strong>in</strong> <strong>the</strong> valley- and mounta<strong>in</strong> area <strong>of</strong> <strong>Tiquipaya</strong>.<br />
(Borggrén-Franck, L<strong>in</strong>dberg, 2005)<br />
Fig 16: Hydrogeologic section. (Negowat, 2005. Villa Nueva HIDROGEO)<br />
Fig 17: Illustration <strong>of</strong> water balances. (Borggrén-Franck, L<strong>in</strong>dberg, 2005)<br />
Fig 18: Conceptual <strong>model</strong>. (Borggrén-Franck, L<strong>in</strong>dberg, 2005)<br />
Fig 19. Parsley and sp<strong>in</strong>ach irrigated with residual water <strong>in</strong> Bruno Moqho (Ampuero,<br />
Mondaca, 2005).<br />
Fig 20: Man wash<strong>in</strong>g clo<strong>the</strong>s <strong>in</strong> <strong>the</strong> river Khora and sign say<strong>in</strong>g “Forbidden to wash clo<strong>the</strong>s”.<br />
(Borggrén-Franck, L<strong>in</strong>dberg, 2005)<br />
Fig 21: Residual water canal from <strong>the</strong> municipal slaughterhouse and <strong>the</strong> <strong>in</strong>filtration lagoon<br />
(Ampuero, Mondaca, 2005).<br />
Fig 22: The municipality’s garbage dump on <strong>the</strong> riverbed <strong>of</strong> Khora-<strong>Tiquipaya</strong> (Ampuero,<br />
Mondaca, 2005).<br />
Fig 23: View downstream from <strong>the</strong> garbage dump. In <strong>the</strong> background is <strong>the</strong> elevated tank <strong>of</strong><br />
COAPAT, Comity <strong>of</strong> potable water and sewage disposal <strong>in</strong> <strong>Tiquipaya</strong> (Ampuero,<br />
Mondaca, 2005).<br />
Index <strong>of</strong> tables<br />
Table 1: BNP per capita <strong>in</strong> 2002. (http://www.globalis.se, 2005)<br />
Table 2: Areas <strong>of</strong> <strong>the</strong> watersheds <strong>in</strong> <strong>Tiquipaya</strong>. (Borggrén-Franck, L<strong>in</strong>dberg, 2005)<br />
Table 3: Irrigation systems recharg<strong>in</strong>g <strong>the</strong> <strong>aquifer</strong>. (Borggrén-Franck, L<strong>in</strong>dberg, 2005)<br />
Table 4: Average precipitation and river flow. (Borggrén-Franck, L<strong>in</strong>dberg, 2005)<br />
Bachelor’s Degree Project - A <strong>conceptual</strong> <strong>model</strong> <strong>of</strong> <strong>the</strong> <strong>aquifer</strong> <strong>in</strong> <strong>Tiquipaya</strong>, <strong>Bolivia</strong> 6(52)<br />
<strong>KTH</strong> - Royal Institute <strong>of</strong> Technology - Stockholm 2005
Acknowledgement<br />
We are most thankful for <strong>the</strong> help and support we received <strong>in</strong> <strong>Bolivia</strong> and Sweden, especially<br />
we want to thank:<br />
Our supervisors<br />
Dr. Ewa-Lotta Thunqvist, <strong>KTH</strong> Sweden<br />
Architect José Cardoso Morales<br />
The Municipality <strong>of</strong> <strong>Tiquipaya</strong><br />
Dr. Evaristo Peñaloza Alejo<br />
Eng. Juan Ayala<br />
The staff<br />
Promic<br />
Eng. Ivan Vargas<br />
Eng. Oscar Cespedes<br />
Eng. David Morales<br />
The staff<br />
La universidad Mayor de San Simon<br />
Rector Eng. Franz Vargas Loayza<br />
Mag. Economista Teresa Polo Nájera<br />
Laboratorio de Hidraulica<br />
Eng. Edgar Montenegro<br />
Eng. Galo Muñoz<br />
The students and staff<br />
Centro AGUA<br />
Alfredo Durán<br />
Raoul Ampuero<br />
Daniel Vega<br />
The staff<br />
CLAS<br />
Helder Soto<br />
and Hilda Morales<br />
Bachelor’s Degree Project - A <strong>conceptual</strong> <strong>model</strong> <strong>of</strong> <strong>the</strong> <strong>aquifer</strong> <strong>in</strong> <strong>Tiquipaya</strong>, <strong>Bolivia</strong> 7(52)<br />
<strong>KTH</strong> - Royal Institute <strong>of</strong> Technology - Stockholm 2005
Introduction<br />
The area <strong>of</strong> study <strong>in</strong> this project is <strong>in</strong> <strong>Bolivia</strong> (Fig 1), South America. The specific area is <strong>the</strong><br />
Municipality <strong>of</strong> <strong>Tiquipaya</strong>, situated <strong>in</strong> <strong>the</strong> Cochabamba valley. Cochabamba valley is <strong>in</strong> <strong>the</strong><br />
zone <strong>of</strong> <strong>the</strong> valleys <strong>in</strong> <strong>the</strong> oriental mounta<strong>in</strong> range. This zone is on <strong>the</strong> edge <strong>of</strong> <strong>the</strong> Altiplano,<br />
which <strong>in</strong>cludes more than a third <strong>of</strong> <strong>Bolivia</strong>’s territory. The climate <strong>in</strong> <strong>the</strong> zone <strong>of</strong> <strong>the</strong> valleys<br />
is arid to semi-arid, with a high evapotranspiration and moderate ra<strong>in</strong>fall. Cochabamba City is<br />
called <strong>the</strong> town <strong>of</strong> eternal spr<strong>in</strong>g and it is known for its nice climate. The wea<strong>the</strong>r is known to<br />
be sunny and <strong>the</strong> average annual temperature is 17,5°C.<br />
Figure 1. Map <strong>of</strong> Boliva. Departments & Elevations<br />
There is one serious problem caused by <strong>the</strong> climate and <strong>the</strong> rapid population growth, and that<br />
is constant shortage <strong>of</strong> water. S<strong>in</strong>ce <strong>the</strong>re is a shortage <strong>of</strong> water and a lack <strong>of</strong> regional<br />
plann<strong>in</strong>g this has led to largely uncontrolled use <strong>of</strong> <strong>the</strong> groundwater resources. The <strong>aquifer</strong> <strong>in</strong><br />
Bachelor’s Degree Project - A <strong>conceptual</strong> <strong>model</strong> <strong>of</strong> <strong>the</strong> <strong>aquifer</strong> <strong>in</strong> <strong>Tiquipaya</strong>, <strong>Bolivia</strong> 8(52)<br />
<strong>KTH</strong> - Royal Institute <strong>of</strong> Technology - Stockholm 2005
<strong>the</strong> Central Valley is an alluvial fan delta system and <strong>the</strong> capacity <strong>of</strong> <strong>the</strong> reservoir is big,<br />
though not big enough <strong>in</strong> a long-term perspective.<br />
Cochabamba City is <strong>the</strong> third largest <strong>in</strong> population and economic importance, after La Paz<br />
and Santa Cruz. The population <strong>in</strong> <strong>the</strong> prov<strong>in</strong>ce is 1.5 million people, accord<strong>in</strong>g to <strong>the</strong> latest<br />
census <strong>in</strong> 2001 (INE, 2001). 59% <strong>of</strong> <strong>the</strong> population lives <strong>in</strong> urban areas, and 41% <strong>in</strong> rural<br />
areas. The economic activities <strong>in</strong> <strong>the</strong> area are agriculture, commercial development and<br />
<strong>in</strong>dustry.<br />
Bachelor’s Degree Project - A <strong>conceptual</strong> <strong>model</strong> <strong>of</strong> <strong>the</strong> <strong>aquifer</strong> <strong>in</strong> <strong>Tiquipaya</strong>, <strong>Bolivia</strong> 9(52)<br />
<strong>KTH</strong> - Royal Institute <strong>of</strong> Technology - Stockholm 2005
Background<br />
<strong>Bolivia</strong> is <strong>the</strong> poorest and <strong>in</strong> many ways least developed country <strong>in</strong> South America (Fig 2).<br />
S<strong>in</strong>ce it’s <strong>in</strong>dependence <strong>in</strong> 1825 <strong>the</strong>re have been more than 190 revolutions and coups. The<br />
whole twentieth century was overshadowed by military coups, rule <strong>of</strong> dictators and<br />
bankruptcy. This repeated sequence led to an <strong>in</strong>crease <strong>in</strong> foreign <strong>in</strong>fluence, through loans and<br />
<strong>in</strong>terests <strong>in</strong> m<strong>in</strong>es and oil fields. Attempts to raise <strong>Bolivia</strong> from its status as an<br />
underdeveloped country met with little success; <strong>in</strong>stead great personal fortunes were amazed<br />
from t<strong>in</strong> m<strong>in</strong><strong>in</strong>g. <strong>Bolivia</strong> became more corrupted and <strong>the</strong> foreign dept only <strong>in</strong>creased. Despite<br />
<strong>the</strong> importance <strong>of</strong> its m<strong>in</strong>es, its large reserves <strong>of</strong> natural gas and crude oil, <strong>Bolivia</strong> still is <strong>the</strong><br />
poorest nation <strong>in</strong> Lat<strong>in</strong> America, liv<strong>in</strong>g by a subsistence economy (Table 1). One <strong>of</strong> <strong>the</strong><br />
organizations support<strong>in</strong>g <strong>Bolivia</strong> is <strong>the</strong> Swedish Agency for International Development (Sida/<br />
Asdi).<br />
Figure 2. Map <strong>of</strong> South America<br />
Tabel 1. BNP per capita <strong>in</strong> 2002<br />
BNP per capita <strong>in</strong> 2002 <strong>in</strong> $ ppp<br />
(purchas<strong>in</strong>g power parities)<br />
accord<strong>in</strong>g to Globalis.se<br />
<strong>Bolivia</strong> 2460 $ ppp<br />
Paraguay 4610 $ ppp<br />
Peru 5010 $ ppp<br />
Brasil 7770 $ ppp<br />
Sweden 26050 $ ppp<br />
A large part <strong>of</strong> <strong>Bolivia</strong>’s population makes it’s liv<strong>in</strong>g <strong>of</strong> <strong>the</strong> illegal grow<strong>in</strong>g <strong>of</strong> Coca, <strong>the</strong><br />
source <strong>of</strong> coca<strong>in</strong>e; A government eradication begun <strong>in</strong> <strong>the</strong> late 1990’s has depressed <strong>the</strong><br />
economy <strong>in</strong> those areas were coca-grow<strong>in</strong>g was important. For farmers <strong>the</strong> future is very<br />
uncerta<strong>in</strong> and unsafe, this has led to a grow<strong>in</strong>g support for <strong>the</strong> farmers’ party, Movimiento Al<br />
Socialismo. MAS party is grow<strong>in</strong>g fast and may w<strong>in</strong> <strong>the</strong> national elections <strong>in</strong> 2007. MAS<br />
party won <strong>the</strong> last municipal elections <strong>in</strong> <strong>Tiquipaya</strong> and is govern<strong>in</strong>g <strong>the</strong> area.<br />
In Cochabamba groundwater from <strong>the</strong> <strong>aquifer</strong> comb<strong>in</strong>ed with surface water from lakes<br />
supplies <strong>the</strong> city with water until <strong>the</strong> Misicuni project is put <strong>in</strong> operation. The Misicuni project<br />
was developed <strong>in</strong> <strong>the</strong> 1950s and is a large-dam construction to br<strong>in</strong>g water from <strong>the</strong> Tunari<br />
mounta<strong>in</strong> range, where <strong>the</strong> ra<strong>in</strong>falls are considerably higher. Cochabamba City has dreamt <strong>of</strong><br />
<strong>the</strong> Misicuni project for a long time, and any threat to <strong>the</strong> project has challenged <strong>the</strong> hope that<br />
<strong>the</strong> water problems will be resolved (Laurie, Marv<strong>in</strong>, 1998). S<strong>in</strong>ce <strong>the</strong> water revolution took<br />
Bachelor’s Degree Project - A <strong>conceptual</strong> <strong>model</strong> <strong>of</strong> <strong>the</strong> <strong>aquifer</strong> <strong>in</strong> <strong>Tiquipaya</strong>, <strong>Bolivia</strong> 10(52)<br />
<strong>KTH</strong> - Royal Institute <strong>of</strong> Technology - Stockholm 2005
place <strong>in</strong> Cochabamba <strong>in</strong> <strong>the</strong> year 2000, it has become even more important for <strong>the</strong> people to<br />
achieve <strong>the</strong> Misicuni dream. In 2000, due to <strong>in</strong>creas<strong>in</strong>g privatization <strong>in</strong> <strong>Bolivia</strong>, <strong>the</strong><br />
government sold <strong>the</strong> water <strong>in</strong>dustry <strong>in</strong> Cochabamba to a foreign company. They took over <strong>the</strong><br />
whole water network and raised <strong>the</strong> charges for water. This resulted <strong>in</strong> demonstrations that<br />
f<strong>in</strong>ally led to <strong>the</strong> pass<strong>in</strong>g <strong>of</strong> a new national water law that gave legal recognition to <strong>the</strong> users<br />
and Cochabamba’s water was returned to <strong>the</strong> public utility SEMAPA. They are construct<strong>in</strong>g<br />
<strong>the</strong> Misicuni dam and tunnel right now, and <strong>the</strong> planned completion is <strong>in</strong> with<strong>in</strong> a couple <strong>of</strong><br />
years.<br />
A big part <strong>of</strong> <strong>the</strong> population <strong>in</strong> Cochabamba valley is <strong>in</strong>digenous and <strong>the</strong>ir mo<strong>the</strong>r tongue is<br />
Quechua. Spanish is <strong>the</strong> <strong>of</strong>ficial language and <strong>in</strong> urban areas it is <strong>the</strong> most frequently used<br />
language. In rural areas Quechua is <strong>of</strong>ten <strong>the</strong> only spoken language.<br />
Because <strong>of</strong> <strong>the</strong> nice climate agriculture without doubt employs most people. The <strong>in</strong>digenous<br />
population <strong>of</strong>ten lives <strong>of</strong> traditional agriculture and cultivation <strong>of</strong> flowers, which <strong>the</strong>y sell <strong>in</strong><br />
<strong>the</strong> local markets. Important crops are soybeans, corn, sugarcane, potatoes and all k<strong>in</strong>ds <strong>of</strong><br />
fruit. If it wasn’t for <strong>the</strong> lack <strong>of</strong> water for irrigation and <strong>the</strong> recurrent floods, mak<strong>in</strong>g a liv<strong>in</strong>g<br />
would have been a lot easier. Potable water is also a big problem, 33% <strong>of</strong> <strong>the</strong> households <strong>in</strong><br />
Cochabamba does not have access to water (INE, 2001).<br />
Figure 3. Satellite image <strong>of</strong> Cochabamba central valley<br />
Bachelor’s Degree Project - A <strong>conceptual</strong> <strong>model</strong> <strong>of</strong> <strong>the</strong> <strong>aquifer</strong> <strong>in</strong> <strong>Tiquipaya</strong>, <strong>Bolivia</strong> 11(52)<br />
<strong>KTH</strong> - Royal Institute <strong>of</strong> Technology - Stockholm 2005
Background on <strong>the</strong> municipality <strong>of</strong> <strong>Tiquipaya</strong><br />
The municipality <strong>of</strong> <strong>Tiquipaya</strong> is situated <strong>in</strong> <strong>the</strong> prov<strong>in</strong>ce <strong>of</strong> Quillacollo <strong>in</strong> <strong>the</strong> department <strong>of</strong><br />
Cochabamba. The municipality covers an area <strong>of</strong> 57208 Ha. Most <strong>of</strong> <strong>the</strong> area is <strong>in</strong> <strong>the</strong> districts<br />
1, 2 and 3 (Fig 4). This is on <strong>the</strong> north side <strong>of</strong> <strong>the</strong> waterdivider (Fig 5). The climate <strong>in</strong> this part<br />
is more tropical and <strong>the</strong>re is no problem with water. This report does not concern that part <strong>of</strong><br />
<strong>Tiquipaya</strong>. We have concentrated on <strong>the</strong> sou<strong>the</strong>rn part, district 4, 5 and 6. The urban area is<br />
situated with<strong>in</strong> <strong>the</strong>se districts.<br />
Accord<strong>in</strong>g to <strong>the</strong> latest census (INE, 2001) <strong>the</strong> population <strong>in</strong> <strong>Tiquipaya</strong> will be 58.095 <strong>in</strong><br />
2005. The number <strong>of</strong> homes is estimated to be 8216. Out <strong>of</strong> <strong>the</strong>se, 24 % does not have access<br />
to clean water for domestic use.<br />
Agriculture and cattle rais<strong>in</strong>g employs 20% <strong>of</strong> <strong>the</strong> population, followed by trade 17%,<br />
<strong>in</strong>dustry and manufacture 13% and construction work 12% (INE, 2003).<br />
Dur<strong>in</strong>g <strong>the</strong> last year <strong>the</strong> municipality <strong>of</strong> <strong>Tiquipaya</strong> has been governed by MAS. The mayor is<br />
Dr. Evaristo Peñaloza Alejo. Topics as water, residual water and <strong>in</strong>frastructure are <strong>of</strong> current<br />
<strong>in</strong>terest <strong>in</strong> <strong>the</strong> municipality. The municipality is aware <strong>of</strong> <strong>the</strong> fact that <strong>the</strong> actual operat<strong>in</strong>g<br />
systems are <strong>in</strong>sufficient, but <strong>the</strong> lack <strong>of</strong> money impedes <strong>the</strong> development.<br />
Figure 4. <strong>Tiquipaya</strong> district map with <strong>the</strong> districts affect<strong>in</strong>g <strong>the</strong> water balance marked red<br />
Bachelor’s Degree Project - A <strong>conceptual</strong> <strong>model</strong> <strong>of</strong> <strong>the</strong> <strong>aquifer</strong> <strong>in</strong> <strong>Tiquipaya</strong>, <strong>Bolivia</strong> 12(52)<br />
<strong>KTH</strong> - Royal Institute <strong>of</strong> Technology - Stockholm 2005
Objectives<br />
The objectives <strong>of</strong> this study are to make a <strong>conceptual</strong> <strong>model</strong> <strong>of</strong> <strong>the</strong> <strong>aquifer</strong> <strong>in</strong> <strong>Tiquipaya</strong>,<br />
<strong>in</strong>clud<strong>in</strong>g a groundwater balance. Hopefully our <strong>in</strong>vestigation will <strong>in</strong>crease <strong>the</strong> knowledge <strong>of</strong><br />
<strong>the</strong> groundwater situation <strong>in</strong> <strong>the</strong> municipality <strong>of</strong> <strong>Tiquipaya</strong>.<br />
Our results will also be a necessary base for computer simulations <strong>of</strong> groundwater flow.<br />
Computer simulations is a part <strong>of</strong> <strong>the</strong> related research project funded by SIDA “A susta<strong>in</strong>able<br />
and equal management <strong>of</strong> water resources – A gender perspective on water priorities for a<br />
river bas<strong>in</strong> <strong>in</strong> Cochabamba, <strong>Bolivia</strong>”(Thunqvist, 2004).<br />
Bachelor’s Degree Project - A <strong>conceptual</strong> <strong>model</strong> <strong>of</strong> <strong>the</strong> <strong>aquifer</strong> <strong>in</strong> <strong>Tiquipaya</strong>, <strong>Bolivia</strong> 13(52)<br />
<strong>KTH</strong> - Royal Institute <strong>of</strong> Technology - Stockholm 2005
Limitations<br />
The municipality <strong>of</strong> <strong>Tiquipaya</strong> covers an area <strong>of</strong> 57208Ha (Fig 5). Most <strong>of</strong> <strong>the</strong> area is <strong>in</strong><br />
district 1, 2 and 3 (Fig 4). The waterdivide is on <strong>the</strong> top <strong>of</strong> <strong>the</strong> mounta<strong>in</strong> range, so district 1, 2<br />
and 3 belong to ano<strong>the</strong>r catchment area. We have limited <strong>the</strong> area to <strong>the</strong> sou<strong>the</strong>rn part <strong>of</strong> <strong>the</strong><br />
municipality. The limit <strong>in</strong> <strong>the</strong> north is <strong>the</strong> waterdivider on <strong>the</strong> top <strong>of</strong> <strong>the</strong> mounta<strong>in</strong> range. To<br />
<strong>the</strong> sides and to <strong>the</strong> south <strong>the</strong> limit is <strong>the</strong> municipality border. The <strong>aquifer</strong> probably covers a<br />
larger area, but this is not <strong>in</strong>cluded <strong>in</strong> our study.<br />
We have not considered <strong>the</strong> fact that <strong>the</strong> Taquiña brewery uses water for <strong>the</strong>ir beer<br />
production. The water is led directly from a lake and a river <strong>in</strong> <strong>the</strong> <strong>in</strong>vestigation area, to <strong>the</strong><br />
brewery. The <strong>in</strong>formation about <strong>the</strong> amount <strong>of</strong> water used <strong>in</strong> <strong>the</strong> brewery has been very<br />
vary<strong>in</strong>g, but <strong>in</strong> comparison to <strong>the</strong> total amount <strong>of</strong> water <strong>in</strong> <strong>the</strong> catchment area <strong>the</strong> amount for<br />
brewery is neglectable.<br />
We have limited <strong>the</strong> cycle <strong>of</strong> recharge from irrigation water taken from <strong>the</strong> <strong>aquifer</strong> to one<br />
turn. After one turn we assume that <strong>the</strong> percentages for evapotranspiration and <strong>in</strong>filtration are<br />
no longer reliable. Fur<strong>the</strong>r cycles are not <strong>in</strong>cluded <strong>in</strong> <strong>the</strong> balance.<br />
Figure 5. <strong>Tiquipaya</strong> municipality border and <strong>the</strong> top <strong>of</strong> <strong>the</strong> mounta<strong>in</strong> range marked as <strong>the</strong><br />
waterdivider between <strong>the</strong> catchment areas<br />
Bachelor’s Degree Project - A <strong>conceptual</strong> <strong>model</strong> <strong>of</strong> <strong>the</strong> <strong>aquifer</strong> <strong>in</strong> <strong>Tiquipaya</strong>, <strong>Bolivia</strong> 14(52)<br />
<strong>KTH</strong> - Royal Institute <strong>of</strong> Technology - Stockholm 2005
Sources <strong>of</strong> <strong>in</strong>formation<br />
From The National Institute <strong>of</strong> Statistics, INE, we got <strong>the</strong> latest census from 2001, statistics<br />
over water use and a thorough report on <strong>the</strong> poverty situation <strong>in</strong> <strong>Bolivia</strong>.<br />
The National Service <strong>of</strong> Geology and M<strong>in</strong><strong>in</strong>g <strong>of</strong> <strong>Bolivia</strong>, Sergeom<strong>in</strong>, is <strong>the</strong> <strong>of</strong>ficial supplier <strong>of</strong><br />
bullet<strong>in</strong>s and maps concern<strong>in</strong>g geology, m<strong>in</strong><strong>in</strong>g, hydrogeology etc. From <strong>the</strong>ir <strong>of</strong>fice we<br />
bought two bullet<strong>in</strong>s publicized by Sergeom<strong>in</strong> and CABAS, Covenio Alemán-<strong>Bolivia</strong>no de<br />
Aguas Subterráneas.<br />
The Municipality <strong>of</strong> <strong>Tiquipaya</strong> supplied overall data on <strong>the</strong> area. They gave us a deeper<br />
understand<strong>in</strong>g <strong>of</strong> <strong>the</strong> area, vegetation and <strong>the</strong> complexity <strong>of</strong> <strong>the</strong> water problem. We also got<br />
detailed maps over <strong>the</strong> urban area, which were developed for <strong>the</strong> new sewage disposal system.<br />
Through our supervisor, José Cardoso Morales, we got <strong>in</strong> contact with a cooperation called<br />
Promic, Programa Manejo Integral de Cuencas. Promic is f<strong>in</strong>anced by Swiss and <strong>Bolivia</strong>n aid.<br />
They work with watershed management and soil conservation. Groundwater is not <strong>the</strong>ir ma<strong>in</strong><br />
goal, but <strong>the</strong>ir work contributes through <strong>in</strong>creased <strong>in</strong>filtration. From Promic we received<br />
metrological data from <strong>the</strong>ir observation stations <strong>in</strong> <strong>the</strong> mounta<strong>in</strong>s and GIS layers over <strong>the</strong><br />
watersheds. We also got access to Promic’s library, conta<strong>in</strong><strong>in</strong>g prior studies made over <strong>the</strong><br />
area.<br />
SEMAPA, <strong>the</strong> Municipal Service <strong>of</strong> Potable Water and Sewerage, produce and distribute<br />
dr<strong>in</strong>k<strong>in</strong>g water. SEMAPA gave us <strong>in</strong>formation <strong>of</strong> <strong>the</strong> capacity <strong>of</strong> wells <strong>the</strong>y drilled <strong>in</strong> <strong>the</strong> area<br />
and surface water pipes from lakes.<br />
In <strong>the</strong> University <strong>of</strong> San Simon we cooperated with several departments. The Hydraulic<br />
Department had two students who were writ<strong>in</strong>g <strong>the</strong>ir master <strong>the</strong>sis about groundwater <strong>in</strong><br />
Cochabamba. They shared <strong>the</strong>ir data and digital maps with us. We also got access to <strong>the</strong><br />
departments previous technical reports.<br />
The department <strong>of</strong> CLAS works with GIS applications for a susta<strong>in</strong>able development <strong>of</strong> <strong>the</strong><br />
natural resources. CLAS supplied <strong>the</strong> municipality <strong>of</strong> <strong>Tiquipaya</strong> with <strong>the</strong> latest data, maps and<br />
satellite images. This data <strong>the</strong>y also shared with us.<br />
The department Centro A.G.U.A was compil<strong>in</strong>g a GIS database. They were plann<strong>in</strong>g to put<br />
<strong>the</strong> complete database on <strong>the</strong> <strong>in</strong>ternet as data free to download. We got access to this database<br />
even though it wasn’t complete. Centro A.G.U.A also had a project <strong>in</strong> <strong>the</strong> municipality <strong>of</strong><br />
<strong>Tiquipaya</strong>. This project, Negowat, was study<strong>in</strong>g <strong>the</strong> social aspect <strong>of</strong> water use. They had data<br />
over wells and discharge areas which <strong>the</strong>y shared with us.<br />
Methodology <strong>of</strong> work<br />
Gett<strong>in</strong>g to Cochabamba we understood that <strong>the</strong>re were a lot <strong>of</strong> data on our subject. The data<br />
were spread out <strong>in</strong> companies and <strong>in</strong> different departments <strong>of</strong> <strong>the</strong> university. This is why our<br />
method <strong>of</strong> work was to ga<strong>the</strong>r all <strong>the</strong> exist<strong>in</strong>g <strong>in</strong>formation and compile it to a lucid amount <strong>of</strong><br />
data.<br />
The water situation <strong>in</strong> Cochabamba is very complicated. To understand <strong>the</strong> phenomenons<br />
such as flood<strong>in</strong>g, extreme erosion, agriculture etc. we went on several guided field trips with<br />
experts from <strong>the</strong> municipality and Promic. The field trips mostly went to <strong>the</strong> steep mounta<strong>in</strong><br />
area, which is <strong>the</strong> cause to some <strong>of</strong> <strong>the</strong> problems.<br />
Bachelor’s Degree Project - A <strong>conceptual</strong> <strong>model</strong> <strong>of</strong> <strong>the</strong> <strong>aquifer</strong> <strong>in</strong> <strong>Tiquipaya</strong>, <strong>Bolivia</strong> 15(52)<br />
<strong>KTH</strong> - Royal Institute <strong>of</strong> Technology - Stockholm 2005
Quantity<br />
Groundwater recharge<br />
Description <strong>of</strong> <strong>the</strong> mounta<strong>in</strong> area<br />
Much <strong>of</strong> <strong>the</strong> area <strong>of</strong> <strong>the</strong> mounta<strong>in</strong> range is made up <strong>of</strong> Paleozoic rocks, such as Ordovician,<br />
Silurian and Devonian, and <strong>in</strong> m<strong>in</strong>or extent some Mesozoic rocks (Renner, Velasco, 2000).<br />
The mounta<strong>in</strong>s <strong>in</strong> <strong>the</strong> <strong>Tiquipaya</strong> area start at an altitude <strong>of</strong> 2900m above sea level and <strong>the</strong><br />
highest po<strong>in</strong>t <strong>of</strong> <strong>the</strong> range is <strong>the</strong> Tunari peak at 5030m. This makes <strong>the</strong> difference <strong>in</strong> altitude<br />
about 1500m <strong>in</strong> a vertical distance <strong>of</strong> 900m mak<strong>in</strong>g <strong>the</strong> <strong>in</strong>cl<strong>in</strong>ation 59° <strong>in</strong> <strong>the</strong> some areas. In<br />
<strong>the</strong> summer when <strong>the</strong>re is heavy ra<strong>in</strong>fall, <strong>the</strong> river runs from <strong>the</strong> top <strong>of</strong> <strong>the</strong> mounta<strong>in</strong> to <strong>the</strong><br />
bottom <strong>in</strong> only 30 m<strong>in</strong>utes (Promic, 2005).<br />
The vegetation <strong>in</strong> <strong>the</strong> Cordillera is mostly high steppe and high mounta<strong>in</strong> prairie, i.e. pastures<br />
and bushes. In <strong>the</strong> lower areas a little denser semi-arid vegetation <strong>of</strong> trees and bushes is<br />
developed (Fig 6). A long time ago <strong>the</strong> whole Cordillera was covered with trees, but dur<strong>in</strong>g<br />
<strong>the</strong> years <strong>the</strong> forest has been cut down for economic ga<strong>in</strong>. In one area, <strong>the</strong> Tunari Park, <strong>the</strong>y<br />
have planted trees aga<strong>in</strong>, but <strong>the</strong> rest <strong>of</strong> <strong>the</strong> high Cordillera is only covered with bushes and<br />
pastures. In <strong>the</strong> lower mounta<strong>in</strong> areas <strong>in</strong> <strong>Tiquipaya</strong> <strong>the</strong>y have planted some trees, for example<br />
Eucalyptus, Kishuara and Quewiña.<br />
Figure 6. Riverbed and semi-arid vegetation <strong>in</strong> <strong>the</strong> mounta<strong>in</strong>s <strong>of</strong> <strong>the</strong> Khora watershed<br />
In <strong>the</strong> Cordillera <strong>the</strong>y have great problems with erosion. The mounta<strong>in</strong> is covered by a layer<br />
<strong>of</strong> fluvio-glacial sediments. S<strong>in</strong>ce <strong>the</strong>re are no trees and high <strong>in</strong>cl<strong>in</strong>ation, <strong>the</strong> soil flows away<br />
when <strong>the</strong>re is heavy ra<strong>in</strong> fall. In some watersheds Promic has tried to decrease <strong>the</strong> erosion by<br />
build<strong>in</strong>g gabions and by plant<strong>in</strong>g a type <strong>of</strong> grass. The grass b<strong>in</strong>ds <strong>the</strong> soil to <strong>the</strong> ground and<br />
<strong>the</strong> gabions decreases <strong>the</strong> velocity <strong>of</strong> <strong>the</strong> water to make it possible for more water to <strong>in</strong>filtrate.<br />
In <strong>the</strong> <strong>Tiquipaya</strong> mounta<strong>in</strong> area <strong>the</strong>re are about 100 households. The families live by<br />
agriculture and <strong>the</strong> <strong>of</strong>ten have cattle. The agriculture is on a small scale and it is very affected<br />
by <strong>the</strong> <strong>in</strong>cl<strong>in</strong>ation and <strong>the</strong> erosion. To avoid erosion <strong>the</strong> farmers have been recommended to<br />
have <strong>the</strong>ir cultivations <strong>in</strong> terraces and to plant imped<strong>in</strong>g l<strong>in</strong>es <strong>of</strong> grass. The farmers also have<br />
been recommended to <strong>in</strong>stead <strong>of</strong> mak<strong>in</strong>g more and more fields when <strong>the</strong> soil needs to rest,<br />
<strong>the</strong>y should change <strong>the</strong> crops <strong>in</strong> <strong>the</strong>ir exist<strong>in</strong>g fields. The purpose is to protect <strong>the</strong> cultivations<br />
Bachelor’s Degree Project - A <strong>conceptual</strong> <strong>model</strong> <strong>of</strong> <strong>the</strong> <strong>aquifer</strong> <strong>in</strong> <strong>Tiquipaya</strong>, <strong>Bolivia</strong> 16(52)<br />
<strong>KTH</strong> - Royal Institute <strong>of</strong> Technology - Stockholm 2005
and to make <strong>the</strong> flood<strong>in</strong>g <strong>in</strong> <strong>the</strong> lower area less. The preventive work aga<strong>in</strong>st erosion and<br />
flood<strong>in</strong>g must be done <strong>in</strong> <strong>the</strong> higher area. Once <strong>the</strong> water reaches <strong>the</strong> valley it is much harder<br />
to control. The most common land use <strong>in</strong> <strong>the</strong> watersheds is pasture. Smaller parts are used for<br />
temporal agriculture and reforestation.<br />
Bachelor’s Degree Project - A <strong>conceptual</strong> <strong>model</strong> <strong>of</strong> <strong>the</strong> <strong>aquifer</strong> <strong>in</strong> <strong>Tiquipaya</strong>, <strong>Bolivia</strong> 17(52)<br />
<strong>KTH</strong> - Royal Institute <strong>of</strong> Technology - Stockholm 2005
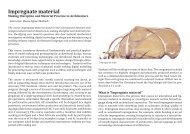
The recharge zone <strong>in</strong> <strong>the</strong> valley<br />
From <strong>the</strong> mounta<strong>in</strong> foot <strong>the</strong> soil is made up by alluvial cones <strong>of</strong> different ages (Fig 7). At <strong>the</strong><br />
edge <strong>of</strong> <strong>the</strong> range <strong>the</strong> oldest cones start and <strong>the</strong>y are mostly <strong>of</strong> glacial orig<strong>in</strong>. The deposits are<br />
ma<strong>in</strong>ly- coarse gra<strong>in</strong>ed materials formed by rounded blocks, boulders and gravel with<br />
contents <strong>of</strong> sands, muds and clays. They are <strong>of</strong> high hydraulic permeability, <strong>the</strong>refore <strong>the</strong>ir<br />
surface is dry and with scarce vegetal coverage.<br />
Dur<strong>in</strong>g centuries <strong>the</strong> rivers have run from <strong>the</strong> Cordillera and towards <strong>the</strong> valley and <strong>the</strong> old<br />
fans are detected down to 80 m. The current rivers (Fig 7) deposit <strong>the</strong>ir material superficially<br />
onto <strong>the</strong> older fans. In general, <strong>the</strong> granulometry change from coarse to f<strong>in</strong>e <strong>in</strong> direction <strong>of</strong> <strong>the</strong><br />
Rocha River.<br />
-Alluvial zone. Gravel, blocks, sand. High recharge.<br />
--Alluvial zone. Gravel, clay, blocks. Medium recharge.<br />
--Transition zone. Clay, sand. Low recharge.<br />
--Lacustr<strong>in</strong>e zone. Clay. No recharge.<br />
-<br />
--Materials: Mud and clay.<br />
--Rivers<br />
Figure 7. Recharge zones <strong>in</strong> <strong>the</strong> valley and <strong>the</strong> rivers Tolavi, Khora and Taquiña<br />
In <strong>Tiquipaya</strong> <strong>the</strong> area with coarse gra<strong>in</strong>ed materials are used for pastures and cultivations.<br />
This area is where most <strong>of</strong> <strong>the</strong> groundwater recharge takes place. In <strong>the</strong> summer when it ra<strong>in</strong>s<br />
<strong>the</strong> rivers get flooded. S<strong>in</strong>ce <strong>the</strong> rivers are shallow <strong>the</strong>y extend sideways when <strong>the</strong> flow<br />
Bachelor’s Degree Project - A <strong>conceptual</strong> <strong>model</strong> <strong>of</strong> <strong>the</strong> <strong>aquifer</strong> <strong>in</strong> <strong>Tiquipaya</strong>, <strong>Bolivia</strong> 18(52)<br />
<strong>KTH</strong> - Royal Institute <strong>of</strong> Technology - Stockholm 2005
<strong>in</strong>creases. S<strong>in</strong>ce <strong>the</strong> permeability is high a lot <strong>of</strong> water can <strong>in</strong>filtrate from <strong>the</strong> extended river<br />
beds.<br />
Def<strong>in</strong>ition <strong>of</strong> <strong>the</strong> watersheds<br />
A large part <strong>of</strong> <strong>the</strong> municipality <strong>of</strong> <strong>Tiquipaya</strong> is mounta<strong>in</strong> area. The distance from <strong>the</strong> urban<br />
area to <strong>the</strong> highest po<strong>in</strong>t <strong>of</strong> <strong>the</strong> mounta<strong>in</strong> range varies from 7-12 km. This divides <strong>the</strong><br />
municipality <strong>in</strong> different watersheds (Fig 8). The ra<strong>in</strong>water flows from <strong>the</strong> mounta<strong>in</strong> peaks<br />
and towards <strong>the</strong> valley <strong>in</strong> <strong>the</strong> south. From <strong>the</strong> peaks <strong>the</strong> area is divided <strong>in</strong>to three large and<br />
two small watersheds. There are also several small watersheds at <strong>the</strong> mounta<strong>in</strong> foot. The large<br />
one to <strong>the</strong> east, Taquiña, is divided <strong>in</strong> half by <strong>the</strong> municipality border. S<strong>in</strong>ce <strong>the</strong> river Taquiña<br />
runs <strong>in</strong>to <strong>Tiquipaya</strong> we have <strong>in</strong>cluded <strong>the</strong> watershed <strong>in</strong> our area. In <strong>the</strong> west <strong>the</strong> municipality<br />
border co<strong>in</strong>cides more or less with <strong>the</strong> river Phiusi from <strong>the</strong> watersheds Phiusi and Apote. The<br />
river runs <strong>in</strong>to ano<strong>the</strong>r municipality so <strong>the</strong>se watersheds are not <strong>in</strong>cluded. The total area <strong>of</strong> <strong>the</strong><br />
watersheds affect<strong>in</strong>g <strong>the</strong> <strong>aquifer</strong> is 69,91 km² (Table 2).<br />
Figure 8. Watersheds affect<strong>in</strong>g <strong>the</strong> municipality <strong>of</strong> <strong>Tiquipaya</strong><br />
Table 2. Areas <strong>of</strong> <strong>the</strong> watersheds <strong>in</strong> <strong>Tiquipaya</strong><br />
Name Area (km²)<br />
Thola Pujru 15,26<br />
Khora <strong>Tiquipaya</strong> 26,99<br />
Taquiña 19,25<br />
Chuta Kawa 3,74<br />
Wark´a Puquiri 1,37<br />
Rema<strong>in</strong><strong>in</strong>g small watersheds 3,29<br />
Bachelor’s Degree Project - A <strong>conceptual</strong> <strong>model</strong> <strong>of</strong> <strong>the</strong> <strong>aquifer</strong> <strong>in</strong> <strong>Tiquipaya</strong>, <strong>Bolivia</strong> 19(52)<br />
<strong>KTH</strong> - Royal Institute <strong>of</strong> Technology - Stockholm 2005
Dra<strong>in</strong>age for irrigation and domestic use<br />
In <strong>Tiquipaya</strong> <strong>the</strong>y have a wide-spread system for dra<strong>in</strong>age. The communities (Fig 9) <strong>in</strong><br />
<strong>Tiquipaya</strong> have access to different systems for irrigation.<br />
Figure 9. Map <strong>of</strong> communities <strong>in</strong> <strong>Tiquipaya</strong> and <strong>the</strong> rivers Tolavi, Khora and Taquiña<br />
Each community chooses a committee to handle <strong>the</strong> distribution for irrigation and domestic<br />
use. Every community works out a schedule concern<strong>in</strong>g when and how much water every<br />
household should have. Some communities situated fur<strong>the</strong>r north have priority over <strong>the</strong> water<br />
from river Khora. They have <strong>the</strong> right to store water from <strong>the</strong> river before o<strong>the</strong>rs have access<br />
to it. The reservoir for dr<strong>in</strong>k<strong>in</strong>g water for <strong>the</strong> urban area is situated fur<strong>the</strong>r down <strong>in</strong> <strong>the</strong> river.<br />
Because <strong>of</strong> this <strong>the</strong> urban area more <strong>of</strong>ten lacks dr<strong>in</strong>k<strong>in</strong>g water <strong>in</strong> <strong>the</strong> w<strong>in</strong>ter, June-September.<br />
Irrigation system Mit´a<br />
This system is <strong>the</strong> most important <strong>in</strong> <strong>the</strong> area and <strong>the</strong> water is taken from <strong>the</strong> base flow <strong>of</strong><br />
river Khora. It supplies water to 13 communities <strong>in</strong> <strong>the</strong> north, central and south zones. From<br />
<strong>the</strong> river <strong>the</strong> water is led to reservoirs and <strong>the</strong>n <strong>in</strong> open concrete grooves to <strong>the</strong> communities.<br />
Irrigation system Lagum Mayu<br />
This system takes water from <strong>the</strong> lagoons, 450 l/s and leads it down to <strong>the</strong> communities. The<br />
11 communities (650 ha) supplied by <strong>the</strong> system receive 280-300 l/s. The system is run from<br />
9 th <strong>of</strong> August to November or December. The water is distributed by turn and <strong>the</strong> frequency is<br />
Bachelor’s Degree Project - A <strong>conceptual</strong> <strong>model</strong> <strong>of</strong> <strong>the</strong> <strong>aquifer</strong> <strong>in</strong> <strong>Tiquipaya</strong>, <strong>Bolivia</strong> 20(52)<br />
<strong>KTH</strong> - Royal Institute <strong>of</strong> Technology - Stockholm 2005
more or less 21 days. The 565 users are divided <strong>in</strong>to groups which receive different amounts<br />
<strong>of</strong> water. The cost for each user is Bs 4.5/hr (~$ 0.56).<br />
Irrigation system Chankas<br />
This system <strong>in</strong>cludes <strong>the</strong> Sirpita and Montecillo communities. S<strong>in</strong>ce 1967 <strong>the</strong>y have <strong>the</strong> rights<br />
to <strong>the</strong> water <strong>in</strong> 11 lagoons. The system is run 2 or 3 times a year and <strong>the</strong> <strong>in</strong>tervals vary<br />
between 3 to 4 weeks. The communities receive water for 3 days each. The flow from <strong>the</strong><br />
lagoons is 200-250 l/s. Some is lost on <strong>the</strong> way so <strong>the</strong> communities receive 110-200 l/s. There<br />
are 118 users and <strong>the</strong>y have <strong>the</strong> right to at least one hour <strong>of</strong> water every turn.<br />
The National irrigation system N° 1 (SNRN° 1)<br />
"La Angostura" SNRN° 1 (Fig 9) was constructed <strong>in</strong> 1940-1945 with technical help from <strong>the</strong><br />
Mexican government. This system has 1000 users <strong>in</strong> <strong>Tiquipaya</strong>, on an area <strong>of</strong> 1200 ha. They<br />
receive water dur<strong>in</strong>g one month 5 times a year and <strong>the</strong> flow is 800-1500 l/s. The cost for<br />
water and ma<strong>in</strong>tenance is 108 Bs/user/years (~$ 13.5).<br />
Irrigation system by spr<strong>in</strong>gs<br />
In <strong>the</strong> central zone <strong>of</strong> <strong>Tiquipaya</strong> <strong>the</strong>re are 37 spr<strong>in</strong>gs, with flows vary<strong>in</strong>g between 0.5-15 l/s.<br />
The water is distributed from <strong>the</strong> spr<strong>in</strong>gs to <strong>the</strong> users. Depend<strong>in</strong>g on <strong>the</strong> precipitation <strong>in</strong> <strong>the</strong><br />
Cordillera <strong>the</strong> capacity <strong>of</strong> <strong>the</strong> ponds are 80 - 650 m³.<br />
Dur<strong>in</strong>g our fieldtrips we have observed that <strong>the</strong> soil is extremely dry <strong>in</strong> <strong>the</strong> w<strong>in</strong>ter.<br />
Consider<strong>in</strong>g this we can assume that <strong>the</strong> irrigation water evaporates and no water reaches <strong>the</strong><br />
<strong>aquifer</strong>. After <strong>the</strong> ra<strong>in</strong>y season when <strong>the</strong> irrigation starts aga<strong>in</strong> and <strong>the</strong> soil is more saturated,<br />
some irrigation water might reach <strong>the</strong> <strong>aquifer</strong>. The amount which <strong>in</strong>filtrates is 25% (Ricaldi et<br />
al, 1989).<br />
Three irrigation systems, Lagum Mayu, Chankas, SNRN° 1, take water from catchment areas<br />
outside <strong>of</strong> <strong>Tiquipaya</strong>. The amount that <strong>in</strong>filtrates from <strong>the</strong>se irrigation systems is recharg<strong>in</strong>g<br />
<strong>the</strong> <strong>aquifer</strong> (Table 3). The addition to <strong>the</strong> <strong>aquifer</strong> is calculated to be 25% <strong>of</strong> <strong>the</strong> average flow<br />
dur<strong>in</strong>g <strong>the</strong> average distribution time.<br />
Table 3. Irrigation systems recharg<strong>in</strong>g <strong>the</strong> <strong>aquifer</strong><br />
Irrigation<br />
system<br />
Average<br />
flow (l/s)<br />
Average distribu-<br />
tion time(months)<br />
Volume<br />
(m³/year)<br />
Infiltration<br />
25%(m³/year)<br />
Lagum Mayu 290 4 3110400 777600<br />
Chankas 155 2 803520 200880<br />
SNRN° 1 1150 5 14904000 3726000<br />
Sum 4.704.480<br />
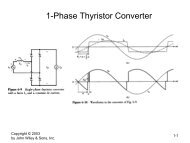
Metrological conditions<br />
In Cochabamba <strong>the</strong> ra<strong>in</strong> period is <strong>in</strong> <strong>the</strong> summer, January, February and Mars. The variation<br />
<strong>in</strong> precipitation is extreme. Based on data from Promic we have calculated that <strong>in</strong> <strong>the</strong> valley<br />
66.1% <strong>of</strong> <strong>the</strong> ra<strong>in</strong> falls <strong>in</strong> <strong>the</strong> summer and 1.1% <strong>in</strong> <strong>the</strong> w<strong>in</strong>ter. At 4200 m <strong>in</strong> <strong>the</strong> Cordillera<br />
54.9% falls <strong>in</strong> <strong>the</strong> summer and 2.1% <strong>in</strong> <strong>the</strong> w<strong>in</strong>ter. This causes a big variation <strong>in</strong> <strong>the</strong><br />
groundwater level dur<strong>in</strong>g <strong>the</strong> year.<br />
Bachelor’s Degree Project - A <strong>conceptual</strong> <strong>model</strong> <strong>of</strong> <strong>the</strong> <strong>aquifer</strong> <strong>in</strong> <strong>Tiquipaya</strong>, <strong>Bolivia</strong> 21(52)<br />
<strong>KTH</strong> - Royal Institute <strong>of</strong> Technology - Stockholm 2005
In <strong>the</strong> valley <strong>the</strong>re is one metrological station, LH-UMSS at an altitude <strong>of</strong> 2570 m. This<br />
metrological station is situated too low <strong>in</strong> a place that is not comparable to <strong>Tiquipaya</strong>. The<br />
LH-UMSS station is <strong>in</strong> <strong>the</strong> diagram (Fig 10) as a comparison, but it is not <strong>in</strong>cluded <strong>in</strong> <strong>the</strong><br />
calculations (See Appendix). In <strong>the</strong> Taquiña watershed <strong>the</strong>re are three stations record<strong>in</strong>g<br />
metrological data.<br />
They are situated <strong>in</strong> different altitude Taquiña 4200 m, Janamayu 3770 m and Limkupata<br />
3550 m. They record data such as humidity, precipitation, temperature, solar radiation, w<strong>in</strong>d<br />
velocity and direction. The precipitation varies with altitude from 400-1000 mm/year. The<br />
year average is for <strong>the</strong> station Taquiña 807 mm/year, Janamayu 768 mm/year and Limkupata<br />
642 mm/year. The year average for <strong>the</strong> stations is 739 mm/year.<br />
(m.m.)<br />
Figure 10. Diagram <strong>of</strong> precipitation<br />
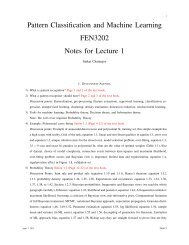
The variation <strong>in</strong> temperature from day to night is between 20-30ºC <strong>in</strong> <strong>the</strong> valley and 15-19ºC<br />
<strong>in</strong> <strong>the</strong> Cordillera (Fig 11). On <strong>the</strong> o<strong>the</strong>r hand <strong>the</strong> temperature is very even dur<strong>in</strong>g <strong>the</strong> year, <strong>the</strong><br />
maximum temperature <strong>in</strong> <strong>the</strong> valley only varies between 27,7- 32,3ºC.<br />
(ºC)<br />
200,00<br />
180,00<br />
160,00<br />
140,00<br />
120,00<br />
100,00<br />
80,00<br />
60,00<br />
40,00<br />
20,00<br />
20,00<br />
0,00<br />
18,00<br />
16,00<br />
14,00<br />
12,00<br />
10,00<br />
8,00<br />
6,00<br />
4,00<br />
2,00<br />
0,00<br />
Jan Mars May July September November<br />
LH-UMSS Taquiña Janamayu Limkupata<br />
Average temperature (ºC)<br />
Jan Mars May July September Noviembre<br />
LH-UMSS Taquiña Janamayu Limkupata<br />
Precipitation(m.m.)<br />
Figure 11. Diagram <strong>of</strong> average temperature<br />
Months<br />
For our calculations we used <strong>the</strong> average precipitation/month (Fig 10) for each station<br />
recorded year 1992-2002. We divided <strong>the</strong> total area <strong>of</strong> <strong>the</strong> watersheds, 69,91 km², <strong>in</strong>to three<br />
area groups. To divide <strong>the</strong> total area we used <strong>the</strong> contour l<strong>in</strong>es correspond<strong>in</strong>g to <strong>the</strong> altitude<br />
between <strong>the</strong> altitudes <strong>of</strong> <strong>the</strong> stations. Then we extrapolated <strong>the</strong> average precipitation/month<br />
from each station on <strong>the</strong> correspond<strong>in</strong>g area. The correspond<strong>in</strong>g areas are Taquiña 23,8 km²,<br />
Janamayu 10,6 km² and Limkupata 35,6 km². Through this calculation we got an average for<br />
<strong>the</strong> whole area based on <strong>the</strong> data from <strong>the</strong> metrological stations <strong>in</strong> <strong>the</strong> Taquiña watershed.<br />
Months<br />
Bachelor’s Degree Project - A <strong>conceptual</strong> <strong>model</strong> <strong>of</strong> <strong>the</strong> <strong>aquifer</strong> <strong>in</strong> <strong>Tiquipaya</strong>, <strong>Bolivia</strong> 22(52)<br />
<strong>KTH</strong> - Royal Institute <strong>of</strong> Technology - Stockholm 2005
Evapotranspiration<br />
The potential evaporation has been calculated from <strong>the</strong> data from <strong>the</strong> metrological stations <strong>in</strong><br />
Taquiña. The data has been recorded by Promic. The potential evaporation is higher than <strong>the</strong><br />
precipitation <strong>in</strong> all cases (Fig 12).<br />
1800,0<br />
1600,0<br />
1400,0<br />
1200,0<br />
1000,0<br />
(mm.)<br />
800,0<br />
600,0<br />
400,0<br />
200,0<br />
0,0<br />
Potentialevaporation<br />
Potential evaporation/Precipitation<br />
LHUMSS Taquiña Janamayu Limkupata<br />
Precipitation<br />
Stations<br />
Figure 12. Diagram <strong>of</strong> potential evaporation<br />
The real evapotranspiration it is estimated to be approx. 490 mm/year (Renner, Velasco<br />
2002). This value <strong>of</strong> evapotranspiration is 66% <strong>of</strong> <strong>the</strong> average precipitation <strong>in</strong> <strong>the</strong> Taquiña<br />
watershed, 738 mm/year. The evapotranspiration exceeds <strong>the</strong> precipitation on a monthly basis<br />
April–September. Accord<strong>in</strong>g to ano<strong>the</strong>r study (Ricaldi et al, 1989) <strong>the</strong> real evapotranspiration<br />
is 20% <strong>of</strong> <strong>the</strong> precipitation. Compared to real evapotranspiration <strong>in</strong> o<strong>the</strong>r places 20% <strong>in</strong> this<br />
region seems low. Instead <strong>of</strong> 20% we have used an evapotranspiration <strong>of</strong> 25% <strong>of</strong> <strong>the</strong><br />
precipitation (Promic, 2005). This value still seems low but we preferred to use this<br />
estimation, made by pr<strong>of</strong>essionals know<strong>in</strong>g <strong>the</strong> area, <strong>in</strong>stead <strong>of</strong> estimat<strong>in</strong>g a value our selves.<br />
The run<strong>of</strong>f vary quite a bit depend<strong>in</strong>g on which evapotranspiration we use.<br />
Infiltration and river flow<br />
We have estimated some facts based on observations dur<strong>in</strong>g our field excursions. For our<br />
calculations we needed an average river flow. In order to get this value we subtracted <strong>the</strong><br />
evapotranspiration from <strong>the</strong> precipitation <strong>in</strong> <strong>the</strong> mounta<strong>in</strong> watersheds. The rema<strong>in</strong><strong>in</strong>g amount<br />
is assumed to flow down <strong>in</strong> <strong>the</strong> rivers. On its way down some water <strong>in</strong>filtrates <strong>in</strong> <strong>the</strong><br />
watershed and discharges as spr<strong>in</strong>gs fur<strong>the</strong>r down <strong>in</strong> <strong>the</strong> mounta<strong>in</strong> area. This fact was<br />
observed dur<strong>in</strong>g our fieldtrips were spr<strong>in</strong>gs discharged all along <strong>the</strong> steep riversides. A small<br />
amount <strong>of</strong> water might reach <strong>the</strong> <strong>aquifer</strong> through <strong>the</strong> ground directly from <strong>the</strong> watersheds, but<br />
this amount is not <strong>in</strong>cluded <strong>in</strong> <strong>the</strong> calculations. To simplify <strong>the</strong> calculations we have assumed<br />
that <strong>the</strong> precipitation from <strong>the</strong> watersheds reaches <strong>the</strong> valley only as river flow (See<br />
Appendix).<br />
In <strong>the</strong> w<strong>in</strong>ter, April – September, we have observed that <strong>the</strong> flow <strong>in</strong> <strong>the</strong> rivers is small. S<strong>in</strong>ce<br />
<strong>the</strong>re is hardly any precipitation <strong>the</strong> small river flow is assumed to be a base flow <strong>of</strong><br />
groundwater discharg<strong>in</strong>g <strong>in</strong> <strong>the</strong> mounta<strong>in</strong>s. In <strong>the</strong> first calculation with evapotranspiration 490<br />
mm/year, no reduction was needed s<strong>in</strong>ce <strong>the</strong> flow dur<strong>in</strong>g <strong>the</strong>se months was negative (Table<br />
4). In <strong>the</strong> second one, evapotranspiration 25%, <strong>the</strong> river flow was reduced to zero from April<br />
to September.<br />
Bachelor’s Degree Project - A <strong>conceptual</strong> <strong>model</strong> <strong>of</strong> <strong>the</strong> <strong>aquifer</strong> <strong>in</strong> <strong>Tiquipaya</strong>, <strong>Bolivia</strong> 23(52)<br />
<strong>KTH</strong> - Royal Institute <strong>of</strong> Technology - Stockholm 2005
The precipitation <strong>in</strong> <strong>the</strong> valley is about 500 mm/year. We have based our calculations on <strong>the</strong><br />
assumption that 15% <strong>in</strong>filtrates to <strong>the</strong> <strong>aquifer</strong> (Ricaldi et al, 1989). We have not subtracted<br />
any evapotranspiration <strong>in</strong> <strong>the</strong> valley area. We assume that it is <strong>in</strong>cluded <strong>in</strong> <strong>the</strong> 85% that does<br />
not <strong>in</strong>filtrate.<br />
Table 4. Average precipitation and river flow<br />
Jan Feb Mars April May June July Aug Sep Oct Nov Dec<br />
Monthly average precipitation<br />
(mm/month) 166 122 127 24 5 4 4 14 25 46 71 129<br />
Monthly average precipitation<br />
converted to flow (l/s) 4495 3338 3323 682 152 121 125 419 729 1325 1984 3398<br />
Flow after subtract<strong>in</strong>g evapo-<br />
transpiration 490 mm/year (l/s) 3409 2252 2237 -404 -934 -966 -961 -668 -357 239 897 2312<br />
Flow after subtract<strong>in</strong>g<br />
evapotranspiration 25% (l/s) 3371 2504 2492 0 0 0 0 0 0 994 1488 2549<br />
Bachelor’s Degree Project - A <strong>conceptual</strong> <strong>model</strong> <strong>of</strong> <strong>the</strong> <strong>aquifer</strong> <strong>in</strong> <strong>Tiquipaya</strong>, <strong>Bolivia</strong> 24(52)<br />
<strong>KTH</strong> - Royal Institute <strong>of</strong> Technology - Stockholm 2005
Groundwater discharge<br />
Description <strong>of</strong> <strong>the</strong> river bas<strong>in</strong> area<br />
The river bas<strong>in</strong> area beg<strong>in</strong>s at <strong>the</strong> mounta<strong>in</strong> foot with cultivations and pastures. The centre <strong>of</strong><br />
<strong>Tiquipaya</strong> is situated 2 km fur<strong>the</strong>r down (Fig 13). The urban area is about 600 m <strong>in</strong> diameter.<br />
The natural centre is <strong>the</strong> town hall and <strong>the</strong> town square. Around <strong>the</strong> centre <strong>the</strong> semi-urban area<br />
extends and is mixed with agriculture. As <strong>in</strong> <strong>the</strong> rest <strong>of</strong> <strong>the</strong> valley <strong>the</strong> urban area is constantly<br />
grow<strong>in</strong>g. Nowadays <strong>the</strong>re are houses all along <strong>the</strong> road to Cochabamba and it is hard to<br />
determ<strong>in</strong>e were <strong>Tiquipaya</strong> ends and Cochabamba beg<strong>in</strong>s.<br />
Towards <strong>the</strong> south and <strong>the</strong> central valley <strong>the</strong> soil goes from alluvial deposits to lacustr<strong>in</strong>e<br />
deposits. The lacustr<strong>in</strong>e deposits conta<strong>in</strong> a lot <strong>of</strong> mud and clay and is <strong>the</strong>refore not good for<br />
groundwater exploitation. The municipality <strong>of</strong> <strong>Tiquipaya</strong> does not quite reach this area, but<br />
deterioration <strong>in</strong> <strong>the</strong> storage capacity is noted towards <strong>the</strong> south.<br />
There are four larger rivers runn<strong>in</strong>g <strong>in</strong>to <strong>Tiquipaya</strong>. From east to west <strong>the</strong>y are called Taquiña,<br />
Chuta Kawa, Khora <strong>Tiquipaya</strong> and Tolavi. Chuta Kawa and Khora <strong>Tiquipaya</strong> jo<strong>in</strong>s just north<br />
<strong>of</strong> <strong>the</strong> town. These two impose <strong>the</strong> biggest threat to <strong>the</strong> area due to flood<strong>in</strong>g. Along <strong>the</strong> rivers<br />
<strong>in</strong> <strong>the</strong> bas<strong>in</strong> area <strong>the</strong> municipality has marked <strong>of</strong>f an area for possible flood<strong>in</strong>g. In this area<br />
households or o<strong>the</strong>r build<strong>in</strong>gs are forbidden. S<strong>in</strong>ce <strong>the</strong> urban area is grow<strong>in</strong>g this area is<br />
start<strong>in</strong>g to be illegally exploited. Families move <strong>the</strong>re, build houses and start farm<strong>in</strong>g. This<br />
might work for a couple <strong>of</strong> years, until <strong>the</strong> next heavy ra<strong>in</strong>fall comes and flushes away <strong>the</strong><br />
houses. Too much agriculture <strong>in</strong> <strong>the</strong> area also affects <strong>the</strong> groundwater recharge, s<strong>in</strong>ce it will<br />
lead to less water <strong>in</strong>filtrat<strong>in</strong>g to <strong>the</strong> <strong>aquifer</strong>.<br />
Figure 13. Satellite image <strong>of</strong> <strong>Tiquipaya</strong>´s valley area, show<strong>in</strong>g <strong>the</strong> municipality border and town<br />
centre<br />
Bachelor’s Degree Project - A <strong>conceptual</strong> <strong>model</strong> <strong>of</strong> <strong>the</strong> <strong>aquifer</strong> <strong>in</strong> <strong>Tiquipaya</strong>, <strong>Bolivia</strong> 25(52)<br />
<strong>KTH</strong> - Royal Institute <strong>of</strong> Technology - Stockholm 2005
Discharge<br />
The discharge <strong>in</strong> <strong>the</strong> municipality <strong>of</strong> <strong>Tiquipaya</strong> is made up by artesian flow<strong>in</strong>g spr<strong>in</strong>gs, wells<br />
and groundwater flow out <strong>of</strong> <strong>the</strong> municipality (Fig 14). The <strong>aquifer</strong> does not co<strong>in</strong>cide with <strong>the</strong><br />
municipality border and <strong>the</strong> groundwater flows south out <strong>of</strong> <strong>the</strong> municipality towards <strong>the</strong><br />
Rocha river. The Rocha river is <strong>the</strong> only discharge from <strong>the</strong> Cochabamba valley. All <strong>the</strong><br />
rivers <strong>in</strong> <strong>the</strong> valley flow towards Rocha, which runs out <strong>of</strong> <strong>the</strong> valley <strong>in</strong> <strong>the</strong> southwest.<br />
--Drilled well<br />
--Drilled well<br />
--Groundwater flow<br />
--Altitude l<strong>in</strong>e<br />
Figure 14. Location <strong>of</strong> wells and groundwater flow<br />
There are 37 flow<strong>in</strong>g spr<strong>in</strong>gs (Negowat, 2005) and dur<strong>in</strong>g <strong>the</strong> last couple <strong>of</strong> years <strong>the</strong> users<br />
have noticed a decreas<strong>in</strong>g amount <strong>of</strong> water <strong>in</strong> <strong>the</strong> dams and longer periods <strong>of</strong> drought. The<br />
spr<strong>in</strong>gs have a vary<strong>in</strong>g flow between 0,5-8 l/s. There are more specific data over <strong>the</strong> spr<strong>in</strong>gs <strong>in</strong><br />
two areas <strong>of</strong> <strong>Tiquipaya</strong>, Kanarancho and L<strong>in</strong>de. We have based our calculations on this data<br />
and extrapolated it over <strong>the</strong> rest <strong>of</strong> <strong>the</strong> municipality. We could determ<strong>in</strong>e an average flow on<br />
<strong>the</strong> areas <strong>of</strong> L<strong>in</strong>de and Kanarancho. From altitude curves we could def<strong>in</strong>e a bigger area <strong>in</strong><br />
central <strong>Tiquipaya</strong> were <strong>the</strong> spr<strong>in</strong>g discharge is probably <strong>the</strong> same. Based on this area and <strong>the</strong><br />
average flow <strong>the</strong> total discharge from <strong>the</strong> spr<strong>in</strong>gs is estimated to be 2.200.527 m³/year (See<br />
Appendix).<br />
Bachelor’s Degree Project - A <strong>conceptual</strong> <strong>model</strong> <strong>of</strong> <strong>the</strong> <strong>aquifer</strong> <strong>in</strong> <strong>Tiquipaya</strong>, <strong>Bolivia</strong> 26(52)<br />
<strong>KTH</strong> - Royal Institute <strong>of</strong> Technology - Stockholm 2005
The number <strong>of</strong> wells <strong>in</strong> <strong>Tiquipaya</strong> is very uncerta<strong>in</strong>. There is a list <strong>of</strong> registered well <strong>in</strong> <strong>the</strong><br />
Cochabamba valley and out <strong>of</strong> <strong>the</strong>se 1140 wells, 101 are situated <strong>in</strong> <strong>Tiquipaya</strong>. The depth,<br />
flow and type <strong>of</strong> use is only def<strong>in</strong>ed <strong>in</strong> some cases, but based on this data we got an average<br />
flow <strong>of</strong> 2,31 l/s for <strong>the</strong> 101 registered wells. From ano<strong>the</strong>r study (Agencia Técnica, 2004) 37<br />
more wells with an average flow <strong>of</strong> 3,16 l/s were added. This adds up to an average discharge<br />
<strong>of</strong> 11.044.853 m³/year from <strong>the</strong> wells <strong>in</strong> <strong>Tiquipaya</strong>.<br />
In Kanarancho and L<strong>in</strong>de <strong>the</strong>re are more specific data over <strong>the</strong> private wells <strong>in</strong> <strong>the</strong> areas. If we<br />
assume that <strong>the</strong> frequency <strong>of</strong> wells is <strong>the</strong> same <strong>in</strong> <strong>the</strong> lower part <strong>of</strong> <strong>the</strong> municipality and 66%<br />
<strong>in</strong> <strong>the</strong> upper part, this would mean an additional 357 wells. The flow would be 28.580.130<br />
m³/year. The data from L<strong>in</strong>de and Kanrancho describes that <strong>the</strong> wells for domestic use are<br />
shallow 3-12 m and <strong>the</strong>y run dry quite easily (Peñarrieta, Vega, 2004). Because <strong>of</strong> <strong>the</strong>se facts<br />
we reduced <strong>the</strong> flow from <strong>the</strong> wells with a percentage based on <strong>the</strong> flow variation from <strong>the</strong><br />
spr<strong>in</strong>gs. This value for all <strong>the</strong> wells, <strong>in</strong>clud<strong>in</strong>g <strong>the</strong> 138 registered wells, is 20.641.174 m³/year.<br />
As a comparison we have used data on water sources (Agencia Técnica, 2004). 4% <strong>of</strong> <strong>the</strong><br />
water is taken from spr<strong>in</strong>gs, 74% from wells and 22% from o<strong>the</strong>r sources such as rivers etc.<br />
Based on this data <strong>the</strong> number <strong>of</strong> wells should be 473 and we calculated on 495, which is<br />
accurate enough.<br />
Bachelor’s Degree Project - A <strong>conceptual</strong> <strong>model</strong> <strong>of</strong> <strong>the</strong> <strong>aquifer</strong> <strong>in</strong> <strong>Tiquipaya</strong>, <strong>Bolivia</strong> 27(52)<br />
<strong>KTH</strong> - Royal Institute <strong>of</strong> Technology - Stockholm 2005
Irrigation<br />
Water for irrigation is a big problem <strong>in</strong> <strong>Tiquipaya</strong>. If it was not for irrigation <strong>the</strong>y would not<br />
lack water <strong>in</strong> <strong>the</strong> municipality. The amount <strong>of</strong> potable water is estimated to be 100<br />
l/person/day. In <strong>Tiquipaya</strong> with about 60000 residents, this adds up to 2,2 million m³/year.<br />
The amount <strong>of</strong> irrigation water for an area as big as <strong>Tiquipaya</strong>, 1,8 km², is 11 million m³/year<br />
(Ricaldi et al, 1989). The <strong>aquifer</strong> can not supply this amount <strong>of</strong> water, so most <strong>of</strong> <strong>the</strong><br />
irrigation water is taken from o<strong>the</strong>r catchment areas or from lakes <strong>in</strong> <strong>the</strong> mounta<strong>in</strong>s. In an area<br />
similar to <strong>Tiquipaya</strong> <strong>the</strong>y have estimated <strong>the</strong> discharge from <strong>the</strong> <strong>aquifer</strong> for irrigation purpose<br />
to be 3,6 million m³/year (Ricaldi et al, 1989). In our calculations we have not separated water<br />
for domestic use from <strong>the</strong> irrigation water. We have based <strong>the</strong> calculations on <strong>the</strong> flow from<br />
<strong>the</strong> wells and spr<strong>in</strong>gs, and not taken <strong>the</strong> type <strong>of</strong> use <strong>in</strong>to consideration.<br />
Land use<br />
<strong>Tiquipaya</strong> is an agricultural municipality. Except for <strong>the</strong> urban areas <strong>the</strong>re is agriculture <strong>in</strong> <strong>the</strong><br />
whole municipality. Approximately 50 % <strong>of</strong> <strong>the</strong> districts 4, 5 and 6 is agricultural (Fig 15).<br />
Just north <strong>of</strong> <strong>the</strong> town centre <strong>the</strong>re are some areas with semi-<strong>in</strong>tensive agriculture and urbanagriculture.<br />
Along <strong>the</strong> mounta<strong>in</strong> foot and <strong>the</strong> rivers <strong>the</strong> areas are def<strong>in</strong>ed as degraded or<br />
temporal agriculture, due to <strong>the</strong> return<strong>in</strong>g floods. The rest <strong>of</strong> <strong>the</strong> municipality south-west <strong>of</strong><br />
<strong>the</strong> town centre is def<strong>in</strong>ed by <strong>in</strong>tense agriculture all around <strong>the</strong> year.<br />
Stratigraphy<br />
Figure 15. Map <strong>of</strong> land use <strong>in</strong> <strong>the</strong> valley- and mounta<strong>in</strong> area <strong>of</strong> <strong>Tiquipaya</strong><br />
There are three sedimentary bodies <strong>in</strong> <strong>the</strong> Cochabamba valley whose thickness exceeds 300m.<br />
The <strong>aquifer</strong> <strong>in</strong> <strong>Tiquipaya</strong> is one <strong>of</strong> <strong>the</strong>m with a thickness <strong>of</strong> 450m (Fig 16) (Olivera,<br />
Neumann-Redl<strong>in</strong>, 1997). There have been resistivity tests <strong>in</strong> <strong>the</strong> valley to determ<strong>in</strong>e <strong>the</strong><br />
topography and geometry <strong>of</strong> <strong>the</strong> Ordovician basement and <strong>of</strong> <strong>the</strong> Quarternay fill<strong>in</strong>gs. In<br />
<strong>Tiquipaya</strong> <strong>the</strong> basement is at 1600 m.a.s.l and <strong>the</strong> fill<strong>in</strong>gs are 800 m thick. However <strong>the</strong> data<br />
show considerable irregularity, probably due to electromagnetic disturbances such as power<br />
Bachelor’s Degree Project - A <strong>conceptual</strong> <strong>model</strong> <strong>of</strong> <strong>the</strong> <strong>aquifer</strong> <strong>in</strong> <strong>Tiquipaya</strong>, <strong>Bolivia</strong> 28(52)<br />
<strong>KTH</strong> - Royal Institute <strong>of</strong> Technology - Stockholm 2005
l<strong>in</strong>es, telephone l<strong>in</strong>es, radiobroadcast<strong>in</strong>g antennas, metallic fences, etc. The curves <strong>in</strong> many<br />
cases have not been adapted to <strong>the</strong> field values, <strong>the</strong>refore <strong>the</strong> reliability <strong>of</strong> <strong>the</strong> data is not<br />
always complete (Renner, Velasco, 2000).<br />
The productivity <strong>of</strong> <strong>the</strong> different <strong>aquifer</strong>s is not absolutely verified. As a part <strong>of</strong> a plan to<br />
supply <strong>the</strong> City <strong>of</strong> Cochabamba with potable water <strong>in</strong> 1994, <strong>the</strong>y carried out three deep well<br />
pump<strong>in</strong>g tests and one were <strong>in</strong> <strong>Tiquipaya</strong>. The report <strong>of</strong> <strong>the</strong> perforation works shows two<br />
large sets <strong>of</strong> strata <strong>of</strong> favorable characteristics for exploitation. The first one, reach<strong>in</strong>g 200m,<br />
consist essentially <strong>of</strong> coarse fragments, gravels and sands. The second one, until depths <strong>of</strong><br />
500m, consists <strong>of</strong> f<strong>in</strong>er sedimentation and well-def<strong>in</strong>ed clay levels (Renner, Velasco, 2000).<br />
Figure 16. Hydrogeologic section<br />
The follow<strong>in</strong>g units can be identified (Renner, Velasco, 2000):<br />
0 -216 m coarse fragments, gravels and sands<br />
216-239 m first clayey zone<br />
239-305 m levels <strong>of</strong> gravels with <strong>in</strong>tercalation <strong>of</strong> clayey horizons<br />
305-325 m second clayey zone<br />
325-395 m alternance <strong>of</strong> levels <strong>of</strong> gravels and sand<br />
395-447 m gravel and sands with <strong>in</strong>tercalation <strong>of</strong> clayey levels<br />
447-503 m alternance <strong>of</strong> gravels and sands<br />
Bachelor’s Degree Project - A <strong>conceptual</strong> <strong>model</strong> <strong>of</strong> <strong>the</strong> <strong>aquifer</strong> <strong>in</strong> <strong>Tiquipaya</strong>, <strong>Bolivia</strong> 29(52)<br />
<strong>KTH</strong> - Royal Institute <strong>of</strong> Technology - Stockholm 2005
The first lithological set down to 216 m is a potentially good source for exploitation.<br />
<strong>Tiquipaya</strong> was not <strong>in</strong>terest<strong>in</strong>g for deep well production because <strong>of</strong> <strong>the</strong> presumed problems <strong>of</strong><br />
pollution <strong>in</strong> <strong>the</strong> superficial levels <strong>of</strong> <strong>the</strong> <strong>aquifer</strong> and <strong>the</strong> possible <strong>in</strong>terference with wells <strong>of</strong> low<br />
depth. The <strong>aquifer</strong> is hidraulically <strong>in</strong>terconnected (Stimson et al, 1992) so <strong>in</strong>terference would<br />
have become evident sooner or later.<br />
The second group <strong>of</strong> layers also seems to have <strong>in</strong>terest<strong>in</strong>g <strong>aquifer</strong> characteristics, but from <strong>the</strong><br />
beg<strong>in</strong>n<strong>in</strong>g <strong>the</strong> flow rates were very low. Every time <strong>the</strong> well was opened and pumped via<br />
compressed air <strong>the</strong> water at first conta<strong>in</strong>ed much bentonite, <strong>the</strong>n became clearer and later<br />
turned muddy aga<strong>in</strong>. Dur<strong>in</strong>g pump<strong>in</strong>g tests, significant well losses were observed and it<br />
became clear that <strong>the</strong> construction <strong>of</strong> <strong>the</strong> well was deficient. The losses also made it<br />
impossible to determ<strong>in</strong>e <strong>the</strong> hydraulic parameter <strong>of</strong> <strong>the</strong> <strong>aquifer</strong>. A pump was <strong>in</strong>stalled and <strong>the</strong><br />
flow stabilized at 15 l/s, with peaks at 20 l/s and with a drawdown at 179-180 m. The pumped<br />
water cont<strong>in</strong>ued to be turbid and <strong>the</strong> flow rate low. This proved that <strong>the</strong> well was not<br />
completely developed, and it was shut down.<br />
From <strong>the</strong> deep drill<strong>in</strong>g we draw <strong>the</strong> conclusion that <strong>the</strong> hydrogeological conditions <strong>in</strong><br />
<strong>Tiquipaya</strong> is not favorable for <strong>the</strong> exploitation <strong>of</strong> deep groundwater. The hydraulic<br />
conductivity decreases with depth and <strong>the</strong> <strong>in</strong>creas<strong>in</strong>g amount <strong>of</strong> clay, which means that <strong>the</strong><br />
yield <strong>of</strong> <strong>the</strong> wells is generally lower than <strong>in</strong> <strong>the</strong> upper part <strong>of</strong> <strong>the</strong> <strong>aquifer</strong>. For <strong>the</strong> same reasons<br />
<strong>the</strong> recharge <strong>in</strong> <strong>the</strong> lower part is slower and might lead to decreas<strong>in</strong>g pump<strong>in</strong>g rates. The high<br />
contents <strong>of</strong> iron and magnesium <strong>in</strong> <strong>the</strong> deep <strong>aquifer</strong> would also need treatment before<br />
distribution for human consumption.<br />
Water balance<br />
To understand <strong>the</strong> possible variation <strong>in</strong> <strong>the</strong> <strong>aquifer</strong> reserve we have done several calculations<br />
(See Appendix). In those calculations one variable is <strong>the</strong> evapotranspiration. The<br />
evapotranspiration used is 490 mm/year (Renner&Velasco, 2000) and 25% <strong>of</strong> <strong>the</strong> average<br />
precipitation (Promic). This gives us a probable <strong>in</strong>terval <strong>of</strong> run <strong>of</strong>f, after subtract<strong>in</strong>g <strong>the</strong><br />
evapotranspiration, <strong>of</strong> 29.41 – 34.73 million m³/year.<br />
We have made one water balance calculation based on estimations made by Ricaldi et al,<br />
1989. The <strong>in</strong>filtration to <strong>the</strong> <strong>aquifer</strong> <strong>in</strong> <strong>the</strong> valley is estimated to be 25% <strong>of</strong> <strong>the</strong> run <strong>of</strong>f from<br />
<strong>the</strong> watersheds. There is also an addition to <strong>the</strong> <strong>aquifer</strong> from <strong>the</strong> precipitation <strong>in</strong> <strong>the</strong> valley.<br />
The precipitation is approx. 500mm/year and <strong>the</strong> municipality covers an area <strong>of</strong> 18 km² <strong>in</strong> <strong>the</strong><br />
valley. Of this amount <strong>of</strong> water 15% <strong>in</strong>filtrates, <strong>in</strong>clud<strong>in</strong>g <strong>the</strong> loss as evapotranspiration.<br />
The irrigation water also contributes to <strong>the</strong> <strong>aquifer</strong> reserve. This is an addition to <strong>the</strong> balance<br />
s<strong>in</strong>ce <strong>the</strong> water orig<strong>in</strong>ates from watersheds outside <strong>of</strong> <strong>the</strong> valley. Based on <strong>the</strong> same study <strong>the</strong><br />
amount that <strong>in</strong>filtrates from <strong>the</strong> irrigation water is 25%.<br />
As <strong>aquifer</strong> discharge 3,6 million m³/year and 48% <strong>of</strong> <strong>the</strong> possible recharge is used for<br />
irrigation. There is also discharge for domestic use. This is based on a population <strong>of</strong> 60 000<br />
people and an average domestic use <strong>of</strong> 100 l/person/day. A balance with <strong>the</strong>se variables gives<br />
us an <strong>aquifer</strong> reserve with<strong>in</strong> <strong>the</strong> <strong>in</strong>terval <strong>of</strong> 1.18 -1.87 million m³/year (Fig 17).<br />
The second balance is based on <strong>the</strong> same precipitation, evapotranspiration and recharge<br />
assumptions. As discharge we have used our estimations <strong>of</strong> flow from spr<strong>in</strong>gs and wells. The<br />
number <strong>of</strong> spr<strong>in</strong>gs and flow rate is accord<strong>in</strong>g to <strong>the</strong> description <strong>in</strong> chapter Discharge. The<br />
discharge from <strong>the</strong> wells is based on <strong>the</strong> 138 registered wells and <strong>the</strong>ir average flow. We also<br />
Bachelor’s Degree Project - A <strong>conceptual</strong> <strong>model</strong> <strong>of</strong> <strong>the</strong> <strong>aquifer</strong> <strong>in</strong> <strong>Tiquipaya</strong>, <strong>Bolivia</strong> 30(52)<br />
<strong>KTH</strong> - Royal Institute <strong>of</strong> Technology - Stockholm 2005
<strong>in</strong>cluded <strong>the</strong> 357 assumed wells <strong>in</strong> this balance. Total number <strong>of</strong> wells is 495. The average<br />
flow rate is not probable to flow all trough <strong>the</strong> year, so <strong>the</strong>refore we have adjusted <strong>the</strong><br />
discharge with a year variation. The adjustment is accord<strong>in</strong>g to <strong>the</strong> year variation <strong>of</strong> <strong>the</strong> flow<br />
rate from <strong>the</strong> spr<strong>in</strong>gs. In this balance <strong>the</strong> reserve is negative, with<strong>in</strong> <strong>the</strong> <strong>in</strong>terval <strong>of</strong> (-9.43) – (-<br />
8.10) million m³/year (Fig 17).<br />
The third balance is made as a comparison between <strong>the</strong> first and <strong>the</strong> second balance. In this<br />
balance <strong>the</strong> amount <strong>of</strong> recharge is as mentioned above. The discharge is based on <strong>the</strong><br />
estimated number <strong>of</strong> spr<strong>in</strong>gs and on registered wells with no year variation. Total number <strong>of</strong><br />
wells 138. With <strong>the</strong>se variables <strong>the</strong> reserve is with<strong>in</strong> <strong>the</strong> <strong>in</strong>terval <strong>of</strong> 0,17 – 1,50 million<br />
m³/year (Fig 17).<br />
Figure 17. Illustration <strong>of</strong> water balances<br />
In <strong>the</strong>se different calculations <strong>the</strong> only variable that is based on sufficient data is <strong>the</strong><br />
precipitation. When <strong>the</strong> evapotranspiration is subtracted from <strong>the</strong> precipitation <strong>the</strong> run<strong>of</strong>f<br />
turns <strong>in</strong> to an assumption based on values <strong>of</strong> estimated evapotranspiration. There is no<br />
<strong>in</strong>formation on how <strong>the</strong>se values were calculated, so <strong>the</strong>re is a possibility that <strong>the</strong>y are<br />
<strong>in</strong>correct.<br />
The percentages for <strong>in</strong>filtration are estimations made by Ricaldi et al, 1989. In <strong>the</strong> first<br />
calculation we have used all <strong>of</strong> <strong>the</strong> assumptions made by Ricaldi et al, 1989. There is no<br />
<strong>in</strong>formation on any <strong>of</strong> <strong>the</strong>se assumptions, except that <strong>the</strong>y were made <strong>in</strong> 1989. We do not rely<br />
on <strong>the</strong>se assumptions because <strong>the</strong>y are old and <strong>the</strong> facts <strong>the</strong>y are based on are not accounted<br />
for. We have still used <strong>the</strong>se estimations <strong>in</strong> <strong>the</strong> balance because <strong>the</strong>re are no o<strong>the</strong>r reliable<br />
<strong>in</strong>put data. In <strong>the</strong> second calculation <strong>the</strong> discharge is based on our estimations <strong>of</strong> wells and<br />
flow variation. We know for at fact that <strong>the</strong>re are more wells <strong>the</strong>n <strong>the</strong> ones registered, but<br />
<strong>the</strong>re is no <strong>in</strong>formation on how many. It is possible that we have assumed too many wells and<br />
that some <strong>of</strong> our estimations are <strong>in</strong>correct. But based on <strong>the</strong> facts we know, <strong>the</strong> second<br />
balance is more likely to be truthful.<br />
There is a big variation between <strong>the</strong> water balance <strong>in</strong> <strong>the</strong> first and <strong>the</strong> second calculation. To<br />
compare <strong>the</strong>se two we did <strong>the</strong> third balance. In this calculation we only used <strong>the</strong> registered<br />
wells, which we know are too few. The third balance showed an amount <strong>of</strong> water reserve<br />
between <strong>the</strong> amounts <strong>of</strong> <strong>the</strong> first- and <strong>the</strong> second balance. S<strong>in</strong>ce we know that <strong>the</strong> reserve <strong>in</strong><br />
<strong>the</strong> third balance should be less, this supports our assumptions that <strong>the</strong> <strong>aquifer</strong> reserve is<br />
decreas<strong>in</strong>g.<br />
Bachelor’s Degree Project - A <strong>conceptual</strong> <strong>model</strong> <strong>of</strong> <strong>the</strong> <strong>aquifer</strong> <strong>in</strong> <strong>Tiquipaya</strong>, <strong>Bolivia</strong> 31(52)<br />
<strong>KTH</strong> - Royal Institute <strong>of</strong> Technology - Stockholm 2005
Conceptual <strong>model</strong><br />
The exact extension <strong>of</strong> <strong>the</strong> <strong>aquifer</strong> is hard to know. There have been <strong>in</strong>vestigations <strong>of</strong><br />
transmissibility, <strong>the</strong> piezometric basement and o<strong>the</strong>r hydrogeologic facts. The <strong>aquifer</strong> limits<br />
are not def<strong>in</strong>ed but <strong>the</strong> thickest part is north <strong>of</strong> <strong>Tiquipaya</strong> centre and it decreases from <strong>the</strong>re.<br />
The whole valley is considered to be one large system. In <strong>Tiquipaya</strong> <strong>the</strong> groundwater flow is<br />
towards <strong>the</strong> south and not towards <strong>the</strong> o<strong>the</strong>r sedimentary bodies <strong>of</strong> wide thickness (Fig 18).<br />
We can assume that <strong>the</strong> groundwater level has a large variation dur<strong>in</strong>g <strong>the</strong> year. The variation<br />
is connected to <strong>the</strong> ra<strong>in</strong> periods. The groundwater level subsides dur<strong>in</strong>g <strong>the</strong> dry period and it<br />
does not rise aga<strong>in</strong> until after <strong>the</strong> ra<strong>in</strong> period. The most <strong>in</strong>tense ra<strong>in</strong> period is <strong>in</strong> January and<br />
<strong>the</strong> spr<strong>in</strong>gs have <strong>the</strong>ir highest flow rate <strong>in</strong> April so <strong>the</strong> delay for <strong>the</strong> ra<strong>in</strong>water to reach <strong>the</strong><br />
<strong>aquifer</strong> is approximately 2-3 months. The signs <strong>of</strong> this groundwater level variation are <strong>the</strong><br />
wells and spr<strong>in</strong>gs that run dry dur<strong>in</strong>g large parts <strong>of</strong> <strong>the</strong> year.<br />
There is no field <strong>in</strong>vestigation data on <strong>the</strong> groundwater level. We know that most <strong>of</strong> <strong>the</strong> wells<br />
are 3-10 m deep and that <strong>the</strong>re are flow<strong>in</strong>g spr<strong>in</strong>gs. Based on <strong>the</strong>se facts we can assume that<br />
<strong>the</strong> groundwater level is near <strong>the</strong> surface.<br />
Based on <strong>the</strong> water balances we believe that <strong>the</strong> water reserve is decreas<strong>in</strong>g. The year<br />
variation carries on but <strong>the</strong> groundwater level does not rise to its normal level after <strong>the</strong> ra<strong>in</strong><br />
period. This could be <strong>of</strong> natural cause, for example caused by many years <strong>of</strong> drought, but <strong>the</strong><br />
amount <strong>of</strong> precipitation has been normal to higher over <strong>the</strong> last 10 years. S<strong>in</strong>ce <strong>the</strong> habitants<br />
have noticed a decreas<strong>in</strong>g amount <strong>of</strong> flow <strong>in</strong> <strong>the</strong> spr<strong>in</strong>gs <strong>the</strong> conclusion is that <strong>the</strong><br />
groundwater level is s<strong>in</strong>k<strong>in</strong>g.<br />
Figure 18. Conceptual <strong>model</strong><br />
Bachelor’s Degree Project - A <strong>conceptual</strong> <strong>model</strong> <strong>of</strong> <strong>the</strong> <strong>aquifer</strong> <strong>in</strong> <strong>Tiquipaya</strong>, <strong>Bolivia</strong> 32(52)<br />
<strong>KTH</strong> - Royal Institute <strong>of</strong> Technology - Stockholm 2005
Quality<br />
Threats and pollution<br />
Irrigation with residual water<br />
In some areas <strong>of</strong> <strong>Tiquipaya</strong> <strong>the</strong> residual water is used for irrigation. In <strong>the</strong> community <strong>of</strong><br />
Bruno Moqho <strong>the</strong>y use <strong>the</strong> domestic sewage water from <strong>the</strong> urban centre <strong>of</strong> <strong>Tiquipaya</strong>. The<br />
residual water is led to a small river without treatment and <strong>the</strong> farmers use it mostly for <strong>the</strong>ir<br />
parsley and sp<strong>in</strong>ach cultivations (Fig 19). Because <strong>of</strong> <strong>the</strong> lack <strong>of</strong> water <strong>the</strong> farmers use <strong>the</strong><br />
residual water without consider<strong>in</strong>g <strong>the</strong> risks. The soil and <strong>the</strong> groundwater will be<br />
contam<strong>in</strong>ated and <strong>the</strong> consumers are exposed to a health risk.<br />
Figure 19. Parsley and sp<strong>in</strong>ach irrigated with residual water <strong>in</strong> Bruno Moqho<br />
In Chiquicollo <strong>the</strong>re is a similar problem with residual water. It is led to <strong>the</strong> area by <strong>the</strong><br />
irrigation system SNR-1. When <strong>the</strong> system is not filled with clean irrigation water, it is filled<br />
with sewage water and garbage from <strong>the</strong> north part <strong>of</strong> <strong>the</strong> Cochabamba City. The sewage<br />
from <strong>the</strong> urban areas El Carmen and Cruce Taquiña is also led to Chiquicollo (Ampuero,<br />
Mondaca, 2005).<br />
The usage <strong>of</strong> fertilizers <strong>in</strong> <strong>the</strong> agriculture<br />
The usage <strong>of</strong> fertilizers <strong>in</strong> <strong>the</strong> agriculture is a problem especially <strong>in</strong> <strong>the</strong> nor<strong>the</strong>rn parts where<br />
<strong>the</strong> permeability is higher. They use nitrogen based fertilizers, pesticides and fungicides.<br />
There is a high risk that <strong>the</strong> chemicals will reach <strong>the</strong> <strong>aquifer</strong>. The nitrogen levels <strong>in</strong> <strong>the</strong><br />
groundwater are with<strong>in</strong> <strong>the</strong> established limits, but <strong>the</strong>re has been no <strong>in</strong>vestigation on <strong>the</strong> o<strong>the</strong>r<br />
chemicals used <strong>in</strong> <strong>the</strong> agriculture.<br />
The usage <strong>of</strong> detergents<br />
The habitants <strong>in</strong> <strong>Tiquipaya</strong> use <strong>the</strong> rivers for wash<strong>in</strong>g both clo<strong>the</strong>s and cars. The usage <strong>of</strong><br />
detergents overfeeds <strong>the</strong> soil and <strong>the</strong> wash<strong>in</strong>g <strong>of</strong> cars lets out chemicals. Detergents also make<br />
<strong>the</strong> water less suit<strong>in</strong>g for dr<strong>in</strong>k<strong>in</strong>g. The rivers have been used for wash<strong>in</strong>g for hundreds <strong>of</strong><br />
years so this problem is not easy to overcome. In <strong>the</strong> mounta<strong>in</strong> area <strong>the</strong> habitants wash <strong>the</strong>ir<br />
clo<strong>the</strong>s just up streams <strong>of</strong> <strong>the</strong> canals which supply <strong>the</strong> town with potable water (Fig 20). The<br />
municipality has taken action on this problem and forbidden <strong>the</strong> usage <strong>of</strong> detergents. The<br />
people do not follow <strong>the</strong> municipality’s recommendations or <strong>the</strong> signs along <strong>the</strong> river that<br />
forbid <strong>the</strong> usage <strong>of</strong> detergents (Ampuero, Mondaca, 2005).<br />
Bachelor’s Degree Project - A <strong>conceptual</strong> <strong>model</strong> <strong>of</strong> <strong>the</strong> <strong>aquifer</strong> <strong>in</strong> <strong>Tiquipaya</strong>, <strong>Bolivia</strong> 33(52)<br />
<strong>KTH</strong> - Royal Institute <strong>of</strong> Technology - Stockholm 2005
Figure 20. Man wash<strong>in</strong>g clo<strong>the</strong>s <strong>in</strong> <strong>the</strong> river Khora and sign<br />
say<strong>in</strong>g “Forbidden to wash clo<strong>the</strong>s”<br />
Residual products from chicha production and slaughter houses<br />
In <strong>the</strong> Kanarancho area <strong>the</strong>re are contam<strong>in</strong>ation problems due to chicha production and<br />
slaughterhouses. Chicha is a traditional beer made <strong>of</strong> corn and <strong>the</strong> rest products from <strong>the</strong><br />
production is acid. The rest products are not treated and <strong>the</strong>refore <strong>the</strong> soil <strong>in</strong> <strong>the</strong> area is turn<strong>in</strong>g<br />
to acid for cultivations, average pH 5. The rest products from <strong>the</strong> slaughter house is led away<br />
<strong>in</strong> open canals and mixed with residual water. This is an health risk and it is molest<strong>in</strong>g <strong>the</strong><br />
neighbors.<br />
In Collpapampa <strong>the</strong>re is a chicken slaughterhouse, which <strong>in</strong>volve <strong>the</strong> same problems as<br />
mentioned above. The slaughter house is situated <strong>in</strong> <strong>the</strong> recharge zone for <strong>the</strong> <strong>aquifer</strong> so <strong>the</strong><br />
vulnerability risk is even higher than <strong>in</strong> Kanarancho.<br />
Situated just besides <strong>the</strong> Khora river is <strong>the</strong> municipal slaughterhouse, which tend to<br />
approximately 70 cattle per week. There is no treatment plant so <strong>the</strong> residual water is lead<br />
50m to a lagoon (Fig 21). The lagoon is situated on <strong>the</strong> riverbed so <strong>the</strong> <strong>in</strong>filtration from <strong>the</strong><br />
lagoon is very high (Ampuero, Mondaca, 2005).<br />
Figure 21. Residual water canal from <strong>the</strong> municipal slaughterhouse and <strong>the</strong> <strong>in</strong>filtration lagoon<br />
Bachelor’s Degree Project - A <strong>conceptual</strong> <strong>model</strong> <strong>of</strong> <strong>the</strong> <strong>aquifer</strong> <strong>in</strong> <strong>Tiquipaya</strong>, <strong>Bolivia</strong> 34(52)<br />
<strong>KTH</strong> - Royal Institute <strong>of</strong> Technology - Stockholm 2005
The Taquiña brewery<br />
There is no available data on <strong>the</strong> Taquiña brewery. We have not considered <strong>the</strong> fact that <strong>the</strong><br />
Taquiña brewery uses water for <strong>the</strong>ir beer production. The water is led directly to <strong>the</strong> brewery<br />
from a lake and a river which belong to our <strong>in</strong>vestigation area to <strong>the</strong> brewery. The direct<br />
effect that <strong>the</strong> brewery has on <strong>the</strong> area is a smaller amount <strong>of</strong> water. The river flow is used for<br />
beer production <strong>in</strong>stead <strong>of</strong> <strong>aquifer</strong> recharge and domestic use. We also received verbal<br />
<strong>in</strong>formation that <strong>the</strong> tanks <strong>in</strong> <strong>the</strong> brewery are cleaned with lye. The handl<strong>in</strong>g <strong>of</strong> <strong>the</strong> residual<br />
water from <strong>the</strong> clean<strong>in</strong>g process is unknown.<br />
Garbage<br />
Domestic garbage is one <strong>of</strong> <strong>the</strong> pr<strong>in</strong>cipal environmental problems <strong>in</strong> <strong>Tiquipaya</strong>. In <strong>the</strong> City <strong>of</strong><br />
Cochabamba only 64,7% have access to municipal garbage disposal service. The rem<strong>in</strong>der <strong>of</strong><br />
<strong>the</strong> rubbish is disposed <strong>in</strong> <strong>the</strong> countryside, rivers or <strong>in</strong> wild garbage heaps, constitut<strong>in</strong>g<br />
potential focal po<strong>in</strong>ts for <strong>the</strong> contam<strong>in</strong>ation <strong>of</strong> <strong>the</strong> shallow groundwater (Olivera, Neumann-<br />
Redl<strong>in</strong>, 1997). In <strong>Tiquipaya</strong> <strong>the</strong> municipal garbage is dumped <strong>in</strong> <strong>the</strong> river bed just below <strong>the</strong><br />
<strong>in</strong>tersection <strong>of</strong> <strong>the</strong> river Khora-<strong>Tiquipaya</strong> and Chuta Kawa (Fig 22-23). The problem is<br />
grow<strong>in</strong>g with <strong>the</strong> population and <strong>the</strong> municipality’s <strong>in</strong>ability to f<strong>in</strong>d a solution. The riverbeds<br />
are important groundwater recharge zones, so <strong>the</strong> garbage presents a high vulnerability risk<br />
for <strong>the</strong> <strong>aquifer</strong>. Accord<strong>in</strong>g to Negowat (Ampuero, Mondaca, 2005) <strong>the</strong> daily deposit is<br />
approximately 10 tons.<br />
Figure 22. The municipality’s garbage dump on <strong>the</strong> riverbed <strong>of</strong> Khora-<strong>Tiquipaya</strong><br />
Bachelor’s Degree Project - A <strong>conceptual</strong> <strong>model</strong> <strong>of</strong> <strong>the</strong> <strong>aquifer</strong> <strong>in</strong> <strong>Tiquipaya</strong>, <strong>Bolivia</strong> 35(52)<br />
<strong>KTH</strong> - Royal Institute <strong>of</strong> Technology - Stockholm 2005
Figure 23. View downstream from <strong>the</strong> garbage dump. In <strong>the</strong> background is <strong>the</strong> elevated tank<br />
<strong>of</strong> COAPAT, Comity <strong>of</strong> potable water and sewage disposal <strong>in</strong> <strong>Tiquipaya</strong><br />
Sewage disposal system and latr<strong>in</strong>es<br />
The centre <strong>of</strong> <strong>Tiquipaya</strong> has a sewage disposal system for 4000 habitants, but not an adequate<br />
treatment plant. They use a Imh<strong>of</strong>f tank, which only treats 20% <strong>of</strong> <strong>the</strong> residual water. In <strong>the</strong><br />
rest <strong>of</strong> <strong>the</strong> municipality <strong>the</strong> habitants solve <strong>the</strong> problem by construct<strong>in</strong>g latr<strong>in</strong>es and septic<br />
tanks. S<strong>in</strong>ce <strong>the</strong> soil is so permeable <strong>in</strong> <strong>the</strong> nor<strong>the</strong>rn part <strong>the</strong> septic tanks and latr<strong>in</strong>es create<br />
contam<strong>in</strong>ation po<strong>in</strong>ts for <strong>the</strong> groundwater. This water is used without treatment <strong>in</strong> <strong>the</strong><br />
sou<strong>the</strong>rn parts. The septic tanks and latr<strong>in</strong>es <strong>in</strong> <strong>the</strong> sou<strong>the</strong>rn parts cause big problems dur<strong>in</strong>g<br />
<strong>the</strong> ra<strong>in</strong> period. In <strong>the</strong>se parts <strong>the</strong> groundwater level is closer to <strong>the</strong> ground so when <strong>the</strong> level<br />
rises <strong>the</strong> latr<strong>in</strong>es and septic tanks easily get flooded. This may cause floods <strong>of</strong> contam<strong>in</strong>ated<br />
water towards <strong>the</strong> superficial water reserves. A similar problem occurs <strong>in</strong> <strong>the</strong> mounta<strong>in</strong> area.<br />
The ra<strong>in</strong>water <strong>in</strong>filtrates <strong>the</strong> latr<strong>in</strong>es and <strong>the</strong>n cont<strong>in</strong>ues with <strong>the</strong> residual water straight out <strong>in</strong><br />
to <strong>the</strong> river. The river is <strong>the</strong>n used as domestic water without treatment <strong>in</strong> <strong>the</strong> nor<strong>the</strong>rn part<br />
and <strong>the</strong> centre <strong>of</strong> <strong>Tiquipaya</strong> (Ampuero, Mondaca, 2005).<br />
Contam<strong>in</strong>ation due to traffic<br />
There is one highly trafficked road, Avenida Ecologica, go<strong>in</strong>g through <strong>Tiquipaya</strong>. S<strong>in</strong>ce <strong>the</strong><br />
vehicles <strong>in</strong> this region <strong>in</strong> general are old and <strong>in</strong> bad shape, we can assume that <strong>the</strong>re is a lot <strong>of</strong><br />
contam<strong>in</strong>ation. The road goes trough <strong>the</strong> <strong>aquifer</strong> recharge zone and <strong>the</strong>y have taken no action<br />
to control <strong>the</strong> ra<strong>in</strong>water on <strong>the</strong> road. The possible contam<strong>in</strong>ation po<strong>in</strong>ts are <strong>the</strong> exhaust-gas<br />
and <strong>the</strong> rest products from <strong>the</strong> wheels. The exhaust-gas might be a dim<strong>in</strong>ish<strong>in</strong>g problem<br />
because more and more people convert <strong>the</strong>ir cars to run on natural-gas. But on <strong>the</strong> o<strong>the</strong>r hand<br />
<strong>the</strong>re are many trucks that still run on diesel. Due to <strong>the</strong> high traffic <strong>the</strong>re are also many carworkshops<br />
that use chemicals which <strong>the</strong>y let out on <strong>the</strong> streets or with <strong>the</strong> residual water.<br />
Bachelor’s Degree Project - A <strong>conceptual</strong> <strong>model</strong> <strong>of</strong> <strong>the</strong> <strong>aquifer</strong> <strong>in</strong> <strong>Tiquipaya</strong>, <strong>Bolivia</strong> 36(52)<br />
<strong>KTH</strong> - Royal Institute <strong>of</strong> Technology - Stockholm 2005
Water quality<br />
The groundwater <strong>in</strong> <strong>the</strong> Cochabamba valley has been studied <strong>in</strong> detail by Días et al. (1955)<br />
who divided <strong>the</strong> water <strong>in</strong> three hydrochemical groups. <strong>Tiquipaya</strong> is part <strong>of</strong> group one which<br />
corresponds to <strong>the</strong> nor<strong>the</strong>rn part <strong>of</strong> <strong>the</strong> valley with <strong>the</strong> alluvial fan system. The waters are<br />
classified as magnesium-calcium bicarbonate waters. The electrical conductivity <strong>of</strong> <strong>the</strong>se<br />
waters is <strong>the</strong> lowest <strong>in</strong> <strong>the</strong> valley. The Rocha river, which is <strong>the</strong> ma<strong>in</strong> discharge from <strong>the</strong><br />
valley, has also been studied <strong>in</strong> detail and <strong>the</strong> contam<strong>in</strong>ation level is found to be high<br />
(Vergara Medrano, 2000).<br />
In <strong>Tiquipaya</strong> <strong>the</strong> Negowat project has done a diagnostic <strong>of</strong> <strong>the</strong> environmental aspects<br />
(Ampuero, Mondaca, 2005). They have identified certa<strong>in</strong> areas with a higher contam<strong>in</strong>ation<br />
level and a higher risk for <strong>the</strong> population.<br />
In <strong>Tiquipaya</strong> <strong>the</strong> technical department has carried out a study on <strong>the</strong> groundwater and<br />
superficial water <strong>in</strong> <strong>the</strong> municipality. The results are <strong>the</strong> follow<strong>in</strong>g (Ampuero, Woudstra,<br />
2005):<br />
pH<br />
In most <strong>of</strong> <strong>the</strong> tests <strong>the</strong> pH varied between 6 and 7, which means neutral. The tests <strong>in</strong>dicate<br />
that <strong>the</strong> Taquiña river and <strong>the</strong> Chuta Kawa river are very slightly acidic, 6,5. The Khora river<br />
is also slightly acidic, 6. The Khora river is not with<strong>in</strong> <strong>the</strong> regional recommended levels, 6,5-<br />
8,5. All <strong>the</strong> tests are with<strong>in</strong> <strong>the</strong> recommendations from <strong>the</strong> National Environmental Law and<br />
<strong>the</strong>y serve as bacterial dis<strong>in</strong>fectants s<strong>in</strong>ce <strong>the</strong>y are below pH 8. There is a small difference<br />
between <strong>the</strong> superficial- and groundwater tests, where <strong>the</strong> first tests are more acid and <strong>the</strong><br />
second more neutral.<br />
Electrical conductivity<br />
At <strong>the</strong> observation po<strong>in</strong>ts <strong>the</strong> electrical conductivity vary between 68.8 and 373 µmhos/cm,<br />
present<strong>in</strong>g <strong>the</strong> lowest values <strong>in</strong> <strong>the</strong> superficial waters and <strong>the</strong> highest <strong>in</strong> <strong>the</strong> groundwater. In<br />
<strong>the</strong> groundwater fur<strong>the</strong>r north <strong>the</strong> value is lower than <strong>in</strong> <strong>the</strong> south. This can be expla<strong>in</strong>ed by<br />
<strong>the</strong> fact that <strong>the</strong> nor<strong>the</strong>rn part <strong>of</strong> <strong>the</strong> <strong>aquifer</strong> is situated just below <strong>the</strong> recharge zones and <strong>the</strong><br />
<strong>in</strong>filtrat<strong>in</strong>g superficial water does not pass through complex geological strata. All <strong>the</strong><br />
measured values are with<strong>in</strong> <strong>the</strong> recommended limits.<br />
Turbidity<br />
Turbidity is produced by <strong>the</strong> presence <strong>of</strong> organic and <strong>in</strong>organic particles <strong>in</strong> <strong>the</strong> water.<br />
Turbidity over 5 UNT is visible for <strong>the</strong> consumer. High turbidity is not dangerous for <strong>the</strong><br />
consumer, except for when <strong>the</strong> particles are live patogenic microorganisms. Turbidity is a<br />
very important parameter because <strong>of</strong> <strong>the</strong> estetic aspect. For <strong>the</strong> consumer turbidity is<br />
immediately l<strong>in</strong>ked to a possible contam<strong>in</strong>ation risk. The samples taken <strong>in</strong> <strong>Tiquipaya</strong> vary<br />
from 0,08 -14,3 UNT. The groundwater samples were lower than <strong>the</strong> superficial ones. The<br />
turbidity <strong>in</strong> <strong>the</strong> superficial water is directly l<strong>in</strong>ked to ra<strong>in</strong>fall and human activity along <strong>the</strong><br />
water canals.<br />
Alkal<strong>in</strong>ity<br />
The alkal<strong>in</strong>ity <strong>in</strong> water rarely exceeds 300 mg/l. High alkal<strong>in</strong>ity is not immediately dangerous<br />
for <strong>the</strong> consumer, but it gives <strong>the</strong> water a bad taste, which can lead to people reject<strong>in</strong>g <strong>the</strong><br />
water. If <strong>the</strong> alkal<strong>in</strong>ity is lower than 10 mg/l <strong>the</strong> water turns highly corrosive.<br />
Bachelor’s Degree Project - A <strong>conceptual</strong> <strong>model</strong> <strong>of</strong> <strong>the</strong> <strong>aquifer</strong> <strong>in</strong> <strong>Tiquipaya</strong>, <strong>Bolivia</strong> 37(52)<br />
<strong>KTH</strong> - Royal Institute <strong>of</strong> Technology - Stockholm 2005
The samples show that <strong>the</strong>re is a variation between <strong>the</strong> water sources. The highest values were<br />
found <strong>in</strong> <strong>the</strong> groundwater sources (122-163 mg/l), while <strong>the</strong> superficial water sources were<br />
lower (34-139 mg/l). All <strong>the</strong> values are with<strong>in</strong> <strong>the</strong> recommended limits.<br />
Hardness<br />
The hardness vary between 24-165 mg/l, present<strong>in</strong>g <strong>the</strong> lowest values <strong>in</strong> <strong>the</strong> superficial water<br />
samples and <strong>the</strong> highest <strong>in</strong> <strong>the</strong> groundwater samples. All <strong>the</strong> values are with<strong>in</strong> <strong>the</strong><br />
recommended limits. The undesirable effect <strong>of</strong> hardness is <strong>the</strong> cover<strong>in</strong>g it leaves on glas, taps<br />
etc.<br />
Iron<br />
The amount <strong>of</strong> iron is normally below 0,5 mg/l <strong>in</strong> <strong>the</strong>se k<strong>in</strong>ds <strong>of</strong> water sources. In <strong>Tiquipaya</strong><br />
<strong>the</strong> amount was 1-3 mg/l <strong>in</strong> all <strong>the</strong> samples, which is above <strong>the</strong> recommended limits. No<br />
contam<strong>in</strong>ation po<strong>in</strong>t has been identified so <strong>the</strong> high iron amount is <strong>of</strong> natural cause, <strong>the</strong><br />
geological formation. The iron causes problems concern<strong>in</strong>g <strong>the</strong> taste and smell <strong>of</strong> <strong>the</strong> water, it<br />
can also leave sta<strong>in</strong>s.<br />
Manganese<br />
The amount <strong>of</strong> manganese found <strong>in</strong> <strong>the</strong> groundwater sources was 0,06-2,36 mg/l and <strong>in</strong> <strong>the</strong><br />
superficial water sources 0,008-0,43 mg/l. Manganese can causes colorations already at <strong>the</strong><br />
concentration <strong>of</strong> 0,05 mg/l. The effects are similar to <strong>the</strong> ones <strong>of</strong> iron.<br />
The manganese contam<strong>in</strong>ation is <strong>of</strong> natural cause. Caused by groundwater from deep wells<br />
be<strong>in</strong>g <strong>in</strong> contact with rocks with high iron and manganese quantities.<br />
Nitrates<br />
Water can naturally conta<strong>in</strong> up to 1 mg/l. In <strong>Tiquipaya</strong> <strong>the</strong>re were no difference between <strong>the</strong><br />
groundwater and <strong>the</strong> superficial water samples. The quantities were 0,1-0,6 mg/l, which is<br />
with<strong>in</strong> <strong>the</strong> recommended limits. In <strong>the</strong> <strong>Tiquipaya</strong> region it is recommended that <strong>the</strong> levels <strong>of</strong><br />
nitrate are monitored. This is because <strong>of</strong> <strong>the</strong> high extent <strong>of</strong> residual water <strong>in</strong> <strong>the</strong> agriculture,<br />
lack <strong>of</strong> treatment plant and <strong>the</strong> cattle keep<strong>in</strong>g. These are activities which <strong>in</strong>crease <strong>the</strong> levels <strong>of</strong><br />
nitrates.<br />
Phosphates<br />
The concentration <strong>of</strong> phosphates <strong>in</strong> <strong>the</strong> form <strong>of</strong> orthophosphate is by natural cause rarely<br />
higher than 10 mg/l. In <strong>Tiquipaya</strong> <strong>the</strong> groundwater had concentrations <strong>of</strong> 0,06-3,05 mg/l and<br />
<strong>the</strong> superficial water 0,02-0,25 mg/l.<br />
Inorganic phosphates come from <strong>the</strong> use <strong>of</strong> detergents and fertilizers. This could be a ris<strong>in</strong>g<br />
problem <strong>in</strong> <strong>Tiquipaya</strong> and it is recommended that <strong>the</strong> concentration is monitored.<br />
Sulfates<br />
The concentration <strong>of</strong> sulfates is very vary<strong>in</strong>g by natural causes. The concentration can be as<br />
high as 200 g/l. In <strong>Tiquipaya</strong> <strong>the</strong> levels are vary<strong>in</strong>g as well. In <strong>the</strong> groundwater levels between<br />
1,5-44,02 mg/l were found. In <strong>the</strong> superficial water sources <strong>the</strong> levels were lower 5,56-14,63<br />
mg/l.<br />
Fecal coliform bacteria<br />
Fecal coliform bacteria which presence <strong>in</strong>dicates that <strong>the</strong> water may be contam<strong>in</strong>ated with<br />
human or animal wastes. Microbes <strong>in</strong> waters can cause short-term effects, such as diarrhea,<br />
cramps, nausea, headaches or o<strong>the</strong>r symptoms. They may pose a special health risk for<br />
<strong>in</strong>fants, young children, some <strong>of</strong> <strong>the</strong> elderly, and people with severely comprised immune<br />
Bachelor’s Degree Project - A <strong>conceptual</strong> <strong>model</strong> <strong>of</strong> <strong>the</strong> <strong>aquifer</strong> <strong>in</strong> <strong>Tiquipaya</strong>, <strong>Bolivia</strong> 38(52)<br />
<strong>KTH</strong> - Royal Institute <strong>of</strong> Technology - Stockholm 2005
systems. Accord<strong>in</strong>g to OMS 80% <strong>of</strong> <strong>the</strong> <strong>in</strong>fant mortality <strong>in</strong> develop<strong>in</strong>g countries is caused by<br />
fecal bacteria. In <strong>Tiquipaya</strong> <strong>the</strong> groundwater and <strong>the</strong> superficial waters show traces <strong>of</strong> fecal<br />
coliform contam<strong>in</strong>ation. One sample taken from a distribution tank was very high. It is<br />
connected to a heavy ra<strong>in</strong>fall <strong>the</strong> night before and <strong>the</strong> fact that <strong>the</strong> people liv<strong>in</strong>g <strong>in</strong> <strong>the</strong><br />
watershed above <strong>the</strong> <strong>in</strong>take for <strong>the</strong> tank do not have septic tanks or treat <strong>the</strong>ir residual water.<br />
Conclusions on water contam<strong>in</strong>ation<br />
Concern<strong>in</strong>g <strong>the</strong> groundwater <strong>aquifer</strong> <strong>the</strong> most impend<strong>in</strong>g problems are <strong>the</strong> follow<strong>in</strong>g. First;<br />
<strong>the</strong> l<strong>in</strong>ked problems <strong>of</strong> no sewage systems, coliform bacteria and residual water <strong>in</strong> <strong>the</strong><br />
agriculture. Second; <strong>the</strong> garbage handl<strong>in</strong>g. The municipality needs to construct a sewage<br />
disposal system and preferably a sewage treatment plant. The system needs to be dimensioned<br />
for a ra<strong>the</strong>r fast population growth. In April 2005 <strong>the</strong> municipality had already started to plan<br />
for a new disposal system. S<strong>in</strong>ce this process is very expensive and time demand<strong>in</strong>g it would<br />
be appropriate with an alternative solution. The temporary solution could be to <strong>in</strong>form <strong>the</strong><br />
population how to construct better latr<strong>in</strong>es and septic tanks and to understand <strong>the</strong> connected<br />
problems, such as coliform bacteria. Concern<strong>in</strong>g <strong>the</strong> garbage <strong>the</strong> municipality needs to<br />
recollect <strong>the</strong> garbage more <strong>of</strong>ten and f<strong>in</strong>d a place for construct<strong>in</strong>g a garbage disposal plant.<br />
The disposal plant has to be constructed <strong>in</strong> a way that does not harm <strong>the</strong> <strong>aquifer</strong>. For example,<br />
it should not be situated on permeable soil and it should be prevented from leak<strong>in</strong>g to <strong>the</strong><br />
<strong>aquifer</strong>.<br />
Bachelor’s Degree Project - A <strong>conceptual</strong> <strong>model</strong> <strong>of</strong> <strong>the</strong> <strong>aquifer</strong> <strong>in</strong> <strong>Tiquipaya</strong>, <strong>Bolivia</strong> 39(52)<br />
<strong>KTH</strong> - Royal Institute <strong>of</strong> Technology - Stockholm 2005
Conclusion<br />
The extension <strong>of</strong> <strong>the</strong> <strong>aquifer</strong> has been hard to determ<strong>in</strong>e. There is very little data on <strong>the</strong> strata<br />
<strong>in</strong> <strong>the</strong> area. In all <strong>the</strong> different prior studies <strong>the</strong> same deep well pump<strong>in</strong>g tests from <strong>the</strong><br />
Semapa project has been evaluated and only one was test was carried out <strong>in</strong> <strong>Tiquipaya</strong>.<br />
Accord<strong>in</strong>g to <strong>the</strong> deep well pump<strong>in</strong>g test <strong>the</strong> first lithological set, down to 200m, is a<br />
potentially good source for exploitation. This is supported by <strong>the</strong> facts say<strong>in</strong>g that <strong>the</strong> whole<br />
valley is <strong>in</strong>terconnected with three sedimentary bodies with higher capacity, one be<strong>in</strong>g <strong>in</strong><br />
<strong>Tiquipaya</strong>. For fur<strong>the</strong>r <strong>in</strong>vestigations it is necessary to determ<strong>in</strong>e <strong>the</strong> capacity <strong>of</strong> <strong>the</strong> <strong>aquifer</strong> <strong>in</strong><br />
<strong>Tiquipaya</strong> and <strong>the</strong> o<strong>the</strong>r two bodies more exactly.<br />
The recharge <strong>in</strong> our study is based on precipitation data from Promic. Even thought <strong>the</strong><br />
precipitation data is sufficient it has been hard to make a reliable assumption <strong>of</strong> <strong>the</strong><br />
evapotranspiration and <strong>the</strong> <strong>in</strong>filtration from <strong>the</strong> rivers. If <strong>the</strong>re were data on <strong>the</strong> outflow rate<br />
from <strong>the</strong> watershed where <strong>the</strong> metrological stations are it would be possible to calculate <strong>the</strong><br />
real evapotranspiration based on <strong>the</strong>se facts. Specific facts on <strong>the</strong> flow or/and <strong>the</strong><br />
evapotranspiration is needed to make more exact calculations.<br />
Concern<strong>in</strong>g <strong>the</strong> <strong>in</strong>filtration, to make a reliable assumption <strong>of</strong> <strong>the</strong> <strong>in</strong>filtration from <strong>the</strong> rivers<br />
laboratory tests and field <strong>in</strong>vestigations carried out with <strong>the</strong> same soil and flow rate is needed.<br />
To get a reliable percentage <strong>of</strong> <strong>the</strong> <strong>in</strong>filtration from <strong>the</strong> irrigation similar test are needed.<br />
Ano<strong>the</strong>r variable uncerta<strong>in</strong>ty is <strong>the</strong> amount <strong>of</strong> irrigation water taken from o<strong>the</strong>r watersheds.<br />
We have based our assumptions on a study carried out by Negowat, but we feel that <strong>the</strong>re is<br />
some <strong>in</strong>formation that is unclear. For example <strong>the</strong> flow rates vary quite a bit and that leads to<br />
ra<strong>the</strong>r big variations <strong>in</strong> <strong>the</strong> estimated recharge. We did not have <strong>the</strong> possibility to analyze this<br />
so we have used an average <strong>in</strong> our calculations (Table 3).<br />
The discharge is <strong>the</strong> most unreliable part <strong>of</strong> <strong>the</strong> groundwater balance. The <strong>in</strong>formation we<br />
received over <strong>the</strong> spr<strong>in</strong>gs <strong>in</strong> Kanarancho and L<strong>in</strong>de were quite good except that <strong>the</strong>re were not<br />
data for <strong>the</strong> whole year. Over all to be able to assume <strong>the</strong> discharge from <strong>the</strong> <strong>aquifer</strong> a study is<br />
essential. The study should <strong>in</strong>clude localization and estimation <strong>of</strong> flow rates <strong>of</strong> all <strong>the</strong> wells<br />
and spr<strong>in</strong>gs <strong>in</strong> <strong>Tiquipaya</strong>.<br />
Concern<strong>in</strong>g <strong>the</strong> water balance <strong>the</strong> conclusion is that <strong>the</strong> examples based on Ricaldi et al. are<br />
not reliable. There is no explanation on how <strong>the</strong>y received <strong>the</strong>ir data and <strong>the</strong> study is from<br />
1989. S<strong>in</strong>ce 1989 <strong>the</strong> population has <strong>in</strong>creased very much so <strong>the</strong>ir assumptions on discharge<br />
can not be accurate. The assumptions we have made seems more reliable <strong>the</strong>n <strong>the</strong> ones made<br />
<strong>in</strong> 1989.<br />
As a conclusion our calculations show that <strong>the</strong> groundwater reserve is decreas<strong>in</strong>g. The most<br />
important pro<strong>of</strong> for this fact is that <strong>the</strong> habitants <strong>of</strong> <strong>Tiquipaya</strong> have noticed a decreas<strong>in</strong>g<br />
amount <strong>of</strong> flow <strong>in</strong> <strong>the</strong> spr<strong>in</strong>gs which have been work<strong>in</strong>g for hundreds <strong>of</strong> years (Negowat).<br />
S<strong>in</strong>ce all <strong>the</strong> <strong>in</strong>put data is unsure and a lot is miss<strong>in</strong>g, we do not feel confident enough to<br />
specify <strong>the</strong> exact amount <strong>of</strong> reduction <strong>in</strong> <strong>the</strong> <strong>aquifer</strong>.<br />
There is a big variation between <strong>the</strong> water balance <strong>in</strong> <strong>the</strong> first and <strong>the</strong> second calculation. To<br />
compare <strong>the</strong>se two we did <strong>the</strong> third balance. In <strong>the</strong> third calculation we only used <strong>the</strong><br />
registered wells, which we know are too few. The third balance showed an amount <strong>of</strong> water<br />
reserve between <strong>the</strong> amounts <strong>of</strong> <strong>the</strong> first- and <strong>the</strong> second balance. S<strong>in</strong>ce we know that <strong>the</strong><br />
reserve <strong>in</strong> <strong>the</strong> third balance should be less, this supports our <strong>the</strong>ory that <strong>the</strong> <strong>aquifer</strong> reserve is<br />
decreas<strong>in</strong>g.<br />
If <strong>the</strong> <strong>aquifer</strong> is to be used as a potable water reserve <strong>the</strong> environmental problems need to be<br />
solved. Right now <strong>the</strong> problems augment with <strong>the</strong> grow<strong>in</strong>g population. To obta<strong>in</strong> a<br />
susta<strong>in</strong>able development <strong>the</strong> habitants' residual water and garbage have to be taken care <strong>of</strong>.<br />
Bachelor’s Degree Project - A <strong>conceptual</strong> <strong>model</strong> <strong>of</strong> <strong>the</strong> <strong>aquifer</strong> <strong>in</strong> <strong>Tiquipaya</strong>, <strong>Bolivia</strong> 40(52)<br />
<strong>KTH</strong> - Royal Institute <strong>of</strong> Technology - Stockholm 2005
As a f<strong>in</strong>al conclusion we do not th<strong>in</strong>k that <strong>the</strong> actual situation <strong>in</strong> <strong>Tiquipaya</strong> is susta<strong>in</strong>able. The<br />
groundwater reserve is decreas<strong>in</strong>g and can not supply enough water for <strong>the</strong> municipality.<br />
Recommendations<br />
• The <strong>aquifer</strong> is likely to cover a larger area than <strong>the</strong> one we have limited. In order to<br />
determ<strong>in</strong>e <strong>the</strong> extension <strong>of</strong> <strong>the</strong> <strong>aquifer</strong> more well drill<strong>in</strong>g tests and geophysical tests<br />
are recommended. Dur<strong>in</strong>g <strong>the</strong>se tests it would be appropriate to record <strong>the</strong> lithography,<br />
<strong>the</strong> extension <strong>of</strong> <strong>the</strong> <strong>aquifer</strong> and <strong>the</strong> groundwater levels.<br />
• We recommend fields <strong>in</strong>vestigations and laboratory tests to get a reliable percentage<br />
<strong>of</strong> <strong>in</strong>filtration from <strong>the</strong> rivers and from <strong>the</strong> irrigation.<br />
• The real evapotranspiration is a variable which needs to be more thoroughly<br />
<strong>in</strong>vestigated.<br />
• To be able to assume <strong>the</strong> discharge from <strong>the</strong> <strong>aquifer</strong> a study is essential. The study<br />
should <strong>in</strong>clude localization and estimation <strong>of</strong> flow rates <strong>of</strong> all <strong>the</strong> wells and spr<strong>in</strong>gs <strong>in</strong><br />
<strong>Tiquipaya</strong>.<br />
• We recommend <strong>the</strong> municipality to construct a sewage disposal system and preferably<br />
a sewage treatment plant. Concern<strong>in</strong>g <strong>the</strong> garbage <strong>the</strong> municipality needs to recollect<br />
<strong>the</strong> garbage more <strong>of</strong>ten and f<strong>in</strong>d a place for construct<strong>in</strong>g a safe garbage disposal plant.<br />
• To obta<strong>in</strong> a susta<strong>in</strong>able water use we recommend <strong>the</strong> municipality to use water from<br />
catchment areas with water surplus, situated outside <strong>of</strong> <strong>the</strong> Cochabamba Valley. If <strong>the</strong><br />
agriculture stays as <strong>in</strong>tensive as it is today <strong>the</strong> municipality needs to use water supplies<br />
from o<strong>the</strong>r watersheds. This would also give <strong>the</strong> <strong>aquifer</strong> a chance to restore its reserve.<br />
The completion <strong>of</strong> <strong>the</strong> Misicuni project will hopefully provide <strong>Tiquipaya</strong> with <strong>the</strong><br />
water supplement needed.<br />
• There is a vulnerability map <strong>in</strong> a small scale cover<strong>in</strong>g <strong>the</strong> whole valley. We<br />
recommend a more specific vulnerability map over <strong>the</strong> <strong>aquifer</strong> <strong>in</strong> <strong>Tiquipaya</strong>. A<br />
vulnerability <strong>in</strong>vestigation is very important and urgent, s<strong>in</strong>ce <strong>the</strong>re are many treats to<br />
<strong>the</strong> <strong>aquifer</strong> <strong>in</strong> this area.<br />
Bachelor’s Degree Project - A <strong>conceptual</strong> <strong>model</strong> <strong>of</strong> <strong>the</strong> <strong>aquifer</strong> <strong>in</strong> <strong>Tiquipaya</strong>, <strong>Bolivia</strong> 41(52)<br />
<strong>KTH</strong> - Royal Institute <strong>of</strong> Technology - Stockholm 2005
References<br />
Agencia Técnica, 2004. Resumen de diagnostico del sistema de agua potable. Proyecto de<br />
agua potable y alcantarillado, Colcapirhua-<strong>Tiquipaya</strong>. Negowat.<br />
Ampuero, R., Woudstra, R., 2005. Diagnostico de le calidad del agua de consumo domestico<br />
en los municipios de <strong>Tiquipaya</strong> y Colcapirhua. Centro AGUA, Environment Aspects.<br />
Ampuero, R., Mondaca, G., 2005. Diagnostico ambiental participativo del municipio de<br />
<strong>Tiquipaya</strong>. Centro AGUA, Environmental Aspects.<br />
Diaz, J., Ramirez, I., Zapeke, M., 1995. Hidrogeoquímica del Valle central de Cochabamba-<br />
Informe Técnico. German <strong>Bolivia</strong>n Agreement on Groundwater, CABAS.<br />
Laurie, N., Marv<strong>in</strong>, S., 1998. Globalisation, neoliberalism, and negotiated development <strong>in</strong> <strong>the</strong><br />
Andes: water projects and regional identity <strong>in</strong> Cochabamba, <strong>Bolivia</strong>. Environment and<br />
Plann<strong>in</strong>g A 1999, volume 31, p. 1401–1415.<br />
Negowat, 2005. Villa Nueva HIDROGEO. Centro AGUA, Negowat.<br />
Negowat, 2005. Sistema de riego por comunidades. Centro AGUA, Negowat.<br />
Oliviera, R., Neumann-Redl<strong>in</strong>, C., 1997. Thematic maps <strong>of</strong> <strong>the</strong> m<strong>in</strong>eral resources <strong>of</strong> <strong>Bolivia</strong>.<br />
SERGEOMIN. CABAS.<br />
Peñarrieta, R., Vega, D., 2004. Estudio de los sistemas de veritiente y del uso de la tierra en la<br />
comunidad de Kanarancho (Zona Central de <strong>Tiquipaya</strong>). Centro AGUA, Negowat.<br />
Peñarrieta, R., Vega, D., 2005. Estudio de la tierra y de los sistemas de veritiente en la<br />
comunidad de L<strong>in</strong>de (Zona Central de <strong>Tiquipaya</strong>). Centro AGUA, Negowat.<br />
Renner, S., Velasco, C., 2000. Geology and Hydrogeology <strong>of</strong> <strong>the</strong> Central Valley <strong>of</strong><br />
Cochabamba. German <strong>Bolivia</strong>n Agreement on Groundwater, CABAS.<br />
Ricaldi, V., Anaya, L., Solis, G., 1989. Gerencia de recursos hídricos y nacionales <strong>in</strong>forme<br />
sobre la explotación de aguas subterráneas en Quillacolla El Paso. CORDECO.<br />
Stimson, J., Frappe, S., Drimmie R., Rudolph, D., Farvolden, R., 1992. Evolución isotópica y<br />
geoquímica de las aguas subterráneas en el valle de Cochabamba, <strong>Bolivia</strong>. Los recursos<br />
hídricos en <strong>Bolivia</strong> y su dimensión ambiental, p. 197-210.<br />
Stimson, J., Frape, S., Drimmie, R., Rudolph, D., 1996. Interpretation <strong>of</strong> groundwater flow<br />
patterns through a reconstruction <strong>of</strong> <strong>the</strong> tritium precipitation record <strong>in</strong> Cochabamba Valley,<br />
<strong>Bolivia</strong>. Journal <strong>of</strong> Hydrology 180, p. 155-172.<br />
Thunqvist, E-L., 2004. A susta<strong>in</strong>able and equal management <strong>of</strong> water Resources – A gender<br />
perspective on water priorities for a river bas<strong>in</strong> <strong>in</strong> Cochabmba, <strong>Bolivia</strong>. <strong>KTH</strong>.<br />
Vergara Medrano, E., 2000. Estatus ambiental del río Rocha. UMSS.<br />
Web pages (2005-08)<br />
http://aol.countrywatch.comaol_regions.asp/REGION=5<br />
http://www.reliefweb.<strong>in</strong>t/rw/RWB.NSF/db900LargeMaps/SKAR-64GEDC?OpenDocument<br />
http://www.globalis.se<br />
Bachelor’s Degree Project - A <strong>conceptual</strong> <strong>model</strong> <strong>of</strong> <strong>the</strong> <strong>aquifer</strong> <strong>in</strong> <strong>Tiquipaya</strong>, <strong>Bolivia</strong> 42(52)<br />
<strong>KTH</strong> - Royal Institute <strong>of</strong> Technology - Stockholm 2005
Appendix<br />
Bachelor’s Degree Project - A <strong>conceptual</strong> <strong>model</strong> <strong>of</strong> <strong>the</strong> <strong>aquifer</strong> <strong>in</strong> <strong>Tiquipaya</strong>, <strong>Bolivia</strong> 43(52)<br />
<strong>KTH</strong> - Royal Institute <strong>of</strong> Technology - Stockholm 2005
Altitude Area Average precipitation/month (mm/month) 1995-2002<br />
(m.a.s.l) (km²) jan feb mars april may june july aug sept oct nov dec<br />
3550 ###### 143,90 102,60 108,40 15,80 5,20 1,30 5,10 22,10 22,70 36,70 61,20 117,40<br />
23,77 Flow(l/s)= 1319,64 940,90 994,08 144,89 47,69 11,92 46,77 202,67 208,17 336,56 561,24 1076,62<br />
3770 ###### 175,38 127,68 145,88 25,04 4,69 5,80 3,58 4,77 21,80 41,44 70,24 141,73<br />
10,56 Flow(l/s)= 714,31 520,03 594,16 101,99 19,10 23,62 14,58 19,43 88,79 168,78 286,08 577,25<br />
4200 ###### 179,27 136,76 126,38 31,73 6,24 6,20 4,63 14,31 31,49 59,69 82,77 127,05<br />
35,59 Flow(l/s)= 2461,16 1877,55 1735,04 435,61 85,67 85,12 63,56 196,46 432,32 819,47 1136,33 1744,24<br />
Sum= 4495,11 3338,47 3323,29 682,49 152,46 120,66 124,91 418,56 729,28 1324,81 1983,65 3398,12<br />
Evapo 490<br />
mm/y (l/s)= 1086,27 1086,27 1086,27 1086,27 1086,27 1086,27 1086,27 1086,27 1086,27 1086,27 1086,27 1086,27<br />
Total flow(l/s)= 3409 2252 2237 -404 -934 -966 -961 -668 -357 239 897 2312<br />
Total flow<br />
(m³/year)= 8835696 5837708 5798339 618294 2326002 5992300<br />
F<strong>in</strong>al flow<br />
(m³/year)= 29408339<br />
Altitude Area Average precipitation/month (mm/month) 1995-2002<br />
(m.a.s.l) (km²) jan feb mars april may june july aug sept oct nov dec<br />
3550 ###### 143,90 102,60 108,40 15,80 5,20 1,30 5,10 22,10 22,70 36,70 61,20 117,40<br />
23,77 Flow(l/s)= 1319,64 940,90 994,08 144,89 47,69 11,92 46,77 202,67 208,17 336,56 561,24 1076,62<br />
3770 ###### 175,38 127,68 145,88 25,04 4,69 5,80 3,58 4,77 21,80 41,44 70,24 141,73<br />
10,56 Flow(l/s)= 714,31 520,03 594,16 101,99 19,10 23,62 14,58 19,43 88,79 168,78 286,08 577,25<br />
4200 ###### 179,27 136,76 126,38 31,73 6,24 6,20 4,63 14,31 31,49 59,69 82,77 127,05<br />
35,59 Flow(l/s)= 2461,16 1877,55 1735,04 435,61 85,67 85,12 63,56 196,46 432,32 819,47 1136,33 1744,24<br />
Sum= 4495,11 3338,47 3323,29 682,49 152,46 120,66 124,91 418,56 729,28 1324,81 1983,65 3398,12<br />
Evapo 25%= 1123,78 834,62 830,82 170,62 38,11 30,17 31,23 104,64 182,32 331,20 495,91 849,53<br />
Total flow(l/s)= 3371 2504 2492 512 114 90 94 314 547 994 1488 2549<br />
Total flow<br />
(m³/year)= 8738484 6489993 6460467 2575432 3856214 6605937<br />
F<strong>in</strong>al flow<br />
(m³/year)= 34726527
1.1<br />
Amount <strong>of</strong> precipitation based on evapotranspiration 490 mm/year 29408339<br />
25% <strong>of</strong> <strong>the</strong> precipitation from <strong>the</strong> watersheds <strong>in</strong>filtrate 29408339*0,25= 7352085<br />
15% <strong>of</strong> <strong>the</strong> precipitation <strong>in</strong> <strong>the</strong> valley <strong>in</strong>filtrate (Area 18 km², 500<br />
mm/year) 18,12*1000²*0,5*0,15= 1359338<br />
25% <strong>of</strong> <strong>the</strong> irrigation water from o<strong>the</strong>r catchment areas <strong>in</strong>filtrate 18817920*0,25= 4704480<br />
Amount <strong>of</strong> recharge SUM= 13415903<br />
Discharge for irrigation (Victor Ricaldi et al. 1989) 3600000<br />
Discharge for domestic use 100 l/person (Victor Ricaldi et al. 1989) 60000*100*365/1000= 2200000<br />
48% for irrigation (Victor Ricaldi et al. 1989) 13415903*0,48= 6439633<br />
Amount <strong>of</strong> discharge SUM= 12239633<br />
Reserve 13415903-12239633= 1176269<br />
1.2<br />
Amount <strong>of</strong> precipitation based on evapotranspiration 25% 34726527<br />
25% <strong>of</strong> <strong>the</strong> precipitation from <strong>the</strong> watersheds <strong>in</strong>filtrate 34726527*0,25= 8681632<br />
15% <strong>of</strong> <strong>the</strong> precipitation <strong>in</strong> <strong>the</strong> valley <strong>in</strong>filtrate (Area 18 km², 500<br />
mm/year) 18,12*1000²*0,5*0,15= 1359338<br />
25% <strong>of</strong> <strong>the</strong> irrigation water from o<strong>the</strong>r catchment areas <strong>in</strong>filtrate 18817920*0,25= 4704480<br />
Amount <strong>of</strong> recharge SUM= 14745450<br />
Discharge for irrigation (Victor Ricaldi et al. 1989) 3600000<br />
Discharge for domestic use 100 l/person (Victor Ricaldi et al. 1989) 60000*100*365/1000= 2200000<br />
48% for irrigation (Victor Ricaldi et al. 1989) 14745450*0,48= 7077816<br />
Amount <strong>of</strong> discharge SUM= 12877816<br />
Reserve 14745450-12877816= 1867634
2.1<br />
Amount <strong>of</strong> precipitation based on evapotranspiration 490 mm/year 29408339<br />
25% <strong>of</strong> <strong>the</strong> precipitation from <strong>the</strong> watersheds <strong>in</strong>filtrate 29408339*0,25= 7352085<br />
15% <strong>of</strong> <strong>the</strong> precipitation <strong>in</strong> <strong>the</strong> valley <strong>in</strong>filtrate (Area 18 km², 500<br />
mm/year) 18,12*1000²*0,5*0,15= 1359338<br />
25% <strong>of</strong> <strong>the</strong> irrigation water from o<strong>the</strong>r catchment areas <strong>in</strong>filtrate 18817920*0,25= 4704480<br />
Amount <strong>of</strong> recharge SUM= 13415903<br />
Discharge from spr<strong>in</strong>gs, with variation 2200527<br />
Discharge from registered and assumed wells, with variation 20641174<br />
Amount <strong>of</strong> discharge SUM= 22841701<br />
Reserve 13415903-22841701= -9425798<br />
2.2<br />
Amount <strong>of</strong> precipitation based on evapotranspiration 25% 34726527<br />
25% <strong>of</strong> <strong>the</strong> precipitation from <strong>the</strong> watersheds <strong>in</strong>filtrate 34726527*0,25= 8681632<br />
15% <strong>of</strong> <strong>the</strong> precipitation <strong>in</strong> <strong>the</strong> valley <strong>in</strong>filtrate (Area 18 km², 500<br />
mm/year) 18,12*1000²*0,5*0,15= 1359338<br />
25% <strong>of</strong> <strong>the</strong> irrigation water from o<strong>the</strong>r catchment areas <strong>in</strong>filtrate 18817920*0,25= 4704480<br />
Amount <strong>of</strong> recharge SUM= 14745450<br />
Discharge from spr<strong>in</strong>gs, with variation 2200527<br />
Discharge from registered and assumed wells, with variation 20641174<br />
Amount <strong>of</strong> discharge SUM= 22841701<br />
Reserve 14745450-22841701= -8096251
3.1<br />
Amount <strong>of</strong> precipitation based on evapotranspiration 490 mm/year 29408339<br />
25% <strong>of</strong> <strong>the</strong> precipitation from <strong>the</strong> watersheds <strong>in</strong>filtrate 29408339*0,25= 7352085<br />
15% <strong>of</strong> <strong>the</strong> precipitation <strong>in</strong> <strong>the</strong> valley <strong>in</strong>filtrate (Area 18 km², 500<br />
mm/year) 18,12*1000²*0,5*0,15= 1359338<br />
25% <strong>of</strong> <strong>the</strong> irrigation water from o<strong>the</strong>r catchment areas <strong>in</strong>filtrate 18817920*0,25= 4704480<br />
Amount <strong>of</strong> recharge SUM= 13415903<br />
Amount <strong>of</strong> discharge from spr<strong>in</strong>gs and registered wells, no variation SUM= 13245435<br />
Reserve 13415903-13245435= 170467<br />
3.2<br />
Amount <strong>of</strong> precipitation based on evapotranspiration 25% 34726527<br />
25% <strong>of</strong> <strong>the</strong> precipitation from <strong>the</strong> watersheds <strong>in</strong>filtrate 34726527*0,25= 8681632<br />
15% <strong>of</strong> <strong>the</strong> precipitation <strong>in</strong> <strong>the</strong> valley <strong>in</strong>filtrate (Area 18 km², 500<br />
mm/year) 18,12*1000²*0,5*0,15= 1359338<br />
25% <strong>of</strong> <strong>the</strong> irrigation water from o<strong>the</strong>r catchment areas <strong>in</strong>filtrate 18817920*0,25= 4704480<br />
Amount <strong>of</strong> recharge SUM= 14745450<br />
Amount <strong>of</strong> discharge from spr<strong>in</strong>gs and registered wells, no variation SUM= 13245435<br />
Reserve 14745450-13245435= 1500014
ESTACION LH UMSS<br />
PROMEDIOS (1995-2002)<br />
Hum.<br />
Velocidad del<br />
Altura = 2570 m.s.n.m. Evaporac, Rel. Radiacición Precipitac. Temperatura<br />
Viento Direcion<br />
Lat. Sur =17º 26' 37" m.m./mes (%) Solar m.m./mes ºC m/s Prevalente<br />
Long. Oeste= 66º 08' 35" W/m2 Mínima Máxima Promedio Máxima Promedio Viento<br />
Enero 120,52 68,38 233,73 114,18 10,43 29,55 17,53 12,90 0,70 177,12<br />
Febrero 108,90 68,30 240,46 68,64 10,02 28,44 17,64 11,34 0,58 182,50<br />
Año Marzo 116,79 68,83 232,33 83,06 8,14 29,64 17,51 23,11 0,56 188,86<br />
Abril 123,85 57,62 237,32 14,98 6,13 29,48 17,78 11,93 0,57 181,25<br />
1995-2002 Mayo 106,66 43,39 198,13 2,03 2,69 28,99 15,01 12,57 0,50 197,60<br />
Junio 92,39 43,64 176,07 0,89 0,33 27,69 14,16 11,03 0,47 209,53<br />
Julio 105,06 41,13 186,33 0,76 0,53 27,87 14,16 12,67 0,54 192,91<br />
Agosto 138,73 43,14 210,54 2,61 3,93 29,09 16,36 12,04 0,67 165,34<br />
Septiembre 164,86 45,53 247,99 14,26 4,86 30,30 17,89 15,31 0,89 148,53<br />
Octubre 173,94 45,63 278,90 13,09 8,39 31,51 19,39 10,16 0,90 143,79<br />
Noviembre 171,57 46,08 265,77 38,88 9,28 32,32 18,43 12,35 0,88 137,35<br />
Diciembre 158,99 56,23 244,71 49,11 9,97 31,47 19,74 13,70 0,84 163,19<br />
Suma 1582,24 402,48<br />
Promedio 52,32 229,36 6,22 29,70 17,13 13,26 0,68 174,00<br />
Extrema 0,33 32,32 23,11
ESTACION LINKUPATA<br />
PROMEDIOS (1992-2002)<br />
Hum.<br />
Velocidad del<br />
Altura = 3550 m.s.n.m. Evaporac. Rel. Precipitac. Temperatura<br />
Viento Direcion<br />
X = 800200 m.m./mes (%) m.m./mes ºC m/s Prevalente<br />
Y = 8084700 Mínima Máxima Promedio Máxima Promedio Viento<br />
Enero 115,4 76,8 143,9 5,0 20,1 11,2 49,5 5,1 248,3<br />
Febrero 104,8 79,1 102,6 5,5 19,7 11,2 48,9 5,1 123,0<br />
Marzo 103,2 77,9 108,4 5,4 20,3 10,9 46,4 4,6 109,9<br />
Abril 108,7 62,0 15,8 5,2 20,3 11,6 53,4 6,6 138,0<br />
Año Mayo 115,0 42,4 5,2 2,5 18,3 10,4 52,6 4,6 93,0<br />
1992/2002 Junio 125,3 30,3 1,3 1,4 18,9 10,2 56,3 5,0 117,3<br />
Julio 128,8 32,1 5,1 1,2 19,3 9,3 57,1 5,6 68,7<br />
Agosto 159,4 41,4 22,1 1,8 19,2 10,3 51,9 8,0 118,1<br />
Septiembre 169,3 47,9 22,7 2,9 20,5 10,7 50,9 10,2 174,5<br />
Octubre 181,0 57,3 36,7 3,6 21,0 11,1 49,7 7,8 183,8<br />
Noviembre 166,8 63,5 61,2 4,2 22,0 11,8 56,5 6,8 196,2<br />
Diciembre 152,8 70,7 117,4 4,5 21,4 11,4 48,0 6,5 229,9<br />
Suma 1630,4 642,4<br />
Promedio 56,8 3,6 20,1 10,8 51,8 6,3 150,1<br />
Extrema 1,2 22,0 57,1
ESTACION JANAMAYU<br />
PROMEDIOS (1992-2002)<br />
Hum.<br />
Velocidad del<br />
Altura = 3770 m.s.n.m. Evaporac. Rel. Precipitac. Int.Rad.Solar. Temperatura<br />
Viento Direcion<br />
X = 801500 m.m./mes (%) m.m./mes w/m2-mes ºC m/s Prevalente<br />
Y = 8084400 Mínima Máxima Promedio Máxima Promedio Viento<br />
Enero 80,86 82,56 175,38 169,89 3,23 18,40 9,10 27,88 3,20 241,86<br />
Febrero 75,11 83,31 127,68 168,60 3,85 18,17 9,12 32,63 3,26 159,78<br />
Marzo 83,73 82,34 145,88 170,46 3,34 18,49 8,88 34,34 3,21 155,33<br />
Abril 97,09 66,24 25,04 212,24 2,59 18,77 9,62 29,13 4,04 83,00<br />
Año Mayo 105,33 43,90 4,69 219,84 0,23 18,57 9,20 35,43 4,05 83,67<br />
1992/2002 Junio 114,00 32,64 5,80 202,22 -0,86 18,93 8,44 35,96 3,95 82,75<br />
Julio 121,17 33,49 3,58 217,44 -0,39 18,41 9,19 40,12 4,71 74,89<br />
Agosto 119,77 42,78 14,77 226,13 -0,09 18,05 8,44 42,84 5,41 89,30<br />
Septiembre 138,24 52,92 21,80 238,79 1,18 19,28 9,06 44,69 6,30 89,44<br />
Octubre 139,35 57,69 41,44 228,40 1,90 20,39 9,41 57,66 5,93 74,11<br />
Noviembre 122,68 65,51 70,24 223,43 1,97 21,00 9,80 39,26 4,80 58,20<br />
Diciembre 108,97 74,46 141,73 197,80 3,48 20,02 9,82 39,98 3,99 182,40<br />
Suma 1306,29 778,02<br />
Promedio 59,82 206,27 1,70 19,04 9,17 38,33 4,40 114,56<br />
Extrema -0,86 21,00 57,66
ESTACION TAQUIÑA<br />
PROMEDIOS (1992-2002)<br />
Altura = 4200 m.s.n.m. Evaporac. Hum. Rel. Precipitac. Temperatura<br />
Velocidad del<br />
Viento Direcion<br />
X = 803250 m.m./mes (%) m.m./mes ºC m/s Prevalente<br />
Y = 8087500 Mínima Máxima Promedio Máxima Promedio Viento<br />
Enero 89,10 81,51 179,27 1,27 15,34 6,17 47,97 5,42 115,36<br />
Febrero 80,24 86,51 136,76 1,46 14,24 6,50 35,52 6,30 97,23<br />
Marzo 87,88 85,11 126,38 1,12 14,68 6,31 32,09 5,50 98,44<br />
Abril 81,91 71,87 31,73 1,00 15,09 6,58 42,08 6,04 43,25<br />
Año Mayo 96,64 47,23 6,24 -1,14 14,96 6,31 40,61 5,37 284,89<br />
1992-2002 Junio 103,38 35,63 6,20 -1,47 14,53 5,51 42,66 5,36 286,63<br />
Julio 96,35 40,58 4,63 -2,60 14,52 5,27 52,45 6,46 159,00<br />
Agosto 95,15 55,38 14,31 -2,83 14,46 5,10 57,52 8,90 76,20<br />
Septiembre 90,61 64,84 31,49 -1,05 15,23 5,26 50,01 8,04 67,23<br />
Octubre 109,18 72,64 59,69 -0,79 16,16 6,17 50,61 7,99 73,54<br />
Noviembre 103,94 75,62 82,77 -0,04 16,43 6,49 47,17 6,44 114,92<br />
Diciembre 83,18 82,14 127,05 0,74 16,01 6,72 43,16 6,16 116,50<br />
Suma 1117,5 806,5<br />
Promedio 66,6 -0,36 15,14 6,03 45,15 6,50 127,77<br />
Extrema -2,83 16,43 57,52
System Water source jan feb mars april may jun jul agu sep oct nov dec<br />
Sauce Presa Pozo Surgente 0,30 0,30 0,40 0,50 0,40 0,40 0,35 0,28 0,30 0,20 0,20 0,20<br />
Pozo Surgente 0,40 0,40 1,80 5,38 5,50 4,00 3,70 3,50 0,20 0,20 0,20 0,30<br />
Jok'ara Vertiente 0,30 0,40 0,60 1,70 1,20 0,60 0,50 0,30 0,20 0,20 0,00 0,00<br />
Tejería Vertiente 0,30 0,40 1,10 3,50 2,00 2,00 1,60 1,20 0,40 0,30 0,30 0,20<br />
Choquela Vertiente 0,30 0,50 1,20 3,10 2,00 0,80 0,90 1,25 0,50 0,30 0,30 0,30<br />
Clemente Vertiente 0,20 0,30 0,40 0,68 0,70 0,50 0,50 0,50 0,40 0,30 0,20 0,10<br />
Cochera<br />
Pozo +<br />
Vertiente 0,20 0,50 2,00 5,80 2,90 0,60 0,50 0,50 0,30 0,30 0,30 0,10<br />
Average flow 0,29 0,40 1,07 2,95 2,10 1,27 1,15 1,08 0,33 0,26 0,21 0,17<br />
13,00 3,71 5,20 13,93 38,37 27,30 16,53 14,95 13,98 4,27 3,34 2,79 2,23<br />
Flow/km²= 0,4941 7,518 10,525 28,193 77,661 55,258 33,455 30,260 28,305 8,646 6,766 5,639 4,511<br />
jan feb mars april may jun jul aug sep oct nov dec<br />
Lambray 0,20 0,40 0,60 2,10 1,60 1,40 1,10 1,00 0,70 0,20 0,20 0,10<br />
Limoncito 0,10 0,20 0,30 0,50 0,40 0,30 0,20 0,20 0,10 0,00 0,00 0,00<br />
Tarita 0,10 0,20 0,30 0,50 0,40 0,30 0,30 0,20 0,20 0,10 0,10 0,00<br />
Rochito 0,20 0,20 0,60 1,50 1,20 1,00 0,80 0,70 0,50 0,10 0,10 0,10<br />
Troje Punku<br />
Manuelita<br />
0,10 0,10 0,70 1,40 1,10 1,00 0,70 0,70 0,40 0,10 0,10 0,10<br />
T'<strong>in</strong>kis 0,20 0,20 1,00 3,00 2,30 2,00 1,50 1,40 0,40 0,30 0,30 0,20<br />
Tudela 0,30 0,30 0,90 2,10 1,60 1,40 1,10 1,00 0,70 0,20 0,20 0,20<br />
Revollo 0,40 0,40 1,20 4,00 3,00 2,70 2,10 1,90 1,20 0,40 0,40 0,30<br />
Average flow 0,20 0,25 0,70 1,89 1,45 1,26 0,98 0,89 0,53 0,18 0,18 0,13<br />
10,00 2,00 2,50 7,00 18,88 14,50 12,63 9,75 8,88 5,25 1,75 1,75 1,25<br />
Flow/km²= 0,2300 8,696 10,870 30,435 82,065 63,043 54,891 42,391 38,587 22,826 7,609 7,609 5,435<br />
Average Kanaracho and L<strong>in</strong>de 2,86 3,85 10,46 28,62 20,90 14,58 12,35 11,43 4,76 2,55 2,27 1,74<br />
Spr<strong>in</strong>gs average flow/km²=<br />
Reman<strong>in</strong>g areas<br />
8,107 10,697 29,314 79,863 59,151 44,173 36,326 33,446 15,736 7,187 6,624 4,973<br />
flow/km² 1,8016 14,605 19,272 52,812 143,882 106,566 79,583 65,444 60,257 28,350 12,949 11,933 8,959<br />
Flow(l/s) Kan, L<strong>in</strong>de & reman<strong>in</strong>g areas 20,32 26,97 73,74 201,13 148,37 108,74 90,14 83,12 37,87 18,04 16,47 12,44<br />
Average flow (l/s)= 69,78<br />
Average flow (m³/year)= 2200527<br />
Flow wells (reg&assumed) 144,72 217,08 651,25 1326,63 1326,63 1326,63 795,98 723,62 361,81 144,72 144,72 690,54<br />
Average flow (l/s)= 654,53<br />
Average flow (m³/year)= 20641174 Flow from spr<strong>in</strong>gs ®istered wells,no variation (m³/year)= (350,23+69,78)*60*60*24*365/1000=1324543