Myles Allan, Constraints for Probabilistic Forecasts Myles Allan ...
Myles Allan, Constraints for Probabilistic Forecasts Myles Allan ...
Myles Allan, Constraints for Probabilistic Forecasts Myles Allan ...

Create successful ePaper yourself
Turn your PDF publications into a flip-book with our unique Google optimized e-Paper software.
<strong>Myles</strong> <strong>Allan</strong>, <strong>Constraints</strong> <strong>for</strong> <strong>Probabilistic</strong> <strong>Forecasts</strong><br />
<strong>Myles</strong> <strong>Allan</strong>,<br />
Climate Dynamics Group, Atmospheric, Oceanic and Planetary Physics,<br />
Department of Physics, University of Ox<strong>for</strong>d, United Kingdom<br />
This talk will review some basic issues in the use of observational constraints <strong>for</strong> the<br />
generation of probabilistic <strong>for</strong>ecasts on climate (multi-decadal) timescales. Interesting issues<br />
arise from the fact that we are making a prediction of an unprecedented, one-off event, leading<br />
to questions about what constitutes verification of a probabilistic <strong>for</strong>ecast.<br />
I will introduce the notion of STAID (Stable Inference from Data) <strong>for</strong>ecasts as a reasonable<br />
aspiration, and illustrate how <strong>for</strong>ecasts of some very large scale climate variables may be on<br />
their way to being STAID already, but <strong>for</strong>midable challenges lie ahead be<strong>for</strong>e we can bring<br />
this methodology down to a spatial scale small enough <strong>for</strong> most practical impact<br />
assessments.
I Ansorge, Topographical steering of the Antarctic Circumpolar Current in the southwest<br />
Indian Ocean<br />
No Abstract In<strong>for</strong>mation Available<br />
I Ansorge<br />
Oceanography, University of Cape Town, South Africa
A Barrable, GCM Sensitivity <strong>for</strong> Climate Change Studies at a Regional Scale in the<br />
Swartland, Western Cape, South Africa.<br />
A Barrable<br />
Climate Systems Analysis Group, Environmental and Geographical Science Department,<br />
University of Cape Town, South Africa<br />
and<br />
Prof Bruce Hewitson,<br />
Climate change is a critical issue <strong>for</strong> the farmers in southern Africa, especially in the context of<br />
inter- and intra-annual climate variability. In particular an examination of future climate<br />
change needs to be assessed in view of the sector of vulnerability. For the agricultural sector,<br />
this critically includes a regional study of climate change to enable comparative results towards<br />
impacts on soil erosion and land degradation. Within this framework, evaluating the<br />
effectiveness of the climate models to be utilised needs to be addressed be<strong>for</strong>e the impact of<br />
the projected future climate can be properly assessed <strong>for</strong> the region. This study concerns itself<br />
with the southwestern Cape region of the Swartland, where wheat farmers are <strong>for</strong> the most part<br />
reliant on the timing and quantity of rainfall to produce viable yields.<br />
An assessment is made of the per<strong>for</strong>mance of six global climate models <strong>for</strong> the southwestern<br />
Cape: the CCCMA, CSIRO-Mk2, ECHAM4 / OPCY3, HadCM3, NCARCSM and<br />
NCARPCM. By examining the variables of precipitation, temperature and wind speed, and<br />
comparing these to NCEP reanalysis data, one may identify the degree to which the model<br />
simulations reflect the real climate system processes. The model data used comprises 30 years<br />
of simulated climate representing present day conditions based on the A2 SRES scenario of<br />
greenhouse gas concentrations. In this way the sensitivity of the model output to the observed<br />
climate is gauged, thus establishing which models are applicable to the study region.
Judit Bartholy ,Comparisonal Analysis Of Tendencies Of Extreme Climate Indices On<br />
The European And The Carpathian Basin Scales<br />
Judit Bartholy<br />
Department of Meteorology, Eotvos Lorand University, Hungary<br />
and<br />
Rita Pongracz<br />
Since human and natural systems may be especially affected by changes of extreme climate<br />
events, the main objective of our research is to detect the possible changes of intensity and<br />
frequency of these extreme events. Several climate extreme indices have been analysed and<br />
compared <strong>for</strong> Europe and the Carpathian Basin <strong>for</strong> the twentieth century based on the<br />
guidelines suggested by the joint WMO-CCl/CLIVAR Working Group on climate change<br />
detection. These climate extreme indices include the numbers of severe cold days, winter days,<br />
frost days, cold days, warm days, summer days, hot days, extremely hot days, cold nights,<br />
warm nights, the intra-annual extreme temperature range, the heat wave duration, the growing<br />
season length, the number of wet days (using several threshold values defining extremes), the<br />
maximum number of consecutive dry days, the highest 1-day precipitation amount, the greatest<br />
5-day rainfall total, the annual fraction due to extreme precipitation events, etc. There<strong>for</strong>e,<br />
daily maximum, minimum and mean temperature observations and daily precipitation amounts<br />
have been used in the present statistical analysis. Our results suggest that similarly to the global<br />
and continental trends, regional temperature of the Carpathian Basin has become warmer<br />
during the second half of the twentieth century. Furthermore, regional intensity and frequency<br />
of extreme precipitation has increased, while the total precipitation has decreased in the<br />
Carpathian Basin and the mean climate has become drier.
Swadhin Behera, Modes Of Variability In The Indian Ocean: Statistical Perceptions<br />
Swadhin Behera<br />
Frontier Research System For Global Change, Japan<br />
and<br />
Prof. Toshio Yamagata<br />
Reorganization of independent physical modes is an important aspect of climate studies.<br />
Statistical methods such as EOF technique have provided scope to grasp such meaningful<br />
in<strong>for</strong>mation from massive climate data. In the tropical Pacific, the El Nino/Southern<br />
Oscillation (ENSO) signal is captured as the most dominant mode in eigen techniques. The<br />
statistical analyses here capture the coupled phenomenon which is shown to influence the<br />
global climate variability. In the tropical Indian Ocean, a basin-wide uni<strong>for</strong>m polarity pattern<br />
in the sea surface temperature (SST) anomaly is present as the most dominant interannual<br />
mode. This basin-wide uni<strong>for</strong>m mode shows a high correlation with the Pacific variability:<br />
The peak correlation coefficient of 0.8 is found when the Niño-3 index leads the basin-wide<br />
uni<strong>for</strong>m mode by 4 months. Because of the dominant Pacific influence, the tropical Indian<br />
Ocean has been mostly considered to be passive in the climate studies. However, recent<br />
progress in the Indian Ocean research has revealed a coupled mode widely known as the Indian<br />
Ocean Dipole (IOD). The east-west see-saw in the SST anomalies during an IOD event<br />
characterizes the phenomenon. Interestingly, this SST signal is captured as the second<br />
dominant mode in the EOF analysis. The less frequent occurrence compared to the basin-wide<br />
uni<strong>for</strong>m mode provides IOD the second most dominant seat in the EOF analysis. Nevertheless,<br />
the IOD has wide societal impact during the year of occurrences. Although simple statistical<br />
methods like EOF technique provide important clues of climate variability, sophisticated<br />
statistical analyses sometimes are misleading. For example, the IOD which is captured in the<br />
EOF analysis and simple composite technique is missed by the VARIMAX analysis. It is<br />
shown that the presence of the basin-wide uni<strong>for</strong>m mode misleads such sophisticated analyses:<br />
it is necessary to remove the dominant mode to capture the IOD in these methods. It is<br />
important that statistical inferences must be supported by our physical understanding <strong>for</strong> any<br />
meaningful insight of the climate system.
Roman Bekryaev, Estimation Of Climatic Trends Significance<br />
Roman Bekryaev<br />
Arctic And Antarctic Research Institute, St.-Petersburg State University, Russia<br />
Estimation of the climatic trends significance is still not completely resolved problem. The<br />
completeness follows from the serial correlations of the time series. The serial correlation in<br />
turn is connected to the dominated low-frequency climate variability resulting mostly from the<br />
chaotic dynamics of climate systems. Using the traditional statistical approaches (that don't<br />
take into account that serial correlation) can lead to completely wrong results and conclusions.<br />
In the proposed research we explore the climatic trends variance as a variance of generalized<br />
stochastic integral (stochastic integral from the multiplication of random function and weight<br />
function). Using the convolution of the weight functions we got the expression applicable <strong>for</strong><br />
the calculation of the variance of generalized stochastic integrals. We have considered as a<br />
null hypothesis the suggestion that the “real” climatic trend is absent and the trend estimated<br />
from the data set is connected to the limited sample of the stationary random process. As a<br />
result the sampling trend has the mathematical expectation equal to zero but the value of<br />
variance can be essential. Using the suggestion about the Gaussian random distribution of the<br />
air surface temperature we have constructed the density distribution function of the coefficients<br />
of linear and parabolic regression. We have analysed some climatic air surface temperature<br />
time series. For the Northern Hemisphere air surface temperature from 1901 to 2001 we have<br />
found approximately 95-98% trend significance level. In the same time the trend significance<br />
level estimated on the base of routine procedure is more then 99.9%. Our results still support<br />
the existing global warming concept.
Rasmus Benestad, Record-Value Statistics And Test Of Independent And Equal<br />
Distribution (Iid)<br />
Rasmus Benestad<br />
The Norwegian Meteorological Institute, Norway<br />
It is common to use probability distribution functions (p.d.f.s) in climate research to describe<br />
various climatic parameters. The use of p.d.f.s assume the condition that the values are<br />
independent and identically distributed (iid) random values. An ongoing climate change<br />
implies a non-stationary situation where some of the climatic parameters do not satisfy the iid<br />
condition. A test <strong>for</strong> whether a climatic element satisfies the iid condition is suggested, with an<br />
emphasis on the extreme tails of the distribution. A simple expression can be derived <strong>for</strong> how<br />
many times a new record is set in a series of iid random values, and the validity of the nullhypothesis<br />
of iid can be easily tested <strong>for</strong> any observation. A few examples of the application of<br />
record-value statistics to testing of stationarity will be given.
AF Beraki, CLIMATE CHANGE SIMULATIONS OVER ERITREA USING THE<br />
PRECIS REGIONAL CLIMATE MODEL SYSTEM<br />
AF Beraki,<br />
University of Pretoria, South Africa<br />
and<br />
CJdeW Rautenbach<br />
FA Engelbrecht<br />
Eritrea is a relatively young country that gained independence in 1991. It is also regarded as<br />
one of the developing African nations that appear to be most vulnerable to climate change and<br />
variability because of widespread poverty - presumably as a result of poor management<br />
practices and a lack of expertise. Previous studies have indicated that countries in the Sahelian<br />
latitudes are noticeably affected by climate variability (especially droughts) related to the El<br />
Niño Southern Oscillation (ENSO) phenomena. Eritrea is located in the eastern part of the<br />
Sahelian latitudes, and is in general regarded as a semi-arid country. Future changes in the<br />
climate of this region might influence temperature and moisture prone activities, especially<br />
those related to agriculture. The assessment of past regional climate trends and the<br />
development of scenarios <strong>for</strong> possible future climate changes are regarded as important. To<br />
address these issues the PRECIS Regional Climate Model (RCM) System from the UK was<br />
implemented over the region spanning 5°N - 51°N and 2.5°E - 28°E. The model was firstly<br />
<strong>for</strong>ced at its lateral boundaries by a 30-year present-day (1961-1990) integration of the<br />
“atmosphere only” HadCM3H global General Circulation Model (GCM). Secondly, the model<br />
was <strong>for</strong>ced by “fully coupled” HadCM3 (<strong>for</strong> sea surface temperatures and sea ice) and<br />
“atmosphere alone” HadAM3H GCM derived boundary conditions <strong>for</strong> the A2 and B2 SRES<br />
scenarios in an attempt to generate a 20-year future climate change integration (2070-2090).<br />
The experiment allows <strong>for</strong> verification of present-day spatial and temporal per<strong>for</strong>mance of<br />
PRECIS over Eritrea, with specific emphasis on temperature and moisture. Possible climate<br />
change scenarios are also investigated.<br />
Acknowledgement: Met Office, Hadley Centre <strong>for</strong> Climate Prediction and Research, UK
Carel N. Bezuidenhout, Assessing The Value Of The Three Month Rainfall Outlook<br />
(SAWS) Within An Operational System To Forecast Sugarcane Production In South<br />
Africa<br />
Carel N. Bezuidenhout<br />
University Of KwaZulu-Natal, South Africa<br />
On average the South African sugar industry produces two million tons of sugar per annum,<br />
making it one of the ten largest cane sugar producers in the world. Climate variability in the<br />
eastern parts of South Africa has lead to a 25% coefficient of variance in sugar production over<br />
the past ten years. Timely and accurate yield <strong>for</strong>ecasts prior to and during the milling season<br />
holds the potential to improve various activities, such as milling operations, international trade<br />
and agronomic optimisation, within the industry. A yield <strong>for</strong>ecasting system using a crop<br />
model was developed. The system uses climate data to date and substitutes the future with up<br />
to ten different analogue years from the history. Analogue years are selected using the SAWS<br />
three month rainfall outlook. The aim of this study was to assess the accuracy of yield <strong>for</strong>ecasts<br />
when using the SAWS outlook as opposed to a neutral outlook over the period 1998 to 2002.<br />
Errors in yield <strong>for</strong>ecasts (on mill and industry scales) issued between January and May were<br />
reduced by between 10% and 20% when using the SAWS rainfall outlook as opposed to a<br />
neutral outlook. However, yield <strong>for</strong>ecasts based on the SAWS outlook that were issued in<br />
September were often inferior. Spatially it seems as if some areas benefit more from the SAWS<br />
outlook than others. Nevertheless, there is significant evidence that in general the SAWS<br />
outlook enhanced yield <strong>for</strong>ecasts in the sugar industry. The results also suggest that the<br />
technique of selecting ten historic analogue seasons might need some revision.
T.A Bigala, ACID RAIN DEPOSITION OVER SOUTH AFRICA<br />
T.A Bigala<br />
Climatology Research Group, University of the Witwatersrand,South Africa<br />
and<br />
S.J Piketh<br />
M Barenbrug<br />
MT Freiman<br />
Aerosols affect climate by absorbing or reflecting incoming solar radiation, and by affecting<br />
cloud microphysics, cloud albedo and precipitation The Highveld regions of Mpumalanga and<br />
Gauteng are the major industrial areas in South Africa. These areas play a significant role in<br />
the production and transport of aerosols. The urban and industrial areas in these provinces are<br />
important source emitters of sulphur, carbon, and their corresponding oxides, nitrous oxide and<br />
nitrogen dioxide. Measurements of aerosol optical thickness from the ground and aerosol size<br />
characteristics over the Highveld region were collected using hand- held haze meters and a<br />
CIMEL sun photometer. The optical properties of the industrial and urban aerosols over the<br />
Highveld region of South Africa were analysed between the winter months of May-June 2002<br />
and 2003 and the summer months of October-November 2002. The aerosol optical thickness<br />
observed over Pretoria, Bethal and Marble Hall in winter 2002 was high whose values ranged<br />
from 0.05 to 0.7 as compared to Secunda (0.05 to 0.2). In summer 2002, Marble Hall showed<br />
aerosol loading of 0.09 to 0.6 above Pretoria, Secunda and Bethal (0.12 to 0.59). In winter<br />
2003 aerosol loadings showed fairly similar results <strong>for</strong> Sebokeng, Rustenburg and Standerton,<br />
with values ranging from 0.05 to 0.5. The Angström exponent parameter had a wide range of<br />
0.1 to 2.5. This indicates a wide range in particle sizes over the Highveld region. Data from the<br />
sites over the Highveld has revealed values whose calculations are derived because of the<br />
influences of aeolian dust, coarse mode industrial and fine aerosols.
Mr. Albert Boehm, Proper Verification Scores For Areal Probabiity <strong>Forecasts</strong><br />
Mr. Albert Boehm<br />
Boehm Music Studio, USA<br />
Murphy (1973) defined a proper score as one that rewards a <strong>for</strong>ecaster who honestly<br />
communicates their degree of belief. Hedging is said to occur when the stated <strong>for</strong>ecast does<br />
not correspond to this degree of belief. Murphy was specifically addressing subjective<br />
probability <strong>for</strong>ecasts, but the principal holds <strong>for</strong> objective automated <strong>for</strong>ecasts as well as<br />
categorical <strong>for</strong>ecasts. The concept of a proper score can be extended in three ways. First,<br />
there is an important trans<strong>for</strong>mation between a degree of belief and a probability. For example,<br />
the belief that the 99% heaviest rain will occur generally does not correspond to a statement<br />
that the probability of rain over 5 cm is 99%. This trans<strong>for</strong>mation corresponds to the<br />
probability verification term calibration. The degree of belief ranking corresponds to<br />
sharpness. A score can be proper with respect to calibration or sharpness, both, or neither. In<br />
one case, a <strong>for</strong>ecaster could believe a 0% probability but call it 75% to improve the calibration<br />
score of the 70 to 80% bin which had 3 hits and no misses. Next, Murphy used the term<br />
hedging to specify an undesirable characteristic. Aside from the misstatement of degree of<br />
belief, hedging implies waffling, a vagueness or evasivness. However, hedging also means to<br />
optimize rewards by allocating resources <strong>for</strong> diverse alternatives - a very desirable<br />
characteristic in decision making under uncertainty. Instead improper influence can be used<br />
<strong>for</strong> a score that encourages misstatement. Thirdly, Murphy defined a proper score with<br />
respect to expected value. However, other attributes of a score can have improper influence.<br />
For example, a large sampling distribution can include many poor scores even with a good<br />
expected value. These three effects are exacerbated in areal probability <strong>for</strong>ecasts. Locations<br />
in an area can have different probabilities of, say, 5 cm of rain even though the <strong>for</strong>ecaster<br />
expects heavy rain at the 99% level over the entire area. A score can be proper <strong>for</strong> one type of<br />
coverage but improper <strong>for</strong> another. Areas often are highly correlated which inflates the spread<br />
of the sampling distribution. Ref: Murphy, A., 1973: Hedging and Skill Scores <strong>for</strong><br />
Probability <strong>Forecasts</strong>, J Appl. Meteor., 12, p215-222.
Julian Charles Brimelow, On The Application Of Teleconnection Data To Predict The<br />
Severity Of The Alberta Hail Season<br />
Julian Charles Brimelow<br />
Department Of Earth And Atmospheric Sciences, University Of Alberta, Canada<br />
Alberta is prone to frequent hailstorms during the summer, and the resulting damage amounts<br />
to millions of dollars in insured costs annually. It would there<strong>for</strong>e be advantageous to<br />
understand what processes modulate the intensity of the hail season and to then employ this<br />
knowledge to predict the potential severity of the hail season in advance. To this end, we<br />
analyzed almost 30 years of hail data (from a dense hail observation network) together with<br />
composite upper-air maps to identify those large-scale atmospheric characteristics that best<br />
differentiated between active and quiescent hail seasons. This analysis revealed that there were<br />
indeed marked and consistent differences in the summertime 500 hPa circulation regime over<br />
North America between active and quiescent hail seasons. These differences were also<br />
reflected in other variables such as the winter snow pack. It has been demonstrated in the<br />
scientific literature that the large-scale circulation over North America is modulated by<br />
teleconnection patterns, such as the Pacific North American oscillation, with lag times of<br />
several months. There<strong>for</strong>e, it stands to reason that knowledge of the phase and intensity of<br />
certain winter teleconnection indices could be utilized to predict the nature of the summertime<br />
large-scale circulation pattern over North America and thereby infer whether the expected<br />
circulation patterns will or will not be favourable <strong>for</strong> severe convection. Correlation map<br />
analyses indicated that summertime circulation patterns over western North America are<br />
modulated, at least in part, by the Multivariate ENSO index (MEI), Pacific decadal oscillation<br />
(PDO) and East Pacific oscillation (EPO) with lead times of up to six months. The<br />
teleconnection data were then used to identify thresholds of the MEI, PDO and EPO indices at<br />
specific lead times that best differentiated between active and quiescent hail seasons. Our<br />
research suggests that active hail seasons typically followed La Nina winters that occurred<br />
concurrently with a negative phase of the PDO and EPO. By contrast, quiescent hail seasons<br />
typically followed El Nino winters that occurred concurrently with a positive phase of the PDO<br />
and EPO. This set of guidelines can be applied to teleconnection indices in the months leading<br />
up to the summer to determine the likelihood of an active or quiescent hail season. Farmers<br />
could potentially use this in<strong>for</strong>mation to decide how much crop insurance to buy.
Paula Brown, Temperature Extremes In Southern New Zealand<br />
Paula Brown<br />
University Of Otago, New Zealand<br />
The economy of southern New Zealand is heavily resource dependent. Many of these<br />
resources are strongly influenced by climate variability, whether it be pastoral agriculture,<br />
horticulture, viticulture, <strong>for</strong>estry, winter and summer tourism or hydro-electricity generation.<br />
Southern New Zealand has some long temperature records of over 100 years, a large amount of<br />
climatic variability and is located in a region of the world where little climate in<strong>for</strong>mation<br />
exists. Daily minimum and maximum temperatures display a lot of variability over decades of<br />
measurements. When focusing on extremes it is often difficult to distinguish errors from<br />
genuine outliers. Most homogenisation methods utilise monthly means and statistical tests to<br />
identify inhomogeneities from reference series. However, the stations with long records in<br />
New Zealand have few neighbour stations to aid identification of inhomogeneities, particularly<br />
<strong>for</strong> the period 1852-1970. Periods of parallel temperature observations between station<br />
relocation allow compositing of temperatures using probability distribution matching methods<br />
of Trewin and Trevitt (1996). The CUMSUM method of Rhodes and Salinger (1993) is also<br />
applied to identify inhomogeneities. A preliminary analysis of a homogenised temperature<br />
series will be presented.
John Caesar, Creation Of Long-Running, Homogeneous Daily Gridded Global<br />
Temperature Datasets<br />
John Caesar<br />
Met Office, Hadley Centre For Climate Prediciton and Research, United Kingdom<br />
and<br />
Lisa Alexander<br />
Simon Brown<br />
Long, homogeneous quality-controlled climate data are particularly important <strong>for</strong> the study of<br />
climate extremes, given that inhomogeneities caused by artificial jumps are likely to be<br />
detected as erroneous extreme events. For many reasons. long temporal and large spatial scale<br />
daily climate datasets have been available <strong>for</strong> this kind of study. We describe the creation of<br />
new homogeneos gridded daily maximum and minimum temperature datasets based solely on<br />
quality controllled station data from freely available data sources including the Global Daily<br />
Climatology Network (GDCN), Global Climate Observing System (GCOS) and European<br />
Climate Assessment (ECA). The station data were quality controlled to test <strong>for</strong> outliers and<br />
homogeniety and anomalities were calculated so that the data were more spatially coherent,<br />
particularly over regions of varying elevation. The anomalies were gridded with an angulardistance<br />
weighting technique using correlation decay distances calculated over a number of<br />
latitude bands due to the seasonally and spatiallu varying pattern of inter-station relationships .<br />
We have produced daily maximum and minimum temperature datasets covering the period<br />
1950 to 2000 on a 2.5 by 3.75 degree resolution grid, with spatial patterns that are coherent and<br />
physically realistic in areas with suffircient data density. The results were also compared with<br />
the Hadley Centre atmosphere-only model, HadAM3H. Although the model displays a greater<br />
range the gridded observations at the extreme upper and lower ends of the distribution <strong>for</strong> some<br />
areas, the results are generally encouraging.
Hong-Xing Cao, Long Memory Of East-Asian Monsoon And Its Self-Memory Modeling<br />
Hong-Xing Cao<br />
Chinese Academy Of Meteorological Sciences, China<br />
and<br />
Hui-zhong He<br />
Rechard Blender<br />
Neng Shi<br />
The observed series of East-Asian monsoon index <strong>for</strong> 1873 to 2000 are analyzed with<br />
statistics; its trends and climate change in different periods have been revealed too. It is shown<br />
that the East-Asian monsoon has been decreased since 1873, and its interdecadal change is<br />
significant. We focus on the decadal to centennial changes in East-Asian monsoon, which are<br />
connected to a long time memory of the East-Asian monsoon. In order to understand the long<br />
time memory of the East-Asian monsoon, the detrended fluctuation analysis (DFA) is applied<br />
to the time series x(i) (i=1,..., N) of East-Asian monsoon. The departure series of x(i) are<br />
calculated and the integrated series of x(i) are denoted as y(k).Then y(k) is divided into<br />
segments of equal length s and the least-square line fitting the data in each segment, yn(k), is<br />
calculated. The series y(k) is detrended by subtracting the local trend yn(k), and the root-mean<br />
square fluctuations of the detrended series F(s) are computed. F(s) is computed <strong>for</strong> all<br />
'segment-size' s. If log F(s) increases linearly with log s, then the slope of the line relating F(s)<br />
and s in a log-log scale gives the scaling exponent ª┴. According to the random walk theory,<br />
the fluctuations F(s) in a given time segment of length s are related to the autocorrelation<br />
function C(s). For the long time power law correlations exhibit a power spectra: C(s)~s-ª├, the<br />
fluctuations F(s) increase as a power law: F(s) ~ sª┴, ª┴=1ú¡1/ª├. We have computed the East-<br />
Asian monsoon indices with the DFA, The results show that the East-Asian monsoon presents<br />
a long time memory; it means the East-Asian monsoon has significant persistence in the yearly<br />
series. For winter monsoon, ª┴=0.55, ª├=0.9; but <strong>for</strong> summer monsoon, ª┴=0.73, ª├=0.54. It is<br />
shown that the difference between long time memories of monsoons in winter and in summer<br />
is remarkable. As the weather and the climate over China and East Asia are strongly influenced<br />
by the East-Asian monsoon, in particularly, in summer, so the long time memory of the<br />
summer monsoon hints better predictability <strong>for</strong> climate change. In order to model the change<br />
in East-Asian monsoon, a newly-developed time series technique, namely, the data-based selfmemory(DASM)<br />
model based on self-memory principle of dynamic system, has been used,<br />
with which` modeling the East-Asian monsoon indices has been made. The calculating results<br />
show the model is capable of simulating and <strong>for</strong>ecasting the climate change in East-Asian<br />
monsoon.
S Carter, Identifying General Circulation Model Biases Using Self-Organising Maps<br />
S Carter<br />
Environmental and Geographical Science Department, University of Cape Town, South Africa<br />
and<br />
Bruce C. Hewitson<br />
General Circulation Models (GCMs) are the major vehicle <strong>for</strong> assessing global climate change.<br />
However, it has been broadly acknowledged that there are many regional biases that have to be<br />
considered when using these models. With the use of Self Organising Maps (SOMs) one can<br />
characterise the types of circulation that each GCM simulates and compare these archetypal<br />
circulation fields to those seen in reality. Two fully coupled ocean-atmosphere GCMs were<br />
compared to National Centre <strong>for</strong> Climate Prediction (NCEP) data, using the later as a proxy <strong>for</strong><br />
reality. Additionally the relative frequencies <strong>for</strong> each synoptic state were compared between<br />
models and NCEP data, allowing <strong>for</strong> further biases to be identified.
Lynda Chambers, The Changing Climate Of South-Western Australia<br />
Lynda Chambers<br />
Bureau Of Meteorology Research Centre, Australia<br />
and<br />
Neville Nicholls<br />
In many regions of Australia there has been the suggestion that the climate has either changed<br />
or is in the process of changing. This is particularly evident in the south west of Australia,<br />
where rainfall has decreased substantially since the mid-20th century. In 1997 several<br />
Australian government agencies <strong>for</strong>med a partnership with the aim of improving management<br />
decisions of climate-dependent industries and environmental management, through improved<br />
understanding and definition of interannual and interdecadal climate variability. Six years on,<br />
this paper highlights some of the key findings of this research, as well as identifying gaps in<br />
our current knowledge.
Richard Chandler, Rainfall Simulation Using Generalised Linear Models<br />
Richard Chandler<br />
Department of Statistical Science, University College London, United Kingdom<br />
and<br />
Chi Yang<br />
We consider the problem of simulating sequences of daily rainfall at a network of sites, in such<br />
a way as to reproduce a variety of properties realistically over a range of spatial scales. The<br />
properties of interest will vary between applications, but typically will include some measures<br />
of 'extreme' rainfall in addition to means, variances, proportions of wet days and<br />
autocorrelation structure. Our approach is to fit a Generalized Linear Model (GLM) to<br />
raingauge data and, with appropriate incorporation of inter-site dependence structure, to use the<br />
GLM to generate simulated sequences. We illustrate the methodology using a dataset from<br />
southern England, and show that the GLM is able to reproduce many properties at spatial<br />
scales ranging from a single site to 2000km2 (the limit of the available data). Having<br />
established this, we explore the potential <strong>for</strong> using the GLM to generate future rainfall<br />
scenarios conditioned on climate model outputs.
KE Chiloane, Detection of volatile organic compounds (VOCs) from Cape Town Brown<br />
Haze.<br />
KE Chiloane<br />
University of the Witwatersrand, South Africa<br />
and<br />
S.J Piketh<br />
L.B Otter<br />
Cape Town is among the largest tourist destinations on the continent, resulting in tourism being<br />
projected as one of its most important economic growth sectors. But brown haze has a strong<br />
degrading effect on visibility which is immediately apparent to the general public and tourists.<br />
This “brown haze" is described as a brown-coloured smog found predominantly in the<br />
wintertime that occurs mostly from April to September due to strong temperature inversions<br />
and windless conditions that can occur during these months. This haze leads to the build-up of<br />
pollutants emitted into the atmosphere and is normally most intense in the morning after which<br />
it lifts and disperses as the day progresses. The haze is also a cause <strong>for</strong> concern to residents<br />
because of health risks that may accompany the visible air pollution. The project aims to<br />
characterise volatile organic compounds (VOCs) associated with anthropogenic adverts that<br />
are capable of producing photochemical oxidants by reactions with oxides of nitrogen in the<br />
presence of sunlight from the haze. Specific VOCs compounds to be characterised are benzene,<br />
toluene, ethyl benzene and xylene (BTEX). Volatile organic compounds (VOCs) samples were<br />
collected into canisters <strong>for</strong> GC analysis, from a South African Weather Service (SAWS)<br />
research aircraft, Aerocommander 690A (ZS- JRB) from July 29, 2003 through August 26,<br />
2003. Airborne measurements were also carried out using Fourier Trans<strong>for</strong>m Infrared (FTIR)<br />
<strong>for</strong> both brown haze and non-brown haze days. Gas Chromatographic (GC) instrument data<br />
will be used to validate the FTIR data. Comparisons of these VOCs with other pollutants (e.g.<br />
SO2, NO2, ozone, etc) as well their trans<strong>for</strong>mations during the day will be investigated at<br />
different times of the day. In so doing, the evolution, sources, and constituents of the haze can<br />
be determined.
Caio Coelho, Forecast Calibration And Combination: A Simple Bayesian Approach For<br />
ENSO<br />
Caio Coelho<br />
Department of Meteorology, University of Reading, United Kingdom<br />
and<br />
Sergio Pezzulli<br />
Magdalena Balmaseda<br />
Francisco Doblas-Reyes<br />
David Stephenson<br />
This study presents a simple approach <strong>for</strong> combining empirical with raw (i.e. not bias<br />
corrected) coupled model ensemble <strong>for</strong>ecasts aiming to provide more skillful interval <strong>for</strong>ecasts<br />
of an ENSO index. A Bayesian normal model has been used to combine empirical and raw<br />
coupled model December SST Nino-3.4 index <strong>for</strong>ecasts started at the end of the preceding July<br />
(5-month lead time). The empirical <strong>for</strong>ecasts were obtained by linear regression between<br />
December and the preceding July Nino-3.4 index values over the period 1950-2001. Coupled<br />
model ensemble <strong>for</strong>ecasts <strong>for</strong> the period 1987-99 were provided by ECMWF, as part of the<br />
Development of a European Multi-model Ensemble system <strong>for</strong> seasonal to inTERannual<br />
prediction (DEMETER) project. Empirical and raw coupled model ensemble <strong>for</strong>ecasts alone<br />
have similar mean absolute error <strong>for</strong>ecast skill score, compared to climatological <strong>for</strong>ecasts, of<br />
around 50% over the period 1987-1999. The combined <strong>for</strong>ecast gives an increased skill score<br />
of 74% and provides a well-calibrated and reliable estimate of <strong>for</strong>ecast uncertainty. This<br />
methodology can also be extended to combine gridded equatorial Pacific SST ensemble<br />
<strong>for</strong>ecasts from different coupled models (multimodel approach).
Andrew Colman, Predictions Of Lake Volta Inflow Using Statistical And Dynamical<br />
Seasonal Forecast Models<br />
Andrew Colman<br />
Met Office, Hadley Centre For Climate Prediction And Research, United Kingdom<br />
and<br />
Richard Graham<br />
Results of recent research at the Met Office into the use of seasonal rainfall <strong>for</strong>ecasts to<br />
improve long-range prediction of inflow into Lake Volta, Ghana will be described. The work<br />
has been carried out in collaboration with the Volta River Authority (VRA), Ghana. By way of<br />
introduction the scientific basis <strong>for</strong> seasonal prediction will be briefly reviewed and Met Office<br />
systems <strong>for</strong> making routine seasonal <strong>for</strong>ecasts to 6-months ahead described (a range of Met<br />
Office seasonal <strong>for</strong>ecast products, and an introduction to seasonal <strong>for</strong>ecasting, may be viewed<br />
at http://www.metoffice.com/research/seasonal/) Hydro-electric power generation from the<br />
dam at Akasombo produces approximately 50% of Ghanas electricity and prediction of inflow<br />
into the lake, particularly that associated with the June to September rainy season, is a priority<br />
in managing subsequent use of the water resource and planning the need <strong>for</strong> supplementary<br />
generation from thermal power stations. The need <strong>for</strong> reliable inflow prediction has been<br />
enhanced by an increase in the frequency of relatively dry years since the dam was<br />
commissioned in 1966. VRA currently make routine inflow predictions with regression<br />
relationships which use preceding observations of monthly-mean catchment rainfall and river<br />
flow as the sole predictors, with no inclusion of predictors based on long-range <strong>for</strong>ecasts of<br />
seasonal rainfall. New regressions equations which include input from Met Office seasonalrange<br />
rainfall predictions <strong>for</strong> the Volta catchment have been developed and deliver substantial<br />
improvements on the existing methods. Seasonal <strong>for</strong>ecast in<strong>for</strong>mation used includes input from<br />
empirical rainfall prediction models, based on observed large-scale sea surface temperature<br />
predictor patterns, and also from real-time integrations of a dynamical coupled oceanatmosphere<br />
model (a version of the Hadley Centre climate model). The new inflow prediction<br />
method and its improved per<strong>for</strong>mance will be described. Although currently specific to lake<br />
Volta, the research has scope <strong>for</strong> wider application in <strong>for</strong>ecasting water availability in other<br />
parts of the globe where seasonal prediction skill is sufficient. In this context, a global<br />
assessment of prediction skill <strong>for</strong> seasonal rainfall will be presented.
Mr Andrew Colman, Predictability Of Extreme Rainfall And Temperature Seasons From<br />
Cgcms As Demonstrated By The Demeter Handcasts<br />
Mr Andrew Colman,<br />
Met Office, Hadley Centre For Climate Prediction And Research, United Kingdom<br />
Extreme seasons <strong>for</strong> example droughts, hot summers often have a disproportionate impact on<br />
society and the economy. Predictions of extreme seasons by the EU funded Demeter project<br />
Coupled ocean-atmosphere Global Circulation Model (CGCM) hindcasts have been assessed<br />
using a variety of skill measures. Extremes are defined as the outer quint (20%) or outer decile<br />
(10%) of the observed PDF. Deterministic <strong>for</strong>ecasts have been assessed using Mean Square<br />
Skill Scores (MSSS) and using Gerrity skill scores.<br />
Given that extremes are by definition unlikely and given the uncertain nature of seasonal<br />
<strong>for</strong>ecasts, extreme <strong>for</strong>ecasts are an ideal candidate <strong>for</strong> probability <strong>for</strong>ecasts. Model output has<br />
been converted to probabilities using discriminant analysis and other methods and probabilities<br />
assessed using the Relative Operating Characteristic (ROC) measure. Skill of <strong>for</strong>ecasts using<br />
the Met Office GLObal SEAsonal (GLOSEA) <strong>for</strong>ecast model have been compared with the<br />
skill of <strong>for</strong>ecasts produced by combining output from 3 models (Met Office GLOSEA,<br />
ECMWF and Meteo France) and of persistence. Extreme rainfall and temperature seasons<br />
have been found to be slightly more predictable than ordinary seasons on average with highest<br />
skill in the tropics. Examples will be shown where the 3 model <strong>for</strong>ecasts per<strong>for</strong>m better than<br />
GLOSEA and vice versa. The dependence of skill on extreme definition, geographical<br />
location, skill measure and <strong>for</strong>ecast method will also be discussed.
Claire Davies, Towards High-Resolution <strong>Probabilistic</strong> Climate Predictions<br />
Claire Davies<br />
School of Geography and the Environment, University Of Ox<strong>for</strong>d, United Kingdom<br />
and<br />
Mark New<br />
<strong>Myles</strong> Allen<br />
Dave Stain<strong>for</strong>th<br />
There are two key limitations to the use of General Circulation Model (GCM) predictions <strong>for</strong><br />
climate change impact assessment: uncertainties in model physics and the relatively coarse<br />
spatial scale of GCM data. We describe a project that will provide a solution to these<br />
limitations by making use of data from new ef<strong>for</strong>ts in quantifying GCM uncertainties, the<br />
ClimatePrediction.net (CPdN) project, in order to generate high-resolution probabilistic climate<br />
change predictions. The project will embed empirical downscaling software within the<br />
HadCM3 GCM that is running in large-ensemble climate change experiments, distributed<br />
through the internet on individual 'volunteer' PCs under the CPdN project. The software will<br />
analyse diagnostic fields 'on the fly' to generate and archive time series of predictor variables<br />
<strong>for</strong> the downscaling algorithm. The predictor variables will be returned <strong>for</strong> archive on CPdN<br />
sever nodes, <strong>for</strong> later input into the downscaling algorithm to generate downscaled predictions<br />
<strong>for</strong> each CPdN run (potentially many tens of thousands of predictions). The downscaled<br />
predictions can then be analysed to generate probability distributions <strong>for</strong> key surface climate<br />
variables.
R D Diab, Synthesis of recent tropospheric ozone research over Africa<br />
R D Diab<br />
University of Kwazulu-Natal, South Africa<br />
A number of large field experiments (<strong>for</strong> example, SAFARI-92, SAFARI-2000, EXPRESSO)<br />
have taken place over the last decade or so. Routine ozone profiling as part of the SHADOZ<br />
ozonesonde network takes place at Irene and Nairobi, and aircraft measurements in the<br />
MOZAIC programme have contributed both upper tropospheric data and profile data at<br />
selected airports. Chemical-transport and trajectory modelling have also increased our<br />
understanding of the relative strength of sources and atmospheric dynamics. The purpose of<br />
this paper is to synthesize these research results from a variety of sources to present an<br />
overview of the key characteristics of tropospheric ozone over Africa.<br />
Attention is drawn, in the first instance, to the importance of Africa as a continent with a large<br />
land mass in the tropics and a rich and diverse mix of sources of ozone precursor gases.<br />
Highlighted are the contrasts in ozone concentration between east and west Africa and interhemispheric<br />
differences, the build-up of ozone due to re-circulation in the subtropical<br />
anticyclone, the concept of a giant natural photochemical reactor over central and southern<br />
Africa and the significance of inter-continental transport to and from the continent
T S Dlamini, CHARACTERISATION OF EMISSIONS FROM SPONTANEOUS<br />
COMBUSTION OF COAL AT WITBANK<br />
T S Dlamini<br />
University of the Witwatersrand, South Afirica<br />
Atmospheric pollution associated with coal mining activities results mainly from combustion<br />
processes. Spontaneous combustion is one of the most prevalent and serious causes of coal<br />
fires. It is a process in which an oxidation reaction occurs without any externally applied heat<br />
from a spark, such that temperature rise is due to the coal’s heat release through chemical<br />
reaction (Querol, et. al., 1998). This incomplete combustion of coal is known to generate<br />
poisonous gases (LeRoux, 1972).<br />
Characterizing and quantifying these emissions, which are the main aim of this research, are<br />
important steps in air quality monitoring. Gases to be measured are nitrogen oxides, sulphur<br />
dioxide, hydrogen sulphide, carbon monoxide, carbon dioxide, ozone and volatile organic<br />
compounds. These gases are to be captured using a caravan monitoring station with<br />
instruments, within the premises of the Kleinkopje Colliery. Meteorological parameters (wind<br />
velocity, wind speed, temperature profile, relative humidity, pressure, rainfall and solar<br />
radiation) will also be measured at ground level and this will enable the daily trans<strong>for</strong>mations<br />
of the pollutants to be determined.
Dietmar Dommenget, A Cautionary Note On The Interpretation Of Eofs<br />
Dietmar Dommenget<br />
Leibniz-Institut Für Meereswissenschaften, Germany<br />
and<br />
Mojib Latif<br />
EOF and rotated EOF analyses are widely used tools in climate research. In recent years there<br />
have been several cases in which the EOF- or rotated EOF analyses were used to identify<br />
physical modes. These are the ``tropical Atlantic'' and the ``tropical Indian Ocean SST dipole''<br />
modes and the different modes of the Northern Hemisphere winter surface air pressure<br />
variability. Here we would like to discus the problems in interpreting these statistically derived<br />
modes as physical modes. By constructing an artificial example we shall show that the patterns<br />
derived from EOF- or rotated EOF analysis can lead to misinterpretations. This study should be<br />
seen as a cautionary note to highlight the pitfalls which may occur when using the EOF or<br />
rotated EOF techniques.
C.B. Du Preez, Classification of the synoptic conditions over the South Western Cape<br />
during the ripening period of grapes (February 1996 - 2000)<br />
C.B. Du Preez<br />
ARC-Institute <strong>for</strong> Soil, Climate and Water, South Africa<br />
and<br />
V.M.F. Bonnardot<br />
V.A. Carey<br />
A preliminary study of the daily weather situations was per<strong>for</strong>med <strong>for</strong> South Africa and <strong>for</strong><br />
February months (ripening period of the grapes in the Western Cape), similar to the synoptic<br />
classification realized <strong>for</strong> the temperate latitudes in France (Van Jones & Davis, 2000), in order<br />
to study the relationships between climate and viticulture at lower latitudes. Daily weather<br />
bulletins of the South African Weather Service (SAWS) and surface data observed at Cape<br />
Town International Airport by the SAWS were used. The synoptic weather patterns were<br />
classified in four main patterns, namely: the ridging of the Atlantic Ocean High over the<br />
western parts of South Africa, the passing of a cold front over the Western Cape, the<br />
dominance of the interior trough, and the ridging of the Indian Ocean High over the Eastern<br />
parts of South Africa. Of these four classifications, two are applicable in the Western Cape,<br />
namely the ridging Atlantic Ocean High and the cold front. The Atlantic Ocean High occurs on<br />
42% of the days in February over the five seasons (1996-2000) used <strong>for</strong> the classifications,<br />
whilst the cold front occurs on 24% of the days. The occurrence of the Atlantic Ocean High<br />
varies between 64% (1998) and 32% (1999). Comparing these occurrences with previous<br />
research on the influence of vintage (meso-climate) on wine aroma (Carey et al., 2000), it was<br />
found, <strong>for</strong> instance, that warmer conditions in 1998 resulted in predominant tropical fruit<br />
aromas in the Sauvignon Blanc wines, and tree fruit aromas in Chardonnay wines. To<br />
conclude, it is important to broaden this research to include the whole season because one<br />
viticultural stage will influence the others.<br />
Carey V.A., V.M.F. Bonnardot, A. Schmidt & J.C.D. Theron (2000). The interaction between<br />
vintage, vineyard site (meso-climate) and wine aroma…South Africa (1996-2000). O.I.V. Bull.<br />
(2003) Vol. 76, no863-864., 4-29.<br />
Van Jones G. & R.E. Davis (2000). Climate influences on grapevine phenology, grape<br />
composition and wine production and quality <strong>for</strong> Bordeaux, France. Am. J. Enol. Vitic., Vol.<br />
51. No3., 249-261.
FA Engelbrecht, THE NEW CLIMATE OF SOUTHERN AFRICA<br />
FA Engelbrecht<br />
University of Pretoria, South Africa<br />
and<br />
L RAM<br />
In this paper it is hypothesised that the climate of Southern Africa is steadily settling into a new<br />
dynamical mode in response to Global Warming. In the new climate, mid-level high-pressure<br />
systems will become well established over the eastern part of the subcontinent in summer.<br />
Regions under the direct influence of subsidence underneath these systems (north-eastern<br />
South Africa and Zimbabwe) will generally experience drier conditions. In contrast, regions to<br />
the north of these highs (Mozambique and Zambia) will experience wetter conditions, since<br />
they will be under the influence of stronger easterly winds. Stronger moisture advection around<br />
the mid-level highs will cause rainfall to increase over the central to western and southern<br />
interior of South Africa. Since these highs will intensify as Global Warming intensifies, the<br />
associated cloud bands (and rainfall) are expected to be gradually displaced further and further<br />
to the west and south. Upper air troughs from the mid-latitudes will simultaneously be <strong>for</strong>ced<br />
to follow more southerly tracks. As the present-day synoptic scale systems settle into their new<br />
average positions, certain regions may experience wetter conditions, which will change to drier<br />
conditions on a time scale of decades! The changes described above are theorised to be driven<br />
by stronger convection in the greenhouse-warmed Tropics. The excess mass that ascends over<br />
the Tropics eventually descends over the eastern subcontinent, in this way causing<br />
anomalously strong mid-level highs. Winter patterns a hypothesised to undergo similar<br />
changes, which are also discussed in the paper.<br />
Simulations of climate change by two high-resolution regional climate models (DARLAM and<br />
C-CAM), <strong>for</strong>ced by fully coupled Ocean-Atmosphere General Circulation models (AOGCMs)<br />
have been instrumental in <strong>for</strong>mulating this theory. These model results are discussed in detail<br />
in the paper.<br />
Acknowledgements<br />
Many thanks to Dr John McGregor, Prof. Hannes Rautenbach and Christien Potgieter <strong>for</strong><br />
numerous interesting discussions about modelling and climate.
Jesus Fernandez, Precipitation Climatic Prediction Over The Mediterranean Through<br />
Statistical Downscaling Of Multi--Model Output From The AMIP2 Project<br />
Jesus Fernandez<br />
Applied Physics II, University Of The Basque Country, Spain<br />
and<br />
Dr Jon Saenz<br />
Dr Francisco Doblas-Reyes<br />
Dr Eduardo Zorita<br />
The Atmospheric Model Intercomparison Project (AMIP) provides a standard experimental<br />
protocol <strong>for</strong> running global atmospheric general circulation models (AGCMs). This kind of<br />
project is designed with the goal of assessing the inter--model variability of climate prediction,<br />
because the AGCMs are run considering common boundary conditions. Based on 16 models<br />
run under the AMIP2 standard protocol, this work estimates the predictability of precipitation<br />
over the Mediterranean Basin. The main idea behind this work is to quantitatively evaluate<br />
the predictability of precipitation in a region of interest, considering the joint errors derived<br />
from the use of state-of-the-art AGCMs and downscaling methods. This may yield an<br />
indication of the potential predictability that can be achieved under climate change scenarios.<br />
AGCMs do not correctly reproduce precipitation, thus, only large scale fields (namely, SLP)<br />
are directly taken from the multi--model output. Precipitation is then obtained by means of<br />
statistical downscaling of the model results. Linear (based on Canonical Correlation Analysis)<br />
and non-linear (based on analogs) statistical downscaling techniques are used. Since we are<br />
concerned with the analysis of second-kind predictability, Probability Density Functions<br />
(PDFs) of precipitation <strong>for</strong> the target region are calculated <strong>for</strong> the direct output from the<br />
models, the downscaled precipitation, the 'mean model' downscaled precipitation and several<br />
observed precipitation datasets.
C Ferro, A Survey of Statistical Methods For Climate Extremes<br />
C Ferro<br />
Climate Analysis Group, Department of Meteorology, The University of Reading, Reading,<br />
United Kingdom<br />
Extreme weather events take many <strong>for</strong>ms and a variety of techniques are useful <strong>for</strong><br />
determining their statistical properties. I shall focus on methods from the field of extremevalue<br />
theory. The survey will review classical methods that are popular in climate research,<br />
assess the scope <strong>for</strong> applying more elaborate methods, and propose areas <strong>for</strong> future<br />
methodological development. Methods will be illustrated using data from the European<br />
regional climate modelling experiment PRUDENCE.
Irene Fischer-Bruns, A Modelling Study On The Variability Of Storm Activity On Time<br />
Scales Of Decades And Centuries<br />
Irene Fischer-Bruns<br />
Max-Planck-Institute For Meteorology, Germany<br />
The output of several multi-century simulations with a fully coupled OAGCM is examined<br />
with respect to the variability of storm activity in winter <strong>for</strong> both hemispheres on time scales of<br />
decades and longer. The frequency of maximum wind speed events within a grid box, using 8<br />
and 10 Bft as threshold, is used as characteristic parameter. Four simulations are considered -<br />
two historical climate runs with time-variable solar, volcanic and greenhouse gas <strong>for</strong>cing of the<br />
last five centuries, one control run representative <strong>for</strong> present day conditions, and a climate<br />
change experiment. The main result <strong>for</strong> the historical simulations and the control run is that<br />
storm activity is remarkably stationary. Global maps of storm frequency <strong>for</strong> different centuries<br />
do hardly differ, even though significant temperature anomalies temporary emerge in these<br />
runs. Variations in solar and volcanic <strong>for</strong>cing as well as in greenhouse gas concentrations<br />
within the range of the past few hundred years are not related to variations in storm activity. In<br />
the climate change run, which is <strong>for</strong>ced by a 1% increase of CO2 p.a, however, a gradual<br />
change towards more storms in all three storm tracks (North Atlantic, North Pacific, Southern<br />
Ocean) is simulated. A more detailed analysis of the variability of storm activity is done with<br />
the help of EOFs <strong>for</strong> both winter hemispheres. The resulting PC indicates the storm activity.<br />
The hemispheric mean temperature and the storm activity are decoupled in pre-industrial times.<br />
In the transient greenhouse gas scenario, however, the storm activity parallels the development<br />
of temperature, and exceeds the two σ-range of pre-industrial variations in the early 21st<br />
century.
Maria Dolores Frias, Seasonal Forecast Of Downscaled Maximum Temperature Over<br />
The Iberian Peninsula Using Multi-Model Ensemble Versus Single Models By<br />
DEMETER Project.<br />
Maria Dolores Frias<br />
University Of Salamanca, Spain<br />
and<br />
Jesus Fernandez<br />
Jon Saenz<br />
Concepcion Rodriguez-Puebla<br />
An assessment is made about the ability of an ensemble of quasi-independent models to<br />
produce more reliable regional <strong>for</strong>ecasts than a single model. The multi-model ensemble<br />
system developed on the European project known as DEMETER has been considered to<br />
analyze the predictability of maximum temperature over the Iberian Peninsula. This project<br />
provides seven global atmosphere-ocean coupled models from different European<br />
meteorological centers, each running from an ensemble of nine initial conditions. The multimodel<br />
ensemble mean and the single models provide large scale in<strong>for</strong>mation to be translated<br />
to the regional scale taking into account the connection between the North Atlantic sea level<br />
pressure and maximum temperature over Iberian Peninsula. Statistical downscaling based on<br />
Canonical Correlation Analysis is applied in this study in order to estimate maximum<br />
temperature in 55 observation sites evenly covering the Iberian Peninsula. Maximum<br />
temperature estimated from the multi-model ensemble mean and single models are contrasted<br />
with station data by means of correlation, variance fraction and Brier skill score. The results<br />
show that the downscaled multi-model ensemble mean underestimates the observed variability,<br />
but is more correlated to observations than single models which in general overestimate the<br />
variability. Correlation skill is high in early winter and spring and February is the most<br />
predictable month.
T Gill, AN ASSESSMENT OF CHANGING MEAN ANNUAL PRECIPITATION FOR<br />
400 SOUTH AFRICAN RAINFALL STATIONS FROM 1911 TO 2000<br />
T Gill<br />
South African Weather Service, South Africa<br />
and<br />
Andries Kruger<br />
The work being presented is a first step in the assessment of changing mean annual<br />
precipitation over South Africa. The research is a response to a debate which is currently<br />
raging in climate change circles as to whether or not precipitation is increasing or decreasing in<br />
the country. A running 30 year normal was calculated on a decadal interval (1911 to 1940,<br />
1921 to 1950 and so on) <strong>for</strong> each of approximately 400 rainfall stations in South Africa that<br />
have sufficiently long daily rainfall time series. No missing data was interpolated and the daily<br />
rainfall record that was used was left untouched. The normal values of mean annual<br />
precipitation were calculated <strong>for</strong> each station and trends were determined and mapped. A high<br />
degree of variability was found in these trends, both within climate regions and rainfall<br />
districts. The trends were then tested <strong>for</strong> significance and the results mapped. Some<br />
explanations are offered <strong>for</strong> variability which persisted in the significant changes in rainfall,<br />
looking specifically at the influence of topography and increasing urbanization, but these<br />
studies are far from comprehensive.<br />
The intention in the study is to provide a springboard from which further research can be<br />
initiated. Some areas of research that can possibly be undertaken are to apply statistical<br />
interpolation techniques to the daily data in order to fill in some of the missing data and then to<br />
test the significance of the trends again. The number of precipitation days as well as the<br />
intensity of the rainfall could be analysed in order to determine the kind of changes in the<br />
rainfall that may be occurring in conjunction with the precipitation trends. It might also be<br />
useful to further analyse the trends using stations that have remained fairly rural in nature and<br />
compare them to those that have become increasingly surrounded by expanding urban areas.
Nicholas Graham, Ensemble Expansion For Seasonal Climate Prediction Using<br />
Recombination<br />
Nicholas Graham<br />
Hyrdologic Research Center, Scripps Institution Of Oceanography, USA<br />
and<br />
Simon Mason<br />
One primary goal of operational seasonal climate prediction systems is to project the<br />
probability of relatively extreme seasonal averages or totals. One requirement to make such<br />
predictions is accurate knowledge of the probability distribtution of the <strong>for</strong>ecast model output.<br />
In many cases, the size of the model ensemble may be small compared with the size required<br />
to resolve well the probability of a <strong>for</strong>ecast event exceeding some value. We present a method<br />
<strong>for</strong> the expansion of ensemble size <strong>for</strong> two-tierred seasonal prediction systems (in which the<br />
sea surface temperature data is prescribed). The method is based on recombination of<br />
individual monthly values from the various ensemble members to construct a much larger<br />
population of alternative outcomes. Under the assumption of linear independence of sequential<br />
monthly <strong>for</strong>ecast values from any particular ensemble member, these recombined outcomes<br />
are equally likely, thus allowing the construction of a large unbiased large population which<br />
obeys basic constraints of model physics. An additional benefit is that the relationships<br />
between differing variables (<strong>for</strong> example, temperature and precipitation) is maintained.<br />
The results show that if the monthly values are linerly independent, the increase in ensemble<br />
size is proportional to the number of ensemble members. We examine the per<strong>for</strong>mance of the<br />
method using idealized models and with actual AGCM output, and also test the effects of<br />
violations of the assumption of linear independence, and of differing monthly variance.
Tomas Halenka, On The Statistical Analysis Of Solar Activity Impact On Stratosphere-<br />
Troposphere Global Circulation Patterns<br />
Tomas Halenka<br />
Charles University, Dept. Of Meteorology And Environment Protection, Czech Republic<br />
The long-term behaviour of global circulation structures and their connections to some heliogeophysical<br />
influence, especially solar activity, has been studied <strong>for</strong> SOLICE Project recently.<br />
To represent an objective characteristics of circulation patterns the spectral structure of both<br />
stratospheric and tropospheric fields is analysed in terms of spherical harmonics coefficients of<br />
expansions <strong>for</strong> potential vorticity, NCEP/NCAR database of reanalyses is used <strong>for</strong> period<br />
1948-2002 with monthly data. Temporal analysis of significant spherical harmonics is<br />
introduced as well as the comparison of their changes with respect to the changes of different<br />
sets of solar, geomagnetic and global circulation indices. A strong connections to a set of<br />
extraterrestrial parameters appear <strong>for</strong> some distinctive shapes of polar vortex as presented in<br />
composites <strong>for</strong> solar maximum and minimum in vertical structure. The natural variability<br />
connected to the extraterrestrial influence is studied as well as interannual variability with the<br />
emphasis to the QBO and ENSO. The systematic review of the appropriate correlations and<br />
linear regression analysis are presented and decadal variability and long-term trends are<br />
pointed out <strong>for</strong> some of wave numbers. Long-term changes in the variability of the circulation<br />
patterns are analysed by means of wavelet analysis as well.
Gabriele Hegerl, Detection Of Anthropogenic Climate Change: Using The Past As A<br />
Guide To The Future<br />
Gabriele Hegerl<br />
Division Of Earth And Ocean Sciences, Nicholas School Of Environment, USA<br />
and<br />
Tom Crowley<br />
Francis Zwiers<br />
Peter Stott<br />
Detecting and estimating the anthropogenic contribution to past climate change is necessary to<br />
build confidence in predictions of future climate change. Estimates based on the instrumental<br />
period will be most complete, but have problems separating the influence of different external<br />
influences on climate, such as from solar and greenhouse gas <strong>for</strong>cing, and do not allow <strong>for</strong> a<br />
well-sampled estimate of the un<strong>for</strong>ced residual noise contribution. Paleo-reconstructions of<br />
hemispheric scale surface temperature beyond the instrumental period are more uncertain, but<br />
can provide help with both problems. Results are shown using a large ensemble of<br />
simulations with a simple climate model to construct a probability density function <strong>for</strong> climate<br />
sensitivity. While these results are important <strong>for</strong> model validation, society is more concerned<br />
about changes in variables that affect it more directly, such as changes in rainfall and climate<br />
extremes. The outlook <strong>for</strong> detection of changes in temperature and precipitation extremes is<br />
discussed by studying changes from simulations with two different atmosphere-ocean general<br />
circulation models. Results indicate that changes in temperature extremes are significantly<br />
different from changes in seasonal temperature, and that changes in extreme precipitation may<br />
be more robustly detectable than changes in mean precipitation. Observed changes in annual<br />
extremes appear promising, but raise many questions about sampling, homogeneity of time<br />
series and difference in trends between different data sets.
Jaakko Helminen, Malting Barley Crop Yield In Southwestern Finland - Potential Risk<br />
Management Benefits Based On The Use Of Seasonal <strong>Forecasts</strong><br />
Jaakko Helminen<br />
Finnish Meteological Institute, Finland<br />
and<br />
Ari Rajala<br />
The crop yield and quality of malting barley are largely determined by the temparature and<br />
precipitation conditions between the sowing and heading dates. In addition the sowing date,<br />
the precipitation between the heading and harvesting dates and the harvesting conditions are of<br />
importance. The seasonal <strong>for</strong>ecast deviations standardized with respect to the model<br />
climatologies are interpreted as standardized deviations with respect to the observed<br />
climatology downscaled to a regular 10 km * 10 km grid by using a combined method of<br />
kriging and the Gandin approach, which allows <strong>for</strong> neighbourhood station choice by relevant<br />
physical conditions in terms of geographical in<strong>for</strong>mation data, like the height, the relative<br />
coverage of lakes and the relative coverage of sea with respect to the grid point under<br />
processing. By adding to these the relevant threshold values of and risk levels acceptable to<br />
the user as well as by considering the costs and benefits related to different decisions made by<br />
the user the overall risk management <strong>for</strong> climate in the context of malting barley cultivation in<br />
Southwestern Finland is assessed.
Bruce Hewitson, Cohesive spatial changes of precipitation and seasonality over South<br />
Africa<br />
Bruce Hewitson<br />
CSAG, University of Cape Town, South Africa<br />
While much historical climate change analysis has been undertaken <strong>for</strong> many regions of the<br />
world, this is most often focused on point source data – typically surface station observations.<br />
This raises the question over whether the station is spatially representative, and following from<br />
this, whether appropriate inferences may be made about change on the regional scale.<br />
Compounding this is the question of whether the change is occurring in the base values of the<br />
measured variable, or in the statistics or characteristics of occurrence of events.<br />
This talk examines these issues over South Africa using a new gridded data set of daily<br />
precipitation, interpolated from a high station density, and with explicit recognition of the<br />
variable spatial representivity of each station. This latter attribute is further refined by<br />
recognizing that the spatial representivity of any given station is itself a function of the<br />
synoptic weather state. The 50-year period from 1950-1999 is examined in terms of the daily<br />
precipitation values as expressed in the monthly statistics of wet and dry spell duration, wetwet<br />
and dry-dry day probabilities, median rainfall, number of raindays exceeding a threshold,<br />
and the 90 th percentile values. The spatial cohesiveness of historical change is assessed in<br />
terms of trend, variability, and seasonal changes; collectively showing regional trends within<br />
South Africa.
Bruce Hewitson, Empirical Downscaling: Assumptions, Caveats And Stationarity<br />
Bruce Hewitson<br />
CSAG, University of Cape Town, South Africa<br />
Empirical downscaling has, <strong>for</strong> many impacts researchers, become a staple tool in developing<br />
appropriate regional scale climate change scenarios. As regional climate models (RCMs)<br />
continue to develop these will perhaps replace some of the empirical approaches; nonetheless<br />
empirical tools are likely to remain a key approach <strong>for</strong> many impacts and adaptation projects.<br />
In light of this, and the plethora of approaches present in the literature, it is important to<br />
recognize the core assumptions, caveats, and limitations of the conceptual approach (many of<br />
which apply equally to RCMs!).<br />
This talk explores some of the foundational issues underlying empirical downscaling,<br />
highlighting key areas of concern. In particular the issue of stationarity is considered – an<br />
issue commonly put <strong>for</strong>ward as one of the stumbling blocks <strong>for</strong> climate change applications of<br />
empirical downscaling. To conclude, a new downscaling application will be presented, which<br />
suggestively shows some convergence between two GCMs <strong>for</strong> the downscaled future climate<br />
over South Africa.
DD Hlatshwayo, The sensitivity of the MM5 model to different parameterisation schemes<br />
DD Hlatshwayo<br />
South African Weather Services, South Africa<br />
and<br />
CJC Reason<br />
WJ Tennant<br />
Severe Weather is fairly frequent in South Africa and often result in havoc and devastation.<br />
Forecasting of severe weather is one of the most important services that is provided by the<br />
meteorological profession and is very critical to the protection of life and property. The<br />
prediction of severe weather may either be approached by the deterministic numerical weather<br />
prediction , the statistical approach or both. For this research the deterministic numerical<br />
weather prediction has been used. Model simulations were done using the MM5 mesoscale<br />
model nested within the Eta model output.<br />
To investigate the sensitivity of the mesoscale model to the convective schemes in South<br />
Africa and to see how the schemes behave <strong>for</strong> severe and non-severe weather events, two<br />
specific convective events are examined.The first case is a severe event that occurred on the 1st<br />
January 2002 resulting in a lot of damage over the north-eastern parts of South Africa, and the<br />
latter case was a non severe storm that occurred over the east of Pretoria on the 05 February<br />
2004.Two sets of simulations were examined <strong>for</strong> each case, each with a different cumulus<br />
parameterisation scheme on the mother domain. Results show that <strong>for</strong> both cases, not all<br />
schemes in the mother domain function properly with the schemes in the inner domain.
Radan Huth, Detection Of The Modes Of Atmospheric Circulation Variability:<br />
Sensitivity To The Principal Component Methodology<br />
Radan Huth<br />
Institute Of Atmospheric Physics, Czech Republic<br />
We examine the effect of several methodological options in the application of principal<br />
component analysis (PCA) to gridded sea level pressure (SLP) anomaly data on the variability<br />
modes detected. The methodological options include (i) a compensation <strong>for</strong> uneven areal<br />
distribution of gridpoints in a regular latitude / longitude grid (none, by a cosine weighting or<br />
by the use of an equal-area grid), (ii) the selection of similarity matrix (correlation or<br />
covariance), and (iii) rotation (none, orthogonal or oblique). The monthly SLP anomalies over<br />
the Northern Hemisphere in the winter half-year (November to April) are analyzed. The<br />
compensation by a cosine weighting and by the use of the equal-area grid has an almost<br />
identical effect if covariance matrix is used. The PCs derived from correlation and covariance<br />
matrices differ from each other, the difference being considerably smaller <strong>for</strong> rotated solutions.<br />
Unrotated and rotated solutions differ from each other in the degree of simple structure they<br />
possess: much stronger simple structure is present in the rotated PCs. The correlation structure<br />
of the data is more similar to the rotated than unrotated patterns. These two facts suggest that in<br />
the interpretation of modes of variability, rotated solutions should be preferred. The emphasis<br />
is put not only on the leading modes of variability describing the Arctic Oscillation (AO,<br />
resulting from unrotated PCA) and North Atlantic Oscillation (NAO, resulting from rotated<br />
PCA) features, but also on the higher-order modes which also change their shapes and order of<br />
importance in response to the methodological options employed. Concerning the AO vs. NAO<br />
dispute, it is important that the Pacific center of the AO turns out to be an effect of high<br />
variance rather than of joint variability with its Arctic and Atlantic centers. The study is<br />
supported by the Grant Agency of the Academy of Sciences of the Czech Republic, contract<br />
IAA3042401.
Radan Huth, The Use Of Multivariate Statistical Methods In The Analyses Of Long-<br />
Term Climatic Trends<br />
Radan Huth<br />
Institute Of Atmospheric Physics, Czech Republic<br />
This contribution introduces two multivariate statistical methods, namely the principal<br />
component analysis (PCA) and cluster analysis, into the research on long-term trends in<br />
climatic elements, and demonstrates the benefits of their use. The study is based on linear<br />
trends of 11 climatic elements at 21 stations in the Czech Republic and is carried out on a<br />
seasonal basis. PCA, if applied to the trend magnitudes <strong>for</strong> a set of variables at a network of<br />
stations, allows one to find out mutual relationships among the individual variables, trends.<br />
Expected relationships, such as a connection of daily temperature range increases with<br />
increases in sunshine duration, and decreases in cloud cover and relative humidity, are<br />
confirmed by PCA. In addition to it, PCA allows one to uncover other relationships, which<br />
would not have been expected a priori, such as a seasonally varying link between precipitation<br />
probability and precipitation amount. PCA can also serve as a tool <strong>for</strong> identifying the station<br />
where the trends are most representative <strong>for</strong> the whole region analyzed. PCA can be applied<br />
to the trends in another way if the data at a single station are stratified, e.g. classified according<br />
to large-scale circulation characteristics. Then the trend magnitudes of several variables at a<br />
single station under various circulation types enter PCA, which helps to uncover causes of<br />
different patterns of climatic change proceeding under different circulation conditions. The<br />
cluster analysis of stations allows the spatial consistency of trends to be quantified. The<br />
groupings of stations appear to be spatially incoherent and seasonally variable, which indicates<br />
that local peculiarities of the relatively complex terrain affect the station trends to a<br />
considerable extent. The study is supported by the Grant Agency of the Academy of Sciences<br />
of the Czech Republic, contract IAA3017301.
Christopher Jack, Preliminary climate change downscaling with the MM5 regional model<br />
Christopher Jack<br />
CSAG, University of Cape Town, South Africa<br />
and<br />
Mark Tadross<br />
Bruce Hewitson<br />
GCM based climate change projections are of limited use because of the course resolution of<br />
the data generated. Grid scales of the order of several hundred kilometers can cover several<br />
climate regimes or climatic gradients within one or two grid boxes. Interpreting the data at a<br />
human scale is difficult. As a result, much research is being invested in various downscaling<br />
techniques. These techniques attempt to add regional scale in<strong>for</strong>mation to the large scale fields<br />
produces by the GCMs. Regional Climate Models (RCMS) are one downscaling technique<br />
that can be used.In this paper the PSU/NCAR MM5 regional climate model has been used to<br />
downscale three different GCM model datasets. A downscaling of the NCEP reanalysis <strong>for</strong> the<br />
period 1985 to 1995 is presented. A downscaling of the control climate simulation produced<br />
by the ECHAM model as well as the future climate (A2 scenario) simulation are also<br />
presented. The ECHAM control downscaling is compared to the NCEP downscaling and the<br />
differences analyzed both in terms of the differences in the large scale <strong>for</strong>cing fields and the<br />
internal dynamics of the model. Then the ECHAM future and present downscalings are<br />
differenced and the differences analyzed in terms of possible climate change signals. Finally a<br />
preliminary evaluation of the RCM based downscaling technique is presented in the context of<br />
climate change projections. Possible improvements to the technique and future applicability of<br />
the technique are discussed.
PA Johnston, Seasonal <strong>Forecasts</strong> and Agricultural Decision Making - an inside<br />
perspective<br />
PA Johnston<br />
CSAG, University of Cape Town, South Africa<br />
In order to produce more oriented and effective seasonal <strong>for</strong>ecasts it is necessary to gain a<br />
greater understanding of the processes and tools involved in the analysis and decision making<br />
that a <strong>for</strong>ecast user requires to in<strong>for</strong>m his/her subsequent actions. Several options arise when a<br />
user is presented with a <strong>for</strong>ecast - either to alter the current view of things, and consequently<br />
his actions, or to ignore the <strong>for</strong>ecast in preference to his own views or <strong>for</strong> reasons relating to<br />
legitimacy, language or method of presentation. There exists <strong>for</strong> each person a finite amount<br />
of in<strong>for</strong>mation that is used to make decisions. This can be increased through acceptance of new<br />
concepts and points of view, but at any given moment decisions will be made using this finite<br />
amount of in<strong>for</strong>mation, influenced by the environment and milieu within which it is made –<br />
this is referred to as bounded rationality and it is within this rational space that a decision is<br />
made based on the in<strong>for</strong>mation available. Some <strong>for</strong>ecast users, finding themselves<br />
overwhelmed by the array of choice and decision options, settle <strong>for</strong> the <strong>for</strong>ecast easiest to<br />
access, rather than the most suitable.<br />
A greater understanding of a user’s frame of reference would be of great assistance to both the<br />
producer of the <strong>for</strong>ecaster as well as any subsequent interpreter, facilitator or extension agent.<br />
Knowledge of the user’s cognitive state leading to decisions concerning the willingness, and<br />
thereafter the capacity, to utilise a <strong>for</strong>ecast would provide insight into the degree of importance<br />
attached to climate <strong>for</strong>ecast in<strong>for</strong>mation and the constraints and limitations facing the user in<br />
terms of making reactive decisions. The proposed research will investigate maize farmers in<br />
South Africa.
Prof Ian Jolliffe, To Centre Or Not To Centre - Or Perhaps Do It Twice?<br />
Prof Ian Jolliffe<br />
University Of Aberdeen, United Kingdom<br />
The standard definition of covariance or correlation involves centring each variable by<br />
subtracting its mean. However, some applications in climatology use uncentred versions. In<br />
other disciplines doubly-centred versions have also been employed. A brief review is given of<br />
these possibilities, mainly in the context of principal component analysis; their properties are<br />
discussed and illustrated on some simple examples.
M R Jury, Spectral modelling of Southern African climate variablity<br />
M R Jury<br />
University of Kwazulu-Natal, South Africa<br />
and<br />
Warren B White<br />
Chris Reason<br />
In this study, statistical techniques are used to decompose southern African summer rainfall<br />
into biennial (1.5-3 yr), interannual (3-9 yr) and decadal (>9 yr) bands <strong>for</strong> the period 1900-<br />
1999. With the annual cycle removed, residual spectral energy in the rainfall series is found to<br />
cascade from biennial to interannual to decadal bands. Rossby wave action in the South Indian<br />
Ocean appears to dominate the biennial scale variability. El Niño-Southern Oscillation (ENSO)<br />
and related Indian Ocean dipole patterns are important <strong>for</strong> interannual variability.<br />
Significant sea temperature and pressure (SST / SLP) fluctuations occurring 6-12 months prior<br />
to rainfall contribute biennial and interannual indices to a multi-variate model that<br />
demonstrates useful predictive skill. Macro-economic cycles are quasi-decadal, and SST/SLP<br />
patterns <strong>for</strong> this band exhibit eastward wave motion.
Viatcheslav Kharin, Estimating Extremes In Transient Climate Change Simulations<br />
Viatcheslav Kharin<br />
Canadian Centre For Climate Modelling & Analysis, University of Victoria, Canada<br />
and<br />
Francis W. Zwiers<br />
Changes in extreme temperatures and precipitation described in terms of return values of<br />
annual extremes are examined in three ensembles of transient climate change simulations<br />
per<strong>for</strong>med with the second generation global coupled climate model (CGCM2) of the<br />
Canadian Centre <strong>for</strong> Climate Modelling and Analysis. Three-member ensembles were<br />
produced <strong>for</strong> the time period 1990-2100 using the Intergovernmental Panel on Climate<br />
Change IS92a, A2 and B2 emission scenarios. The return values are estimated from a<br />
generalized extreme value distribution with time-dependent location and scale parameters<br />
fitted to 51-yr samples of annual extremes by the method of maximum likelihood. The method<br />
of L-moments <strong>for</strong> estimating return values is revisited and found to produce biased estimates<br />
of return values in the considered transient climate change simulations. The climate response<br />
is of similar magnitude in the integrations with the IS92a and A2 emission scenarios but more<br />
modest <strong>for</strong> the B2 scenario. Changes in temperature extremes are largely associated with<br />
changes in the location of the distribution of annual extremes without substantial changes in<br />
its shape. Exceptions from this general rule occur in regions where land and ocean surface<br />
properties change drastically, such as the regions that experience sea-ice and snow cover<br />
retreat. Globally averaged changes in warm extremes are comparable to the corresponding<br />
changes in annual mean daily maximum temperature while globally averaged cold extremes<br />
warm up faster than annual mean daily minimum temperature. There are substantial regional<br />
differences in the magnitudes of changes in temperature extremes and the corresponding<br />
annual means. Changes in precipitation extremes are due to changes in both the location and<br />
scale of the extreme value distribution and exceed substantially the corresponding changes in<br />
the annual mean precipitation. Generally speaking, the warmer model climate becomes wetter<br />
and hydrologically more variable. Waiting times <strong>for</strong> precipitation events that are considered<br />
extreme at the beginning of the considered simulations are reduced by a factor 1.5-2 by the<br />
end of the 21st century.
Gottfried Kirchengast, Generation Of Global Atmospheric Climatologies From GNSS<br />
Radio Occultation Data<br />
Gottfried Kirchengast<br />
IGAM - University of Graz, Austria<br />
and<br />
Ulrich Foelsch<br />
Andreas Gobiet<br />
Armin Loescher<br />
The Global Navigation Satellite System (GNSS) Radio Occultation (RO) technique is an active<br />
limb sounding method using GNSS radio signals to probe the Earth's atmosphere. Fundamental<br />
atmospheric variables such as temperature and geopotential height can be retrieved with high<br />
accuracy in the troposphere and stratosphere. The changing thermal structure in this height<br />
domain is a sensitive indicator of climate change. The global coverage, all-weather capability,<br />
high accuracy, and self-calibrated nature of the RO method suggests it as a promising tool <strong>for</strong><br />
global monitoring of climatic changes in the atmosphere. The German research satellite<br />
CHAMP with a Global Positioning System (GPS) occultation receiver aboard continuously<br />
acquires about 180 RO profiles per day since March 2002 and provide the first opportunity to<br />
create RO based climatologies on a longer term. The CHAMPCLIM project, a project of the<br />
IGAM/University of Graz, Austria, in collaboration with the GFZ Potsdam, Germany, takes<br />
this opportunity and aims at exploiting the CHAMP RO data <strong>for</strong> climate use. After optimizing<br />
the RO data processing <strong>for</strong> climate applications and related data validation, the main emphasis<br />
since recently is now to create global RO based climatologies <strong>for</strong> monitoring climate<br />
variability and change on a monthly, seasonal, and annual basis. For this purpose, the<br />
complete CHAMP RO data flow (~180 events/day) is used to create refractivity, geopotential<br />
height, temperature, and humidity climatologies by two different methods. On the one hand,<br />
the climatologies are generated by standard averaging-and-binning techniques, on the other<br />
hand, 3D-variational assimilation of the RO refractivity data into ECMWF analysis fields is<br />
per<strong>for</strong>med, yielding global climate analyses on a more dense horizontal grid. We will provide<br />
an overview on the techniques used and show exemplary climatology results <strong>for</strong> the JJA 2003<br />
season used as 'testbed' be<strong>for</strong>e analyzing the full RO dataset 2002/2004.
Won-Tae Kwon, Comparison Of Extreme Climate Events Between Observations And<br />
Simulations Over East Asia<br />
Won-Tae Kwon<br />
Climate Research Lab, Meteorological Research Institute, Korea<br />
and<br />
Youngeun Choi<br />
Hee-Jeong Baek<br />
Kyung-On Boo<br />
The aim of this study is to understand the trends of the frequency and/or severity of extreme<br />
climate events in relation with global climate change. We used the observation data of KMA<br />
and the simulation data based on the SRES A2 scenario. Indicators <strong>for</strong> monitoring changes in<br />
climatic extremes worldwide are those recommended by the Statistical and Regional dynamical<br />
Downscaling of Extremes <strong>for</strong> European regions (STARDEX) research project. Using the best<br />
available daily data, spatial and temporal aspects of the daily and extreme variables are<br />
investigated on an annual and seasonal basis <strong>for</strong> the periods of 1954-1999 <strong>for</strong> observation data<br />
and <strong>for</strong> the period of 1951-2100 <strong>for</strong> simulation data. A systematic increase in the 90th<br />
percentile of daily minimum temperatures throughout most of the analyzed areas over Korea<br />
has been observed. This increase is accompanied by a similar reduction in the number of frost<br />
days and a significant lengthening of the thermal growing season. Although the inter-annual<br />
extreme temperature is based on only two observations, it provides a very robust and<br />
significant measure of declining extreme temperature variability. The five precipitation-related<br />
indicators show no distinct changing patterns <strong>for</strong> spatial and temporal distribution except <strong>for</strong><br />
the regional series of maximum consecutive dry days. The regional climate projection over<br />
East Asia has been produced using dynamical downscaling nested in ECHAM4/HOPE-G<br />
model <strong>for</strong> 150 years. The model simulation shows about 6ºC warming and 10-15%<br />
precipitation increase by the year 2100. There are prominent tendency <strong>for</strong> more drought, more<br />
heat wave, less frost day and more heavy rainfall frequencies.
Willem Adolf Landman, Predicting South African Seasonal Rainfall Using A<br />
Combination Of MOS And Perfect Prognosis<br />
Willem Adolf Landman<br />
South African Weather Service, South Africa<br />
and<br />
Lisa Goddard<br />
GCMs typically overestimate rainfall amounts and often spatially distort patterns of rainfall<br />
variability. Such systematic biases suggest the need to downscale GCM simulations.<br />
Successful recalibration to regional rainfall over southern Africa has been achieved using a<br />
perfect prognosis approach and a model output statistics approach (MOS). Here, a method of<br />
empirical downscaling is presented where MOS equations are developed using 24-member<br />
ensemble GCM simulation rainfall data (the ensemble was <strong>for</strong>ced with simultaneous observed<br />
SSTs <strong>for</strong> each of the 3-month seasons considered) and then 24-member ensemble rainfall realtime<br />
<strong>for</strong>ecast fields at different lead-times from the same GCM are subsequently used in these<br />
MOS equations. It is there<strong>for</strong>e assumed that the skill with which the GCM can produce<br />
<strong>for</strong>ecast at certain lead-times is as good as skill obtained from simulation data, reminiscent to<br />
the assumption of a perfect prognosis approach where ôperfectö <strong>for</strong>ecasts are assumed. The<br />
ECHAM4.5 predictions are generated 3-month seasons by persisting observed SST anomalies<br />
of the month immediately prior to the target season on top of the monthly varying annual cycle<br />
of climatological SSTs. At initialization, ensemble members differ from each other by one<br />
model day integration <strong>for</strong> both the simulation and <strong>for</strong>ecast data. Canonical correlation analysis<br />
(CCA) is the mathematical technique used to set up the MOS equations and also to do the<br />
“perfect prognosis” downscaled <strong>for</strong>ecasts with. These <strong>for</strong>ecasts are verified using ranked<br />
probability skill scores (RPSS). It is found that <strong>for</strong>ecast skill is similar to that of the<br />
simulations <strong>for</strong> 0-month lead <strong>for</strong>ecasts of DJF rainfall using observed SST data from<br />
November.
C Lennard, THE EFFECT OF NESTING TECHNIQUES IN A REGIONAL CLIMATE<br />
MODEL OVER COMPLEX OROGRAPHY<br />
C Lennard<br />
CSAG, University of Cape Town, South Africa<br />
Orographic features in a given region establish the circulatory patterns of air masses in general.<br />
For a mesoscale model to be capable of reproducing this behaviour, a topography is necessary<br />
with a resolution such that orographic features are not smoothed away. The simulation domain<br />
also has to be large enough to include all the terrain characteristics that are believed to<br />
participate in the circulation of air masses, and these can often be far away from the study area.<br />
However, modelling such a large domain at such a high resolution makes it computationally<br />
impractical. Nesting techniques solve this problem and increase spatial resolution only in the<br />
domains where small-scale phenomena might occur and are relevant <strong>for</strong> the reproduction of all<br />
the <strong>for</strong>cing mechanisms in the study area. At the same time, the outer domain(s) is also<br />
included at a coarser resolution, to assure the introduction of larger scale <strong>for</strong>cings into the inner<br />
domain.<br />
The interaction between the domains can be carried out through to different techniques: oneway<br />
or two-way nesting. This study examines the effect of different nesting techniques on<br />
precipitation in the south-western Cape, specifically around the greater Cape Town region<br />
using a regional climate model.
Yun Li, Statistical Modelling Of Extreme Rainfall In Southwest Western Australia<br />
Yun Li<br />
CSIRO Mathematical And In<strong>for</strong>mation Sciences, Australia<br />
and<br />
Wenju Cai<br />
Eddy P. Campbell<br />
Rainfall over Southwest Western Australia (SWWA, 118E westward and 32S southward) has<br />
decreased over the past decades putting further constraints on water resources in an already dry<br />
area. In this study, we analysed daily rainfall over five of geographically dispersed and<br />
homogenized weather station within SWWA. We used a peak over threshold method from<br />
extreme value theory to model daily rainfall above a given threshold. Change points <strong>for</strong><br />
extreme daily rainfall were found around 1965 based on different individual stations, with<br />
extreme daily rainfall reduced since then. To demonstrate the degree of change in the daily<br />
rainfall, we stratified at 1965 and fitted generalized Pareto distributions to the tails of the<br />
distributions <strong>for</strong> daily rainfall in the pre-change period 1930-1965 (including 1965) and the<br />
post-change period 1966-2001. The fitted tail distributions also allow the estimation of<br />
probabilities of extreme daily rainfall, and quantiles of interest <strong>for</strong> a given tail area probability.<br />
Results show that probabilities and amount of extreme daily rainfall have greatly declined after<br />
1965. There has been vigorous debate as to what <strong>for</strong>ces the drying trend, i.e., whether it is part<br />
of multidecadal variability or driven by secular <strong>for</strong>cings such as increasing atmospheric CO2<br />
concentration. In this paper, we also use statistical modelling to identify possible associated<br />
changes in atmospheric circulation. We find that there is a change point near 1965 in a<br />
dominant atmospheric circulation mode of the Antarctic Oscillation (AAO). The result offers<br />
qualified support <strong>for</strong> the argument that the AAO may contribute to the drying trend. This<br />
work is supported by a Western Australian government project: the Indian Ocean Climate<br />
Initiative (IOCI).
Ta-Hsin Li, An Adaptive Multi-Resolution Method For Estimating Global Temperature<br />
Fields From Scattered Observations<br />
Ta-Hsin Li<br />
Department Of Mathematical Sciences, IBM T. J. Watson Research Center, USA<br />
This paper considers the problem of estimating the entire temperature field <strong>for</strong> every location<br />
on the globe from scattered surface air temperatures observed by a network of weather<br />
stations. Classical methods such as spherical harmonics and spherical smoothing splines are<br />
not efficient in representing the data that have inherent multiscale structures. This paper<br />
presents an estimation method that has the capability of adapting to the multiscale<br />
characteristics of the data. The method is based on a spherical wavelet approach recently<br />
developed <strong>for</strong> multiscale representation and analysis of scattered data. Spatially adaptive<br />
estimators are obtained by coupling the spherical wavelets with different thresholding<br />
(selective reconstruction) techniques. These estimators are compared <strong>for</strong> their spatial<br />
adaptability and extrapolation per<strong>for</strong>mance using the surface air temperature data.
Piero Lionello, Response Of The European Temperature To The Radiative Forcing:<br />
Difference Between Winter And Summer Climate Variability<br />
Piero Lionello<br />
Department Of Material Sciences, University Of Lecce, Italy<br />
and<br />
Simona De Zolt<br />
Juerg Luterbacher<br />
Eduardo Zorita<br />
This study analyzes the response of the European Climate to the variability of solar irradiance<br />
and volcanism during the last five centuries. This period is covered by two different<br />
multicentennial global simulations, carried out by the same model and using an identical time<br />
dependent RF (which includes, besides the SVRF, also the Green House Gases increase), and<br />
by a chronicle-based paleo-reconstruction of the European monthly temperature fields.<br />
European temperature is characterized by a higher variability in winter than is summer. In fact,<br />
in winter the two simulations present differences of average European temperature that also<br />
at multidecadal time scale are much larger than in summer and correspond to different NAO<br />
conditions. Spatial distribution of correlation between the two simulation is uni<strong>for</strong>m and it<br />
decreases towards North. The correlation between simulations and paleoreconstruction is<br />
higher in winter than in summer and has a maximum above North Eastern Europe, while there<br />
is no agreement above southern Europe and North Africa. On one hand, these results suggest<br />
that predictability of the European climate would be higher <strong>for</strong> summer than <strong>for</strong> winter, during<br />
which it would be restricted to the multi-decadal or longer timescales at which RF is<br />
dominant. On the other hand, they possibly point out to problems in the knowledge of past<br />
radiative <strong>for</strong>cing and climate in the Mediterranean region.
Piero Lionello, Statistical Analysis Of Different Aspects Of Marine Storminess In The<br />
Mediterranean Region.<br />
Piero Lionello<br />
Department Of Material Sciences, University Of Lecce, Italy<br />
and<br />
Antonella Sanna<br />
Alessandro Zardini<br />
This study discusses trends and variability of storminess in the Mediterranean region during the<br />
second half of the 20th century. Storminess is evaluated considering three different aspects:<br />
monthly synoptic variability patterns, storm tracks, intense surface winds and associate ocean<br />
wave fields. In<strong>for</strong>mation is based NCAR and ERA-40 reanalysis. The synoptic variability is<br />
estimated from the monthly standard deviation maps of the band-pass filtered (1 to 7day cutoff<br />
periods) 500 hpa GPH (GeoPotential Height) and SLP (Sea Level Pressure) fields. Storm<br />
tracks are identified by an automatic recognition procedure applied to the 6-hourly fields of the<br />
reanalysis. The 6-hourly surface wind fields are used <strong>for</strong> simulating the wave field with the<br />
WAM model whose results are considered as a proxi of the presence of intense wind over large<br />
areas <strong>for</strong> a significant duration. The analysis shows the presence of regional processes<br />
affecting the storminess in the Mediterranean region beside the well known NAO large scale<br />
teleconnection pattern. Moreover, It shows that association to large scale patterns depends on<br />
the aspect of stormines considered, so that the regional structures responsible <strong>for</strong> wave field<br />
variability differ from those responsible <strong>for</strong> the atmospheric synoptic variability. A generalized<br />
trend toward reduction of winter storminess has been identified during the second half of the<br />
20th century
Robert Livezey, The Gerrity Equitable Skill Score As A Near Optimal Alternative To<br />
The Modified Heidke Score For Verification Of Categorical Seasonal <strong>Forecasts</strong><br />
Robert Livezey<br />
Climate Services Division/OCWWS/NWS/NOAA, USA<br />
The Heidke Skill Score as modified by the NWS Climate Prediction Center and commonly<br />
used by other practitioners of climate <strong>for</strong>ecasts has virtually all of the undesirable attributes<br />
usually associated with a skill score <strong>for</strong> ordinal categorical <strong>for</strong>ecasts. These include the ability<br />
of <strong>for</strong>ecasters to artificially manipulate the score in several ways to their advantage,<br />
inconsistency of the score with other related scores, and no dependence of the degree of<br />
<strong>for</strong>ecast error or difficulty on <strong>for</strong>ecaster rewards and penalties. There is an alternative called<br />
the Gerrity score that <strong>for</strong> practical purposes has none of these shortcomings and is easy to<br />
compute. The Gerrity score is a particular subset of the Gandin and Murphy family of<br />
equitable skill scores <strong>for</strong> ordinal multi-categorical <strong>for</strong>ecasts. Both the Heidke and Gerrity<br />
scores will be described, placed in context with the Gandin and Murphy and other scores<br />
available in the literature, and their attributes contrasted.
Robert Livezey, Intraseasonal To Interannual Climate Variability Alphabet Soup: What<br />
Is New, What Is The PDO, And Related Questions?<br />
Robert Livezey<br />
Climate Services Division/OCWWS/NWS/NOAA, USA<br />
In the 1980s a considerable ef<strong>for</strong>t (culminating in Barnston and Livezey, 1987) went into<br />
diagnosis and cataloging of the principal atmospheric modes of short-term climate variability.<br />
The results showed that over North America these modes manifest themselves in the upper-air<br />
circulation principally in three patterns or combinations of these patterns, the so-called<br />
Pacific/North American pattern (PNA), the North Atlantic Oscillation (NAO), and the<br />
Tropical/Northern Hemisphere pattern (TNH). The PNA has been associated with tropical<br />
intraseasonals like the Madden-Julian Oscillation (MJO), La Nina, and un<strong>for</strong>ced (by the<br />
tropics) internal variability, the NAO with the latter, but the TNH only with El Nino. Since<br />
then a number of studies have suggested many other modes or patterns than these, most<br />
prominent among them the Arctic Oscillation (AO) and the Pacific Decadal Oscillation (PDO).<br />
An obvious addition to the list is the signature (to date) of global change, which is expected to<br />
be nonuni<strong>for</strong>m in space and by season (ie not just some uni<strong>for</strong>m warming). A considerable<br />
amount of confusion and controversy exists with respect to the AO, the PDO,and global trends.<br />
Many argue that <strong>for</strong> most timescales the AO and NAO are the same phenomena and, <strong>for</strong> all but<br />
very long time scales, are principally a reflection of red-noise internal variability. The growing<br />
weight of evidence suggests that the PDO is entirely the reflection of previously-described<br />
multiple phenomena, that its characteristic decade to decade reversals have been a consequence<br />
of red-noise (thereby unpredictable), and that long-term trends may now be dominating its<br />
polarity. As a practical matter, it may be that the only new dimension to the description of<br />
short-term (intraseasonal to interdecadal) climate variability is global change, and that as far as<br />
wintertime North America is concerned, an adequate description of this variability would<br />
encompass MJO, ENSO, global change, and un<strong>for</strong>ced (from the tropics) internal variability.<br />
The first three likely have some predictabilty, the latter none beyond the limits of deterministic<br />
atmospheric variability predicted by Lorenzian chaos.
Robert Livezey, Climate <strong>Forecasts</strong> With Marginal To Moderate Skill And Limitations<br />
On Their Value To Real Users<br />
Robert Livezey<br />
Climate Services Division/OCWWS/NWS/NOAA, USA<br />
and<br />
Barbara Mayes<br />
Marina Timofeyeva<br />
Long-lead seasonal <strong>for</strong>ecasts of the 1997-98 El Nino and the 1999-2001 La Nina and their<br />
impacts (especially <strong>for</strong> cold season North America) were made with unprecedented skill,<br />
detail, and confidence. This success has led to enormous interest in seasonal prediction<br />
worldwide, including in developing countries, and in many instances unrealistic expectations<br />
about them. The fact remains that climate predictions have at best modest skill, and in many<br />
circumstances no or marginal skill, in the absence of a strong ENSO signal. Nevertheless, it<br />
has been argued <strong>for</strong>cefully by a number of groups that these sets of <strong>for</strong>ecasts have tangible<br />
economic value <strong>for</strong> a class of decision-makers and users. The arguments are based on<br />
application of simple cost-loss models, which relate <strong>for</strong>ecast value in a simple decision<br />
environment to various measures of <strong>for</strong>ecast per<strong>for</strong>mance and skill. The credibility of the<br />
cost-loss arguments depends on whether real decision-makers and users behave in the manner<br />
assumed in the models. In existing applications of the models, the value of the <strong>for</strong>ecasts is the<br />
mean expected over many consistent iterations of the <strong>for</strong>ecast/decision process. In the case of<br />
a winter <strong>for</strong>ecast, a particular user can only exercise this process once per year a particular<br />
location. Thus, <strong>for</strong> the cost-loss model value estimate to be relevant to the user, he/she must<br />
exercise the process over many years and/or over many independent locations in a disciplined,<br />
consistent manner. It is difficult to imagine a user that would do this over a period of even a<br />
decade, or whose decision-making environment would remain static <strong>for</strong> that long. Clearly a<br />
potential user needs to understand (1) his/her cost/loss situation, (2) the expected skill of the<br />
<strong>for</strong>ecasts <strong>for</strong> those parameters, places, and times of year of interest to them, i.e. on which their<br />
decisions will be based, and (3) what is necessary to ensure a high likelihood of realizing value<br />
from use of the <strong>for</strong>ecasts. Here we will address (2) and (3) in the context of official U.S. longlead<br />
seasonal temperature and precipitation <strong>for</strong>ecasts issued by NOAA’s Climate Prediction<br />
Center We begin by computing and combining skills in ways that are in<strong>for</strong>mative to potential<br />
customers of the <strong>for</strong>ecasts. We first display the bulk skills by lead time (which in itself turns<br />
out to be in<strong>for</strong>mative) and then provide the same graphs stratified by time of year, major ENSO<br />
episodes, and both. Where possible we combine consecutive leads with similar skills to<br />
achieve more confident estimates. For those cases that warrant further consideration we<br />
stratify by large-scale U.S. regions (like east vs. central and west or south vs. north). We<br />
demonstrate that some <strong>for</strong>ecast subsets have no or marginal skill, while others have moderate<br />
or even substantial skill. Next we present estimates of the uncertainty in <strong>for</strong>ecast value <strong>for</strong><br />
different <strong>for</strong>ecast skills and realistic iterations of the <strong>for</strong>ecasts/decisions, as well as with<br />
different simple assumptions about the psychology of the user (<strong>for</strong> example, the user abandons<br />
use of the <strong>for</strong>ecast if the <strong>for</strong>ecast was wrong two winters in a row). The computed<br />
uncertainties cast considerable doubt on the utility of marginally skillful <strong>for</strong>ecasts sets <strong>for</strong><br />
individual users and provide a sense of what skill levels are necessary to increase likelihoods<br />
that relatively short sequences of <strong>for</strong>ecasts/decisions will be of value. These skill levels turn<br />
out to be relatively high, comparable to the per<strong>for</strong>mance of the strong ENSO event “<strong>for</strong>ecasts<br />
of opportunity.” On the other hand, users who can exercise <strong>for</strong>ecast/decisions at multiple<br />
independent locations each season over two or more seasons a year (like weather derivatives<br />
brokers) can be reasonably confident of realizing value from only moderately skillful <strong>for</strong>ecast<br />
sets.
Robert Lund, Trends In United States Maximum And Minimum Temperatures<br />
Robert Lund<br />
Department Of Statistics, The University Of Georgia, USA<br />
This talk studies linear trend rates in high and low temperatures recorded in the contiguous 48<br />
United States over the last 150 years. Trends computed from extreme value and regression<br />
based methods will be compared. Methods <strong>for</strong> handling station location moves at known times<br />
(changepoints) will be discussed. Spatial contour maps of the annual warming/cooling rates<br />
were constructed via the nonparametric head-banging algorithm; these rates are partitioned into<br />
seasonal trends <strong>for</strong> Spring, Summer, Fall, and Winter.
Neil MacKellar, REPRESENTING THE LAND SURFACE IN A REGIONAL<br />
CLIMATE MODEL: WHAT ARE THE OPTIONS<br />
Neil MacKellar<br />
CSAG, University of Cape Town, South Africa<br />
and<br />
Mr Mark Tadross<br />
Mr Bruce Hewitson<br />
Numerous sensitivity studies have confirmed the importance of land-surface boundary<br />
conditions in atmospheric modeling. It can there<strong>for</strong>e be inferred that, in order to work towards<br />
increasing the accuracy of weather and climate simulations, it is essential to consider the<br />
quality of land-surface data used by the model. Two possible sources <strong>for</strong> such data are satellite<br />
observations and dynamic global vegetation models, each with its respective attractions and<br />
caveats. In this study, the nature of some land-surface data sets available <strong>for</strong> southern Africa<br />
are described, and the practicalities of how this in<strong>for</strong>mation may be incorporated into Version 5<br />
of the Penn State/NCAR Mesoscale Model (MM5) are explored. In addition, the Sheffield<br />
Dynamic Global Vegetation Model (SDGVM) is employed to simulate a vegetation map <strong>for</strong><br />
use by MM5. The sensitivity of MM5 to using this simulated land surface as opposed to the<br />
default configuration is assessed <strong>for</strong> a 3-month summer period. This represents a first step in<br />
investigating the possibilities <strong>for</strong> a dynamic coupling of these two models.
A Manhique, Atmospheric and ocean patterns associated with rainfall anomalies in<br />
Mozambique<br />
A Manhique<br />
Department Of Oceanography, University of Cape Town, South Africa<br />
and<br />
C.J.C. Reason<br />
Y Richard<br />
Margaret Rouault<br />
L Rydberg<br />
Atmospheric and sea surface temperature (SST) patterns associated with rainfall anomalies in<br />
Mozambique are studied. The study analyses the spatial and temporal variability of rainfall<br />
using extended empirical orthogonal functions (EEOF). Southern Mozambique appears to have<br />
strong spatial and temporal coherence in the late summer (January – March (JFM)). Some<br />
coherence is also observed in the early summer (November – December (ND)) in the north.<br />
Correlation analyses applied between successive months confirm a strong – positive correlation<br />
in the southern region. However in the north, the correlations are weak. Nevertheless two<br />
regions (south: 20 - 26 S; north 10 - 15 S) and three periods (October; ND; JFM) were<br />
considered and respective indexes created. The indices were created by averaging the<br />
standardized monthly rainfall anomalies <strong>for</strong> each region.<br />
Composite analyses show that positive rainfall anomalies in the north region during early<br />
summer (ND) are associated with cooling in the north and equatorial Indian Ocean.<br />
Simultaneously, some increase in SST is observed south of Madagascar. Atmospheric patterns<br />
suggest shifts of the intertropical convergence zone (ITCZ) associated with northeast<br />
monsoons as the main mechanism driving the rainfall anomalies. When the ITCZ is positioned<br />
further south, the region tends to receive more rain, and less when it is located more to the<br />
north. The JFM rainfall anomalies in the south region appeared strongly connected to global<br />
patterns with shifts in the Walker circulation being important.
Lizelle Maritz, Spatial And Temporal Variation In Rainfall In The Arid Zone: Is It<br />
Changing?<br />
Lizelle Maritz<br />
ARC - Institute For Soil, Climate And Water, South Africa<br />
and<br />
Johan Malherbe<br />
Anneke Thackrah<br />
Frans Koch<br />
In general, arid regions tend to have a higher precipitation variability, both spatially and<br />
temporally, compared to humid regions. To examine this variability two sets of rainfall<br />
surfaces were used: Seasonal rainfall surfaces (July to June), using climatic data spanning from<br />
1930 to 2003, and dekadal rainfall surfaces, covering a 13-year period (1986 - 2001, excluding<br />
1994 and 2000). Both these sets of surfaces were developed by the ARC-ISCW using weather<br />
station (SAWS and ARC-ISCW) and satellite data (<strong>for</strong> dekadal rainfall surfaces). The Köppen<br />
classification criteria were used to define the arid zone that was used as the study area. Köppen<br />
divides the arid zone into annual, summer and winter rainfall areas thereby already stressing<br />
the spatial variability of rainfall in the zone. Rainfall surfaces and point data (weather stations<br />
reporting between 52 and 101 years) were analysed to ascertain whether any significant spatial<br />
and temporal changes occurred within the study area both inter- and intra- annually and<br />
seasonally.
Ruth Thokozile Massey, Climate Change, Related Risks And The Role Of Non-Climate<br />
Related Stressors: Perceptions, Adaptations And Responses Of Rural Households In<br />
Kwa-Zulu Natal<br />
Ruth Thokozile Massey<br />
University Of The Witwatersrand, South Africa<br />
Climate related risks within Southern Africa threaten the livelihoods of many communities<br />
particularly those who rely on a variety of resources <strong>for</strong> their subsistence. This risk is primarily<br />
determined by the situation or context in which communities find themselves. Adaptation to<br />
and coping with climate variability are key themes in current discussions and policy initiatives.<br />
The Thukela Catchment region in rural Kwa-Zulu Natal, South Africa, was used as a case<br />
study <strong>for</strong> this research. Two communities were compared in the study. The first has the<br />
Mudane Irrigation Scheme (MIS) organised mainly by the local Department of Agriculture<br />
(DoA). The second has no <strong>for</strong>mal irrigation scheme and is relatively untouched, directly, by<br />
<strong>for</strong>mal institutions. The region is currently in a drought situation but has had recent flooding.<br />
The primary aim of this research was to determine and better understand how the two<br />
communities perceive and respond to climate-related risks and to look at the role non-climate<br />
related stressors have on their ability to cope with climate variability and environmental<br />
change. Focus was placed, specifically, on adaptation and coping and on why some households<br />
within the same community cope with climate related stress beter than others. The role of<br />
<strong>for</strong>mal institutions and food security were looked at in particular. Findings have shown that the<br />
first community relies heavily on DoA <strong>for</strong> access to in<strong>for</strong>mation, training and education as well<br />
as access to water, physical capital, infrastructure and decision making arenas. This in fact<br />
increases their vulnerability and restricts their ability to cope and adapt. This paper raises<br />
questions around the role of adaptation and <strong>for</strong>mal institutions in the livelihoods and coping<br />
strategies of households with regard to climate change.
Andrew Matthews, Understanding Drought: A Four-Dimensional Generalized Linear<br />
Model Of Sahel Rainfall<br />
Andrew Matthews<br />
Climatic Research Unit, University of East Anglia, United Kingdom<br />
and<br />
Jean Palutikof<br />
Tom Holt<br />
A generalized linear model is used to link rainfall in the Sahel to the leading modes of<br />
atmospheric variability over Africa and Asia. The model is an attempt to identify the lagged<br />
atmospheric processes underlying the persistent dry conditions over the region since the late<br />
1960s. Daily rainfall data from over 500 stations in sub-tropical western/central Africa were<br />
gridded to a 1º resolution. Principal Component Analysis (PCA) was used to group the gridded<br />
rainfall data into six spatially coherent areas, <strong>for</strong>ming the predictand regions in the regression<br />
experiment. The main modes of atmospheric variability over a domain stretching from the mid-<br />
Atlantic to Indonesia, at four atmospheric levels, were identified using a four-dimensional PCA<br />
of six variables extracted from the NCEP Reanalysis climate data set. The lagged scores from<br />
the PCA are the predictors in the regression. The generalized linear model linking the lagged<br />
atmospheric predictors to the rainfall indices accounted <strong>for</strong> up to 30% of the rainfall variability,<br />
providing a good representation of the gamma-distributed rainfall series.
T N Mdluli, The Societal Dimensions of Domestic Coal Combustion and Alternative<br />
Energy Sources<br />
T N Mdluli<br />
University of the Witwatersrand, South Africa<br />
and<br />
Luanne Otter<br />
Coleen Vogel<br />
Air pollution is one of many issues that have a direct impact upon the economy and the well<br />
being of society in South Africa. Domestic coal combustion contributes significantly to the air<br />
pollution problem in the country. Mitigation measures that can be put in place to reduce<br />
emissions from domestic coal combustion may have a direct impact upon the environment and<br />
the societies that burn coal. The aim of this research, there<strong>for</strong>e, is to provide an assessment of<br />
the societal impacts of mitigating emissions from domestic coal combustion in Soweto. A<br />
questionaire survey will be conducted and it will explore fuel-use and socio-economic data,<br />
health impacts of domestic coal combustion and the society’s acceptance and willingness to<br />
pay <strong>for</strong> measures that reduce air pollution.
J.-L. Melice, Climate variability at sub-Antarctic Marion Island since 1960<br />
J.-L. Melice<br />
IRD, Laboratoire d'Oceanographie Dynamique et de Climatologie, France<br />
and<br />
Mathieu Rouault<br />
Chris Reason<br />
Johann Lutjeharms<br />
Marion Island (47S, 38E) climate has dramatically changed since 1960. During the last 40<br />
years, a significant increase of the pressure and of the air and sea surface temperatures is<br />
observed together with a significant decrease of the rainfall and a northward shift of the wind<br />
direction. We show that the trend in the pressure observed at Marion is linked to a change in<br />
phase and amplitude of the Semi Annual Oscillation (SAO) index and could explain the trends<br />
observed in the temperature, wind direction and rainfall. The changes observed in the SOA<br />
index can be linked to recent trends in the lower stratospheric polar vortex which, according to<br />
Thomson and Solomon (2002), are due largely to ozone loss.<br />
REFERENCE<br />
Thomson, D.W.J. and S. Solomon (2002). Interpretation of recent Southern Hemisphere<br />
climate change. Science. 296, 895-899.
Ladislav Metelka, Non-Linear SLP Variability In North Atlantic Region In Winter<br />
Period<br />
Ladislav Metelka<br />
Czech Hydrometeorological Institute, Czech Republic<br />
The North Atlantic Oscillation (NAO) is the most significant oscillatory system in North<br />
hemisphere extratropics. It can be simply described with the help of standardized anomalies of<br />
SLP differences between one station in Icelandic region and the other in the region of Azores<br />
or in SW Europe. More sophisticated approach to the NAO is based on Principal Component<br />
Analysis (PCA) of SLP or geopotential heights at low tropospheric levels in North Atlantic<br />
region. As PCA is linear method, the results of PCA are influenced by the application of linear<br />
method to the non-linear problem (interpretation of the results of non-rotated vs. rotated PCA,<br />
etc.). Neural networks belong to Artificial Intelligence (AI) systems. One of the special kinds<br />
of neural networks, so called “autoassociative neural network” is able to per<strong>for</strong>m the non-linear<br />
counterpart of PCA. This method has been used in our study <strong>for</strong> the non-linear description of<br />
winter North Atlantic SLP variability. Due to the fact that the original SLP values in nearby<br />
grid points are highly intercorrelated, linear PCA has been used <strong>for</strong> data pre-processing (<strong>for</strong><br />
dimensionality reduction only, not <strong>for</strong> description of the individual oscillatory systems). Then<br />
the autoassociative neural netowork non-linearly combining several linear PCA scores to a<br />
single non-linear score has been built. Results of our study indicate that the SLP variability in<br />
North Atlantic region is non-linear in its origin. It is indicated by:<br />
- the shift between positions of NAO centers in the positive and negative NAO phases<br />
- some non-linear links between NAO and other NH oscillatory systems (especially<br />
Scandinavian Oscillation) which can not be revealed with the help of linear methods<br />
- signs of “rotational exchange” of the individual centers of SLP anomalies during the<br />
transition between positive and negative NAO phase.
P.S Moatshe, Verification of South African Weather Service operational seasonal<br />
<strong>for</strong>ecasts.<br />
P.S Moatshe<br />
South African Weather Service, South Africa<br />
and<br />
Willem Landman,<br />
The value of evaluating <strong>for</strong>ecast accuracy from the user’s perspective is important. Through<br />
understanding of <strong>for</strong>ecast per<strong>for</strong>mance, it helps decision makers to determine when and how to<br />
respond to expected climate anomalies. Evaluation of seasonal <strong>for</strong>ecasters also can help<br />
planners reduce their vulnerability to climate, because they can plan more in<strong>for</strong>med and<br />
prepare more effectively. A probability <strong>for</strong>ecast can be evaluated using different skill scores,<br />
but in this case the Ranked Probability Skill Score (RPSS) is used. RPSS is the Ranked<br />
Probability Score (RPS) of the <strong>for</strong>ecast compared with the RPS of the <strong>for</strong>ecast of climatology<br />
that assigns 33.3% <strong>for</strong> each three equi-probable categories. The RPSS measures the<br />
cumulatative error between the categorical <strong>for</strong>ecast probabilities and the observed category<br />
relative to some reference <strong>for</strong>ecast. If the dominant <strong>for</strong>ecast category was observed, the RPSS<br />
is positive (per<strong>for</strong>ming) and if not the RPSS is negative (under-per<strong>for</strong>ming). RPSS is zero<br />
when there is no skill.<br />
The SAWS issues probabilistic seasonal <strong>for</strong>ecasts every month. These <strong>for</strong>ecasts are a result of<br />
expert interpretation of output from a large variety of seasonal <strong>for</strong>ecast models. Verification of<br />
five January to March (JFM) season is presented at different lead-times ranging from zero to<br />
four months.
G V Motsa, Atmospheric sulphur transport over the South African Highveld.<br />
G V Motsa<br />
Climatology Research Group, University of the Witwatersrand, South Africa<br />
and<br />
Stuart Piketh<br />
Industries located on the South African Highveld introduce a wide range of anthropogenic<br />
primary pollutants directly into the atmosphere, including particulates such as ash, soot and<br />
dust ; gases such as nitrogen dioxide, nitrous oxide and sulphur dioxide. The industrial<br />
Highveld region accounts <strong>for</strong> 90% of South Africa’s scheduled emissions. Secondary<br />
pollutants, such as nitric acid, sulphuric acid and sulphates are <strong>for</strong>med over time from primary<br />
pollutants through chemical conversions and oxidation in the atmosphere.<br />
This research will focus on sulphur dioxide concentrations in the atmosphere over the Highveld<br />
and how these concentrations change with altitude and time. The main aim is to demonstrate<br />
trends in sulphur transport over the Highveld. Peak concentrations of sulphur dioxide in the<br />
atmosphere will be established and their exact locations -especially in relation to sources on the<br />
Highveld - will be determined. The rate of decrease in sulphur dioxide concentrations in<br />
plumes over space and time will also be determined.<br />
The preliminary results indicate that sulphur dioxide concentrations over the Highveld are<br />
above background levels especially over and near sources. Highest sulphur dioxide<br />
concentrations occur at altitudes between 1500-2000m. These preliminary findings indicate tall<br />
stack emissions as the main source of sulphur dioxide in the atmosphere.
NS Mpandeli, Use And Value of Seasonal Climate <strong>Forecasts</strong> in Rabali Area<br />
NS Mpandeli<br />
Agriculture Research Council - Institute <strong>for</strong> Soil, Climate and Water, South Africa<br />
and<br />
MT Bila<br />
T Ramudzwagi<br />
K Mahuluhulu<br />
E Archer<br />
The IPPC and the climate-impacts modeling work undertaken at IIASA, amongst others, point<br />
to the possibility of the southern African region being negatively impacted by climate<br />
variability and change. Much progress has been made in atmospheric modeling work,<br />
including general circulation models and seasonal <strong>for</strong>ecasts although much still needs to be<br />
done. Despite the lack of certainty in the use of such models, there is sufficient progress that<br />
has been made to begin considering how such products could possibly be used by<br />
agriculturalists in their decision-making processes. With this as backdrop, the use and value of<br />
seasonal <strong>for</strong>ecasts as a potential agricultural risk-management tool by farmers in the Northern<br />
Province, Rabali area is examined. This paper furthers the debate on the user uptake of<br />
climatological and meteorological products in the southern African region. Several questions<br />
are addressed including: When do farmers normally require such in<strong>for</strong>mation? How is such<br />
in<strong>for</strong>mation currently collated and used? How are <strong>for</strong>ecasts currently perceived and how could<br />
this perception, if negative, be improved?
SK Mulaudzi, An estimate of emissions from domestic biofuel combustion in Southern<br />
Africa.<br />
SK Mulaudzi<br />
University of Witwatersrand, South Africa<br />
Combustion of fuelwood, charcoal and non-woody biofuels is a daily practice <strong>for</strong> about half of<br />
the world’s population. Combustion of biofuel is a major source of trace gases, with domestic<br />
biomass burning contributing about 17% carbon dioxide (CO2), 13% carbon monoxide (CO)<br />
and 6% nitrous oxide (N2O) to the global budget. In Africa, where there is a growing<br />
population, domestic biofuel emissions are particularly an important source of trace gases. The<br />
most important source of biomass fuels in Africa is wood fuel (Fuel wood and charcoal), crop<br />
residues and animal dung. In this project, the amount of fuel (wood, dung or crop residues)<br />
used in rural households across Southern Africa is measured daily over winter and summer<br />
months. This data is used to estimate the trace gas production from domestic fires throughout<br />
Southern Africa. The research also compares the trace gas emissions between different<br />
Southern African countries and discusses the seasonal changes in emissions.
T Ndarana, The per<strong>for</strong>mance of the Eta model when its data assimilation is removed<br />
T Ndarana<br />
South African Weather Service, South Africa<br />
and<br />
Hilarie Riphagen<br />
Warren Tennant<br />
The South African Weather Service is currently running the fourth version of the operational<br />
Eta model with a 32 kilometre horizontal resolution and 45 vertical Eta levels. The model has<br />
its own data assimilation procedure which is a twelve hour process and takes about 22 minutes<br />
(15.7% of the total run time) to run on the Cray SV1. The procedure involves the use of twelve<br />
hour old global fields from the NCEP global spectral model on the Global Telecommunication<br />
System (GTS) as initial guess and boundary conditions, three dimensional variational analysis<br />
and four three-hour incremental runs.<br />
The aim of this study is to test the model per<strong>for</strong>mance when the data assimilation process is<br />
removed. To obtain the model initial conditions, the latest GTS fields which contain<br />
observations that cover the whole spectrum of observation types are employed. These are<br />
made available at 09h00 and 21h00 (GMT) on a daily basis.<br />
The model accuracy, skill and reliability <strong>for</strong> both the operational and the experimental model<br />
runs are evaluated and compared. This is done <strong>for</strong> both 24 and 48 hour <strong>for</strong>ecasts. The<br />
evolution of the skill of the different models investigated. The statistics of each system are<br />
evaluated against each model own analyses.
Mark New, Estimating Oceanic Precipitation fields in the Pre-Saetellite era<br />
Mark New<br />
Geography Department, Ox<strong>for</strong>d University, United Kingdom<br />
and<br />
Dimitrios Efthymiades<br />
Richard Washington<br />
A fundamental limitation of gridded precipitation datasets is the paucity of observations over<br />
the oceans in the pre-satellite era. We have evaluated the capabilities and limitations of<br />
reconstructing seasonal oceanic precipitation, using land-based precipitation records. The<br />
reconstruction method is based on eigenvector projection, where eigenvectors (or 'EOFs') of<br />
precipitation variability in the CMAP merged, gauge and satellite-based, precipitation dataset,<br />
with near-global coverage from 1979-present, are projected onto land-only data. The approach<br />
has considerable skill in parts of the Tropics where interannual variability is mainly associated<br />
with ENSO activity. In non-ENSO years (<strong>for</strong> the tropics) and <strong>for</strong> all years in most of the<br />
extratropical oceans, reconstruction skill is substabtially reduced in areas more than 1000km<br />
from land data points.
Mark New, <strong>Probabilistic</strong> Regional Climate Prediction: Potential And Pitfalls<br />
Mark New<br />
Geography Department, Ox<strong>for</strong>d University, United Kingdom<br />
In the last few years simple and intermediate-complexity climate models have been used in<br />
Monte Carlo experiments to provide estimates of the probability distribution of future global<br />
mean temperature. While these results are useful <strong>for</strong> quantifying the limits to our present<br />
ability to predict future climate on global scales, they provide little in<strong>for</strong>mation of relevance at<br />
the regional and local scales at which impacts and adaptation options are assessed. New<br />
developments in Monte Carlo simulations of coupled AOGCMs will in the next few years offer<br />
the potential <strong>for</strong> probabilistic predictions at regional scales and, with appropriate downscaling,<br />
at local (sub GCM-resolution) scales. Provision of limits and/or probability distributions <strong>for</strong><br />
future climate at these scales offers impacts and adaptation researches a powerful opportunity<br />
to assess options in a risk-based framework. However, these conditional probability<br />
distributions <strong>for</strong> future climate and its impacts are much easier to misinterpret that scenariobased<br />
approaches, as they provide the end-user with the illusion that they are unconditional<br />
probabilities.
L. D. Ntsangwane, Investigating the optimal use of a super ensemble over southern<br />
Africa<br />
L. D. Ntsangwane<br />
South African Weather Service, South Africa<br />
and<br />
Willem Landman<br />
Richard Sewell<br />
The ensemble rainfall simulations <strong>for</strong> the 29-year period <strong>for</strong> the December to February (DJF)<br />
season from five General Circulation Models (GCMs) are considered to investigate the optimal<br />
use of a super ensemble over Southern Africa. The number of ensemble members from each<br />
GCM varies from 9 to 24 with 63 ensembles members in total. One possible approach of<br />
incorporating model sensitivities into ensemble <strong>for</strong>ecasting systems is to combine ensembles<br />
run from two or more GCMs. The statistical approach known as the Kolmogorov-Smirnov test<br />
is used to test the hypothesis that the simulations PDF from the individual ensemble systems<br />
are taken from the same population. The results of the five GCM ensembles show that, at 90%<br />
level of significance all the GCMs are somehow significantly different. There<strong>for</strong>e, all the<br />
GCM ensembles are combined to propose an effective ensemble size. This will however, lead<br />
to probabilistic <strong>for</strong>ecasts that are skilful over a greater portion of the region and a greater<br />
portion of the time series. The Rank Probability Skill Score (RPSS) is used to calculate the<br />
effective ensemble size of a super ensemble suite. In addition, the results indicate that even<br />
after combining all the GCM ensembles, not all the 63 ensemble members of a super ensemble<br />
are required <strong>for</strong> optimal skill.
Heiko Paeth, A Dynamical-Statistical Approach For Seasonal Forecast Of Subsahelian<br />
Rainfall Using Cross Validated Model Output Statistics<br />
Heiko Paeth<br />
Meteorological Institute, University Of Bonn, Germany<br />
and<br />
Andreas Hense<br />
Rainfall over sub-Saharan West Africa is subject to large interannual variations, strongly<br />
affecting agricultural planning. This study deals with the predictability of interannual rainfall<br />
anomalies during the rainy season (June-September) over sub-Sahelian West Africa. First,<br />
regional and global near-surface predictors <strong>for</strong> sub-Sahelian precipitation are derived from<br />
multi-model ensemble output. Second, a cross validated stepwise multiple regression model is<br />
developed, choosing physically motivated predictors. This statistical model is used as model<br />
output statistics system (MOS) to <strong>for</strong>ecast the rainy season. This attempt goes one step further<br />
than eg. the Krishnamurti approach by deriving observed rainfall anomalies from simulated<br />
variables other than rainfall in order to avoid systematic errors and uncertainties in the<br />
modelled convection, cloud and rainfall processes. The <strong>for</strong>ecast skill of the MOS system is<br />
found to be small but significantly larger than zero. A low-cost method <strong>for</strong> operational<br />
seasonal <strong>for</strong>ecast is proposed. Sub-saharan rainy seasonal precipitation (RSP) is closely<br />
connected with tropical Atlantic sea surface temperature (SST). However, there is also a<br />
significant teleconnection to El Niño and La Niña events in the eastern equatorial Pacific. In<br />
addition, RSP reveals a strong negative correlation with sea level pressure (SLP) over the<br />
tropical Atlantic and the West African subcontinent, indicating the West African monsoonal<br />
strength. The most important predictors <strong>for</strong> observed precipitation are represented by the<br />
SLP variables, regional mean and gradient, rather than the simulated rainfall itself. Compared<br />
with the null-hypothesis based on randomized predictor chronology, the multi-model<br />
predictability is statistically significant. The validation reveals a significant <strong>for</strong>ecast skill,<br />
especially with respect to small rainfall anomalies. Given the distinct autocorrelation of<br />
tropical SST, this study holds the prospect of operational seasonal <strong>for</strong>ecast over a broad sub-<br />
Sahelian region with low-cost methods.
Heiko Paeth, A Bayesian Decision Method For Climate Change Analysis With Two<br />
Application: Temperature And NH Circulation<br />
Heiko Paeth<br />
Meteorological Institute, University Of Bonn, Germany<br />
and<br />
Seung-Ki Min<br />
Andreas Hense<br />
Climate change analysis can also be viewed as a decision or selection process of the scenario -<br />
greenhouse gases (GHGs), GHG plus sulfate aerosols (SUL), or natural variability - which is<br />
most probable in view of the observations. This decision can be made by means of the<br />
Bayesian decision theory. Based on NCEP reanalysis data and model data from multi-model<br />
ensembles under control and GHG(+SUL) conditions, it is questioned whether the observed<br />
climate characteristics during the 20th century are classified in the undisturbed case or one of<br />
the two changed climates. It is also addressed to which extent the Bayesian decision results are<br />
sensitive to the choice of the prior probability <strong>for</strong> the three climate scenarios and the estimate<br />
of natural variability. Two application studies have been made: (1) A two-dimensional<br />
approach refers to the lower tropospheric and stratospheric temperature. (2) A one-dimensional<br />
approach uses the index time series of the Arctic Oscillation (AO). In terms of temperature, it<br />
is found that the observed anomalies from the late 1990s onward stand out from natural<br />
variability, even if small prior probability is assigned to the disturbed climates. The observed<br />
AO index anomalies during the 1990s are also classified in the simulated GHG scenario, but<br />
recently the signal drops down. Instead, the long-term AO trends reveal a clear climate change<br />
signal, which is robust against the choice of the prior. The estimate of the natural variability is<br />
a crucial factor in the Bayesian decision theory, but does barely affect the results in terms of<br />
the AO.
Jan Picek, Tail Index Of Maximum Air Temperatures And Precipitation In Czech<br />
Republic<br />
Jan Picek<br />
Technical University In Liberec, Czech Republic<br />
If we are interested in the extremal events such as the extreme intensity of the wind, the high<br />
flood levels of the rivers or extreme values of environmental indicators then we are rather<br />
interested in the tails of the underlying distribution than in its central part. A goodness-of-fit<br />
test usually concerns the central part, hence it does not provide us with a sufficient in<strong>for</strong>mation<br />
on the shape of tails. Our primary goal is to study more closely the shape of the tail. The<br />
authors recently constructed several nonparametric tests of one-sided hypotheses on the value<br />
of the Pareto-type tail index of the innovation distribution in the linear autoregressive model.<br />
The tests are nonparametric and are based on the series of residuals with respect to an<br />
appropriate estimator of the AR parameters; more precisely, they are based on the empirical<br />
process of maximal residuals of non-overlapping segments of such series. Inverting the tests in<br />
the Hodges-Lehmann manner, we obtain strongly consistent estimators. The estimators are<br />
applied to the series of the maximal daily temperatures and precipitation at the Czech Republic<br />
station in the period 1961-2000.
Rudi Pretorius, Uncertainty, Scientific Credibility And Related Issues Concerning<br />
Global Climate Change<br />
Rudi Pretorius<br />
University Of South Africa, South Africa<br />
Uncertainty, scientific credibility and related issues concerning global climate change The<br />
contribution by WG1 to the TAR presents new and stronger evidence that most of the warming<br />
over the 20th century (in total 0.6 ± 0.2°C) is attributable to human activities and that the<br />
human influence will continue to change atmospheric composition throughout the 21st century.<br />
It has to be noted, however, that the extent to which it is possible to distinguish between the<br />
anthropogenic influence and the background of natural climate variability, remains debatable -<br />
despite the progress which has been made to reduce uncertainty. In addition, projections of the<br />
climate of the future, which are to a large extent supplied by global climate models with their<br />
own limitations and uncertainties, are inherently not very specific either. An example is the<br />
projection supplied in the TAR of a global average surface warming from 1990 to 2100<br />
ranging from 1.4 to 5.8°C, based on a number of climate models and on the full range of<br />
emission scenarios provided in the SRES. Compared with the earlier IS92 range of 1.0 to<br />
3.5°C as reported in the SAR, the TAR range is significantly greater, with the upper-end<br />
significantly higher as well. This paper presents a critical analysis of the latter as well as<br />
other findings of the IPCC in its assessment reports (with focus on the TAR) concerning<br />
climate change science and also reviews and analyses the relevant debates and criticisms in this<br />
regard. The extent to which anthropogenic factors are responsible <strong>for</strong> observed climate<br />
changes is considered, with reference to the associated disagreements. These can largely be<br />
ascribed to the numerous uncertainties about global climate change which still exist. In the<br />
light of these uncertainties, together with the fact that the complexity and unpredictability of<br />
the earth's climate system and the interactions among its components are apparently still<br />
underestimated, this paper argues that scientists should acknowledge that accurate projections<br />
of the future climate together with its impacts are still not possible at this stage. Considering<br />
the lack of sufficient hard evidence, and in order not to loose scientific credibility, this paper<br />
concludes that is crucial to play open cards and to distinguish clearly between the 'facts' and the<br />
'fiction' regarding global climate change.
Nazario Ramirez, A Transfer Function Model And Remote Sensing Data To Estimate<br />
Soil Moisture<br />
Nazario Ramirez<br />
Department Of Industrail Engineering, University Of Puerto Rico, Puerto Rico<br />
and<br />
Ramon Vasquez<br />
Harold Cruzado<br />
It is well established that per<strong>for</strong>mances of numerical models are very sensitive to initial and<br />
boundary conditions. The regional atmospheric modelling system (RAMS) that is used to<br />
simulate with high resolution the climate dynamics in Puerto Rico is highly sensitive to soil<br />
moisture initial conditions. Incorrect initial conditions will generate misleading modelling<br />
results. There<strong>for</strong>e, this research ef<strong>for</strong>t is focused on the development of reliable estimates of<br />
soil moisture. Remote sensing measurements, artificial neural networks and a transfer function<br />
model are used to estimate soil moisture process in Puerto Rico on a daily and monthly basis.<br />
Preliminary results of an on-going project will be presented in this research work. The<br />
components of water balance system are: precipitation, runoff, evapotranspiration, and<br />
groundwater loss. The driver of the soil moisture system is the amount of precipitation that<br />
occurs in a given area and time. The runoff is highly dependent on the rainfall intensity,<br />
roughness, vegetation and soil type. The evapotranspiration is mostly associated to rainfall<br />
intensity, air temperature, and wind velocity. The amount of percolation will also depend on<br />
rainfall intensity, soil, and vegetation type. The major assumption of this research establishes<br />
that the soil moisture is a function of the following observable variables: precipitation, air<br />
temperature, elevation, soil type, and vegetation index. There<strong>for</strong>e, a transfer function (TF)<br />
model is suggested to represent the interactions of the variables involved in the soil moisture<br />
process. The proposed model pretends to represent the spatial and temporal variability. The<br />
spatial variability will be modelled by using a self organized neural network (NN) including<br />
the following input patterns: vegetation index, rainfall, air temperature, soil type, and elevation.<br />
The spatial variability will provide a reasonable number of homogenous regions and inside of<br />
each region a temporal variability will be model by using the transfer function model. The<br />
input variables of the TF model are: rainfall, air temperature and the output of the TF model is<br />
the soil moisture. The TF model represents the stochastic behaviour of the soil moisture <strong>for</strong> a<br />
specific soil type, vegetation index, and elevation. Thus, the outputs of the TF model will<br />
provide estimation of soil moisture taking into account the spatial and temporal variability.<br />
The outputs of the transfer function will be daily and monthly maps at 1 km2 of resolution of<br />
Puerto Rico soil moisture. Satellite data is obtained from NASA Goddard Space Flight<br />
Center at the Distributed Active Archive Center (DAAC). The MODIS sensor provides air<br />
temperature and vegetation index <strong>for</strong> Puerto Rico at 1 km2 of resolution. Two passes of<br />
instantaneous air temperature are given on a daily basis. One pass represents about the<br />
maximum temperature and the other the minimum temperature; since the fist pass occurs about<br />
noon and the second one during the night. Since MODIS does not provide air temperature<br />
when clouds are present, a second NN is designed to interpolate air temperature under the<br />
presence of clouds. The Backpropagation algorithm with the Levenberg-Marquardt (LM)<br />
learning rule was used to accomplish this interpolation task. The LM learning rule was used to<br />
accelerate the convergence of the NN. The input patterns of the NN are: elevation, vegetation<br />
index and rainfall. The target of the NN was the air temperature obtained from MODIS and
from 52 weather stations. The daily cumulated rainfall <strong>for</strong> Puerto Rico was obtained from<br />
radar data at 5 km2 of resolution. The air temperature that comes from stations was provided<br />
by the National Climate Data Center and the daily rainfall data was provided by the National<br />
Weather Service. Elevation and soil type were provided by the Laboratory of Remote Sensing<br />
from the University of Puerto Rico.
CJ Rautenbach, LIKELY FUTURE CHANGES IN TEMPERATURE AND RAINFALL<br />
IN THE KOMATI RIVER CATCHMENT BASIN<br />
CJ Rautenbach<br />
University of Pretoria, South Africa<br />
and<br />
Stuart Piketh<br />
Jonas Mphepya<br />
Climate change and variability has received a large amount of attention over the past three<br />
decades. Concerns about rapidly changing global surface temperatures in response to elevated<br />
concentrations of greenhouse trace gases such as Carbon dioxide have legitimately been raised.<br />
In 2002 the International Panel on Climate Change (IPCC) issued a series of studies that<br />
evaluated the scientific basis <strong>for</strong> climate change as well as the most likely problems that may<br />
result and the ability of nations around the world to adapt to these changes. Southern Africa<br />
was identified as one of the regions of the world that would not adapt easily to changing<br />
climates, in particular increases in extreme events, mostly as a result of a lack of resources.<br />
Given the a<strong>for</strong>ementioned it is important <strong>for</strong> southern African nations to start to plan <strong>for</strong> the<br />
possible impacts that may arise from increases and or decreases in such climatic factors as<br />
temperature and rainfall. With this in mind Eskom has started to evaluate the implications of<br />
possible climate change to current and future power utility operations and locations. The<br />
research has two primary objectives that are pursued as a measure of precaution to prepare <strong>for</strong><br />
likely changes in future climates:<br />
- To determine whether any IPCC General Circulation Model (GCM) inter-model<br />
consistency appears in future anthropogenic climate change projections over South<br />
Africa with specific emphasis to the Komati river catchment.<br />
- To identify any significant trends in more recently observed climate patterns that concur<br />
with consistent IPCC GCM future climate change projections.<br />
The research has been subdivided into three main activities. The first is to study climate change<br />
simulations produced by six of the most advanced GCM’s in the world. Inter-model<br />
consistency increases the validity of the predictions. Predictions over the next fifty years are<br />
considered. The second component attempts to evaluate the changes within the Komati river<br />
catchment. This has been done by nesting a higher resolution model (DARLAM) within the<br />
larger scale CSIRO GCM. Last, an attempt is made to use observational data from the Komati<br />
River catchment from surface weather stations to evaluate if any changes in surface<br />
temperature, rainfall and mean surface pressure have been detected over the past thirty years.
Jaxk Reeves, Detection Of Undocumented Changepoints: Revisions Of The Two-Phase<br />
Regression Model<br />
Jaxk Reeves<br />
Statistics Department, University Of Georgia, USA<br />
and<br />
Robert Lund<br />
XiaoLan Wang<br />
This presentation examines detection and adjustment of climatic series <strong>for</strong> undocumented<br />
changepoint times, primarily from single site data. The two-phase regression model techniques<br />
currently used are demonstrated to be biased toward the conclusion of an excessive number of<br />
unobserved changepoint times. Simple statistically defensible revisions of these methods based<br />
on work by the authors is presented.
G.W. Reuter, Severe convective storms with large hail and F3-F4 tornadoes in Alberta,<br />
Canada<br />
G.W. Reuter<br />
Department Of Earth and Atmospheric Sciences, University of Alberta, Canada<br />
and<br />
M Dupilka<br />
During the past 20 years there have been three tornadic thunderstorms in Alberta with<br />
intensities of F3 or greater on the Fujita scale. These events were: the Edmonton tornado of<br />
31 July 1987, the Holden tornado of 29 July 1993, and the Pine Lake tornado of 14 July 2000.<br />
A detailed synoptic analysis of these storms was done with the emphasis on surface moisture<br />
and storm tracks. All three cases supported the Smith and Yau conceptual model of severe<br />
thunderstorm outbreaks in central Alberta. In each case the environment had a capping<br />
inversion to build up potential instability, and large values <strong>for</strong> the convective available<br />
potential energy and wind shear. However, the storms differed in the triggering mechanism to<br />
break the cap and release the latent instability. The Holden and Pine Lake storms were<br />
triggered and developed along a well defined dryline. In contrast, the Edmonton tornado had<br />
no dryline; instead the boundary layer was uni<strong>for</strong>mly moist. The three cases also showed<br />
differences in the temperature advection. For the Pine Lake storm there was mid-upper level<br />
cooling whereas, <strong>for</strong> the Edmonton and Holden cases there was low level warming but little or<br />
no mid-upper level cooling. A comparison of the tracks of the tornadoes showed that the Pine<br />
Lake and Holden storms moved consistently in both direction and speed. The Edmonton<br />
tornado, however, made an abrupt change in direction and speed. Thus, extrapolation of<br />
tornado movement would not be a viable nowcasting technique in this case.
HA Riphagen, Trends in observations <strong>for</strong> numerical weather prediction<br />
HA Riphagen<br />
South African Weather Service, South Africa<br />
Numerical weather prediction (NWP) is an initial-boundary value problem in which the<br />
governing equations are integrated <strong>for</strong>ward from a fully determined initial state. An optimal,<br />
physically consistent initial state, consisting of values of meteorological variables at points of a<br />
regular three-dimensional mesh at a particular time, is the product of a data assimilation<br />
process in which irregularly spaced observations of many types are blended statistically with<br />
short-range <strong>for</strong>ecasts. The more accurate the estimate of the initial conditions, the more<br />
accurate the model <strong>for</strong>ecasts.<br />
The NWP systems of the world are currently fed by a wide variety of observing systems, each<br />
subjected to stringent testing be<strong>for</strong>e being introduced operationally. The results of such testing<br />
presented at WMO-sponsored workshops in 1997 and 2000 led to conclusions on the<br />
contributions of these systems to large-scale <strong>for</strong>ecast skill at short and medium range. The<br />
global observing system has since been significantly enhanced through the launch of several<br />
new satellites and instruments. New strategies <strong>for</strong> observation targeting and the design of<br />
optimal observation networks are also enhancing the efficacy of conventional measurements,<br />
such as radiosonde and aircraft data. At the same time the emphasis is shifting more and more<br />
to the smaller scales as model resolutions increase and ‘nowcasting’ techniques <strong>for</strong> severe<br />
weather prediction mature. Precipitation is being assimilated at several centres.<br />
Intensive studies have been carried out in global and regional modelling systems to assess the<br />
impact of the new data, and of the established data types in the changing observation<br />
environment. Further studies have considered the role of well-managed cooperative regional<br />
programmes such as EUCOS (Eumetnet Composite Observing System) and AMDAR (Aircraft<br />
Meteorological DAta Relay) in facilitating new adaptive observing system concepts designed<br />
to shift resources from well-observed to poorly-observed areas. Results and recommendations<br />
from the recent Third WMO Workshop on the Impact of Various Observing Systems on<br />
Numerical Weather Prediction, where such studies were the focus, will be reviewed with<br />
emphasis on the contrasting needs of more and less observation-affluent regions of the world<br />
and, in particular, the southern African situation.
JW Roberts, Spatio Temporal Correlation Analysis of NDVI in the Succulent Karoo<br />
JW Roberts<br />
CSAG, University of Cape Town, South Africa<br />
and<br />
Bruce Hewitson<br />
Emma Archer<br />
Chris Jack<br />
The use of the Normalized Difference Vegetation Index in studies of the relationship between<br />
vegetation and rainfall are widespread. Both the spatial and temporal relationships between<br />
neighbouring pixels in the succulent Karoo biome were analysed using a Spatial Temporal<br />
Correlation Filter (STCF). The STCF calculates the correlation of NDVI values through time<br />
with those of the surrounding pixels through time. The mean correlation value is then assigned<br />
to the centre pixel. The filter moves onto the adjacent pixel and repeats the process. Two kernel<br />
sizes were used 3X3 and 5X5. Results from each are reported. The analyses attempted to<br />
identify areas that change through time in a similar way.<br />
The succulent Karoo biome of southern Africa is part of the greater Cape floral Kingdom.<br />
Levels of endemism and species richness in the biome are unrivalled. Land use practices<br />
namely cropping and grazing have denuded large areas in the biome. Continued agricultural<br />
expansion and overstocking pose major threats to the biomes floral diversity. Assessing the<br />
anthropogenic impacts and climate related changes imposed on the biome are especially<br />
important. Using NDVI and Interpolated rainfall data to assess these impacts provides<br />
extremely valuable data.<br />
Time series analysis of NDVI and interpolated rainfall data are usually per<strong>for</strong>med on the<br />
premise that rainfall is the dominant driving <strong>for</strong>ce in seasonal vegetation change. In the<br />
succulent Karoo this premise may not stand. Land use, irrigation of croplands and the influence<br />
of river systems receiving their rainfall at times other than the dominant winter rainfall regime<br />
all hinder the analysis. It is there<strong>for</strong>e important to know where seasonal vegetation response is<br />
both spatially and temporally homogenous<br />
Analysis was per<strong>for</strong>med <strong>for</strong> the time period 1985-2003 and <strong>for</strong> various seasonally defined<br />
periods: DJF, MAM, JJA & SON. Results from both the 3X3 and 5X5 Kernel were stratified<br />
into classes containing the following correlation values, 0.91 or stronger (class 1), 0.9 – 0.71<br />
(class 2), 0.7 – 0.51 (class 3) and –0.5 – 0.5 (class 4). Class 1 identifies largely undisturbed<br />
areas of the lowland plains of the Namaqualand region. Class 2 correspond to areas with<br />
increased elevation and rough topography. Class 3 may be classified as a transition zone<br />
between class 2 and class 4 as the two classes are found in close proximity to each other. Class<br />
4 is associated with irrigated agriculture and areas around major river systems such as the<br />
Orange and Olifants rivers.<br />
Results indicate that large areas of the biome show relatively good correlation values; these<br />
are however variable depending on the size of the kernel used and time period in question.<br />
Results will contribute to a statistical analysis of the relationship between rainfall and<br />
vegetation growth on an intra seasonal time scale
Alan Robock, Detection Of The Effects Of Volcanic Eruptions On Climate<br />
Alan Robock<br />
Department Of Environmental Sciences, Rutgers University, USA<br />
and<br />
Georgiy Stenchikov<br />
Large tropical volcanic eruptions, such as the 1963 Agung, 1982 El Chichon, and 1991<br />
Pinatubo eruptions, have a detectable influence on global climate. These effects include<br />
tropical cooling, but only summer cooling with winter warming in the midlatitudes of Northern<br />
Hemisphere. These climate response is modulated by the phase of the quasi-biennial<br />
oscillation at the time of the eruption and includes the indirect impacts of volcanically-induced<br />
ozone depletion. The effects of smaller eruptions with troposphere-only emissions or sulfurpoor<br />
stratospheric emissions, such as the 1980 Mt. St. Helens eruption, are not detectable.<br />
High latitude eruptions, such as the 1783 Laki eruption, produce quite different effects. This<br />
talk will discuss the ways that volcanic eruptions perturb not only the radiative balance of the<br />
planet, but also atmospheric dynamics, and describe the patterns that have been detected with<br />
observations and simulated with global climate models. Detection of mid- and high latitude<br />
influences, particularly in the winter, requires a large number of ensemble members to<br />
overcome weather noise. Our recent simulation of the effects of the Pinatubo eruption,<br />
including the effects of the quasi-biennial oscillation, used 24-member ensembles and was able<br />
to successfully model the climate response during the next two Northern Hemisphere winters.
M Rouault, INTENSITY AND SPATIAL EXTENSION OF DROUGHTS IN<br />
SOUTHERN AFRICA SINCE 1901<br />
M Rouault<br />
Department Of Oceanography, University of Cape Town, South Africa<br />
Due to the complexity of rainfall regime in Southern Africa, it is difficult to monitor drought in<br />
real time with a chart showing percentage from normal or anomaly in total rainfall. Drought<br />
occurs often in Southern Africa in all climatic areas at all times of the year with different<br />
intensity, spatial extension and duration. Agricultural drought (3 to 6-month time scales) and<br />
hydrological droughts (1 to 2-year scale) are often decoupled. The standardized precipitation<br />
index (SPI) is a simple index based on rainfall only that can measure drought at different time<br />
scales (3, 6, 12 and 24 months) with spatial homogeneity. The SPI is linked to the probability<br />
occurrence of dry or wet events. The SPI allows monitoring operationally any location with a<br />
30-year time series The SPI can also be used to monitor excess moisture during a wet season<br />
that can aggravate consequences of floods. This may indicate a saturated catchment conducive<br />
to flood development if rainfall continues. It was recently used in many parts of the world and<br />
South Africa but never in Southern Africa as a whole. This first application on the 0.5x0.5<br />
degree resolution 1901 1999 rainfall dadaset developed by Mitchell et al (2004) at CRU permit<br />
to observe some spatial and temporal characteristics of the droughts. Furthermore, their<br />
distribution is particular with: The strongest droughts have happened during the mature phase<br />
of El Niño<br />
There is considerable decadal variability in the spatial extension and intensity of droughts.<br />
Droughts lasting 3 years are not uncommon
Behrooz Sari Sarraf, Evaluation Of Wet And Dry Periods In North West Of IRAN<br />
Behrooz Sari Sarraf<br />
Geographic Department, Tabriz University, Iran<br />
and<br />
Reza Raihany nia<br />
Abstract: In this paper evaluation of wet and dry periods of southwestern region of Iran (Aras<br />
and Urmia basins) is carried out using graphical represention and calculation based on<br />
mathematical modeling. Monthly precipitation records of twenty stations <strong>for</strong> a period of 33<br />
years, from 1970 to 2002 were chosen and fluctuations of each period with respect their<br />
numbers were plotted on a semi -logarithmic scale and the regression equations were obtained.<br />
Accordingly since the longest wet and dry period happens only once in each period, it is<br />
possible to estimate the durations of wet and dry periods <strong>for</strong> each station using the semi<br />
logarithmic graphic representation mentioned above.
Simon Christian Scherrer, Trends In Swiss Alpine Snow Days - The Role Of Local And<br />
Large Scale Climate Variability<br />
Simon Christian Scherrer<br />
Swiss Federal Office Of Meteorology And Climatology (MeteoSwiss), Switzerland<br />
and<br />
Christof Appenzeller<br />
Swiss Alpine snow cover is varying substantially on interannual to decadal time scales. Since<br />
the late 1980s a large decrease in snow days has been observed <strong>for</strong> stations below 800m<br />
altitude. In this work multiple linear regression models are used to quantify the importance of<br />
seasonal mean local temperature and precipitation to explain the observed variability and<br />
trends in Swiss Alpine snow days <strong>for</strong> the period from 1958 to 1999. The role of large-scale<br />
European-North Atlantic climate variability is also discussed. Results show that local as well<br />
as large-scale predictor models can account <strong>for</strong> a modest fraction of ~32 to 45% of the<br />
observed snow day variability. However, it appears that at low locations the recent decrease in<br />
snow cover can be mainly attributed to an increase in seasonal mean temperature. Seasonal<br />
mean precipitation does neither explain large amounts of variability nor affect recent trends in<br />
a substantial manner. Differences are found <strong>for</strong> the northern and southern parts of Switzerland<br />
concerning the influence of large scale climate modes. Interannual snow day variability of the<br />
northern Swiss Alpine slopes is almost unaffected by the North Atlantic Oscillation (NAO).<br />
Decadal trends however can be explained via temperature only by a model that includes the<br />
'NAO index' as explanatory variable. For the southern Swiss Alpine region the NAO is not just<br />
explaining the decadal scale trends but also a substantial part of interannual variability via<br />
temperature and to a small degree via precipitation. In respect of global warming, these results<br />
suggest that a possible change to more frequent positive NAO winters could amplify the<br />
decrease in low altitude snow cover much more than expected from an averaged global<br />
temperature increase alone.
Jürg Schmidli, Statistical Downscaling Using GCM Precipitation As A Predictor. An<br />
Evaluation For The European Alps<br />
Jürg Schmidli<br />
Atmospheric And Climate Science ETH, Switzerland<br />
Conventional statistical downscaling methods <strong>for</strong> precipitation are prone to problems of<br />
'missing' sensitivities, i.e. sources of variability not represented in the chosen predictors. Using<br />
GCM simulated precipitation as a predictor is likely to minimize such problems. This study<br />
evaluates the potential of using GCM-simulated precipitation downscaling in the European<br />
Alps. The evaluation is based on reanalyses (NCEP, ERA40) which are considered as quasiperfect<br />
GCMs and allow comparison of interannual variations from downscaled results and<br />
observations. Four statistical downscaling methods operating on a daily time scale are<br />
investigated. Two methods require GCM simulated precipitation as their only predictor. Two<br />
more sophisticated methods require in addition some proxy of the large-scale flow. The simple<br />
downscaling methods can serve as a benchmark <strong>for</strong> more complicated downscaling methods<br />
such as neural networks or regional climate models. The downscaling methods are evaluated<br />
over the European Alps on a seasonal basis <strong>for</strong> the 15 years 1979-1993. The evaluation<br />
statistics encompass several diagnostics, including mean precipitation, and statistics<br />
representative of heavy precipitation and drought spells. In addition to biases, we put some<br />
emphasis on the representation of observed interannual precipitation variationswhich are<br />
considered as a manifestation of climate sensitivities. The highest skills are obtained <strong>for</strong> the<br />
winter season, when the precipitation climate is driven by synoptic-scale disturbances. The<br />
lowest skills are found <strong>for</strong> the summer season, when local convection is more dominant. The<br />
results of this study imply that GCM-simulated precipitation can carry interesting in<strong>for</strong>mation<br />
on regional precipitation variability even in a region of complex terrain.
David Sexton, Constraining Probalistic Climate Predictions By Model Reliability<br />
David Sexton<br />
Hadley Centre For Climate Prediction And Research, Met Office, United Kingdom<br />
and<br />
Mat Collins<br />
Glen Harris<br />
James Murphy<br />
Mark Webb<br />
Uncertainty in climate prediction is not only due to uncertainty in future emissions,<br />
atmospheric composition and natural variabiltiy but also due to the way climate models<br />
represent the real world. To explore the modelling uncertainty, we have produced a 'physics<br />
ensemble' of 53 atmosphere models coupled to a thermodynamic ocean 'slab' where each<br />
member differed from the Hadleey Centre's standard slab model, HadSM3, by a perturbation to<br />
one of 29 physics parameters. These slab models, which are relatively quick to run to<br />
equlibrium, are <strong>for</strong>ced with 1x and 2x pre-industrial CO2 levels. From these runs, we<br />
estimated the equilibrium annual mean global mean temperature response to doubling CO2<br />
levels, often called climate sensitivity. For this model and experimental set-up, the relative<br />
probabilty <strong>for</strong> different values of climate sensitivity can be estimated. A problem with this<br />
calculation is that the ensemble members differ in quality and reliability; IPCC TAR (The<br />
Intergovernmental Panel on Climate Changes Third Assessment report) faced a similar<br />
problem basing their uncertainty range on future warming on models from different climate<br />
centres.We there<strong>for</strong>e develop a Climate Prediction Index, based on the root mean square errors<br />
of 32 model 20-year means from suitable observational mean data sets, to measure the relative<br />
quality of the ensemble members. Weighting by model reliabilty changes the 90% confiidence<br />
interval from 1.8-5.7K to 2.4-5.7K. By doing this, we hope to give more weight to climate<br />
models that best represent the important physical feedbacks <strong>for</strong> climate change. As the mean<br />
climate is not necessarily a direct measure of how well a model represents these feedback<br />
processes, we show some preliminary results investigating the extent to which the mean<br />
climate constrains future climate change.
Leonard Smith, PROBABILISTIC SEASONAL FORECAST IN THEORY<br />
AND PRACTICE<br />
Leonard Smith<br />
Centre <strong>for</strong> the Analysis of Time Series Department of Statistics, London School of Economics,<br />
United Kingdom<br />
The DEMETER project has successfully produced multi-model multi-initial condition seasonal<br />
<strong>for</strong>ecasts with a lead time of six months over a period of several decades. After an overview of<br />
the available hindcast dataset, consisting of nine initial conditions each evolved under seven<br />
global coupled atmosphere-ocean models initialised four times each year, a number of<br />
questions on the interpretation, evaluation and application of the DEMETER dataset are<br />
addressed. It is argued that these three issues are fundamentally linked; issues as basic as the<br />
"correct" approach to "bias correction" will have fundamental implications not only on <strong>for</strong>ecast<br />
evaluation and ensemble design, but also on the utility of the ensemble <strong>for</strong>ecast system in<br />
application. Central to these questions is the clear distinction between two goals: does one<br />
view the ultimate goal of a multi-model multi-initial condition ensemble prediction system as<br />
providing insight into some hypothetical "True" probability distribution function of likely<br />
futures, given our current limited knowledge? or is the goal to extract the probability<br />
distributions of each of the available models and their relation to the single realization target<br />
(which might be "Truth", but in the case of DEMETER is an ERA-40 reanalysis). It is argued<br />
that, ideally, one would condition a seasonal <strong>for</strong>ecast on the joint distribution of all <strong>for</strong>ecast<br />
in<strong>for</strong>mation (admitting that this argues <strong>for</strong> the inclusion of models with relatively 'low skill' but<br />
'high in<strong>for</strong>mation' content). Practical applications, however, require practicable methods;<br />
current deployable methods in the agricultural and health sectors which were used within<br />
DEMETER are noted, and the search <strong>for</strong> consistency tests to evaluate proposed methods is<br />
reported.
Leonard Smith, Ensemble Climate Modeling: WHat Can IT Teach Us Within An insample<br />
Science<br />
Leonard Smith<br />
Centre <strong>for</strong> the Analysis of Time Series Department of Statistics, London School of Economics,<br />
United Kingdom<br />
By the nature of the problem addressed, climate modelling is an in-sample science. This is true<br />
on at least two counts: first, the time-scale of the <strong>for</strong>ecasts is significantly longer than the<br />
lifetime of the simulation model(s) used; second, both the transient nature of the boundary<br />
conditions (external <strong>for</strong>cing and atmospheric composition) and slow rate at which new data is<br />
obtained limits the scope of traditional approaches like cross-validation. There are fundamental<br />
limitations to what we can be sure of, even on what we can assign meaningful probabilities to,<br />
in this situation (see L.A. Smith, (2002) Proc. National Acad. Sci. USA, 4 (99): 2487-2492). If<br />
we are to realise the potential of ensemble experiments, it is important to clarify the questions<br />
the experiment is to address at the design stage. Several competing goals are discussed in the<br />
context of multi-model, multi-parameter-value, multi-initial condition ensemble modeling. It is<br />
critical to distinguish (at the design stage) between (a) making the best <strong>for</strong>ecast possible today,<br />
in the knowledge that it may be shown to be physically irrelevant (in, say, 10 years time) well<br />
be<strong>for</strong>e the verification time; (b) investigating the behavior of today's model(s) so as to provide<br />
a more useful <strong>for</strong>ecast model(s); (c) bounding likely future behaviours (that is, giving probable<br />
limits under each model, without a clear indication of their probability in practice) and (d)<br />
suggesting specific, pivotal observations to allow repeated reinterpretation the <strong>for</strong>ecast range<br />
(using past and suggesting future model simulations) as time passes. The common disparity<br />
between the variables of interest in potential application (regional, seasonal, and extreme) and<br />
the variables most discussed in model evaluation (global, annual averages) is used to illustrate<br />
the importance of a true initial condition component within the ensemble mix <strong>for</strong> climate<br />
studies in each case above.
Tim Staeger, Statistical Separation Of Natural And Anthropogenic Signals In Observed<br />
Surface Air Temperature Time Series<br />
Tim Staeger<br />
Institute For Meteorology And Geophysics, J.W. Goethe University, Germany<br />
and<br />
Christian-D. Schonwiese<br />
In this study observed surface air temperature time series are statistically analysed with respect<br />
to natural and anthropogenic <strong>for</strong>cing. The data represent global or hemispheric averages,<br />
respectively, as well as regional data (areas means on a global scale, European grid-point data).<br />
The period considered covers approximately the recent century. The analysis method applied is<br />
stepwise regression, including EOF techniques and moving analysis in time, where lowdimension<br />
regression models are evaluated explaining a maximum of observed variance.<br />
Thereby, natural <strong>for</strong>cing is represented by variations of the solar constant, explosive volcanism,<br />
El Nino (ENSO), and the North Atlantic Oscillation (NAO), anthropogenic <strong>for</strong>cing by CO2<br />
equivalents (greenhouse gases, GHG) and tropospheric sulphate (SU). On a global or<br />
hemispheric scale these <strong>for</strong>cing parameter time series explain c. 65 80 % of the observed<br />
temperature variance where greenhouse gases dominate followed by solar activity <strong>for</strong>cing. The<br />
SU signal appears to be problematical. The way to a more regional consideration (as well as<br />
the analysis of precipitation and air pressure data) leads to an increase of stochastic variability<br />
(noise) and in turn to both less explained variance and less confidence of the GHG signal.<br />
Although the most pronounced GHG signals are found in the mid-continental areas of the<br />
northern hemisphere, maximum confidence is related to oceanic and tropical regions. It is<br />
concluded that the large-scale average, in particular global, of surface air temperature is most<br />
appropriate to detect anthropogenic <strong>for</strong>cing on climate by means of observations.
David B. Stephenson, An Overview of EOF / PCA Techniques in Climate Research<br />
David B. Stephenson<br />
Department of Meteorology, University Of Reading, United Kingdom<br />
This talk will provide an overview of Empirical Orthogonal Function (EOF) techniques used in<br />
climate research. Since the 1950s, EOF analysis (or Principal Component Analysis) techniques<br />
have been widely used in climate analysis. This talk will attempt to address the following eight<br />
questions:<br />
- What is EOF/PCA analysis?<br />
- Why do climate scientists use these techniques?<br />
- How has EOF/PCA research evolved since 1950?<br />
- What exactly is a physical/dynamical mode?<br />
- What is a modal expansion?<br />
- Which is more physical: the North Atlantic Oscillation or the Arctic Oscillation?<br />
- What about more regional modes in the Northern Hemisphere?<br />
- Where are we going next?<br />
It is hoped that this talk will raise several issues <strong>for</strong> further discussion and in so doing will<br />
capture much of the variance in current EOF thinking!
Dáithí Stone, The End-To-End Attribution Problem: From Emissions To Impacts<br />
Dáithí Stone<br />
AOPP, Department Of Physics, University Of Ox<strong>for</strong>d, United Kingdom<br />
and<br />
<strong>Myles</strong> Allen<br />
The attribution of recent changes in global mean climate to anthropogenic activities is now<br />
well established. Of course, it is not global mean climate but rather local episodic extreme<br />
weather events that often have the largest impacts. While the attribution of climate change at<br />
more regional scales is now being examined, this research is still restricted to continuous<br />
quantities. Here we present a transfer of a methodology used in epidemiology <strong>for</strong> the<br />
attribution of episodic events. Key to this approach is the consideration of the risk of the event<br />
occurring, rather than the occurrence itself. Given restrictions on our knowledge of the climate<br />
system, it is important to recognise that this risk is in fact a probabilistic quantity and should be<br />
treated accordingly. Tests of the application of this technique to the simple Lorenz 1963<br />
system will examined.
Dáithí Stone, What Is The Best Current Predictor Of Future Climate?<br />
Dáithí Stone<br />
AOPP, Department Of Physics, University Of Ox<strong>for</strong>d, United Kingdom<br />
and<br />
Jesse Kenyon<br />
<strong>Myles</strong> Allen<br />
Gabriele Hegerl<br />
Dave Stain<strong>for</strong>th<br />
Predictions of climate change produced by general circulation models can only be verified<br />
against historical observations. However, due to sampling issues the observational constraints<br />
are consistent with a wide range of possible futures. Thus, <strong>for</strong> establishing the robustness of the<br />
prediction of some future variable we must examine the full historical climate variable space.<br />
It is of considerable interest there<strong>for</strong>e to establish which direction of that variable space is most<br />
important, both in order to constrain the future prediction and to focus ef<strong>for</strong>ts in model<br />
development. Here we conduct a modelling study using the CMIP2 quasi-ensemble to<br />
investigate how intermodel variations in future predictions relate to variations in the<br />
reproduction of historical quantities. Details of the technique and the modelling tests will be<br />
presented.
Peter Stott, Detection Of Anthropogenic Climate Change In Africa And Other<br />
Continental Regions And Attribution Of The Increasing Likelihood Of Extremely Hot<br />
Summer Temperatures.<br />
Peter Stott<br />
Hadley Centre For Climate Prediction And Research, Met Office, United Kingdom<br />
and<br />
Daithi Stone<br />
<strong>Myles</strong> Allen<br />
We show that anthropogenic increases in annual mean temperatures have been detected on<br />
individual continents including in Africa, North America, and Europe. Motivated by the<br />
extremely hot summer in Europe in 2003, we examine the increasing likelihood of hot<br />
European summers and show that a large fraction of the risk of very hot summers can already<br />
be attributed to anthropogenic causes.
Matthew Swann, Extreme Winter Wind And Precipitation In North-Western Europe:<br />
Dataset Comparison And Interannual Variability.<br />
Matthew Swann<br />
Climatic Research Unit, University Of East Anglia, United Kingdom<br />
and<br />
Tom Holt<br />
This work describes the development stages of a seasonal <strong>for</strong>ecasting model designed to<br />
predict daily extremes of wind speed and rainfall over north-western Europe in winter.<br />
European extremes of wind speed and rainfall are embedded in the mean westerly extratropical<br />
circulation and are, there<strong>for</strong>e, influenced by a number of large-scale processes which are<br />
persistent on seasonal timescales. These potential predictors include, <strong>for</strong> example, the North<br />
Atlantic Oscillation (NAO), the sea surface temperature field over the North Atlantic, and<br />
upper air circulations (e.g. Thompson et al., 2002; Frankignoul et al., 2003). The predictor<br />
processes are partially coupled, and have been shown to vary on interannual timescales (e.g.<br />
Rodwell and Folland, 2002). Be<strong>for</strong>e considering predictor/predictand relationships, it is<br />
essential to per<strong>for</strong>m a detailed study of the predictands. This preliminary analysis determines<br />
the optimum statistical model, helps identify the most appropriate methodology, and is the<br />
basis of this discussion. The predictands are total daily precipitation and maximum daily<br />
wind speed, taken from station records and the ECMWF ERA40 reanalysis. The station data<br />
are used to assess the extent and nature of smoothing of extremes in the reanalysis data. First,<br />
the statistical properties of each variable from the two datasets are compared by creating<br />
frequency distributions at selected coincident points. To assess extremes, the analysis<br />
compares the properties of the Generalised Extreme Value distribution <strong>for</strong> the variables in each<br />
dataset at the chosen points. The overall interannual variability of the datasets is examined by<br />
comparing Principal Component Analysis (PCA) scores <strong>for</strong> leading modes of the precipitation<br />
and wind fields.
Mark Tadross, Uncertainty In Producing Regional Climate Change Scenarios For<br />
Southern Africa<br />
Mark Tadross<br />
CSAG, University of Cape Town, South Africa<br />
Using a regional model to downscale climate change predictions from GCMs involves several<br />
aspects of uncertainty: GCMs have different biases when simulating the climate, the correct<br />
physical schemes to use with an RCM are unclear, as is the correct representation of the land<br />
surface in an RCM. All the above are further complicated by a severe lack of observational<br />
data with which to test these models. The talk will address these issues in an ef<strong>for</strong>t to deal with<br />
some of these uncertainties.
Mark Tadross, Midlatitude Wave Patterns Associated With The Start Of The Growing<br />
Season In Southern Africa.<br />
Mark Tadross<br />
CSAG, University of Cape Town, South Africa<br />
The onset of the growing season in southern Africa is an important seasonal characteristic.<br />
Evidence is presented <strong>for</strong> the influence of synoptic variability on onset. Mid-tropospheric<br />
height anomalies are classified using self organising maps and positive anomalies to the south<br />
and east are shown to be associated with an early start. GCM simulations of these anomalies<br />
are also compared to the observations and the implications <strong>for</strong> <strong>for</strong>ecasting discussed.
Warren James Tennant, The Importance Of Rainfall Characteristics In Forecasting And<br />
Verification<br />
Warren James Tennant<br />
South African Weather Service, South Africa<br />
Spatial and temporal variability of rainfall is difficult to quantify. Rainfall observation<br />
techniques all suffer from inadequacies in one way or another such that it is difficult to<br />
establish the spatial integral of rainfall in a specific area. Gauges only provide spot<br />
measurements, while satellite and radar measurements are difficult to calibrate <strong>for</strong> different<br />
synoptic situations. This study looks at a large number of rain gauges in the Pretoria area to<br />
investigate rainfall characteristics on daily and monthly time-scales. The aim is to determine to<br />
what extent in-homogeneity in daily convective-type rainfall is transferred to the longer timescales<br />
and how these high-density measurements match up with satellite and radar<br />
measurements. The effect of rainfall observations on <strong>for</strong>ecast model development and the<br />
verification of rainfall <strong>for</strong>ecasts is also investigated. The period of study <strong>for</strong> this case is January<br />
to March 2004.
Warren James Tennant, Downscaling GCM <strong>Forecasts</strong> To Intra-Seasonal Rainfall<br />
Characteristics<br />
Warren James Tennant<br />
South African Weather Service, South Africa<br />
Seasonal <strong>for</strong>ecasts typically only provide outlooks of rainfall and temperature anomalies<br />
averaged over the entire season. However, there is increasing pressure from users of seasonal<br />
<strong>for</strong>ecast guidance <strong>for</strong> intra-seasonal rainfall characteristics such as rain days, length of dry<br />
spells etc. Forecast frequencies of daily circulation archetypes, determined using a SOM<br />
analysis, are related to rainfall characteristics using neural networks. This methodology and<br />
some results will be presented.
Anneke Thackrah, Climate Change: Is The Brown Locust Trying To Tell Us Something?<br />
Anneke Thackrah<br />
ARC - Institute For Soil, Climate And Water, South Africa<br />
and<br />
Francois Engelbrecht<br />
Hannes Rautenbach<br />
Margaret Kieser<br />
The brown locust, Locustana pardalina (Walker) is endemic to the semi-arid Karoo regions of<br />
South Africa and southern Namibia, and is a constant threat to food security within the<br />
southern African region. As part of a project to develop a Brown Locust Early Warning System<br />
(BLEWS), the locust breeding region was defined using brown locust control data <strong>for</strong> the<br />
period 1984 to 2001. A comparison of the brown locust breeding regions defined in 1937<br />
(Faure), 1958 (Lea) and 2001 (Kieser) reveals a significant westward shift in the eastern<br />
boundary. During the period 1984 to date, limited hatching was reported in the eastern Karoo,<br />
which influenced the subsequent closure of the Middleburg poison depot and its relocation to<br />
Upington. In contrast, the southwestern limits of the outbreak region appear to have expanded.<br />
Simulations of climate change by two high-resolution regional climate models (DARLAM and<br />
C-CAM), <strong>for</strong>ced by fully coupled Ocean-Atmosphere General Circulation models (AOGCMs),<br />
provide much insight into the observed changes in outbreak regions. Modelling results indicate<br />
that a general westward shift of cloud bands that normally produce summer rainfall over the<br />
western and central interior of Southern Africa can be expected in response to Global<br />
Warming. A general increase in annual rainfall across the Karoo can indeed be observed at<br />
various weather stations from the early 1900s, with an associated westward shift of the winter<br />
and early summer (July - December) 150 mm isohyte. This corresponds almost exactly to the<br />
westward shift in the eastern boundary of the locust outbreak area, and suggests that the wetter<br />
conditions are unsuitable <strong>for</strong> brown locust breeding (increased vegetation cover reduces the<br />
availability of suitable oviposition sites). In contrast, the expansion of the brown locust<br />
outbreak area in the drier southwest (100-150 mm) may reflect enhanced breeding success due<br />
to improved soil moisture conditions <strong>for</strong> egg hatching.
Amanda Townsend, Tracking The Evolution Of UK Extreme Temperature Trends<br />
Amanda Townsend<br />
University Of East Anglia, United Kingdom<br />
and<br />
Jean Palutikof<br />
Gareth Janacek<br />
As part of a project to understand the changing character of extreme temperature events over<br />
the British Isles during the twentieth century, long time series of observed daily maximum and<br />
minimum temperatures have been collected. The selection of records has been made bearing in<br />
mind the need <strong>for</strong> good geographical spread. Each time series has been tested <strong>for</strong><br />
inhomogenieties and these have been removed where necessary. The occurrence of extremes<br />
has been explored by fitting Generalized Extreme Value (GEV) distributions to annual maxima<br />
and minima drawn from the winter (DJF) and summer (JJA) seasons. Thus, the time series of<br />
extremes <strong>for</strong> analysis are: highest and lowest values of winter daily maximum temperatures;<br />
highest and lowest values of winter daily minimum temperatures; highest and lowest values of<br />
summer daily maximum temperatures; highest and lowest annual values of summer daily<br />
minimum temperatures. In each case, one value is drawn from each three month time period.<br />
The technique of Maximum Likelihood Estimates has been used to estimate the GEV<br />
parameters. A 30-year moving window has been applied to each of the eight time series,<br />
progressing by one year at each time step. The parameters of the GEV distribution fitted to<br />
each 30-year segment have been calculated and used to determine 20-year return values. The<br />
30 year period ensures a stable and sufficiently large enough dataset in order that unbiased<br />
parameter estimates can be calculated. The moving window approach allows exploration of<br />
changes though time, smoothed <strong>for</strong> clarity. From the GEV parameters, 20-year return values<br />
have been calculated <strong>for</strong> each station and then analyzed <strong>for</strong> trends. While none of the resulting<br />
series are precisely linear against time, linear regression offers a useful foundation <strong>for</strong> trend<br />
detection. The magnitude and direction of the trends have been determined using linear<br />
regression with the statistical significance determined from the Kendall-Tau test. With the<br />
exception of winter extreme cold minimum temperatures (which show a cooling trend of<br />
between -0.83°C/century and -3.22°C/century) all of the time series display some evidence of<br />
a warming trend. The six longest station records <strong>for</strong> cold tail summer minimum temperatures<br />
display the most consistent rise in extreme temperatures during the last century with trend<br />
magnitudes of 1.59°C/century to 3.18°C/century. Understanding the possible causes of these<br />
trends will <strong>for</strong>m the next stage of the study. As a first step, certain covariates are to be added<br />
into the GEV analysis to establish their likely effects on these trends, these include sea level<br />
pressure and specific humidity. Results from this analysis will be presented at the meeting.
Silke Trömel, A Model Fitting Analysis Of Monthly Precipitation Data<br />
Silke Trömel<br />
J.W. Goethe University, Department Of Meteorology and Geophysics, Germany<br />
and<br />
Christian-D. Schoenwiese<br />
A method <strong>for</strong> statistical modelling of climate time series and its application to monthly<br />
precipitation totals of the 20th century is presented. The statistical model describes the time<br />
series under consideration by non-stationary probability density functions with two timedependent<br />
parameters. It depends on the precipitation regime, whether the Gumbel or Weibull<br />
distribution achieves complete description of the data. Thereby the location and scale<br />
parameter or the scale and shape parameter, respectively, may vary containing structured<br />
components like linear or non-linear trends, constant or significantly changing annual cycles<br />
and episodic components. So reliable estimates of these structured components can be<br />
evaluated and the analytical description of the time series allows probability assessments of<br />
extreme values <strong>for</strong> every time step of the observation period as well. In this way<br />
observational German precipitation data can be explained as a realization of a Gumbeldistributed<br />
random variable. Mainly in western Germany positive trends in both the parameters<br />
of the distributions are detected. Together with changes in the amplitude and the phase angle of<br />
the annual cycle in the scale parameter they reflect seasonal differences in the probability<br />
development of exceeding, <strong>for</strong> example, the 180 mm monthly total precipitation threshold.<br />
Winter and spring months show positive changes while the late summer months reveal<br />
negative changes or a slight increase of this probability.
R.P Tshikalanke, Spatial and Temporal Variations in Domestic Biofuel Consumption<br />
rates in Southern Africa.<br />
R.P Tshikalanke<br />
University of Witwatersrand, South Africa<br />
Biomass burning leads to the production of trace gases and aerosols, which influence the<br />
atmospheric chemistry. The magnitude of these emissions is comparable to those of fossil fuel.<br />
Studies have indicated that four types of biofuels are used in Southern Africa, namely wood,<br />
agricultural residues, charcoal and animal dung. The amount of biofuel consumed at a single<br />
part in time has been measured at representative sites around Southern Africa. The seasonal<br />
variation of biofuel consumption has, however not been quantified. Three households were<br />
selected <strong>for</strong> long term data monitoring within Southern Africa. The occupants were given<br />
weighing scales and logbooks were they are recording the number of kilograms used everyday<br />
<strong>for</strong> three cooking session (breakfast, lunch and dinner). The study aims to investigate the<br />
spatial and temporal variation in biofuel consumption rates throughout Southern Africa. It will<br />
also investigate environmental factors influencing the use of domestic fuel. This data, together<br />
with population data will be used to calculate biofuel consumption rates <strong>for</strong> Southern Africa.
Hans Von Storch, The Philosophy of statistics<br />
Hans Von Storch<br />
GKSS Research Centre, Institute For Coastal Research, Germany<br />
No Abstract In<strong>for</strong>mation Available
Hans Von Storch, Limits Of Historical Reconstructions Using Indirect Evidence<br />
Hans Von Storch<br />
GKSS Research Centre, Institute For Coastal Research, Germany<br />
We test how much variability at centennial timescales is lost when past climates are<br />
reconstructed from proxy data. We use data from an atmosphere-ocean climate model<br />
simulation of the last 1000 years, <strong>for</strong>ced with estimates of natural and anthropogenic <strong>for</strong>cings,<br />
and the method of Mann et al. (1998) (1) to estimate Northern Hemisphere temperature from<br />
grid-point temperatures (with white noise added) in realistic locations. We find that the low<br />
frequency variability is greatly underestimated when the predictors contain 50% or more noise.<br />
The inclusion of more predictors from Africa and Asia results in only minor improvement.
Jin-Song Von Storch, On Statistical Dissipation In GCM-Climate.<br />
Jin-Song Von Storch<br />
Meteorological Institute / University Of Hamburg, Germany<br />
This work deals with the dissipation that affects the statistical behavior of a climate variable.<br />
The hypothesis is tested that the statistical dissipation of large-scale variables in a climate<br />
model is significantly influenced by the temporal variations of the model's small scale<br />
variables. The test is done with the T21 ECHAM4 atmospheric GCM by varying model's<br />
representation of small-scale variables in two different ways. First, the strength of the<br />
horizontal diffusion is modified. Secondly, white noise unrelated to the state of the large-scale<br />
variables is added to variables with the smallest scales (wave numbers equal to and smaller<br />
than 18). It is found that the statistical dissipations of large-scale variables (e.g., vorticity at<br />
wavenumber equal to and larger than 6) depend on the intensity of small-scale fluctuations, no<br />
matter whether they are induced by modifying the horizontal diffusion or by adding noise. The<br />
stronger the small-scale fluctuations, the stronger are the dissipations of the large-scale<br />
variables. This result suggests that the simulation of low-frequency climate variations and the<br />
prediction of climate change responses depend on the model representation of small-scale<br />
climate components.
NM Walton, Characterization of the Cape Town Brown Haze<br />
NM Walton<br />
University Of Witwatersrand, South Africa<br />
and<br />
S Piketh<br />
Visibility impairment occurs as a result of the scattering and absorption of light by particles<br />
and gases in the atmosphere. It is described as the haze which obscures the clarity, colour,<br />
texture, and <strong>for</strong>m of what is seen through the atmosphere. Primary particles, secondary<br />
particles (sulfates and nitrates), water particles and nitrogen dioxide gas can cause significant<br />
atmospheric visual impacts (Latimer and Samuelsen, 1978). Cape Town, a major local and<br />
international tourist attraction, experiences high pollution levels during winter with the<br />
occurrence of a brown smog or ‘brown haze’. To evaluate the impact of the haze on visibility<br />
impairment, the Cape Town Brown Haze II project was undertaken during July and August<br />
2003. The plume visual impact screening model, VISCREEN, was used <strong>for</strong> an initial data<br />
analysis. Two screening criteria were used to assess the potential impacts: plume contrast and<br />
∆E. Plume contrast is the relative difference in light intensity of two view objects while ∆E is a<br />
measure of the perceived difference in brightness and colour between a plume and the<br />
background over a range of colours in the visible light spectrum (USEPA, 1992). The plume<br />
visibility model, PLUVUE II, was then used to model plumes from the Table View and<br />
Bellville areas to calculate visual range reduction and atmospheric discolouration over the<br />
surrounding areas.<br />
Latimer, D.A and Samuelsen, G.S., 1978: Visual impact of plumes from power plants:<br />
A theoretical model, Atmospheric Environment, 12, 1455-1465.<br />
U.S. Environmental Protection Agency., 1992: Workbook <strong>for</strong> Plume Visual Impact Screening<br />
and Analysis (revised), EPA-454/4-88-015, October 1992, U.S. Environmental Protection<br />
Agency, Research Triangle Park, NC.
Xiaolan Wang, Using Non-Stationary Generalized Extreme Value Models To Assess<br />
Historical And Possible Future Changes Of Extreme Wave Heights In Northern<br />
Hemisphere Oceans<br />
Xiaolan Wang<br />
Climate Research Branch, Meteorological Service Of Canada, Canada<br />
and<br />
Mr. Val Swail<br />
In this study, we review and extend previous studies on changes of wave heights, focusing on<br />
both observed and possible future changes in the North Atlantic and in the North Pacific. Two<br />
wave hindcasts are used here as observed waves <strong>for</strong> 1958-1997: a global wave hindcast based<br />
on the 10-m winds taken from the NRA (i.e., the reanalysis of the National Centers <strong>for</strong><br />
Environment Prediction, National Center <strong>for</strong> Atmospheric Research), and a detailed North<br />
Atlantic wave hindcast produced with intensively reanalyzed surface winds over the North<br />
Atlantic basin. The observed relationships between sea level pressure (SLP) and significant<br />
wave height (SWH) are used to construct climate change scenarios of SWH: Projections of<br />
seasonal extreme SWH are made using non-stationary generalized extreme value (GEV)<br />
models. The GEV models are trained using the NRA SLP and the observed SWH data <strong>for</strong><br />
1958-1997. The SWH scenarios are constructed using seasonal mean SLP and squared SLP<br />
gradient fields from a coupled climate model (CGCM2) under three different <strong>for</strong>cing scenarios.<br />
The projected (and observed) trends/changes in SWH are assessed by conducting a trend<br />
analysis, in which linear trends are evaluated against quadratic trends. Both oceans had<br />
significant changes in both winter and fall seasonal extremes (and means) of SWH during<br />
1958-1997; they are also projected to have significant changes in the 21st century under all<br />
three <strong>for</strong>cing scenarios. The rate and sign of the projected future SWH changes are not constant<br />
throughout the 21st century; and in some regions, these appear to be quite dependant on the<br />
<strong>for</strong>cing conditions. Often, the projected SWH changes are characterized either by faster<br />
increases in the late decades than in the early decades, or by decreases in the early decades<br />
followed by increases, depending on the <strong>for</strong>cing scenario and the specific location. The rate of<br />
SWH change appears to have a positive relationship with the rate of increase in the greenhouse<br />
gases <strong>for</strong>cing. Changes in ocean wave heights are associated with changes in storm tracks<br />
and cyclone activities over the oceans. In the projected warmer climate, the North Pacific<br />
storm track rotates clock-wise in winter (JFM), with more frequent occurrence of strong<br />
cyclones in the southeast and northwest of the North Pacific; while the storm track over the<br />
northeast Atlantic slightly rotates clock-wise in fall (OND), with more frequent occurrence of<br />
strong cyclones in northern Europe and over the Norwegian Sea.
Xiaolan Wang, Assessment Of Observational Biases And Trends In Canadian<br />
Cloudiness<br />
Xiaolan Wang<br />
Climate Research Branch, Meteorological Service Of Canada, Canada<br />
and<br />
Dr. Francis Zwiers<br />
Mr. Val Swail<br />
Mr. Ted Yuzyk<br />
We have analyzed the hourly cloudiness record (in tenths of the sky dome) at 103 Canadian<br />
stations where observations were made by human observers. The records at 56 stations span<br />
the period from January 1953 to April 2003, while the remaining 47 stations have shorter<br />
records (35-49 years). All records are nearly complete. These records were first subjected to an<br />
intensive assessment of observational biases, and were subsequently analyzed <strong>for</strong> trend by<br />
means of logistic regression. This assessment involved statistical change-point analyses, station<br />
metadata investigation and visual inspection of the time series in question. Changes in<br />
observing practices and observer training, frequent observer changes, relocation, etc. were<br />
found to introduce significant step-changes in cloudiness time series, especially in the period<br />
be<strong>for</strong>e the latest version of Canadian Manual of Surface Weather Observations (MANOBS)<br />
was published in January 1977. We carried out the analyses <strong>for</strong> each of the 11 cloudiness<br />
conditions (from clear sky to overcast: 0/10 - 10/10) separately, while preserving consistency<br />
among the 11 categories. The results of our analyses show that observational biases in<br />
Canadian cloudiness records are too numerous and too significant to ignore. Some biases are<br />
such that trends estimated from unadjusted cloudiness data can be far from reality. After<br />
removing the effect of observational biases, the overall trends of Canadian cloudiness features<br />
more frequent occurrence of clear sky, nearly overcast (9/10) and overcast conditions, and less<br />
frequent occurrence of broken sky conditions in daytime; while nighttime trends feature more<br />
frequent medium-heavy cloudiness conditions and less frequent clear sky and light (1-2 tenths)<br />
cloudiness. Overall nighttime cloudiness has increased during the past half century, which is<br />
consistent with the strong increase in daily minimum temperature that has been observed in<br />
Canada.
A.M. Webb, The nature of the upwelling cell south of Madagascar<br />
A.M. Webb<br />
Department Of Oceanography, University of Cape Town, South Africa<br />
and<br />
R. E Lutjeharms<br />
E Machu<br />
Upwelling in the ocean plays a crucial role in the ecology of many coastlines of the world and<br />
dramatically affects the weather and climate of the adjacent land masses. Most extensive<br />
upwelling regimes are found along the west coasts of continents and are fairly well understood.<br />
It is unusual <strong>for</strong> new upwelling systems still to be discovered. One such newly found upwelling<br />
cell is south-east of Madagascar. This upwelling cell was predicted from basic theory and as a<br />
result subsequently identified in thermal infrared satellite imagery as well as satellite images of<br />
ocean colour (Lutjeharms and Machu, 2000). This has lead to a research cruise making specific<br />
observations in the region as part of the Dutch/South African ACSEX II expedition on the<br />
Dutch research ship Pelagia. The initial results of this cruise confirmed that there indeed is an<br />
upwelling process that occurs at this location (Machu et al., 2002). Further analyses have now<br />
been undertaken and show the nature of the upwelling as well as the likelihood of the<br />
retroflection of the East Madagascar Current south of Madagascar. It is shown that the East<br />
Madagascar Current carries a core of Red Sea Water as it passes the continental shelf off<br />
south-eastern Madagascar. Inshore of the current there are indications of cooler and saltier<br />
water as a result of upwelling. Satellite and other products suggests that the current generates a<br />
cyclone that traps shelf water and carries it away, while an anticyclone <strong>for</strong>ms as part of the<br />
retroflection. This dipole pair then moves off towards the South African coastline (De Ruijter<br />
et al., 2004).<br />
De Ruijter, W.P.M., H.M. van Aken, E.J. Beier, J.R.E. Lutjeharms, R.P. Matano and M.W.<br />
Schouten, (2004). Eddies and dipoles around South Madagascar : <strong>for</strong>mation, pathways and<br />
large-scale impact. Deep-Sea Research I, in press.<br />
Lutjeharms, J.R.E. and E. Machu, 2000. An upwelling cell inshore of the East Madagascar<br />
Current. Deep-Sea Research I, 47(12): 2405-2411.<br />
Machu, E., J. R. E. Lutjeharms, A. M. Webb and H. van Aken, 2002. First hydrographic<br />
evidence of the southeast Madagascar upwelling cell. Geophysical Research Letters, 29(21),<br />
2009, doi:10.1029/2002GL015381.
R Wilby, Limits To Downscaling Predictability / Skill<br />
R Wilby<br />
Climate Change Science, Environment Agency, United Kingdom<br />
This talk will draw on a decade of downscaling intercomparison studies to review issues of<br />
predictability and skill in downscaling techniques; raising notably the debate of to what degree<br />
it is important to select one approach over another. In addition, the talk will present recent<br />
developments and results arising from the Statistical and Regional dynamical Downscaling of<br />
Extremes <strong>for</strong> European regions (STARDEX) project which has focused on rigorous and<br />
systematic inter-comparison and evaluation of statistical, dynamical and statistical-dynamical<br />
downscaling methods.
Xuebin Zhang, On The Estimation Of Exceedance Over A Threshold<br />
Xuebin Zhang<br />
Climate Research Branch, Meteorological Service Of Canada, Canada<br />
and<br />
Gabriele Hegerl<br />
Francis Zwiers<br />
Indices of climate extremes have been developed and maintained <strong>for</strong> the purpose of monitoring<br />
climate change. They are also potentially useful <strong>for</strong> climate change detection studies. A<br />
number of such indices are defined as the number of days in a year or season that daily values<br />
exceeded a time dependent threshold. These thresholds are typically defined as an annual cycle<br />
of daily percentiles that are estimated from a base period such as 1961-1990. Time series of the<br />
frequency of exceedance above the estimated thresholds are often analyzed <strong>for</strong> trends. Using<br />
Monte Carlo simulation, we demonstrate that these time series may contain artificial jumps at<br />
the beginning and end of the base period. This would make these exceedance frequency time<br />
series unsuitable <strong>for</strong> monitoring and detecting climate change. A bootstrap resampling<br />
procedure is proposed to estimate exceedance frequencies during the base period effectively<br />
removes the inhomogeneity.
Xiaogu Zheng, Interannual Variability Of Seasonal-Mean Fields<br />
Xiaogu Zheng<br />
NIWA, New Zealand<br />
and<br />
Carsten Frederiksen<br />
We propose a method <strong>for</strong> studying the influence of intraseasonal variability on the interannual<br />
variability of seasonal mean fields. The method, using monthly mean data, provides estimates<br />
of the interannual variance and covariance, in the seasonal mean field, associated with<br />
intraseasonal variability. These estimates can be used to derive patterns of interannual<br />
variability associated with physical processes that vary significantly within a season, such as<br />
atmospheric blocking, or intraseasonal oscillations. Removing this intraseasonal component<br />
from the total interannual variance/covariance, one can define a “slow” component of<br />
interannual variability that is closely related to very slowly varying (interannual/supra-annual)<br />
external <strong>for</strong>cings and internal dynamics. Together these patterns may help in our understanding<br />
of the source of climate predictive skill, and also the influence of intraseasonal variability on<br />
interannual variability. As an example, the methodology is applied to diagnose physical<br />
processes that play major roles in the variability of DJF New Zealand temperatures.


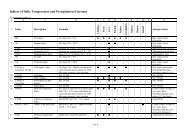
![final_program_abstracts[1]](https://img.yumpu.com/19102520/1/174x260/final-program-abstracts1.jpg?quality=85)