The tenth IMSC, Beijing, China, 2007 - International Meetings on ...
The tenth IMSC, Beijing, China, 2007 - International Meetings on ...
The tenth IMSC, Beijing, China, 2007 - International Meetings on ...

You also want an ePaper? Increase the reach of your titles
YUMPU automatically turns print PDFs into web optimized ePapers that Google loves.
1Oth <str<strong>on</strong>g>Internati<strong>on</strong>al</str<strong>on</strong>g> Meeting <strong>on</strong><br />
Statistical Cl i matology<br />
August 20-24,<str<strong>on</strong>g>2007</str<strong>on</strong>g>, <str<strong>on</strong>g>Beijing</str<strong>on</strong>g>, <str<strong>on</strong>g>China</str<strong>on</strong>g><br />
Program & Abstracts<br />
Organtzed by<br />
Institute of Atmospheric Physics, Chinese Academy of Sciences<br />
and<br />
<str<strong>on</strong>g>Internati<strong>on</strong>al</str<strong>on</strong>g> Meeti ngs <strong>on</strong> Statistical Climatology Steering Committee<br />
fOFICHUilGSZEHTTUS<br />
ii d.r flttHHo(Tl.Clf$tltl9clilf I
Organizers<br />
<str<strong>on</strong>g>IMSC</str<strong>on</strong>g> Steering Committee<br />
Francis Zwiers (Chair, Canada)<br />
Brys<strong>on</strong> Bates (Australia)<br />
Bruce Hewits<strong>on</strong> (South Africa)<br />
Ian Jolliffe (UK)<br />
Doug Nychka (USA)<br />
Hans v<strong>on</strong> Storch (Germany)<br />
10<str<strong>on</strong>g>IMSC</str<strong>on</strong>g> Scientific Program Committee<br />
Huijun Wang (co-chair, <str<strong>on</strong>g>China</str<strong>on</strong>g>) and Xuebin Zhang (co-chair, Canada)<br />
Caspar Ammann (USA)<br />
Brys<strong>on</strong> Bates (Australia)<br />
Richard E. Chandler (UK)<br />
Gabi Hegerl (USA)<br />
Bruce Hewits<strong>on</strong> (South Africa)<br />
Ian Jolliffe (UK)<br />
Rick Katz (USA)<br />
Slava Kharin (Canada)<br />
Ben Kirtman (USA)<br />
Seung-Ki Min (Canada)<br />
Doug Nychka (USA)<br />
Daithi St<strong>on</strong>e (UK)<br />
Hans v<strong>on</strong> Storch (Germany)<br />
Zh<strong>on</strong>gwei Yan (<str<strong>on</strong>g>China</str<strong>on</strong>g>)<br />
Hans Wackernagel (Frence)<br />
Xiaolan Wang (Canada)<br />
Qingyun Zhang (<str<strong>on</strong>g>China</str<strong>on</strong>g>)<br />
Jiang Zhu (<str<strong>on</strong>g>China</str<strong>on</strong>g>)<br />
Francis Zwiers (Canada)<br />
10<str<strong>on</strong>g>IMSC</str<strong>on</strong>g> Local Organizing Committee<br />
Zh<strong>on</strong>gwei Yan and Jiang Zhu (co-chairs)<br />
Guo Zhenhai (web site)<br />
Ziwei Lin (office assistant)<br />
Lunxiang Pan (registrati<strong>on</strong> and finance)<br />
Lizhi Wang (internet)<br />
Yi Wang (local logistics)<br />
Jie Wei (abstracts)<br />
Ying Yang (local logistics)<br />
Lu Zhang (internati<strong>on</strong>al affairs)<br />
Qingyun Zhang (local logistics)
Preface<br />
It is truly a great pleasure to welcome you all to this <str<strong>on</strong>g>tenth</str<strong>on</strong>g> in the series of the <str<strong>on</strong>g>Internati<strong>on</strong>al</str<strong>on</strong>g><br />
<str<strong>on</strong>g>Meetings</str<strong>on</strong>g> <strong>on</strong> Statistical Climatology (<str<strong>on</strong>g>IMSC</str<strong>on</strong>g>), a series that has the simple objectives to<br />
provide a c<strong>on</strong>structive envir<strong>on</strong>ment for exchange between atmospheric scientists and<br />
statisticians and to promote good statistical practice in the atmospheric and climate<br />
sciences. <str<strong>on</strong>g>The</str<strong>on</strong>g> range of subjects spanned by the c<strong>on</strong>tributi<strong>on</strong>s, the number and disciplinary<br />
diversity of the participants, and their wide spread of geographical origins (we have<br />
received more than 200 abstracts from 40 countries located <strong>on</strong> 6 c<strong>on</strong>tinents) all provide<br />
evidence of the important role that statistical analysis plays in climate research.<br />
Many people and organizati<strong>on</strong>s c<strong>on</strong>tributed to the planning and executi<strong>on</strong> of this meeting<br />
for which we are deeply appreciative. It is an impossible task for us to enumerate all of<br />
the people who should be thanked. Nevertheless, there are a few groups and<br />
organizati<strong>on</strong>s that we would like to single out for special thanks. <str<strong>on</strong>g>The</str<strong>on</strong>g> Meeting could not<br />
have taken place without the existence of, and the active encouragement and involvement<br />
of, both the Steering Committee and the Program Committee; the success and the quality<br />
of the meeting are our best thanks to them. We would also like to thank the Award<br />
Committee, chaired by Prof. Ian Jolliffe, for their effort in selecting this meeting’s award<br />
recipients. <str<strong>on</strong>g>The</str<strong>on</strong>g> Institute of Atmospheric Physics (IAP) of the Chinese Academy of<br />
Sciences, and the German GKSS Research Center have provided generous financial<br />
support that has allowed us to offer assistance to keynote speakers, students, and several<br />
participants from developing countries. Finally, we would like to thank the IAP local<br />
organizing staff, led by Prof. Zh<strong>on</strong>gwei Yan and Prof. Jiang Zhu, for their invaluable<br />
works in making the local arrangements for the meeting logistics.<br />
We trust that the Meeting will be rewarding to you all and that it will draw you to the<br />
next <str<strong>on</strong>g>IMSC</str<strong>on</strong>g> that is planned for 2010, and we earnestly hope that you enjoy your visit to<br />
<str<strong>on</strong>g>China</str<strong>on</strong>g> to the full.<br />
Most of presentati<strong>on</strong>s are available for download through the hyperlinks in this<br />
<strong>on</strong>-line versi<strong>on</strong> of the abstracts book.<br />
Huijun Wang and Xuebin Zhang<br />
Program Co-Chairs
Invited Sessi<strong>on</strong>: Spatial patterns of climate ......................................................................................1<br />
Reduced Space Approach to Objective Analyses of Historical Climate Data Sets: Progress<br />
and Problems.............................................................................................................................1<br />
Speaker: Alexey Kaplan....................................................................................................1<br />
Challenges of regi<strong>on</strong>al climate modeling and validati<strong>on</strong> ..........................................................1<br />
Speaker: Douglas Nychka.................................................................................................1<br />
Precipitati<strong>on</strong> Extremes and Spatial Statistics ............................................................................2<br />
Speaker: Richard L. Smith ................................................................................................2<br />
Invited Sessi<strong>on</strong>: Probabilistic estimates of climate sensitivity and other climate system parameters<br />
..........................................................................................................................................................2<br />
New Diagnostics and Comparis<strong>on</strong>s for Estimates of Climate System Properties from Climate<br />
Observati<strong>on</strong>s..............................................................................................................................2<br />
Speaker: Chris E. Forest....................................................................................................2<br />
Quantificati<strong>on</strong> of uncertainty in global temperature projecti<strong>on</strong>s over the twenty-first century:<br />
A synthesis of multiple models and methods............................................................................3<br />
Speaker: Reto Knutti.........................................................................................................3<br />
Coherent treatment of model error and its implicati<strong>on</strong>s for climate sensitivity ........................4<br />
Speaker: Daithi St<strong>on</strong>e........................................................................................................4<br />
Invited Sessi<strong>on</strong>: Seas<strong>on</strong>al to Decadal Forecast .................................................................................5<br />
Slow Modes of Climate Variability and Seas<strong>on</strong>al Predicti<strong>on</strong>....................................................5<br />
Speaker: Carsten S. Frederiksen........................................................................................5<br />
Statistical Methods in CPC Climate Forecast ...........................................................................6<br />
Speaker: Peitao Peng.........................................................................................................6<br />
Establishing n<strong>on</strong>-trivial Skill in Seas<strong>on</strong>al Probability Forecasts: <str<strong>on</strong>g>The</str<strong>on</strong>g> Rise and Fall of<br />
Strawmen ..................................................................................................................................6<br />
Speaker: Le<strong>on</strong>ard Smith....................................................................................................6<br />
Invited Sessi<strong>on</strong>: Climate Rec<strong>on</strong>structi<strong>on</strong> ..........................................................................................7<br />
Significant noise........................................................................................................................7<br />
Speaker: G: Bürger............................................................................................................7<br />
Rec<strong>on</strong>structi<strong>on</strong> Fidelity in Truncated EOF and RegEM Climate Field Rec<strong>on</strong>structi<strong>on</strong><br />
Methods.....................................................................................................................................8<br />
Speaker: Eugene R. Wahl..................................................................................................8<br />
Evaluati<strong>on</strong> of millennial proxy rec<strong>on</strong>structi<strong>on</strong> methods ...........................................................8<br />
Speaker: Francis Zwiers....................................................................................................8<br />
Invited Sessi<strong>on</strong>:.................................................................................................................................9<br />
<str<strong>on</strong>g>The</str<strong>on</strong>g> Quasi-Biennial Oscillati<strong>on</strong> with a Meridi<strong>on</strong>al Tripole Pattern Distributi<strong>on</strong> in the<br />
Interannual Variability and Anomaly of Asian Summer M<strong>on</strong>so<strong>on</strong> over East Asia....................9<br />
Speaker: Huang R<strong>on</strong>ghui ..................................................................................................9<br />
Evidences and Modeling Study of Droughts in <str<strong>on</strong>g>China</str<strong>on</strong>g> during 4-2kaBP..................................10<br />
Speaker: Wang Shaowu...................................................................................................10<br />
Climate and Infectious Disease: New Challenges and Opportunities .....................................11<br />
Speaker: Mark L. Wils<strong>on</strong> ................................................................................................11<br />
Invited Sessi<strong>on</strong>: Climate Extremes .................................................................................................11<br />
Spatial characterizati<strong>on</strong> of extreme meteorological events; climate and weather effects .......11<br />
1
Speaker: Dan Cooley.......................................................................................................11<br />
Probabilistic Event Attributi<strong>on</strong> of the United Kingdom Autumn 2000 Floods .......................12<br />
Speaker: Pardeep Pall......................................................................................................12<br />
Combining climate models for probabilistic of climate change: statistics and heuristics.......13<br />
Speaker: Claudia Tebaldi ................................................................................................13<br />
Parallel Sessi<strong>on</strong>s:Climate Data Homogenizati<strong>on</strong> and Climate Trend/Variability Assessment.....14<br />
Time series analysis of daily rainfall variability and extreme events......................................14<br />
Speaker: Bohloul Alijani.................................................................................................14<br />
Observed changes in July-August precipitati<strong>on</strong> and temperature extremes over <str<strong>on</strong>g>China</str<strong>on</strong>g> .........14<br />
Speaker: H<strong>on</strong>gmei Li ......................................................................................................14<br />
Changes of winter extreme rainfall over Southwest Western Australia and the linkage to the<br />
Southern Annular Mode ..........................................................................................................15<br />
Speaker: Yun Li...............................................................................................................15<br />
Estimati<strong>on</strong> and Extrapolati<strong>on</strong> of Climate Normals and Climatic Trend..................................16<br />
Speaker: Robert E. Livezey.............................................................................................16<br />
Changepoint Detecti<strong>on</strong> in Multinomial Logistic Regressi<strong>on</strong> with Applicati<strong>on</strong> to<br />
Sky-Cloudiness C<strong>on</strong>diti<strong>on</strong>s in Canada....................................................................................17<br />
Speaker: QiQi Lu ............................................................................................................17<br />
A cloud-based rec<strong>on</strong>structi<strong>on</strong> of surface solar radiati<strong>on</strong> trends for Australia..........................17<br />
Speaker: Manuel Nunez ..................................................................................................17<br />
Patterns and trends in severe storm envir<strong>on</strong>ments using re-analysis data...............................18<br />
Speaker: Matthew Pocernich...........................................................................................18<br />
Spatial Variati<strong>on</strong> of Thunderstorm Rainfalls in the Northwest of Iran....................................19<br />
Speaker: Ali Akbar Rasuly..............................................................................................19<br />
A Comparis<strong>on</strong> of Various Changepoint Detecti<strong>on</strong> Techniques for Climate Data....................19<br />
Speaker: Jaxk Reeves......................................................................................................19<br />
Some Features of Instrumental Period Rainfall and Wet Seas<strong>on</strong> Fluctuati<strong>on</strong>s over Different<br />
River Basins of India...............................................................................................................20<br />
Speaker: Nityanand Singh...............................................................................................20<br />
Sequential change point analysis using Bayesian criteri<strong>on</strong>.....................................................21<br />
Speaker: S K Srivastava..................................................................................................21<br />
Homogenizati<strong>on</strong> of daily air pressure, temperature and precipitati<strong>on</strong> series for Southern<br />
Moravia in the period 1848–2006 ...........................................................................................22<br />
Speaker: Petr Stepanek....................................................................................................22<br />
Basic methodological questi<strong>on</strong>s of homogenizati<strong>on</strong> and the MASH procedure.....................23<br />
Speaker: Tamas Szentimrey ............................................................................................23<br />
Trend Analysis of Extreme Climatic Indices in Iran using Extreme Climate Index Software<br />
(ECIS) .....................................................................................................................................24<br />
Speaker: Farahnaz Taghavi .............................................................................................24<br />
Trend analysis of agrometeorological and meteorological indices of climate change in several<br />
climatic regi<strong>on</strong>s of Iran ...........................................................................................................25<br />
Speaker: Vahid Varshavian..............................................................................................25<br />
Penalized maximal t-test, penalized maximal F-test, and the RHtestV2 software package for<br />
2
climate data homogenizati<strong>on</strong>...................................................................................................26<br />
Speaker: Xiaolan L. Wang...............................................................................................26<br />
Penalized maximal t-test for detecting undocumented mean change......................................27<br />
Speaker: Xiaolan L. Wang...............................................................................................27<br />
Penalized maximal F-test for detecting undocumented mean-shift ........................................27<br />
Speaker: Xiaolan L. Wang...............................................................................................27<br />
Observed Temperature Trends in Colorado.............................................................................28<br />
Speaker: Klaus Wolte ......................................................................................................28<br />
Parallel Sessi<strong>on</strong>s:General C<strong>on</strong>tributi<strong>on</strong>........................................................................................28<br />
<str<strong>on</strong>g>The</str<strong>on</strong>g> Survey of 1 to 5 day rain fal in Tehran County based <strong>on</strong> Markof Chain model Sec<strong>on</strong>d<br />
stage ........................................................................................................................................28<br />
Speaker: Mojgan Afshar..................................................................................................28<br />
On the verificati<strong>on</strong> and comparis<strong>on</strong> of extreme rainfall indices from climate models ...........29<br />
Speaker: Cheng-Ta Chen.................................................................................................29<br />
Unsupervised machine learning techniques for studying climate variability..........................30<br />
Speaker: Alexander Ilin...................................................................................................30<br />
Multi-resoluti<strong>on</strong> analysis <strong>on</strong> the relati<strong>on</strong>ship between summer rainfall over North <str<strong>on</strong>g>China</str<strong>on</strong>g> and<br />
Australian winter rainfall ........................................................................................................32<br />
Speaker: Yun Li...............................................................................................................32<br />
<str<strong>on</strong>g>The</str<strong>on</strong>g> dominant dynamical mode under an increase in CO2 c<strong>on</strong>centrati<strong>on</strong>...............................32<br />
Speaker: Jin-S<strong>on</strong>g v<strong>on</strong> Storch .........................................................................................32<br />
Verificati<strong>on</strong> of Biomass Burning Aerosols by Using GOES-12..............................................33<br />
Speaker: Jian Zeng ..........................................................................................................33<br />
Parallel Sessi<strong>on</strong>s:Downscaling.....................................................................................................34<br />
Evaluati<strong>on</strong> of a regi<strong>on</strong>al climate model regarding statistical characteristics of daily<br />
precipitati<strong>on</strong> and sensitivity to physical parameterizati<strong>on</strong>s.....................................................34<br />
Speaker: Susanne Bachner ..............................................................................................34<br />
Addressing climate model uncertainty in stochastic downscaling applicati<strong>on</strong>s......................34<br />
Speaker: Richard E. Chandler .........................................................................................34<br />
On the variati<strong>on</strong> of temperature and precipitati<strong>on</strong> in the 20th century and its scenarios under<br />
various CO2 c<strong>on</strong>centrati<strong>on</strong> in <str<strong>on</strong>g>China</str<strong>on</strong>g> .......................................................................................35<br />
Speaker: Youmin Chen....................................................................................................35<br />
An Automated Synoptic Weather Typing and Its Applicati<strong>on</strong>s to Climate Change Impact<br />
Analyses..................................................................................................................................36<br />
Speaker: Chad Shouquan Cheng.....................................................................................36<br />
Answering questi<strong>on</strong>s about empirical downscaling methodologies........................................36<br />
Speaker: Bruce Hewits<strong>on</strong>................................................................................................36<br />
Does n<strong>on</strong>linearity bring an improvement in statistical downscaling of daily temperature?....37<br />
Speaker: Radan Huth.......................................................................................................37<br />
Detecti<strong>on</strong> and simulati<strong>on</strong> of extreme rainfall in a topographically complex regi<strong>on</strong> ...............38<br />
Speaker: Chris Lennard...................................................................................................38<br />
Regressi<strong>on</strong> Procedures and <str<strong>on</strong>g>The</str<strong>on</strong>g>ir Applicati<strong>on</strong>s to Climate Change Impact Analyses.............38<br />
3
Speaker: Qian Li .............................................................................................................38<br />
Issues for Use of Climate Models to Assess Future Impacts and Develop Adaptive Strategies:<br />
Cauti<strong>on</strong>s for IPCC WGs 1 and 2 .............................................................................................39<br />
Speaker: Robert E. Livezey.............................................................................................39<br />
Snow Trends in Northern Spain: Analysis and simulati<strong>on</strong> with statistical downscaling models<br />
.................................................................................................................................................40<br />
Speaker: Maria R. P<strong>on</strong>s...................................................................................................40<br />
Relati<strong>on</strong>ship between large-scale circulati<strong>on</strong> and North American extreme precipitati<strong>on</strong> in<br />
observati<strong>on</strong>s and model simulati<strong>on</strong>s .......................................................................................41<br />
Speaker: Jiafeng Wang ....................................................................................................41<br />
Parallel Sessi<strong>on</strong>s:Climate Change Detecti<strong>on</strong> and Attributi<strong>on</strong> ......................................................41<br />
Applicati<strong>on</strong> of Granger Causality Test to Detecti<strong>on</strong> and Attributi<strong>on</strong> of Climate Change .......41<br />
Speaker: H<strong>on</strong>g-xing Cao.................................................................................................41<br />
Detecti<strong>on</strong> of urban warming in recent temperature trends in Japan........................................43<br />
Speaker: Fumiaki Fujibe .................................................................................................43<br />
A hierarchical Bayesian model for climate change detecti<strong>on</strong> and attributi<strong>on</strong> .........................43<br />
Speaker: Tianshu Ma.......................................................................................................43<br />
Multi-Model Bayesian Climate Change Assessment for Regi<strong>on</strong>al Surface Temperatures .....44<br />
Speaker: Seung-Ki Min...................................................................................................44<br />
Detecti<strong>on</strong> of Human Influence <strong>on</strong> pan-Arctic Precipitati<strong>on</strong>....................................................45<br />
Speaker: Seung-Ki Min...................................................................................................45<br />
Impact of carb<strong>on</strong>aceous aerosols <strong>on</strong> attributable warming and future predicti<strong>on</strong>...................45<br />
Speaker: Toru Nozawa ....................................................................................................45<br />
Robustness of climate change signals in near term predicti<strong>on</strong>s up to the year 2030...............46<br />
Speaker: Hideo Shiogama ...............................................................................................46<br />
Extending attributi<strong>on</strong> studies: postage stamps for the world...................................................47<br />
Speaker: Dáithí St<strong>on</strong>e......................................................................................................47<br />
C<strong>on</strong>sistency of observed winter precipitati<strong>on</strong> trends in northern Europe with regi<strong>on</strong>al climate<br />
change projecti<strong>on</strong>s...................................................................................................................47<br />
Speaker: Hans v<strong>on</strong> Storch ...............................................................................................47<br />
Detecti<strong>on</strong> of external influence <strong>on</strong> trends of atmospheric storminess and northern oceans<br />
wave heights............................................................................................................................48<br />
Speaker: Xiaolan L. Wang...............................................................................................48<br />
Detecti<strong>on</strong> of Human Influence <strong>on</strong> 20th Century Precipitati<strong>on</strong> Trends....................................48<br />
Speaker: Xuebin Zhang...................................................................................................48<br />
An assessment of regi<strong>on</strong>al record-breaking statistics in annual mean temperature ................49<br />
Speaker: Eduardo Zorita .................................................................................................49<br />
Parallel Sessi<strong>on</strong>s:Process Studies.................................................................................................50<br />
<str<strong>on</strong>g>The</str<strong>on</strong>g> study <strong>on</strong> Anomalous Atmosphere-Ocean Currents and the Propagati<strong>on</strong> Mechanism for<br />
Warm Signal of Sea Temperature............................................................................................50<br />
Speaker: Changrui...........................................................................................................50<br />
Detecting annual cycle in the modes of low-frequency circulati<strong>on</strong> variability.......................51<br />
4
Speaker: Radan Huth.......................................................................................................51<br />
Harm<strong>on</strong>ic Analysis <strong>on</strong> Low Latitudinal Climatological Wind Field.......................................52<br />
Speaker: Liping Li...........................................................................................................52<br />
Links between cycl<strong>on</strong>ic activity and precipitati<strong>on</strong>..................................................................53<br />
Speaker: Piero Li<strong>on</strong>ello...................................................................................................53<br />
<str<strong>on</strong>g>The</str<strong>on</strong>g> Interdecadal Variati<strong>on</strong> of the Equatorial Pacific SST and its Relati<strong>on</strong>ships with the<br />
Southern and Northern Oscillati<strong>on</strong>..........................................................................................53<br />
Speaker: Jingbei Peng .....................................................................................................53<br />
<str<strong>on</strong>g>The</str<strong>on</strong>g> Unsteadiness of NH Stati<strong>on</strong>ary Wave ..............................................................................54<br />
Speaker: Ning Shi ...........................................................................................................54<br />
Parallel Sessi<strong>on</strong>s:Climate Rec<strong>on</strong>structi<strong>on</strong>....................................................................................55<br />
On the loss or preservati<strong>on</strong> of externally forced climate variability in climate field<br />
rec<strong>on</strong>structi<strong>on</strong>s ........................................................................................................................55<br />
Speaker: Caspar M. Ammann..........................................................................................55<br />
Rec<strong>on</strong>structi<strong>on</strong> of the Past 100-Year Weather Variati<strong>on</strong> in Europe.........................................56<br />
Speaker: Youmin Chen....................................................................................................56<br />
A multiple surrogate data study of rec<strong>on</strong>structi<strong>on</strong> skills .........................................................57<br />
Speaker: Bo Christiansen ................................................................................................57<br />
Meiyu since 1736 over Middle-Lower Reaches of Yangtze River..........................................57<br />
Speaker: Quansheng Ge ..................................................................................................57<br />
Coherence of climatic rec<strong>on</strong>structi<strong>on</strong> from historical documents in <str<strong>on</strong>g>China</str<strong>on</strong>g> by different studies<br />
.................................................................................................................................................58<br />
Speaker: Quansheng Ge ..................................................................................................58<br />
Linear and n<strong>on</strong>-linear rec<strong>on</strong>structi<strong>on</strong> from tree-ring series and written documents and the<br />
problem of low frequencies and missing data.........................................................................59<br />
Speaker: Guiot, Joel ........................................................................................................59<br />
<str<strong>on</strong>g>The</str<strong>on</strong>g> 'Hockey Stick' and the 1990s: A Statistical Perspective <strong>on</strong> Rec<strong>on</strong>structing Hemispheric<br />
Temperatures...........................................................................................................................59<br />
Speaker: Bo Li ................................................................................................................59<br />
Dec<strong>on</strong>structing Rec<strong>on</strong>structi<strong>on</strong> ...............................................................................................60<br />
Speaker: Matthew R. Schofield.......................................................................................60<br />
Pseudo-proxy tests of the regularized expectati<strong>on</strong> maximizati<strong>on</strong> (RegEM) method and their<br />
implicati<strong>on</strong>s for real-world climate field rec<strong>on</strong>structi<strong>on</strong>s of the last millennium ...................61<br />
Speaker: Jas<strong>on</strong> E. Smerd<strong>on</strong> .............................................................................................61<br />
North western temperature during S<strong>on</strong>g and Yuan Dynasty (960-1368AD) in <str<strong>on</strong>g>China</str<strong>on</strong>g> ............61<br />
Speaker: Jingyun Zheng..................................................................................................61<br />
Underlying dynamics of glacial millennial-scale climate transiti<strong>on</strong>s derived from ice-core<br />
data..........................................................................................................................................62<br />
Speaker: Frank Kwasniok .............................................................................................62<br />
Parallel Sessi<strong>on</strong>s:Regi<strong>on</strong>al Studies...............................................................................................63<br />
Spatio-Temporal Variability of the Sea Surface Temperature of the Gulf of Guinea and Its<br />
Implicati<strong>on</strong> for Coastal Precitati<strong>on</strong> in Nigeria ........................................................................63<br />
5
Speaker: Ediang Okuku Archib<strong>on</strong>g.................................................................................63<br />
<str<strong>on</strong>g>The</str<strong>on</strong>g> impact of climate change <strong>on</strong> frost occurrences across the Murray-Darling Basin...........64<br />
Speaker: B. Timbal..........................................................................................................64<br />
Iterative Interpolati<strong>on</strong> of Daily Precipitati<strong>on</strong> Data for Alberta, Canada..................................65<br />
Speaker: QINGFANG DAI .............................................................................................65<br />
Recent Rainfall Trends in Agro-Ecological Z<strong>on</strong>es of Zambia ................................................65<br />
Speaker: Suman Jain .......................................................................................................65<br />
Variability of Rainfall in C<strong>on</strong>necti<strong>on</strong> with the 3 - 5-Day Wave in Northern Africa in summer<br />
.................................................................................................................................................66<br />
Speaker: David MONKAM ............................................................................................66<br />
C<strong>on</strong>siderati<strong>on</strong> of Drought at the Aji-chai Basin......................................................................66<br />
Speaker: Davoud Naghizadeh .........................................................................................66<br />
<str<strong>on</strong>g>The</str<strong>on</strong>g> quantitative survey of drought effects <strong>on</strong> the barley yield in Eastern Azarbayjan by<br />
classical statistical ways..........................................................................................................67<br />
Speaker: Elham Rahmani................................................................................................67<br />
<str<strong>on</strong>g>The</str<strong>on</strong>g> Evaluati<strong>on</strong> of Climatic Factors that Effect Climate in Azarbayjan by Method of Principal<br />
Comp<strong>on</strong>ent Analysis ...............................................................................................................68<br />
Speaker: Majid Rezaei Banafsheh...................................................................................68<br />
Climate Risk Management in North-East of Iran By Statistical Downscaling Direct <strong>on</strong> GCMs<br />
Output .....................................................................................................................................69<br />
Speaker: Sina Samadi......................................................................................................69<br />
Analysing decadal rainfall perfomance in Uganda .................................................................70<br />
Speaker: Senkunda Samuel .............................................................................................70<br />
A Preview of Iran`s Climate Using SIAP Method ..................................................................70<br />
Speaker: Behrooz Sari Sarraf ..........................................................................................70<br />
Analyzing of synoptic intence showers over the southern part of ARAS River .....................71<br />
Speaker: Behrooz Sari Sarraf ..........................................................................................71<br />
Indian M<strong>on</strong>so<strong>on</strong> Rainfall and its relati<strong>on</strong>ship with El-nino/Southern Oscillati<strong>on</strong> Index (SOI)<br />
Over India during 1940- 2000.................................................................................................71<br />
Speaker: C.V.Singh .........................................................................................................71<br />
Parallel Sessi<strong>on</strong>s:Forecast ............................................................................................................72<br />
Verificati<strong>on</strong> of Climate Predicti<strong>on</strong>s.........................................................................................72<br />
Speaker: Albert R. Boehm...............................................................................................72<br />
Integrated seas<strong>on</strong>al climate forecasts for South America........................................................74<br />
Speaker: Caio Coelho......................................................................................................74<br />
<str<strong>on</strong>g>The</str<strong>on</strong>g> Roles of Ensembles in Climate Modelling ......................................................................75<br />
Speaker: Hailiang Du ......................................................................................................75<br />
Climatepredicti<strong>on</strong>.net..............................................................................................................75<br />
Speaker: Nick Faull.........................................................................................................75<br />
Statistical characterizati<strong>on</strong> of ensemble predicti<strong>on</strong> systems: Applicati<strong>on</strong> to the DEMETER<br />
ensemble .................................................................................................................................76<br />
Speaker: Jesús Fernández................................................................................................76<br />
Spatiotemporal Rainfall Predictive Model using ANN and Storm Data Sets. Case Study:<br />
6
Bogotá City, Colombia............................................................................................................77<br />
Speaker: Carlos F Gaitan ................................................................................................77<br />
A new interval-based method for seas<strong>on</strong>al forecast validati<strong>on</strong>: Applicati<strong>on</strong> to DEMETER in<br />
Perú and Spain ........................................................................................................................77<br />
Speaker: Jose M. Gutierrez .............................................................................................77<br />
Tests for evaluating rank histograms from ensemble forecasts...............................................78<br />
Speaker: Ian Jolliffe ........................................................................................................78<br />
Empirical probabilistic seas<strong>on</strong>al forecasts for Canada............................................................79<br />
Speaker: V. Kharin ..........................................................................................................79<br />
Regime predictability in an atmospheric model or analogue predicti<strong>on</strong> revisited ..................79<br />
Speaker: Frank Kwasniok ...............................................................................................79<br />
Insights from a Skill Analysis of the First Decade of L<strong>on</strong>g-Lead U.S. Three-M<strong>on</strong>th<br />
Temperature and Precipitati<strong>on</strong> Forecasts ................................................................................80<br />
Speaker: Robert E. Livezey.............................................................................................80<br />
A Multiple Linear Regressi<strong>on</strong> Model for the Seas<strong>on</strong>al Predicti<strong>on</strong> of Rainfall over Peninsular<br />
India ........................................................................................................................................80<br />
Speaker: Lorna R. Nayagam ...........................................................................................80<br />
Determinati<strong>on</strong> of Threshold for Binary Forecast ....................................................................81<br />
Speaker: Ke<strong>on</strong> Tae Sohn .................................................................................................81<br />
Effects of daily MOC fluctuati<strong>on</strong>s <strong>on</strong> l<strong>on</strong>g-term MOC predictability ....................................82<br />
Speaker: Jin-S<strong>on</strong>g v<strong>on</strong> Storch .........................................................................................82<br />
On the reliability of ENSO dynamical predicti<strong>on</strong>s .................................................................82<br />
Speaker: Youmin Tang ....................................................................................................82<br />
Comparis<strong>on</strong> of Informati<strong>on</strong>-based Measures of Forecast Uncertainty in Ensemble ENSO<br />
Predicti<strong>on</strong> ................................................................................................................................83<br />
Speaker: Youmin Tang ....................................................................................................83<br />
Seas<strong>on</strong>al Climate Forecasts for the Southwestern U.S............................................................84<br />
Speaker: Klaus Wolter.....................................................................................................84<br />
Parallel Sessi<strong>on</strong>s:Simulati<strong>on</strong> tools for weather generati<strong>on</strong> and risk assessment ..........................85<br />
High resoluti<strong>on</strong> simulati<strong>on</strong> of weather sequences for binary events with Generative<br />
Classifiers................................................................................................................................85<br />
Speaker: Rafael Ancell....................................................................................................85<br />
Using multi-site stochastic downscaling to understand regi<strong>on</strong>al precipitati<strong>on</strong> variability and<br />
trends across southern Australia..............................................................................................85<br />
Speaker: Stephen P. Charles............................................................................................85<br />
Improving the simulati<strong>on</strong> of extreme events by stochastic weather generators......................86<br />
Speaker: Richard W. Katz ...............................................................................................86<br />
Atmospheric dust dispersi<strong>on</strong> from disking operati<strong>on</strong>: near-field simulati<strong>on</strong> ..........................87<br />
Speaker: Junming wang ..................................................................................................87<br />
Stochastic modeling of regi<strong>on</strong>al variability in the summertime precipitati<strong>on</strong> over the<br />
southwestern U.S. ...................................................................................................................88<br />
Speaker: Jingyun Wang...................................................................................................88<br />
A study of daily precipitati<strong>on</strong> in North <str<strong>on</strong>g>China</str<strong>on</strong>g> using generalized linear models......................89<br />
7
Speaker: Yi Wang............................................................................................................89<br />
Parallel Sessi<strong>on</strong>s: ENSO and M<strong>on</strong>so<strong>on</strong> ..........................................................................................90<br />
<str<strong>on</strong>g>The</str<strong>on</strong>g> preparati<strong>on</strong> of the colza suitability map using statistical analysis and GIS .....................90<br />
Speaker: Hamed Adab.....................................................................................................90<br />
Multi-scale analysis of the surface energy balance during the corn growing seas<strong>on</strong>, and a new<br />
reas<strong>on</strong> for energy unclosed......................................................................................................90<br />
Speaker: Jianxia Guo.......................................................................................................90<br />
Effects of land cover change <strong>on</strong> East Asian summer m<strong>on</strong>so<strong>on</strong> variability..............................91<br />
Speaker: Eungul Lee .......................................................................................................91<br />
Seas<strong>on</strong>al Predicti<strong>on</strong> of Rainfall over Peninsular India using a Principal Comp<strong>on</strong>ent<br />
Regressi<strong>on</strong> Model ...................................................................................................................92<br />
Speaker: Lorna R. Nayagam ...........................................................................................92<br />
L<strong>on</strong>g Range Forecasting of M<strong>on</strong>so<strong>on</strong> Rainfall over Peninsular India for Recent Years.........93<br />
Speaker: J Rajesh ............................................................................................................93<br />
M<strong>on</strong>itoring and defining El Ni?o/Southern Oscillati<strong>on</strong> behaviour with an enhanced<br />
Multivariate ENSO Index (MEI) ............................................................................................93<br />
Speaker: Klaus Wolter.....................................................................................................93<br />
Parallel Sessi<strong>on</strong>s:Spatial statistics................................................................................................94<br />
Interacti<strong>on</strong>s between dust clouds and meningitis epidemics in the Sahel: a geostatistical study<br />
.................................................................................................................................................94<br />
Speaker: Béatrice Augereau ............................................................................................94<br />
Estimati<strong>on</strong> of the missing data by principal comp<strong>on</strong>ents analysis..........................................95<br />
Speaker: L. Benaichata....................................................................................................95<br />
Spatial interpolati<strong>on</strong> of daily precipitati<strong>on</strong> in <str<strong>on</strong>g>China</str<strong>on</strong>g>: 1951-2000............................................95<br />
Speaker: Deliang Chen....................................................................................................95<br />
Applicati<strong>on</strong>s of Bayesian Networks in Climate ......................................................................96<br />
Speaker: Jose M. Gutierrez .............................................................................................96<br />
Space-time Modeling of Biomass Burning and Regi<strong>on</strong>al Aerosols in Southeast Asia............97<br />
Speaker: Tao Shi..............................................................................................................97<br />
C<strong>on</strong>structi<strong>on</strong> and applicati<strong>on</strong>s of 2-d digital filters for separating spatial scales ....................98<br />
Speaker: Hans v<strong>on</strong> Storch ...............................................................................................98<br />
Parallel Sessi<strong>on</strong>s:Climate and Industry ........................................................................................98<br />
Multi-scale analysis of the surface energy balance during the corn growing seas<strong>on</strong>, and a new<br />
reas<strong>on</strong> for energy unclosed......................................................................................................98<br />
Speaker: Jianxia Guo.......................................................................................................98<br />
A Decisi<strong>on</strong> Tree Classificati<strong>on</strong> with Correlati<strong>on</strong>-based Feature Selecti<strong>on</strong> for Decisi<strong>on</strong> Making<br />
in C<strong>on</strong>ducting the Cloud Seeding Operati<strong>on</strong>s .........................................................................99<br />
Speaker: Lily Ingsrisawang.............................................................................................99<br />
Uncertain Climatic Land of Africa........................................................................................100<br />
Speaker: Gord<strong>on</strong> Ondiek Nyabade................................................................................100<br />
Estimating barley yield by means of drought indexes and climatic parameters in Eastern<br />
Azerbaijan using Artificial Neural Network .........................................................................101<br />
8
Speaker: Elham Rahmani..............................................................................................101<br />
Drought and its ecological effects in central of Gilan –south western of Caspian sea..........102<br />
Speaker: Ramezani Gourabi, Bahman ..........................................................................102<br />
A model of potential natural vegetati<strong>on</strong> ................................................................................102<br />
Speaker: Matteo Zampieri.............................................................................................102<br />
Special AMS Sessi<strong>on</strong>:Verificati<strong>on</strong> of Climate Forecasts............................................................103<br />
Diagnostic and user-focused verificati<strong>on</strong> of seas<strong>on</strong>al and climate forecasts: Extensi<strong>on</strong>s from<br />
weather forecast verificati<strong>on</strong> methodologies.........................................................................103<br />
Speaker: Barbara G. Brown...........................................................................................103<br />
Locality and the Ranked Probability Score...........................................................................103<br />
Speaker: Sim<strong>on</strong> Mas<strong>on</strong> .................................................................................................103<br />
Verificati<strong>on</strong> of Seas<strong>on</strong>al to Secular Climate Forecasts.........................................104<br />
Speaker: David Stephens<strong>on</strong>...........................................................................................104<br />
Verificati<strong>on</strong> of Climate Forecasts (Discussi<strong>on</strong>).....................................................................105<br />
Speaker: Ian Jolliffe ......................................................................................................105<br />
Bey<strong>on</strong>d Ensembles: <str<strong>on</strong>g>The</str<strong>on</strong>g> Applicati<strong>on</strong> and Improvement of Climate Simulati<strong>on</strong>s .................105<br />
Speaker: Le<strong>on</strong>ard Smith................................................................................................105<br />
Poster Sessi<strong>on</strong> ...............................................................................................................................105<br />
Detected shift of Mediterranean cycl<strong>on</strong>e tracks using the ERA-40 database........................105<br />
Judit Bartholy................................................................................................................105<br />
Regi<strong>on</strong>al climate change expected by the end of the 21st century in Central/Eastern Europe<br />
...............................................................................................................................................106<br />
J. Bartholy .....................................................................................................................106<br />
Future changes of extreme events over Korea in regi<strong>on</strong>al projecti<strong>on</strong>...................................107<br />
Kyung-On Boo..............................................................................................................107<br />
Multi-scale statistic and dynamic model for annual streamflow of the Yangtze River at the<br />
Three Gorges Dam in <str<strong>on</strong>g>China</str<strong>on</strong>g>..................................................................................................107<br />
CAO Liqing...................................................................................................................107<br />
Climate Change in the Siberian High and Its Relati<strong>on</strong>ship to the East-Asian M<strong>on</strong>so<strong>on</strong> ......108<br />
H<strong>on</strong>g-xing Cao..............................................................................................................108<br />
L<strong>on</strong>g-term Probabilistic Forecast and T* Distributi<strong>on</strong>..........................................................109<br />
Shao-Hang Chu .............................................................................................................109<br />
Spatial Drought Rec<strong>on</strong>structi<strong>on</strong> Based On Point-By-Point Regressi<strong>on</strong>................................109<br />
Edward R. Cook............................................................................................................109<br />
High resoluti<strong>on</strong> modeling of the m<strong>on</strong>so<strong>on</strong> circulati<strong>on</strong> in the Indian Ocean..........................110<br />
N. A. Diansky................................................................................................................110<br />
<str<strong>on</strong>g>The</str<strong>on</strong>g> Study of the Impacts of Meteorological Parameters <strong>on</strong> the Air Quality Index in the<br />
Esfahan City.......................................................................................................................... 111<br />
Victoria Ezzatian ........................................................................................................... 111<br />
Statistical Analysis of temporal variati<strong>on</strong> of rainfall and evapotranspirati<strong>on</strong> in several<br />
meteorological stati<strong>on</strong>s of Iran..............................................................................................112<br />
Fathi. Mohammad .........................................................................................................112<br />
Error Detecti<strong>on</strong> and Checking of Inhomogenities Basing <strong>on</strong> the Metadata in Uganda<br />
9
Climatological Dataset..........................................................................................................113<br />
Lubega N.Fortunata.......................................................................................................113<br />
Analyze Effect Factors and Research Forecasting Method of the Annual Water C<strong>on</strong>sumpti<strong>on</strong><br />
in <str<strong>on</strong>g>Beijing</str<strong>on</strong>g> City.......................................................................................................................114<br />
Ge Zhao-xia...................................................................................................................114<br />
Forecasting Schemes of the Reservoir’s M<strong>on</strong>thly Runoff Volume Based <strong>on</strong> the Wavelet<br />
Analyze .................................................................................................................................114<br />
Ge Zhao-xia...................................................................................................................114<br />
<str<strong>on</strong>g>The</str<strong>on</strong>g> study of the Urban Heat Island in Nanjing city..............................................................115<br />
Gu Lihua .......................................................................................................................115<br />
“Attributi<strong>on</strong> of changes in extreme weather risk: a study of the European Summer 2003<br />
Heatwave”.............................................................................................................................115<br />
Helen Hanl<strong>on</strong> ................................................................................................................115<br />
Seas<strong>on</strong>al Rainfall Predicti<strong>on</strong> for the Tropical Pacific Regi<strong>on</strong>...............................................116<br />
Luke He.........................................................................................................................116<br />
Development and analysis of a daily high resoluti<strong>on</strong> grid over Spain (1950-2003) .............117<br />
Sixto Herrera .................................................................................................................117<br />
Projecti<strong>on</strong> of future heat wave mortality rates using regi<strong>on</strong>al climate model predicti<strong>on</strong>s ....117<br />
Chun Kit Ho..................................................................................................................117<br />
East Asian Summer m<strong>on</strong>so<strong>on</strong> changes in the MIS 3 Stage recorded from the western South<br />
<str<strong>on</strong>g>China</str<strong>on</strong>g> Sea ..............................................................................................................................118<br />
Baoqi Huang .................................................................................................................118<br />
Wavelet Based Fractal Analysis of El Niño Episodes...........................................................118<br />
Zhiy<strong>on</strong>g Huang .............................................................................................................118<br />
Global average surface temperature anomalies with COBE-SST.........................................119<br />
Koji Ishihara..................................................................................................................119<br />
Multi-timescale Analysis, Rec<strong>on</strong>structi<strong>on</strong> and Estimati<strong>on</strong> for Global Sun Solar in January and<br />
North Hemispherical Temperature Anomalies Data..............................................................119<br />
Ji Lingling .....................................................................................................................119<br />
L<strong>on</strong>g-term climatology of droughts in the Limpopo Province of South Africa ....................120<br />
T. A. Kabanda................................................................................................................120<br />
Rescue of historical climate data: Compilati<strong>on</strong> of a new historical data-base for Germany.121<br />
Alice Kapala..................................................................................................................121<br />
Annual and seas<strong>on</strong>al precipitati<strong>on</strong> trend investigati<strong>on</strong> in central regi<strong>on</strong> of Iran using<br />
n<strong>on</strong>-parametric methods........................................................................................................121<br />
Yo<strong>on</strong>es Khoshkhoo .......................................................................................................121<br />
L<strong>on</strong>g-range correlati<strong>on</strong>s of ERA-40 temperature data: Geographic patterns and height<br />
dependence............................................................................................................................122<br />
Andrea Kiraly................................................................................................................122<br />
Interpolati<strong>on</strong> methods of weather generator parameters .......................................................122<br />
Stanislava Kliegrova .....................................................................................................122<br />
Intra-seas<strong>on</strong>al Variability of Indian M<strong>on</strong>so<strong>on</strong> Precipitati<strong>on</strong> in Coupled Climate Model<br />
Simulati<strong>on</strong>s and Projecti<strong>on</strong>s under IPCC AR4......................................................................123<br />
ASHWINI KULKARNI................................................................................................123<br />
10
Statistical analysis of definiteness of selected climate classificati<strong>on</strong>s from a view of climate<br />
change ...................................................................................................................................125<br />
KVETON, VIT..............................................................................................................125<br />
<str<strong>on</strong>g>The</str<strong>on</strong>g> structure of predictability in a quasigeostrophic atmospheric model.............................125<br />
Frank Kwasniok ............................................................................................................125<br />
Projected change in mean and extreme climate over Korea..................................................126<br />
W<strong>on</strong>-Tae Kw<strong>on</strong> .............................................................................................................126<br />
Trend Indicators of Atmospheric Climate Change based <strong>on</strong> Reanalyses and Global Climate<br />
Model Scenarios....................................................................................................................127<br />
Bettina C. Lackner ........................................................................................................127<br />
Bayesian Detecti<strong>on</strong> and Attributi<strong>on</strong> of Climate Change <strong>on</strong> a Regi<strong>on</strong> of Northeast Asia ......128<br />
Je<strong>on</strong>g-Hye<strong>on</strong>g Lee ........................................................................................................128<br />
Stochastic downscaling of climate model outputs for c<strong>on</strong>tinuous hydrological simulati<strong>on</strong>..128<br />
Nadja Leith....................................................................................................................128<br />
<str<strong>on</strong>g>The</str<strong>on</strong>g> seas<strong>on</strong>al characteristic of ChangSha's climate warming................................................129<br />
Liao Chunhua................................................................................................................129<br />
Rainfall and Synoptic characteristics of the flood discharge events at Xin'anjiang, eastern<br />
<str<strong>on</strong>g>China</str<strong>on</strong>g>, during the 1980s-1990s .............................................................................................130<br />
H<strong>on</strong>gtao Liu ..................................................................................................................130<br />
<str<strong>on</strong>g>The</str<strong>on</strong>g> Analysis and Study <strong>on</strong> Mesoscale c<strong>on</strong>vective Cloud Clusters and the Torrential Rains of<br />
the Middle Yangtze River During Meiyu Seas<strong>on</strong>..................................................................130<br />
Tiantian Liu...................................................................................................................130<br />
<str<strong>on</strong>g>The</str<strong>on</strong>g> Study of <str<strong>on</strong>g>The</str<strong>on</strong>g> Effect of D<strong>on</strong>gting Lake <strong>on</strong> <str<strong>on</strong>g>The</str<strong>on</strong>g> Temperature..........................................131<br />
Tiantian Liu...................................................................................................................131<br />
<str<strong>on</strong>g>The</str<strong>on</strong>g> Study of Reas<strong>on</strong>s of Drought of Northwestern Regi<strong>on</strong> of Iran......................................131<br />
Fardin Saberi Louyeh....................................................................................................131<br />
Quantifying Uncertanties Associated With Climate Variaiblity and Climate Change Studies:<br />
the Cox´S Semiparametric Approach....................................................................................132<br />
Aline de Holanda Nunes Maia ......................................................................................132<br />
<str<strong>on</strong>g>The</str<strong>on</strong>g> Dominant Indian Ocean Dipole Influence <strong>on</strong> Southeastern African Seas<strong>on</strong>al Rainfall<br />
Variability..............................................................................................................................134<br />
Desm<strong>on</strong>d Manatsa.........................................................................................................134<br />
Climate Predicti<strong>on</strong> Techniques for Small Scale Farmers Using Daily Rainfall Data in<br />
Southern Province - Zambia..................................................................................................135<br />
Munalula Mate ..............................................................................................................135<br />
Statistical Analysis of variati<strong>on</strong> and precipitati<strong>on</strong> trend in arid regi<strong>on</strong>, central IRAN..........136<br />
Nasr Isfahani Mehrdad..................................................................................................136<br />
<str<strong>on</strong>g>The</str<strong>on</strong>g> Relati<strong>on</strong> Between PCA and SOM in Processing of Multivariate Datasets ....................137<br />
Ladislav METELKA.....................................................................................................137<br />
Probabilistic Climate Change Predicti<strong>on</strong>s Applying Bayesian Model Averaging.................137<br />
Seung-Ki Min................................................................................................................137<br />
Linking atmospheric circulati<strong>on</strong> to daily rainfall patterns over the territory of Bulgaria using<br />
Hidden Markov Models ........................................................................................................138<br />
Neyko M. Neykov.........................................................................................................138<br />
11
Bridging the gap between simulated climate and local weather ...........................................139<br />
Heiko Paeth...................................................................................................................139<br />
Comparis<strong>on</strong> of past and future trends of extreme climate indices for Central/Eastern Europe<br />
...............................................................................................................................................140<br />
R. P<strong>on</strong>gracz ...................................................................................................................140<br />
Past climate rec<strong>on</strong>structi<strong>on</strong> for the Carpathian basin using documentary sources................140<br />
R. P<strong>on</strong>gracz ...................................................................................................................140<br />
Predicti<strong>on</strong> of M<strong>on</strong>so<strong>on</strong> rainfall over Peninsular India using parameters over Arabian Sea and<br />
adjacent seas..........................................................................................................................141<br />
Rajesh J .........................................................................................................................141<br />
Statistical downscaling of a specific weather pattern for rainfall forecast using techniques of<br />
artificial intelligence .............................................................................................................142<br />
María Cleof Valverde Ramírez......................................................................................142<br />
Determining Africa Socio-Ec<strong>on</strong>omic Challenges to Climate Sensitivity: the Need to Work<br />
Together ................................................................................................................................143<br />
Ayadiani Kenneth Rumi ................................................................................................143<br />
A GEV fit to Annual Temperature Extremes in Argentina: a Study of the 1976-77 Climate<br />
Shift.......................................................................................................................................144<br />
Matilde Rusticucci ........................................................................................................144<br />
Impact of ENSO PHASES <strong>on</strong> Amaz<strong>on</strong>ia Seas<strong>on</strong>al Rainfall.................................................145<br />
Clovis Angeli Sansigolo................................................................................................145<br />
Climate Data Homogenizati<strong>on</strong> and Climate Trend/Variability Assessment..........................145<br />
Nazaryan Satenik ..........................................................................................................145<br />
<str<strong>on</strong>g>The</str<strong>on</strong>g> KMA Ensemble Predicti<strong>on</strong> System : the impact of Ensemble size increase..................146<br />
Joo-Hyung S<strong>on</strong>..............................................................................................................146<br />
Arctic heat spells - a case study of the warm spring 2006 at Svalbard .................................147<br />
Dag Johan Steinskog .....................................................................................................147<br />
West African Weather Systems in the Development of Tropical Cycl<strong>on</strong>es...........................147<br />
Salami Tairu ..................................................................................................................147<br />
Intense Precipitati<strong>on</strong> Events in the Reanalysis Datasets over the Asia .................................148<br />
Kiyotoshi Takahashi......................................................................................................148<br />
Relati<strong>on</strong>ship Between Ensemble Mean Square and Ensemble Mean Skill in Four Climate<br />
Models...................................................................................................................................149<br />
Youmin Tang .................................................................................................................149<br />
A Methodology in Predicting the Influence of Climatic .......................................................149<br />
Herminia C. Tanguilig...................................................................................................149<br />
Intelligent data processing center (IDPC) of climate and rural development in Iran (case study:<br />
sistan regi<strong>on</strong>).........................................................................................................................150<br />
Mortaza tavakoli ...........................................................................................................150<br />
Climatic jumps in precipitati<strong>on</strong> extremes in associati<strong>on</strong> with recent drying process in North<br />
<str<strong>on</strong>g>China</str<strong>on</strong>g>.....................................................................................................................................150<br />
Tu Kai............................................................................................................................150<br />
Water vapour transport from the tropical Atlantic and summer rainfall over tropical southern<br />
Africa ....................................................................................................................................151<br />
12
Nicolas Vigaud ..............................................................................................................151<br />
Regi<strong>on</strong>al scale and downscaled climate projecti<strong>on</strong>s for Croatia...........................................152<br />
Visnja Vucetic ...............................................................................................................152<br />
Climate change impact <strong>on</strong> the increase of forest fire risk <strong>on</strong> the Croatian Adriatic coast.....153<br />
Marko Vučetić...............................................................................................................153<br />
Fitting a power law model for low frequencies of ERA40 air temperature spectra..............154<br />
Dmitry Vyushin .............................................................................................................154<br />
Impact of L<strong>on</strong>g-Range Correlati<strong>on</strong>s <strong>on</strong> Trend Detecti<strong>on</strong> in Total Oz<strong>on</strong>e .............................154<br />
Dmitry Vyushin .............................................................................................................154<br />
Crytic Period Analysis Model of Hydrological Process Based <strong>on</strong> Herteroskedasticity Test and<br />
Its Applicati<strong>on</strong>.......................................................................................................................155<br />
H<strong>on</strong>grui Wang ...............................................................................................................155<br />
Examining the Oceanic Fresh Water Flux in the NCEP Reanalyses and Global Models .....156<br />
Pingping Xie .................................................................................................................156<br />
Impact of Urban Expansi<strong>on</strong> <strong>on</strong> Regi<strong>on</strong>al Temperature Change in the Yangtze River Delta 157<br />
Zhiqing Xie ...................................................................................................................157<br />
Detecting Inhomogeneity in Daily Climate Series Using Wavelet Analysis.........................157<br />
Zh<strong>on</strong>gwei Yan ...............................................................................................................157<br />
Changing Trends of Climate in Jiangsu Province during 1961 to 2000................................158<br />
Xiliang Zhang ...............................................................................................................158<br />
Calibrating and evaluating reanalyses surface temperature bias by topographic correcti<strong>on</strong>.159<br />
Tianbao Zhao.................................................................................................................159<br />
A Statistical Predicti<strong>on</strong> of the Seas<strong>on</strong>al Mean Circulati<strong>on</strong> and a Comparis<strong>on</strong> with Dynamical<br />
Ensemble Predicti<strong>on</strong> using NCEP’s CFS..............................................................................159<br />
Xiaogu Zheng................................................................................................................159<br />
A Statistical Predicti<strong>on</strong> of the Seas<strong>on</strong>al Mean Circulati<strong>on</strong>....................................................160<br />
Xiaogu Zheng................................................................................................................160<br />
To explore an optimal climate decisi<strong>on</strong>-making method suitable for medium-sized reservoir<br />
management ..........................................................................................................................161<br />
Zou Xiyun .....................................................................................................................161<br />
13
Invited Sessi<strong>on</strong>: Spatial patterns of climate<br />
Reduced Space Approach to Objective Analyses of Historical Climate Data Sets: Progress and<br />
Problems<br />
Speaker: Alexey Kaplan<br />
Alexey Kaplan<br />
Lam<strong>on</strong>t-Doherty Earth Observatory of Columbia University<br />
alexeyk@ldeo.columbia.edu<br />
Observed historical climate fields are characterized by comparatively precise data and<br />
good coverage in the last few decades and poor observati<strong>on</strong>al coverage in the earlier period.<br />
<str<strong>on</strong>g>The</str<strong>on</strong>g> technique of the reduced space objective analysis of such fields (i.e. estimating them in<br />
projecti<strong>on</strong>s <strong>on</strong>to a low-dimensi<strong>on</strong>al space spanned by the leading patterns of the signal<br />
variability) is presented in the c<strong>on</strong>text of more traditi<strong>on</strong>al approaches to objective data analysis.<br />
Various versi<strong>on</strong>s of space reducti<strong>on</strong> and covariance estimati<strong>on</strong> techniques are reviewed.<br />
Outstanding problems and possible ways to overcome them are discussed.<br />
Challenges of regi<strong>on</strong>al climate modeling and validati<strong>on</strong><br />
Speaker: Douglas Nychka<br />
Douglas Nychka, ari Kaufman, Stephen Sain and Linda Mearns<br />
Nati<strong>on</strong>al Center for Atmospheric Research, PO Box 3000, Boulder, CO 80307-3000<br />
nychka@ucar.edu<br />
As attenti<strong>on</strong> shifts from broad global summaries of climate change to more specific<br />
regi<strong>on</strong>al results there is a need for statistics to analyze observati<strong>on</strong>s and model output that<br />
have significant variability and also to quantify the uncertainty in regi<strong>on</strong>al projecti<strong>on</strong>s. This talk<br />
will survey some work <strong>on</strong> interpreting regi<strong>on</strong>al climate experiments. In large multi-model<br />
studies <strong>on</strong>e challenge is to understand the c<strong>on</strong>tributi<strong>on</strong>s of different global and regi<strong>on</strong>al model<br />
combinati<strong>on</strong>s to the simulated climate. This is difficult because the runs tend to be short in<br />
length and with a limited number of ensemble members. We suggest some spatial models for<br />
the climate fields based <strong>on</strong> sparse approximati<strong>on</strong>s to the covariance matrix and derive an AN<br />
OVA like decompositi<strong>on</strong> for the fields. <str<strong>on</strong>g>The</str<strong>on</strong>g> decompositi<strong>on</strong> into main effects and interacti<strong>on</strong>s<br />
helps to isolate the effects of different models. <str<strong>on</strong>g>The</str<strong>on</strong>g> spatial models provide a rigorous<br />
framework for assessing statistical significance and comparing simulati<strong>on</strong>s to observed<br />
climate. This approach is illustrated for output from the PRUDENCE program and we also<br />
discuss the newer NARCCAP experiments for regi<strong>on</strong>al climate of North America.<br />
1
Precipitati<strong>on</strong> Extremes and Spatial Statistics<br />
Speaker: Richard L. Smith<br />
Richard L. Smith<br />
University of North Carolina<br />
rls@email.unc.edu<br />
In recent years an enormous literature has grown up documenting the increase in<br />
frequency of extreme climatic events of many types, and their c<strong>on</strong>jectured associati<strong>on</strong> with<br />
anthropogenic causes of climate change. However, much of this literature has been relatively<br />
unsophisticated statistically, for example, calculating indices of climate change and looking for<br />
trends via time series and regressi<strong>on</strong> methods. <str<strong>on</strong>g>The</str<strong>on</strong>g> field of precipitati<strong>on</strong> extremes is especially<br />
challenging statistically, since precipitati<strong>on</strong> is defined by spatial as well as temporal scale, and<br />
climate model data is at a different spatial scale from rain gauge data. In this talk I focus <strong>on</strong> two<br />
applicati<strong>on</strong>s where the applicati<strong>on</strong> of spatial statistics is critical. <str<strong>on</strong>g>The</str<strong>on</strong>g> first c<strong>on</strong>cerns the<br />
estimati<strong>on</strong> of trends in the extremes of l<strong>on</strong>g-term precipitati<strong>on</strong> data, where spatial statistics is<br />
used to combine trends calculated at different locati<strong>on</strong>s and to define regi<strong>on</strong>al and nati<strong>on</strong>al<br />
trends. <str<strong>on</strong>g>The</str<strong>on</strong>g> sec<strong>on</strong>d applicati<strong>on</strong> c<strong>on</strong>cerns the more specific problem of relating extreme value<br />
distributi<strong>on</strong>s calculated from point source (rain guage) data and gridded data, which is critical<br />
to characterizing the projecti<strong>on</strong> of future extremes from climate models.<br />
Invited Sessi<strong>on</strong>: Probabilistic estimates of climate sensitivity and other climate system<br />
parameters<br />
New Diagnostics and Comparis<strong>on</strong>s for Estimates of Climate System Properties from Climate<br />
Observati<strong>on</strong>s<br />
Speaker: Chris E. Forest<br />
Chris E. Forest<br />
Joint Program <strong>on</strong> the Science and Policy of Global Change, Massachusetts Institute of Technology,<br />
Cambridge, MA 02139, USA<br />
ceforest@mit.edu<br />
Bruno Sansò<br />
Department of Applied Mathematics and Statistics, University of California, Santa Cruz, Santa Cruz,<br />
CA<br />
Daniel Zantedeschi<br />
Department of Applied Mathematics and Statistics, University of California, Santa Cruz, Santa Cruz,<br />
CA<br />
Andrei P. Sokolov<br />
2
Joint Program <strong>on</strong> the Science and Policy of Global Change,Massachusetts Institute of Technology,<br />
Cambridge, MA 02139, USA<br />
Peter H. St<strong>on</strong>e<br />
Joint Program <strong>on</strong> the Science and Policy of Global Change,Massachusetts Institute of Technology,<br />
Cambridge, MA 02139, USA<br />
Two major challenges in estimating climate system properties (e.g., climate sensitivity<br />
and rate of deep-ocean heat uptake) from climate observati<strong>on</strong>s include: (a) the uncertainty in<br />
the historical climate forcings and climate observati<strong>on</strong>s, and (b) the uncertainty in the unforced<br />
variability of the climate system. Each of these poses a major challenge due to both the limited<br />
data available from either observati<strong>on</strong>s or climate model output and the required accuracy in<br />
the statistical algorithms. To address these issues, we have implemented a new estimati<strong>on</strong><br />
algorithm based <strong>on</strong> Bayesian methods to estimate the probability density functi<strong>on</strong>s for climates<br />
system properties. This is similar to model calibrati<strong>on</strong> algorithms in the statistics literature<br />
although here we use multi-variate patterns rather than scalar diagnostics to estimate the<br />
likelihood functi<strong>on</strong>s. We use a Bayesian approach that allows for the use of scientifically based<br />
informati<strong>on</strong> <strong>on</strong> the climate system properties to be used in the calibrati<strong>on</strong> process. <str<strong>on</strong>g>The</str<strong>on</strong>g><br />
statistical model tackles the problem of dealing with multivariate diagnostics and incorporates<br />
all estimati<strong>on</strong> uncertainties into the posterior distributi<strong>on</strong>s of the climate system properties.<br />
Additi<strong>on</strong>ally we obtain estimates of the covariance structure of the unforced variability of<br />
temperature change patterns. <str<strong>on</strong>g>The</str<strong>on</strong>g>se results are critical for understanding uncertainty in future<br />
climate change and provide an independent check that the informati<strong>on</strong> c<strong>on</strong>tained in recent<br />
climate change is robust to statistical treatment. <str<strong>on</strong>g>The</str<strong>on</strong>g>se results include uncertainties in the<br />
estimati<strong>on</strong> of the multivariate covariance matrices for the first time.<br />
Quantificati<strong>on</strong> of uncertainty in global temperature projecti<strong>on</strong>s over the twenty-first century: A<br />
synthesis of multiple models and methods<br />
Speaker: Reto Knutti<br />
Reto Knutti<br />
Institute for Atmospheric and Climate Science, ETH Zurich, Switzerland<br />
reto.knutti@env.ethz.ch<br />
<str<strong>on</strong>g>The</str<strong>on</strong>g> quantificati<strong>on</strong> of the uncertainties in future climate projecti<strong>on</strong>s is crucial for the<br />
implementati<strong>on</strong> of climate policies. Here I provide projecti<strong>on</strong>s of global temperature change<br />
over the twenty-first century for the six illustrative, n<strong>on</strong>-interventi<strong>on</strong> SRES emissi<strong>on</strong> scenarios<br />
based <strong>on</strong> the latest generati<strong>on</strong> of coupled general circulati<strong>on</strong> climate models, and assess<br />
uncertainty ranges and probabilistic projecti<strong>on</strong>s from various published methods and models.<br />
Short-term trends in global temperature are comparably well c<strong>on</strong>strained and similar across all<br />
3
scenarios. When c<strong>on</strong>sidering evidence from different studies, l<strong>on</strong>g-term uncertainties are<br />
found to be larger than the ranges shown in previous IPCC reports, and also larger than<br />
captured in single models or methods. This is due to structural differences in the models, the<br />
sources of uncertainty taken into account, the type observati<strong>on</strong>al c<strong>on</strong>straints used, and the<br />
statistical assumpti<strong>on</strong>s made. It is shown that assuming a time- and scenario independent<br />
relative uncertainty range for the future is a good approximati<strong>on</strong> for the scenarios c<strong>on</strong>sidered.<br />
<str<strong>on</strong>g>The</str<strong>on</strong>g> deviati<strong>on</strong>s from a c<strong>on</strong>stant relative uncertainty can be explained by the assumpti<strong>on</strong>s made<br />
in different methods, which all c<strong>on</strong>sider a subset of uncertainties in climate feedbacks,<br />
observed surface warming and observed ocean heat uptake, uncertainties in forcing,<br />
c<strong>on</strong>tributi<strong>on</strong>s of natural unforced internal variability, and natural forced variability by solar and<br />
volcanic forcing. Inclusi<strong>on</strong> of uncertainties in carb<strong>on</strong> cycle feedbacks extends the upper bound<br />
of the uncertainty range by more than the lower bound.<br />
Coherent treatment of model error and its implicati<strong>on</strong>s for climate sensitivity<br />
Speaker: Daithi St<strong>on</strong>e<br />
Daithi St<strong>on</strong>e, David Frame and Myles Allen<br />
AOPP, University of Oxford<br />
st<strong>on</strong>ed@atm.ox.ac.uk<br />
Debate over the correct statistical framework to use, and Bayesian prior assumpti<strong>on</strong>s to<br />
make, has bedevilled efforts to reach c<strong>on</strong>sensus over the appropriate range of uncertainty in<br />
climate sensitivity. <str<strong>on</strong>g>The</str<strong>on</strong>g> crux of the problem is that we are dealing with a quantity that is<br />
n<strong>on</strong>-linear in any c<strong>on</strong>ceivable observable climate variable, and the uncertainties are sufficiently<br />
large that arbitrary issues of statistical methodology have a substantial impact <strong>on</strong> headline<br />
c<strong>on</strong>clusi<strong>on</strong>s. In Frame et al (2005) we proposed an approach to making the process more<br />
transparent by separating out the role played by data from the role of prior assumpti<strong>on</strong>s in<br />
estimating a distributi<strong>on</strong> for climate sensitivity. If differences in prior assumpti<strong>on</strong>s are removed,<br />
the c<strong>on</strong>sensus <strong>on</strong> the relative likelihood of high versus very-high values for climate sensitivity<br />
is surprisingly good. Rather than resolving differences between rival estimates, as we hoped,<br />
our suggesti<strong>on</strong> seems to have inflamed the debate still further. In this talk we will explain how<br />
the approach proposed in Frame et al (2005) generalises to a problem in which there are<br />
multiple underdetermined parameters, and show how it fits into the standard statistical<br />
framework of likelihood profiling. We will argue that the climate change detecti<strong>on</strong> and<br />
attributi<strong>on</strong> community has, in effect, adopted a likelihood-profiling approach to date, which<br />
typically delivers more cautious estimates of uncertainty than a fully Bayesian subjectivist<br />
approach. <str<strong>on</strong>g>The</str<strong>on</strong>g> difficulty we face in assessments like that of the Intergovernmental Panel <strong>on</strong><br />
Climate Change is that, if the same language is used to report likelihood-based results from<br />
attributi<strong>on</strong> studies and subjective Bayesian probabilities for predicti<strong>on</strong> studies, we will end up<br />
appearing more c<strong>on</strong>fident about the future than we are about the past. A logical soluti<strong>on</strong> would<br />
4
e to adopt a different calibrated language to report subjective probabilities to that used to<br />
report likelihoods, but whether this could be accepted at this stage is a moot point.<br />
Invited Sessi<strong>on</strong>: Seas<strong>on</strong>al to Decadal Forecast<br />
Slow Modes of Climate Variability and Seas<strong>on</strong>al Predicti<strong>on</strong><br />
Speaker: Carsten S. Frederiksen<br />
Carsten S. Frederiksen<br />
Bureau of Meteorology Research Centre, Melbourne, Australia<br />
c.frederiksen@bom.gov.au<br />
Xiaogu Zheng<br />
Nati<strong>on</strong>al Institute of Water and Atmospheric Research, Wellingt<strong>on</strong>, New Zealand<br />
<str<strong>on</strong>g>The</str<strong>on</strong>g> provisi<strong>on</strong> of skillful seas<strong>on</strong>al forecasts of temperature, rainfall and other climate<br />
variables has obvious potential benefits for countries whose ec<strong>on</strong>omic activity is dependent <strong>on</strong><br />
agriculture, tourism and other climate-sensitive industries. At extra-tropical latitudes, a<br />
substantial comp<strong>on</strong>ent of interannual variability of seas<strong>on</strong>al mean climate fields arises from<br />
variability within the seas<strong>on</strong> (i.e. intraseas<strong>on</strong>al variability). This 'intraseas<strong>on</strong>al' comp<strong>on</strong>ent is<br />
mainly c<strong>on</strong>tributed to by weather variability with time scale l<strong>on</strong>ger than the deterministic<br />
predicti<strong>on</strong> period (about ten days) and therefore it is essentially unpredictable <strong>on</strong> seas<strong>on</strong>al, or<br />
l<strong>on</strong>ger, timescales. After removing this comp<strong>on</strong>ent from seas<strong>on</strong>al mean fields, the residual<br />
comp<strong>on</strong>ent is more likely to be associated with slowly varying external forcings (e.g. sea<br />
surface temperatures) and from slowly varying (interannual/supra-annual, slower than<br />
intraseas<strong>on</strong>al time scale) internal atmospheric variability and therefore, it is more potentially<br />
predictable at the l<strong>on</strong>g range. This comp<strong>on</strong>ent is referred to comm<strong>on</strong>ly as the 'slow' or<br />
'potentially predictable' comp<strong>on</strong>ent.<br />
Recently, the authors developed a methodology for estimating, from m<strong>on</strong>thly mean data,<br />
spatial patterns, or modes, of the slow and intraseas<strong>on</strong>al comp<strong>on</strong>ents. This methodology<br />
provides a way to better identify and understand the sources of predictive skill as well as the<br />
sources of uncertainty in climate variability. Here, we illustrate this by applying the<br />
methodology to an analysis of New Zealand rainfall variability and the Southern Hemisphere<br />
and Northern Hemisphere 500hPa geopotential height field, often used to characterize the<br />
general atmospheric circulati<strong>on</strong>. In particular, we show how the informati<strong>on</strong> obtained can be<br />
used to develop improved statistical seas<strong>on</strong>al forecasts of these two variables. <str<strong>on</strong>g>The</str<strong>on</strong>g><br />
methodology for c<strong>on</strong>structing the forecast schemes is based <strong>on</strong> determining predictors for the<br />
principal comp<strong>on</strong>ent time series of the dominant slow modes and then using these to c<strong>on</strong>struct<br />
a forecast of the climate field as a linear combinati<strong>on</strong> of the slow modes. We compare the skill<br />
of our statistical schemes with dynamical seas<strong>on</strong>al forecast models and show how our<br />
methodology can be used to analyse the sources of model predictive skill.<br />
5
Statistical Methods in CPC Climate Forecast<br />
Speaker: Peitao Peng<br />
Peitao Peng<br />
CPC/NCEP/NOAA<br />
peitao.peng@noaa.gov<br />
Although dynamical models have been increasingly used in climate forecast, statistical<br />
(or empirical) methods still have rooms to play, since dynamical models are far from perfect in<br />
their settings. This presentati<strong>on</strong> will review the status of climate forecast in CPC and introduce<br />
some statistical methods used in operati<strong>on</strong>al forecast. Emphasis will be <strong>on</strong> the methods<br />
developed by CPC scientists, such as the optimum climate normal (OCN) and the c<strong>on</strong>structed<br />
analog (CA). <str<strong>on</strong>g>The</str<strong>on</strong>g> OCN method, taking an average of latest years as the predicti<strong>on</strong> for the<br />
coming year, has shown valuable skills in catching decadal or l<strong>on</strong>ger timescale variability. <str<strong>on</strong>g>The</str<strong>on</strong>g><br />
CA method, approximating current state with a linear combinati<strong>on</strong> of historical sates and then<br />
carrying forward in time while persisting the weights assigned to each historical case, is skillful<br />
for forecasting sub-seas<strong>on</strong>al and seas<strong>on</strong>al variability.<br />
In additi<strong>on</strong>, our recent effort in c<strong>on</strong>solidating forecasting tools will also be reported<br />
Establishing n<strong>on</strong>-trivial Skill in Seas<strong>on</strong>al Probability Forecasts: <str<strong>on</strong>g>The</str<strong>on</strong>g> Rise and Fall of Strawmen<br />
Speaker: Le<strong>on</strong>ard Smith<br />
Professor Le<strong>on</strong>ard Smith<br />
L<strong>on</strong>d<strong>on</strong> School of Ec<strong>on</strong>omics, Centre for the Analysis of Time Series (CATS)<br />
lenny@maths.ox.ac.uk<br />
A clear dem<strong>on</strong>strati<strong>on</strong> of the utility for probability forecasts <strong>on</strong> seas<strong>on</strong>al time scales<br />
would significantly increase their attractiveness to decisi<strong>on</strong> makers who already use ensemble<br />
informati<strong>on</strong> <strong>on</strong> weather timescales. <str<strong>on</strong>g>The</str<strong>on</strong>g> challenges of robust evaluati<strong>on</strong> of probability forecasts<br />
<strong>on</strong> seas<strong>on</strong>al scales are illustrated by c<strong>on</strong>trasting the performance of simulati<strong>on</strong> models with<br />
relatively simple data-based statistical models. Several challenges arise from the<br />
small-number statistics available for seas<strong>on</strong>al lead-times, multi-model multi-initial c<strong>on</strong>diti<strong>on</strong><br />
ensembles must be translated into probability density functi<strong>on</strong>s and evaluated based <strong>on</strong> <strong>on</strong>ly<br />
dozens of forecast-verificati<strong>on</strong> pairs; this is in c<strong>on</strong>trast to the weather case where the forecast<br />
archive may c<strong>on</strong>sist of many hundreds of pairs. When the archive is small, and data are<br />
precious, false c<strong>on</strong>fidence in the forecasts is likely due to over-fitting and the poor assignments<br />
of weights to the various model structures. Three methods of weighting models ([i] equally,<br />
[ii]in/out selecti<strong>on</strong> which rejects some models completely while assigning equal weights to<br />
6
those retained, and [iii] performance based weights) are c<strong>on</strong>sidered, and illustrated in cases of<br />
small and large forecast archives. In the large archive case, robust results can be obtained by<br />
a wide variety of approaches. <str<strong>on</strong>g>The</str<strong>on</strong>g> case of seas<strong>on</strong>al forecasts requires more care. <str<strong>on</strong>g>The</str<strong>on</strong>g>se<br />
issues are explored in both DEMETER forecasts and the ECMWF operati<strong>on</strong>al seas<strong>on</strong>al<br />
ensemble forecast, which are c<strong>on</strong>trasted with probability forecasts from new dynamic<br />
climatology models, simple data-based statistical models which take account of the initial<br />
c<strong>on</strong>diti<strong>on</strong> and relax towards the climatological dynamics. Suggesti<strong>on</strong>s for improving the design<br />
of future multi-model experiments are proposed, as are methods for the presentati<strong>on</strong> of<br />
operati<strong>on</strong>al results to the numerate user community.<br />
Invited Sessi<strong>on</strong>: Climate Rec<strong>on</strong>structi<strong>on</strong><br />
Significant noise<br />
Speaker: G: Bürger<br />
G: Bürger<br />
FU Berlin<br />
gerd.buerger@met.fu-berlin.de<br />
Noise is, by definiti<strong>on</strong>, insignificant. That means the following: Empirical statements,<br />
based <strong>on</strong> a set of data, are usually established by way of indirect proof, using the c<strong>on</strong>cept of a<br />
null hypothesis. <str<strong>on</strong>g>The</str<strong>on</strong>g> hypothesis is mostly of the form 'This result is based <strong>on</strong> pure chance',<br />
meaning that the data are merely the result of a random draw from some given, predefined<br />
distributi<strong>on</strong>, that is: noise. From that distributi<strong>on</strong> <strong>on</strong>e derives the likelihood of the data and, if<br />
that likelihood is sufficiently low, the truth of the opposite which is then dubbed 'significant'.<br />
This kind of test has become folklore in climate science and bel<strong>on</strong>gs to the set of standard<br />
procedures and software by which results are produced.<br />
Now the 'based <strong>on</strong> pure chance'-phrase has become quite c<strong>on</strong>troversial especially in the<br />
field of climate rec<strong>on</strong>structi<strong>on</strong>s, so that the same empirical relati<strong>on</strong>s are 'significant' for some<br />
and 'insignificant' for others. I think at least 3 independent ingredients can be identified that<br />
c<strong>on</strong>tribute to this c<strong>on</strong>troversy.<br />
- Data and methods by which results are produced are often a complicated mix of various<br />
sources and procedures (proxies, type of regressi<strong>on</strong>, scaling, filtering).<br />
- Many c<strong>on</strong>venti<strong>on</strong>al tests use/rely <strong>on</strong> stati<strong>on</strong>ary statistics.<br />
- <str<strong>on</strong>g>The</str<strong>on</strong>g> debate is heated and the respective opp<strong>on</strong>ents push the limits.<br />
Climate research seems to be mired in this uncomfortable mix, and the challenge for the<br />
classical statistician seems overwhelming. Accordingly, my talk will not offer any fulminant<br />
soluti<strong>on</strong> but instead describe the state of my own bewilderment, not least about some of the<br />
most basic c<strong>on</strong>cepts of statistics.<br />
7
Rec<strong>on</strong>structi<strong>on</strong> Fidelity in Truncated EOF and RegEM Climate Field Rec<strong>on</strong>structi<strong>on</strong> Methods<br />
Speaker: Eugene R. Wahl<br />
Eugene R. Wahl<br />
Envir<strong>on</strong>mental Studies and Geology, Alfred University, USA<br />
wahle@alfred.edu<br />
Caspar M. Ammann<br />
Nati<strong>on</strong>al Center for Atmospheric Research, USA<br />
An important new technique for examining the fidelity of climate rec<strong>on</strong>structi<strong>on</strong> methods<br />
is to test them experimentally in the c<strong>on</strong>text of three-dimensi<strong>on</strong>al climate system models<br />
(CSMs). <str<strong>on</strong>g>The</str<strong>on</strong>g> authors have utilized this technique with a l<strong>on</strong>g (AD 850-2000) run of the NCAR<br />
CSM to examine the Truncated EOF climate field rec<strong>on</strong>structi<strong>on</strong> (CFR) method used by Mann,<br />
Bradley, and Hughes (MBH 1998, 1999). Experiments have been d<strong>on</strong>e using specially<br />
re-ordered (by year) cases to test the rec<strong>on</strong>structi<strong>on</strong> method in extreme situati<strong>on</strong>s and in the<br />
calibrati<strong>on</strong> situati<strong>on</strong> actually faced by MBH. Three notable results are: 1) the MBH versi<strong>on</strong> of<br />
Truncated EOF CFR is sensitive to the range of the full climatology of N. Hemisphere<br />
temperature present in the calibrati<strong>on</strong> period; 2) this inherent sensitivity leads to a relatively<br />
small, but real, loss of low frequency amplitude in the situati<strong>on</strong> actually faced by MBH; and 3)<br />
extending the calibrati<strong>on</strong> period backwards from 1900 to 1850 reduces the amplitude loss to<br />
quite low levels, even though the size of the instrumental grid used in calibrati<strong>on</strong> would be<br />
reduced by more than a factor of four. <str<strong>on</strong>g>The</str<strong>on</strong>g> authors, al<strong>on</strong>g with M. Mann and S. Rutherford,<br />
have utilized the l<strong>on</strong>g NCAR run and the Erik run of the ECHO-G CSM to examine the<br />
Regularized Expectati<strong>on</strong> Maximizati<strong>on</strong> (RegEM) CFR method. RegEM does not exhibit low<br />
frequency amplitude loss when rec<strong>on</strong>structing N. Hemisphere temperature under a variety of<br />
simulated noise, calibrati<strong>on</strong> length, and proxy richness situati<strong>on</strong>s. <str<strong>on</strong>g>The</str<strong>on</strong>g> authors also have<br />
d<strong>on</strong>e initial examinati<strong>on</strong>s of whole-field fidelity in the Truncated EOF CFR for the after-effects<br />
over Europe from large tropical volcanic events (using the l<strong>on</strong>g NCAR run). <str<strong>on</strong>g>The</str<strong>on</strong>g> model<br />
patterns are themselves highly like the real-world rec<strong>on</strong>structi<strong>on</strong>s produced by Fischer et al.<br />
(<str<strong>on</strong>g>2007</str<strong>on</strong>g>), both spatially and in terms of amplitude. Rec<strong>on</strong>structed pattern fidelity is good, but<br />
amplitude loss is again seen. This whole-field result hints that there could be situati<strong>on</strong>s in<br />
which pattern fidelity of the Truncated EOF CFR may be a more robust feature than fidelity of<br />
field mean values.<br />
Evaluati<strong>on</strong> of millennial proxy rec<strong>on</strong>structi<strong>on</strong> methods<br />
Speaker: Francis Zwiers<br />
Francis Zwiers<br />
Climate Research Divisi<strong>on</strong>, Envir<strong>on</strong>ment Canada<br />
Francis.Zwiers@ec.gc.ca<br />
8
A range of existing statistical approaches for rec<strong>on</strong>structing historical temperature<br />
variati<strong>on</strong>s from proxy data are compared using both climate model data and real-world<br />
paleoclimate proxy data. We also propose a new method for rec<strong>on</strong>structi<strong>on</strong> that is based <strong>on</strong> a<br />
state-space time series model and Kalman filter algorithm. Two methods, <strong>on</strong>e using a<br />
state-space modelling approach and the other the recently developed RegEM method,<br />
generally perform better than their competitors when rec<strong>on</strong>structing interannual variati<strong>on</strong>s in<br />
Northern Hemispheric mean surface air temperature. On the other hand, a variety of methods<br />
are seen to perform well when rec<strong>on</strong>structing surface air temperature variability <strong>on</strong> decadal<br />
time scales. An advantage of the new method is that it can incorporate additi<strong>on</strong>al,<br />
n<strong>on</strong>-temperature, informati<strong>on</strong> into the rec<strong>on</strong>structi<strong>on</strong>, such as the estimated resp<strong>on</strong>se to<br />
external forcing, thereby permitting a simultaneous rec<strong>on</strong>structi<strong>on</strong> and detecti<strong>on</strong> analysis as<br />
well as projecti<strong>on</strong> into the future. An applicati<strong>on</strong> of these extensi<strong>on</strong> is also dem<strong>on</strong>strated in the<br />
paper.<br />
Invited Sessi<strong>on</strong>:<br />
<str<strong>on</strong>g>The</str<strong>on</strong>g> Quasi-Biennial Oscillati<strong>on</strong> with a Meridi<strong>on</strong>al Tripole Pattern Distributi<strong>on</strong> in the Interannual<br />
Variability and Anomaly of Asian Summer M<strong>on</strong>so<strong>on</strong> over East Asia<br />
Speaker: Huang R<strong>on</strong>ghui<br />
Huang R<strong>on</strong>ghui<br />
Intitute of Atmospheric Physics, Chinese Academy of Sciences<br />
hrh@asg.iap.ac.cn/hgiap@hotmail.com<br />
Chen Jil<strong>on</strong>g<br />
Intitute of Atmospheric Physics, Chinese Academy of Sciences<br />
Huang Gang<br />
Intitute of Atmospheric Physics, Chinese Academy of Sciences<br />
In order to reveal the regularity of the interannual variability and anomaly of Asian<br />
summer m<strong>on</strong>so<strong>on</strong> over East Asia, the observed data of summer precipitati<strong>on</strong> in <str<strong>on</strong>g>China</str<strong>on</strong>g>, the<br />
NCEP/NCAR and ERA-40 reanalysis data and the Empirical Orthog<strong>on</strong>al Founcti<strong>on</strong> (EOF) and<br />
the entropy spectral analysis methods are applied to analyze the interannual variati<strong>on</strong>s of<br />
summer m<strong>on</strong>so<strong>on</strong> (June-August) rainfall in <str<strong>on</strong>g>China</str<strong>on</strong>g> and water vapor transport fluxes over East<br />
Asia in this paper. <str<strong>on</strong>g>The</str<strong>on</strong>g> results show that there is an obvious oscillati<strong>on</strong> with a period of<br />
two~three years, i.e., the TBO, in the interannual variati<strong>on</strong>s of summer m<strong>on</strong>so<strong>on</strong> rainfall in<br />
<str<strong>on</strong>g>China</str<strong>on</strong>g>, and the spatial distributi<strong>on</strong> of this oscillati<strong>on</strong> exhibits a meridi<strong>on</strong>al tripole pattern<br />
structure over East Asia. Moreover, it is also shown that this oscillati<strong>on</strong> is closely associated<br />
9
with the quasi-biennial oscillati<strong>on</strong> in the interannual variati<strong>on</strong>s of the water vapor transport<br />
fluxes by summer m<strong>on</strong>so<strong>on</strong> flow over East Asia.<br />
Furthermore, in order to understand the physical processes including the internal and<br />
external processes that influence the variability of Asian summer m<strong>on</strong>so<strong>on</strong> over East Asia, in<br />
this paper, the interannual variati<strong>on</strong>s of sea temperature in the surface and subsurface of the<br />
tropical western Pacific are analyzed by using the sea surface temperature (SST) data of the<br />
NCEP/NCAR reanalysis dataset and the sea temperature in the subsurface of the West Pacific<br />
al<strong>on</strong>g 137°E, JMA, respectively. From the analyzed result, it is revealed that there is also a<br />
significant quasi-biennial oscillati<strong>on</strong> in the interannual variati<strong>on</strong>s of thermal state of the tropical<br />
western Pacific. And it is also shown that the quasi-biennial oscillati<strong>on</strong> in the interannual<br />
variati<strong>on</strong>s of thermal state of the tropical western Pacific has a great impact <strong>on</strong> the Asian<br />
summer m<strong>on</strong>so<strong>on</strong> and the water vapor transport driven by the m<strong>on</strong>so<strong>on</strong> flow over East Asia.<br />
Besides, the influencing mechanism of the quasi-biennial oscillati<strong>on</strong> in the interannual<br />
variati<strong>on</strong>s of thermal state of the tropical western Pacific <strong>on</strong> the interannual variati<strong>on</strong>s of Asian<br />
summer m<strong>on</strong>so<strong>on</strong> is discussed by using the telec<strong>on</strong>necti<strong>on</strong> theory in this paper. <str<strong>on</strong>g>The</str<strong>on</strong>g> TBO with<br />
a meridi<strong>on</strong>al tripole pattern distributi<strong>on</strong> in the interannual variability and anomaly of Asian<br />
summer m<strong>on</strong>so<strong>on</strong> over East Asia can be well explained from the East Asia/Pacific<br />
telec<strong>on</strong>necti<strong>on</strong> pattern of circulati<strong>on</strong> anomalies resp<strong>on</strong>ding to forcing by the heating anomaly<br />
around the Philippines proposed by Nitta (1987), and Huang and Li (1987, 1988). And the<br />
telec<strong>on</strong>necti<strong>on</strong> pattern of meridi<strong>on</strong>al wind anomalies al<strong>on</strong>g the westerly jet stream in the upper<br />
troposphere over East Asia also has an important influence <strong>on</strong> the meridi<strong>on</strong>al tripole pattern<br />
distributi<strong>on</strong>.<br />
Evidences and Modeling Study of Droughts in <str<strong>on</strong>g>China</str<strong>on</strong>g> during 4-2kaBP<br />
Speaker: Wang Shaowu<br />
Wang Shaowu<br />
Department of Atmospheric Sciences School of Physics Peking University<br />
swwang@pku.edu.cn<br />
Huang Jianbin<br />
Department of Atmospheric Sciences School of Physics Peking University<br />
Wen Xinyu<br />
Department of Atmospheric Sciences School of Physics Peking University<br />
Zhu Jinh<strong>on</strong>g<br />
Department of Atmospheric Sciences School of Physics Peking University<br />
Documentary records indicated the predominance of drought in the period of 4-2kaBP,<br />
which covered the Xia (since 2070BC), Shang (since 1600BC), and West Zhou (1041-771BC)<br />
Dynasties and so forth. Drying up of the rivers, disasters with droughts were recorded in a<br />
series of historical documentati<strong>on</strong>s, such as Chr<strong>on</strong>icles <strong>on</strong> Bamboo Clappers, Book of Odes,<br />
13<br />
Chinese Encyclopedia, and so <strong>on</strong>. Palaeo-envir<strong>on</strong>mental data; pollen, peat, TOC, C, and<br />
magnetic susceptibility provided high-resoluti<strong>on</strong> records of climatic humidity in thousands<br />
years ago. Droughts have predominated in <str<strong>on</strong>g>China</str<strong>on</strong>g> 4-2kaBP according to the<br />
10
palaeo-envir<strong>on</strong>mental data from south of Northeast, North, to the east of Northwest <str<strong>on</strong>g>China</str<strong>on</strong>g>, and<br />
over the eastern Plateau, corresp<strong>on</strong>ding to the intensificati<strong>on</strong> of summer m<strong>on</strong>so<strong>on</strong> over the<br />
East Asia. <str<strong>on</strong>g>The</str<strong>on</strong>g> latter may caused by the increase of insolati<strong>on</strong> over land area of the Northern<br />
Hemisphere, which depended <strong>on</strong> the precessi<strong>on</strong>. Droughts were simulated well by the AGCM<br />
under the orbital forcing.<br />
Climate and Infectious Disease: New Challenges and Opportunities<br />
Speaker: Mark L. Wils<strong>on</strong><br />
Mark L. Wils<strong>on</strong><br />
Department of Epidemiology, School of Public Health, University of Michigan, Ann Arbor, MI 48109,<br />
USA<br />
wils<strong>on</strong>ml@umich.edu<br />
Climate has been associated with transmissi<strong>on</strong> of many infectious disease agents, but<br />
rigorous analysis of risk patterns is not straightforward. Weather and climate variables alter<br />
transmissi<strong>on</strong> dynamics in various directi<strong>on</strong>s and through different pathways, depending <strong>on</strong> the<br />
type of microbe, its natural reservoir, and mode(s) of transmissi<strong>on</strong>. Disease expressi<strong>on</strong><br />
following infecti<strong>on</strong> also may be indirectly affected. Impacts can be linked to seas<strong>on</strong>al variati<strong>on</strong><br />
with different disease-dependent time-lags, or to extreme events. Risk has been assessed at<br />
scales ranging from microclimate to global indices, but in most cases has not been carefully<br />
investigated with more complex, multi-level statistics that c<strong>on</strong>sider influences of strain variati<strong>on</strong>,<br />
immunity, socio-ec<strong>on</strong>omic or behavioral risks, and adaptati<strong>on</strong>. Examples of research analyzing<br />
space and/or time patterns of climate and infectious diseases will be presented to illustrate<br />
various epidemiologic and ecologic results. In additi<strong>on</strong> to describing associati<strong>on</strong>s, l<strong>on</strong>ger-term<br />
efforts are aimed at developing forecasts that might serve as early warning of outbreaks.<br />
Opportunities for climatologists and epidemiologists to collaborate will be explored.<br />
Invited Sessi<strong>on</strong>: Climate Extremes<br />
Spatial characterizati<strong>on</strong> of extreme meteorological events; climate and weather effects<br />
Speaker: Dan Cooley<br />
Dan Cooley<br />
Colorado State University (USA)<br />
cooleyd@stat.colostate.edu<br />
11
Meteorological data are generally spatial and our goal is to characterize the spatial nature<br />
of extreme meteorological events. To do so, <strong>on</strong>e should characterize the spatial effects due to<br />
both climate and weather. <str<strong>on</strong>g>The</str<strong>on</strong>g> climate effects are characterized by the marginal distributi<strong>on</strong><br />
associated with a particular locati<strong>on</strong>, while the weather effects would be characterized by the<br />
dependence found in the observati<strong>on</strong>s. Unfortunately, the recorded data are a result of both<br />
climate and weather effects and it is not straightforward to separate the two, especially with<br />
extreme data.<br />
Recently there have been several characterizati<strong>on</strong>s of the climatological variati<strong>on</strong> of<br />
extremes. <str<strong>on</strong>g>The</str<strong>on</strong>g>se have been hierarchical models which have an assumpti<strong>on</strong> that the data are<br />
c<strong>on</strong>diti<strong>on</strong>ally independent given the climatological dependence. <str<strong>on</strong>g>The</str<strong>on</strong>g>re has also been separate<br />
work in how to describe the spatial dependence in extreme weather events and how to perform<br />
spatial predicti<strong>on</strong> for extremes. <str<strong>on</strong>g>The</str<strong>on</strong>g>se weather problems all assume that the climatological<br />
variati<strong>on</strong> has already been accounted for. Thus, to this point, the weather and climate<br />
problems have been dealt with completely separately.<br />
This talk will illustrate the difficulties in modeling weather and climate extremes. <str<strong>on</strong>g>The</str<strong>on</strong>g><br />
climatological dependence problem will be illustrated by a project which describes the risk of<br />
extreme precipitati<strong>on</strong> for a regi<strong>on</strong> of Colorado (USA). <str<strong>on</strong>g>The</str<strong>on</strong>g> weather dependence problem will be<br />
illustrated by a project which performs spatial predicti<strong>on</strong>. Finally, an <strong>on</strong>going project will be<br />
presented in which the c<strong>on</strong>diti<strong>on</strong>al independence assumpti<strong>on</strong> is clearly violated and how we<br />
are attempting to characterize the climatological dependence.<br />
Probabilistic Event Attributi<strong>on</strong> of the United Kingdom Autumn 2000 Floods<br />
Speaker: Pardeep Pall<br />
Pardeep Pall<br />
AOPP, Oxford University<br />
p.pall@atm.ox.ac.uk<br />
Myles Allen<br />
AOPP, Oxford University<br />
Dáithí St<strong>on</strong>e<br />
AOPP, Oxford University<br />
Tolu Aina<br />
AOPP, Oxford University<br />
Peter Stott<br />
Hadley Centre, UK Met. Office<br />
<str<strong>on</strong>g>The</str<strong>on</strong>g> United Kingdom floods of Autumn 2000 occurred during the wettest autumn in<br />
England & Wales since records began in 1766, causing widespread damage and an estimated<br />
insured loss of 1.3bn pounds.<br />
12
Whilst it has been noted that such types of event might become more likely under global<br />
warming, it is impossible to directly attribute this specific event to anthropogenic emissi<strong>on</strong>s of<br />
greenhouse gases. It is, however, possible to attribute the c<strong>on</strong>tributi<strong>on</strong> (if any) of<br />
anthropogenic greenhouse gas emissi<strong>on</strong>s to the risk of such a magnitude of event occurring at<br />
that time. We do this using a Probabilistic Event Attributi<strong>on</strong> methodology -- in a manner similar<br />
to that previously used for the European Summer 2003 heatwave, but now accounting for the<br />
more variable nature of precipitati<strong>on</strong>.<br />
We compare an Industrial Autumn 2000 climate which includes the effects of atmospheric<br />
greenhouse gases for that time, and an analogous N<strong>on</strong>-industrial climate had there been no<br />
emissi<strong>on</strong>s of these gases over the 20th century. <str<strong>on</strong>g>The</str<strong>on</strong>g>se climates c<strong>on</strong>sist of very large<br />
ensembles of weather simulati<strong>on</strong>s generated using a high spatio-temporal resoluti<strong>on</strong> global<br />
atmospheric climate model. We find that the Industrial climate is able to capture observed<br />
Autumn 2000 levels of precipitati<strong>on</strong>, and that approximately 20-30% of the risk of this<br />
precipitati<strong>on</strong> is attributable to the aforementi<strong>on</strong>ed greenhouse gases. This c<strong>on</strong>clusi<strong>on</strong> is,<br />
however, very dependent <strong>on</strong> the characteristics of sea surface temperatures input to the<br />
N<strong>on</strong>-industrial climate being compared against.<br />
Such an assessment may have implicati<strong>on</strong>s for providing insurance to properties built in<br />
floodplains and, notably, requires very large ensembles of simulati<strong>on</strong>s for such an extreme<br />
event. Given recent debates over the c<strong>on</strong>tributi<strong>on</strong> of anthropogenic climate change to the risk<br />
of extreme weather events, future development of an operati<strong>on</strong>al Probabilistic Event<br />
Attributi<strong>on</strong> system would have many advantages.<br />
Combining climate models for probabilistic of climate change: statistics and heuristics<br />
Speaker: Claudia Tebaldi<br />
Claudia Tebaldi<br />
NCAR, USA<br />
tebaldi@ucar.edu<br />
In the last few years what have been called 'ensembles of opportunity',i.e. output from<br />
similar experiments run by different climate models, arebecoming increasingly easy to come<br />
by, and increasingly rich in the amountof data they provide.<br />
In this talk I focus <strong>on</strong> ensembles of global coupled climate models.It has been shown over<br />
and over that no model is 'the best model' and projecti<strong>on</strong>s that are synthesized from the<br />
ensembles promise to be more reliable, and to offer a better representati<strong>on</strong> of the uncertainties<br />
involved in future climate change, than anything that can be gathered from single model<br />
experiments.<str<strong>on</strong>g>The</str<strong>on</strong>g>re are challenges, though, besides opportunities, in optimally combining<br />
multi-model ensembles. How to measure and account for differentperformance in representing<br />
observed climate; how to quantify interdependencies am<strong>on</strong>g models, how to deal with<br />
increasingly different models when it comes to the representati<strong>on</strong> of auxiliary processes, e.g.<br />
the carb<strong>on</strong> cycle. Not to menti<strong>on</strong> the pre-existing challenges of designing experiments able to<br />
13
alance the demands of resources between intra-model ensembles and the sampling of a<br />
representative set of scenarios.<br />
I will focus <strong>on</strong> some work by myself and co-authors that tackles the quantificati<strong>on</strong> of<br />
uncertainty in regi<strong>on</strong>al climate projecti<strong>on</strong>s. I want to exemplify through this approach not <strong>on</strong>ly<br />
issues, shortcomings and open questi<strong>on</strong>s, but also the most promising directi<strong>on</strong>s in which this<br />
kind of statistical analyses should be taken next.<br />
Parallel Sessi<strong>on</strong>s:Climate Data Homogenizati<strong>on</strong> and Climate Trend/Variability Assessment<br />
Time series analysis of daily rainfall variability and extreme events<br />
Speaker: Bohloul Alijani<br />
Bohloul Alijani<br />
Teacher Training University, Tehran, IRAN<br />
boalijani@yahoo.com<br />
<str<strong>on</strong>g>The</str<strong>on</strong>g> amount and variability of precipitati<strong>on</strong> characteristics, especially extreme events,<br />
are very important for most of the developmental purposes in dry and semi-dry climates. Iran<br />
being located in dry climates suffers from extreme events of daily rainfall every year. This<br />
research has tried to investigate the frequency and intensity of these extreme events with the<br />
help of some indices such as annual rain amount and rain days, maximum <strong>on</strong>e day<br />
precipitati<strong>on</strong>, the frequency of rain days exceeding the 75th, 90th, 95th, and 99th percentiles<br />
and the amount of rainfall due to these events during the existing data period (1961-2004) for<br />
Tehran stati<strong>on</strong>. <str<strong>on</strong>g>The</str<strong>on</strong>g> data were processed by Man Kendal randomness and trend tests and<br />
linear regressi<strong>on</strong> models.<br />
<str<strong>on</strong>g>The</str<strong>on</strong>g> results showed a positive trend in all indices am<strong>on</strong>g which <strong>on</strong>ly annual rain days trend<br />
was significant at α =0.05. Although the amount and frequency of rainfall showed increasing<br />
trend during study period, but at the same time the increasing share of the extreme events<br />
indicates some irregularity in the precipitati<strong>on</strong> pattern of the stati<strong>on</strong>. <str<strong>on</strong>g>The</str<strong>on</strong>g> final c<strong>on</strong>clusi<strong>on</strong> of the<br />
study is that the rainfall does not show any significant change but its internal irregularity has<br />
increased. This creates problem for planners and sustainable development of the area.<br />
Key words: climate change, daily rainfall, climate hazards, rainfall variability, rainfall trend.<br />
Observed changes in July-August precipitati<strong>on</strong> and temperature extremes over <str<strong>on</strong>g>China</str<strong>on</strong>g><br />
Speaker: H<strong>on</strong>gmei Li<br />
H<strong>on</strong>gmei Li<br />
14
State Key Laboratory of Numerical Modeling for Atmospheric Sciences and Geophysical Fluid<br />
Dynamics, Institute of Atmospheric Physics, Chinese Academy of Sciences<br />
lihm@mail.iap.ac.cn<br />
Ruc<strong>on</strong>g Yu<br />
State Key Laboratory of Severe Weather, Chinese Academy of Meteorological Sciences, <str<strong>on</strong>g>China</str<strong>on</strong>g><br />
Meteorological Administrati<strong>on</strong><br />
Tianjun Zhou<br />
State Key Laboratory of Numerical Modeling for Atmospheric Sciences and Geophysical Fluid<br />
Dynamics, Institute of Atmospheric Physics, Chinese Academy of Sciences<br />
Using daily stati<strong>on</strong> data over <str<strong>on</strong>g>China</str<strong>on</strong>g>, we studied the trends, inter-annual and decadal<br />
variati<strong>on</strong>s in July-August (hereinafter JA) precipitati<strong>on</strong> and temperature extremes, and probed<br />
into possible associati<strong>on</strong> between precipitati<strong>on</strong> and temperature. Our results show that except<br />
for the precipitati<strong>on</strong> intensity, which show c<strong>on</strong>sistent increase trends over most part of <str<strong>on</strong>g>China</str<strong>on</strong>g>,<br />
other extreme precipitati<strong>on</strong> indices show positive trends al<strong>on</strong>g the Yangtze River valley and<br />
negative trends over North <str<strong>on</strong>g>China</str<strong>on</strong>g> for the last 50 years, there’s no significant trend for <str<strong>on</strong>g>China</str<strong>on</strong>g> as<br />
a whole. Extreme temperature indices based <strong>on</strong> daily minimum temperature show coherent<br />
increasing trend, which is corresp<strong>on</strong>ding to the global warming. Daily maximum temperature is<br />
mostly affected by precipitati<strong>on</strong>, significant decrease trends were found al<strong>on</strong>g mid-low Yangtze<br />
River valley. For <str<strong>on</strong>g>China</str<strong>on</strong>g> as a whole, the dominant increase of daily extreme temperature<br />
occurred after 1990s. Besides l<strong>on</strong>g-term trend, JA precipitati<strong>on</strong> and temperature extremes also<br />
show significant decadal variati<strong>on</strong>s. <str<strong>on</strong>g>The</str<strong>on</strong>g> DTR (diurnal temperature range) and ETR (extreme<br />
temperature range) tend to decrease over most part of <str<strong>on</strong>g>China</str<strong>on</strong>g>, they experienced a decadal shift<br />
starting from late 1970s. <str<strong>on</strong>g>The</str<strong>on</strong>g> difference (1980-2001 mean minus 1958-1979 mean) spatial<br />
pattern of extreme temperature and precipitati<strong>on</strong> indices is c<strong>on</strong>sistent with their l<strong>on</strong>g-term<br />
trends. <str<strong>on</strong>g>The</str<strong>on</strong>g> probability of cold nights (warm nights) is lower (higher) after 1980s than before.<br />
Changes of winter extreme rainfall over Southwest Western Australia and the linkage to the<br />
Southern Annular Mode<br />
Speaker: Yun Li<br />
Yun Li<br />
CSIRO Mathematical and Informati<strong>on</strong> Sciences, Private Bag 5, Wembley, WA 6913, Australia<br />
Yun.Li@csiro.au<br />
Southwest Western Australia (SWWA) is an austral winter rainfall dominated regi<strong>on</strong>.<br />
Since late 1960s, rainfall over SWWA has experienced a substantial drying trend with a winter<br />
rainfall decrease of some 25%, putting further c<strong>on</strong>straints <strong>on</strong> water resources in an already dry<br />
area. <str<strong>on</strong>g>The</str<strong>on</strong>g> decline is manifest as a reducti<strong>on</strong> of high-intensity extreme rainfall events. <str<strong>on</strong>g>The</str<strong>on</strong>g>re<br />
15
has been vigorous debate as to what is forcing the drying trend, i.e., whether it is driven by<br />
secular forcings such as increasing atmospheric CO2 c<strong>on</strong>centrati<strong>on</strong> or whether it is part of<br />
multidecadal variability. Previous results from greenhouse warming experiments suggest that<br />
the SWWA rainfall shows a drying trend with an increasing mid-latitude mean sea level<br />
pressure (MSLP) under increasing atmospheric CO2, which is expressed as an upward trend<br />
of a dominant atmospheric circulati<strong>on</strong> mode in Southern Hemisphere called Southern Annual<br />
Mode (SAM) or the Antarctic Oscillati<strong>on</strong> (AAO).<br />
We present our recent results <strong>on</strong> statistical modeling winter extreme rainfall over SWWA<br />
and its associated changes with the SAM. <str<strong>on</strong>g>The</str<strong>on</strong>g> possibility of the rainfall reducti<strong>on</strong> being a part<br />
of multidecadal variability was discussed by using outputs of the CSIRO Mark 3 climate model<br />
in an experiment without CO2 forcing. Our results offer the qualified support for the argument<br />
that the SAM may c<strong>on</strong>tribute to the drying trend.<br />
This work was supported by the Indian Ocean Climate Initiative of the Western Australian<br />
state government, and CSIRO WfHC Flagship-Climate Program.<br />
Estimati<strong>on</strong> and Extrapolati<strong>on</strong> of Climate Normals and Climatic Trend<br />
Speaker: Robert E. Livezey<br />
Robert E. Livezey<br />
Climate Services Divisi<strong>on</strong>, Office of Climate, Water, and Weather Services, NWS/NOAA/DOC<br />
robert.e.livezey@noaa.gov<br />
WMO-recommended 30-yr normals are no l<strong>on</strong>ger generally useful for the design,<br />
planning, and decisi<strong>on</strong>-making purposes they were intended. <str<strong>on</strong>g>The</str<strong>on</strong>g>y not <strong>on</strong>ly have little<br />
relevance to the future climate, but are often unrepresentative of the current climate. <str<strong>on</strong>g>The</str<strong>on</strong>g><br />
reas<strong>on</strong> for this is rapid global climate change over the last 30 years that is likely to c<strong>on</strong>tinue<br />
into the future. It is dem<strong>on</strong>strated that simple empirical alternatives already are available that<br />
not <strong>on</strong>ly produce reas<strong>on</strong>ably accurate normals for the current climate but also often justify their<br />
extrapolati<strong>on</strong> several years into the future. This result is tied to the c<strong>on</strong>diti<strong>on</strong> that recent trends<br />
in the climate are approximately linear or have a substantial linear comp<strong>on</strong>ent. This c<strong>on</strong>diti<strong>on</strong><br />
is generally satisfied for the U. S. climate divisi<strong>on</strong> data, but will also have wide applicability<br />
globally. One alternative, Optimum Climate Normals (OCN) are multi-year averages not fixed<br />
at 30 years like WMO normals, but adapted climate record by record based <strong>on</strong><br />
easily-estimated characteristics of the records. <str<strong>on</strong>g>The</str<strong>on</strong>g> OCN works well except with very str<strong>on</strong>g<br />
trends or l<strong>on</strong>ger extrapolati<strong>on</strong>s with more moderate trends. In these cases least squares linear<br />
trend fits to the period since the mid-1970s are viable alternatives. An even better alternative is<br />
the use of hinge fit normals, based <strong>on</strong> modeling the time dependence of large-scale climate<br />
change. Here, l<strong>on</strong>ger records can be exploited to stabilize estimates of modern trends. Related<br />
issues are the need to avoid arbitrary trend fitting and to account for trends in studies of ENSO<br />
impacts. Given these results we recommend that (a) the WMO and nati<strong>on</strong>al climate services<br />
16
address new policies for changing climate normals using the results here as a starting point,<br />
and (b) NOAA initiate a program for improved estimates and forecasts of official U. S. normals,<br />
including operati<strong>on</strong>al implementati<strong>on</strong> of a simple hybrid system that combines the advantages<br />
of both the OCN and the hinge fit.<br />
Changepoint Detecti<strong>on</strong> in Multinomial Logistic Regressi<strong>on</strong> with Applicati<strong>on</strong> to Sky-Cloudiness<br />
C<strong>on</strong>diti<strong>on</strong>s in Canada<br />
Speaker: QiQi Lu<br />
QiQi Lu<br />
Mississippi State University<br />
qlu@math.msstate.edu<br />
Xiaolan Wang<br />
Climate Research Divisi<strong>on</strong>, ASTD, STB, Envir<strong>on</strong>ment Canada<br />
Detecting changepoints in a sequence of c<strong>on</strong>tinuous random variables has been<br />
extensively explored in both statistics and climatology literature. <str<strong>on</strong>g>The</str<strong>on</strong>g>re is little, however, for<br />
studying the case with multicategory resp<strong>on</strong>se variables. For instance, the sky-cloudiness<br />
c<strong>on</strong>diti<strong>on</strong> in Canada is reported in <str<strong>on</strong>g>tenth</str<strong>on</strong>g>s of the sky dome and has 11 categories (0 for clear<br />
sky, 1/10 for <strong>on</strong>e <str<strong>on</strong>g>tenth</str<strong>on</strong>g> of sky covered, and 10/10 for overcast). To model and homogenize<br />
such a multinomial variable, this paper develops an overall likelihood-ratio test statistic in an<br />
ordinal logistic regressi<strong>on</strong> model setting. A method of partiti<strong>on</strong>ing of the overall test statistics is<br />
also proposed to enable <strong>on</strong>e to test the changes in the individual categories. This technique is<br />
applied in the analysis of the real cloudiness data.<br />
A cloud-based rec<strong>on</strong>structi<strong>on</strong> of surface solar radiati<strong>on</strong> trends for Australia<br />
Speaker: Manuel Nunez<br />
Manuel Nunez<br />
School of Geography and Envir<strong>on</strong>mental Studies, University of Tasmania, Hobart 7005, Australia<br />
Yun Li<br />
CSIRO Mathematical and Informati<strong>on</strong> Sciences, Wembley, WA 6913, Australia<br />
Despite its importance to climate change, reliable and calibrated measurements of solar<br />
radiati<strong>on</strong> are available <strong>on</strong>ly after 1992 for Australia. In this study we extend the data base by<br />
developing a cloud-based solar radiati<strong>on</strong> model and extending the data set back from 1967 to<br />
2004. Results show no significant change in the majority of stati<strong>on</strong>s, although slightly more<br />
than <strong>on</strong>e quarter of the stati<strong>on</strong>s report a significant decrease of solar radiati<strong>on</strong> with a maximum<br />
of just less than <strong>on</strong>e percent per decade. Trend analyses also detect an upturn in many of the<br />
17
southern stati<strong>on</strong>s in the late eighties which appear to relate to changes in middle and high<br />
cloud cover.<br />
This work was supported by Western Australian state government projects: Indian Ocean<br />
Climate Initiative and Strategic Research Fund for the Marine Envir<strong>on</strong>ment.<br />
Patterns and trends in severe storm envir<strong>on</strong>ments using re-analysis data<br />
Speaker: Matthew Pocernich<br />
Matthew Pocernich<br />
NCAR, USA<br />
pocernic@ucar.edu<br />
Eric Gilleland<br />
NCAR, USA<br />
Harold Brooks<br />
NSSL, USA<br />
Barbara Brown<br />
NCAR, USA<br />
Severe storms cannot be resolved well by climate models because they occur at too<br />
fine of a scale and because of limitati<strong>on</strong>s in the capabilities of climate models. We therefore<br />
examine the changes in frequency of large-scale c<strong>on</strong>diti<strong>on</strong>s c<strong>on</strong>ducive to severe storms with<br />
respect to space and time.<br />
This presentati<strong>on</strong> addresses three issues. First, using previously published results, the<br />
relati<strong>on</strong>ships between moderately high levels of c<strong>on</strong>vective available potential energy (CAPE<br />
J/kg) and vertical shear (m/s) and the occurrence of observed c<strong>on</strong>vective storms are reviewed.<br />
This review supports the use of high values of the product of CAPE and shear as a proxy for<br />
severe c<strong>on</strong>vective events, but cauti<strong>on</strong>s about the ability of this informati<strong>on</strong> to discern storm<br />
types.<br />
Sec<strong>on</strong>d, to gather informati<strong>on</strong> over a greater domain of space and time, CAPE and shear<br />
are calculated from the NCEP/ NCAR reanalysis data set using the Skew-t/Hodograph<br />
Analysis and Research Program (SHARP) yielding data <strong>on</strong> an approximately 2-degree square<br />
grid, 4 times daily from 1958 through 1999. <str<strong>on</strong>g>The</str<strong>on</strong>g> CAPE, shear and their product (CAPE*shear)<br />
are summarized statistically and graphically. Statistically significant trends are identified using<br />
general linear models fit to annual and m<strong>on</strong>thly summaries of this data set. Issues associated<br />
with multiple comparis<strong>on</strong>s are addressed using a method that limits the false discovery rate.<br />
Results show that in select regi<strong>on</strong>s significant changes in the frequencies of high CAPE*shear<br />
events have occurred over the last 40 years.<br />
Third, the distributi<strong>on</strong> of the product of CAPE and shear are heavy tailed, with large values<br />
being relatively rare. <str<strong>on</strong>g>The</str<strong>on</strong>g>refore, the generalized extreme value distributi<strong>on</strong> is well suited to<br />
model the tails of high values. In our work we model these extremes using the spatial<br />
extensi<strong>on</strong> of the extRemes toolkit. Initial results are c<strong>on</strong>sistent with empirical extreme values,<br />
18
and show promise for analyzing trends in extremes of this large-scale indicator of<br />
smaller-scale severe weather activity. Both approaches to analyzing the data may be<br />
extended to allow inferences to be made regarding the frequency of c<strong>on</strong>vective storms under<br />
future climate change scenarios.<br />
Spatial Variati<strong>on</strong> of Thunderstorm Rainfalls in the Northwest of Iran<br />
Speaker: Ali Akbar Rasuly<br />
Ali Akbar Rasuly<br />
Tabriz University<br />
rasouli@tabrizu.ac.ir<br />
Thunderstorm rainfall is c<strong>on</strong>sidered as a very vital climatic factor because of its significant<br />
effects and often disastrous c<strong>on</strong>sequences up<strong>on</strong> people and the natural envir<strong>on</strong>ment in the<br />
Northwest of Iran. Thus, the purpose of this study was to analyze the spatial variati<strong>on</strong> and<br />
distributi<strong>on</strong> of thunderstorm rainfall in the regi<strong>on</strong>, between 1951 and 2005. Previous studies<br />
have found that thunderstorm rainfalls are most frequent in the spring and summer normally at<br />
the late afterno<strong>on</strong> and early nights. <str<strong>on</strong>g>The</str<strong>on</strong>g>y occur primarily over the southwest of the study area<br />
and mountains, and less frequently over the lowland interior of regi<strong>on</strong>. It was suggested that<br />
envir<strong>on</strong>mental factors, such as synoptic weather systems and the physiographic parameters<br />
may c<strong>on</strong>trol thunderstorm occurrence and its associated rainfall distributi<strong>on</strong>.<br />
Accordingly, a specific attenti<strong>on</strong> was paid to the patterns of the spatial variati<strong>on</strong> of<br />
thunderstorm rainfall during the warm m<strong>on</strong>ths over a l<strong>on</strong>g time-span (55 years), using data<br />
from 16 synoptic stati<strong>on</strong>s. Mathematically, the gamma functi<strong>on</strong>s (beta and alpha values) and<br />
Pears<strong>on</strong>'s Exp<strong>on</strong>ential Type 3 were c<strong>on</strong>sequently applied to data available for describing and<br />
summarizing of the probability distributi<strong>on</strong> of daily thunderstorm rainfalls across the regi<strong>on</strong>.<br />
Additi<strong>on</strong>ally, to distinguish the details of major thunderstorms envir<strong>on</strong>ment, a few NOAA and<br />
TRMM satellites images, a number of synoptic charts and rainfall amounts observed during<br />
certain large events have been compared.<br />
A Comparis<strong>on</strong> of Various Changepoint Detecti<strong>on</strong> Techniques for Climate Data<br />
Speaker: Jaxk Reeves<br />
Jaxk Reeves<br />
University of Georgia<br />
jaxk@stat.uga.edu<br />
19
A serious problem for climate data researchers is the detecti<strong>on</strong> of changepoints in<br />
climate series. Detecti<strong>on</strong> of such changepoints (typically caused by man-made interventi<strong>on</strong>s<br />
such as relocati<strong>on</strong> of a temperature stati<strong>on</strong>, new recording instruments or techniques, etc.) is<br />
very important, since quantificati<strong>on</strong> of l<strong>on</strong>g-term trends, such as possible global warming, can<br />
not be d<strong>on</strong>e with any degree of reliability until artificial changepoints are removed from the<br />
series of interest. <str<strong>on</strong>g>The</str<strong>on</strong>g> field of climate research is replete with numerous ad-hoc methods for<br />
detecting changepoints, with relatively little statistical justificati<strong>on</strong> for most. This presentati<strong>on</strong><br />
attempts to categorize these methods statistically and to indicate the situati<strong>on</strong>s in which each<br />
might be appropriate or optimal. Most results presnted will pertain to analysis of classical<br />
annual temperature series, which can reas<strong>on</strong>ably be modeled with independent normally<br />
distributed error innovati<strong>on</strong>s. Some results c<strong>on</strong>cerning suggested procedures when these<br />
assumpti<strong>on</strong>s are violated, as in the case of correlated errors, will also be discussed.<br />
Some Features of Instrumental Period Rainfall and Wet Seas<strong>on</strong> Fluctuati<strong>on</strong>s over Different<br />
River Basins of India<br />
Speaker: Nityanand Singh<br />
Nityanand Singh<br />
Indian Institute of Tropical Meteorology, Pune (INDIA)<br />
nsingh@tropmet.res.in<br />
N.A.S<strong>on</strong>takke<br />
Indian Institute of Tropical Meteorology, Pune (INDIA)<br />
H.N.Singh<br />
Indian Institute of Tropical Meteorology, Pune (INDIA)<br />
A.Ranade<br />
Indian Institute of Tropical Meteorology, Pune (INDIA)<br />
In recent years a new perspective has been added to hydrological investigati<strong>on</strong>s of India<br />
with the launch of the most ambitious Master Plan 'Interbasin Water Transfer –Interlinking of<br />
Rivers of India'. <str<strong>on</strong>g>The</str<strong>on</strong>g> plan is intended to utilize the country's water resources to the fullest<br />
extent practicable by transferring water from the surplus basin to deficit areas. One of the<br />
important issues to be addressed amicably in the planning process of the program is the<br />
impact of global changes, particularly global warming, <strong>on</strong> the rainfall fluctuati<strong>on</strong> over different<br />
basins of the country. L<strong>on</strong>g period basin-scale rainfall data is expected to provide vital<br />
informati<strong>on</strong> to this plan. <str<strong>on</strong>g>The</str<strong>on</strong>g> drainage system of the whole country can be divided into 11 major<br />
and 36 minor river basins, and the west coast drainage system which is a combined drainage<br />
area of 25 small rivers. L<strong>on</strong>gest instrumental area-averaged m<strong>on</strong>thly, seas<strong>on</strong>al (winter JF,<br />
summer MAM, m<strong>on</strong>so<strong>on</strong> JJAS, post-m<strong>on</strong>so<strong>on</strong> OND, July-August, June-August,<br />
October-November and May-November) and annual rainfall series have been developed for<br />
each of the 11 major and 36 minor basins as well as the west coast drainage system using<br />
highly quality-c<strong>on</strong>trolled data from well spread network of 316 raingauges. For the period<br />
20
1901-2005 with complete data of all stati<strong>on</strong>s the area-averaged series has been prepared from<br />
simple arithmetic mean of the gauges in the particular basin, and for period prior to 1901<br />
(sometimes going back to 1813) with lesser observati<strong>on</strong>s the series is c<strong>on</strong>structed by applying<br />
established objective method. For the whole country the different rainfall series could be<br />
developed for the period 1813-2005. For the different basins the starting year of rainfall data is<br />
as (ending year is always 2005): major basins <str<strong>on</strong>g>The</str<strong>on</strong>g> Indus 1844; <str<strong>on</strong>g>The</str<strong>on</strong>g> Ganga 1829; <str<strong>on</strong>g>The</str<strong>on</strong>g><br />
Brahmaputra 1848; <str<strong>on</strong>g>The</str<strong>on</strong>g> Sabarmati 1861; <str<strong>on</strong>g>The</str<strong>on</strong>g> Mahi 1857; <str<strong>on</strong>g>The</str<strong>on</strong>g> Narmada 1844; <str<strong>on</strong>g>The</str<strong>on</strong>g> Tapi 1859;<br />
<str<strong>on</strong>g>The</str<strong>on</strong>g> Godavari 1826; <str<strong>on</strong>g>The</str<strong>on</strong>g> Krishna 1826; <str<strong>on</strong>g>The</str<strong>on</strong>g> Mahanadi 1848 and <str<strong>on</strong>g>The</str<strong>on</strong>g> Cauvery 1829; minor<br />
basins Chenab 1891; Beas 1853; Satluz 1844; Yamuna 1844; Ramaganga 1844; Gomati<br />
1844; Ghaghara 1844; Gandak 1848; Kosi 1870; Mahananda 1837; Chambal 1844; Sind 1860;<br />
Betwa 1844; Ken 1844; T<strong>on</strong>s 1844; S<strong>on</strong> 1842; Tista 1869; Brahmaputra 1848; Dhansiri 1871;<br />
Wainganga 1844; Wardha 1826; Penganga 1865; Godavari 1844; Indravati 1871; Krishna<br />
1836; Bhima 1826; Tungabhadra 1837; Luni 1856; Surma 1848; Kasai 1831; Damodar 1829;<br />
Subarnarekha 1848; Brahmani 1871; Penner 1813; Palar & P<strong>on</strong>naiyar 1853; Vagai 1846 and<br />
<str<strong>on</strong>g>The</str<strong>on</strong>g> West Coast Drainage System 1817. Important statistical characteristics of the rainfall<br />
series are reported. Annual rainfall quintiles are used as threshold to categorize yearly rainfall<br />
c<strong>on</strong>diti<strong>on</strong> for the particular basin as meteorologically very dry, moderately dry, normal,<br />
moderately wet and very wet. Distinct epochs in annual rainfall fluctuati<strong>on</strong>s over the whole<br />
country and the different basins are identified.<br />
<str<strong>on</strong>g>The</str<strong>on</strong>g> area-averaged m<strong>on</strong>thly rainfall sequence have been used to document climatology<br />
and fluctuati<strong>on</strong> of the wet seas<strong>on</strong> (starting date, ending date and durati<strong>on</strong>) over the whole<br />
country, 11 major river basins, 36 minor river basins as well as the west coast drainage system.<br />
Objective criteri<strong>on</strong> ‘c<strong>on</strong>tinuous period with rainfall greater than 50 mm every m<strong>on</strong>th’ was<br />
applied <strong>on</strong> yearly data to identify the wet seas<strong>on</strong>. Starting date is marked in the first m<strong>on</strong>th of<br />
the c<strong>on</strong>secutive m<strong>on</strong>ths, each with rainfall greater than 50 mm, by linear interpolati<strong>on</strong> up to<br />
which from the beginning of the m<strong>on</strong>th 50 mm rainfall is expected. And the ending date is<br />
marked by linear interpolati<strong>on</strong> in the last m<strong>on</strong>th of the c<strong>on</strong>secutive m<strong>on</strong>th from which up to the<br />
end of the m<strong>on</strong>th 50 mm rainfall is yet to occur. <str<strong>on</strong>g>The</str<strong>on</strong>g> mean (±1σ) of the starting date, ending<br />
date and durati<strong>on</strong> of the wet seas<strong>on</strong> for the whole country are as: 29 May (±11days), 12<br />
October (±13days) and 136 days (±18days). According to Fisher’s g-statistic test distributi<strong>on</strong> of<br />
the starting date, ending date and durati<strong>on</strong> follows the Gaussian (or normal) law.<br />
<str<strong>on</strong>g>The</str<strong>on</strong>g> mean (±1σ) of the starting date (MSD), ending date (MED) and durati<strong>on</strong> for 11 major<br />
river basins are tabulated. <str<strong>on</strong>g>The</str<strong>on</strong>g> g-statistic test suggested that parameters of the wet period for<br />
different major basins are near-normal.<br />
<str<strong>on</strong>g>The</str<strong>on</strong>g> parameters of the wet seas<strong>on</strong> for 36 minor basins and west coast drainage system<br />
have also been determined following similar procedure and their climatological and fluctuati<strong>on</strong><br />
characteristics studied. Visibly the time series of different wet seas<strong>on</strong> parameters for all the<br />
cases examined is homogeneous and random.<br />
Sequential change point analysis using Bayesian criteri<strong>on</strong><br />
Speaker: S K Srivastava<br />
S K Srivastava<br />
21
<str<strong>on</strong>g>The</str<strong>on</strong>g> Energy and Resources Institute, New Delhi<br />
sangeet@teri.res.in<br />
M K Srivastava<br />
Bose Institute, Darjeeling, India<br />
V Chaudhary<br />
Department of Science and Technology, Delhi<br />
S Anand<br />
Center for Atmospheric Sciences, IIT, Delhi<br />
Climate change is becoming a major issue all over the globe due to its wide spread<br />
impacts <strong>on</strong> various socioec<strong>on</strong>omic sectors across the regi<strong>on</strong>s. It may also render significant<br />
changes in the climate variability leading to abrupt climate regime shifts that can have<br />
c<strong>on</strong>siderable impacts at various temporal and spatial scales. <str<strong>on</strong>g>The</str<strong>on</strong>g> identificati<strong>on</strong> of such regime<br />
shifts (or “the change points” in the climatic time series) may help us translating these impacts<br />
to adaptati<strong>on</strong> and mitigati<strong>on</strong> policies. Change point detecti<strong>on</strong> models (CPDMs) are useful in<br />
detecting abrupt changes in the climatic variability. In essence, a CPDM employs a measure<br />
<strong>on</strong> stability and persistence of a statistical model of the climate and its variability. <str<strong>on</strong>g>The</str<strong>on</strong>g> problem<br />
to detect and identify a climatic regime shift can be formulated with respect to many statistical<br />
parameters such as mean and variance. <str<strong>on</strong>g>The</str<strong>on</strong>g> most prevalent models are CPDM with respect to<br />
the mean of a variable.<br />
This paper presents a comparative study of two of such methods, <strong>on</strong>e each to the<br />
changes with respect to mean (Model-1) and to variance (Model-2) respectively. Both models<br />
resolve the change point detecti<strong>on</strong> problem quite well. Model-1 is sequential change point<br />
analyzer and uses student-t test to detect the changes in the fit of the distributi<strong>on</strong> based <strong>on</strong><br />
mean of the segment. Model-2 uses Bayesian Informati<strong>on</strong> Criteri<strong>on</strong> (BIC) to identify the<br />
changes in the variances in the time series. However, it is shown that Model-2 is more robust<br />
to the presence of outliers than to changes in mean. In fact Model-2 is computati<strong>on</strong>ally more<br />
efficient as well.<br />
Homogenizati<strong>on</strong> of daily air pressure, temperature and precipitati<strong>on</strong> series for Southern Moravia<br />
in the period 1848–2006<br />
Speaker: Petr Stepanek<br />
Petr Stepanek<br />
Czech Hydrometeorological Institute, Regi<strong>on</strong>al Office Brno, Czech Republic<br />
petr.stepanek@chmi.cz<br />
Rudolf Brazdil<br />
Institute of Geography, Masaryk University, Brno, Czech Republic<br />
Ladislava Reznickova<br />
Institute of Geography, Masaryk University, Brno, Czech Republic<br />
22
Homogenizati<strong>on</strong> of daily meteorological series is a difficult task. Several kinds of<br />
problems have to be taken into c<strong>on</strong>siderati<strong>on</strong> in the course of homogenizati<strong>on</strong>: selecti<strong>on</strong> of a<br />
proper homogenizati<strong>on</strong> method with regard to the data used, creati<strong>on</strong> of reference series,<br />
completi<strong>on</strong> of missing values, annual course of adjustments and others. We present an<br />
attempt to create a homogeneous series of daily air pressure, temperature and precipitati<strong>on</strong><br />
readings in the area of Southern Moravia (Czech Republic) from 1848 to 2006. Tools for<br />
c<strong>on</strong>verting daily precipitati<strong>on</strong> series to be normally distributed were adopted. In case of air<br />
temperature and precipitati<strong>on</strong>, other characteristics such as m<strong>on</strong>thly and annual number of<br />
days above given thresholds (0°C, 5°C, 10°C, 15°C for temperature, ≥ 0.1, 1.0, 5.0, 10.0 mm<br />
for precipitati<strong>on</strong>) were investigated and mutually compared.<br />
Because of presence of a noise in the series, statistical homogeneity tests give their<br />
results with some porti<strong>on</strong> of uncertainty. Using various statistical tests al<strong>on</strong>g with various types<br />
of reference series made it possible to increase c<strong>on</strong>siderably the number of homogeneity tests<br />
results for each tested series and thus to assess homogeneity more reliably. Two basic<br />
approaches were adopted: (i) homogenizati<strong>on</strong> of m<strong>on</strong>thly series and projecti<strong>on</strong> of estimated<br />
smoothed m<strong>on</strong>thly adjustments in annual variati<strong>on</strong> of daily adjustments and (ii)<br />
homogenizati<strong>on</strong> of daily values in individual m<strong>on</strong>ths and direct estimati<strong>on</strong> of daily adjustments,<br />
again smoothed by low-pass filter. Differences in results obtained from these two approaches<br />
are further discussed.<br />
<str<strong>on</strong>g>The</str<strong>on</strong>g> series were prepared, quality checked and homogenized by means of AnClim and<br />
ProClimDB software (www.climahom.eu).<br />
Basic methodological questi<strong>on</strong>s of homogenizati<strong>on</strong> and the MASH procedure<br />
Speaker: Tamas Szentimrey<br />
Tamas Szentimrey<br />
Hungarian Meteorological Service<br />
szentimrey.t@met.hu<br />
<str<strong>on</strong>g>The</str<strong>on</strong>g> MASH (Multiple Analysis of Series for Homogenizati<strong>on</strong>) iterative procedure is a<br />
relative method and depending <strong>on</strong> the distributi<strong>on</strong> of examined climate element additive or<br />
multiplicative model can be applied. In the earlier program system the following subjects were<br />
elaborated for m<strong>on</strong>thly series: series comparis<strong>on</strong>, break point (changepoint) and outlier<br />
detecti<strong>on</strong>, correcti<strong>on</strong> of series, missing data complementing, automatic usage of meta data<br />
and a verificati<strong>on</strong> procedure to evaluate the homogenizati<strong>on</strong> results. <str<strong>on</strong>g>The</str<strong>on</strong>g> new versi<strong>on</strong> was<br />
developed further for daily data: homogenizati<strong>on</strong>, quality c<strong>on</strong>trol and missing data<br />
complementing.<br />
As we see it, the basic methodological questi<strong>on</strong>s of homogenizati<strong>on</strong> are as follows:<br />
comparis<strong>on</strong> of series, break point detecti<strong>on</strong> and correcti<strong>on</strong> of shifts. In general the relative<br />
23
homogeneity principle is used to remove the unknown climate change signal since we have no<br />
informati<strong>on</strong> about the shape of this signal. This means that the climate data series are<br />
compared mutually in order to detect the inhomogeneities and to correct the series. <str<strong>on</strong>g>The</str<strong>on</strong>g><br />
possible errors are type <strong>on</strong>e error i.e. detecti<strong>on</strong> of false inhomogeneity and type two error i.e.<br />
neglecting real inhomogeneity. <str<strong>on</strong>g>The</str<strong>on</strong>g> significance and the power of the procedures can be<br />
defined according to the probabilities of these errors.<br />
<str<strong>on</strong>g>The</str<strong>on</strong>g> methodology of comparis<strong>on</strong> of series is related to the questi<strong>on</strong>s as reference series<br />
creati<strong>on</strong>, difference series c<strong>on</strong>stituti<strong>on</strong>, multiple comparis<strong>on</strong> of series etc. This topic is very<br />
important for detecti<strong>on</strong> as well as for correcti<strong>on</strong>, because the efficient comparis<strong>on</strong> of series can<br />
increase both the significance and the power. <str<strong>on</strong>g>The</str<strong>on</strong>g> development of efficient methods can be<br />
based <strong>on</strong> the examinati<strong>on</strong> of the spatial covariance structure of climate data series.<br />
<str<strong>on</strong>g>The</str<strong>on</strong>g> next questi<strong>on</strong> is the methodology for multiple break points (changepoint) detecti<strong>on</strong>.<br />
One of the possibilities is to use penalized likelihood methods based <strong>on</strong> the Bayesien model<br />
selecti<strong>on</strong>. Different criteria, penalty terms (e.g. AIC, BIC) may be applied according to the<br />
assumed a priori probabilities. However the significance level of these methods is<br />
questi<strong>on</strong>able. Another possibility is to use hypothesis test methods for this purpose. At the<br />
MASH a hypothesis test procedure has been developed, as we want to avoid the type <strong>on</strong>e<br />
error that is the damage of data series.<br />
<str<strong>on</strong>g>The</str<strong>on</strong>g> third questi<strong>on</strong> is the methodology for correcti<strong>on</strong> of series. Almost all the methods use<br />
the maximum likelihood estimati<strong>on</strong> for the correcti<strong>on</strong> factors at the detected break points. <str<strong>on</strong>g>The</str<strong>on</strong>g><br />
MASH procedure is an excepti<strong>on</strong> because the correcti<strong>on</strong> factors are estimated <strong>on</strong> the basis of<br />
c<strong>on</strong>fidence intervals.<br />
Summarily, the philosophy of MASH is as follows: cautious break points detecti<strong>on</strong> and<br />
correcti<strong>on</strong> in order to decrease the probability of type <strong>on</strong>e error, but using optimal series<br />
comparis<strong>on</strong> for decreasing the probability of type two error that is increasing the power.<br />
References<br />
Szentimrey, T., 1999: Multiple Analysis of Series for Homogenizati<strong>on</strong> (MASH)<br />
Trend Analysis of Extreme Climatic Indices in Iran using Extreme Climate Index Software<br />
(ECIS)<br />
Speaker: Farahnaz Taghavi<br />
Farahnaz Taghavi<br />
Institute of Geophysics, University of Tehran , Tehran, IRAN<br />
ftaghavi@ut.ac.ir<br />
In recent years, extreme events (droughts, floods, heat waves) and climate –related<br />
hazards take the heaviest toll <strong>on</strong> human life and exert high damage costs in Iran. In this study,<br />
the behavior and the frequency of extreme events are investigated using extreme climate<br />
index software (ECIS).<str<strong>on</strong>g>The</str<strong>on</strong>g> ECIS is a code under MATLAB includes several subroutines, such<br />
24
as Homogen Data, Gap, Index, Statistic and Return Period for calculating extreme indices ,<br />
their trends and the return period of climatic extreme indices. <str<strong>on</strong>g>The</str<strong>on</strong>g> geostatistical methods such<br />
as weighting with inverse distances and the Kriging methods are used for interpolati<strong>on</strong>s and<br />
data producti<strong>on</strong>. In ECIS, the trends is calculated <strong>on</strong> the basis of daily series of temperature<br />
and precipitati<strong>on</strong> observati<strong>on</strong>s from 16 synoptic stati<strong>on</strong>s in Iran in the period 1951-2005.<str<strong>on</strong>g>The</str<strong>on</strong>g><br />
indices are selected from the list of climate change indices recommended by CLIVAR.Results<br />
indicate that the symmetric warming in the tails of most indices is seen over most regi<strong>on</strong>s of<br />
Iran except in the northwest regi<strong>on</strong>. Also, results show that the frequency of warm (cold)<br />
extreme indices is increased (decreased) and the precipitati<strong>on</strong> extreme indices vary<br />
depending up<strong>on</strong> geographic locati<strong>on</strong>. Finally, the observed changes in indices of climate<br />
extremes show that a large proporti<strong>on</strong> of Iran was increasingly affected by a significant change<br />
in climate extremes and the frequency of extreme events is increased.<br />
Keywords: Trend, Extreme Event, Climate Index, Frequency.<br />
Trend analysis of agrometeorological and meteorological indices of climate change in several<br />
climatic regi<strong>on</strong>s of Iran<br />
Speaker: Vahid Varshavian<br />
Vahid Varshavian<br />
University of Tehran, Iran<br />
vahid.varshavian@gmail.com<br />
Nozar Ghahreman<br />
College of Soil and Water Engineering, University of Tehran, Karaj,Iran<br />
To detect the possible occurrence of climate change it is necessary to define a set of<br />
agrometeorological indices, derived from the climatic data that are capable of indicating the<br />
c<strong>on</strong>sequences of climate change <strong>on</strong> crop producti<strong>on</strong>. In this study, maximum and minimum<br />
daily air temperatures (Tmax and Tmin), mean daily air temperature (Tmean) and total daily<br />
rainfall data in a 40 years period (1961-2004) of five synoptic stati<strong>on</strong>s, namely Tehran, Tabriz,<br />
Zahedan and Bushehr were collected. <str<strong>on</strong>g>The</str<strong>on</strong>g>se stati<strong>on</strong>s represent different climates of Iran<br />
based <strong>on</strong> Koppen climatic classificati<strong>on</strong>. <str<strong>on</strong>g>The</str<strong>on</strong>g> collected data were used to calculate extreme<br />
temperature and rainfall values including the magnitudes of the lower (1st, 5th, 10th) and<br />
upper (90th, 95th, 99th) percentile threshold values for each year and number of days below<br />
the lower threshold values and above the upper threshold values, date of first autumn frost, AF<br />
(day), date of last spring frost, SF (day) and length of frost free period LFF (day). Besides,<br />
number of frost days, rainy days, snowy days and annual rainfall amounts were derived using<br />
the m<strong>on</strong>thly data obtained from the Islamic Republic of Iran Meteorological Organizati<strong>on</strong><br />
(IRIMO). In case of Bushehr stati<strong>on</strong>, based <strong>on</strong> its climate, (Desert climate) frost dates and<br />
numbers of snowy days were not included in the analysis. All time series have been checked<br />
for normality with the Kolmogorov-Smirnov test. Time trends for all variables were analysed<br />
using parametric and n<strong>on</strong>parametric techniques (Least squares linear regressi<strong>on</strong>, Pears<strong>on</strong>,<br />
Spearman and Kendall's τ-significance test).<br />
25
Am<strong>on</strong>g the study stati<strong>on</strong>s Tabriz (temperate humid climate) showed significant negative<br />
trend in rain thresholds, number of frost days and annual rainfall amounts. Bushehr (Desert<br />
climate) showed significant positive trend in upper percentile of daily rainfall amount and<br />
number of rainy days. Zahedan (Steppe climate) showed significant negative trend in number<br />
of frost days, annual rainfall amounts and number of lowest percentile of rainfall and positive<br />
trends in length of frost free period and number of highest percentile. Tehran (As the other<br />
example of Steppe climate) also showed significant positive trends in length of frost free period,<br />
date of first autumn frost and number of highest percentile of rainfall data and negative trend in<br />
number of frost days, date of last spring frost and lower thresholds of rain. In general, most of<br />
the selected stati<strong>on</strong>s showed significant positive trend in extreme temperatures especially<br />
minimum daily air temperature thresholds which might be an indicati<strong>on</strong> of an overall warming<br />
trend. In both Steppe climatic stati<strong>on</strong>s the length of frost free period was increased.<br />
Keywords: Climate change, Extreme values; Frost dates; Frost free period; Rainfall;<br />
Temperature<br />
Penalized maximal t-test, penalized maximal F-test, and the RHtestV2 software package for<br />
climate data homogenizati<strong>on</strong><br />
Speaker: Xiaolan L. Wang<br />
Xiaolan L. Wang<br />
Climate Research Divisi<strong>on</strong>, ASTD, STB, Envir<strong>on</strong>ment Canada<br />
Xiaolan.Wang@ec.gc.ca<br />
<str<strong>on</strong>g>The</str<strong>on</strong>g> penalized maximal t-test (PMT) and the penalized maximal F-test (PMFT) have<br />
recently been developed, which greatly alleviate the problem uneven distributi<strong>on</strong> of false alarm<br />
rate and detecti<strong>on</strong> power of two comm<strong>on</strong>ly used changepoint tests. On the basis of the PMT<br />
and PMFT being embedded in a recursive testing algorithm, the software package RHtestV2<br />
has been developed (in both R and FORTRAN) for detecting, and adjusting for, multiple<br />
changepoints (mean-shifts) that could exist in a data series that may have first order<br />
autoregressive errors. <str<strong>on</strong>g>The</str<strong>on</strong>g> time series being tested may have zero-trend or a linear trend<br />
throughout the whole period of data record; its lag-1 autocorrelati<strong>on</strong> (if any) is empirically<br />
accounted for. A good homogenous time series that is well correlated with the base series may<br />
be used as a reference series. However, detecti<strong>on</strong> of changepoints is also possible with the<br />
RHtestV2 package when a good homogenous reference series is not available. This<br />
presentati<strong>on</strong> will focus <strong>on</strong> the recursive testing algorithm, the usage of the RHtestV2 functi<strong>on</strong>s,<br />
and the procedure in climate data homogenizati<strong>on</strong> with the RHtestV2 software package.<br />
26
Penalized maximal t-test for detecting undocumented mean change<br />
Speaker: Xiaolan L. Wang<br />
Xiaolan L. Wang<br />
Climate Research Divisi<strong>on</strong>, ASTD, STB, Envir<strong>on</strong>ment Canada<br />
Xiaolan.Wang@ec.gc.ca<br />
Qiuzi H. Wen and Yuehua Wu<br />
Department of Mathematics and Statistics, York University, Canada<br />
In this paper, a penalized maximal t-test (PMT) is proposed for detecting undocumented<br />
mean-shifts in climate data series. PMT takes the relative positi<strong>on</strong> of each candidate<br />
changepoint into account, to diminish the effect of unequal sample sizes <strong>on</strong> the power of<br />
detecti<strong>on</strong>. M<strong>on</strong>te Carlo simulati<strong>on</strong> studies are c<strong>on</strong>ducted to evaluate the performance of PMT,<br />
in comparis<strong>on</strong> with the most popularly used method, the standard normal homogeneity test<br />
(SNHT). An applicati<strong>on</strong> of the two methods to atmospheric pressure series recorded at a<br />
Canadian site is also presented.<br />
It is shown that the false alarm rate of PMT is very close to the specified level of<br />
significance and basically evenly distributed across all candidate changepoints, while that of<br />
SNHT can be up to 10 times higher than the specified level for points near the ends of series<br />
and much lower for the middle points. In comparis<strong>on</strong> with SNHT, c<strong>on</strong>sequently, PMT has<br />
higher power for detecting all changepoints that are not too close to the ends of series, and<br />
lower power for detecting changepoints that are near the ends of series. On average, however,<br />
PMT has significantly higher power of detecti<strong>on</strong>. <str<strong>on</strong>g>The</str<strong>on</strong>g> smaller the shift magnitude Δ relative to<br />
the noise standard deviati<strong>on</strong> σ , the greater the improvement of PMT over SNHT. <str<strong>on</strong>g>The</str<strong>on</strong>g><br />
improvement in hit rate can be as much as 14-25% for detecting small shifts (Δ < σ) regardless<br />
of time series length, and up to 5% for detecting medium shifts (Δ = σ ~ 1.5σ) in time series of<br />
length N < 100. For all detectable shift sizes, the largest improvement is always obtained when<br />
N < 100, which is of great practical importance, because most annual climate data series is of<br />
length N < 100.<br />
Penalized maximal F-test for detecting undocumented mean-shift<br />
Speaker: Xiaolan L. Wang<br />
Xiaolan L. Wang<br />
Climate Research Divisi<strong>on</strong>, ASTD, STB, Envir<strong>on</strong>ment Canada<br />
Xiaolan.Wang@ec.gc.ca<br />
In this study, a penalized maximal F-test (PMFT) is proposed for detecting undocumented<br />
mean-shifts that are not accompanied by any sudden change in the linear trend of time series.<br />
PMFT aims to even out the uneven distributi<strong>on</strong> of false alarm rate and detecti<strong>on</strong> power of the<br />
corresp<strong>on</strong>ding unpenalized maximal F-test that is based <strong>on</strong> a comm<strong>on</strong> trend two-phase<br />
27
egressi<strong>on</strong> model (TPR3). <str<strong>on</strong>g>The</str<strong>on</strong>g> performance of PMFT is compared with that of TPR3 using<br />
M<strong>on</strong>te Carlo simulati<strong>on</strong>s and a climate data series.<br />
It is shown that, due to the effect of unequal sample sizes, the false alarm rate of TPR3<br />
has a W-shape distributi<strong>on</strong>, with much higher-than-specified values for points near the ends of<br />
the series and lower values for points between either of the ends and the middle of the series.<br />
C<strong>on</strong>sequently, for a mean-shift of certain magnitude, TPR3 would detect it with a<br />
lower-than-specified level of c<strong>on</strong>fidence and hence more easily when it occurs near the ends<br />
of the series than somewhere between either of the ends and the middle of the series; it would<br />
mistakenly declare many more changepoints near the ends of a homogeneous series. <str<strong>on</strong>g>The</str<strong>on</strong>g>se<br />
undesirable features of TPR3 are diminished in PMFT by using an empirical penalty functi<strong>on</strong> to<br />
take into account the relative positi<strong>on</strong> of each point being tested. As a result, PMFT has<br />
notably higher power of detecti<strong>on</strong>; its false alarm rate and effective level of c<strong>on</strong>fidence are very<br />
close to the nominal level, basically evenly distributed across all possible candidate<br />
changepoints. <str<strong>on</strong>g>The</str<strong>on</strong>g> improvement in hit rate can be more than 10% for detecting small shifts (Δ<br />
≤ σ, where σ is the noise standard deviati<strong>on</strong>).<br />
Observed Temperature Trends in Colorado<br />
Speaker: Klaus Wolte<br />
Klaus Wolte<br />
klaus.wolter@noaa.gov<br />
Colorado ranges from around 1200m in elevati<strong>on</strong> to well over 4000m. While many of<br />
the original high-elevati<strong>on</strong> mining camps also recorded temperature and moisture as early as a<br />
century ago, c<strong>on</strong>tinuous stati<strong>on</strong> records rarely precede the 1930s, or ‘Dust Bowl’ era. This<br />
analysis documents the temperature trends of those stati<strong>on</strong>s that are deemed most reliable by<br />
the Colorado State Climatologist’ Office, stratified by new ‘Climate Divisi<strong>on</strong>’, by seas<strong>on</strong>, by<br />
varying base periods (from 30- to 100-year), by statistical significance, by elevati<strong>on</strong>, and in<br />
relati<strong>on</strong> to simultaneous precipitati<strong>on</strong> trends. While recent warming trends are large and<br />
alarming (especially in spring), l<strong>on</strong>ger-term trends are not always upwards, highlighting the<br />
need to understand the warmth of the 1930s in particular.<br />
Parallel Sessi<strong>on</strong>s:General C<strong>on</strong>tributi<strong>on</strong><br />
<str<strong>on</strong>g>The</str<strong>on</strong>g> Survey of 1 to 5 day rain fal in Tehran County based <strong>on</strong> Markof Chain model Sec<strong>on</strong>d stage<br />
Speaker: Mojgan Afshar<br />
Mojgan Afshar. Ph.D<br />
28
Iran,Tehran, Azad university, Research & science campus<br />
mojgan.afshar@yahoo.com<br />
Fardin Saberi, Master Degree<br />
Iran, Tehran, Azad University, Central Branch<br />
<str<strong>on</strong>g>The</str<strong>on</strong>g> Survey of 1 to 5 day rainfall in Tehran County based <strong>on</strong> Markof Chain model<br />
Sec<strong>on</strong>d stage Mojgan Afshar, Ph.D in Natural Geography, Iran, Tehran, Research and<br />
Science Campus Fardin Saberi, Master Degree,Iran, Tehran, Azad University, Central Branch<br />
In order to Statistically and Synoptically Analyze and predict the sequence of 1 to 5 day<br />
rainfall in Tehran County during the cold period, rainfall in Mehrabad, Doshan Tappeh, Karaj,<br />
Abali, Hamand Absard and Aminabad Stati<strong>on</strong>s during the statistical period of years 1985-2004<br />
were daily provided from the country meteorology organizati<strong>on</strong>. For determining and predicting<br />
the rainfall sequences, the Sec<strong>on</strong>d grade Markov Chain model was used. At first, the<br />
frequency of wet (days 0/1 milimeter or more rainfall) and dry days (less than 0/1 rainfall)<br />
based <strong>on</strong> their sequence were classified and the frequency of every sequence was individually<br />
studied. <str<strong>on</strong>g>The</str<strong>on</strong>g>n the possibility of occurrence of each sequence m<strong>on</strong>thly and during the six cold<br />
m<strong>on</strong>ths was calculated. <str<strong>on</strong>g>The</str<strong>on</strong>g> most frequency of wet days throughout all m<strong>on</strong>ths except<br />
November was attributed to Abali stati<strong>on</strong> and the least was related to Aminabad stati<strong>on</strong>. March<br />
and October were in order the wettest and driest m<strong>on</strong>ths in Tehran county.<br />
<str<strong>on</strong>g>The</str<strong>on</strong>g> varieties of deep rainfall in all stati<strong>on</strong>s were completely obvious. <str<strong>on</strong>g>The</str<strong>on</strong>g> most and the<br />
least dry years were in order related to Karaj (12 years) and Doshan Tappeh (9 years). <str<strong>on</strong>g>The</str<strong>on</strong>g><br />
year 1995 in Tehran county was defined as the driest year. After determining the sequences,<br />
the survey of effective pressure patterns causing county rainfall <strong>on</strong> 10th to 13th of December<br />
1995 as a four day wet period in the driest year of the survey period was synoptically analyzed.<br />
For this reas<strong>on</strong>, the maps of sea level pressure and 500 hp as well as maps of directi<strong>on</strong> and<br />
the speed of wind and special humidity in level 700 hp were used.<br />
In synoptical survey, it was recognized that the most important sources of wetness in Iran<br />
are red sea and Adan gulf which Coincidence of these wetness sources with Soudi Arabia and<br />
Persian Gulf has caused the more transiti<strong>on</strong> of wetness into Iran and Tehran.<br />
Key words: rainfall, wet and dry sequences, Markov Chain Model, drought, synoptical analysis.<br />
On the verificati<strong>on</strong> and comparis<strong>on</strong> of extreme rainfall indices from climate models<br />
Speaker: Cheng-Ta Chen<br />
Cheng-Ta Chen<br />
Nati<strong>on</strong>al Taiwan Normal University, Department of Earth Sciences<br />
chen@rain.geos.ntnu.edu.tw<br />
29
Interpreting model precipitati<strong>on</strong> output (e.g., as a grid-point estimate vs. as an areal<br />
mean) has a large impact <strong>on</strong> the evaluati<strong>on</strong> and comparis<strong>on</strong> of simulated daily extreme rainfall<br />
indices from climate models. We first argue that interpretati<strong>on</strong> as a grid-point estimate (i.e.,<br />
corresp<strong>on</strong>ding to stati<strong>on</strong> data) is incorrect. We then illustrate impacts of this interpretati<strong>on</strong> vs.<br />
the areal-mean interpretati<strong>on</strong> in the c<strong>on</strong>text of rainfall extremes. Using a high resoluti<strong>on</strong><br />
(0.25x0.25 degree) gridded CPC daily US unified precipitati<strong>on</strong> dataset as idealized perfect<br />
model gridded output, both 30-year return levels of daily precipitati<strong>on</strong> (P30) and a simple daily<br />
intensity index are substantially reduced when estimated at coarser resoluti<strong>on</strong> than when<br />
estimated at finer resoluti<strong>on</strong>. <str<strong>on</strong>g>The</str<strong>on</strong>g> reducti<strong>on</strong> of P30 averaged over the c<strong>on</strong>terminous US is<br />
about 9, 15, 28, 33, and 43% when the data were first interpolated to 0.5x0.5, 1x1, 2x2, 3x3<br />
and 4x4 degree grid boxes, respectively, before the calculati<strong>on</strong> of extremes. <str<strong>on</strong>g>The</str<strong>on</strong>g> differences<br />
resulting from the point estimate vs. areal mean interpretati<strong>on</strong> are sensitive to both the data<br />
grid size and to the particular extreme rainfall index analyzed. <str<strong>on</strong>g>The</str<strong>on</strong>g> differences are not as<br />
sensitive to the magnitude and regi<strong>on</strong>al distributi<strong>on</strong> of the indices. Almost all IPCC AR4<br />
models underestimate US mean P30 if it is validated with P30 estimated from the high<br />
resoluti<strong>on</strong> CPC daily rainfall observati<strong>on</strong>. On the other hand, if CPC daily data is interpolated to<br />
various model resoluti<strong>on</strong>s and then calculate the P30 before comparis<strong>on</strong> (more correct in our<br />
view), about half of the model show good agreement with observati<strong>on</strong>s while most of the<br />
remaining models tend to overestimate the mean intensity of heavy rainfall events. A further<br />
implicati<strong>on</strong> of interpreting model precipitati<strong>on</strong> output as an areal mean is that use of either<br />
simple multimodel ensemble averages of extreme rainfall or inter-model variability measures<br />
of extreme rainfall to assess the comm<strong>on</strong> characteristics and range of uncertainties in current<br />
Atmosphere/Ocean General Circulati<strong>on</strong> Models (AOGCMs) is not appropriate if simulated<br />
extreme rainfall is analyzed at model’s native resoluti<strong>on</strong>. Owing to the large sensitivity to the<br />
assumpti<strong>on</strong> used, we recommend that for analysis of precipitati<strong>on</strong> extremes, investigators<br />
interpret model precipitati<strong>on</strong> output as an area average as opposed to a point estimate, and<br />
then ensure that various analysis steps remain c<strong>on</strong>sistent with that interpretati<strong>on</strong>.<br />
Unsupervised machine learning techniques for studying climate variability<br />
Speaker: Alexander Ilin<br />
Alexander Ilin<br />
Helsinki University of Technology<br />
alexilin@cis.hut.fi<br />
Harri Valpola<br />
Helsinki University of Technology<br />
Erkki Oja<br />
Helsinki University of Technology<br />
30
We present applicati<strong>on</strong>s of several techniques intensively studied recently in the<br />
machine learning community to exploratory analysis of global climate data. <str<strong>on</strong>g>The</str<strong>on</strong>g> c<strong>on</strong>sidered<br />
techniques are related to rotating principal comp<strong>on</strong>ents using various statistical criteria. <str<strong>on</strong>g>The</str<strong>on</strong>g><br />
proposed algorithms use modeling assumpti<strong>on</strong>s plausible for the global climate system and<br />
they are closely related to the method called independent comp<strong>on</strong>ent analysis (ICA). <str<strong>on</strong>g>The</str<strong>on</strong>g><br />
proposed exploratory algorithms follow a comm<strong>on</strong> framework, which allows for finding<br />
underlying signals with properties of interest. <str<strong>on</strong>g>The</str<strong>on</strong>g> algorithms are iterative, alternating between<br />
estimating the important structure of extracted signals and using this structure to find new<br />
signal estimates.<br />
<str<strong>on</strong>g>The</str<strong>on</strong>g> proposed algorithms are applied to analysis of the daily global data from the<br />
NCEP/NCAR reanalysis project. <str<strong>on</strong>g>The</str<strong>on</strong>g> first example presents how using <strong>on</strong>ly the assumpti<strong>on</strong> of<br />
prominent interannual variability allows for finding the comp<strong>on</strong>ent capturing El Nino-Southern<br />
Oscillati<strong>on</strong> (ENSO): <str<strong>on</strong>g>The</str<strong>on</strong>g> time course of the most prominent comp<strong>on</strong>ent is a good ENSO index<br />
and the corresp<strong>on</strong>ding spatial patterns have many features traditi<strong>on</strong>ally associated with ENSO.<br />
Interestingly, the sec<strong>on</strong>d comp<strong>on</strong>ent extracted from the dataset combining the three variables<br />
somewhat resembles the derivative of the ENSO index. It is also possible to capture how the<br />
effect of ENSO changes depending <strong>on</strong> the time of the year using a slightly modified technique.<br />
Several other algorithms with applicati<strong>on</strong>s to the same climate dataset are presented. One<br />
technique finds a meaningful representati<strong>on</strong> of the slow climate variability as combinati<strong>on</strong> of<br />
trends, interannual quasi-oscillati<strong>on</strong>s (including ENSO), the annual cycle and slow changes in<br />
seas<strong>on</strong>al variati<strong>on</strong>s. This can be achieved by a similar technique which emphasizes slow<br />
behavior of time signals prominent <strong>on</strong> distinct timescales. Another approach is to analyze fast<br />
weather variati<strong>on</strong>s and find comp<strong>on</strong>ents in which such variability has significant behavior in a<br />
slow timescale. For example, it is possible to find fast varying comp<strong>on</strong>ents whose intensity of<br />
variati<strong>on</strong>s has been slowly increasing over the last decades.<br />
<str<strong>on</strong>g>The</str<strong>on</strong>g>re are lots of possible directi<strong>on</strong>s in which this research can be extended. For example,<br />
<strong>on</strong>e can study slow climate changes, n<strong>on</strong>linear effects such as interacti<strong>on</strong>s between<br />
phenomena (similar to ENSO-annual cycle interacti<strong>on</strong>s), spatially evolving phenomena,<br />
climatic effects <strong>on</strong> ecology, ec<strong>on</strong>omy etc. It might also be possible to learn the dynamics of<br />
some climate phenomena for making predicti<strong>on</strong> of their evoluti<strong>on</strong>. We developed a relevant<br />
algorithm which allows for finding groups of comp<strong>on</strong>ents with shared dynamics and predictable<br />
time course.<br />
<str<strong>on</strong>g>The</str<strong>on</strong>g> same algorithmic framework could be used for implementing new tools for<br />
discovering significant regularities in the climate. <str<strong>on</strong>g>The</str<strong>on</strong>g> new directi<strong>on</strong>s can be motivated by the<br />
type of features which might emerge during exploratory data analysis or can be based <strong>on</strong><br />
expert knowledge.<br />
31
Multi-resoluti<strong>on</strong> analysis <strong>on</strong> the relati<strong>on</strong>ship between summer rainfall over North <str<strong>on</strong>g>China</str<strong>on</strong>g> and<br />
Australian winter rainfall<br />
Speaker: Yun Li<br />
Yun Li<br />
CSIRO Mathematical and Informati<strong>on</strong> Sciences, Private Bag 5, Wembley, WA 6913, Australia<br />
Yun.Li@csiro.au<br />
Jianping Li<br />
State Key Laboratory of Atmospheric Sciences and Geophysical Fluid Dynamics, Institute of<br />
Atmospheric Physics, Chinese Academy of Sciences, PO Box 9804, <str<strong>on</strong>g>Beijing</str<strong>on</strong>g> 100029, <str<strong>on</strong>g>China</str<strong>on</strong>g><br />
Sim<strong>on</strong> Barry<br />
CSIRO Mathematical and Informati<strong>on</strong> Sciences, PO Box 664, Canberra, ACT 2601, Australia<br />
Summer rainfall over north <str<strong>on</strong>g>China</str<strong>on</strong>g> results from the advance of the East-Asian summer<br />
m<strong>on</strong>so<strong>on</strong> which is closely linked with the Australian winter m<strong>on</strong>so<strong>on</strong>. Recent research has<br />
indicated that the interacti<strong>on</strong> between these two m<strong>on</strong>so<strong>on</strong> systems can affect both the<br />
East-Asian summer rainfall and Australian winter rainfall. <str<strong>on</strong>g>The</str<strong>on</strong>g>re is also evidence showing that<br />
the observed boreal summer rainfall variability over north <str<strong>on</strong>g>China</str<strong>on</strong>g> is similar to the austral winter<br />
rainfall variability (in particular drying trends) over southwest Western Australia (SWWA). This<br />
has attracted significant interest and attenti<strong>on</strong> to study the relati<strong>on</strong>ship between summer<br />
rainfall over North <str<strong>on</strong>g>China</str<strong>on</strong>g> and Australian winter rainfall, particularly in terms of possible causes<br />
and policy opti<strong>on</strong>s in resp<strong>on</strong>se to the rainfall decrease.<br />
We present results <strong>on</strong> multi-resoluti<strong>on</strong> analysis <strong>on</strong> the relati<strong>on</strong>ship between summer<br />
rainfall over North <str<strong>on</strong>g>China</str<strong>on</strong>g> and Australian winter rainfall. Our results suggest that there is<br />
significant positive correlati<strong>on</strong> at level 0.05 in the low frequency base-line drift of rainfall<br />
variability between summer rainfall over North <str<strong>on</strong>g>China</str<strong>on</strong>g> and SWWA winter rainfall. <str<strong>on</strong>g>The</str<strong>on</strong>g> positive<br />
correlati<strong>on</strong>s are also found at various larger scales (lower frequencies), but not in the small<br />
scale (high frequency) noise in the rainfall variability.<br />
This work is supported by an Australian government bilateral climate change partnership<br />
project (with the People’s Republic of <str<strong>on</strong>g>China</str<strong>on</strong>g>) called “Research <strong>on</strong> Rainfall and Climate Change<br />
in both <str<strong>on</strong>g>China</str<strong>on</strong>g> and Australia”.<br />
<str<strong>on</strong>g>The</str<strong>on</strong>g> dominant dynamical mode under an increase in CO2 c<strong>on</strong>centrati<strong>on</strong><br />
Speaker: Jin-S<strong>on</strong>g v<strong>on</strong> Storch<br />
Jin-S<strong>on</strong>g v<strong>on</strong> Storch<br />
Max-Planck Institute for Meteorology<br />
jin-s<strong>on</strong>g.v<strong>on</strong>.storch@zmaw.de<br />
32
A 50-member ensemble is produced with the ECHAM5/MPI-OM model to study<br />
dynamical modes under an increase in CO2 c<strong>on</strong>centrati<strong>on</strong>. <str<strong>on</strong>g>The</str<strong>on</strong>g> mode with the largest spatial<br />
scale is found over and in the Southern Ocean. It is essentially z<strong>on</strong>ally symmetric. An increase<br />
in CO2 c<strong>on</strong>centrati<strong>on</strong> produces a temperature increase in the Southern subtropics and<br />
c<strong>on</strong>sequently a strengthening of the meridi<strong>on</strong>al temperature gradient. <str<strong>on</strong>g>The</str<strong>on</strong>g> latter leads to<br />
changes in the midlatitude westerlies and the surface z<strong>on</strong>al wind stress. <str<strong>on</strong>g>The</str<strong>on</strong>g> wind stress<br />
changes strengthen the northward Ekman transports that transport the cold polar water into<br />
the midlatitude Southern Ocean, whereby further maintaining the meridi<strong>on</strong>al temperature<br />
gradient. <str<strong>on</strong>g>The</str<strong>on</strong>g> relati<strong>on</strong> of this mode to the Antarctic Oscillati<strong>on</strong>, the dominant Southern<br />
Hemispheric mode under the c<strong>on</strong>trol c<strong>on</strong>diti<strong>on</strong> (i.e. pre-industrial CO2 c<strong>on</strong>centrati<strong>on</strong>), is<br />
studied in the phase space spanned by the leading EOFs.<br />
Verificati<strong>on</strong> of Biomass Burning Aerosols by Using GOES-12<br />
Speaker: Jian Zeng<br />
Jian Zeng<br />
Earth Resources Technology Inc.<br />
Jian.Zeng@noaa.gov<br />
Biomass burning impacts the climate system <strong>on</strong> local, regi<strong>on</strong>al and global radiati<strong>on</strong><br />
budget. High aerosol c<strong>on</strong>centrati<strong>on</strong>s caused by biomass burning outbreaks are able to<br />
provoke damaging impact <strong>on</strong> human life. An algorithm has been developed to automatically<br />
detect aerosols and track l<strong>on</strong>g-range transport of smoke plumes associated with biomass<br />
burning. Two major schemes are applied in the algorithm, the source scheme and the pattern<br />
recogniti<strong>on</strong> scheme. This algorithm combines GOES observati<strong>on</strong>s of fire hot spots with<br />
aerosol optical depth maps in the source scheme to find the smoke aerosols most possibly<br />
caused by the fire sources. Sec<strong>on</strong>dly apply the pattern recogniti<strong>on</strong> technique to identify smoke<br />
plumes that drifted away from the source regi<strong>on</strong>. Once the optical depths due to smoke<br />
aerosols are separated from other types of aerosols, they are c<strong>on</strong>verted to smoke<br />
c<strong>on</strong>centrati<strong>on</strong>s using mass extincti<strong>on</strong> coefficient of 7.8 m2/g and assuming that aerosols are<br />
c<strong>on</strong>fined to the lowest 5 km of the atmosphere. <str<strong>on</strong>g>The</str<strong>on</strong>g> algorithm was applied to the biomass<br />
burning episodes during September 1-15, 2006 and evaluated using Oz<strong>on</strong>e M<strong>on</strong>itoring<br />
Instrument (OMI) absorpti<strong>on</strong> aerosol optical depth product and HYSPLIT model analysis. We<br />
will present algorithm descripti<strong>on</strong>, evaluati<strong>on</strong>, and its potential impact <strong>on</strong> climate.<br />
33
Parallel Sessi<strong>on</strong>s:Downscaling<br />
Evaluati<strong>on</strong> of a regi<strong>on</strong>al climate model regarding statistical characteristics of daily precipitati<strong>on</strong><br />
and sensitivity to physical parameterizati<strong>on</strong>s<br />
Speaker: Susanne Bachner<br />
Susanne Bachner<br />
Meteorological Institute, B<strong>on</strong>n<br />
s.bachner@uni-b<strong>on</strong>n.de<br />
Alice Kapala<br />
Meteorological Institute, B<strong>on</strong>n<br />
Clemens Simmer<br />
Meteorological Institute, B<strong>on</strong>n<br />
<str<strong>on</strong>g>The</str<strong>on</strong>g> use of Regi<strong>on</strong>al Climate Models (RCM) for scenario simulati<strong>on</strong>s of the future climate<br />
has become possible in the last years. For a careful interpretati<strong>on</strong> of the scenario simulati<strong>on</strong><br />
results, the models should be evaluated with respect to their ability to reproduce statistical<br />
characteristics of daily precipitati<strong>on</strong>. This is d<strong>on</strong>e here for the regi<strong>on</strong>al climate model CLM,<br />
developed by the German Weather Service and several institutes in Germany. Especially<br />
since the questi<strong>on</strong> of increasing extremes in a changing climate becomes more important,<br />
characteristics other than mean values have to be evaluated in more detail. In this study, we<br />
focus <strong>on</strong> summer precipitati<strong>on</strong> in Germany.<br />
Eleven different summer seas<strong>on</strong>s have been modelled, forced by ERA40 reanalysis, and<br />
have been analyzed regarding different statistical precipitati<strong>on</strong> characteristics like e.g. the<br />
frequency distributi<strong>on</strong> and characteristics of heavy precipitati<strong>on</strong>. A comparis<strong>on</strong> is made to<br />
stati<strong>on</strong> data of the German Weather Service at a daily and seas<strong>on</strong>al time scale.<br />
Furthermore, the uncertainty related to the physical parameterizati<strong>on</strong>s in the CLM is<br />
addressed with an ensemble of simulati<strong>on</strong>s using different opti<strong>on</strong>s in the physical package.<br />
<str<strong>on</strong>g>The</str<strong>on</strong>g> evaluati<strong>on</strong> strategy and the main results will be presented. Characteristics which are<br />
averaged over larger areas and several summers are captured quite well, but the interannual<br />
variability and spatial structure show quite some differences. <str<strong>on</strong>g>The</str<strong>on</strong>g> model uncertainty due to<br />
physics is not negligible, where the largest sensitivity is found by the changes in the c<strong>on</strong>vecti<strong>on</strong><br />
scheme.<br />
Addressing climate model uncertainty in stochastic downscaling applicati<strong>on</strong>s<br />
Speaker: Richard E. Chandler<br />
Richard E. Chandler<br />
University College L<strong>on</strong>d<strong>on</strong><br />
34
ichard@stats.ucl.ac.uk<br />
Nadja Leith<br />
University College L<strong>on</strong>d<strong>on</strong><br />
Downscaling techniques are widely used to c<strong>on</strong>vert the outputs from gridded numerical<br />
climate models to the temporal and spatial scales required for hydrological applicati<strong>on</strong>s.<br />
Increasingly, however, it is being recognized that projecti<strong>on</strong>s of future climate can differ widely<br />
between climate models. It is therefore necessary to account for climate model uncertainty in<br />
any downscaling exercise. Here we suggest that a hierarchical statistical model, implemented<br />
in a Bayesian framework, provides a logically coherent and interpretable way to think about<br />
climate model uncertainty in general, which can be applied to downscaling studies in particular.<br />
<str<strong>on</strong>g>The</str<strong>on</strong>g> ideas are illustrated by c<strong>on</strong>sidering the generati<strong>on</strong> of future daily rainfall sequences at a<br />
single locati<strong>on</strong> in the UK, based <strong>on</strong> the outputs of four different climate models under the<br />
SRES A2 emissi<strong>on</strong>s scenario. <str<strong>on</strong>g>The</str<strong>on</strong>g> technique could in principle be used in c<strong>on</strong>juncti<strong>on</strong> with any<br />
appropriate stochastic downscaling method; in our applicati<strong>on</strong>, the downscaling is based <strong>on</strong><br />
Generalised Linear Models for daily rainfall.<br />
On the variati<strong>on</strong> of temperature and precipitati<strong>on</strong> in the 20th century and its scenarios under<br />
various CO2 c<strong>on</strong>centrati<strong>on</strong> in <str<strong>on</strong>g>China</str<strong>on</strong>g><br />
Speaker: Youmin Chen<br />
Youmin Chen<br />
Max-Planck Institute for Biogeochemistry<br />
ychen@bgc-jena.mpg.de<br />
Impacted by m<strong>on</strong>so<strong>on</strong> climate envir<strong>on</strong>ment, the variati<strong>on</strong> of temperature and<br />
precipitati<strong>on</strong> has its excepti<strong>on</strong>al characteristics. We applied CRU dataset (1901-2000) and<br />
ECHAM5 model output (2001-2100) to analyze the variati<strong>on</strong> of temperature and precipitati<strong>on</strong><br />
in <str<strong>on</strong>g>China</str<strong>on</strong>g>. <str<strong>on</strong>g>The</str<strong>on</strong>g> first 100-years are c<strong>on</strong>sidered as the observed variati<strong>on</strong> and the sec<strong>on</strong>d<br />
100-years are the projected scenarios. All the datasets are in the grid with 0.5/0.5 lat/l<strong>on</strong> and<br />
the area weighted averages are calculated with the regi<strong>on</strong> as a whole. It is found that the<br />
temperature increased by 0.7 degC in the 20th century, and the latest trend reach up to 6<br />
degC/100-years (1982-2002); the scenario shows that the temperature increase by a variety of<br />
from 3.7 to 5.6 degC in the 21st century. <str<strong>on</strong>g>The</str<strong>on</strong>g>re is no significant trend for precipitati<strong>on</strong> both in<br />
the 20th century and in the future scenarios. <str<strong>on</strong>g>The</str<strong>on</strong>g> temperature and precipitati<strong>on</strong> mainly show<br />
negative correlati<strong>on</strong> before 1965, after which there is a significant positive relati<strong>on</strong>ship, which<br />
may means that with the climate warming in <str<strong>on</strong>g>China</str<strong>on</strong>g>, the precipitati<strong>on</strong> could increase. Based <strong>on</strong><br />
CRU dataset, the whole area shows increasing temperature except for Sichuan basin, where<br />
the temperature is decreasing. However, temperature trends manifest a great variety at<br />
35
different time periods. <str<strong>on</strong>g>The</str<strong>on</strong>g>re are negative temperature trends from 1945 to 1970; all other time<br />
periods show positive trends. In additi<strong>on</strong>, several abrupt changes in temperature were<br />
detected respectively in the year 1937, 1913, 1986 and 1949.<br />
An Automated Synoptic Weather Typing and Its Applicati<strong>on</strong>s to Climate Change Impact<br />
Analyses<br />
Speaker: Chad Shouquan Cheng<br />
Chad Shouquan Cheng<br />
Meteorological Service of Canada Branch, Envir<strong>on</strong>ment Canada<br />
cheng@ec.gc.ca<br />
<str<strong>on</strong>g>The</str<strong>on</strong>g> synoptic weather typing approach has become popular in evaluating the impact of<br />
climate <strong>on</strong> a variety of envir<strong>on</strong>mental problems. One of the reas<strong>on</strong>s is its ability to categorize a<br />
complex set of meteorological variables as a coherent index and to facilitate to link with<br />
high-impact weather analyses. In a series of studies, an automated synoptic weather typing<br />
was developed using principal comp<strong>on</strong>ents analysis, average linkage clustering procedure,<br />
and discriminant functi<strong>on</strong> analysis to classify daily weather types. Meteorological data used in<br />
the weather typing usually include hourly/six-hourly surface observati<strong>on</strong>s of air temperature,<br />
dew point temperature, sea-level air pressure, total cloud cover, and west-east and<br />
south-north wind velocities. <str<strong>on</strong>g>The</str<strong>on</strong>g> weather typing approach was validated using an independent<br />
dataset (1/4–1/3 of the total years) that was randomly selected.<br />
This talk will focus <strong>on</strong> development and validati<strong>on</strong> of the synoptic weather typing and its<br />
applicati<strong>on</strong>s to a variety of high-impact weather analyses, such as freezing rain, heavy rainfall,<br />
high air pollutant levels, and extreme temperature/air polluti<strong>on</strong>-related premature mortality. In<br />
additi<strong>on</strong>, this talk will summarize how the weather typing was applied, using downscaled GCM<br />
climate change scenarios, to project changes in frequency and magnitude of future<br />
high-impact weather events.<br />
Answering questi<strong>on</strong>s about empirical downscaling methodologies<br />
Speaker: Bruce Hewits<strong>on</strong><br />
Bruce Hewits<strong>on</strong><br />
University of Cape Town<br />
hewits<strong>on</strong>@csag.uct.ac.za<br />
R Wilby<br />
UK Envir<strong>on</strong>ment Agency<br />
36
Answering questi<strong>on</strong>s about empirical downscaling methodologies<br />
<str<strong>on</strong>g>The</str<strong>on</strong>g> increasing demand for regi<strong>on</strong>al scale climate change projecti<strong>on</strong>s, and the increasing<br />
availability of empirical downscaling products, raise important questi<strong>on</strong>s about the role and<br />
influence of methodology choice <strong>on</strong> the derived projecti<strong>on</strong>s. <str<strong>on</strong>g>The</str<strong>on</strong>g>re are a wide range of applied<br />
downscaling methods in the literature, and which seek to accommodate the comp<strong>on</strong>ents of<br />
deterministic and stochastic variance in the local climate resp<strong>on</strong>se to large scale forcing. In<br />
general the methods fall into <strong>on</strong>e of two approaches; using some form of scale transfer<br />
functi<strong>on</strong> to capture the deterministic comp<strong>on</strong>ent and then adding the stochastic element, or<br />
alternatively using a technique such as a weather generator c<strong>on</strong>diti<strong>on</strong>ed in some form to<br />
accommodate the deterministic large scale forcing.<br />
We compare two such methodologies which have matured and been used to provide<br />
regi<strong>on</strong>al scenarios for a broad range of end user applicati<strong>on</strong>s. <str<strong>on</strong>g>The</str<strong>on</strong>g> two approaches are used to<br />
project climate change for four locati<strong>on</strong>s that present a challenge due to locati<strong>on</strong> and complex<br />
local features. <str<strong>on</strong>g>The</str<strong>on</strong>g> four locati<strong>on</strong>s span Africa and include tropical and higher latitudes, coastal<br />
and inland regi<strong>on</strong>s, and complex topography.<br />
Does n<strong>on</strong>linearity bring an improvement in statistical downscaling of daily temperature?<br />
Speaker: Radan Huth<br />
Radan Huth<br />
Institute of Atmospheric Physics, Prague, Czech Republic<br />
huth@ufa.cas.cz<br />
Stanislava Kliegrova<br />
Czech Hydrometeorological Institute, regi<strong>on</strong>al office, Hradec Kralove, Czech Republic<br />
Ladislav Metelka<br />
Czech Hydrometeorological Institute, regi<strong>on</strong>al office, Hradec Kralove, Czech Republic<br />
<str<strong>on</strong>g>The</str<strong>on</strong>g> aim of the c<strong>on</strong>tributi<strong>on</strong> is to evaluate the potential gain in the performance of<br />
statistical downscaling due to introducti<strong>on</strong> of n<strong>on</strong>linearity into the transfer functi<strong>on</strong>s. This issue<br />
has not been resolved so far. <str<strong>on</strong>g>The</str<strong>on</strong>g> n<strong>on</strong>linearity is introduced in two different ways: (i) by using<br />
artificial neural networks (ANNs), namely the multilayer perceptr<strong>on</strong> architecture, and (ii) by<br />
stratificati<strong>on</strong> of the dataset by a classificati<strong>on</strong> of circulati<strong>on</strong> patterns, the linear method being<br />
built in each class separately. <str<strong>on</strong>g>The</str<strong>on</strong>g> study c<strong>on</strong>cerns daily maximum and minimum temperatures<br />
in winter at eight European stati<strong>on</strong>s differing in their geographical and climatological settings,<br />
spread from Ireland to Russia and from northern Finland to Spain. <str<strong>on</strong>g>The</str<strong>on</strong>g> predictors are the 500<br />
hPa heights and 850 hPa temperature defined in a network covering whole Europe and a large<br />
part of the neighbouring Atlantic Ocean. <str<strong>on</strong>g>The</str<strong>on</strong>g> performance of the methods is quantified in terms<br />
of correlati<strong>on</strong>s between the downscaled and observed values. Other measures of<br />
corresp<strong>on</strong>dence, such as mean absolute error or root mean square error, lead to identical<br />
37
esults. We dem<strong>on</strong>strate that the n<strong>on</strong>linear methods bring an improvement, although rather<br />
marginal, to the sub-optimal linear methods, such as the linear regressi<strong>on</strong> of predictor’s<br />
principal comp<strong>on</strong>ents. <str<strong>on</strong>g>The</str<strong>on</strong>g> best linear method, multiple linear regressi<strong>on</strong> of gridpoint values, is<br />
however not surpassed by any n<strong>on</strong>linear method. <str<strong>on</strong>g>The</str<strong>on</strong>g> performance of the best n<strong>on</strong>linear<br />
method, ANN with gridpoint values as predictors, is fairly close to the linear method, but in<br />
general is slightly worse. <str<strong>on</strong>g>The</str<strong>on</strong>g> classificati<strong>on</strong> does not improve the fit between the downscaled<br />
and observed values either. In additi<strong>on</strong> to the corresp<strong>on</strong>dence measures, we evaluate the<br />
downscaled temperature in terms of temporal and spatial autocorrelati<strong>on</strong>s and statistical<br />
distributi<strong>on</strong>s. ANNs are the <strong>on</strong>ly method capable of reproducing at least some deviati<strong>on</strong>s of the<br />
statistical distributi<strong>on</strong>s from normality. Spatial autocorrelati<strong>on</strong>s are best reproduced by the<br />
classificati<strong>on</strong>-based methods, whereas the temporal autocorrelati<strong>on</strong>s are best captured by the<br />
linear methods. Taken together, the linear regressi<strong>on</strong> of gridpoint values appears to be the<br />
method whose performance is closest to the optimum.<br />
Detecti<strong>on</strong> and simulati<strong>on</strong> of extreme rainfall in a topographically complex regi<strong>on</strong><br />
Speaker: Chris Lennard<br />
Chris Lennard<br />
University of Cape Town<br />
lennard@egs.uct.ac.za<br />
Annually, extreme rainfall causes milli<strong>on</strong>s of dollars worth of damage and regularly<br />
displaces thousands of people in Cape Town, South Africa. Forecast skill for extreme<br />
precipitati<strong>on</strong> in the regi<strong>on</strong> is generally poor thus an accurate, qualitative forecast is necessary.<br />
An empirical technique is presented for the identificati<strong>on</strong> of weather systems associated with<br />
extreme rainfall as are results from high resoluti<strong>on</strong> simulati<strong>on</strong>s of these storms.<br />
Regressi<strong>on</strong> Procedures and <str<strong>on</strong>g>The</str<strong>on</strong>g>ir Applicati<strong>on</strong>s to Climate Change Impact Analyses<br />
Speaker: Qian Li<br />
Qian Li<br />
Meteorological Service of Canada Branch, Envir<strong>on</strong>ment Canada<br />
qian.li@ec.gc.ca<br />
Chad Shouquan Cheng<br />
Meteorological Service of Canada Branch, Envir<strong>on</strong>ment Canada<br />
Guil<strong>on</strong>g Li<br />
Meteorological Service of Canada Branch, Envir<strong>on</strong>ment Canada<br />
38
In a series of climate change impact studies, many regressi<strong>on</strong> procedures were applied<br />
to c<strong>on</strong>struct the simulati<strong>on</strong> models for various high-impact weather analyses, including daily<br />
rainfall occurrence and amount, freezing rain occurrence, streamflow volume, air polluti<strong>on</strong><br />
c<strong>on</strong>centrati<strong>on</strong>, and extreme temperature/air polluti<strong>on</strong>-related premature mortality. <str<strong>on</strong>g>The</str<strong>on</strong>g><br />
regressi<strong>on</strong> procedures include binomial and multinomial logistic regressi<strong>on</strong>, orthog<strong>on</strong>al<br />
regressi<strong>on</strong>, robust regressi<strong>on</strong>, autocorrelati<strong>on</strong> correcti<strong>on</strong> regressi<strong>on</strong>, stepwise regressi<strong>on</strong>, and<br />
n<strong>on</strong>linear regressi<strong>on</strong>. In additi<strong>on</strong>, these regressi<strong>on</strong> analyses were employed to develop<br />
downscaling transfer functi<strong>on</strong>s for various meteorological variables.<br />
This talk will focus <strong>on</strong> the selecti<strong>on</strong> of appropriate regressi<strong>on</strong> methods to c<strong>on</strong>duct different<br />
climate change impact analyses and to develop/validate the simulati<strong>on</strong> models. In additi<strong>on</strong>, the<br />
use of regressi<strong>on</strong> procedures in downscaling GCM climate change scenarios and deriving<br />
hourly stati<strong>on</strong>-scale future climate scenarios will be summarized.<br />
Issues for Use of Climate Models to Assess Future Impacts and Develop Adaptive Strategies:<br />
Cauti<strong>on</strong>s for IPCC WGs 1 and 2<br />
Take-Home Messages:<br />
Speaker: Robert E. Livezey<br />
Robert E. Livezey<br />
NWS Climate Services, Office of Services, NOAA<br />
robert.e.livezey@noaa.gov<br />
1. Impact assessment and scenario development must approach climate model output far<br />
more critically, c<strong>on</strong>ducting expert and thorough historical record validati<strong>on</strong> of all critical aspects<br />
of the problem as a first mandatory step.<br />
Otherwise the assessments or scenarios may be worthless or, worse, misleading.<br />
2. Model validati<strong>on</strong> needs greater research attenti<strong>on</strong>, both to meet user needs under (1)<br />
and to sensitize modelers to deficiencies.<br />
Currently, model validati<strong>on</strong> is grossly inadequate.<br />
3. More attenti<strong>on</strong> needs to be paid to the development of credible mesoscale (to avoid<br />
downscaling compromises) global coupled models that correctly treat the full spectrum of<br />
variability.<br />
Downscaling (whether statistical or with nested models) is inherently flawed.<br />
Discussi<strong>on</strong>:<br />
Global climate change will not be uniform either geographically or seas<strong>on</strong>ally. Associated<br />
changes will not <strong>on</strong>ly be in temperature means but in its variability, both intraseas<strong>on</strong>al and<br />
interannual, in the means and variability of precipitati<strong>on</strong>, winds, etc. and in the risks of high<br />
impact weather types and events. It is rare that a policymaker, adaptive planner, or resource<br />
manager c<strong>on</strong>cerned with climate sensitive issues or sectors should not have a critical interest<br />
39
in this granularity of change, certainly at a minimum the seas<strong>on</strong>al and geographic distributi<strong>on</strong><br />
of changes in the mean temperature and precipitati<strong>on</strong>; changes in the mean annual global<br />
surface temperature are of no practical interest to any<strong>on</strong>e by themselves.<br />
Unfortunately, state-of-the-art climate models that credibly produce the historical trace of<br />
the global mean annual temperature also credibly reproduce at best the geographic<br />
distributi<strong>on</strong> of mean temperature trends in some, but not all, seas<strong>on</strong>s. Major deficiencies<br />
remain in historical simulati<strong>on</strong>s of some aspects of mean temperature changes and all aspects<br />
of mean precipitati<strong>on</strong> changes, while little or no attenti<strong>on</strong> has been paid to validati<strong>on</strong> of<br />
variability, extremes, etc. and their changes. <str<strong>on</strong>g>The</str<strong>on</strong>g> ability of these models to credibly treat much<br />
of the latter depends <strong>on</strong> their ability to reproduce the form, seas<strong>on</strong>ality, and variance of the<br />
phenomen<strong>on</strong> that c<strong>on</strong>stitute the dominant c<strong>on</strong>trols <strong>on</strong> weather systems and their variability.<br />
<str<strong>on</strong>g>The</str<strong>on</strong>g>se phenomena minimally include ENSO, the MJO, the NAO, and m<strong>on</strong>so<strong>on</strong>s. Since no<br />
climate model has been shown to collectively and correctly treat all of these it is unlikely that<br />
any model can currently and credibly address variability or risks of high impact events.<br />
Because of these and other deficiencies, downscaling (whether statistical or dynamical) based<br />
<strong>on</strong> perfect model approaches cannot be a productive approach to scenario development in<br />
almost all instances. Correcti<strong>on</strong> approaches are problematic as well because of data<br />
limitati<strong>on</strong>s and the inherent n<strong>on</strong>-stati<strong>on</strong>arity of climate change.<br />
Snow Trends in Northern Spain: Analysis and simulati<strong>on</strong> with statistical downscaling models<br />
Speaker: Maria R. P<strong>on</strong>s<br />
Maria R. P<strong>on</strong>s<br />
Spanish Nati<strong>on</strong>al Meteorological Institute (INM)<br />
mari<strong>on</strong>a@inm.es<br />
Sixto Herrera<br />
Spanish Nati<strong>on</strong>al Meteorological Institute (INM)<br />
Jose M. Gutierrez<br />
University of Cantabria<br />
In this study we c<strong>on</strong>sider a database of binary snow observati<strong>on</strong>s (occurrence or no<br />
occurrence) in a set of stati<strong>on</strong>s from the Spanish Nati<strong>on</strong>al Meteorological Institute (INM) over<br />
Northern Spain. A previous quality analysis has been performed based <strong>on</strong>ly <strong>on</strong> the length of<br />
missing periods and the stati<strong>on</strong>s with less than 10% of missing data in the period 1957-2002<br />
were selected for the study. In the first part of the work a trend analysis is performed regarding<br />
the annual number of days in which snow occurred, obtaining in some stati<strong>on</strong>s a significant<br />
decreasing trend in approximately the last 15 years.<br />
Sec<strong>on</strong>dly, the c<strong>on</strong>necti<strong>on</strong> of snow with large-scale fields simulated by a General<br />
Circulati<strong>on</strong> Model (GCM) is analyzed using statistical downscaling methods (in particular<br />
analog and weather typing techniques). On the <strong>on</strong>e hand, we validate the probabilistic<br />
predicti<strong>on</strong>s using Relative Operating Characteristics (ROC) curves. However, due to the low<br />
40
climatological annual frequency of snow occurrence (around 6% in average), appropriate<br />
thresholds for the predicted probability have been calculated for each stati<strong>on</strong> to obtain<br />
deterministic predicti<strong>on</strong>s which can be validated with 2x2 c<strong>on</strong>tingency tables (for instance,<br />
typical values for HIR are around 60% whereas FARs are around 2%). Using this technique<br />
the annual number of days with snow is correctly simulated for the different stati<strong>on</strong>s,<br />
reproducing the observed trends. <str<strong>on</strong>g>The</str<strong>on</strong>g>se results are based <strong>on</strong> cross-validati<strong>on</strong> studies, in<br />
which a window around each of the predicted dates is removed in the analysis.<br />
In order to check the possible extrapolati<strong>on</strong> of statistical downscaling to climate change<br />
studies, the following experiment was c<strong>on</strong>ducted: the last 15 years of data –in which the<br />
decreasing trend was observed- were tried to simulate using the remaining 30 years as the<br />
training period to develop the statistical model. Some promising results are reported.<br />
Relati<strong>on</strong>ship between large-scale circulati<strong>on</strong> and North American extreme precipitati<strong>on</strong> in<br />
observati<strong>on</strong>s and model simulati<strong>on</strong>s<br />
Speaker: Jiafeng Wang<br />
Jiafeng Wang<br />
York University, Tor<strong>on</strong>to, Canada<br />
jiafeng.wang@ec.gc.ca<br />
Xuebin Zhang<br />
Climate Research Divisi<strong>on</strong>, Envir<strong>on</strong>ment Canada<br />
Almost all statistical downscaling approaches assume that the relati<strong>on</strong>ship between<br />
observed large-scale predictors and regi<strong>on</strong>al/local scale predictants will remain valid in the<br />
future. This assumpti<strong>on</strong> is rarely validated. Using simulati<strong>on</strong>s c<strong>on</strong>ducted with three GCMs<br />
(CCCma CGCM3, NCAR-CCSM3, and MIROC), we examine if such assumpti<strong>on</strong> holds for the<br />
relati<strong>on</strong>ship between large-scale circulati<strong>on</strong> and extreme winter precipitati<strong>on</strong> in North America.<br />
We found that the dominant spatial patterns in the observati<strong>on</strong>s and the simulati<strong>on</strong>s are similar.<br />
We also found that modelled extreme precipitati<strong>on</strong> resp<strong>on</strong>ses to the circulati<strong>on</strong> patterns are<br />
different from that observed. <str<strong>on</strong>g>The</str<strong>on</strong>g> model simulated relati<strong>on</strong>ship between extreme precipitati<strong>on</strong><br />
and large-scale circulati<strong>on</strong> for the 20th century c<strong>on</strong>tinues to hold for the 21st century.<br />
Parallel Sessi<strong>on</strong>s:Climate Change Detecti<strong>on</strong> and Attributi<strong>on</strong><br />
Applicati<strong>on</strong> of Granger Causality Test to Detecti<strong>on</strong> and Attributi<strong>on</strong> of Climate Change<br />
Speaker: H<strong>on</strong>g-xing Cao<br />
H<strong>on</strong>g-xing Cao<br />
41
Chinese Academy of Meteorological sciences, 46 Zh<strong>on</strong>gguancun Nandajie, 100081, <str<strong>on</strong>g>Beijing</str<strong>on</strong>g>,<str<strong>on</strong>g>China</str<strong>on</strong>g><br />
caohx@sina.com<br />
Yang Zheng<br />
Nati<strong>on</strong>al Envir<strong>on</strong>mental Protecti<strong>on</strong> Administrati<strong>on</strong>, Chegezhuangdajie, xxxxxx, <str<strong>on</strong>g>Beijing</str<strong>on</strong>g><br />
Hai-yan Yu<br />
<str<strong>on</strong>g>Beijing</str<strong>on</strong>g> Bureau of Metrology, 44 Zizhuyuanlu, 100089, <str<strong>on</strong>g>Beijing</str<strong>on</strong>g>, <str<strong>on</strong>g>China</str<strong>on</strong>g><br />
<str<strong>on</strong>g>The</str<strong>on</strong>g> presence of natural climate variability means that the detecti<strong>on</strong> and attributi<strong>on</strong> of<br />
anthropogenic climate change is a statistical ‘signal-in-noise’ problem. Several statistical<br />
methods for detecti<strong>on</strong> and attributi<strong>on</strong> of climate change have been developed. Here ‘Granger<br />
causality’ tests are applied to this issue.<br />
‘Granger causality’ tests -- or more correctly perhaps, Granger n<strong>on</strong>-causality tests -- are<br />
statistical tests of ‘causality’ in the sense of determining whether lagged observati<strong>on</strong>s of<br />
another variable have incremental forecasting power when added to a univariate<br />
autoregressive representati<strong>on</strong> of a variable. Granger causality is a technique for determining<br />
whether <strong>on</strong>e time series is useful in forecasting another. Ordinarily, regressi<strong>on</strong>s reflect ‘mere’<br />
correlati<strong>on</strong>s, but Clive Granger, who w<strong>on</strong> a Nobel Prize in Ec<strong>on</strong>omics, argued that there is an<br />
interpretati<strong>on</strong> of a set of tests as revealing something about causality.<br />
A time series X is said to Granger-cause Y if it can be shown, usually through a series of<br />
F-tests <strong>on</strong> lagged values of X (and with lagged values of Y also known), that those X values<br />
provide statistically significant informati<strong>on</strong> <strong>on</strong> future values of Y.<br />
<str<strong>on</strong>g>The</str<strong>on</strong>g> test works by first doing a regressi<strong>on</strong> of ΔY <strong>on</strong> lagged values of ΔY. Once the<br />
appropriate lag interval for Y is proved significant (t-stat or p-value), subsequent regressi<strong>on</strong>s<br />
for lagged levels of ΔX are performed and added to the regressi<strong>on</strong>, provided that they are<br />
significant in and of themselves,and add explanatory power to the model. This can be<br />
repeated for multiple ΔX 's (with each ΔX being tested independently of other ΔX 's, but in<br />
c<strong>on</strong>juncti<strong>on</strong> with the proved lag level of ΔY). More than 1 lag level of a variable can be included<br />
in the final regressi<strong>on</strong> model, provided it is statistically significant and provides explanatory<br />
power.<br />
Several climatic variables, such as CO2 c<strong>on</strong>centrati<strong>on</strong> in the atmosphere, solar black<br />
point, Atlantic oscillati<strong>on</strong>, East-Asian m<strong>on</strong>so<strong>on</strong> etc. are used for testing temperatures in <str<strong>on</strong>g>China</str<strong>on</strong>g><br />
and in <str<strong>on</strong>g>Beijing</str<strong>on</strong>g> by means of Granger causality test. <str<strong>on</strong>g>The</str<strong>on</strong>g> plausible c<strong>on</strong>necti<strong>on</strong>s between these<br />
variables and temperatures in <str<strong>on</strong>g>China</str<strong>on</strong>g> and in <str<strong>on</strong>g>Beijing</str<strong>on</strong>g> are revealed. We focus <strong>on</strong> an impact of the<br />
CO2 c<strong>on</strong>centrati<strong>on</strong> <strong>on</strong> temperatures in <str<strong>on</strong>g>China</str<strong>on</strong>g> and in <str<strong>on</strong>g>Beijing</str<strong>on</strong>g>; the cause of delay of temperature<br />
change in <str<strong>on</strong>g>China</str<strong>on</strong>g> to global warming is explained. Thus it is proved that the Granger causality<br />
test is able to use to detecti<strong>on</strong> and attributi<strong>on</strong> of climate change. Besides, Granger causality<br />
test can reveal relati<strong>on</strong>ships am<strong>on</strong>g different meteorological elements, so it is capable for<br />
screening the predictors for a predictant.<br />
42
Detecti<strong>on</strong> of urban warming in recent temperature trends in Japan<br />
Speaker: Fumiaki Fujibe<br />
Fumiaki Fujibe<br />
Meteorological Research Institute, Japan Meteorological Agency<br />
ffujibe@mri-jma.go.jp<br />
<str<strong>on</strong>g>The</str<strong>on</strong>g> c<strong>on</strong>tributi<strong>on</strong> of urban effects <strong>on</strong> recent temperature trends in Japan was analyzed<br />
using data at 561 stati<strong>on</strong>s for 27 years (March 1979- Feb. 2006). Stati<strong>on</strong>s were grouped<br />
according to the populati<strong>on</strong> density in an area of 3km radius. In comparis<strong>on</strong> to the group of<br />
stati<strong>on</strong>s with low populati<strong>on</strong> density (=3000 people per sq. kilometer) shows an anomalous trend of 0.12 C/decade during<br />
the 27 years. Even the weakly populated group (100-300 people per sq. kilometer) has an<br />
anomalous trend of 0.04 C/decade, which is significant at the 5% level. This result indicates<br />
that a careful analysis of urban effects is required in using temperature data in Japan for<br />
researches in climatic change.<br />
A hierarchical Bayesian model for climate change detecti<strong>on</strong> and attributi<strong>on</strong><br />
Speaker: Tianshu Ma<br />
Tianshu Ma<br />
York University<br />
mts205@mathstat.yorku.ca<br />
Xuebin Zhang<br />
Meteorological Service of Canada, Downsview, Ontario<br />
Helene Massam<br />
York University<br />
Two different Bayesian approaches have been used for climate change detecti<strong>on</strong> and<br />
attributi<strong>on</strong>. One is to use Bayesian methods to make inferences about posterior distributi<strong>on</strong> of<br />
regressi<strong>on</strong> coefficient, or scaling factor β, that is obtained from a c<strong>on</strong>venti<strong>on</strong>al optimal<br />
fingerprinting approach. <str<strong>on</strong>g>The</str<strong>on</strong>g> other is based <strong>on</strong> Bayes factor to compare two probability models<br />
which assign different values about β. Detecti<strong>on</strong> and attributi<strong>on</strong> can be inferenced by finding<br />
the most likely model and its corresp<strong>on</strong>ding parameter. Earlier work related to the first method<br />
uses a mixture 2-modal normal distributi<strong>on</strong> a priori. While this method is computati<strong>on</strong>ally easy<br />
to implement when simulati<strong>on</strong>s from <strong>on</strong>e GCM are used, it is not straightforward to extend to<br />
multiple GCMs due to the difficulties in the selecti<strong>on</strong> of prior distributi<strong>on</strong>. Here, we propose a<br />
43
more general procedure, a hierarchical approach , that can be applied for both single and<br />
multiple GCMs simulati<strong>on</strong>s.<br />
In the single GCM case, earlier studies (e.g. Berliner 2003, Lee et al. 2003) estimate prior<br />
distributi<strong>on</strong> parameters empirically using l<strong>on</strong>g simulati<strong>on</strong>s of an EBM. We use a normal<br />
distributi<strong>on</strong> as our prior for β and a sec<strong>on</strong>d flat prior distributi<strong>on</strong> based <strong>on</strong> a hyperparameter,<br />
eliminating the need to use a model to obtain such estimati<strong>on</strong> that could be affected by the<br />
performance of the EBM. Detecti<strong>on</strong> and attributi<strong>on</strong> is inferenced based <strong>on</strong> the posterior<br />
distributi<strong>on</strong> of β. In the multi-model case, all GCMs are treated equally because there is no<br />
obvious reas<strong>on</strong> to suggest a particular GCM is superior to other GCMs. We compute <strong>on</strong>e<br />
scaling factor β for every GCM separately. <str<strong>on</strong>g>The</str<strong>on</strong>g>se scaling factors are then c<strong>on</strong>sidered as a<br />
sample from a comm<strong>on</strong> populati<strong>on</strong> with the hyperparameter which is then inferenced.<br />
Our methods have been applied to simulati<strong>on</strong>s with observed anthropogenic forcing<br />
changes from several GCMs including CGCM1/CGCM2, HadCM2, HadCM3, and PCM to<br />
assess the causes of 20th Century temperature changes over the globe. Results indicate that<br />
the observed global temperature changes during 1900-1949, 1910-1959, and 1950-1999 may<br />
be attributed to the effect of combined greenhouse gases and sulfate aerosols.<br />
Multi-Model Bayesian Climate Change Assessment for Regi<strong>on</strong>al Surface Temperatures<br />
Speaker: Seung-Ki Min<br />
Seung-Ki Min<br />
Climate Research Divisi<strong>on</strong>, Envir<strong>on</strong>ment Canada<br />
seung-ki.min@ec.gc.ca<br />
Andreas Hense<br />
Meteorological Institute, University of B<strong>on</strong>n<br />
A Bayesian approach is applied to the observed regi<strong>on</strong>al and seas<strong>on</strong>al surface air<br />
temperature (SAT) changes using single-model ensembles (SMEs) with the ECHO-G model<br />
and multimodel ensembles (MMEs) of the IPCC AR4 simulati<strong>on</strong>s. Bayesian decisi<strong>on</strong> classifies<br />
observati<strong>on</strong>s into the most probable scenario out of six available scenarios: CTL (c<strong>on</strong>trol), N<br />
(natural forcing), ANTHRO (anthropogenic forcing), G (greenhouse gas), S (Sulfate aerosols),<br />
and ALL (natural plus anthropogenic forcing). Space-time vectors of detecti<strong>on</strong> variable are<br />
c<strong>on</strong>structed for six c<strong>on</strong>tinental regi<strong>on</strong>s (North America, South America, Asia, Africa, Australia,<br />
and Europe) by combining temporal comp<strong>on</strong>ents of SATs (expressed as Legendre coefficients)<br />
from two or three subregi<strong>on</strong>s of each c<strong>on</strong>tinental regi<strong>on</strong>.<br />
Bayesian decisi<strong>on</strong> results show that over most of the regi<strong>on</strong>s observed SATs are<br />
classified into ALL or ANTHRO scenarios for the whole 20th century and its sec<strong>on</strong>d half. N and<br />
ALL scenarios are decided during the first half of the 20th century, but <strong>on</strong>ly in the low latitude<br />
regi<strong>on</strong> (Africa and South America), which might be related to resp<strong>on</strong>se patterns to solar forcing.<br />
Overall seas<strong>on</strong>al decisi<strong>on</strong>s follow annual results, but there are notable seas<strong>on</strong>al dependences<br />
which differ between regi<strong>on</strong>s. A comparis<strong>on</strong> of SME and MME results dem<strong>on</strong>strates that the<br />
Bayesian decisi<strong>on</strong>s for regi<strong>on</strong>al-scale SATs are largely robust to inter-model uncertainties as<br />
well as prior probability and temporal scales as found in the global results.<br />
44
Detecti<strong>on</strong> of Human Influence <strong>on</strong> pan-Arctic Precipitati<strong>on</strong><br />
Speaker: Seung-Ki Min<br />
Seung-Ki Min<br />
Climate Research Divisi<strong>on</strong>, Envir<strong>on</strong>ment Canada<br />
seung-ki.min@ec.gc.ca<br />
Xuebin Zhang<br />
Climate Research Divisi<strong>on</strong>, Envir<strong>on</strong>ment Canada<br />
Francis Zwiers<br />
Climate Research Divisi<strong>on</strong>, Envir<strong>on</strong>ment Canada<br />
<str<strong>on</strong>g>The</str<strong>on</strong>g> Arctic and the northern sub-polar regi<strong>on</strong> are critical areas for climate change. <str<strong>on</strong>g>The</str<strong>on</strong>g><br />
fluctuati<strong>on</strong> of regi<strong>on</strong>al fresh water inflow to the Arctic Ocean modulates the deep ocean<br />
circulati<strong>on</strong> and thus exerts str<strong>on</strong>g influence <strong>on</strong> global climate. This regi<strong>on</strong> also warms faster<br />
under global warming. By comparing observati<strong>on</strong>s to simulati<strong>on</strong>s from 22 coupled climate<br />
models, we detect anthropogenic influence in the space-time precipitati<strong>on</strong> patterns over the<br />
northern high-latitude (north of 55N) lands during the sec<strong>on</strong>d half of the 20th century. <str<strong>on</strong>g>The</str<strong>on</strong>g><br />
detecti<strong>on</strong> is also robust to the removal of Arctic Oscillati<strong>on</strong> related variability in the observed<br />
precipitati<strong>on</strong>. This regi<strong>on</strong>al-scale precipitati<strong>on</strong> detecti<strong>on</strong> result represents a new and str<strong>on</strong>g<br />
evidence that human activity has c<strong>on</strong>tributed to the pan-Arctic climate change.<br />
Impact of carb<strong>on</strong>aceous aerosols <strong>on</strong> attributable warming and future predicti<strong>on</strong><br />
Speaker: Toru Nozawa<br />
Toru Nozawa<br />
Nati<strong>on</strong>al Institute for Envir<strong>on</strong>mental Studies<br />
nozawa@nies.go.jp<br />
Hideo Shiogama<br />
Nati<strong>on</strong>al Institute for Envir<strong>on</strong>mental Studies<br />
Tatsuya Nagashima<br />
Nati<strong>on</strong>al Institute for Envir<strong>on</strong>mental Studies<br />
Toshihiko Takemura<br />
Research Institute for Applied Mechanics, Kyushu University<br />
Impacts of historical changes in carb<strong>on</strong>aceous aerosols <strong>on</strong> past attributable warming<br />
and future predicti<strong>on</strong> are investigated using an optimal fingerprinting method (Allen and Stott,<br />
45
2003) with a series of numerical simulati<strong>on</strong>s performed by a coupled ocean-atmosphere<br />
general circulati<strong>on</strong> model (CGCM) called by MIROC. Observati<strong>on</strong>ally c<strong>on</strong>strained attributable<br />
warming in the 20th century is similar to that estimated with the other CGCMs (Stott et al.,<br />
2006) if the historical changes in carb<strong>on</strong>aceous aerosols do not c<strong>on</strong>sidered in MIROC as in the<br />
other CGCMs. When we c<strong>on</strong>sider historical changes in carb<strong>on</strong>aceous aerosols, <strong>on</strong> the other<br />
hand, observati<strong>on</strong>ally c<strong>on</strong>strained attributable warming increases and uncertainties in<br />
attributable anthropogenic signals become larger. Scaled future predicti<strong>on</strong> gets more<br />
uncertainties when we use scaling factors estimated with carb<strong>on</strong>aceous aerosol forcings. This<br />
implies that the other process, such as carb<strong>on</strong> cycle, atmospheric chemistry, dynamical<br />
vegetati<strong>on</strong>, etc. might also have significant impact <strong>on</strong> the past attributable warming and the<br />
scaled future predicti<strong>on</strong>.<br />
Robustness of climate change signals in near term predicti<strong>on</strong>s up to the year 2030<br />
Speaker: Hideo Shiogama<br />
Hideo Shiogama<br />
Nati<strong>on</strong>al Institute for Envir<strong>on</strong>mental Studies, Tsukuba, Japan<br />
shiogama.hideo@nies.go.jp<br />
Toru Nozawa<br />
Nati<strong>on</strong>al Institute for Envir<strong>on</strong>mental Studies, Tsukuba, Japan<br />
Seita Emori<br />
Nati<strong>on</strong>al Institute for Envir<strong>on</strong>mental Studies, Tsukuba, Japan<br />
This is the first study to examine whether human c<strong>on</strong>tributi<strong>on</strong>s to changes in extreme<br />
temperature indices have larger amplitudes than natural variability in near future (up to 2030)<br />
climate predicti<strong>on</strong>. We performed 10 runs of the initial c<strong>on</strong>diti<strong>on</strong> perturbed ensemble of a<br />
coupled atmosphere-ocean general circulati<strong>on</strong> model. In the near future, over most land areas,<br />
all 10 runs show agreement in predicting more frequent occurrences of warm nights and warm<br />
days, and less frequent cold nights and cold days, suggesting that human influences in them<br />
have become larger than natural variability. Area weighted fracti<strong>on</strong> of grid boxes where all runs<br />
agree the directi<strong>on</strong> of changes over the land is little sensitive to ensemble sizes (for warm<br />
nights, 96% and 93% for 4 runs and 10 runs, respectively). It was also suggested that the<br />
changes in the frequency of warm and cold extremes are mainly due to shifts in seas<strong>on</strong>al<br />
mean temperatures. Additi<strong>on</strong>ally snow cover affects the frequency of cold extremes in some<br />
areas.<br />
46
Extending attributi<strong>on</strong> studies: postage stamps for the world<br />
Speaker: Dáithí St<strong>on</strong>e<br />
Dáithí St<strong>on</strong>e<br />
Tyndall Centre, Dept. of Physics, University of Oxford<br />
st<strong>on</strong>ed@atm.ox.ac.uk<br />
Studies of the detecti<strong>on</strong> and attributi<strong>on</strong> of climate change are progressing bey<strong>on</strong>d the<br />
questi<strong>on</strong> `Have we influenced the climate?' and starting to address the questi<strong>on</strong> `How does the<br />
current climate differ because of our influence?' <str<strong>on</strong>g>The</str<strong>on</strong>g> subtle but important difference between<br />
these two questi<strong>on</strong>s means that different assumpti<strong>on</strong>s are required when addressing them.<br />
Are these assumpti<strong>on</strong>s c<strong>on</strong>tradictory? This talk will discuss these questi<strong>on</strong>s through a<br />
comparis<strong>on</strong> of observed c<strong>on</strong>tinental surface temperature trends with those from a multi-model<br />
ensemble of historical simulati<strong>on</strong>s including <strong>on</strong>ly natural external forcings and an ensemble<br />
including both anthropogenic and natural forcings.<br />
C<strong>on</strong>sistency of observed winter precipitati<strong>on</strong> trends in northern Europe with regi<strong>on</strong>al climate<br />
change projecti<strong>on</strong>s<br />
Speaker: Hans v<strong>on</strong> Storch<br />
Hans v<strong>on</strong> Storch<br />
Institute for Coastal Research, GKSS<br />
hv<strong>on</strong>storch@web.de<br />
J<strong>on</strong>as Bhend<br />
Institute for Coastal Research, GKSS<br />
Often it is claimed that the recent changes in northern European climate are at least<br />
partly anthropogenic even though a human influence has not yet been successfully detected.<br />
Hence we investigate whether the recent changes are c<strong>on</strong>sistent with regi<strong>on</strong>al climate change<br />
projecti<strong>on</strong>s.<str<strong>on</strong>g>The</str<strong>on</strong>g>refore, trends in winter (DJF) mean precipitati<strong>on</strong> in northern Europe are<br />
compared to human induced changes as predicted by an ensemble of four regi<strong>on</strong>al climate<br />
model simulati<strong>on</strong>s.<br />
<str<strong>on</strong>g>The</str<strong>on</strong>g> patterns of recent trends and predicted changes match reas<strong>on</strong>ably well as indicated<br />
by pattern correlati<strong>on</strong> and the similarity is very likely not random. However, the model<br />
projecti<strong>on</strong>s severely underestimate the recent change in winter precipitati<strong>on</strong> by 50 to 80\%.<br />
That is, the signal-to-noise ratio of the anthropogenic precipitati<strong>on</strong> change is either rather low<br />
or the presently used simulati<strong>on</strong>s are significantly flawed in their ability to project changes into<br />
the future.<br />
47
European trends c<strong>on</strong>tain large NAO-related signals, of which a major unknown part may<br />
be unrelated to the anthropogenic signal. <str<strong>on</strong>g>The</str<strong>on</strong>g>refore, we also examine the c<strong>on</strong>sistency of<br />
recent and projected changes after subtracting the NAO signal in both the observati<strong>on</strong>s and in<br />
the projecti<strong>on</strong>s. It turns out that even after the removal of the NAO signal, the pattern of trends<br />
in the observati<strong>on</strong>s are similar to those projected by the models. At the same time, the<br />
magnitude of the trends is c<strong>on</strong>siderably reduced and closer to the magnitude of the change in<br />
the projecti<strong>on</strong>s.<br />
Detecti<strong>on</strong> of external influence <strong>on</strong> trends of atmospheric storminess and northern oceans wave<br />
heights<br />
Speaker: Xiaolan L. Wang<br />
Xiaolan L. Wang<br />
Climate Research Divisi<strong>on</strong>, ASTD, STB, Envir<strong>on</strong>ment Canada, Tor<strong>on</strong>to, Ontario<br />
Xiaolan.Wang@ec.gc.ca<br />
Val R. Swail, Francis W. Zwiers, Xuebin Zhang,Yang Feng<br />
Climate Research Divisi<strong>on</strong>, ASTD, STB, Envir<strong>on</strong>ment Canada, Tor<strong>on</strong>to, Ontario<br />
<str<strong>on</strong>g>The</str<strong>on</strong>g> atmospheric storminess (as inferred from geostrophic wind energy) and ocean<br />
wave heights have increased in the cold seas<strong>on</strong>s over the past half century in the<br />
high-latitudes of the northern hemisphere (especially the northeast North Atlantic in boreal<br />
winter), and have decreased in more southerly northern latitudes. This study shows that these<br />
trend patterns c<strong>on</strong>tain a detectable resp<strong>on</strong>se to external forcing (i.e., both natural and<br />
anthropogenic forcing). <str<strong>on</strong>g>The</str<strong>on</strong>g> signal of external influence is found to be str<strong>on</strong>gest in the winter<br />
hemisphere, that is, in the northern hemisphere in January-February-March and in the<br />
southern hemisphere in July-August-September. However, the magnitude of the estimated<br />
resp<strong>on</strong>se to the forcing, which was obtained directly from climate models in the case of<br />
geostrophic wind energy and indirectly via an empirical downscaling procedure in the case of<br />
ocean wave heights, is significantly less than the magnitude of the observed changes in these<br />
parameters.<br />
Detecti<strong>on</strong> of Human Influence <strong>on</strong> 20th Century Precipitati<strong>on</strong> Trends<br />
Speaker: Xuebin Zhang<br />
Xuebin Zhang<br />
Envir<strong>on</strong>ment Canada<br />
Xuebin.Zhang@ec.gc.ca<br />
48
Francis W. Zwiers, Gabriele C. Hegerl, F. Hugo Lambert, Nathan P. Gillett, Susan Solom<strong>on</strong>, Peter<br />
Stott, Toru Nozawa<br />
Human influence <strong>on</strong> climate has been detected in surface air temperature <strong>on</strong> global,<br />
c<strong>on</strong>tinental and some sub-c<strong>on</strong>tinental scales, in sea level pressure, in free atmospheric<br />
temperature, in tropopause height, and in ocean heat c<strong>on</strong>tent. While precipitati<strong>on</strong> change is<br />
highly relevant to the impacts of climate change, large scale precipitati<strong>on</strong> changes have not<br />
previously been detected and attributed to human influence. A key reas<strong>on</strong> for this is that<br />
perhaps because compensating increases and decreases in different regi<strong>on</strong>s of the globe<br />
reduce the global average signal. Models suggest that while anthropogenic forcing should<br />
have caused a small increase in global mean precipitati<strong>on</strong>, it also is expected to induce a<br />
latitudinal redistributi<strong>on</strong> of precipitati<strong>on</strong> with moistening at high latitudes, drying in sub-tropical<br />
latitudes, and perhaps a shift of the ITCZ. Here we compare the changes in the pattern of 20th<br />
century land precipitati<strong>on</strong> observati<strong>on</strong>s averaged in latitude bands to precipitati<strong>on</strong> changes<br />
simulated by fourteen climate models. We show that the influence of anthropogenic forcing <strong>on</strong><br />
observed z<strong>on</strong>al mean precipitati<strong>on</strong> changes can be detected and that these changes cannot<br />
be explained by internal climate variability or the effect of natural forcing. We estimate that<br />
anthropogenic forcing c<strong>on</strong>tributed substantially to observed increases in precipitati<strong>on</strong> in the<br />
northern mid-latitudes, to drying in the northern subtropics and tropics, and to moistening in<br />
the southern deep tropics and subtropics. <str<strong>on</strong>g>The</str<strong>on</strong>g> observed changes, which are larger than<br />
estimated from presently available model simulati<strong>on</strong>s, have significant implicati<strong>on</strong>s for<br />
ecosystems, agriculture, and human health.<br />
An assessment of regi<strong>on</strong>al record-breaking statistics in annual mean temperature<br />
Speaker: Eduardo Zorita<br />
Eduardo Zorita<br />
GKSS<br />
eduardo.zorita@gmx.de<br />
Hans v<strong>on</strong> Storch<br />
GKSS<br />
Different datasets of global mean surface air temperature show c<strong>on</strong>sistently increasing<br />
values for the past 50 years. Since 1990, a large number of record warm years was detected:<br />
the 12 warmest years since 1880 have all occurred after 1990. <str<strong>on</strong>g>The</str<strong>on</strong>g> probability p of the event E<br />
of finding at least 12 of the largest values of a sequence of 126 random numbers (years 1880<br />
to 2005) <strong>on</strong> the last 16 places (year 1990 to 2005) is 9.3·10–14. However, annual mean<br />
surface air temperatures show serial correlati<strong>on</strong>s even in the absence of variati<strong>on</strong>s of external<br />
forcing. Two null-hypothesis have been used to calculate the probability that such series of<br />
49
warm record years may arise by chance in stati<strong>on</strong>ary, but serially correlated, series: an<br />
auto-regressive process of order 1 and l<strong>on</strong>g-memory process. <str<strong>on</strong>g>The</str<strong>on</strong>g> parameters of these<br />
processes are estimated from the observed data, using the complete record or just part of it.<br />
<str<strong>on</strong>g>The</str<strong>on</strong>g> resulting probabilities, estimated by M<strong>on</strong>tecarlo realizati<strong>on</strong>s, hover over 10-4 to 10 -3.<br />
A similar analysis has been performed for the annual temperature averaged in each of the<br />
26 regi<strong>on</strong>s defined by Giorgi and Bi (2005), derived from the HadCRU3 data set. Some of<br />
these series start earlier than 1880. <str<strong>on</strong>g>The</str<strong>on</strong>g> autoregressive parameter is estimated for each of<br />
these series, as well as the number of warmest years occurring in 1990-2005. <str<strong>on</strong>g>The</str<strong>on</strong>g><br />
probabilities of these number of record years arising by chance under this null-hypothesis<br />
varies widely. For some regi<strong>on</strong>s, it is as high as 0.1, but for other regi<strong>on</strong>s, notably East Asia<br />
and Alaska, they are remarkably small, of the order of 10-6, indicating that for these regi<strong>on</strong>s<br />
the late series of warm years would lie even more clearly outside the range of random<br />
fluctuati<strong>on</strong>s than for the global annual temperature.<br />
Parallel Sessi<strong>on</strong>s:Process Studies<br />
<str<strong>on</strong>g>The</str<strong>on</strong>g> study <strong>on</strong> Anomalous Atmosphere-Ocean Currents and the Propagati<strong>on</strong> Mechanism for<br />
Warm Signal of Sea Temperature<br />
Speaker: Changrui<br />
Changrui<br />
IAP<br />
changrui2001@163.com<br />
Zhang Qingyun<br />
IAP<br />
Because of the sparse observati<strong>on</strong> over the Ocean, the important problems about the<br />
characteristics of the ocean currents and their relati<strong>on</strong>ship with the sea temperature anomaly<br />
during El Niño events are still not completely resolved, although there already have been a few<br />
researchers focused their attenti<strong>on</strong>s <strong>on</strong> this field. In order to deeply investigate the truth behind<br />
the puzzles from a new way, this research is based up<strong>on</strong> the Simple Ocean Data Assimilati<strong>on</strong><br />
(SODA) dataset from 1971 to 2000 and the NECP/NCAR reanalysis dataset from 1980 to<br />
2000, which are of high resoluti<strong>on</strong> and l<strong>on</strong>g time scale. <str<strong>on</strong>g>The</str<strong>on</strong>g>refore, from the departures point of<br />
view, the variati<strong>on</strong>s of z<strong>on</strong>al wind and ocean currents as well as the propagati<strong>on</strong> features of<br />
the sea temperature signal during El Niño events have been investigated by composite<br />
analysis. In this research, special emphasis is placed <strong>on</strong> the two main types of El Niño events:<br />
the middle-pattern of El Niño and the east-pattern of El Niño. According to the amplitude of the<br />
sea surface temperature anomaly and its characteristics of propagati<strong>on</strong>, the 1982/83, 1991/92<br />
and 1997/98 events are composite for the middle-pattern of El Niño event and the 1972/73 and<br />
1976/77 events for the east-pattern of El Niño event. <str<strong>on</strong>g>The</str<strong>on</strong>g> results show that:<br />
50
1, In the middle-pattern of El Niño event(the anomalous warm water appears first in the<br />
western of 120°W) and the east-pattern of El Niño event(the anomalous warm water appears<br />
first in the eastern of 120°W), there is a significantly eastward propagati<strong>on</strong> of the str<strong>on</strong>gest<br />
western wind anomalies over the western equatorial Pacific Ocean. Besides, the positive<br />
(negative) equatorial surface current anomalies are associated with the enhanced (weakened)<br />
western wind anomalies. <str<strong>on</strong>g>The</str<strong>on</strong>g> resp<strong>on</strong>se of the ocean currents to the z<strong>on</strong>al wind anomaly has a<br />
high correlati<strong>on</strong> with the intensity and the characteristics of the propagati<strong>on</strong> of the z<strong>on</strong>al wind<br />
anomaly. In the middle-pattern of El Niño event, the western wind anomalies are relatively<br />
str<strong>on</strong>ger, which is favorable for the eastward movement of the positive equatorial surface<br />
current anomalies over the western Pacific. <str<strong>on</strong>g>The</str<strong>on</strong>g>refore, the intensity of such El Niño event is<br />
relatively str<strong>on</strong>ger.<br />
2, In the middle-pattern of El Niño event, over the western Pacific, the anomalous<br />
down-welling of the equatorial ocean currents caused by the c<strong>on</strong>vergence of surface z<strong>on</strong>al<br />
currents anomalies suppresses the up-rush of the deep cold water, leading to the warm<br />
surface water, which also moves eastward with the eastward propagati<strong>on</strong> of the anomalous<br />
down-welling.<br />
3, In the east-pattern of El Niño event, the anomalous down-welling of the equatorial<br />
ocean currents caused by the c<strong>on</strong>vergence of surface z<strong>on</strong>al currents anomalies over the<br />
western Pacific Ocean does not move eastward, and the formati<strong>on</strong> of warm water is relevant to<br />
the regi<strong>on</strong>al (120°W east) anomalous down-welling of the equatorial ocean currents caused by<br />
the c<strong>on</strong>vergence of surface z<strong>on</strong>al currents anomalies, which suppresses the up-rush of the<br />
deep cold water. This is c<strong>on</strong>siderably different from the feature in the middle-pattern of El Niño<br />
event.<br />
Detecting annual cycle in the modes of low-frequency circulati<strong>on</strong> variability<br />
Speaker: Radan Huth<br />
Radan Huth<br />
Institute of Atmospheric Physics, Prague, Czech Republic<br />
huth@ufa.cas.cz<br />
Modes of low-frequency variability of atmospheric circulati<strong>on</strong> in the extratropics are<br />
comm<strong>on</strong>ly detected by rotated principal comp<strong>on</strong>ent analysis (PCA) of m<strong>on</strong>thly or seas<strong>on</strong>al<br />
means. PCA is usually performed <strong>on</strong> m<strong>on</strong>thly or seas<strong>on</strong>al, not annual basis. However, we<br />
were faced with the task of creating time series of the variability modes that would be<br />
equidistant in time with the time step of <strong>on</strong>e m<strong>on</strong>th. In this c<strong>on</strong>tributi<strong>on</strong>, we compare two<br />
approaches to this task: the first <strong>on</strong>e c<strong>on</strong>sists in performing PCA for each m<strong>on</strong>th separately<br />
(m<strong>on</strong>thly PCA), similarly to Barnst<strong>on</strong> and Livezey (1987), whereas in the other, PCA is<br />
c<strong>on</strong>ducted for all m<strong>on</strong>thly data together (annual PCA). All the analyses are based <strong>on</strong> 500 hPa<br />
heights from the NCEP/NCAR reanalysis. <str<strong>on</strong>g>The</str<strong>on</strong>g> disadvantage of m<strong>on</strong>thly PCA is that <strong>on</strong>ly two<br />
modes can be traced throughout the whole annual cycle: it is the North Atlantic Oscillati<strong>on</strong><br />
51
(NAO) and the West Pacific Oscillati<strong>on</strong> (WPO), which in the warm seas<strong>on</strong> turns into the<br />
Subtropical Z<strong>on</strong>al (SZ) mode. Moreover, parts of variability are attached to the modes rather<br />
randomly, which makes their comparis<strong>on</strong> between m<strong>on</strong>ths difficult. M<strong>on</strong>thly PCA is therefore<br />
hardly applicable to producing equidistant time series of the variability modes. Since the<br />
variability of atmospheric circulati<strong>on</strong> is larger in winter than in summer, results of annual PCA<br />
are potentially biased towards str<strong>on</strong>ger influence of winter. <str<strong>on</strong>g>The</str<strong>on</strong>g>refore, we weighted each<br />
m<strong>on</strong>th by its standard deviati<strong>on</strong>, thus giving all m<strong>on</strong>ths equal influence in the analysis.<br />
However, the results of weighted and unweighted PCA differ <strong>on</strong>ly in the order of the modes,<br />
not in their shapes. Of the 13 modes detected, <strong>on</strong>ly 2 are str<strong>on</strong>gest in summer; all the others<br />
dominate in winter. Annual PCA does not succeed in distinguishing the winter and summer<br />
positi<strong>on</strong>s of at least some modes; it detects the ‘annualy average’ modes, whose positi<strong>on</strong> is<br />
generally similar to, but not coincident with, their winter positi<strong>on</strong>. In c<strong>on</strong>clusi<strong>on</strong>, a search for <strong>on</strong><br />
optimum method of detecti<strong>on</strong> of the variability modes with a m<strong>on</strong>thly resoluti<strong>on</strong> is still open.<br />
Harm<strong>on</strong>ic Analysis <strong>on</strong> Low Latitudinal Climatological Wind Field<br />
Speaker: Liping Li<br />
Liping Li<br />
Nanjing University of Informati<strong>on</strong> Science & Tech<strong>on</strong>ology,Nanjing<br />
li.liping@163.com<br />
Panxing Wang<br />
Nanjing University of Informati<strong>on</strong> Science & Tech<strong>on</strong>ology,Nanjing<br />
Xingyu Wu<br />
Nanjing University of Informati<strong>on</strong> Science & Tech<strong>on</strong>ology,Nanjing<br />
A scheme of Fourier analysis <strong>on</strong> m<strong>on</strong>thly wind field is put forward. 850hPa, 200hPa<br />
climatological wind fields in low-latitude z<strong>on</strong>e from 30°S to 30°N and Asia are investigated. <str<strong>on</strong>g>The</str<strong>on</strong>g><br />
results show that it has providesd a series of valuable informati<strong>on</strong>. 1) Climatological wind fields<br />
is characterized by low dimensi<strong>on</strong> and low order, whose module square is centered up<strong>on</strong> the<br />
first few (3~5) wave comp<strong>on</strong>ents. 2) <str<strong>on</strong>g>The</str<strong>on</strong>g> most important 0 wave comp<strong>on</strong>ent characterizes the<br />
c<strong>on</strong>figurati<strong>on</strong> of mean z<strong>on</strong>al trade winds. For 850hPa wind field, trade winds are more<br />
extensive then the edge of westerlies all the year around; the highest trade winds in the<br />
Northern and Southern Hemispheres and the thermal equator, matching al<strong>on</strong>g with<br />
hemispherical Hedley cell centers and the comm<strong>on</strong> ascending leg, move northwardly and<br />
southwardly approximately together with the seas<strong>on</strong>s. For 850hPa wind field, easterlies and<br />
westerlies are also important in the whole year, but the former is weaker than the latter<br />
obviously. <str<strong>on</strong>g>The</str<strong>on</strong>g> seas<strong>on</strong>al movement of the tropical easterlies, towards north and south, shows<br />
clear hemispherical variati<strong>on</strong>s. 3) More than 80 percents of the steady wave module square<br />
are centered up<strong>on</strong> the first few couples of wave comp<strong>on</strong>ents (from the first to forth wave for<br />
850hPa and form the first to third wave for 200hPa), which show the main circulati<strong>on</strong> system of<br />
the steady wave. <str<strong>on</strong>g>The</str<strong>on</strong>g> first couple, whose module square fitting rate is much larger than others,<br />
displays the equatorial Walker cell and the seas<strong>on</strong>al movement of the intertropical<br />
52
c<strong>on</strong>vergence z<strong>on</strong>e (ITCZ). <str<strong>on</strong>g>The</str<strong>on</strong>g> third and the sec<strong>on</strong>d couples are the sec<strong>on</strong>d most significant in<br />
January and July respectively.<br />
Key words: Fourier harm<strong>on</strong>ic analysis; low latitudinal climatological wind field; In the complex field<br />
Links between cycl<strong>on</strong>ic activity and precipitati<strong>on</strong><br />
Speaker: Piero Li<strong>on</strong>ello<br />
Piero Li<strong>on</strong>ello<br />
Univ. of Salento, Lecce, Italy<br />
piero.li<strong>on</strong>ello@unile.it<br />
Mid-latitude cycl<strong>on</strong>es have important effects <strong>on</strong> the envir<strong>on</strong>ment as they are associated<br />
with rain, winds, waves, surges and even landslides, and they are linked to timing and<br />
magnitude of the extreme weather events. This study c<strong>on</strong>centrates <strong>on</strong> precipitati<strong>on</strong> events<br />
over Europe during the sec<strong>on</strong>d half of the 20th century and <strong>on</strong> their link to cycl<strong>on</strong>e positi<strong>on</strong> and<br />
intensity, both at global and at daily scale. Data for the analysis of the cycl<strong>on</strong>es are provided by<br />
the ERA-40 (ECMWF Re-Analysis) dataset for cycl<strong>on</strong>e and sea level pressure variability and<br />
by CRU (Climate Research Unit, Univ. of East Anglia) and ECA (European Climate<br />
Assessment, hosted at Royal Netherlands Meteorological Institute, KNMI) for m<strong>on</strong>thly and<br />
daily datasets, respectively. Spatial distributi<strong>on</strong> of the correlati<strong>on</strong> between cycl<strong>on</strong>e activity and<br />
precipitati<strong>on</strong> and links between spatial variability of their trends are discussed. Signals are<br />
particularly c<strong>on</strong>sistent over Northern Europe where both cycl<strong>on</strong>e activity and precipitati<strong>on</strong><br />
present a positive trend.<br />
<str<strong>on</strong>g>The</str<strong>on</strong>g> Interdecadal Variati<strong>on</strong> of the Equatorial Pacific SST and its Relati<strong>on</strong>ships with the Southern<br />
and Northern Oscillati<strong>on</strong><br />
Speaker: Jingbei Peng<br />
Jingbei Peng<br />
Institute of Atmospheric Physics<br />
pengjingbei@mail.iap.ac.cn<br />
Zhang Qingyun<br />
Institute of Atmospheric Physics<br />
Northern Oscillati<strong>on</strong> Index (NOI) is the index of climate variability based <strong>on</strong> the<br />
difference in sea level pressure (SLP) anomalies of the Ship N which was in the Northeast<br />
53
Pacific and Manila, Philippine, in a climatologically low SLP regi<strong>on</strong>. SLPs at these two<br />
observati<strong>on</strong> sites have a str<strong>on</strong>g negative correlati<strong>on</strong>. NOI reflects the oscillati<strong>on</strong> between the<br />
North Pacific Subtropical High and Tropical Low Pressure Belt. It is roughly the north Pacific<br />
equivalent of the Southern Oscillati<strong>on</strong> Index (SOI), and highly correlated with SOI and the sea<br />
surface temperature anomalies (SSTA) in the tropical Eastern Pacific <strong>on</strong> the interannual scale.<br />
<str<strong>on</strong>g>The</str<strong>on</strong>g> interdecadal variability of SSTA in Niño 3 (Niño-3) that measures the variability of the<br />
tropical Pacific SSTA, and its relati<strong>on</strong>ships with the interdecadal variability of NOI and SOI<br />
were studied by using ICOADS dataset and observati<strong>on</strong>s. Niño-3, NOI and SOI experienced<br />
climatic abrupt changes in the mid-1970s. <str<strong>on</strong>g>The</str<strong>on</strong>g> increase of Niño-3 after mid-1970s indicated a<br />
notable basin-wide warming in the Pacific Ocean, while NOI and SOI shifted from positive<br />
phases of the interdecadal variati<strong>on</strong> to the negative phases. <str<strong>on</strong>g>The</str<strong>on</strong>g> abrupt jumps of NOI and SOI<br />
were leading the variati<strong>on</strong> of Niño-3.<br />
In spite of the l<strong>on</strong>g-term trend, Niño-3, NOI and SOI shared the same interdecadal-scale<br />
periods dominated by positive and negative values, suggesting substantial climate shifts <strong>on</strong> a<br />
roughly 12~15-year ‘cycle’. After filtering, the interdecadal variati<strong>on</strong>s of NOI and SOI showed<br />
different characteristics. Before mid-1970s, NOI and SOI were weaker and out-phase. After<br />
mid-1970s, they were str<strong>on</strong>ger and in-phase. <str<strong>on</strong>g>The</str<strong>on</strong>g> lag-relati<strong>on</strong> revealed that SOI leaded Niño-3<br />
by about 7 m<strong>on</strong>ths, and NOI by 10 m<strong>on</strong>ths, the str<strong>on</strong>gest correlati<strong>on</strong> coefficients were weaker<br />
before mid-1970s. After mid-1970s, SOI leaded Niño-3 by 4 m<strong>on</strong>ths with str<strong>on</strong>ger correlati<strong>on</strong>,<br />
and the same as NOI. <str<strong>on</strong>g>The</str<strong>on</strong>g> l<strong>on</strong>g-term and the interdecadal variati<strong>on</strong>s of SOI and NOI may<br />
explain the interdecadal variati<strong>on</strong> of Niño-3.<br />
<str<strong>on</strong>g>The</str<strong>on</strong>g> Unsteadiness of NH Stati<strong>on</strong>ary Wave<br />
Speaker: Ning Shi<br />
Ning Shi<br />
NUIST<br />
shining0826@hotmail.com<br />
Wang Panxing<br />
NUIST<br />
In this paper, a c<strong>on</strong>cept of stati<strong>on</strong>ary wave unsteadiness is presented and elucidated in<br />
terms of the framework of Lorenz circulati<strong>on</strong> decompositi<strong>on</strong>, which illustrates the variability of<br />
z<strong>on</strong>al wave comp<strong>on</strong>ents of stati<strong>on</strong>ary wave relative to the intensity of stati<strong>on</strong>ary waves <strong>on</strong><br />
m<strong>on</strong>thly weather map. Based <strong>on</strong> the Lorenz circulati<strong>on</strong> decompositi<strong>on</strong> method, the degree of<br />
unsteadiness for the global (local) stati<strong>on</strong>ary wave is defined, and then used to analyze the<br />
stati<strong>on</strong>ary wave unsteadiness <strong>on</strong> the latitude band 30-60N, where the stati<strong>on</strong>ary wave intensity<br />
of northern hemisphere 500-mb geopotential height, as is well known, is significantly str<strong>on</strong>g.<br />
<str<strong>on</strong>g>The</str<strong>on</strong>g> following results are obtained: 1) <str<strong>on</strong>g>The</str<strong>on</strong>g> degree of unsteadiness characterizes the<br />
space-time variance of global stati<strong>on</strong>ary waves in 30-60N belt, and the locati<strong>on</strong> of unsteady<br />
belt advances southward and then retreats northward in the course of seas<strong>on</strong>al march. Steady<br />
54
stati<strong>on</strong>ary waves occur in mid-latitude band in winter and subtropical area in summer.<br />
Specifically, these are associated with the major troughs of East Asia, North America and a<br />
weaker Europe trough in winter and a relatively steady subtropical high system in summer. A<br />
high value center for the degree of unsteadiness appears at 35N in spring and 50N in summer,<br />
which might be caused by the interannual variati<strong>on</strong> of stati<strong>on</strong>ary waves, particularly variati<strong>on</strong>s<br />
in associati<strong>on</strong> with the strength and z<strong>on</strong>al migrati<strong>on</strong> of stati<strong>on</strong>ary waves. 2) <str<strong>on</strong>g>The</str<strong>on</strong>g> degree of<br />
unsteadiness for the local stati<strong>on</strong>ary wave clearly shows a z<strong>on</strong>al asymmetry. <str<strong>on</strong>g>The</str<strong>on</strong>g> steady<br />
z<strong>on</strong>es are always located in areas c<strong>on</strong>trolled by str<strong>on</strong>g troughs or ridges of stati<strong>on</strong>ary waves,<br />
whereas the unsteady <strong>on</strong>es are in the areas where the stati<strong>on</strong>ary wave intensity is weak. <str<strong>on</strong>g>The</str<strong>on</strong>g><br />
degree of unsteadiness for local stati<strong>on</strong>ary waves in the subtropics is str<strong>on</strong>ger in winter than in<br />
summer, and the reverse is true in the mid-latitude regi<strong>on</strong>. Over the local North American<br />
c<strong>on</strong>tinent, the degree of unsteadiness is slightly less than 1 in summer, indicating that the<br />
stati<strong>on</strong>ary wave in this regi<strong>on</strong> is more steady than that over other mid- and high latitude regi<strong>on</strong>.<br />
As a c<strong>on</strong>trast, North European is the most unsteady area for stati<strong>on</strong>ary wave, as represented<br />
by a high value of degree of unsteadiness locally, both in summer and winter. <str<strong>on</strong>g>The</str<strong>on</strong>g> summertime<br />
distributi<strong>on</strong> of degree of unsteadiness shows a rather complicated structure in overall. 3) From<br />
North <str<strong>on</strong>g>China</str<strong>on</strong>g> to the Northwest Pacific, there is a high value of degree of unsteadiness in<br />
summer, with its center located to the east of Heil<strong>on</strong>gjiang Province, which impacts northern<br />
part of <str<strong>on</strong>g>China</str<strong>on</strong>g> including Northeast <str<strong>on</strong>g>China</str<strong>on</strong>g>, North <str<strong>on</strong>g>China</str<strong>on</strong>g> and Northwest <str<strong>on</strong>g>China</str<strong>on</strong>g>. From the<br />
macroscopic point, it, therefore, can explain why these areas become a vulnerable climate<br />
z<strong>on</strong>e in summer. It is obviously that the degree of unsteadiness is an intrinsic characteristic of<br />
stati<strong>on</strong>ary waves, and it can be regarded as being of the same importance as the intensity and<br />
energy-spectrum structure of stati<strong>on</strong>ary waves for the study of the general circulati<strong>on</strong> system.<br />
Parallel Sessi<strong>on</strong>s:Climate Rec<strong>on</strong>structi<strong>on</strong><br />
On the loss or preservati<strong>on</strong> of externally forced climate variability in climate field<br />
rec<strong>on</strong>structi<strong>on</strong>s<br />
Speaker: Caspar M. Ammann<br />
Caspar M. Ammann<br />
NCAR<br />
ammann@ucar.edu<br />
Philippe Naveau<br />
Univ. of Colorado / LSCE<br />
Eugene R. Wahl<br />
Alfred Univ.<br />
Because future climate change will be str<strong>on</strong>gest at regi<strong>on</strong>al scales - in particular with<br />
regard to the hydrologic cycle, it is important that we understand how radiative forcing can<br />
55
affect climate variability at that spatial scale. An extended record is required for a cleaner<br />
separati<strong>on</strong> of naturally occurring variability from changes that are linked to the recent<br />
anthropogenic influence <strong>on</strong> climate. Additi<strong>on</strong>ally, to raise c<strong>on</strong>fidence in regi<strong>on</strong>al climate<br />
predicti<strong>on</strong>s, it is important to test if hypothesized links between forcings and resp<strong>on</strong>se are<br />
indeed systematic over time, and possibly even the same over multiple time scales. Climate<br />
field rec<strong>on</strong>structi<strong>on</strong>s (CFRs) based <strong>on</strong> high-resoluti<strong>on</strong> proxy networks provide a way of<br />
extending the often short instrumental record. Significant progress has been made in recent<br />
years in understanding the properties and skills of rec<strong>on</strong>structi<strong>on</strong>s <strong>on</strong> a global or hemispheric<br />
mean scale. In preparati<strong>on</strong> for assessments of future regi<strong>on</strong>al scale climate and its<br />
predictability, it is now crucial to investigate how much of regi<strong>on</strong>al climate is driven by external<br />
forcing and what comp<strong>on</strong>ents are simply due to internal, unforced variability. Solar activity<br />
changes over decadal to millennial time scales and short lived, interannual volcanic effects <strong>on</strong><br />
climate offer our <strong>on</strong>ly way of testing such links. Successful preservati<strong>on</strong> of the forced<br />
structures in climate resp<strong>on</strong>se to external forcing is therefore crucial, particularly given the fact<br />
that during the short calibrati<strong>on</strong> period natural forcing factors were c<strong>on</strong>founded by increasing<br />
anthropogenic disturbance. This c<strong>on</strong>tributi<strong>on</strong> employs coupled climate model output to test<br />
how much of externally forced climate signals are preserved in field rec<strong>on</strong>structi<strong>on</strong>s, and how<br />
much informati<strong>on</strong> could be lost or compromised by the short calibrati<strong>on</strong> or underlying<br />
assumpti<strong>on</strong>s of stati<strong>on</strong>arity.<br />
Rec<strong>on</strong>structi<strong>on</strong> of the Past 100-Year Weather Variati<strong>on</strong> in Europe<br />
Speaker: Youmin Chen<br />
Youmin Chen, Galina Churkina and Martin Heimann<br />
Max-Planck-Institute for Biogeochemistry<br />
ychen@bgc-jena.mpg.de<br />
<str<strong>on</strong>g>The</str<strong>on</strong>g> historical climate is rec<strong>on</strong>structed in the aspects of temperature, precipitati<strong>on</strong>,<br />
radiati<strong>on</strong>, humidity, vapor pressure deficit, and so <strong>on</strong>, which will be used for ecosystem<br />
modeling as the climate forcing. <str<strong>on</strong>g>The</str<strong>on</strong>g> daily variati<strong>on</strong>s are based <strong>on</strong> REMO daily dataset from<br />
1971 to 2000; the m<strong>on</strong>thly summaries are based <strong>on</strong> the CRU dataset from 1901 to 2002.<br />
Can<strong>on</strong>ical correlati<strong>on</strong> analysis (CCA) is used for m<strong>on</strong>thly anomaly rec<strong>on</strong>structi<strong>on</strong> from CRU to<br />
REMO datasets; and the weather generator-like technique is used for reproducing daily<br />
variability. We employ auto-regressi<strong>on</strong> method to generate time series based <strong>on</strong> the time<br />
coefficient of principle comp<strong>on</strong>ent (PC) so that spatial relati<strong>on</strong>ship between spatial grids and<br />
different variables will be preserved through PC projecti<strong>on</strong>. One of the augments is the<br />
selecti<strong>on</strong> of the distributi<strong>on</strong> of the random number, which is expected to have the similar<br />
distributi<strong>on</strong> as the residuals after the auto-regressi<strong>on</strong> estimati<strong>on</strong>. <str<strong>on</strong>g>The</str<strong>on</strong>g> rec<strong>on</strong>structi<strong>on</strong> result has<br />
the characters that m<strong>on</strong>thly data is c<strong>on</strong>sistent with CRU dataset and daily variability is<br />
c<strong>on</strong>sistent with REMO dataset; and that the relati<strong>on</strong>ships between grids and variables are<br />
preserved. That is obviously important for rec<strong>on</strong>structi<strong>on</strong> of the variables in a specific domain,<br />
as the ecosystem modeling often required.<br />
56
A multiple surrogate data study of rec<strong>on</strong>structi<strong>on</strong> skills<br />
Speaker: Bo Christiansen<br />
Bo Christiansen<br />
Danish Meteorological Institute<br />
boc@dmi.dk<br />
Torben Schmith<br />
Danish Meteorological Institute<br />
Peter <str<strong>on</strong>g>The</str<strong>on</strong>g>jll<br />
Danish Meteorological Institute<br />
Rec<strong>on</strong>structi<strong>on</strong> methods may differ in many details but they basically rely <strong>on</strong> a statistical<br />
relati<strong>on</strong>ship between proxy data and observati<strong>on</strong>s. However, the statistical properties and<br />
robustness of such methods are not well known which has led to the current vivid discussi<strong>on</strong><br />
about the quality of published rec<strong>on</strong>structi<strong>on</strong>s. Of particular c<strong>on</strong>cern has been the methods'<br />
ability to catch low frequency variability.<br />
In this paper we will present a systematic study of rec<strong>on</strong>structi<strong>on</strong> methods. <str<strong>on</strong>g>The</str<strong>on</strong>g> methods<br />
include both global-mean rec<strong>on</strong>structi<strong>on</strong>s, field rec<strong>on</strong>structi<strong>on</strong>s based <strong>on</strong> Principal<br />
Comp<strong>on</strong>ents and Can<strong>on</strong>ical Correlati<strong>on</strong> Analysis, and the regularized EM algorithm.<br />
Based <strong>on</strong> a climate simulati<strong>on</strong> of the period AD 1500-2000 with the ECHAM4/OPYC3<br />
Ocean-Atmosphere General Circulati<strong>on</strong> Model we use a novel technique to generate an<br />
ensemble of surrogate fields with the same temporal and spatial characteristics as the original<br />
modelled surface temperature field. This technique also allows us to c<strong>on</strong>trol the strength of the<br />
decadal-multidecadal variability in the surrogate fields. We apply the rec<strong>on</strong>structi<strong>on</strong> methods<br />
to each member of the ensemble of surrogate worlds: we train the rec<strong>on</strong>structi<strong>on</strong> method <strong>on</strong> a<br />
subperiod (defining the set of surrogate proxies by degrading a number of gridbox timeseries)<br />
and rec<strong>on</strong>struct the remaining years. <str<strong>on</strong>g>The</str<strong>on</strong>g> multi-world approach will allow us to make statistical<br />
robust estimates both of the mean properties of the different rec<strong>on</strong>structi<strong>on</strong> methods and their<br />
statistical variance and significance.<br />
Meiyu since 1736 over Middle-Lower Reaches of Yangtze River<br />
Speaker: Quansheng Ge<br />
Quansheng Ge<br />
Institute of Geographical Sciences and Natural Resources Researches, CAS<br />
geqs@igsnrr.ac.cn<br />
Jingyun Zheng<br />
Institute of Geographical Sciences and Natural Resources Researches, CAS<br />
Zhixin Hao<br />
Institute of Geographical Sciences and Natural Resources Researches, CAS<br />
57
<str<strong>on</strong>g>The</str<strong>on</strong>g> Starting and Ending dates, the length series and precipitati<strong>on</strong> of Meiyu were<br />
rec<strong>on</strong>structed in the Middle-Lower Reaches of Yangtze River during 1736-1911, using Yu<br />
(rainfall)-Xue (snowfall)-Fen (approximately 0.32cm)-Cun (approximately 3.2cm) records in the<br />
Qing dynasty, based <strong>on</strong> the climatic feature of Meiyu. And the Meiyu characteristics were<br />
analyzed since 1736, joint with instrumental precipitati<strong>on</strong> data. <str<strong>on</strong>g>The</str<strong>on</strong>g> strength of the East Asian<br />
Summer M<strong>on</strong>so<strong>on</strong> (EASM) and related rainband locati<strong>on</strong> were speculated, based <strong>on</strong> the<br />
relati<strong>on</strong>ship between the length of Meiyu and the index of the EASM. <str<strong>on</strong>g>The</str<strong>on</strong>g> results shows that:<br />
<str<strong>on</strong>g>The</str<strong>on</strong>g> starting and ending dates and the length of Meiyu all have significant annual-decadal<br />
change, particularly, the length of Meiyu has inter-decadal variati<strong>on</strong>s with 20-30 year and 40<br />
year, and century scale variati<strong>on</strong>, except for the inter-annual variati<strong>on</strong> with 2 years and 7-8<br />
year. <str<strong>on</strong>g>The</str<strong>on</strong>g> periods of 1736-1770, 1821-1870, 1921-1970 are characterized by the shorter<br />
length of Meiyu, str<strong>on</strong>g EASM, and the rainband related to EASM is located in the North <str<strong>on</strong>g>China</str<strong>on</strong>g><br />
and South <str<strong>on</strong>g>China</str<strong>on</strong>g>, but the periods of 1771-1820, 1871-1920 and 1971-2000 are characterized<br />
by the l<strong>on</strong>ger length of Meiyu, weak EASM, and the rainband is located in the Middle-Lower<br />
Reaches of Yangtze River easily.<br />
Coherence of climatic rec<strong>on</strong>structi<strong>on</strong> from historical documents in <str<strong>on</strong>g>China</str<strong>on</strong>g> by different studies<br />
Speaker: Quansheng Ge<br />
Quansheng Ge<br />
Institute of Geographical Sciences and Natural Resources Researches, CAS<br />
geqs@igsnrr.ac.cn<br />
Jingyun Zheng<br />
Institute of Geographical Sciences and Natural Resources Researches, CAS<br />
Yanyu Tian<br />
Institute of Geographical Sciences and Natural Resources Researches, CAS<br />
Much effort has been spent in the last few decades to rec<strong>on</strong>struct the climate over <str<strong>on</strong>g>China</str<strong>on</strong>g><br />
using a variety of historical documents. However, the results are not always the same. To<br />
address the quality of the rec<strong>on</strong>structi<strong>on</strong> work,the coherence of 14 rec<strong>on</strong>structed temperature<br />
series, which are derived from historical documents by different studies,is expounded. And the<br />
comparis<strong>on</strong> between the rec<strong>on</strong>structed temperature series derived from historical documents<br />
and natural archives is also c<strong>on</strong>ducted. It is found that the temperature series by different<br />
studies are highly correlated. <str<strong>on</strong>g>The</str<strong>on</strong>g> closer the rec<strong>on</strong>structed regi<strong>on</strong>s are, the higher their relati<strong>on</strong><br />
is, which suggests that the regi<strong>on</strong>al differences of climate change are resp<strong>on</strong>sible for the<br />
differences of rec<strong>on</strong>structed temperature series. And the 30-year temporal resoluti<strong>on</strong> might be<br />
reas<strong>on</strong>able for temperature change study by using Chinese historical documentary data. <str<strong>on</strong>g>The</str<strong>on</strong>g><br />
similarity between the results based <strong>on</strong> historical records and natural evidence is also<br />
dem<strong>on</strong>strated. On the basis of the validati<strong>on</strong> of the rec<strong>on</strong>structi<strong>on</strong> work with historical<br />
documents, the synthesized temperature series for last 500 and 1000 years are achieved.<br />
58
Linear and n<strong>on</strong>-linear rec<strong>on</strong>structi<strong>on</strong> from tree-ring series and written documents and the<br />
problem of low frequencies and missing data<br />
Speaker: Guiot, Joel<br />
Guiot, Joel<br />
CEREGE CNRS, Aix-en-Provence, France<br />
guiot@cerege.fr<br />
Nicault, Antoine<br />
CEN, University of Laval, Quebec, Canada<br />
Climatic rec<strong>on</strong>structi<strong>on</strong>s for the last millennium based <strong>on</strong> l<strong>on</strong>g tree-ring series and, when<br />
available, <strong>on</strong> historical written documents, have several crucial problems related, to the<br />
calibrati<strong>on</strong> (linear or n<strong>on</strong>-linear methods, stati<strong>on</strong>arity and range of the climatic variable), the<br />
validati<strong>on</strong> of the estimates (availability of independent data, method), the variability amplitude<br />
of the extrapolati<strong>on</strong> and the low frequency comp<strong>on</strong>ent of the rec<strong>on</strong>structed signal. Various<br />
methods have been proposed as well for the pre-processing of the low frequency comp<strong>on</strong>ent<br />
of the tree-ring series (standardizati<strong>on</strong>) than for the calibrati<strong>on</strong> method or the post-processing<br />
of the rec<strong>on</strong>structi<strong>on</strong>s. We illustrate our discussi<strong>on</strong> with examples taken from our own works<br />
(rec<strong>on</strong>structi<strong>on</strong> of temperature in Europe and summer PDSI in the Mediterranean regi<strong>on</strong>) that<br />
we compare with approaches found in the recent literature (Mann et al, 2005; Rutherford et al,<br />
2005; Burger et al, 2006 …). We will propose some soluti<strong>on</strong>s for the various problems pointed<br />
out. So n<strong>on</strong> linear calibrati<strong>on</strong> techniques such as analogues methods and artificial neural<br />
network are useful for rec<strong>on</strong>structing the full range of the climatic variables and to perform in<br />
presence of missing data (it is compared to the regularized expectati<strong>on</strong> maximizati<strong>on</strong> (RegEM)<br />
method). A combinati<strong>on</strong> of cross-validati<strong>on</strong> and bootstrap technique is useful for a robust<br />
validati<strong>on</strong>. <str<strong>on</strong>g>The</str<strong>on</strong>g> treatment of the tree-ring series trend by using a flexible regi<strong>on</strong>al growth curve<br />
is also a good soluti<strong>on</strong> for saving low frequencies in the rec<strong>on</strong>structed climatic series. Finally<br />
we propose that, in the future, the use of inverted process models is an integrated approach<br />
able to deal with most of the problems discussed in the talk.<br />
<str<strong>on</strong>g>The</str<strong>on</strong>g> 'Hockey Stick' and the 1990s: A Statistical Perspective <strong>on</strong> Rec<strong>on</strong>structing Hemispheric<br />
Temperatures<br />
Speaker: Bo Li<br />
Bo Li<br />
Nati<strong>on</strong>al Center for Atmospheric Research<br />
boli@ucar.edu<br />
Douglas W. Nychka<br />
Nati<strong>on</strong>al Center for Atmospheric Research<br />
Caspar M. Ammann<br />
59
Nati<strong>on</strong>al Center for Atmospheric Research<br />
<str<strong>on</strong>g>The</str<strong>on</strong>g> short instrumental record of about 100-150 years forces us to use proxy indicators<br />
to study climate over l<strong>on</strong>g time scales. <str<strong>on</strong>g>The</str<strong>on</strong>g> climate informati<strong>on</strong> in these indirect data is<br />
embedded in c<strong>on</strong>siderable noise, and the past temperature rec<strong>on</strong>structi<strong>on</strong>s are therefore full of<br />
uncertainty, which blurs the understanding of the temperature evoluti<strong>on</strong>. To date, the<br />
characterizati<strong>on</strong> and quantificati<strong>on</strong> of uncertainty have not been a high priority in<br />
rec<strong>on</strong>structi<strong>on</strong> procedures. Here we propose a new statistical methodology to explicitly<br />
account for three types of uncertainties in the rec<strong>on</strong>structi<strong>on</strong> process. Via ensemble<br />
rec<strong>on</strong>structi<strong>on</strong>, we directly obtain the distributi<strong>on</strong> of decadal maximum as well as annual<br />
maximum. Our method is an integrati<strong>on</strong> of linear regressi<strong>on</strong>, bootstraping and cross-validati<strong>on</strong><br />
techniques, and it 1) accounts for the effects of temporal correlati<strong>on</strong> of temperature; 2)<br />
identifies the variability of the estimated statistical model; and 3) adjusts the effects of potential<br />
overfitting. We apply our method to the Northern Hemisphere (NH) average temperature<br />
rec<strong>on</strong>structi<strong>on</strong>. Our results indicate that the recent decadal temperature increase is rapidly<br />
overwhelming previous maxima, even with uncertainty taken into account, and the last decade<br />
is highly likely to be the warmest in the last millennium.<br />
Dec<strong>on</strong>structing Rec<strong>on</strong>structi<strong>on</strong><br />
Speaker: Matthew R. Schofield<br />
Matthew R. Schofield<br />
University of Otago<br />
Richard J. Barker<br />
University of Otago<br />
<str<strong>on</strong>g>The</str<strong>on</strong>g> study of climatological data is inhibited by the availability of data. Inference about<br />
the climate over the past hundreds or thousands of years cannot be based <strong>on</strong> direct<br />
observati<strong>on</strong>s, which are <strong>on</strong>ly available for the past century or two. To obviate this problem<br />
proxies with many more observati<strong>on</strong>s, such as isotopes, tree rings and ice cores are used to<br />
predict the past climate.<br />
Using tree rings as an example, we stress the importance of modeling the unobserved<br />
climate process in terms of a selecti<strong>on</strong> of scientifically driven pre-specified models. <str<strong>on</strong>g>The</str<strong>on</strong>g><br />
methods we suggest allow all uncertainty to be explicitly included in the model, which may<br />
substantially effect the c<strong>on</strong>clusi<strong>on</strong>s obtained. If time permits, an example will be given.<br />
60
Pseudo-proxy tests of the regularized expectati<strong>on</strong> maximizati<strong>on</strong> (RegEM) method and their<br />
implicati<strong>on</strong>s for real-world climate field rec<strong>on</strong>structi<strong>on</strong>s of the last millennium<br />
Speaker: Jas<strong>on</strong> E. Smerd<strong>on</strong><br />
Jas<strong>on</strong> E. Smerd<strong>on</strong><br />
Lam<strong>on</strong>t-Doherty Earth Observatory of Columbia University<br />
jsmerd<strong>on</strong>@ldeo.columbia.edu<br />
Alexey Kaplan<br />
Lam<strong>on</strong>t-Doherty Earth Observatory of Columbia University<br />
Several pseudo-proxy tests of the regularized expectati<strong>on</strong> maximizati<strong>on</strong> (RegEM)<br />
method are now documented in the literature. <str<strong>on</strong>g>The</str<strong>on</strong>g> differences in current applicati<strong>on</strong>s hinge <strong>on</strong><br />
the regularizati<strong>on</strong> method used within the RegEM algorithm to estimate the regressi<strong>on</strong><br />
coefficients and error covariance of the linear regressi<strong>on</strong> model. We test several of these<br />
regularizati<strong>on</strong> methods using pseudo-proxy networks from millennial integrati<strong>on</strong>s of the GKSS<br />
ECHO-G and the NCAR CSM General Circulati<strong>on</strong> Models (GCMs). We dem<strong>on</strong>strate that <strong>on</strong>e<br />
form of RegEM using ridge regressi<strong>on</strong> is sensitive to the chosen standardizati<strong>on</strong> interval of<br />
instrumental and proxy data. Previous tests of this method that used output from the CSM<br />
millennial integrati<strong>on</strong> standardized the data matrix using informati<strong>on</strong> prior to the instrumental<br />
period. <str<strong>on</strong>g>The</str<strong>on</strong>g> inclusi<strong>on</strong> of such informati<strong>on</strong> yields rec<strong>on</strong>structi<strong>on</strong>s with minimal systematic biases,<br />
but the approach makes such pseudo-proxy tests irrelevant for real-world applicati<strong>on</strong>s. RegEM<br />
rec<strong>on</strong>structi<strong>on</strong>s using ridge regressi<strong>on</strong> and standardizati<strong>on</strong>s c<strong>on</strong>fined to the instrumental<br />
period yield warm biases and variance losses at low frequencies in both ECHO-G and CSM<br />
pseudo-proxy tests. We further explore additi<strong>on</strong>al regularizati<strong>on</strong> schemes in RegEM, as they<br />
are related to published approaches. We explore selecti<strong>on</strong> criteria for regularizati<strong>on</strong><br />
parameters and test the performance of derived rec<strong>on</strong>structi<strong>on</strong>s in terms of their ability to<br />
reproduce hemispheric averages and spatial variability. Results indicate a more nuanced<br />
interpretati<strong>on</strong> of the RegEM method than what is currently presented in the literature, as well<br />
as the need for a more systematic evaluati<strong>on</strong> of the method.<br />
North western temperature during S<strong>on</strong>g and Yuan Dynasty (960-1368AD) in <str<strong>on</strong>g>China</str<strong>on</strong>g><br />
Speaker: Jingyun Zheng<br />
Jingyun Zheng<br />
Institute of Geographical Sciences and Natural Resources Researches, CAS<br />
zhengjy@igsnrr.ac.cn<br />
Zhixin Hao<br />
Institute of Geographical Sciences and Natural Resources Researches, CAS<br />
61
<str<strong>on</strong>g>The</str<strong>on</strong>g> extent of the Medieval Warm Period (MWP) from 900AD to 1300AD, was occurred in<br />
the periods of Wudai-S<strong>on</strong>g-Yuan Dynasty, when the temperature is warm as Holocene<br />
Megathermal in many parts of the worlds. Although the exact timing and durati<strong>on</strong> of warm<br />
periods may have varied from regi<strong>on</strong> to regi<strong>on</strong>, the relatively warm c<strong>on</strong>diti<strong>on</strong>s during MWP<br />
have been generally accepted by the climatologist. For example, Chinese scholars have been<br />
studied the magnitude and timing for MWP by the historical documentary evidence of<br />
ph<strong>on</strong>ological events and cold/warm records, the results were expressed that the 930-1310<br />
was warming, and particularly in the periods of 930s-1100s and 1200s-1310s, the temperature<br />
may have passed the 20 century warming. However, the temperature rec<strong>on</strong>structi<strong>on</strong> in North<br />
Western of <str<strong>on</strong>g>China</str<strong>on</strong>g> from the evidences of tree-ring, ice core and lake sediment showed<br />
inc<strong>on</strong>sistent results with Eastern <str<strong>on</strong>g>China</str<strong>on</strong>g> for MWP, which includes the surface temperature<br />
rec<strong>on</strong>structi<strong>on</strong> <strong>on</strong>ly reached the mean value and no significant MWP, even the periods of<br />
1000-1050, 1150-1350 were cooling placed in the past 1000 years; and the timing with<br />
1200-1400 was behind 300 years than Eastern <str<strong>on</strong>g>China</str<strong>on</strong>g>.<br />
Here, we analyzed the cold/warm magnitude, and calculated the temperature in North<br />
western, covering Gansu, Shanxi, Ningxia and part of Henan, based the evidence of the<br />
abnormal snow and frost records, to assess the temperature level during the past 1000 years.<br />
<str<strong>on</strong>g>The</str<strong>on</strong>g> results showed that the temperature has three obvious stages during 960~1368, which<br />
included the 962-1110 cooling, the1111-1260 warming, and the 1260-1368 cooling lower than<br />
962-1110. And <strong>on</strong>ly the cooling event of the last stage, 1260-1368 was compatible with the<br />
trend in Eastern <str<strong>on</strong>g>China</str<strong>on</strong>g>.<br />
Underlying dynamics of glacial millennial-scale climate transiti<strong>on</strong>s derived from<br />
ice-core data<br />
Speaker: Frank Kwasniok<br />
Frank Kwasniok<br />
University of Exeter, United Kingdom<br />
Gerrit Lohmann<br />
Alfred Wegener Institute for Polar and Marine Research, Bremerhaven, Germany<br />
A method for systematically deriving simple n<strong>on</strong>linear dynamical models from ice-core<br />
data is proposed. It offers a tool to integrate models and theories with paleoclimatic data. <str<strong>on</strong>g>The</str<strong>on</strong>g><br />
method is based <strong>on</strong> the unscented Kalman filter, a n<strong>on</strong>linear extensi<strong>on</strong> of the c<strong>on</strong>venti<strong>on</strong>al<br />
Kalman filter. Here, we adopt the c<strong>on</strong>ceptual model of stochastically driven moti<strong>on</strong> in a<br />
potential that allows for two distinctly different states. <str<strong>on</strong>g>The</str<strong>on</strong>g> parameters of the model, that is, the<br />
shape of the potential and the noise strength are estimated from a Greenland ice-core record.<br />
<str<strong>on</strong>g>The</str<strong>on</strong>g> data reveal that during glacial times the potential is asymmetric and degenerate: there is<br />
<strong>on</strong>e stable cold stadial state and <strong>on</strong>e indifferently stable warm interstadial state<br />
62
Parallel Sessi<strong>on</strong>s:Regi<strong>on</strong>al Studies<br />
Spatio-Temporal Variability of the Sea Surface Temperature of the Gulf of Guinea and Its<br />
Implicati<strong>on</strong> for Coastal Precitati<strong>on</strong> in Nigeria<br />
Speaker: Ediang Okuku Archib<strong>on</strong>g<br />
Ediang Okuku Archib<strong>on</strong>g.<br />
World Maritime University, Malmo, Sweden<br />
Dr.T.Odekunle<br />
Department of Geography Obafemi Awolowo University, Ile-Ife, Nigeria<br />
A.O Eludoyin<br />
Department of Geography Obafemi Awolowo University, Ile-Ife, Nigeria<br />
A.A Ediang<br />
World Maritime University, Malmo Sweden<br />
This study described and discussed the spatio-temporal variability of the sea surface<br />
temperature (SST) of the Gulf of Guinea and its implicati<strong>on</strong> for the coastal precipitati<strong>on</strong> in<br />
Nigeria between 1950 and 1998. <str<strong>on</strong>g>The</str<strong>on</strong>g> specific objectives of the study include: (a) examining<br />
the spatio-temporal variability in the mean annual sea surface temperature over the Gulf of<br />
Guinea between 1950 and 1998; (b) examining the spatio-temporal variability in the mean<br />
mid-summer (July, August and September) sea surface temperature over the Gulf of Guinea<br />
between 1950 and 1998; (c) identifying the areas of the Gulf of Guinea in which the sea<br />
surface temperature is below the latitudinal average over the period of study; (d) identifying the<br />
areas of the Gulf of Guinea in which the sea surface temperature temporal variability is above<br />
the latitudinal average over the period of study; and (e) discussing the implicati<strong>on</strong>s of the<br />
pattern of the variability of the sea surface temperature in the Gulf of Guinea for coastal<br />
precipitati<strong>on</strong> in Nigeria. <str<strong>on</strong>g>The</str<strong>on</strong>g> data used for the study are the mean m<strong>on</strong>thly SST at specific<br />
locati<strong>on</strong>s in the Gulf of Guinea. <str<strong>on</strong>g>The</str<strong>on</strong>g> data were obtained from the <str<strong>on</strong>g>Internati<strong>on</strong>al</str<strong>on</strong>g> Research<br />
Institute for Climate Predicti<strong>on</strong>. <str<strong>on</strong>g>The</str<strong>on</strong>g> specific locati<strong>on</strong>s where data were collected to represent<br />
the Gulf of Guinea are L<strong>on</strong>gitudes 100W, 80W, 60W, 40W, 20W, 00, 20E, 40E, 60E, and 80E<br />
and Latitudes 50N, 30N, 10N, 10S, 30S, and 50S.<br />
<str<strong>on</strong>g>The</str<strong>on</strong>g> statistical analytical procedures employed to summarise and make inferences <strong>on</strong> the<br />
data include: (a) K-means cluster analyses; (b) Coefficient of variati<strong>on</strong>; and (c) Integrated Land<br />
and Water Informati<strong>on</strong> System (ILWIS) software (versi<strong>on</strong> 3.2 Academic). <str<strong>on</strong>g>The</str<strong>on</strong>g> K-means cluster<br />
analysis was employed to classify the SST into groups. <str<strong>on</strong>g>The</str<strong>on</strong>g> coefficient of variati<strong>on</strong> was used to<br />
determine the degree of the SST variability over time, while the ILWIS was employed to map<br />
the spatio-temporal variability in the SST.<br />
Results from the study reveal that the SST of the Gulf of Guinea is generally colder<br />
between L<strong>on</strong>gitudes 80W and 20E. <str<strong>on</strong>g>The</str<strong>on</strong>g> temperature anomaly which appears most noticeable<br />
during the m<strong>on</strong>ths of July-August-September is also discernible in the average annual pattern.<br />
This area of the SST anomaly was also observed to experience the greatest inter-annual<br />
variability l<strong>on</strong>gitudinally. <str<strong>on</strong>g>The</str<strong>on</strong>g> results also show that while SST generally decreases from the<br />
north to the south and from east to the west, variability value generally increases from the<br />
63
north to the south and from east to the west. <str<strong>on</strong>g>The</str<strong>on</strong>g> observati<strong>on</strong> thus shows that the areas of<br />
relatively colder SST are those having the higher variability values.<br />
<str<strong>on</strong>g>The</str<strong>on</strong>g> study c<strong>on</strong>cluded by noting that, although the inter-annual variability in the SST of the<br />
Gulf of Guinea as observed in this study, is generally low, it appears to greatly perturb the<br />
rainfall-producing systems of West Africa in general and Nigeria in particular. Its most<br />
prominent effects are: (i) the chilling effect at the coast-thereby acquiring negative buoyancy,<br />
and later the warming over the land (which at this time of the year is warmer than the sea) -<br />
thus acquiring positive buoyancy to effect c<strong>on</strong>vecti<strong>on</strong> at some distance inland; (ii) the<br />
southwesterlies are strengthened by the upwelling effect of the ocean water in the Gulf of<br />
Guinea (i.e. localized high pressure offshore). This is believed to inhibit precipitati<strong>on</strong> around<br />
the coastal area; and (iii) the static stability, brought about by colder SST in the Gulf of Guinea<br />
that prevent the development of c<strong>on</strong>vecti<strong>on</strong> and thus resp<strong>on</strong>sible for the ‘little dry seas<strong>on</strong>’ in<br />
southwestern Nigeria during the m<strong>on</strong>ths of July-August-September.<br />
<str<strong>on</strong>g>The</str<strong>on</strong>g> impact of climate change <strong>on</strong> frost occurrences across the Murray-Darling Basin<br />
Speaker: B. Timbal<br />
B. Timbal<br />
Bureau of Meteorological Research Centre<br />
This study focuses <strong>on</strong> quantifying both the effect of mean and variance changes in the<br />
impact of climate change <strong>on</strong> extremes, looking at <strong>on</strong>e particular case. <str<strong>on</strong>g>The</str<strong>on</strong>g> area of interest is<br />
the Murray-Darling Basin, which is covered by an important network of climate stati<strong>on</strong>s with<br />
l<strong>on</strong>g daily records. This is an important agricultural area str<strong>on</strong>gly impacted by frost.<br />
Furthermore, frost occurrences are observed during winter m<strong>on</strong>ths with a frequency from 30%<br />
in the mountainous South-East to less than 1% in the North and Western part of the basin. In<br />
order to study the combined effect of the mean warming and variance effect, estimates of the<br />
mean warming for minimal temperatures are derived from Direct model outputs (DMO) using<br />
climate model simulati<strong>on</strong>s archived in the IPCC AR4 database, using differences between<br />
simulati<strong>on</strong> of the climate of the 20th century and of the 21st century forced with different<br />
emissi<strong>on</strong> scenarios. <str<strong>on</strong>g>The</str<strong>on</strong>g> mean anomalies are applied to observed series and compared with<br />
results obtained using a downscaling technique developed for daily temperature extremes<br />
(Tmin and Tmax) in the regi<strong>on</strong> and applied to the same IPCC AR4 simulati<strong>on</strong>s. In this study,<br />
the DMO and downscaled temperature series estimate of frost occurrences for the current<br />
climate are compared to evaluate the benefits of using a statistical downscaling method for<br />
local climate extremes. Furthermore, the impact of emissi<strong>on</strong>s scenarios <strong>on</strong> frost occurrences<br />
are compared between DMO and downscaled series to evaluate the importance of<br />
reproducing the observed probability density functi<strong>on</strong> of local temperature in order to infer<br />
future changes for climate extremes. Finally, the c<strong>on</strong>tributi<strong>on</strong> of the mean and variance effect<br />
across the range of climate simulati<strong>on</strong>s is assessed and the importance of the variance effect<br />
is evaluated.<br />
64
Iterative Interpolati<strong>on</strong> of Daily Precipitati<strong>on</strong> Data for Alberta, Canada<br />
Speaker: QINGFANG DAI<br />
QINGFANG DAI<br />
Department of Mathematical and Statistical Sciences, University of Alberta<br />
qdai@math.ualberta.ca<br />
Samuel S.P. Shen<br />
Department of Mathematics and Statistics, San Diego State University<br />
Climate physics shows that topographic precipitati<strong>on</strong> is related to atmospheric<br />
circulati<strong>on</strong> patterns and climate dynamics. <str<strong>on</strong>g>The</str<strong>on</strong>g>se patterns may be reflected statistically by<br />
empirical orthog<strong>on</strong>al functi<strong>on</strong>s (EOFs). In this research, we take the elevati<strong>on</strong>s into account<br />
and use EOF-interpolati<strong>on</strong> method to develop Hybrid 2.0, the next generati<strong>on</strong> of hybrid<br />
interpolati<strong>on</strong> method based <strong>on</strong> the initial data derived from Hybrid 1.0. <str<strong>on</strong>g>The</str<strong>on</strong>g> method to be<br />
developed will first calculate a climatology surface as the mean of 1961-1990 data. Climate<br />
anomalies will be interpolated by EOF-interpolati<strong>on</strong> to retain the spatial variance. Finally, the<br />
nearest-stati<strong>on</strong> regressi<strong>on</strong> will be applied to retain the temporal variance. With this developed<br />
method, we interpolate daily precipitati<strong>on</strong> data <strong>on</strong>to grids for Alberta, Canada. <str<strong>on</strong>g>The</str<strong>on</strong>g> accuracy of<br />
the final result of Hybrid 2.0 is assessed with cross-validati<strong>on</strong> and compared to that of Hybrid<br />
1.0.<br />
Recent Rainfall Trends in Agro-Ecological Z<strong>on</strong>es of Zambia<br />
Speaker: Suman Jain<br />
Suman Jain<br />
University of Zambia<br />
sjain@natsci.unza.zm<br />
Agriculture sector c<strong>on</strong>tributes approximately 15% to Zambia's GDP. About 80% of<br />
farming households in Zambia are subsistence farmers who depend <strong>on</strong> rains for crop<br />
producti<strong>on</strong>. In recent years, significant rainfall deficits at critical stages of crop growth have<br />
frequently led to serious shortfalls in crop producti<strong>on</strong>. This paper attempts to characterize the<br />
nature of drought in Zambia.<br />
40 years(1960-2000) of daily rainfall data obtained from selected stati<strong>on</strong>s of the<br />
Department of Meteorological services of Zambia have been classified in the following classes:<br />
class1 (0-0.5mm), class2(0.5-5mm), class3 (5-10mm), class4 (10-25mm)and class5 (>25mm).<br />
Trend analysis is d<strong>on</strong>e for (i) annual number of days in each of the classes from 2 to 5 (ii)<br />
annual number of rainfall days (sum of days in classes 2 to 5) (iii) annual rainfall amounts for<br />
65
the Agro_ecological z<strong>on</strong>es of Zambia. <str<strong>on</strong>g>The</str<strong>on</strong>g> analysis shows that in Agro-ecological z<strong>on</strong>e 1, low<br />
intensity rainfall events are increaing and intense rainfall events are decreasing. In<br />
Agro-ecological z<strong>on</strong>e 2 low and moderate rain events are decreasing and intense rain events<br />
are increasing. <str<strong>on</strong>g>The</str<strong>on</strong>g> annual rain events in Agro-ecological z<strong>on</strong>e 1 are increasing at the rate of<br />
0.629 events/year and decreasing in Agro-ecological z<strong>on</strong>e 2 at the rate of 0.33 events/year.<br />
<str<strong>on</strong>g>The</str<strong>on</strong>g> annual rainfall amounts in Agro-ecological z<strong>on</strong>e 1 and 2 are decreasing at the rate of<br />
1.038 and 3.269 mm/ year respectively.<br />
Variability of Rainfall in C<strong>on</strong>necti<strong>on</strong> with the 3 - 5-Day Wave in Northern Africa in summer<br />
Speaker: David MONKAM<br />
David MONKAM<br />
Department of Physics, Faculty of Science, University of Douala, P.O.Box: 24157 Douala - Camero<strong>on</strong><br />
m<strong>on</strong>kam1@yahoo.fr<br />
A composite method is used to determine the spatial pattern of the westward propagating<br />
3 - 5-day waves and the associated rainfall anomalies in northern Africa in summer,<br />
throughout the period 1981-90. <str<strong>on</strong>g>The</str<strong>on</strong>g> rainfall anomalies increasing (decreasing) is associated<br />
with the cycl<strong>on</strong>ic (anticycl<strong>on</strong>ic) circulati<strong>on</strong> and negative (positive) geopotential height<br />
anomalies. <str<strong>on</strong>g>The</str<strong>on</strong>g> waves increase rainfall in the band of latitudes 7.5°- 15°, around the ZCIT<br />
mean positi<strong>on</strong> in summer, with a maximum near the Fouta-Djall<strong>on</strong> in Guinea and decrease<br />
rainfall north of 15° and south of 7.5°. <str<strong>on</strong>g>The</str<strong>on</strong>g> rainfall anomalies increasing or decreasing depends<br />
<strong>on</strong> the waves activities. For example in 1981 where the waves were active, the rainfall<br />
anomalies composited were positive in the whole studied area, with str<strong>on</strong>g values while in<br />
1982 and 1983 where they were weak, the rainfall anomalies composited were negative south<br />
of 10°.<br />
C<strong>on</strong>siderati<strong>on</strong> of Drought at the Aji-chai Basin<br />
Speaker: Davoud Naghizadeh<br />
Davoud Naghizadeh<br />
Head of Radjan Ab C<strong>on</strong>sulting Engineers Co.<br />
d_n_raz2006@yahoo.com<br />
Mr. Rostamzadeh<br />
(PHD Student of physical Geography, University of Tabriz, Iran)<br />
Masumeh KHalkhali<br />
(Master of physical Geography, University of Tabriz, Iran)<br />
Climatic change is <strong>on</strong>e of the natural characteristic of the atmospheric cycle that causes<br />
abnormality and fluctuati<strong>on</strong>s in the trend of climatic parameters such as precipitati<strong>on</strong> and heat.<br />
Atmospheric abnormalities are very intensive in the most parts of the world and resulting<br />
66
disturbance in the natural ecosystems. Droughts are the symbols of climatic changes and are<br />
accounting as natural damages affecting the human life and ther living creatures.<br />
In this study climatological drought at the Aji-chai basin was studied using SPI index. For<br />
this propose climatalogical data of the selected stati<strong>on</strong>s (Tabriz, Ahar, Sarab, Bostanabad<br />
Ligvan) were used to study drought c<strong>on</strong>diti<strong>on</strong>s for 3, 6 and 12 m<strong>on</strong>ths time periods, the results<br />
shows that drought are appearing in the short time periods with short time durati<strong>on</strong> but<br />
l<strong>on</strong>gtime droughts are also have the l<strong>on</strong>gtime durati<strong>on</strong>s.<br />
In the Aji-chai basin the number of short time droughts are more than l<strong>on</strong>gtime. Ones in<br />
which durati<strong>on</strong> of the l<strong>on</strong>gtime droughts comparing with short time droughts are more. All of<br />
the selected stati<strong>on</strong>s are facing to 3, 6 and 12 m<strong>on</strong>ths gentle to moderate droughts and there<br />
are no intensive or very intensive drought in the studied stati<strong>on</strong>s.<br />
Keywords: Drought, Ajichai, SPI, GIS.<br />
<str<strong>on</strong>g>The</str<strong>on</strong>g> quantitative survey of drought effects <strong>on</strong> the barley yield in Eastern Azarbayjan by classical<br />
statistical ways<br />
Speaker: Elham Rahmani<br />
Elham Rahmani<br />
Tehran University<br />
Elhamrahmani1382@yahoo.com<br />
Abdolmajid Liaghat<br />
Tehran University<br />
Ali Khalili<br />
Tehran University<br />
<str<strong>on</strong>g>The</str<strong>on</strong>g> growing seas<strong>on</strong> climatic parameters; especially, rainfall plays the main role to<br />
predict the yield producti<strong>on</strong>. <str<strong>on</strong>g>The</str<strong>on</strong>g>refore the main objective of this research was to find out some<br />
possible relati<strong>on</strong>s am<strong>on</strong>g meteorology parameters and drought indexes with the yield using<br />
classical statistical methods.<br />
To achieve the objective, meteorological parameters such as; precipitati<strong>on</strong>, the average of<br />
maximum temperature, the average of minimum temperature, the average of temperature, the<br />
sum of temperatures more than 10º,evaporati<strong>on</strong>,the water vapor pressure ,the average of wind<br />
speed, the sunshine .and the drought indexes such as; Percent of normal Index, Standard<br />
Index of Annual Precipitati<strong>on</strong> Index, Hydrothermal Index, Nguyen Index, Transeau Index,<br />
Standardized Precipitati<strong>on</strong> Index, Shashko moisture drought Index, Rainfall Anomaly Index<br />
were evaluated in terms of normality and their mutual influences. <str<strong>on</strong>g>The</str<strong>on</strong>g>n the correlati<strong>on</strong> analysis<br />
between the barley yield and the climatic parameters and drought indexes have been<br />
examined .the results of this study showed that am<strong>on</strong>g the drought indexes, Nguyen Index ,<br />
Transeau Index , Rainfall Anomaly Index and Standardized Precipitati<strong>on</strong> Index (SPI24) are<br />
67
more effective for predicti<strong>on</strong> of barely yield. It is also found that the multivariate regressi<strong>on</strong> are<br />
better than the univariate regressi<strong>on</strong> models.<br />
Finally, all the obtained regressi<strong>on</strong> models were ranked based <strong>on</strong> statistical indexes(R,<br />
RMSE and MBE). This study showed that the multivariate regressi<strong>on</strong> model including wind<br />
speed, sunshine, temperature summati<strong>on</strong> more than 10, precipitati<strong>on</strong> and Nguyen index is the<br />
best model for predicti<strong>on</strong> yield producti<strong>on</strong> in Miane. Average wind speed and Nguyen index<br />
were recognized to be the most effective parameters for yield producti<strong>on</strong> in the model.<br />
<str<strong>on</strong>g>The</str<strong>on</strong>g> Evaluati<strong>on</strong> of Climatic Factors that Effect Climate in Azarbayjan by Method of Principal<br />
Comp<strong>on</strong>ent Analysis<br />
Speaker: Majid Rezaei Banafsheh<br />
Majid Rezaei Banafsheh<br />
University of Tabriz<br />
mrbanafsheh@yahoo.com<br />
Zahedi, Majid<br />
University of Tabriz<br />
Jahanbakhsh, Saeid<br />
University of Tabriz<br />
Naderi, Zolikha<br />
University of Piamnoor Meshkinshahr<br />
<str<strong>on</strong>g>The</str<strong>on</strong>g> regi<strong>on</strong> studied here includes: Ardedil, east and west Azarbayjan provinces located in<br />
the north west of Iran. In this research nineteen synoptic Stati<strong>on</strong>s with relative distributi<strong>on</strong> have<br />
been chosen. <str<strong>on</strong>g>The</str<strong>on</strong>g> data gathered M<strong>on</strong>thly during 1971 to 2005.<br />
<str<strong>on</strong>g>The</str<strong>on</strong>g>se research is d<strong>on</strong>e by using principal comp<strong>on</strong>ent analysis (PCA) method an also<br />
varieties such as wind speed, seas<strong>on</strong>al precipitati<strong>on</strong>, relative humidity at 3, 9, 15 synoptic time<br />
and average daily temperature and the highest, lowest daily average temperature and also the<br />
average of dew point, and the maximum precipitati<strong>on</strong> in the north west of Iran has been<br />
discussed, in order to determine the effective varieties and principal comp<strong>on</strong>ent analysis (PCA)<br />
<strong>on</strong> the climate of Azarbayjan. <str<strong>on</strong>g>The</str<strong>on</strong>g> effects of every chosen variety based <strong>on</strong> the importance and<br />
choosing the places of every stati<strong>on</strong> show same factors. <str<strong>on</strong>g>The</str<strong>on</strong>g> c<strong>on</strong>clusi<strong>on</strong> of this research<br />
includes the analysis of main factors in every stati<strong>on</strong>s and areas. In data analysis, drawing<br />
diagrams and maps several software such as: ArcView, Minitab, SPSS, Arc info and Excel,<br />
have been used.<br />
Key words: precipitati<strong>on</strong>, temperature, dew point, Relative humidity, Principal Comp<strong>on</strong>ent<br />
Analysis, North West Azarbayjan.<br />
68
Climate Risk Management in North-East of Iran By Statistical Downscaling Direct <strong>on</strong> GCMs<br />
Output<br />
Speaker: Sina Samadi<br />
Sina Samadi<br />
Climatological Research Institute(CRI)-I.R.of Iran Meteorological Organizati<strong>on</strong>(IRIMO)<br />
sisamadi@yahoo.com<br />
In climate change studies the global circulati<strong>on</strong> models of Atmosphere (GCMAs) enable<br />
<strong>on</strong>e to simulate the global climate, with the field variables being represented <strong>on</strong> a grid points<br />
300 km apart. Unfortunately, the most recent generati<strong>on</strong> of general circulati<strong>on</strong> models (GCMs)<br />
still has serious problems when modeling over Iran. However, these models are able to<br />
reproduce the main patterns of atmospheric circulati<strong>on</strong>, such as those derived from a principal<br />
comp<strong>on</strong>ent analysis of the sea level pressure anomaly field. GCMs Models are benefit for<br />
detecting Climate change and z<strong>on</strong>e <strong>on</strong> a special parameter. Even if global climate models in<br />
the future are run at high resoluti<strong>on</strong> there will remain the need to ‘downscale’ the results from<br />
such models to individual sites or localities for impact studies. A Statistical Model (SM) has<br />
been developed to downscale large scale predictors given by Global Climate Models (GCMs).<br />
This is a complementary approach to the dynamical modeling of regi<strong>on</strong>al climate change using<br />
high resoluti<strong>on</strong> nested models. It allows bridging the scale difference (“downscaling”) between<br />
coarse grid Coupled Atmosphere-Ocean GCMs and the finest temporal and spatial scales<br />
required for regi<strong>on</strong>al and envir<strong>on</strong>mental impact studies of climate changeGeneral Circulati<strong>on</strong><br />
Models (GCMs) indicate that rising c<strong>on</strong>centrati<strong>on</strong>s of greenhouse gases will have significant<br />
implicati<strong>on</strong>s for climate at global and regi<strong>on</strong>al scales. Less certain is the extent to which<br />
meteorological processes at individual sites will be affected. So–called “downscaling”<br />
techniques are used to bridge the spatial and temporal resoluti<strong>on</strong> gaps between what climate<br />
modelers are currently able to provide and what impact assessors require. Many downscaling<br />
techniques have been developed in recent years, all having in comm<strong>on</strong> the need to establish<br />
statistical links between the large-scale circulati<strong>on</strong> and the observed data at a local or regi<strong>on</strong>al<br />
scale. We know several centers in the world are producing climate data in deferent scenarios.<br />
So, choose the best <strong>on</strong>e that is suitable in selecti<strong>on</strong> area and then use them for detecting<br />
change in climate parameters is the main propose of this paper. In this paper, we try to find<br />
correlati<strong>on</strong> between observed data and models outputs to find the best <strong>on</strong>e for downscale<br />
m<strong>on</strong>thly precipitati<strong>on</strong> over the North-East of Iran. We use SDSM tools for that changing scale.<br />
It was found that the precipitati<strong>on</strong> characteristics (mean, variance, and empirical distributi<strong>on</strong>)<br />
were better reproduced by the downscaled results than by the GCM direct output. With using<br />
Precipitati<strong>on</strong> parameter c<strong>on</strong>structed for the future (2005–2050) in SPI (Standard Precipitati<strong>on</strong><br />
Index) we could detect climate change in this regi<strong>on</strong> for future and it will improve climate risk<br />
management.<br />
Keyword: Climate Change, Downscaling, , GCM, Management, SDSM, Risk<br />
69
Analysing decadal rainfall perfomance in Uganda<br />
Speaker: Senkunda Samuel<br />
Senkunda Samuel<br />
Uganda Department of Meteorology<br />
senkunds@yahoo.com<br />
<str<strong>on</strong>g>The</str<strong>on</strong>g> generati<strong>on</strong> of climatological and weather informati<strong>on</strong> that can be applied in advising<br />
the planners and decisi<strong>on</strong> makers mostly involves data analysis, after which most appropriate<br />
inferencing can be d<strong>on</strong>e.This paper will look at the ten day rainfall analysis for Uganda for the<br />
past ten years, using accumulated decadal rainfall data.Data from a total of 16 active synoptic<br />
stati<strong>on</strong>s across the country, has been analysed whereby accumulated ten day rainfall graphs<br />
have been generated.<br />
A Preview of Iran`s Climate Using SIAP Method<br />
Speaker: Behrooz Sari Sarraf<br />
Dr.Behrooz Sari Sarraf<br />
Islamic Azad University_Ahar Branch<br />
sarisarraf@tabrizu.ac.ir<br />
Abbas Hoseiny Shamechi<br />
Islamic Azad University_Ahar Branch<br />
Mrs.Masoomeh Emamgholizadeh<br />
University of Tabriz<br />
In the existing study, we have used the precipitati<strong>on</strong> records of synoptic stati<strong>on</strong>s of Iran<br />
for a l<strong>on</strong>g term period, after retrieving the data and applying homogenity tests.Using the SIAP<br />
equati<strong>on</strong>, we have drawn z<strong>on</strong>ing map of IRAN based <strong>on</strong> standardized values and the<br />
coefficient of variati<strong>on</strong> of precipitati<strong>on</strong> have been studied and finally the coefficients of variati<strong>on</strong><br />
map of Iran has beenstudied and finally the coefficients of variati<strong>on</strong> map of Iran has been<br />
prepared.<br />
According to the results obtained, in the years 1966 and 1973 all over Iran has<br />
experienced droughts and since 1995 until 2001 a very l<strong>on</strong>g desiccati<strong>on</strong> in most parts of Iran<br />
has dominated.<br />
Key words:Z<strong>on</strong>ing, Drought,coefficient of variati<strong>on</strong>,Siap<br />
70
Analyzing of synoptic intence showers over the southern part of ARAS River<br />
Speaker: Behrooz Sari Sarraf<br />
Dr.Behrooz Sari Sarraf<br />
University of Tabriz<br />
sarisarraf@tabrizu.ac.ir<br />
Dr.Ali Akbar Rasouli<br />
University of Tabriz<br />
Javad Farshi Frogh<br />
Tabriz meteorologocal organizati<strong>on</strong><br />
Mrs.Taherh Kayani<br />
University of Tabriz<br />
<str<strong>on</strong>g>The</str<strong>on</strong>g> main goal of the current study was to examinati<strong>on</strong> of some of distinguished intense<br />
rainfalls using six synoptic stati<strong>on</strong> data in the southern part of Aras River.To achive our main<br />
goals, the data from six stati<strong>on</strong> including Makoo, Khoy, Ardabil,Parsabad, Ahar, and Gholfa<br />
from 1986 t0 2003 was used.By taking advantage of synoptic maps it was found that some<br />
type of shower rains could be resulted of c<strong>on</strong>sequence effect of interring cold fr<strong>on</strong>t upcoming<br />
to the study areas.In this regard two synoptic stati<strong>on</strong> Skew_T maps have been analyzed.<str<strong>on</strong>g>The</str<strong>on</strong>g><br />
final result shows that in the study area some intense showers could be produced from the<br />
local thunderstorm as well. Key Words: southern part of Aras River ,intense shower,Skew-t<br />
Map<br />
Indian M<strong>on</strong>so<strong>on</strong> Rainfall and its relati<strong>on</strong>ship with El-nino/Southern Oscillati<strong>on</strong> Index (SOI)<br />
Over India during 1940- 2000<br />
Speaker: C.V.Singh<br />
Dr. C.V.Singh<br />
D.M.S., Vishvkarma Bhawan,Indian Institute of Technology, New Delhi-110016 (India)<br />
cvsingh2@rediffmail.com/*E-mail : cvsingh@cas.iitd.ernet.in<br />
<str<strong>on</strong>g>The</str<strong>on</strong>g> interannual fluctuati<strong>on</strong>s in the Southern Oscillati<strong>on</strong> Index (SOI) and their relati<strong>on</strong>ship<br />
to the Indian m<strong>on</strong>so<strong>on</strong> rainfall (June-September) have been studies for the period 1940-2000<br />
covering 340 stati<strong>on</strong>s all over India (in figure 1. each stati<strong>on</strong>s c<strong>on</strong>tains the seas<strong>on</strong>al average<br />
rainfall of five neighbors stati<strong>on</strong>s). <str<strong>on</strong>g>The</str<strong>on</strong>g> m<strong>on</strong>so<strong>on</strong> rainfall is significant correlated with the<br />
southern oscillati<strong>on</strong> index (June-September) 0.65. <str<strong>on</strong>g>The</str<strong>on</strong>g> large positive southern oscillati<strong>on</strong><br />
indexes are positively correlated with the flood years, while the negative southern oscillati<strong>on</strong><br />
indexes are correlated with the drought years. In this study, we have taken the flood/drought<br />
and El-Nino years separately and find their relati<strong>on</strong>ship with SOI. It has been observed that<br />
mostly drought occurs, when Southern Oscillati<strong>on</strong> Index value is negative. It has also been<br />
noticed that there is a good correlati<strong>on</strong> ship with El-Nino and drought years (57%). <str<strong>on</strong>g>The</str<strong>on</strong>g><br />
Spectrum analysis is also carried out <strong>on</strong> m<strong>on</strong>so<strong>on</strong> rainfall and Southern Oscillati<strong>on</strong> Index<br />
71
separately (SOI) and it is c<strong>on</strong>cluded that they are highly correlated in the period range 2-2.5<br />
years to 4-6 years and 5.5-6.0 years respectively. It has also been observed that the climatic<br />
anomalies such as drought in India and El-Nino off the coast of Peru are linked with the<br />
Southern Oscillati<strong>on</strong> (Walker circulati<strong>on</strong>)<br />
Kew Words: M<strong>on</strong>so<strong>on</strong> rainfall, Southern Oscillati<strong>on</strong> Index, El-Nino, Climatic fluctuati<strong>on</strong>s<br />
Parallel Sessi<strong>on</strong>s:Forecast<br />
Verificati<strong>on</strong> of Climate Predicti<strong>on</strong>s<br />
Speaker: Albert R. Boehm<br />
Albert R. Boehm<br />
retired<br />
albertboehm@juno.com<br />
WEATHER VERIFICATION: Verificati<strong>on</strong> of climate predicti<strong>on</strong>s is based <strong>on</strong> the<br />
c<strong>on</strong>siderable methodology that has been developed to verify weather forecasts. Thus, first the<br />
methodology for weather forecasts is reviewed.<br />
PURPOSE: Forecasts are verified for two purposes (1) Diagnostic verificati<strong>on</strong>- to give<br />
forecasters feedback to improve their forecasts by removing bias, etc. (2) Quantify utility to<br />
build user edibility (the probability a user thinks that they are correct)<br />
TYPES OF FORECASTS<br />
QUANTITATIVE: a specific value from a c<strong>on</strong>tinuous variable e.g. 50deg. C<br />
PROBABILITY FORECAST: a forecast plus the uncertainty that it will occur expressed as a<br />
probability.<br />
A probability forecast can be used to optimize utilty of a forecast by minimizing expected loss<br />
or allowing for an alternate acti<strong>on</strong>: e.g. go <strong>on</strong> picnic but take an umbrella.<br />
CATEGORY FORECASTS: a well defined event e.g.rain or no rain or a temperature below<br />
freezing.<br />
RANKED CATEGORIES results from a c<strong>on</strong>tinuous variable divided into categories by a set of<br />
thresholds e.g. temperature 0>
chosen since it completely defines the variability of cases and hence the verificati<strong>on</strong> score.<br />
<str<strong>on</strong>g>The</str<strong>on</strong>g> trouble is that weather is highly correlated in time and space thus having much less<br />
variability then the independent normative model indicates. <str<strong>on</strong>g>The</str<strong>on</strong>g> effect of correlati<strong>on</strong> can be<br />
incorporated by using randomly SIMULATED VERIFICATION: generated forecasts and<br />
observati<strong>on</strong> with known correlati<strong>on</strong>.<br />
SYNTHETIC VERIFICATION is the closed form result which would occur from a series of<br />
simulated verificati<strong>on</strong>s and thus an explicit form shows the effects of skill, event climate<br />
probability and other factors <strong>on</strong> a verificati<strong>on</strong> score and <strong>on</strong>e easily programmed simulati<strong>on</strong> of<br />
correlated forecasts and verifying observati<strong>on</strong> is the TRANSNORMAL model which generates<br />
multivariate normal deviates which are then transformed into weather variables via their<br />
cumulative distributi<strong>on</strong>. <str<strong>on</strong>g>The</str<strong>on</strong>g> transormal model can relate with closed form expressi<strong>on</strong>s<br />
quantitative, category and probability forecasts<br />
CLIMATE PREDICTIONS differ from weather forecasts in several ways instead of being for a<br />
single locati<strong>on</strong> at <strong>on</strong>e time, they are often valid for a large regi<strong>on</strong> and an extended valid time<br />
thus they are often expressed as distributi<strong>on</strong>s. Plus generally because of l<strong>on</strong>ger lead times,<br />
they generally have lower skill and accuracy. Gringorten (1952) proposed an S score to verify<br />
probability density forecasts. Plus synthetic verificati<strong>on</strong> indicates it is quite sensitive to low skill<br />
forecasts.<str<strong>on</strong>g>The</str<strong>on</strong>g> S score was able to show that <strong>on</strong>e year ahead seas<strong>on</strong>al temperature analog<br />
forecasts forecasts produced by ETAC had significant improvement over chance.<br />
CFARC MODEL a global extensi<strong>on</strong> of the transnormal model generates weather forecasts and<br />
observati<strong>on</strong> <strong>on</strong> a global scale thus providing a normative model for judging significance of such<br />
things as widely separated telac<strong>on</strong>necti<strong>on</strong>s and global climate change.<br />
CLIMATE CHANGE VERIFICATION: By using observati<strong>on</strong>s from <strong>on</strong>e period as a predicti<strong>on</strong> of<br />
a later period, climate change can be verified. We note from experience that the climate is<br />
always changing thus the questi<strong>on</strong>: has the climate changed is trivial since the answer is<br />
always Yes! <str<strong>on</strong>g>The</str<strong>on</strong>g> real questi<strong>on</strong> is has the climate changed in an important manner?<br />
A Glossary of over 28 verificati<strong>on</strong> terms is included. For example:<br />
skill: takes into account the difficulty of the forecast in accessing the ability of a forecaster or<br />
forecast method. Skill attempts to compare verificati<strong>on</strong> of easy forecasts with hard forecasts.<br />
Generally, accuracy will be lower when: 1. the forecast event is rare, 2. data is sparse or<br />
missing, or 3. the weather situati<strong>on</strong> is complex; it does not fall into an easily recognized pattern.<br />
See Skill Score.<br />
2 ROC<br />
Verificati<strong>on</strong> methodology using Relative Operating Characteristics (ROC), is derived from<br />
signal detecti<strong>on</strong> theory. This methodology is intended to provide informati<strong>on</strong> <strong>on</strong> the<br />
characteristics of systems up<strong>on</strong> which management decisi<strong>on</strong>s can be taken.(WMO2000)<br />
Skill Score, SS: Is a generalized form to c<strong>on</strong>vert any score into a fracti<strong>on</strong>al improvement over<br />
some standard. Thus: SS = [S(f) - S(s)] / [S(p) - S(s)] where S(f) is a any score based <strong>on</strong><br />
forecasts, S(s) is the score based <strong>on</strong> a standard such a persistence or climatology or chance ,<br />
and S(p) is the perfect score. For forecasts better then the standard, SS has the range [0, 1]<br />
with 0 when forecasts have the same accuracy as the standard and 1 when when forecasts<br />
are∞the forecasts are perfect. SS is negative with range to - less than standard. When the<br />
perfect score is zero as in the Brier score or MSE, it simplifies to: SS= 1 - S(f)/S(s). WARNING:<br />
When the denominator can become small, skill scores are subject to c<strong>on</strong>siderable variability.<br />
73
See Heidke Skill Score. Ref. Heidke (1926) and Murphy (1976).<br />
Bibliography<br />
Murphy, A., 1993: What is a good forecast? An essay <strong>on</strong> the nature of goodness in weather<br />
forecasting, Weather and Forecasting, 8, 281-293.<br />
Tufte, Edward R., 1983: <str<strong>on</strong>g>The</str<strong>on</strong>g> Visual Display of Quantitative Informati<strong>on</strong>, Graphics Press,<br />
Cheshire, CT, pp 197.<br />
WMO (200) Standardised Verificati<strong>on</strong> System (SVS) for L<strong>on</strong>g-Range Forecasts<br />
Integrated seas<strong>on</strong>al climate forecasts for South America<br />
Speaker: Caio Coelho<br />
Caio Coelho<br />
Centro de Previsão de Tempo e Estudos Climáticos (CPTEC), Instituto Naci<strong>on</strong>al de Pesquisas<br />
Espaciais (INPE), Brazil<br />
caio@cptec.inpe.br<br />
Seas<strong>on</strong>al climate forecasts are forecasts of the expected climatic c<strong>on</strong>diti<strong>on</strong>s in the<br />
forthcoming 3-6 m<strong>on</strong>ths. <str<strong>on</strong>g>The</str<strong>on</strong>g>se forecasts are currently produced using empirical (statistical)<br />
and dynamical (physical) models. Given the availability of these two modeling approaches <strong>on</strong>e<br />
might questi<strong>on</strong> the feasibility of producing a single and well calibrated integrated forecast that<br />
gather all available informati<strong>on</strong> at the time the forecast is issued.<br />
This talk will illustrate how empirical and dynamical coupled model rainfall seas<strong>on</strong>al<br />
forecasts for South America are currently being integrated (i.e. combined and calibrated) using<br />
a Bayesian approach know as forecast assimilati<strong>on</strong>. Empirical forecasts are produced using a<br />
simple multivariate regressi<strong>on</strong> model that uses the previous m<strong>on</strong>th Pacific and Atlantic sea<br />
surface temperature as predictors for South American rainfall of the following three m<strong>on</strong>th<br />
seas<strong>on</strong>. Dynamical forecasts are from the European Seas<strong>on</strong>al to Inter-annual Predicti<strong>on</strong><br />
(EURO-SIP) coupled multi-model system composed by ECMWF, UK Met Office and<br />
Météo-France. Such an empirical-dynamical multi-model integrated system is part of<br />
EUROBRISA (A EURO-BRazilian Initiative for improving South American seas<strong>on</strong>al forecasts).<br />
Preliminary results of rainfall seas<strong>on</strong>al forecasts for South America produced by each model<br />
and by the integrated system together with skill assessment measures, which indicate regi<strong>on</strong>s<br />
where forecasts have best quality, will be presented.<br />
74
<str<strong>on</strong>g>The</str<strong>on</strong>g> Roles of Ensembles in Climate Modelling<br />
Speaker: Hailiang Du<br />
Hailiang Du<br />
CATS, <str<strong>on</strong>g>The</str<strong>on</strong>g> L<strong>on</strong>d<strong>on</strong> School of Ec<strong>on</strong>omics<br />
h.l.du@lse.ac.uk<br />
E.R.Tredger<br />
CATS, <str<strong>on</strong>g>The</str<strong>on</strong>g> L<strong>on</strong>d<strong>on</strong> School of Ec<strong>on</strong>omics<br />
F.Niehoerster<br />
Freie Universitaet Berlin, Meteorologisches Institute<br />
D.Stainforth<br />
University of Oxford<br />
L.A.Smith<br />
CATS, <str<strong>on</strong>g>The</str<strong>on</strong>g> L<strong>on</strong>d<strong>on</strong> School of Ec<strong>on</strong>omics; University of Oxford<br />
Ensemble simulati<strong>on</strong>s play a central role in climate modelling, both in terms of model<br />
improvement and decisi<strong>on</strong> support. <str<strong>on</strong>g>The</str<strong>on</strong>g>ir effectiveness in this role is shown to vary with how<br />
various uncertainties are sampled and with what the ensemble itself is interpreted to represent.<br />
Experimental design will vary with the goal of the experiment, indeed the divisi<strong>on</strong> of resources<br />
between sampling distributi<strong>on</strong>s of initial c<strong>on</strong>diti<strong>on</strong>s, parameterizati<strong>on</strong>s, model structures and<br />
forcing scenarios will vary with the questi<strong>on</strong>s to be addressed. <str<strong>on</strong>g>The</str<strong>on</strong>g> impact of each type of<br />
uncertainty and the importance of ensembles in each case will be shown with examples from<br />
the archives of the IPCC and climatepredicti<strong>on</strong>.net, as well as illustrative statistical models.<br />
<str<strong>on</strong>g>The</str<strong>on</strong>g>se issues and opti<strong>on</strong>s for designing ensemble experiments are addressed in several<br />
settings, <strong>on</strong>e being the statisticians. Traditi<strong>on</strong>al vehicle for sampling experiments: the selecti<strong>on</strong><br />
of balls from a collecti<strong>on</strong> of urns. Current experimental designs place restricti<strong>on</strong> <strong>on</strong> the use of<br />
ensembles of simulati<strong>on</strong>s for either decisi<strong>on</strong> support or model improvement. <str<strong>on</strong>g>The</str<strong>on</strong>g> aim is to<br />
illustrate approaches which exploit ensemble based experiments to gain maximum value from<br />
climate simulati<strong>on</strong>s, given finite resources and imperfect models.<br />
Climatepredicti<strong>on</strong>.net<br />
Speaker: Nick Faull<br />
Nick Faull<br />
University of Oxford<br />
nfaull@atm.ox.ac.uk<br />
David Frame<br />
University of Oxford<br />
Tolu Aina<br />
University of Oxford<br />
75
Matthew Collins<br />
Hadley Centre, UK Metoffice<br />
Myles Allen<br />
University of Oxford<br />
Climatepredicti<strong>on</strong>.net is a simulati<strong>on</strong> project harnessing the power of idle PCs to<br />
forecast the climate of the 21st century. In collaborati<strong>on</strong> with the BBC, we asked volunteer<br />
members of the public to download a climate model from the project website and to run it<br />
locally <strong>on</strong> their PC. Each model forms a single member of a massive, perturbed physics<br />
ensemble in the world's largest climate forecasting experiment. As well as discussing the<br />
design of the experiment, we present some of our first results.<br />
Statistical characterizati<strong>on</strong> of ensemble predicti<strong>on</strong> systems: Applicati<strong>on</strong> to the DEMETER<br />
ensemble<br />
Speaker: Jesús Fernández<br />
Jesús Fernández<br />
University of Cantabria<br />
Cristina Primo<br />
ECMWF<br />
Ant<strong>on</strong>io S. Cofiño<br />
University of Cantabria<br />
Jose M. Gutierrez<br />
University of Cantabria<br />
Miguel A. Rodriguez<br />
Instituto de Fisica de Cantabria<br />
A novel approach is presented to characterize and graphically represent the<br />
spatiotemporal evoluti<strong>on</strong> of ensembles by means of a simple diagram. <str<strong>on</strong>g>The</str<strong>on</strong>g> study focuses <strong>on</strong><br />
the evoluti<strong>on</strong> of perturbati<strong>on</strong>s, defined as differences between each ensemble member and a<br />
c<strong>on</strong>trol member. <str<strong>on</strong>g>The</str<strong>on</strong>g> lognormal character of these perturbati<strong>on</strong>s suggests a characterizati<strong>on</strong> in<br />
terms of the first two moments of the logarithmic transformed values (the log-perturbati<strong>on</strong>s).<br />
On <strong>on</strong>e hand, the mean is associated with the spatially-averaged exp<strong>on</strong>ential growth in time.<br />
On the other hand, the variance accounts for the inhomogeneous and localized spatial growth<br />
comp<strong>on</strong>ent.<br />
We introduce the MVL (Mean-Variance of Logarithms) diagram to intuitively represent the<br />
interplay and evoluti<strong>on</strong> of these two magnitudes. We show how this diagram uncovers useful<br />
informati<strong>on</strong> about the spatiotemporal dynamics of the ensemble by appling it to the analysis of<br />
the multimodel ensemble for seas<strong>on</strong>al forecasting developed in the EU-project DEMETER.<br />
76
<str<strong>on</strong>g>The</str<strong>on</strong>g> diagram shows aspects of the initializati<strong>on</strong> procedure and the internal dynamics of the<br />
models, which cannot be easily assessed by other means.<br />
Spatiotemporal Rainfall Predictive Model using ANN and Storm Data Sets. Case Study: Bogotá<br />
City, Colombia<br />
Speaker: Carlos F Gaitan<br />
Carlos F Gaitan<br />
Geophysical Institute - Javeriana University<br />
c.gaitan@javeriana.edu.co<br />
Obreg<strong>on</strong>, Nels<strong>on</strong><br />
Geophysical Institute - Javeriana University<br />
Torres, Darwin E<br />
Geophysical Institute - Javeriana University<br />
Developing an accurate spatiotemporal rainfall predictive model is a challenging task in<br />
atmospheric sciences and a great need for mayor capital cities like Bogotá, Colombia. Within<br />
the hydroinformatics discipline, several models were developed at either spatial or temporal<br />
scale for predicting the precipitati<strong>on</strong> at the city for a storm event. This work aims at showing a<br />
new model using Artificial Neural Networks (ANN) and precipitati<strong>on</strong> data sets gathered at thirty<br />
six rain gauges; in order to develop the model, the city map was divided with an equally<br />
spaced grid, over which were located the rain gauges; the temporal resoluti<strong>on</strong> of the model<br />
was defined <strong>on</strong> a quarter hour. <str<strong>on</strong>g>The</str<strong>on</strong>g> model was trained to predict the next two expected values<br />
for each cell of the grid, using the available data of the neighboring cells and the early period<br />
informati<strong>on</strong>; before beginning the training instances of the model and in order of obtaining<br />
appropriate patterns, a proper statistical characterizati<strong>on</strong> of the data sets was advanced, in<br />
particular spatiotemporal linear and n<strong>on</strong>-linear correlati<strong>on</strong>s. <str<strong>on</strong>g>The</str<strong>on</strong>g> type of calibrated ANN is the<br />
multilayer perceptr<strong>on</strong> trained with the delta generalized rule. Results suggest that the<br />
ANN-based model applied for the study z<strong>on</strong>e perform well for almost all the grid cells and that<br />
such performance basically depends <strong>on</strong> both topological features of the nets and correlati<strong>on</strong><br />
structures am<strong>on</strong>g point precipitati<strong>on</strong> data sets.<br />
A new interval-based method for seas<strong>on</strong>al forecast validati<strong>on</strong>: Applicati<strong>on</strong> to DEMETER in Perú<br />
and Spain<br />
Speaker: Jose M. Gutierrez<br />
Jose M. Gutierrez<br />
University of Cantabria<br />
Jose M. Gutierrez,manuel.gutierrez@unican.es<br />
Maria Dolores Frias<br />
77
University of Cantabria<br />
Carmen Sordo<br />
University of Cantabria<br />
Ant<strong>on</strong>io S. Cofiño<br />
University of Cantabria<br />
In this work we describe a simple statistical method to validate seas<strong>on</strong>al forecasts,<br />
comparing them with random predicti<strong>on</strong>s. This method provides an estimati<strong>on</strong> of the statistical<br />
significance of the skill and, hence, allows us to find out predictable situati<strong>on</strong>s where the<br />
seas<strong>on</strong>al system significantly outperforms a random forecast. We also analyze the advantages<br />
of post-processing the predicti<strong>on</strong>s with some appropriate statistical downscaling method. <str<strong>on</strong>g>The</str<strong>on</strong>g><br />
technique is applied to precipitati<strong>on</strong> and temperature forecasts c<strong>on</strong>sidering two regi<strong>on</strong>s with<br />
different seas<strong>on</strong>al behavior: Peru (in the tropics) and Spain (mid-latitudes). Results show high<br />
predictability over Peru during El Niño periods. Here, the use of a downscaling method clearly<br />
improves the forecast skill. Over Spain the forecast signal is much weaker, but some<br />
predictability related to El Niño and La Niña events is found.<br />
Finally, some sensitivity studies are presented. On the <strong>on</strong>e hand, we compare raw stati<strong>on</strong><br />
data with high resoluti<strong>on</strong> gridded interpolated data. On the other hand, different temporal<br />
aggregati<strong>on</strong> patterns are used for the analog downscaling method (daily, weekly and m<strong>on</strong>thly),<br />
comparing the different results obtained.<br />
For this work we have used data from the DEMETER multimodel project.<br />
Tests for evaluating rank histograms from ensemble forecasts<br />
Speaker: Ian Jolliffe<br />
Ian Jolliffe<br />
University of Exeter<br />
ian@sandloch.fsnet.co.uk<br />
Cristina Primo<br />
ECMWF<br />
Rank histograms are often plotted in order to evaluate the forecasts produced by an<br />
ensemble forecasting system - an ideal rank histogram is `flat'. It has been noted previously<br />
that the obvious test of `flatness', the well-known χ2 goodness-of-fit test, spreads its power<br />
thinly and hence is not good at detecting specific alternatives to flatness, such as bias or<br />
over/under-dispersi<strong>on</strong>. Other tests, which focus their power and are therefore more successful<br />
in detecting such alternatives, will be discussed and illustrated.<br />
<str<strong>on</strong>g>The</str<strong>on</strong>g> talk will emphasise new tests, which decompose the overall χ2 statistic, but the<br />
Cramér-v<strong>on</strong> Mises family of tests will also be described.<br />
78
Empirical probabilistic seas<strong>on</strong>al forecasts for Canada<br />
Speaker: V. Kharin<br />
V. Kharin<br />
Canadian Centre for Climate Modelling & Analysis<br />
Slava.Kharin@ec.gc.ca<br />
A method for c<strong>on</strong>structing empirical deterministic and probabilistic seas<strong>on</strong>al forecasts<br />
in Canada is proposed. <str<strong>on</strong>g>The</str<strong>on</strong>g> performance of the empirical forecasts is evaluated and compared<br />
to the performance of a multi-model ensemble of seas<strong>on</strong>al hindcasts produced with four global<br />
numerical models. Special attenti<strong>on</strong> in developing and validating empirical forecasts is paid to<br />
avoiding artificial skill enhancement. <str<strong>on</strong>g>The</str<strong>on</strong>g> 20th century empirical seas<strong>on</strong>al hindcasts of near<br />
surface temperature in Canada are best skillful in colder seas<strong>on</strong>s for time leads up to several<br />
m<strong>on</strong>ths. Little skill is found in transient seas<strong>on</strong>s. One-m<strong>on</strong>th lead empirical seas<strong>on</strong>al<br />
forecasts are competitive to the corresp<strong>on</strong>ding numerical model seas<strong>on</strong>al forecasts. Seas<strong>on</strong>al<br />
precipitati<strong>on</strong> hindcasts in Canada are not very skillful.<br />
Regime predictability in an atmospheric model or analogue predicti<strong>on</strong> revisited<br />
Speaker: Frank Kwasniok<br />
Frank Kwasniok<br />
University of Exeter, United Kingdom<br />
Predictability properties of atmospheric flow are diagnosed and analysed empirically using<br />
n<strong>on</strong>linear signal processing techniques. <str<strong>on</strong>g>The</str<strong>on</strong>g> noti<strong>on</strong> of predictability is relaxed from accurate<br />
predicti<strong>on</strong> of individual trajectories to a coarse-grained view in which <strong>on</strong>ly probabilities of<br />
visiting certain regi<strong>on</strong>s of state space or regimes are forecast. <str<strong>on</strong>g>The</str<strong>on</strong>g> regimes and a probabilistic<br />
model of the transiti<strong>on</strong>s between them are determined simultaneously by fitting a hidden<br />
Markov model to a data set of the system. <str<strong>on</strong>g>The</str<strong>on</strong>g>n regime predictability is examined as a functi<strong>on</strong><br />
of initial c<strong>on</strong>diti<strong>on</strong> using the Markov model; states with particularly high or low regime<br />
predictability are identified. States with high regime predictability are characterized by a large<br />
projecti<strong>on</strong> of their posterior distributi<strong>on</strong> of regime membership <strong>on</strong>to the slowliest decaying<br />
eigenmode of the Markov model. Predictability informati<strong>on</strong> is refined by using an analogue<br />
model of the regime posterior. <str<strong>on</strong>g>The</str<strong>on</strong>g> method bears the potential of improving predicti<strong>on</strong> by<br />
combining dynamical models of the system with the present statistical model. <str<strong>on</strong>g>The</str<strong>on</strong>g> ideas<br />
outlined above are applied to the classical Lorenz system as well as an atmospheric model<br />
with realistic variability and telec<strong>on</strong>necti<strong>on</strong> patterns.<br />
79
Insights from a Skill Analysis of the First Decade of L<strong>on</strong>g-Lead U.S. Three-M<strong>on</strong>th Temperature<br />
and Precipitati<strong>on</strong> Forecasts<br />
Speaker: Robert E. Livezey<br />
Robert E. Livezey<br />
NWS Climate Services, Office of Services, NOAA<br />
robert.e.livezey@noaa.gov<br />
Marina Timofeyeva<br />
University Corporati<strong>on</strong> for Atmospheric Research<br />
<str<strong>on</strong>g>The</str<strong>on</strong>g> first ten years (issued starting in mid-December 1994) of official, l<strong>on</strong>g-lead (out to<br />
<strong>on</strong>e year) U. S. three-m<strong>on</strong>th mean temperature and precipitati<strong>on</strong> forecasts are verified using a<br />
categorical skill score. Through aggregati<strong>on</strong> of forecasts over overlapping three-m<strong>on</strong>th target<br />
periods and/or multiple leads, we obtain informative results about skill improvements, skill<br />
variability (by lead, seas<strong>on</strong>, locati<strong>on</strong>, variable, and situati<strong>on</strong>), skill sources, and potential<br />
forecast utility. <str<strong>on</strong>g>The</str<strong>on</strong>g> forecasts clearly represent advances over zero-lead forecasts issued prior<br />
to 1995. But our most important result is that skill hardly varies by lead-time all the way out to<br />
<strong>on</strong>e year, except for cold-seas<strong>on</strong> forecasts under str<strong>on</strong>g El Nino or La Nina (ENSO) c<strong>on</strong>diti<strong>on</strong>s.<br />
<str<strong>on</strong>g>The</str<strong>on</strong>g> inescapable c<strong>on</strong>clusi<strong>on</strong> is that this lead-independent skill comes from use of l<strong>on</strong>g-term<br />
trends to make the forecasts and we show that these trends are almost entirely associated<br />
with climate change. However, we also argue that climate change is not yet being optimally<br />
taken into account. All other skill in the forecasts comes from exploitati<strong>on</strong> of str<strong>on</strong>g and<br />
predictable ENSO episodes for winter forecasts, out to 6.5-m<strong>on</strong>ths lead for precipitati<strong>on</strong> and<br />
bey<strong>on</strong>d 8.5-m<strong>on</strong>ths for temperature. Apparently other sources of skill supported by existing<br />
research, including predictability inherent in weaker ENSO episodes and interactive feedbacks<br />
between the extratropical atmosphere and underlying surfaces, do not materially c<strong>on</strong>tribute to<br />
positive forecast performance. Compared to str<strong>on</strong>g ENSO and climate change signals, other<br />
sources are too weak, unreliable, or poorly understood to detect an impact. Another<br />
c<strong>on</strong>sequence of the clear attributi<strong>on</strong> of skill is that often-observed high regi<strong>on</strong>al/seas<strong>on</strong>al skills<br />
imply that the forecasts can be unambiguously valuable to a wide range of users. With these<br />
findings, steps (some immediate) can be taken to improve both the skill and usability of official<br />
l<strong>on</strong>g-lead forecasts.<br />
A Multiple Linear Regressi<strong>on</strong> Model for the Seas<strong>on</strong>al Predicti<strong>on</strong> of Rainfall over Peninsular<br />
India<br />
Speaker: Lorna R. Nayagam<br />
Lorna R. Nayagam<br />
Department of Atmospheric Sciences, Cochin University of Science and Technology<br />
lorna@cusat.ac.in<br />
80
Rajesh J.<br />
Department of Atmospheric Sciences, Cochin University of Science and Technology<br />
H. S. Ram Mohan<br />
Department of Atmospheric Sciences, Cochin University of Science and Technology<br />
<str<strong>on</strong>g>The</str<strong>on</strong>g> present study attempts to develop a linear multiple regressi<strong>on</strong> model to predict the<br />
summer m<strong>on</strong>so<strong>on</strong> rainfall over Peninsular India (PIR). Correlati<strong>on</strong> between PIR and several<br />
global parameters were found and areas having 99% significance were selected as indices.<br />
<str<strong>on</strong>g>The</str<strong>on</strong>g> c<strong>on</strong>sistency of the relati<strong>on</strong>ship between these indices and PIR was checked by doing a<br />
15-year sliding window correlati<strong>on</strong> (significant at 5% level). Twenty indices were used as the<br />
input and 5 predictors were selected by the stepwise regressi<strong>on</strong> method. <str<strong>on</strong>g>The</str<strong>on</strong>g> predictors are<br />
Z<strong>on</strong>al wind at 925hPa (jan), 700 hPa (mar), 200 hPa (jan), 100hPa (apr), and 30 hPa (feb)<br />
over different spatial locati<strong>on</strong>s. <str<strong>on</strong>g>The</str<strong>on</strong>g>se 5 predictors were used to develop the linear regressi<strong>on</strong><br />
model. <str<strong>on</strong>g>The</str<strong>on</strong>g> model has been trained for a period of 24 years (1977-2000). <str<strong>on</strong>g>The</str<strong>on</strong>g> model has a<br />
multiple correlati<strong>on</strong> of 0.944 and coefficient of determinati<strong>on</strong> of 89.2%. <str<strong>on</strong>g>The</str<strong>on</strong>g> VIF analysis of all<br />
the parameters that is retained in the stepwise regressi<strong>on</strong> have values less than 2 indicating<br />
an insignificant level of multicollinearity and has a Durbin Wats<strong>on</strong> value of 2.247.<str<strong>on</strong>g>The</str<strong>on</strong>g> model<br />
performance was assessed for 5 years (2001-2005) using statistical measures such as RMSE,<br />
BIAS and ABSE. <str<strong>on</strong>g>The</str<strong>on</strong>g> model has a RMSE of 13 %, BIAS of 3.62% and ABSE of 10.26% of<br />
l<strong>on</strong>g-term average. Climatological predicti<strong>on</strong>s were also made and found that RMSE, BIAS<br />
and ABSE are 15.73%, -11.52% and 13.83% of l<strong>on</strong>g term average, respectively.<br />
Determinati<strong>on</strong> of Threshold for Binary Forecast<br />
Speaker: Ke<strong>on</strong> Tae Sohn<br />
Ke<strong>on</strong> Tae Sohn<br />
Pusan Nati<strong>on</strong>al University, Korea<br />
ktsohn@pusan.ac.kr<br />
Je<strong>on</strong>g Hye<strong>on</strong>g Lee<br />
D<strong>on</strong>g_A University, Korea<br />
<str<strong>on</strong>g>The</str<strong>on</strong>g>re are many binary forecasts like heavy rain in weather forecast system. Threshold<br />
is needed to generate a binary forecast based <strong>on</strong> the probablisitic forecast model. This study is<br />
performed via M<strong>on</strong>te-Carlo simulati<strong>on</strong> to propose a guidance <strong>on</strong> the choice of skill score to find<br />
the optimal threshold for binary forecasts.<br />
In M<strong>on</strong>te-Carlo simulati<strong>on</strong>, 40 patterns which c<strong>on</strong>sist of 5 distributi<strong>on</strong> modes, 4 occurrence<br />
rates and 2 variati<strong>on</strong> models, are generated by random variate sampling. Varying threshold<br />
from 0 to 1, binary forecasts are generated by the threshold and the results are summarized in<br />
2x2 c<strong>on</strong>tingency tables. And skill scores (Heidke skill score, hit rate, true skill statistic, threat<br />
score, etc) are computed to find the threshold which maximizes a skill score separately. As<br />
81
esults, the guidance <strong>on</strong> the determinati<strong>on</strong> of threshold for binary forecast is proposed for each<br />
pattern.<br />
Using this guidance, the heavy snow forecast in Korea is c<strong>on</strong>sidered as a case study.<br />
Effects of daily MOC fluctuati<strong>on</strong>s <strong>on</strong> l<strong>on</strong>g-term MOC predictability<br />
Speaker: Jin-S<strong>on</strong>g v<strong>on</strong> Storch<br />
Jin-S<strong>on</strong>g v<strong>on</strong> Storch<br />
Max-Planck Institute for Meteorology<br />
jin-s<strong>on</strong>g.v<strong>on</strong>.storch@zmaw.de<br />
Helmuth Haak<br />
Max-Planck Institute for Meteorology<br />
<str<strong>on</strong>g>The</str<strong>on</strong>g> first c<strong>on</strong>tinuous assessment of the Atlantic meridi<strong>on</strong>al overturning circulati<strong>on</strong><br />
(MOC), achieved within the framework of the UK Rapid Climate Change Program, indicates<br />
str<strong>on</strong>g MOC variability <strong>on</strong> timescales of about a few weeks. A large part of this variability<br />
results from or is related to the wind stress forcing. Assume that this MOC variability is not<br />
predictable bey<strong>on</strong>d a few weeks, its presence will significantly limit the l<strong>on</strong>g-term MOC<br />
predicti<strong>on</strong>s which owe their skill to the slow ocean dynamics. To quantify this limitati<strong>on</strong>, daily<br />
and yearly MOC time series generated by the ECHAM/MPI-OM model are used to test two null<br />
hypothesis: <strong>on</strong>e addresses the existence of the slow dynamics and the other the strength of<br />
the variability generated by the slow dynamics relative to the low-frequency white-noise<br />
extensi<strong>on</strong> of the unpredictable short-term fluctuati<strong>on</strong>s. <str<strong>on</strong>g>The</str<strong>on</strong>g> analysis is carried out for different<br />
frequency ranges by decomposing the variances in frequency domain. It is found that the<br />
model slow dynamics start to operate <strong>on</strong> timescales l<strong>on</strong>ger than two to three years and the<br />
variance generated by the slow dynamics can <strong>on</strong>ly be over and above the low-frequency<br />
white-noise extensi<strong>on</strong> of the unpredictable noise when c<strong>on</strong>sidering timescales l<strong>on</strong>ger than 20<br />
years. <str<strong>on</strong>g>The</str<strong>on</strong>g> result suggests that when predicting the MOC by initializing the ECHAM/MPI-OM<br />
model using an ocean analysis, a l<strong>on</strong>g initializati<strong>on</strong> time period, preferably l<strong>on</strong>ger than 20<br />
years, is required to capture the state of slow dynamics at the initial time.<br />
On the reliability of ENSO dynamical predicti<strong>on</strong>s<br />
Speaker: Youmin Tang<br />
Youmin Tang<br />
University of Northern British Columbia, Canada<br />
ytang@unbc.ca<br />
Richard Kleeman<br />
Courant Institute, New York University, USA<br />
82
Andrew Moore<br />
Uni. of California at Santa Cruz, USA<br />
In this study, ensemble predicti<strong>on</strong>s were c<strong>on</strong>structed using two realistic ENSO<br />
predicti<strong>on</strong> models and using stochastic optimals. By applying a recently developed theoretical<br />
framework, we have explored several important issues relating to ENSO predictability<br />
including reliability measures of ENSO dynamical predicti<strong>on</strong>s; and the dominant precursors<br />
that c<strong>on</strong>trol reliability. It was found that predicti<strong>on</strong> utility (R), defined by relative entropy, is a<br />
useful measure for the reliability of ENSO dynamical predicti<strong>on</strong>s, such that the larger the value<br />
of R, the more reliable a predicti<strong>on</strong>. <str<strong>on</strong>g>The</str<strong>on</strong>g> predicti<strong>on</strong> utility R c<strong>on</strong>sists of two comp<strong>on</strong>ents, a<br />
dispersi<strong>on</strong> comp<strong>on</strong>ent (DC) associated with the ensemble spread, and a signal comp<strong>on</strong>ent<br />
(SC) determined by the predictive mean signals. Our results show that the predicti<strong>on</strong> utility R is<br />
dominated by SC.<br />
Using a linear stochastic dynamical system, we further examined SC and found it to be<br />
intrinsically related to the leading eigenmode amplitude of the initial c<strong>on</strong>diti<strong>on</strong>s. This finding<br />
was validated by actual model predicti<strong>on</strong> results, and is also c<strong>on</strong>sistent with other recent work.<br />
<str<strong>on</strong>g>The</str<strong>on</strong>g> relati<strong>on</strong>ship between R and SC has particular practical significance for ENSO<br />
predictability studies, since it provides an inexpensive and robust method for exploring<br />
forecast uncertainties without the need for costly ensemble runs.<br />
Comparis<strong>on</strong> of Informati<strong>on</strong>-based Measures of Forecast Uncertainty in Ensemble ENSO<br />
Predicti<strong>on</strong><br />
Speaker: Youmin Tang<br />
Youmin Tang<br />
University of Northern British Columbia, Canada<br />
ytang@unbc.ca<br />
Richard Kleeman<br />
Courant Institute, New York University, USA<br />
Andrew Moore<br />
Uni. of California at Santa Cruz, USA<br />
In this study, we have applied informati<strong>on</strong> theory to investigate the reliability of El Nino<br />
Southern Oscillati<strong>on</strong> (ENSO) predicti<strong>on</strong>s from 1981-1998. Several recently proposed<br />
informati<strong>on</strong>-based measures, including relative entropy (R), predictive informati<strong>on</strong> (PI),<br />
predictive power (PP) and mutual informati<strong>on</strong> (MI), were explored for quantifying predicti<strong>on</strong><br />
reliability. It was found that the MI is a good indicator of overall pedictability. When it is large,<br />
the predicti<strong>on</strong> system has high predictability whereas small MI often corresp<strong>on</strong>ds to a low<br />
83
predicti<strong>on</strong> skill. <str<strong>on</strong>g>The</str<strong>on</strong>g> R and PI have a nearly identical average (over all predicti<strong>on</strong>s) as should<br />
be the case in theory.<br />
Comparing the different informati<strong>on</strong>-based measures reveals that R is a better predictor of<br />
predicti<strong>on</strong> reliability than PI and PP, especially when correlati<strong>on</strong>-based metrics are used to<br />
evaluate model predictability. A ``triangular relati<strong>on</strong>ship'' emerges between R and the model<br />
skill, namely that when R is large, the predicti<strong>on</strong> is likely to be reliable whereas when R is small,<br />
the predicti<strong>on</strong> skill is much variable. A small R is often accompanied by a relatively weak<br />
ENSO variability. <str<strong>on</strong>g>The</str<strong>on</strong>g> possible reas<strong>on</strong>s why R is superior to PI and PP as a measure of ENSO<br />
forecast reliability will also be discussed.<br />
Seas<strong>on</strong>al Climate Forecasts for the Southwestern U.S.<br />
Speaker: Klaus Wolter<br />
Klaus Wolter<br />
NOAA-CIRES Climate Diagnostics Center<br />
klaus.wolter@noaa.gov<br />
New and improved climate divisi<strong>on</strong>s can be used for the statistical predicti<strong>on</strong> of climate<br />
anomalies (here: precipitati<strong>on</strong>) in the interior southwestern U.S. After initial success with<br />
simple ENSO composites, the lack of clear-cut ENSO phases around 2000-2001 prompted<br />
further explorati<strong>on</strong> with other well-known telec<strong>on</strong>necti<strong>on</strong> indices. Stepwise linear regressi<strong>on</strong><br />
was chosen as the most straightforward statistical technique to test and develop predicti<strong>on</strong><br />
equati<strong>on</strong>s.<br />
Seas<strong>on</strong>al forecasts were trained <strong>on</strong> stati<strong>on</strong> data for the Water Years 1951 through 1999.<br />
This includes the implementati<strong>on</strong> of a statistical ensemble approach that uses five different<br />
base periods, bias-corrected for its performance within the 49-year record. After some<br />
experimentati<strong>on</strong>, publicly issued forecasts started in late 2001, and were c<strong>on</strong>tinually updated<br />
m<strong>on</strong>thly <strong>on</strong> the internet (http://www.cdc.noaa.gov/people/klaus.wolter/SWcasts/). Since the<br />
original data training period ended in September 1999, there will be almost eight years of<br />
verificati<strong>on</strong> data available by August <str<strong>on</strong>g>2007</str<strong>on</strong>g>.<br />
Seas<strong>on</strong>al forecast skill for the interior southwestern U.S. appears to be linked not <strong>on</strong>ly to<br />
ENSO (and its various 'flavors'), but also to SST regi<strong>on</strong>s further afield (Indian Ocean) as well<br />
as closer to the U.S. (eastern subtropical Pacific and Caribbean). Other useful predictors<br />
include northern hemispheric telec<strong>on</strong>necti<strong>on</strong> patterns, and antecedent regi<strong>on</strong>al precipitati<strong>on</strong><br />
anomalies. Verificati<strong>on</strong> skill for the last eight years exhibits large regi<strong>on</strong>al and seas<strong>on</strong>al<br />
variati<strong>on</strong>s, but has remained positive for all seas<strong>on</strong>s, in c<strong>on</strong>trast with official Climate Predicti<strong>on</strong><br />
Center forecasts for this regi<strong>on</strong>. This presentati<strong>on</strong> highlights the regi<strong>on</strong>s and seas<strong>on</strong>s with the<br />
highest skill, and reports <strong>on</strong> possible c<strong>on</strong>tributors to this skill.<br />
84
Parallel Sessi<strong>on</strong>s:Simulati<strong>on</strong> tools for weather generati<strong>on</strong> and risk assessment<br />
High resoluti<strong>on</strong> simulati<strong>on</strong> of weather sequences for binary events with Generative Classifiers<br />
Speaker: Rafael Ancell<br />
Rafael Ancell<br />
Spanish Nati<strong>on</strong>al Meteorological Institute (INM)<br />
rct@inm.es<br />
Jose M. Gutierrez<br />
University of Cantabria<br />
Different generative classifiers have been used to develop a probabilistic model for the<br />
simulati<strong>on</strong> of high resoluti<strong>on</strong> spatially distributed weather sequences for binary events. <str<strong>on</strong>g>The</str<strong>on</strong>g><br />
main difference between discriminative and generative classifiers is that discriminative<br />
classifiers directly model the posterior probability, and the generative <strong>on</strong>es first model the joint<br />
probability distributi<strong>on</strong> to get the posterior, taking into account the relati<strong>on</strong>ships am<strong>on</strong>g the<br />
different attributes given some kind of available evidence. Generative Classifiers provide us a<br />
simple method for generating stochastic weather in a spatially c<strong>on</strong>sistent manner. Instead of<br />
simulating values independently for each variable (as in standard weather generator methods)<br />
we simulate spatial realizati<strong>on</strong>s taking into account the c<strong>on</strong>straints imposed by the<br />
dependencies am<strong>on</strong>g the atributes. This work illustrates the applicati<strong>on</strong> of this methodology in<br />
the case of discrete variables (precipitati<strong>on</strong>), though a similar scheme is also applicable to the<br />
c<strong>on</strong>tinuous case.<br />
<str<strong>on</strong>g>The</str<strong>on</strong>g> study has been carried out over a small area with 42 locati<strong>on</strong>s in Northern Spain, and<br />
both extreme and normal precipitai<strong>on</strong> events have been c<strong>on</strong>sidered. <str<strong>on</strong>g>The</str<strong>on</strong>g> validati<strong>on</strong> of the<br />
results is based <strong>on</strong> the RSA (ROC skill area). Three generative classifier models are evaluated:<br />
naive Bayes, augmented naive Bayes, and general probabilistic models (Bayesian networks),<br />
in different nowcasting, forecasting and climate problems. Finally we show that, in the<br />
forecasting situati<strong>on</strong>, the spatial dependencies do not provide any additi<strong>on</strong>al informati<strong>on</strong> to the<br />
simple naive Bayes when an estimati<strong>on</strong> of the atmospheric state (numerical weather predicti<strong>on</strong>)<br />
is given. However, these dependencies become very important in the nowcasting and climate<br />
paradigms, i.e. when some kind of evidence, other than the atmospheric state, is c<strong>on</strong>sidered.<br />
Using multi-site stochastic downscaling to understand regi<strong>on</strong>al precipitati<strong>on</strong> variability and<br />
trends across southern Australia<br />
Speaker: Stephen P. Charles<br />
Stephen P. Charles<br />
CSIRO Land and Water<br />
85
Steve.Charles@csiro.au<br />
Brys<strong>on</strong> C. Bates<br />
CSIRO Marine and Atmospheric Research<br />
Guobin Fu<br />
CSIRO Land and Water<br />
A stochastic downscaling framework based <strong>on</strong> a n<strong>on</strong>homogeneous hidden Markov<br />
model (NHMM) identifies how regi<strong>on</strong>al precipitati<strong>on</strong> changes are related to large-scale<br />
atmospheric forcing. <str<strong>on</strong>g>The</str<strong>on</strong>g> NHMM stochastically simulates multi-site, daily precipitati<strong>on</strong><br />
c<strong>on</strong>diti<strong>on</strong>al <strong>on</strong> large-scale atmospheric forcing. When driven by observed atmospheric<br />
predictors, from NCEP/NCAR Reanalysis, the NHMM is able to reproduce the statistical<br />
properties of daily, intra-seas<strong>on</strong>al, inter-annual and inter-decadal multi-site precipitati<strong>on</strong> for<br />
several regi<strong>on</strong>s across temperate, mid-latitude southern Australia.<br />
Although originally proposed as a tool for climate change projecti<strong>on</strong>, we highlight the<br />
benefits of using such stochastic downscaling models for ‘forensic climatology’ – to understand<br />
the drivers of significant decreases in both variability and amount of precipitati<strong>on</strong> experienced<br />
across southern Australia in recent decades. Links to detecti<strong>on</strong> and attributi<strong>on</strong> research, and<br />
other recent investigati<strong>on</strong>s into how these changes relate to hemispherical circulati<strong>on</strong>, will also<br />
be discussed.<br />
Improving the simulati<strong>on</strong> of extreme events by stochastic weather generators<br />
Speaker: Richard W. Katz<br />
Richard W. Katz<br />
Nati<strong>on</strong>al Center for Atmospheric Research<br />
rwk@ucar.edu<br />
Eva M. Furrer<br />
Nati<strong>on</strong>al Center for Atmospheric Research<br />
Stochastic weather generators are used for a number of purposes, including<br />
disaggregati<strong>on</strong> of climate forecasts and statistical downscaling of the output of climate change<br />
experiments. Although entire sequences of daily weather are usually required, in many<br />
applicati<strong>on</strong>s it is extreme weather events (such as high precipitati<strong>on</strong> amounts) that are<br />
particularly important. Although much is known about the characteristics of extreme weather<br />
events (e.g., the apparent heavy upper tail of daily precipitati<strong>on</strong> amount), such informati<strong>on</strong> is<br />
seldom explicitly taken into account in c<strong>on</strong>venti<strong>on</strong>al stochastic weather generators.<br />
One approach to stochastic weather generati<strong>on</strong> is resampling. This approach is<br />
n<strong>on</strong>parametric, with the advantage that the shape of the distributi<strong>on</strong> of a weather variable is<br />
not assumed a priori. However, it has the disadvantage that no value outside the span of the<br />
86
data can ever be generated. In fact, c<strong>on</strong>venti<strong>on</strong>al resampling algorithms, such as the standard<br />
form of bootstrap, fail for the maximum value of a sample or when the underlying distributi<strong>on</strong> is<br />
heavy-tailed. Such limitati<strong>on</strong>s of the resampling approach are dem<strong>on</strong>strated in this talk by<br />
example.<br />
<str<strong>on</strong>g>The</str<strong>on</strong>g> alternative approach to stochastic weather generati<strong>on</strong> is parametric. This approach<br />
involves a formal stochastic model for time series of daily weather variables (e.g., a Markov<br />
chain model for precipitati<strong>on</strong> occurrence). Because the parametric distributi<strong>on</strong>s (e.g., gamma)<br />
typically used cannot produce a heavy tail, precipitati<strong>on</strong> extremes can be underestimated by a<br />
substantial amount.<br />
Furrer and Katz (<str<strong>on</strong>g>2007</str<strong>on</strong>g>) proposed a generalized linear modeling (GLM) technique for<br />
parametric stochastic weather generati<strong>on</strong>. <str<strong>on</strong>g>The</str<strong>on</strong>g> GLM technique and its extensi<strong>on</strong>s are used in<br />
this talk to explore how the simulati<strong>on</strong> of high precipitati<strong>on</strong> amounts can be improved. In<br />
particular, the substituti<strong>on</strong> of a stretched exp<strong>on</strong>ential (or Weibull) distributi<strong>on</strong>, instead of the<br />
gamma, for the upper tail of daily precipitati<strong>on</strong> amounts can be readily incorporated into the<br />
GLM approach. Extreme value theory has established that such a distributi<strong>on</strong> can produce an<br />
apparent heavy tail. Requiring an extensi<strong>on</strong> of the GLM framework is the technique of fitting a<br />
mixture of two Weibull distributi<strong>on</strong>s to daily precipitati<strong>on</strong> amount. <str<strong>on</strong>g>The</str<strong>on</strong>g> results suggest that the<br />
simulati<strong>on</strong> of extreme precipitati<strong>on</strong> events can be substantially improved, with a stochastic<br />
model that remains fairly parsim<strong>on</strong>ious.<br />
Reference<br />
Furrer, E.M., and R.W. Katz, <str<strong>on</strong>g>2007</str<strong>on</strong>g>: Generalized linear modeling approach to stochastic<br />
weather generators. Climate Research (in press).<br />
Atmospheric dust dispersi<strong>on</strong> from disking operati<strong>on</strong>: near-field simulati<strong>on</strong><br />
Speaker: Junming wang<br />
Junming wang<br />
New Mexico State University, Plant & Envir<strong>on</strong>mental Sciences, USA<br />
jwang@nmsu.edu<br />
April L. Hiscox<br />
University of C<strong>on</strong>necticut, USA<br />
David R. Miller<br />
University of C<strong>on</strong>necticut, USA<br />
Ted Sammis<br />
New Mexico State University, Plant & Envir<strong>on</strong>mental Sciences, USA<br />
Wenli Yang, Britt A. Holmén<br />
University of California at Davis, USA<br />
This paper presents a dynamic random-walk model which simulates the field-scale<br />
PM10 (particle m) dust dispersi<strong>on</strong> from an agriculture operati<strong>on</strong>μmatter of diameter ≤10<br />
87
(disking). <str<strong>on</strong>g>The</str<strong>on</strong>g> major inputs are the mean wind speed (wind fricti<strong>on</strong> velocity, u*) and directi<strong>on</strong> in<br />
the simulati<strong>on</strong> period, atmospheric stability, and source strength (g/s, or particle numbers/s). In<br />
each time step (usually dt
egi<strong>on</strong> can be explained by the random evoluti<strong>on</strong> of the stochastic models, i.e. about 45% of<br />
the observed seas<strong>on</strong>al-mean rainfall variance lies outside of the regi<strong>on</strong>al chain-dependent<br />
model’s capability (which is termed the “potentially predictable” variance). In additi<strong>on</strong>, <strong>on</strong>ly a<br />
small fracti<strong>on</strong> of observed years (between 10% to 20% over a given sub-regime) c<strong>on</strong>tain<br />
seas<strong>on</strong>al-mean precipitati<strong>on</strong> anomalies that c<strong>on</strong>tribute to this potentially-predictable variance.<br />
Next, the influences of the various comp<strong>on</strong>ent sub-processes – rainfall occurrence, rainfall<br />
coverage, and rainfall intensity – up<strong>on</strong> the overall precipitati<strong>on</strong> anomalies are analyzed. Study<br />
results indicate that year-to-year variati<strong>on</strong>s of all three can produce rainfall anomalies in a<br />
given year. However year-to-year variati<strong>on</strong>s in coverage have the greatest impact up<strong>on</strong><br />
seas<strong>on</strong>al rainfall anomalies in each regi<strong>on</strong>. Finally, the influence of regi<strong>on</strong>al rainfall variati<strong>on</strong>s<br />
<strong>on</strong> precipitati<strong>on</strong> anomalies at single stati<strong>on</strong> is analyzed. Study results indicate that the regi<strong>on</strong>al<br />
chain-dependent models can capture more than 60% of the stati<strong>on</strong>-based variance in the<br />
summertime precipitati<strong>on</strong>. In additi<strong>on</strong>, 70% of the seas<strong>on</strong>al precipitati<strong>on</strong> variance at a given<br />
stati<strong>on</strong> is accounted for by regi<strong>on</strong>al variability and <strong>on</strong>ly about 30% of the variance is<br />
c<strong>on</strong>tributed by local processes.<br />
A study of daily precipitati<strong>on</strong> in North <str<strong>on</strong>g>China</str<strong>on</strong>g> using generalized linear models<br />
Speaker: Yi Wang<br />
Yi Wang<br />
IAP<br />
wangyi@mail.tea.ac.cn<br />
Yan Zh<strong>on</strong>gwei<br />
IAP<br />
Daily precipitati<strong>on</strong> series for North <str<strong>on</strong>g>China</str<strong>on</strong>g> during 1961-2004 was analyzed with<br />
generalized linear models (GLM). A two-stage approach was adopted. Firstly, the pattern of<br />
wet and dry was fitted using logistic regressi<strong>on</strong>; sec<strong>on</strong>dly, the precipitati<strong>on</strong> amount during wet<br />
days was fitted under gamma distributi<strong>on</strong>. <str<strong>on</strong>g>The</str<strong>on</strong>g> regi<strong>on</strong>al daily precipitati<strong>on</strong> sequence was<br />
simulated by incorporating significant large-scale climate indices and interacti<strong>on</strong>s between<br />
predictors (e.g. seas<strong>on</strong>al effect, rainfall autocorrelati<strong>on</strong> and persistence).<br />
<str<strong>on</strong>g>The</str<strong>on</strong>g> results suggested most influential factors affecting precipitati<strong>on</strong> in North <str<strong>on</strong>g>China</str<strong>on</strong>g>, as<br />
listed below.<br />
(1) North Pacific pattern (NP): a striking negative correlati<strong>on</strong> exits between annual wet days<br />
in North <str<strong>on</strong>g>China</str<strong>on</strong>g> and the NP index. <str<strong>on</strong>g>The</str<strong>on</strong>g> positive phase of the NP pattern is associated with less<br />
annual wet day numbers in North <str<strong>on</strong>g>China</str<strong>on</strong>g>. <str<strong>on</strong>g>The</str<strong>on</strong>g> NP also influences the summer rainfall intensity<br />
in North <str<strong>on</strong>g>China</str<strong>on</strong>g>. <str<strong>on</strong>g>The</str<strong>on</strong>g> positive (negative) phase of NP corresp<strong>on</strong>ds to deficient (excessive)<br />
rainfall.<br />
(2) <str<strong>on</strong>g>The</str<strong>on</strong>g> Arctic Oscillati<strong>on</strong> (AO): this pattern is found to be significantly correlated with the<br />
summer precipitati<strong>on</strong> amount in North <str<strong>on</strong>g>China</str<strong>on</strong>g>. A larger AO index corresp<strong>on</strong>ds to weaker<br />
precipitati<strong>on</strong>.<br />
89
(3) Large-scale circulati<strong>on</strong> at 500hPa height: the Asian z<strong>on</strong>al circulati<strong>on</strong> in JJA is negatively<br />
correlated with both the precipitati<strong>on</strong> occurrence and severity. Another influential factor is the<br />
Subtropical High in the Western Pacific (SHWP) in summer: the str<strong>on</strong>ger the SHWP is the<br />
larger the number of rainy days in North <str<strong>on</strong>g>China</str<strong>on</strong>g>.<br />
(4) East Asian Summer M<strong>on</strong>so<strong>on</strong>: A lower EAP (East Asian-Pacific Pattern) index, indicating<br />
weaker East Asian m<strong>on</strong>so<strong>on</strong>s, corresp<strong>on</strong>ds to less summer precipitati<strong>on</strong> in North <str<strong>on</strong>g>China</str<strong>on</strong>g>. In<br />
additi<strong>on</strong>, when <strong>on</strong>set of South <str<strong>on</strong>g>China</str<strong>on</strong>g> Sea summer m<strong>on</strong>so<strong>on</strong> (SCSM) is early, the rainfall is rich<br />
and persistent.<br />
Parallel Sessi<strong>on</strong>s: ENSO and M<strong>on</strong>so<strong>on</strong><br />
<str<strong>on</strong>g>The</str<strong>on</strong>g> preparati<strong>on</strong> of the colza suitability map using statistical analysis and GIS<br />
Speaker: Hamed Adab<br />
Hamed Adab<br />
Abstract In this paper, 10 envir<strong>on</strong>mental data items including climatic and physical<br />
variables for colza cultivati<strong>on</strong> collected from 24 sample farmlands in Sabzevar township within<br />
the period of agricultural year 2004-2005 and then required statistical analysis carried out for<br />
the selected farmlands in order to select the significant linear multiple regressi<strong>on</strong> procedures<br />
including enter, stepwise and backward in c<strong>on</strong>necti<strong>on</strong> to colza yield . After selecting backward<br />
procedure as the best model, four envir<strong>on</strong>mental c<strong>on</strong>diti<strong>on</strong> variables including degree-day,<br />
mean temperature, slope and EC of used groundwater extracted as necessary variables for<br />
z<strong>on</strong>ati<strong>on</strong> of suitable areas in the whole the study area. <str<strong>on</strong>g>The</str<strong>on</strong>g>n the spatial maps of the selected<br />
variables were prepared and the z<strong>on</strong>ati<strong>on</strong> map of suitable areas for cultivati<strong>on</strong> of colza was<br />
prepared using GIS functi<strong>on</strong>s. <str<strong>on</strong>g>The</str<strong>on</strong>g> results show that the appropriate regi<strong>on</strong>s for cultivati<strong>on</strong> of<br />
colza are located in the plain regi<strong>on</strong> in Sabzevar. Toward the border of the plain, suitability<br />
c<strong>on</strong>diti<strong>on</strong>s of colza cultivati<strong>on</strong> is degrading. Keywords: Colza, Sabzevar, linear multiple<br />
regressi<strong>on</strong>, Geographical Informati<strong>on</strong> System (GIS).<br />
Multi-scale analysis of the surface energy balance during the corn growing seas<strong>on</strong>, and a new<br />
reas<strong>on</strong> for energy unclosed<br />
Speaker: Jianxia Guo<br />
Jianxia Guo<br />
<str<strong>on</strong>g>Beijing</str<strong>on</strong>g> Normal University<br />
gyr@bnu.edu.cn<br />
Field measurement data collected from the agricultural and meteorological test stati<strong>on</strong> of<br />
CMA, 2004, was employed to investigate the energy balance problem during the entire corn<br />
growing seas<strong>on</strong>. Analysis was performed for the entire growing seas<strong>on</strong>, 10-day, diurnal, and<br />
90
<strong>on</strong> instantaneous time scales, respectively. <str<strong>on</strong>g>The</str<strong>on</strong>g> statistical regressi<strong>on</strong> slope of turbulent energy<br />
fluxes (sensible and latent heats) against available energy (net radiati<strong>on</strong>, less the ground heat<br />
flux) is 75.79% for the entire corn growing seas<strong>on</strong>, which indicates a lack of closure of 24.2%.<br />
<str<strong>on</strong>g>The</str<strong>on</strong>g> imbalance is greatest during nocturnal periods. <str<strong>on</strong>g>The</str<strong>on</strong>g> regressi<strong>on</strong> slope of daytime data is<br />
89% during the 10 days of mid-June, and gradually decreases to 67% during the 10 days of<br />
early October, showing the seas<strong>on</strong>al decrease of energy closure with the corn growth. <str<strong>on</strong>g>The</str<strong>on</strong>g><br />
diurnal cycle of the energy utilizing ratios show that the energy closure in afterno<strong>on</strong>s is better<br />
than mornings. <str<strong>on</strong>g>The</str<strong>on</strong>g> instantaneous energy utilizing ratios are mainly c<strong>on</strong>centrated within the<br />
range of 0~1, but there also exist a number of values outside this range even during the<br />
daytime. <str<strong>on</strong>g>The</str<strong>on</strong>g> latent heat is the main energy c<strong>on</strong>sumpti<strong>on</strong> form <strong>on</strong> all scales. <str<strong>on</strong>g>The</str<strong>on</strong>g> heat storage<br />
term from the energy balance equati<strong>on</strong>, may exceed the sensible heat in as l<strong>on</strong>g as seventy<br />
days, which suggests it should not be omitted from the energy balance analysis of the corn<br />
field. <str<strong>on</strong>g>The</str<strong>on</strong>g>re are phase differences that exist in the diurnal cycle of the energy comp<strong>on</strong>ents. <str<strong>on</strong>g>The</str<strong>on</strong>g><br />
phase of the heat storage term is often shifted to earlier times with respect to the net radiati<strong>on</strong>.<br />
We explore the lagging effect of turbulent fluxes as a new reas<strong>on</strong> for failing to obtain the<br />
energy closure. Results show that the energy closure ratios are improved <strong>on</strong> all time scales<br />
when turbulent fluxes are lagged by 30 minutes to the available energy. As well as not <strong>on</strong>ly the<br />
ratio points outside the range of 0~1, but also the earlier phase of the heat storage term are<br />
improved in some degree.<br />
Effects of land cover change <strong>on</strong> East Asian summer m<strong>on</strong>so<strong>on</strong> variability<br />
Speaker: Eungul Lee<br />
Eungul Lee<br />
CIRES and U of Colorado-Boulder<br />
eungul.lee@colorado.edu<br />
Thomas N. Chase<br />
CIRES and U of Colorado-Boulder<br />
Balaji Rajagopalan<br />
CIRES and U of Colorado-Boulder<br />
<str<strong>on</strong>g>The</str<strong>on</strong>g> East Asian Summer M<strong>on</strong>so<strong>on</strong> (EASM) is a tropical/subtropical m<strong>on</strong>so<strong>on</strong> covering<br />
eastern <str<strong>on</strong>g>China</str<strong>on</strong>g>, the Korean peninsula, Japan, and the adjacent marginal seas. <str<strong>on</strong>g>The</str<strong>on</strong>g> regi<strong>on</strong> of<br />
the EASM in this study will be 20°~50°N and 110°~145°E. We have shown in previous<br />
research (Lee et al., in press) that there exist two comp<strong>on</strong>ents to the EASM, a northern<br />
comp<strong>on</strong>ent and southern comp<strong>on</strong>ent, which are differentiated because they have different<br />
causal relati<strong>on</strong>ships with heat sources in the surrounding oceans. Each comp<strong>on</strong>ent of the<br />
EASM can be skillfully predicted by these causal relati<strong>on</strong>ships.<br />
We wish to build <strong>on</strong> the previous research of Lee et al. and our proposed research will<br />
address the following questi<strong>on</strong>s: (1) How do land factors affect the strength, seas<strong>on</strong>ality, and<br />
sub-seas<strong>on</strong>al variability of the EASM; (2) How do land and ocean factors interact to determine<br />
these properties for the EASM; (3) whether statistical models using a combinati<strong>on</strong> of land<br />
cover and ocean heating factors skillfully predict EASM precipitati<strong>on</strong>; (4) whether models of the<br />
91
sub-EASMs behave differently when land factors included; and (5) Do the statistical models<br />
based <strong>on</strong> observati<strong>on</strong>al data have good agreement with climate model simulati<strong>on</strong>s and can<br />
these climate models elucidate the physical mechanisms governing m<strong>on</strong>so<strong>on</strong> strength and<br />
seas<strong>on</strong>ality.<br />
Spatial correlati<strong>on</strong>, Empirical Orthog<strong>on</strong>al Functi<strong>on</strong> (EOF), and composite analyses will be<br />
used to dem<strong>on</strong>strate the relati<strong>on</strong>ships between the EASM and the surrounding land surface<br />
factors such as density of vegetati<strong>on</strong> cover, snow cover, soil moisture, and irrigati<strong>on</strong> extent.<br />
Multivariate linear and n<strong>on</strong>-linear regressi<strong>on</strong>s using stepwise methods will be applied to create<br />
the forecast models for the EASM. <str<strong>on</strong>g>The</str<strong>on</strong>g>se will be compared against EOF analyses for<br />
c<strong>on</strong>sistency. Observed relati<strong>on</strong>ships affecting the EASM will also be compared with results<br />
from general circulati<strong>on</strong> model experiments in order to illuminate the physical mechanisms<br />
involved.<br />
Seas<strong>on</strong>al Predicti<strong>on</strong> of Rainfall over Peninsular India using a Principal Comp<strong>on</strong>ent Regressi<strong>on</strong><br />
Model<br />
Speaker: Lorna R. Nayagam<br />
Lorna R. Nayagam<br />
Department of Atmospheric Sciences, Cochin University of Science and Technology<br />
lorna@cusat.ac.in<br />
Rajesh J.<br />
Department of Atmospheric Sciences, Cochin University of Science and Technology<br />
H. S. Ram Mohan<br />
Department of Atmospheric Sciences, Cochin University of Science and Technology<br />
<str<strong>on</strong>g>The</str<strong>on</strong>g> aim of the study is to develop a principal comp<strong>on</strong>ent regressi<strong>on</strong> model to predict the<br />
summer m<strong>on</strong>so<strong>on</strong> rainfall over Peninsular India (PIR). Correlati<strong>on</strong> between PIR and several<br />
global parameters were found and those areas having 99% significance were selected for<br />
making indices. <str<strong>on</strong>g>The</str<strong>on</strong>g> c<strong>on</strong>sistency of the relati<strong>on</strong>ship between these indices and PIR was<br />
checked by doing a 15-year sliding window correlati<strong>on</strong> (significant at 5% level). Seven indices<br />
having high correlati<strong>on</strong> were selected. Indices are relative humidity at 925hPa (apr), specific<br />
humidity at 850hPa (apr), sea level pressure (may), z<strong>on</strong>al wind at 100 hPa (apr), 30 hPa (feb),<br />
70 hPa (jan) and meridi<strong>on</strong>al wind at 10 hPa (jan) over different spatial locati<strong>on</strong>s. PCA is d<strong>on</strong>e<br />
using these seven indices, for the period 1977-2005. Six comp<strong>on</strong>ents with eigen value greater<br />
than two which explains the maximum variance were selected for further analysis. A multiple<br />
linear regressi<strong>on</strong> model was developed using these comp<strong>on</strong>ents for the period 1977-1998.<br />
<str<strong>on</strong>g>The</str<strong>on</strong>g> model has a multiple correlati<strong>on</strong> of 0.917 and coefficient of determinati<strong>on</strong> of 84 %. <str<strong>on</strong>g>The</str<strong>on</strong>g> VIF<br />
analysis of all the parameters that is retained in the model have values less than 2 indicating<br />
an insignificant level of multicollinearity and has a Durbin Wats<strong>on</strong> value of 1.54. <str<strong>on</strong>g>The</str<strong>on</strong>g> model<br />
performance was assessed for 7 years (1999-2005) using statistical measures such as RMSE,<br />
BIAS and ABSE. <str<strong>on</strong>g>The</str<strong>on</strong>g> model has a RMSE of 6.71 %, BIAS of 0.13% and ABSE of 5.28% of<br />
l<strong>on</strong>g-term average. Climatological predicti<strong>on</strong>s were also made and found that RMSE, BIAS<br />
and ABSE are 16.75%, -14.08% and 14.52% of l<strong>on</strong>g term average, respectively.<br />
92
Key words:- principal comp<strong>on</strong>ent regressi<strong>on</strong>, Climatological predicti<strong>on</strong>s, multiple correlati<strong>on</strong><br />
L<strong>on</strong>g Range Forecasting of M<strong>on</strong>so<strong>on</strong> Rainfall over Peninsular India for Recent Years<br />
Speaker: J Rajesh<br />
J Rajesh<br />
Department of Atmospheric Sciences, Cochin University of Science and Technology<br />
rajeshj@cusat.ac.in<br />
Lorna R. Nayagam<br />
Department of Atmospheric Sciences, Cochin University of Science and Technology<br />
K. Mohankumar<br />
Department of Atmospheric Sciences, Cochin University of Science and Technology<br />
H. S. Ran Mohan<br />
Department of Atmospheric Sciences, Cochin University of Science and Technology<br />
This study attempts to develop a linear multiple regressi<strong>on</strong> model to predict the summer<br />
m<strong>on</strong>so<strong>on</strong> rainfall over Peninsular India (PIR) for recent years. Correlati<strong>on</strong> between PIR and<br />
several global parameters were found and areas having 99% significance were selected as<br />
indices. <str<strong>on</strong>g>The</str<strong>on</strong>g> c<strong>on</strong>sistency of the relati<strong>on</strong>ship between these indices and PIR was checked by<br />
doing a 15-year sliding window correlati<strong>on</strong> (significant at 5% level). Nineteen indices were<br />
used as the input and 3 predictors were selected by the stepwise regressi<strong>on</strong> method. <str<strong>on</strong>g>The</str<strong>on</strong>g><br />
predictors are Z<strong>on</strong>al wind at 700Pa (mar), 200 hPa (Jan) and 10 hPa (Feb.) over different<br />
spatial locati<strong>on</strong>s. <str<strong>on</strong>g>The</str<strong>on</strong>g>se 3 predictors were used to develop the linear regressi<strong>on</strong> model. <str<strong>on</strong>g>The</str<strong>on</strong>g><br />
model has been trained for a period of 23 years (1981-2003). <str<strong>on</strong>g>The</str<strong>on</strong>g> model has a multiple<br />
correlati<strong>on</strong> of 0.908 and coefficient of determinati<strong>on</strong> of 82.5%. <str<strong>on</strong>g>The</str<strong>on</strong>g> VIF analysis of all the<br />
parameters that is retained in the stepwise regressi<strong>on</strong> have values less than 2 indicating an<br />
insignificant level of multicollinearity and has a Durbin Wats<strong>on</strong> value of 1.82.<str<strong>on</strong>g>The</str<strong>on</strong>g> model was<br />
assessed validated for 4 years (2004 -<str<strong>on</strong>g>2007</str<strong>on</strong>g>). <str<strong>on</strong>g>The</str<strong>on</strong>g> model has a RMSE of 7%, BIAS of 0 and<br />
ABSE of 5.98% of l<strong>on</strong>g-term average, for the training period. Climatological predicti<strong>on</strong>s were<br />
also made and found that RMSE, BIAS and ABSE are 15.42%, 3.37% and 11.69% of l<strong>on</strong>g<br />
term average, respectively.<br />
M<strong>on</strong>itoring and defining El Ni?o/Southern Oscillati<strong>on</strong> behaviour with an enhanced Multivariate<br />
ENSO Index (MEI)<br />
Speaker: Klaus Wolter<br />
Klaus Wolter<br />
NOAA-CIRES Climate Diagnostics Center<br />
klaus.wolter@noaa.gov<br />
Michael Timlin<br />
93
NOAA-CIRES Climate Diagnostics Center<br />
Fi<strong>on</strong>a Horsfall<br />
NWS Climate Services, Office of Services, NOAA<br />
This talk addresses the need for an internati<strong>on</strong>ally acceptable ENSO index that allows<br />
for the global definiti<strong>on</strong> of ENSO events under operati<strong>on</strong>al, near-realtime c<strong>on</strong>diti<strong>on</strong>s. <str<strong>on</strong>g>The</str<strong>on</strong>g> MEI<br />
appears uniquely qualified to fulfill this need. It was originally defined as the first Principal<br />
Comp<strong>on</strong>ent of six atmosphere-ocean (COADS ) variables in the tropical Pacific basin. Here we<br />
describe a new effort to expand the MEI c<strong>on</strong>cept to include both satellite (OLR) and<br />
subsurface data. Since these data sets are <strong>on</strong>ly available for the last two+ decades, it will be<br />
necessary to extend and blend the new MEI time series with the original MEI to allow for<br />
historical analyses prior to 1979. On the other hand, l<strong>on</strong>g-term trends in MEI-related climate<br />
data will have to be removed in order to separate ‘Global Change’ from ENSO signals.<br />
Parallel Sessi<strong>on</strong>s:Spatial statistics<br />
Interacti<strong>on</strong>s between dust clouds and meningitis epidemics in the Sahel: a geostatistical study<br />
Speaker: Béatrice Augereau<br />
Béatrice Augereau<br />
Pôle Image - Université Paris-Diderot Paris 7<br />
Hans Wackernagel<br />
Geostatistics group - Ecole des Mines de Paris<br />
Solenne Philipp<strong>on</strong><br />
PRODIG -- UMR 8586 CNRS<br />
Jean-Claude Bergès<br />
PRODIG -- UMR 8586 CNRS<br />
Catherine Mering<br />
Pôle Image - Université Paris-Diderot Paris 7<br />
Meningitis due to meningococcus may cause severe epidemics in Africa: 200,000<br />
cases and 20,000 casualties in 1996 for the whole Sahel z<strong>on</strong>e; in <str<strong>on</strong>g>2007</str<strong>on</strong>g> there were over 20,000<br />
cases reported for Burkina Faso. <str<strong>on</strong>g>The</str<strong>on</strong>g> priviledged hypothesis in the present study is that of a<br />
link between dust clouds and the start of an epidemic. <str<strong>on</strong>g>The</str<strong>on</strong>g> meningitis data in the present study<br />
(1992-2003) stems from health centers in different regi<strong>on</strong>s of Mali. <str<strong>on</strong>g>The</str<strong>on</strong>g> dust clouds in the<br />
Sahel were identified by processing images from the Meteosat geostati<strong>on</strong>ary satelite. <str<strong>on</strong>g>The</str<strong>on</strong>g><br />
spatial and temporal co-occurences of meteorological events and meningitis epidemics have<br />
94
een analysed with geostatistical tools taking account of delay effects between the former and<br />
the latter.<br />
<str<strong>on</strong>g>The</str<strong>on</strong>g> present work prepares the ground for Meteosat Sec<strong>on</strong>d Generati<strong>on</strong> (MSG) studies,<br />
which will rely <strong>on</strong> data with a better space-time coverage and with more climatological<br />
parameters, like e.g. temperature and humidity, whose sudden variati<strong>on</strong>s in pre-m<strong>on</strong>so<strong>on</strong><br />
periods are important factors. Eventually this could yield to the development of derivate<br />
products providing forecasts of meningitis in the Sahel, leading ultimately to a better<br />
planificati<strong>on</strong> of vaccinati<strong>on</strong> campaigns.<br />
Estimati<strong>on</strong> of the missing data by principal comp<strong>on</strong>ents analysis<br />
Speaker: L. Benaichata<br />
L. Benaichata<br />
Université de Tiaret<br />
l_benaichata@mail.univ-tiaret.dz<br />
M. Kadi<br />
African Centre of Meteorological Applicati<strong>on</strong> for Development<br />
From observati<strong>on</strong> to the use, weather data must be treated and checked before final use.<br />
One of the problems met is the missing data displayed in many datasets from weather stati<strong>on</strong>.<br />
Thus, we try to solve this problem by using <strong>on</strong>e of the methods of Eigenvectors called Principal<br />
Comp<strong>on</strong>ents Analysis (PCA). he work c<strong>on</strong>sists in testing the method <strong>on</strong> a matrix with a logical<br />
in its data. <str<strong>on</strong>g>The</str<strong>on</strong>g> method is compared with two others, Regressi<strong>on</strong> substituti<strong>on</strong> and EM<br />
estimati<strong>on</strong>.Apparently the PCA method rec<strong>on</strong>stitutes the missing data perfectly and better.<br />
However, the method is applied to a climatic file which c<strong>on</strong>tains precipitati<strong>on</strong> data from<br />
weather stati<strong>on</strong>s bel<strong>on</strong>ging to the same regi<strong>on</strong> from the statistical point of view. Results are<br />
particularly encouraging showing the effectiveness of the method.<br />
Spatial interpolati<strong>on</strong> of daily precipitati<strong>on</strong> in <str<strong>on</strong>g>China</str<strong>on</strong>g>: 1951-2000<br />
Speaker: Deliang Chen<br />
Deliang Chen<br />
Earth Sciences Centre, Gothenburg University, Sweden<br />
deliang@gvc.gu.se<br />
Lebing G<strong>on</strong>g<br />
Earth Sciences Centre, Uppsala University, Sweden<br />
Ch<strong>on</strong>-yu Xu<br />
Earth Sciences Centre, Uppsala University, Sweden<br />
Weijing Li<br />
Nati<strong>on</strong>al Climate Center, <str<strong>on</strong>g>China</str<strong>on</strong>g> Meteorological Administrati<strong>on</strong>, <str<strong>on</strong>g>China</str<strong>on</strong>g><br />
Chang-Hoi Ho<br />
95
School of Earth and Envir<strong>on</strong>mental Sciences, Seoul Nati<strong>on</strong>al University, Korea<br />
Climate research relies heavily <strong>on</strong> good quality instrumental data. So far relatively little<br />
efforts have been made to create gridded climate data for <str<strong>on</strong>g>China</str<strong>on</strong>g>. This is especially true for<br />
high resoluti<strong>on</strong> data that can be used to study regi<strong>on</strong>al climate variability and to validate<br />
regi<strong>on</strong>al climate models. This work focuses <strong>on</strong> gridding of daily precipitati<strong>on</strong> in <str<strong>on</strong>g>China</str<strong>on</strong>g> over the<br />
last 50 years. Daily precipitati<strong>on</strong> data of <str<strong>on</strong>g>China</str<strong>on</strong>g> from 726 stati<strong>on</strong>s during 1951 and 2000 are<br />
interpolated to a high-resoluti<strong>on</strong> 18km*18km spatial grid system covering the whole country. A<br />
0.5o*0.5o block interpolati<strong>on</strong> is then obtained by averaging the grid nodes falling in each block.<br />
Am<strong>on</strong>g comm<strong>on</strong>ly used interpolati<strong>on</strong> methods, ordinary kriging (OK) based <strong>on</strong> seas<strong>on</strong>al<br />
semi-variogram is chosen because it shows the best and the most robust performance in cross<br />
validati<strong>on</strong> (CV). OK shows better results than those from Inverse Distance Weighting (IDW)<br />
method, the sec<strong>on</strong>d-best method. Excluding the 126 stati<strong>on</strong>s (17% of 726 stati<strong>on</strong>s) in the<br />
northwest arid area, the daily, m<strong>on</strong>thly and annual relative mean absolute error (RMAE)<br />
established by CV for the other 600 stati<strong>on</strong>s is 58%, 26% and 13% respectively. A close look<br />
at the results for tropical <str<strong>on</strong>g>China</str<strong>on</strong>g> shows that the interpolated results have a relatively high<br />
reliability there.<br />
Applicati<strong>on</strong>s of Bayesian Networks in Climate<br />
Speaker: Jose M. Gutierrez<br />
Jose M. Gutierrez<br />
University of Cantabria<br />
manuel.gutierrez@unican.es<br />
Rafael Ancell<br />
Spanish Nati<strong>on</strong>al Meteorological Institute (INM)<br />
Carmen M. Sordo<br />
University of Cantabria<br />
Probabilistic networks are an efficient datamining tool which provides a compact and<br />
simple probabilistic representati<strong>on</strong> of informati<strong>on</strong>. This technique can deal with a large number<br />
of variables (discrete or c<strong>on</strong>tinuous) extracting <strong>on</strong>ly the relevant dependencies am<strong>on</strong>g them.<br />
<str<strong>on</strong>g>The</str<strong>on</strong>g>se dependencies are graphically depicted using a directed acyclic graph (for the Bayesian<br />
Networks case) which is easy to understand and interpret. <str<strong>on</strong>g>The</str<strong>on</strong>g> graph defines a decompositi<strong>on</strong><br />
of the high-dimensi<strong>on</strong>al probability density functi<strong>on</strong> into a set of low-dimensi<strong>on</strong>al local<br />
distributi<strong>on</strong>s (marginal or c<strong>on</strong>diti<strong>on</strong>al). Although this technique is well known in different fields<br />
(genomics, machine learning, etc.), just a few applicati<strong>on</strong>s have been described in climate.<br />
In this work we present some applicati<strong>on</strong>s of Bayesian networks in climate from a data<br />
mining point of view. We work with a database of observati<strong>on</strong>s in a network of stati<strong>on</strong>s over the<br />
96
Iberian Peninsula and with the corresp<strong>on</strong>ding gridded atmospheric patterns generated by a<br />
numerical circulati<strong>on</strong> model. As a first step, we study the efficiency of standard learning<br />
algorithms to obtain directed acyclic graphs representing the spatial dependencies am<strong>on</strong>g the<br />
variables included in the database. <str<strong>on</strong>g>The</str<strong>on</strong>g> resulting graphical models are applied to different<br />
problems including climate analysis and weather forecast allowing also to easily perform<br />
sensitivity studies. Just to menti<strong>on</strong> a couple of examples, in the climate case, the agreement<br />
between the graphical representati<strong>on</strong>s learned from observed and simulated (by a general<br />
circulati<strong>on</strong> model) records gives us an idea of the model's ability to capture the observed<br />
climatology. On the other hand, Bayesian networks can also be used to obtain the posterior<br />
probability of an event in the stati<strong>on</strong>s' network given a predicted state of the atmosphere as<br />
evidence.<br />
Space-time Modeling of Biomass Burning and Regi<strong>on</strong>al Aerosols in Southeast Asia<br />
Speaker: Tao Shi<br />
Tao Shi<br />
<str<strong>on</strong>g>The</str<strong>on</strong>g> Ohio State University<br />
taoshi@stat.osu.edu<br />
Catherine Calder<br />
<str<strong>on</strong>g>The</str<strong>on</strong>g> Ohio State University<br />
Darla Munroe<br />
<str<strong>on</strong>g>The</str<strong>on</strong>g> Ohio State University<br />
Ningchuan Xiao<br />
<str<strong>on</strong>g>The</str<strong>on</strong>g> Ohio State University<br />
Scientists and policy makers have become increasingly c<strong>on</strong>cerned about the implicati<strong>on</strong>s<br />
of the c<strong>on</strong>sistent brown haze covering Southeast Asia in terms of human health and climate<br />
change. <str<strong>on</strong>g>The</str<strong>on</strong>g> emergence of this haze is due to increased atmospheric c<strong>on</strong>centrati<strong>on</strong>s of<br />
carb<strong>on</strong>aceous aerosols, which are generated by anthropogenic activities including both<br />
slash-and-burn agriculture and fossil fuel combusti<strong>on</strong>.<br />
Our research focuses <strong>on</strong> determining the relative c<strong>on</strong>tributi<strong>on</strong> of these two types of<br />
emissi<strong>on</strong>s to the total aerosol burden over the regi<strong>on</strong>. We propose a space-time Bayesian<br />
model for regi<strong>on</strong>al carb<strong>on</strong>aceous aerosol compositi<strong>on</strong> and c<strong>on</strong>centrati<strong>on</strong>, given atmospheric<br />
circulati<strong>on</strong> processes and observed fire occurrence. Our model synthesizes a variety of types<br />
of data including remote sensing imagery, output from atmospheric transport models, and<br />
estimates of biomass emissi<strong>on</strong>s for various vegetati<strong>on</strong> types.<br />
This is joint work with Prof. Kate Calder (Statistics, OSU), Prof. Darla Munroe (Geography,<br />
OSU), and Prof. Ningchuan Xiao (Geography, OSU). This project is supported by NASA<br />
Land-Cover/Land-Use Change program.<br />
97
C<strong>on</strong>structi<strong>on</strong> and applicati<strong>on</strong>s of 2-d digital filters for separating spatial scales<br />
Speaker: Hans v<strong>on</strong> Storch<br />
Hans v<strong>on</strong> Storch<br />
Institute for Coastal Research, GKSS<br />
hv<strong>on</strong>storch@web.de<br />
Frauke Feser<br />
Institute for Coastal Research, GKSS<br />
Matthias Zahn<br />
Institute for Coastal Research, GKSS<br />
An algorithm for deriving 2-d isotropic digital filters, which approximates a given<br />
resp<strong>on</strong>se functi<strong>on</strong>, has been derived. <str<strong>on</strong>g>The</str<strong>on</strong>g>se filters are used to examine the performance of<br />
regi<strong>on</strong>al atmospheric models <strong>on</strong> different spatial scales. One applicati<strong>on</strong> is related to the<br />
identificati<strong>on</strong> of added value of simulati<strong>on</strong>s with such models as compared to driving global<br />
models, another for the identificati<strong>on</strong> of smaller storms, in particular typho<strong>on</strong>s and polar lows.<br />
Parallel Sessi<strong>on</strong>s:Climate and Industry<br />
Multi-scale analysis of the surface energy balance during the corn growing seas<strong>on</strong>, and a new<br />
reas<strong>on</strong> for energy unclosed<br />
Speaker: Jianxia Guo<br />
Jianxia Guo<br />
State Key Laboratory of Remote Sensing Science, School of Geography, <str<strong>on</strong>g>Beijing</str<strong>on</strong>g> Normal University<br />
gyr@bnu.edu.cn<br />
Bian Lingen<br />
Chinese Academy of Meteorological Sciences<br />
Dai Y<strong>on</strong>gjiu<br />
State Key Laboratory of Remote Sensing Science, School of Geography, <str<strong>on</strong>g>Beijing</str<strong>on</strong>g> Normal University<br />
Field measurement data collected from the agricultural and meteorological test stati<strong>on</strong> of<br />
CMA, 2004, was employed to investigate the energy balance problem during the entire corn<br />
growing seas<strong>on</strong>. Analysis was performed for the entire growing seas<strong>on</strong>, 10-day, diurnal, and<br />
<strong>on</strong> instantaneous time scales, respectively. <str<strong>on</strong>g>The</str<strong>on</strong>g> statistical regressi<strong>on</strong> slope of turbulent energy<br />
fluxes (sensible and latent heats) against available energy (net radiati<strong>on</strong>, less the ground heat<br />
flux) is 75.79% for the entire corn growing seas<strong>on</strong>, which indicates a lack of closure of 24.2%.<br />
<str<strong>on</strong>g>The</str<strong>on</strong>g> imbalance is greatest during nocturnal periods. <str<strong>on</strong>g>The</str<strong>on</strong>g> regressi<strong>on</strong> slope of daytime data is<br />
98
89% during the 10 days of mid-June, and gradually decreases to 67% during the 10 days of<br />
early October, showing the seas<strong>on</strong>al decrease of energy closure with the corn growth. <str<strong>on</strong>g>The</str<strong>on</strong>g><br />
diurnal cycle of the energy utilizing ratios show that the energy closure in afterno<strong>on</strong>s is better<br />
than mornings. <str<strong>on</strong>g>The</str<strong>on</strong>g> instantaneous energy utilizing ratios are mainly c<strong>on</strong>centrated within the<br />
range of 0~1, but there also exist a number of values outside this range even during the<br />
daytime. <str<strong>on</strong>g>The</str<strong>on</strong>g> latent heat is the main energy c<strong>on</strong>sumpti<strong>on</strong> form <strong>on</strong> all scales. <str<strong>on</strong>g>The</str<strong>on</strong>g> heat storage<br />
term from the energy balance equati<strong>on</strong>, may exceed the sensible heat in as l<strong>on</strong>g as seventy<br />
days, which suggests it should not be omitted from the energy balance analysis of the corn<br />
field. <str<strong>on</strong>g>The</str<strong>on</strong>g>re are phase differences that exist in the diurnal cycle of the energy comp<strong>on</strong>ents. <str<strong>on</strong>g>The</str<strong>on</strong>g><br />
phase of the heat storage term is often shifted to earlier times with respect to the net radiati<strong>on</strong>.<br />
We explore the lagging effect of turbulent fluxes as a new reas<strong>on</strong> for failing to obtain the<br />
energy closure. Results show that the energy closure ratios are improved <strong>on</strong> all time scales<br />
when turbulent fluxes are lagged by 30 minutes to the available energy. As well as not <strong>on</strong>ly the<br />
ratio points outside the range of 0~1, but also the earlier phase of the heat storage term are<br />
improved in some degree.<br />
A Decisi<strong>on</strong> Tree Classificati<strong>on</strong> with Correlati<strong>on</strong>-based Feature Selecti<strong>on</strong> for Decisi<strong>on</strong> Making in<br />
C<strong>on</strong>ducting the Cloud Seeding Operati<strong>on</strong>s<br />
Speaker: Lily Ingsrisawang<br />
Lily Ingsrisawang<br />
Department of Statistics, Kasetsart University, Bangkok,Thailand<br />
fscilli@ku.ac.th<br />
Supawadee Ingsrisawang<br />
Nati<strong>on</strong>al Center for Genetic Engineering and Biotechnology, Bangkok, Thailand<br />
Saisuda Somchit<br />
Department of Statistics, Kasetsart University, Bangkok, Thailand<br />
Warawut Khantiyanan<br />
Bureau of the Royal Rainmaking and Agriculture Aviati<strong>on</strong>, Bangkok, Thailand<br />
Prasert Aungsuratana<br />
Bureau of the Royal Rainmaking and Agriculture Aviati<strong>on</strong>, Bangkok, Thailand<br />
<str<strong>on</strong>g>The</str<strong>on</strong>g> northeastern part of Thailand is an arid regi<strong>on</strong> with varied rainfall. To enhance the<br />
precipitati<strong>on</strong> in this area, a number of cloud seeding operati<strong>on</strong>s have been c<strong>on</strong>ducted by the<br />
Royal Rain Making Project. Since there is no assurance for the success of cloud seeding<br />
operati<strong>on</strong>s, it is important to determine or forecast the success rate before any operati<strong>on</strong>s are<br />
c<strong>on</strong>ducted. Several climate factors, precipitati<strong>on</strong> records and predicti<strong>on</strong> results from the cloud<br />
models such as the Great Plains Cumulus Model (GPCM) are normally used in making the<br />
decisi<strong>on</strong> <strong>on</strong> whether the cloud seeding operati<strong>on</strong> will be successful or not. This study presents<br />
a two-step supervised learning framework to improve the forecasting performance <strong>on</strong> the<br />
success rate of cloud seeding operati<strong>on</strong>s. First, we perform a correlati<strong>on</strong>-based feature<br />
99
selecti<strong>on</strong> to eliminate the irrelevant features and find a subset of features that give the maximal<br />
separati<strong>on</strong> between success and failure in the operati<strong>on</strong>s. Sec<strong>on</strong>d, we apply C4.5, a decisi<strong>on</strong><br />
tree inducti<strong>on</strong> algorithm, with the selected discriminative features for building a classifier for<br />
predicting success or failure in the cloud seeding operati<strong>on</strong>s. Using the real data collected in<br />
the northeastern part of Thailand from the Royal Rain Making Regi<strong>on</strong>al Center during<br />
2004-2006, our framework yields the accurate and interpretable classifier, reaching 91.2%<br />
accuracy. In additi<strong>on</strong>, the decisi<strong>on</strong> tree can be c<strong>on</strong>verted and extracted to a rule set to improve<br />
forecast and facilitate decisi<strong>on</strong> making for c<strong>on</strong>ducting the weather modificati<strong>on</strong> activities or<br />
cloud seeding operati<strong>on</strong>s.<br />
Uncertain Climatic Land of Africa<br />
Speaker: Gord<strong>on</strong> Ondiek Nyabade<br />
Gord<strong>on</strong> Ondiek Nyabade<br />
Go Fishnet Youth Project<br />
g<strong>on</strong>yabade@yahoo.com<br />
<str<strong>on</strong>g>The</str<strong>on</strong>g> beautiful and most resourceful land of Africa is daily faced with uncertainty in her<br />
climatic c<strong>on</strong>diti<strong>on</strong>s.Each country and especially countries c<strong>on</strong>stituting East and Southern<br />
Africa regi<strong>on</strong> most people live in rural areas and depend <strong>on</strong> subsistence agriculture for their<br />
livelihoods. In the regi<strong>on</strong> land degradati<strong>on</strong> occurs mostly from soil erosi<strong>on</strong>, chemical<br />
degradati<strong>on</strong> (loss of nutrients, depleti<strong>on</strong> of organic matter and acidificati<strong>on</strong>) and biological<br />
depleti<strong>on</strong>. Other factors which c<strong>on</strong>tribute to land degradati<strong>on</strong> in the regi<strong>on</strong> include compacti<strong>on</strong><br />
from overgrazing of rangelands, unc<strong>on</strong>trolled burning and improper cultivati<strong>on</strong> of steep slopes,<br />
alternating flooding and crusting, salinizati<strong>on</strong> and polluti<strong>on</strong> which all combine to cause<br />
degenerati<strong>on</strong> of the fragile ecosystems covering large expanses of the regi<strong>on</strong>.<br />
Landscapes devoid of vegetative cover deeply incised by gullies that are difficult to<br />
reclaim, characterize large land expanses in the regi<strong>on</strong> classified as drylands. <str<strong>on</strong>g>The</str<strong>on</strong>g> porti<strong>on</strong>s<br />
classified as sub-humid or humid (highlands and wetlands) are pr<strong>on</strong>e to rapid soil loss from<br />
flash floods or periodic flooding. With a cycle of 2-3 and sometimes 5-6 years, droughts that<br />
have occurred in the regi<strong>on</strong> for over a century, worsen the land degradati<strong>on</strong> problem making<br />
land management a formidable task particularly during the critical moisture deficient periods.<br />
Differing land tenure systems combined with high poverty and low literacy levels comm<strong>on</strong><br />
am<strong>on</strong>g the rural populati<strong>on</strong> complicate land management process.<br />
Low technological capacity, poor governance, poorly c<strong>on</strong>ceived management policies and<br />
their implementati<strong>on</strong> further complicate land management issues. Technology development,<br />
technology transfer and low adopti<strong>on</strong> rates further exacerbate the situati<strong>on</strong>. Pressure <strong>on</strong> the<br />
land and competiti<strong>on</strong> for land is of main c<strong>on</strong>cern throughout the regi<strong>on</strong>. Governments in the<br />
regi<strong>on</strong> as well as private organizati<strong>on</strong>s (including the numerous NGOs operating in the regi<strong>on</strong>),<br />
some communities and individuals (including researchers and academicians) have all<br />
identified the need to c<strong>on</strong>serve land and reverse degradati<strong>on</strong> to restore its productivity and<br />
improve the quality of life for those who depend <strong>on</strong> it for their livelihoods.<br />
100
<str<strong>on</strong>g>The</str<strong>on</strong>g> paper examines the nature and causes of land degradati<strong>on</strong> in the regi<strong>on</strong>, linking it to<br />
populati<strong>on</strong> characteristics, land ownership, low technological capacity, poverty, poor<br />
governance, low literacy and inappropriate land management practices. <str<strong>on</strong>g>The</str<strong>on</strong>g> paper points out<br />
that numerous interventi<strong>on</strong>s targeted at reducing poverty and improvement in land resource<br />
management have not achieved their targets due to lack of coordinati<strong>on</strong>, rigidity and impositi<strong>on</strong><br />
which culminated in failure of the interveners to recognize and incorporate indigenous<br />
knowledge and peoples?preferences and/or indigenous age-old land management strategies.<br />
Linkages to trade and unequal market access that encourages poverty and unwise use of the<br />
land resources are discussed. Adopting people centered interventi<strong>on</strong>s is recommended<br />
together with smart partnerships between the participating partners both from the north and<br />
those from the south. Soluti<strong>on</strong>s will largely depend <strong>on</strong> willingness to change and sharing<br />
informati<strong>on</strong> that will guide appropriate regi<strong>on</strong>al acti<strong>on</strong>. <str<strong>on</strong>g>The</str<strong>on</strong>g> regi<strong>on</strong> faces an enormous<br />
challenge part of which is to come up with viable soluti<strong>on</strong>s that will reverse the degradati<strong>on</strong> of<br />
land and manage it sustainably<br />
Estimating barley yield by means of drought indexes and climatic parameters in Eastern<br />
Azerbaijan using Artificial Neural Network<br />
Speaker: Elham Rahmani<br />
Elham Rahmani<br />
Tehran University<br />
Elhamrahmani1382@yahoo.com<br />
Abdolmajid Liaghat<br />
Tehran University<br />
<str<strong>on</strong>g>The</str<strong>on</strong>g> growing seas<strong>on</strong> climatic parameters; especially, rainfall plays the main role to<br />
predict the yield producti<strong>on</strong>. <str<strong>on</strong>g>The</str<strong>on</strong>g>refore the main objective of this research was to find out<br />
possible relati<strong>on</strong>s am<strong>on</strong>g meteorology parameters and drought indexes with the yield using<br />
Artificial Neural Network.To achieve the objective, meteorological parameters such as;<br />
precipitati<strong>on</strong>, the average of maximum temperature, the average of minimum temperature, the<br />
average of temperature, the sum of temperatures more than 10,evaporati<strong>on</strong>,the water vapor<br />
pressure ,the average of wind speed, the sunshine and the drought indexes such as; Percent<br />
of normal Index, Standard Index of Annual Precipitati<strong>on</strong> Index, Hydrothermal Index, Nguyen<br />
Index, Transeau Index, Standardized Precipitati<strong>on</strong> Index, Shashko moisture drought Index,<br />
Rainfall Anomaly Index were evaluated in terms of normality and their mutual influences. <str<strong>on</strong>g>The</str<strong>on</strong>g>n<br />
the correlati<strong>on</strong> analysis between the barley yield and the climatic parameters and drought<br />
indexes have been examined .the results of this study showed that am<strong>on</strong>g the drought indexes,<br />
Nguyen Index , Transeau Index , Rainfall Anomaly Index and Standardized Precipitati<strong>on</strong> Index<br />
(SPI24) are more effective for predicti<strong>on</strong> of barely yield. In this research, ANN model is<br />
recommended for m<strong>on</strong>itoring and predicting agricultural drought.<br />
101
Drought and its ecological effects in central of Gilan –south western of Caspian sea<br />
Speaker: Ramezani Gourabi, Bahman<br />
Ramezani Gourabi, Bahman.<br />
Depart. of Physical Geography , Islamic Azad university Rasht branch, IRAN<br />
bahman@iaurasht.ac.ir /bahmanr2000@yahoo.com<br />
I compared the changing of precipitati<strong>on</strong> (Drought) with growth of tree ring index (TRI) in<br />
the cental of Gilan at a statistical period (1995-2003). <str<strong>on</strong>g>The</str<strong>on</strong>g> research method this paper is field<br />
work and using from cut wood and capture of wooddisk and prapering in the laboratory and<br />
counting of TRI yearly with comparing precipitati<strong>on</strong> rate in this same time (anaual, m<strong>on</strong>thly)<br />
with correlati<strong>on</strong> method. Result of this research showed that drought or deficit of rain has direct<br />
relati<strong>on</strong>ship with growth tree ring index ((TRI) diameter incremeter in Popolar trees and has<br />
prefer that with irrigati<strong>on</strong> <strong>on</strong> time could will low risk of destroy.<br />
Key words: Drought, Gilan, Popolar trees, Tree Ring Index (TRI)<br />
A model of potential natural vegetati<strong>on</strong><br />
Speaker: Matteo Zampieri<br />
Matteo Zampieri<br />
ISAC-CNR, Lecce, Itay<br />
M.Zampieri@isac.cnr.it<br />
P. Li<strong>on</strong>ello<br />
Univ. of Salento, Lecce, Italy<br />
A number of vegetati<strong>on</strong> dynamical models already exist, but they are affected by<br />
uncertainties related to the high degree of parameterizati<strong>on</strong> of the involved processes.<br />
Here, as an alternative, a diagnostic model of potential natural vegetati<strong>on</strong>, based <strong>on</strong><br />
cluster analysis of high resoluti<strong>on</strong> datasets of observed vegetati<strong>on</strong> distributi<strong>on</strong> and climate, is<br />
proposed.<br />
<str<strong>on</strong>g>The</str<strong>on</strong>g> model reliability is discussed and it is showns how it can be applied for rec<strong>on</strong>structing<br />
sp<strong>on</strong>taneous vegetati<strong>on</strong> distributi<strong>on</strong> in areas where it has been replaced because of anthropic<br />
acti<strong>on</strong>. Further, it can be coupled to climate models in order to take into account the feedback<br />
of dynamical vegetati<strong>on</strong> to the atmosphere and it can be be used to infer past climate from<br />
paleo-vegetati<strong>on</strong> datasets.<br />
102
Special AMS Sessi<strong>on</strong>:Verificati<strong>on</strong> of Climate Forecasts<br />
Diagnostic and user-focused verificati<strong>on</strong> of seas<strong>on</strong>al and climate forecasts: Extensi<strong>on</strong>s from<br />
weather forecast verificati<strong>on</strong> methodologies<br />
Speaker: Barbara G. Brown<br />
Barbara G. Brown<br />
NCAR, USA<br />
bgb@ucar.edu<br />
In recent years, the weather forecast verificati<strong>on</strong> community has given a lot of attenti<strong>on</strong><br />
toward development of verificati<strong>on</strong> approaches that provide more meaningful informati<strong>on</strong><br />
about forecast performance than can typically be obtained using traditi<strong>on</strong>al verificati<strong>on</strong><br />
measures (e.g., RMSE, Brier Skill Score). In part, the movement toward these new<br />
approaches has been driven by a desire to identify and understand which aspects of a forecast<br />
are performing well or poorly (e.g., to feed back into model improvements). In additi<strong>on</strong>, this<br />
focus has been driven by the need to provide more meaningful informati<strong>on</strong> regarding forecast<br />
quality to forecast users (e.g., to aid in decisi<strong>on</strong> making). Both of these motivati<strong>on</strong>s also have<br />
relevance in the seas<strong>on</strong>al and climate predicti<strong>on</strong> community.<br />
More specifically, new verificati<strong>on</strong> methods have been developed that c<strong>on</strong>sider attributes<br />
of spatial forecasts that are of relevance either for a particular user or a broad spectrum of<br />
users. While heretofore much of the effort toward development of these methods has focused<br />
<strong>on</strong> weather forecasts, similar approaches would be equally applicable for evaluating the<br />
performance of seas<strong>on</strong>al predicti<strong>on</strong>s, and for examining the abilities of global and regi<strong>on</strong>al<br />
climate models to replicate current (or previous) climate c<strong>on</strong>diti<strong>on</strong>s. Differences between<br />
climate/seas<strong>on</strong>al forecasts and weather forecasts that must be taken into account when<br />
applying these methods will be discussed, and examples of the types of methods available<br />
and how they might be applied to climate forecast verificati<strong>on</strong> will be presented. In additi<strong>on</strong>, the<br />
c<strong>on</strong>cept of user-focused verificati<strong>on</strong> will be discussed in a more general c<strong>on</strong>text.<br />
Locality and the Ranked Probability Score<br />
Speaker: Sim<strong>on</strong> Mas<strong>on</strong><br />
Sim<strong>on</strong> Mas<strong>on</strong><br />
<str<strong>on</strong>g>The</str<strong>on</strong>g> <str<strong>on</strong>g>Internati<strong>on</strong>al</str<strong>on</strong>g> Research Institute for Climate and Society, Columbia University<br />
sim<strong>on</strong>@iri.columbia.edu<br />
103
<str<strong>on</strong>g>The</str<strong>on</strong>g> ranked probability score and its corresp<strong>on</strong>ding skill score are widely used metrics<br />
of the quality of forecasts of weather and climate that are expressed as probabilities of three or<br />
more ordinal categories.<str<strong>on</strong>g>The</str<strong>on</strong>g> ranked probability score c<strong>on</strong>siders the ordering of the categories<br />
so that for two forecasts with equal probabilities assigned to the observed category, a better<br />
score will be achieved by the forecast that gives higher probabilities to nearby categories. It is<br />
argued here that when c<strong>on</strong>sidering the mathematical quality of forecasts as opposed to their<br />
social or ec<strong>on</strong>omic value, the credit given to probabilities assigned to categories close to the<br />
observed category ('distance') is an undesirable feature of the ranked probability score<br />
because we have no knowledge of what the actual probabilities are for these categories for<br />
any specific case. <str<strong>on</strong>g>The</str<strong>on</strong>g> reliability of the probabilities assigned to the categories that did not<br />
verify can be tested <strong>on</strong>ly over a set of forecasts by c<strong>on</strong>sidering the observed relative<br />
frequencies of verificati<strong>on</strong>s within these categories c<strong>on</strong>diti<strong>on</strong>al up<strong>on</strong> the forecast probabilities<br />
assigned.It is thus inappropriate to give credit for 'near-misses' in the c<strong>on</strong>text of probabilistic<br />
forecasts. A desirable feature of a scoring metric is that of 'locality': the forecast is scored <strong>on</strong>ly<br />
<strong>on</strong> the basis of the probability assigned to what actually occurred. <str<strong>on</strong>g>The</str<strong>on</strong>g> ranked probability score<br />
does not have this feature. Alternative scores include the quadratic and the logarithmic scores,<br />
but the latter is to be preferred since the former does not generalise to c<strong>on</strong>tinuous forecasts<br />
(infinite number of categories).<br />
Verificati<strong>on</strong> of Seas<strong>on</strong>al to Secular Climate Forecasts<br />
Speaker: David Stephens<strong>on</strong><br />
Professor David Stephens<strong>on</strong><br />
University of Exeter, UK<br />
Verificati<strong>on</strong> is a key aspect in developing good scientific forecast systems. Without<br />
reliable procedures for forecast evaluati<strong>on</strong>, we are unable to judge whether a forecasting<br />
system is better than just chance or whether a new forecasting system is really an<br />
improvement compared to previous schemes.<br />
Climate forecasts pose particular problems for forecast verificati<strong>on</strong>. Small sample sizes and<br />
n<strong>on</strong>-stati<strong>on</strong>arity due to l<strong>on</strong>g-term trends can make verificati<strong>on</strong> scores extremely unreliable and<br />
uninformative and put serious limits <strong>on</strong> how well we can assess such types of forecast.<br />
This talk will discuss various issues that affect the verificati<strong>on</strong> of climate forecasts and will<br />
present simple statistical models for understanding verificati<strong>on</strong> of climate forecasts <strong>on</strong><br />
lead-times from seas<strong>on</strong>s to centuries<br />
104
Verificati<strong>on</strong> of Climate Forecasts (Discussi<strong>on</strong>)<br />
Speaker: Ian Jolliffe<br />
Bey<strong>on</strong>d Ensembles: <str<strong>on</strong>g>The</str<strong>on</strong>g> Applicati<strong>on</strong> and Improvement of Climate Simulati<strong>on</strong>s<br />
Speaker: Le<strong>on</strong>ard Smith<br />
Professor Le<strong>on</strong>ard Smith<br />
L<strong>on</strong>d<strong>on</strong> School of Ec<strong>on</strong>omics, Centre for the Analysis of Time Series (CATS)<br />
lenny@maths.ox.ac.uk<br />
Climate models are large n<strong>on</strong>linear dynamical systems which insightfully but<br />
imperfectly reflect the evolving weather patterns of the Earth. In the theory of n<strong>on</strong>linear<br />
dynamical systems, the c<strong>on</strong>cept of shadowing is employed to describe the ability of <strong>on</strong>e<br />
mathematical system to admit trajectories which remain close to the trajectory of another<br />
mathematical system, as the two evolve in time. This idea is generalised to the case where we<br />
have <strong>on</strong>e mathematical dynamical system and observati<strong>on</strong>s of a physical system. Recent<br />
applicati<strong>on</strong>s to operati<strong>on</strong>al weather models are used to justify the likely applicability of this<br />
approach in the climate c<strong>on</strong>text. Ensemble experiments sample the various uncertainties and<br />
inadequacies of the available models, and yield useful informati<strong>on</strong> <strong>on</strong> model behaviour. <str<strong>on</strong>g>The</str<strong>on</strong>g><br />
high dimensi<strong>on</strong> of the model-state spaces and our ignorance of how to to sample the space of<br />
model structures limit our ability to improve and interpret our models using the ensemble<br />
approach.<br />
<str<strong>on</strong>g>The</str<strong>on</strong>g>se limits are highlighted, from the decisi<strong>on</strong> makers perspective, with figures from the<br />
<str<strong>on</strong>g>2007</str<strong>on</strong>g> IPCC Summary for Policy Makers. Our ability to address the needs of decisi<strong>on</strong> makers<br />
via ensemble experiments is discussed, and c<strong>on</strong>trasted with the informati<strong>on</strong> which could be<br />
extracted from shadowing experiments. In the climate c<strong>on</strong>text, shadowing experiments identify<br />
pseudo-orbits of the model over relatively well-observed historical periods (say, 1950-2006).<br />
Poster Sessi<strong>on</strong><br />
Detected shift of Mediterranean cycl<strong>on</strong>e tracks using the ERA-40 database<br />
Judit Bartholy<br />
Dept. of Meteorology, Eotvos Lorand University, Budapest, Hungary<br />
105
ari@ludens.elte.hu<br />
R. P<strong>on</strong>gracz<br />
Dept. of Meteorology, Eotvos Lorand University, Budapest, Hungary<br />
M. Pattantyus-Abraham<br />
Dept. of Hydraulic and Water Resources Engineering, Budapest University of Technology and<br />
Ec<strong>on</strong>omics, Budapest, Hungary<br />
Midlatitude cycl<strong>on</strong>es are analyzed <strong>on</strong> a selected regi<strong>on</strong> covering most part of southern<br />
Europe and the Mediterranean Sea (i.e., 35-50°N, 10°-25°E). On the base of mean sea level<br />
pressure fields of the ECMWF (European Centre for Medium-range Weather Forecast)<br />
Reanalysis Dataset (ERA-40), detailed evaluati<strong>on</strong> of the Mediterranean cycl<strong>on</strong>es is<br />
accomplished for the period between 1957 and 2002 <strong>on</strong> a 1-degree horiz<strong>on</strong>tal resoluti<strong>on</strong> grid.<br />
Cycl<strong>on</strong>e centers are identified using anomaly fields, and then, the paths of these mid-latitude<br />
cycl<strong>on</strong>e centers are tracked with a 6-hour time step (using 00 UTC, 06 UTC, 12 UTC, and 18<br />
UTC). Decadal, annual, and seas<strong>on</strong>al statistical analysis of cycl<strong>on</strong>e tracks includes the study<br />
of the genesis, the frequency and the activity of the Mediterranean cycl<strong>on</strong>es, as well, as the<br />
variability of cycl<strong>on</strong>e tracks. <str<strong>on</strong>g>The</str<strong>on</strong>g> results suggest that the cycl<strong>on</strong>e frequency in the entire<br />
Mediterranean regi<strong>on</strong> increased in summer and autumn, and decreased in winter and spring.<br />
A special belt-shape area is identified, which plays a special role in cyclogenesis, and also, the<br />
cycl<strong>on</strong>e tracks often remain within this belt. An overall decreasing trend is detected in winter<br />
and spring in the entire Mediterranean belt, while cycl<strong>on</strong>e frequency increased in autumn. <str<strong>on</strong>g>The</str<strong>on</strong>g><br />
largest positive and negative trend coefficients are identified in summer.<br />
Regi<strong>on</strong>al climate change expected by the end of the 21st century in Central/Eastern Europe<br />
J. Bartholy<br />
Dept. of Meteorology, Eotvos Lorand University, Budapest, Hungary<br />
bari@ludens.elte.hu<br />
R. P<strong>on</strong>gracz<br />
Dept. of Meteorology, Eotvos Lorand University, Budapest, Hungary<br />
GY. Gelybo<br />
Dept. of Meteorology, Eotvos Lorand University, Budapest, Hungary<br />
CS. Torma<br />
Dept. of Meteorology, Eotvos Lorand University, Budapest, Hungary<br />
<str<strong>on</strong>g>The</str<strong>on</strong>g> results from coarse resoluti<strong>on</strong> global climate models (GCM) can <strong>on</strong>ly be c<strong>on</strong>sidered<br />
as a first-guess of regi<strong>on</strong>al climate change c<strong>on</strong>sequences of global warming. Regi<strong>on</strong>al climate<br />
models (RCM) nested in GCMs may lead to better estimati<strong>on</strong>s of future climate c<strong>on</strong>diti<strong>on</strong>s in<br />
the European subregi<strong>on</strong>s since the horiz<strong>on</strong>tal resoluti<strong>on</strong> of these RCMs is much finer than the<br />
GCMs. In this poster, RCM outputs from the completed PRUDENCE project are summarized<br />
for the Carpathian Basin (located in Central/Eastern Europe). Composite maps of expected<br />
change in temperature and precipitati<strong>on</strong> are generated using the RCM simulati<strong>on</strong>s (with 50 km<br />
spatial resoluti<strong>on</strong>) for the periods of 2071-2100 and 1961-1990. Furthermore, uncertainty of<br />
106
the regi<strong>on</strong>al climate change is represented by the standard deviati<strong>on</strong> of the simulated changes.<br />
Furthermore, the potential use of regi<strong>on</strong>al climate model RegCM3 developed by Giorgi et al. in<br />
ICTP is discussed. This RCM is a 3-dimensi<strong>on</strong>al, sigma-coordinate, primitive equati<strong>on</strong> model,<br />
and has been adapted at the Department of Meteorology, Eotvos Lorand University with 10 km<br />
horiz<strong>on</strong>tal resoluti<strong>on</strong> and 23 vertical levels.<br />
Future changes of extreme events over Korea in regi<strong>on</strong>al projecti<strong>on</strong><br />
Kyung-On Boo<br />
Nati<strong>on</strong>al Institute of Meteorological Research<br />
bko@kma.go.kr<br />
W<strong>on</strong>-Tae Kw<strong>on</strong><br />
Nati<strong>on</strong>al Institute of Meteorological Research<br />
Seung-Ki Min<br />
Envir<strong>on</strong>ment Canada<br />
IPCC has sent a clear message that warming of the climate system is unequivocal and<br />
most of the observed warming is attributable to human activities. For the next two decades, a<br />
warming of about 0.2C per decade is projected for a range of SRES emissi<strong>on</strong> scenarios. At the<br />
end of 21st century, global mean surface temperature is projected to increase by 1.1-6.4C due<br />
to the projected increases of greenhouse gas c<strong>on</strong>centrati<strong>on</strong>s in the atmosphere. Large-scale<br />
forcing arising from global warming may locally change the precipitati<strong>on</strong> distributi<strong>on</strong> over<br />
complex terrain regi<strong>on</strong>s such as the Korean Peninsula. To understand possible future surface<br />
climate change over Korea, regi<strong>on</strong>al climate change projecti<strong>on</strong> is produced from MM5. <str<strong>on</strong>g>The</str<strong>on</strong>g><br />
boundary c<strong>on</strong>diti<strong>on</strong> is from the coupled climate model ECHAM4/HOPE-G simulati<strong>on</strong> based <strong>on</strong><br />
the IPCC SRES A1B scenario. In regi<strong>on</strong>al projecti<strong>on</strong>, temperature and annual rainfall amount<br />
will increase by 4C and 17% over the Korean Peninsula in the end of 21st century. Hot<br />
extremes and heavy rainfall events will c<strong>on</strong>tinue to become more frequent.<br />
Multi-scale statistic and dynamic model for annual streamflow of the Yangtze River at the Three<br />
Gorges Dam in <str<strong>on</strong>g>China</str<strong>on</strong>g><br />
CAO Liqing<br />
Institute of Geography, Nanjing Normal University<br />
51909592@163.com<br />
LING Zhenshan<br />
Institute of Geography, Nanjing Normal University<br />
JI Lingling<br />
Institute of Meteorology, PLA Unit. of Sci. & Tech., Nanjing<br />
107
A novel multi-scale analysis method, Empirical Mode Decompositi<strong>on</strong> (EMD),is used to<br />
analysis the annual streamflow of the Yangtze River at the three Gorges Dam in <str<strong>on</strong>g>China</str<strong>on</strong>g>. <str<strong>on</strong>g>The</str<strong>on</strong>g><br />
results shows that:(1) <str<strong>on</strong>g>The</str<strong>on</strong>g> annual streamflow of the Yangtze River at the three Gorges Dam<br />
can be decomposed into four timescales quasi-periodic oscillati<strong>on</strong>s including a 3 year signal, a<br />
7 year signal, a 13 year signal and a 54 year signal, as well as a trend. With each c<strong>on</strong>tributing<br />
rati<strong>on</strong> of the quasi-periodicity discussed, the 13 year and the 54 year timescale oscillati<strong>on</strong> is<br />
the most prominent.(2)Using the model for annual streamflow of the Yangtzs river at the three<br />
gorges dam based <strong>on</strong> EMD, the predicti<strong>on</strong>s of streamflow from 2001 to 2004 are tried and<br />
show good effects. <str<strong>on</strong>g>The</str<strong>on</strong>g> relative errors of model 1 and model 2 are less than 12.5% and 2.4%<br />
respectively.(3)Five years predicti<strong>on</strong> in advance of annual streamflow for the Yangtze River at<br />
the three Gorges Dam shows that the annual streamflow will be less in the future two years,<br />
then rise again in the third and forth year, up to the year 2012 the greater streamflow<br />
comparing to that in 1998 will probably occur. <str<strong>on</strong>g>The</str<strong>on</strong>g> results of the study provide a valuable<br />
informati<strong>on</strong> for operating and managing the Three Gorges hydro-power stati<strong>on</strong>.<br />
Climate Change in the Siberian High and Its Relati<strong>on</strong>ship to the East-Asian M<strong>on</strong>so<strong>on</strong><br />
H<strong>on</strong>g-xing Cao<br />
Chinese Academy of Meteorological sciences<br />
caohx@sina.com<br />
Hai-yan Yu<br />
<str<strong>on</strong>g>Beijing</str<strong>on</strong>g> Bureau of Metrology<br />
Ju-zhi Ji<br />
Harbin Bureau of Meteorology<br />
<str<strong>on</strong>g>The</str<strong>on</strong>g> Siberian high is a large scale system of the Northern hemispheric circulati<strong>on</strong>, which<br />
dominants other systems, such as the circulati<strong>on</strong> over the Eurasia, the East-Asian M<strong>on</strong>so<strong>on</strong>,<br />
the Meiyu over the Yangtze River. <str<strong>on</strong>g>The</str<strong>on</strong>g> study of climate change in the Siberian High has been<br />
carried out and presented in this paper.In order to understanding the interannual to<br />
interdecadal variati<strong>on</strong>s of the Siberian high, the index I of the Siberian high for 1873―2000<br />
was calculated using the NCEP/NCAR reanalysis data, the index I is a mean of the sea level<br />
pressure (SLP) for all network points covering 40―55°N, 90E―110°E.<str<strong>on</strong>g>The</str<strong>on</strong>g> climate change in<br />
the Siberian high in winter was investigated. Its linear trend is almost at zero, it means the<br />
variati<strong>on</strong> in the Siberian high in winter oscillated around an average since 1873. <str<strong>on</strong>g>The</str<strong>on</strong>g>re were<br />
three oscillati<strong>on</strong>s during 1873 to 2000, the averaged oscillati<strong>on</strong> period is about 40yr. <str<strong>on</strong>g>The</str<strong>on</strong>g><br />
minimum of the Siberian index I during 1873 to 2000 is 1025.1 hPa in 1917, but the maximum<br />
is 1038.1 hPa in 1967. <str<strong>on</strong>g>The</str<strong>on</strong>g>re were two periods with a low pressure during 1913―1922 and<br />
1988―1998 respectively. But there was <strong>on</strong>e period with a high pressure during 1966―1974,<br />
but the pressure values are not so high. <str<strong>on</strong>g>The</str<strong>on</strong>g> interdecadal variati<strong>on</strong> was investigated too. <str<strong>on</strong>g>The</str<strong>on</strong>g><br />
result shows that the interdecadal variati<strong>on</strong> of the Siberian index is significant.In order to model<br />
the climate change in the Siberian high in winter, a new approach of time series analysis is<br />
carried out, it is called a data-based self-memoried (DASM) model. Self-memoried principle of<br />
dynamic system is briefly described, then the DASM model is presented as well. <str<strong>on</strong>g>The</str<strong>on</strong>g> DASM<br />
108
model has been applied to the series of the Siberian high index and dem<strong>on</strong>strated its ability for<br />
fitting and forecasting.Besides, the relati<strong>on</strong>ship between the Siberian high in winter and the<br />
East-Asian summer m<strong>on</strong>so<strong>on</strong> was studied. <str<strong>on</strong>g>The</str<strong>on</strong>g> synchr<strong>on</strong>izati<strong>on</strong> between the Siberian high in<br />
winter and the East-Asian summer m<strong>on</strong>so<strong>on</strong> existed before 1925, after that the variati<strong>on</strong>s of<br />
both the Siberian high in winter and the East-Asian summer m<strong>on</strong>so<strong>on</strong> were quite different, the<br />
East-Asian summer m<strong>on</strong>so<strong>on</strong> became weaker.<br />
L<strong>on</strong>g-term Probabilistic Forecast and T* Distributi<strong>on</strong><br />
Shao-Hang Chu<br />
US Envir<strong>on</strong>mental Protecti<strong>on</strong> Agency<br />
chu.shao-hang@epa.gov<br />
Models are great tools to test ideas. <str<strong>on</strong>g>The</str<strong>on</strong>g>ir usefulness, however, depends <strong>on</strong> their ability to<br />
simulate the current reality and predict the future. In this study, I show that a statistical model<br />
based <strong>on</strong> a new t*-distributi<strong>on</strong> of stati<strong>on</strong> temporal data is capable of predicting the probability<br />
of any future outcome to exceed a specific value using <strong>on</strong>ly the currently available sample<br />
statistics assuming a normal random variable. In an air quality management applicati<strong>on</strong>, the<br />
model has dem<strong>on</strong>strated categorically an average success rate of over 80% both in simulating<br />
the current oz<strong>on</strong>e n<strong>on</strong>-attainment areas and forecasting the rate of future violati<strong>on</strong> of the<br />
8-hour oz<strong>on</strong>e Nati<strong>on</strong>al Ambient Air Quality Standards in the U.S. for up to 12 years. While the<br />
predictability of deterministic climate models is still limited by large uncertainties, the<br />
probabilistic forecast by this model provides a promising alternative in assessing the climate<br />
impact <strong>on</strong> envir<strong>on</strong>ment for decades.<br />
Spatial Drought Rec<strong>on</strong>structi<strong>on</strong> Based On Point-By-Point Regressi<strong>on</strong><br />
Edward R. Cook<br />
Tree-Ring Laboratory, Lam<strong>on</strong>t-Doherty Earth Observatory, 61 Route 9W, Palisades, NY 10964<br />
drdendro@ldeo.columbia.edu<br />
<str<strong>on</strong>g>The</str<strong>on</strong>g> paleoclimate rec<strong>on</strong>structi<strong>on</strong> of climate fields is often c<strong>on</strong>sidered a joint space-time<br />
estimati<strong>on</strong> problem where the predictand climate field, typically <strong>on</strong> a regular grid, is<br />
rec<strong>on</strong>structed simultaneously from an irregular predictor network of paleoclimate proxies. In<br />
dendroclimatology, there is a rich history of doing this as far back as 1971. In so doing, sea<br />
level pressure, temperature, precipitati<strong>on</strong>, and drought fields have been successfully<br />
rec<strong>on</strong>structed from tree-ring networks using a variety of reduced space multivariate regressi<strong>on</strong><br />
methods. While such methods can work well, they are also difficult to diagnose because the<br />
network of predictors is c<strong>on</strong>tributing jointly to the rec<strong>on</strong>structi<strong>on</strong> of the climate field in a<br />
potentially very complicated way. Thus, why a reduced space multivariate method might fail to<br />
skillfully rec<strong>on</strong>struct certain areas of a climate field might be impossible to identify and correct<br />
109
for without negatively impacting other parts of the field. This would appear to be especially the<br />
case in rec<strong>on</strong>structing precipitati<strong>on</strong> and drought fields that have a lot of relatively small-scale<br />
spatial variability in them. To avoid this problem in rec<strong>on</strong>structing gridded Palmer Drought<br />
Severity Indices (PDSI) over North America from tree rings, and to use <strong>on</strong>ly those tree-ring<br />
chr<strong>on</strong>ologies that are likely to have true drought signals in them, a method of point-by-point<br />
regressi<strong>on</strong> (PPR) was developed and extensively tested. PPR rec<strong>on</strong>structs each grid point of<br />
PDSI separately from all others using principle comp<strong>on</strong>ents regressi<strong>on</strong> analysis. As<br />
c<strong>on</strong>structed, PPR has total c<strong>on</strong>trol over which tree-ring predictors are used at each grid point<br />
through two steps that determine the selecti<strong>on</strong> of candidate predictors: a search radius for<br />
locating likely predictors of PDSI and a screening probability that identifies those predictors<br />
within the search radius that are likely to c<strong>on</strong>tain statistically useful informati<strong>on</strong> about past<br />
drought. This predictor selecti<strong>on</strong> process is applied at each grid point in the rec<strong>on</strong>structi<strong>on</strong> of<br />
the PDSI field such that not all tree-ring predictors are used to rec<strong>on</strong>struct drought at all<br />
locati<strong>on</strong>s of the grid. Thus, the PPR method operates locally within the possibly overlapping<br />
limits of the search radius used. Even though PPR does not theoretically guarantee the<br />
preservati<strong>on</strong> of the joint space-time variability of the PDSI field because of its point-wise<br />
method of estimati<strong>on</strong>, tests reveal that the inherent spatial patterns of drought variability over<br />
North America are faithfully preserved in the PPR-rec<strong>on</strong>structed field.<br />
High resoluti<strong>on</strong> modeling of the m<strong>on</strong>so<strong>on</strong> circulati<strong>on</strong> in the Indian Ocean<br />
N. A. Diansky<br />
E-mail:dinar@inm.ras.ru<br />
V. B. Zalesny<br />
S. N. Mosh<strong>on</strong>kin<br />
A. S. Rusakov<br />
Institute of Numerical Mathematics, Russian Academy of Sciences, 119333, Gubkina<br />
Results <strong>on</strong> the m<strong>on</strong>so<strong>on</strong> circulati<strong>on</strong> in the Indian Ocean simulated with a σ-coordinate<br />
ocean model developed at the Institute of Numerical Mathematics, the Russian Academy of<br />
Sciences is presented. <str<strong>on</strong>g>The</str<strong>on</strong>g> model has a horiz<strong>on</strong>tal resoluti<strong>on</strong> of 1/8°×1/12° and c<strong>on</strong>tains 21<br />
σ-layers of uneven thickness. Realistic bottom topography and land geometry are used. <str<strong>on</strong>g>The</str<strong>on</strong>g><br />
numerical experiments were carried out for 15 years starting from the Levitus climatology for<br />
January and m<strong>on</strong>thly mean climatic atmospheric forcing from the NCEP reanalysis data. <str<strong>on</strong>g>The</str<strong>on</strong>g><br />
annual cycle of the surface and subsurface currents and temperature and salinity fields were<br />
analyzed. <str<strong>on</strong>g>The</str<strong>on</strong>g> model reproduces well the Summer M<strong>on</strong>so<strong>on</strong> and the Winter M<strong>on</strong>so<strong>on</strong> currents<br />
and their time evoluti<strong>on</strong> and spatial structures. <str<strong>on</strong>g>The</str<strong>on</strong>g> Somali Current is adequately modeled.<br />
During the Summer M<strong>on</strong>so<strong>on</strong>, the velocities of the current exceed 2 m/s, while the total mass<br />
transport is approximately 70 Sv. <str<strong>on</strong>g>The</str<strong>on</strong>g> model results show that a reversal of the Somali Current<br />
from the northern directi<strong>on</strong> in the summer to the southern directi<strong>on</strong> in the winter is<br />
accompanied by the generati<strong>on</strong> of anticycl<strong>on</strong>ic eddies, which drift westward owing to the<br />
β-effect and dissipate either near the Somali shore or in the Gulf of Aden. <str<strong>on</strong>g>The</str<strong>on</strong>g> m<strong>on</strong>so<strong>on</strong><br />
variability of the equatorial surface current and equatorial subsurface countercurrent system<br />
110
are analyzed. It is shown that these currents are generated predominantly by the z<strong>on</strong>al<br />
comp<strong>on</strong>ent of wind stress, in which the half-year harm<strong>on</strong>ic dominates. This leads to the fact<br />
that the equatorial surface current also changes its directi<strong>on</strong> with a half-year periodicity almost<br />
in phase with the wind. <str<strong>on</strong>g>The</str<strong>on</strong>g> oppositely directed subsurface compensati<strong>on</strong>al countercurrent<br />
changes its directi<strong>on</strong> with a time lag of approximately <strong>on</strong>e m<strong>on</strong>th. Gradient currents, which<br />
appear in the Bay of Bengal due to the riverine runoff, make an important c<strong>on</strong>tributi<strong>on</strong> to the<br />
circulati<strong>on</strong>. This effect manifests itself especially str<strong>on</strong>gly in the summer during the peak of the<br />
Ganges River runoff, which transports fresh turbid waters. <str<strong>on</strong>g>The</str<strong>on</strong>g> principal features of the<br />
large-scale quasi-stati<strong>on</strong>ary gyre structure of the Indian Ocean such as the Great Whirl,<br />
Socotra high, and Laccadive high and low are simulated.<br />
<str<strong>on</strong>g>The</str<strong>on</strong>g> Study of the Impacts of Meteorological Parameters <strong>on</strong> the Air Quality Index in the Esfahan<br />
City<br />
Victoria Ezzatian<br />
Isfahan Meteorological Office<br />
victoria_ezzatian@yahoo.com<br />
Air is the certain compositi<strong>on</strong> of different gases. If the percent of these compositi<strong>on</strong>s be<br />
changed which has been harmful effectiveness <strong>on</strong> human health or alive things,it be called air<br />
polluti<strong>on</strong>. For numerising the quality of air and reporting it to comm<strong>on</strong>, Air Quality Indices were<br />
been used thus polluti<strong>on</strong> standard index is <strong>on</strong>e of these indecies. A standard Air Quality Index<br />
changes the density of surface pollutants to a dimenti<strong>on</strong>less number. This index classified by<br />
50 units that each number expresses the especial c<strong>on</strong>diti<strong>on</strong> of air quality by Good, Moderate,<br />
Unhealthy and very Unhealthy words. <str<strong>on</strong>g>The</str<strong>on</strong>g> goal of this investigati<strong>on</strong> is stuying the effect of<br />
meteorological parameters <strong>on</strong> Esfahan Air Quality Index by Isfahan Meteorological Weather<br />
Stati<strong>on</strong>, Envir<strong>on</strong>mental Organizati<strong>on</strong> Stati<strong>on</strong>s. So, first of all we calculated air quality index by<br />
special software during 1383-1385. Because of Oz<strong>on</strong>e is very important for determining Air<br />
Quality Index so we studied it during 1995-2005.For determining the effectes of meteorological<br />
parameters <strong>on</strong> Air Quality Index we used the meteorological data <strong>on</strong> surface and 13 standard<br />
upper levels. Calculati<strong>on</strong>s expressed that Maximum Temperature, Average Temperature,<br />
Total Solar Radiati<strong>on</strong> and surface Pressure have str<strong>on</strong>g effects <strong>on</strong> Total Oz<strong>on</strong> measurments.<br />
Dioxside Nitrogene in spring and summer, Dioxside Sulfure in autumn and winter had<br />
maximum values. Dencity of Carb<strong>on</strong>m<strong>on</strong>oxide changes with trafic pattrern and man activities<br />
and its values upper than other pollutants. Dencity of Pulb and Cadmium changes with traffic<br />
pattern. Particular Matter in dry days had upper levels in compare of wet days and more than<br />
half of them had about 0.1 micrometere diameter. Normalised Residual Mass Curve of Total<br />
Oz<strong>on</strong>e showed that Oz<strong>on</strong> fluctuati<strong>on</strong>s decreses in recent years. Upper level meteorological<br />
parameters had str<strong>on</strong>g effect <strong>on</strong> Oz<strong>on</strong> especially temperature in 50 milibar level. Total oz<strong>on</strong>e<br />
in spring had high valuse and in winter had low values. We calculated the statistical<br />
relati<strong>on</strong>ships between Air Quality Index and meteorological parameters <strong>on</strong> surface and upper<br />
standard levels. Calculati<strong>on</strong>s showes that relati<strong>on</strong>ships between Total Oz<strong>on</strong>e and Total Sun<br />
Radiati<strong>on</strong> is more than Sunny Hours.Termal Island Effect <strong>on</strong> Isfahan city due to c<strong>on</strong>suming<br />
111
energy and termal saving ability of asphalt and structural materias caused that isfahan<br />
minimum temperature .0.1 c and miximum 3 c upper than upper than perimeter .Air quality in<br />
Azadi and Bozorgmehr squares were more than Lale square which shows the role of urban<br />
transportati<strong>on</strong> in decreasing air quality in some days. We draw synoptic maps in surface and<br />
500 milibar levels a day before pollutant episode, during pollutant days and <strong>on</strong>e day after<br />
pollutant episode by Grads. software and classified the occured patterns in these days.<br />
Durati<strong>on</strong> of pollutant days in Esfahan City were in <strong>on</strong>e, three, five, seven, seventheen,<br />
nineteen and twenty three days period. Synoptic maps showed that presence of high pressure<br />
sycl<strong>on</strong>es with pressures upper than 1025 milibar <strong>on</strong> North, Westnorth or Eastnorth of Iran<br />
(North of Caspian Sea, Gafghaz, Siberia and Oral Lake) are essential factor for bad air quality<br />
in Esfahan city. Sometimes these c<strong>on</strong>diti<strong>on</strong>s due to the formati<strong>on</strong> a local high pressure sycl<strong>on</strong><br />
that air polluti<strong>on</strong> intencify and reach to critical limits. At this time in the upper upper level<br />
usually a teraghf formed <strong>on</strong> Mediterane Sea, Black Sea, Iraq or in the Northwest of Iran when<br />
a ridge were about west of Iran. Due to this time weather subsides from upper level and air<br />
descends which causes the dencity of pollutants <strong>on</strong> the surface increased. In additi<strong>on</strong>, when<br />
high pressure cycl<strong>on</strong>es are presenc, the movement of air through inside of sycl<strong>on</strong>e with low<br />
speed which limits the scattering of pollutant in horiz<strong>on</strong>tal area. This phenomena causes the<br />
polluted days be c<strong>on</strong>tinued. So in these days we must cotrol the issuing of pollutants from<br />
sources by different ways that each way must be d<strong>on</strong>e by related organizati<strong>on</strong>s. Some of these<br />
activities are: using instruments for m<strong>on</strong>itoring and c<strong>on</strong>trolling the volume of polume from<br />
industries stacks, development of urban green space, correcting some passage and altitude of<br />
urban buldings, development of public transportati<strong>on</strong>, development of the tecnology of<br />
automobile producti<strong>on</strong>.<br />
Key words:Air Quality Index(A.Q.I), Meteorological Parameter,Total Oz<strong>on</strong>e , Atmospheric Pollutant<br />
Model , synoptic System .<br />
Statistical Analysis of temporal variati<strong>on</strong> of rainfall and evapotranspirati<strong>on</strong> in several<br />
meteorological stati<strong>on</strong>s of Iran<br />
Fathi. Mohammad<br />
University of Tehran, Iran<br />
fathisarvestani@gmail.com<br />
Dr. khalily. A.<br />
University of Tehran, Iran<br />
Dr. Sohrabi. T.<br />
University of Tehran, Iran<br />
<str<strong>on</strong>g>The</str<strong>on</strong>g> methods for estimating temporal variati<strong>on</strong> of evapotranspirati<strong>on</strong> and rainfall are useful<br />
tools for irrigati<strong>on</strong> scheduling and regi<strong>on</strong>al water allocati<strong>on</strong>. <str<strong>on</strong>g>The</str<strong>on</strong>g> purpose of this study was to<br />
determine the probability, trend of seas<strong>on</strong>al, annual rainfall and evapotranspirati<strong>on</strong> in some<br />
meteorological stati<strong>on</strong>s of Iran for the last 50 years. Reference crop evapotranspirati<strong>on</strong> (ETo)<br />
was calculated from Penman–M<strong>on</strong>teith equati<strong>on</strong> using meteorological data measured from 11<br />
112
stati<strong>on</strong>s in Iran. <str<strong>on</strong>g>The</str<strong>on</strong>g> amount of seas<strong>on</strong>al, annual ETo and rainfall trend were determined by<br />
Mann–Kendall test analysis during 1953s–2003. <str<strong>on</strong>g>The</str<strong>on</strong>g> data was then subjected to statistical<br />
tests to determine the probability distributi<strong>on</strong>s that best fit them. Suitable probability<br />
distributi<strong>on</strong>s were selected from am<strong>on</strong>g the Normal, Log-Normal, Gumbel Extreme Value Type<br />
I, Gamma and Logistic distributi<strong>on</strong>s. Seas<strong>on</strong>al and annual rainfall and ETo at 80, 50 and 30<br />
percent probability levels were determined. <str<strong>on</strong>g>The</str<strong>on</strong>g> results showed that there is not any significant<br />
trend for seas<strong>on</strong>al and annual rainfall and evapotranspirati<strong>on</strong> in all of stati<strong>on</strong>. And so, <str<strong>on</strong>g>The</str<strong>on</strong>g><br />
probability analysis of data shows that variability of evapotranspirati<strong>on</strong> and rainfall are so much,<br />
therefore determining return period of this data are useful for rainfed irrigati<strong>on</strong>. <str<strong>on</strong>g>The</str<strong>on</strong>g> results of<br />
this analysis can be attributed to expansi<strong>on</strong> of irrigati<strong>on</strong> areas and agricultural management.<br />
Keywords: climate change, rainfall, Reference crop evapotranspirati<strong>on</strong>, probability analysis,<br />
trend<br />
Error Detecti<strong>on</strong> and Checking of Inhomogenities Basing <strong>on</strong> the Metadata in Uganda<br />
Climatological Dataset<br />
Lubega N.Fortunata<br />
Department Meteorology Uganda<br />
lubegf@yahoo.com<br />
Majugu Absein<br />
Department Meteorology Uganda<br />
Climate data is a key aspect of statistical climatology, more so, today, when climate<br />
change amplitude is super imposed <strong>on</strong> climate variability, there is a dire need of well managed<br />
quality data to prove that climate change is not a myth but a reality. WMO together with the<br />
climate scientist are keen to see that artificial deviati<strong>on</strong>s within the climate data must be dealt<br />
with, hence the need for data homogenizati<strong>on</strong>. In his opening speech, at the FOUTH<br />
SEMINAR ON HOMOGENISATION AND QUALITY CONTROL IN CLIMATOLOGICAL<br />
DATABASES (Budapest Hungary WMO_TD No.1236 2004), Yadowsun Boodhoo observed<br />
that, homogenizati<strong>on</strong> of the climate data is not within the reach of all member countries. In this<br />
regard, this paper seeks to address issues pertaining to uncertainties within the climate<br />
datasets which was written out of the quality c<strong>on</strong>trol work d<strong>on</strong>e during the HYDROCLIMATIC<br />
STUDY(2003) in Uganda. <str<strong>on</strong>g>The</str<strong>on</strong>g> detecti<strong>on</strong> of errors in climatological data sets, the checking of<br />
inhomogenities basing <strong>on</strong> metadata and design of quality c<strong>on</strong>trol measures were undertaken<br />
during an inter-disciplinary study carried out by Uganda Meteorological Department (UMD) in<br />
collaborati<strong>on</strong> with the Water Resource Management Department (WRMD). <str<strong>on</strong>g>The</str<strong>on</strong>g>re were 597<br />
rainfall and 50 temperature stati<strong>on</strong>s which were digitized using CLICOM software that<br />
generated 16,363 and 1,500 records of rainfall and temperatures respectively, spanning the<br />
years 1902 to 2003.Different types of errors and their relati<strong>on</strong>ship were identified. Checking<br />
logics (nature of checking algorithm) were employed both by automatic computer programs<br />
and manual checks. <str<strong>on</strong>g>The</str<strong>on</strong>g> check tests used varied in accordance with the characteristic of<br />
logical operati<strong>on</strong>s, the element and the type of data being checked, daily, m<strong>on</strong>thly or annual<br />
113
data type and also suspicious zeros. Suspicious values were compared to their neighbors<br />
and the meta data available was checked to prove the worthiness of the record. In respect of<br />
data quality, correlati<strong>on</strong>s for AWS data was compared with manual data to see if it can be used<br />
to complete the missing data in the series for Namul<strong>on</strong>ge Reaseach stati<strong>on</strong> and Ebtebbe<br />
where the AWS stati<strong>on</strong>s have been place in the same site with the manual stati<strong>on</strong>s.Ultimately<br />
because of the new quality c<strong>on</strong>trol techniques used in this study, c<strong>on</strong>firmed c<strong>on</strong>sistent extreme<br />
values of rainfall were identified. C<strong>on</strong>firmed inc<strong>on</strong>sistent records were also identified.<br />
Inhomogenities were discovered in Mbarara, Buvuma and within estates stati<strong>on</strong>s who had<br />
abruptly changed management.<br />
Analyze Effect Factors and Research Forecasting Method of the Annual Water C<strong>on</strong>sumpti<strong>on</strong> in<br />
<str<strong>on</strong>g>Beijing</str<strong>on</strong>g> City<br />
Ge Zhao-xia<br />
Insititute of hydrology and water resources,Hehai university<br />
zxge@hhu.edu.cn<br />
Gu Yueh<strong>on</strong>g<br />
Insititute of hydrology and water resources,Hehai university<br />
In this paper, the partial least squares model is used to analyze the relati<strong>on</strong>ship between<br />
the annul water c<strong>on</strong>sumpti<strong>on</strong> and its influencing factors in <str<strong>on</strong>g>Beijing</str<strong>on</strong>g>. It is found that the annual<br />
water c<strong>on</strong>sumpti<strong>on</strong> in testing year can be forecasted more precisely when the sample time<br />
between forecast object and factors is staggered by 3 years. As the equati<strong>on</strong> c<strong>on</strong>firmed, the<br />
future value of factors should be forecasted for restrict of samples’ length. <str<strong>on</strong>g>The</str<strong>on</strong>g> factor samples<br />
are forecasted by AR model. At last, through the determinate equati<strong>on</strong> and the forecasted<br />
factors, the annual water c<strong>on</strong>sumpti<strong>on</strong> from 2003 to 2010 in <str<strong>on</strong>g>Beijing</str<strong>on</strong>g> can be forecasted. It turns<br />
out the definitely increasing trend of the annul water c<strong>on</strong>sumpti<strong>on</strong> in <str<strong>on</strong>g>Beijing</str<strong>on</strong>g> from 2003 to 2010.<br />
Forecasting Schemes of the Reservoir’s M<strong>on</strong>thly Runoff Volume Based <strong>on</strong> the Wavelet Analyze<br />
Ge Zhao-xia<br />
Insititute of hydrology and water resources,Hehai university<br />
zxge@hhu.edu.cn<br />
Gu Yue-h<strong>on</strong>g<br />
Insititute of hydrology and water resources,Hehai university<br />
Cao Li-qing<br />
Insititute of hydrology and water resources,Hehai university<br />
<str<strong>on</strong>g>The</str<strong>on</strong>g> wavelet theory is used to analyze some reservoir’s m<strong>on</strong>thly runoff volume. Based <strong>on</strong><br />
the decomposed approximate and detailed coefficients, model is established with BP network.<br />
<str<strong>on</strong>g>The</str<strong>on</strong>g> result of show that the model with the method of wavelet analyze and BP network is better<br />
and valuable.<br />
114
<str<strong>on</strong>g>The</str<strong>on</strong>g> study of the Urban Heat Island in Nanjing city<br />
Gu Lihua<br />
Nanjing university of informati<strong>on</strong> science and technology<br />
lihuamm820@sohu.com<br />
Qiu Xinfa<br />
Nanjing university of informati<strong>on</strong> science and technology<br />
<str<strong>on</strong>g>The</str<strong>on</strong>g> urban heat island (UHI) intensity in Nanjing, has been particularity investigated using<br />
the temperature data measured at three urban and <strong>on</strong>e suburb stati<strong>on</strong> form 1960 to 2005,<br />
including annual, mensal, day-by-day temperature of average, highest, lowest, and four<br />
times(02:00, 08:00 , 14:00, 20:00) a day. <str<strong>on</strong>g>The</str<strong>on</strong>g> thesis adopts three sorts UHI statistical methods<br />
to analyze the character of the UHI. <str<strong>on</strong>g>The</str<strong>on</strong>g> c<strong>on</strong>clusi<strong>on</strong> can be drawn as following: (1) <str<strong>on</strong>g>The</str<strong>on</strong>g> UHI<br />
intensity boosts up with the developing of city, and also gives more prominent presentati<strong>on</strong> <strong>on</strong><br />
annual lowest temperature than <strong>on</strong> annual highest temperature and annual average<br />
temperature. (2)<str<strong>on</strong>g>The</str<strong>on</strong>g> seas<strong>on</strong>al variety of UHI intensity is obvious: str<strong>on</strong>g in spring, weak in<br />
autumn and winter. (3) <str<strong>on</strong>g>The</str<strong>on</strong>g> UHI intensity in Nanjing is lower than other large city, the peak<br />
value is between 0 and 3 . When the daily temperature is lowest, the UHI intensity is<br />
str<strong>on</strong>ger. (4) <str<strong>on</strong>g>The</str<strong>on</strong>g> temperature of four times reflects an obvious day and night variety of UHI<br />
intensity with the maximum intensity appears at 02:00 and the minimum at 14:00. (5)<str<strong>on</strong>g>The</str<strong>on</strong>g> UHI<br />
intensity exp<strong>on</strong>ent increases holistically reduce in 1960s, arrive at lowest in 1970s, increases<br />
again form 1975.<br />
“Attributi<strong>on</strong> of changes in extreme weather risk: a study of the European Summer 2003<br />
Heatwave”<br />
Helen Hanl<strong>on</strong><br />
AOPP, University of Oxford<br />
hanl<strong>on</strong>@atm.ox.ac.uk<br />
Myles Allen<br />
AOPP, University of Oxford<br />
Daithi St<strong>on</strong>e<br />
AOPP, University of Oxford<br />
Peter Stott<br />
Hadley Centre, UK Met Office<br />
Alberto Troccoli<br />
European Centre for Medium-Range Weather Forecasts, Reading<br />
In 2003 the average summer temperature in c<strong>on</strong>tinental Europe exceeded the 1961-1990<br />
European summer mean by 2.3K. Many regi<strong>on</strong>s experienced a large number of deaths due to<br />
115
the elevated temperatures, and attributi<strong>on</strong> studies have determined that human activity have at<br />
least doubled the risk of such a heatwave compared to pre-industrial times. However, other,<br />
n<strong>on</strong>-linear processes could also have amplified summer 2003 temperatures: feedbacks<br />
between reduced cloud cover and precipitati<strong>on</strong> and reduced soil-moisture may have prevented<br />
the usual c<strong>on</strong>vective disrupti<strong>on</strong> of the high pressure system. This study will build <strong>on</strong> previous<br />
attributi<strong>on</strong> work by attempting to further isolate the change in risk of the heatwave due to<br />
anthropogenic influences. A large ensemble of the ECMWF IFS model will be performed at<br />
higher resoluti<strong>on</strong> than previous studies, with improved simulati<strong>on</strong> of land surface processes.<br />
Seas<strong>on</strong>al Rainfall Predicti<strong>on</strong> for the Tropical Pacific Regi<strong>on</strong><br />
Luke He<br />
CPC/NCEP/NOAA<br />
Luke.He@noaa.gov<br />
Joshua Fu<br />
<str<strong>on</strong>g>Internati<strong>on</strong>al</str<strong>on</strong>g> Pacific Research Center<br />
Nicole Colasacco<br />
Pacific ENSO Applicati<strong>on</strong> Center<br />
T<strong>on</strong>y Barnst<strong>on</strong><br />
<str<strong>on</strong>g>Internati<strong>on</strong>al</str<strong>on</strong>g> Research Institute for Climate and Society<br />
Research has shown that short term global climate fluctuati<strong>on</strong>s, such as those related to<br />
the El Nino Southern Oscillati<strong>on</strong> (ENSO) phenomen<strong>on</strong>, play a dominant role in the climate<br />
variability in the tropical Pacific regi<strong>on</strong>. Because the demand for climate informati<strong>on</strong> in the<br />
tropical Pacific regi<strong>on</strong> has risen in the last decade, the PEAC (Pacific ENSO Applicati<strong>on</strong><br />
Center) Climate Telec<strong>on</strong>ference and the Southern Pacific Island Climate Telec<strong>on</strong>ference have<br />
been held m<strong>on</strong>thly to support the decisi<strong>on</strong> making processes undertaken in the tropical Pacific<br />
regi<strong>on</strong> for water resource management, fisheries management, agriculture, natural disaster<br />
mitigati<strong>on</strong> strategies, and other climate sensitive sectors. <str<strong>on</strong>g>The</str<strong>on</strong>g> climate telec<strong>on</strong>ferences also set<br />
up a bridge to exchange the climate informati<strong>on</strong> for the scientists from US, Australia, New<br />
Zealand, and Pacific island nati<strong>on</strong>s. Both dynamic and statistical forecasting tools are<br />
examined for the seas<strong>on</strong>al rainfall forecast for the tropical Pacific regi<strong>on</strong> in the climate<br />
telec<strong>on</strong>ferences. An objectively c<strong>on</strong>solidated seas<strong>on</strong>al rainfall forecast scheme for the tropical<br />
Pacific regi<strong>on</strong> is developed recently through the support of the NOAA PRIDE (Pacific Regi<strong>on</strong><br />
Integrated Data Enterprise) project. <str<strong>on</strong>g>The</str<strong>on</strong>g> future plan and opportunities, e.g., NOAA Climate<br />
Test Bed (CTB) and Pacific Climate Informati<strong>on</strong> System (PaCIS), for improving the climate<br />
predicti<strong>on</strong> skill for the tropical Pacific regi<strong>on</strong> will also be discussed.<br />
116
Development and analysis of a daily high resoluti<strong>on</strong> grid over Spain (1950-2003)<br />
Sixto Herrera<br />
Spanish Nati<strong>on</strong>al Meteorological Institute (INM)<br />
Maria R. P<strong>on</strong>s<br />
Spanish Nati<strong>on</strong>al Meteorological Institute (INM)<br />
Ant<strong>on</strong>io S. Cofiño<br />
University of Cantabria<br />
Jose M. Gutierrez<br />
University of Cantabria<br />
Gridded climate data sets have the advantage of producing a historical set of c<strong>on</strong>sistent<br />
and regularly distributed observati<strong>on</strong>s, and are a very useful tool for validating numerical<br />
weather predicti<strong>on</strong> models. In this work, a new 0.2º spatial resoluti<strong>on</strong> (~20Kms) observati<strong>on</strong>al<br />
grid for precipitati<strong>on</strong> and extreme temperatures (maximum and minimum) has been developed,<br />
built-up from the Spanish Nati<strong>on</strong>al Meteorological Institute (INM) data network: 3500 rain<br />
gauges and 850 thermometric stati<strong>on</strong>s. Both networks have a daily temporal coverage from<br />
1950 to 2003.<br />
Firstly, comm<strong>on</strong>ly used interpolati<strong>on</strong> methods –such as kriging, kernel-based methods,<br />
angular distance weighting and thin plate splines- have been compared, using different<br />
aggregati<strong>on</strong> time scales: daily, weekly and m<strong>on</strong>thly. In this work we show how the<br />
performance of the different methods depends <strong>on</strong> the aggregati<strong>on</strong> time scale.<br />
Sec<strong>on</strong>dly, in order to explore the utility of the grid, an analysis of the climatology, trends<br />
and telec<strong>on</strong>necti<strong>on</strong>s with El Nino-Southern Oscillati<strong>on</strong> (ENSO) and North Atlantic Oscillati<strong>on</strong><br />
(NAO) has been performed.<br />
Projecti<strong>on</strong> of future heat wave mortality rates using regi<strong>on</strong>al climate model predicti<strong>on</strong>s<br />
Chun Kit Ho<br />
School of Engineering, Computer Science and Mathematics, University of Exeter<br />
ckh202@exeter.ac.uk<br />
As the frequency and intensity of heat waves are projected to increase in the 21st<br />
century, mortality associated with extreme high temperatures is a major health impact under<br />
climate change. This poster presents projecti<strong>on</strong>s of future heat wave mortality in two European<br />
cities, L<strong>on</strong>d<strong>on</strong>, United Kingdom and Budapest, Hungary using predicti<strong>on</strong>s from the Hadley<br />
Centre Regi<strong>on</strong>al Climate Model (RCM).<br />
<str<strong>on</strong>g>The</str<strong>on</strong>g> past relati<strong>on</strong>ships between daily mortality rates and observed meteorological<br />
variables in L<strong>on</strong>d<strong>on</strong> (1993-2003) and Budapest (1992-2001) are modelled using a generalized<br />
additive model (GAM). It is shown that the mortality rates in both cities exhibit annual cycles,<br />
117
modified by effects of air temperature and humidity. Systematic errors in the RCM are<br />
identified by comparing its simulati<strong>on</strong> of present-day climate with observati<strong>on</strong>s. After correcting<br />
such biases, changes in summer mortality rates in the 21st century are projected using the<br />
GAM developed with the air temperature and humidity predicted by the RCM.<br />
East Asian Summer m<strong>on</strong>so<strong>on</strong> changes in the MIS 3 Stage recorded from the western South<br />
<str<strong>on</strong>g>China</str<strong>on</strong>g> Sea<br />
Baoqi Huang<br />
Department of Geology Peking University <str<strong>on</strong>g>Beijing</str<strong>on</strong>g> 100871 <str<strong>on</strong>g>China</str<strong>on</strong>g><br />
bqhuang@pku.edu.cn<br />
Wenyu Yang<br />
College of Envir<strong>on</strong>mental Sciences, Peking University, <str<strong>on</strong>g>Beijing</str<strong>on</strong>g> 100871, <str<strong>on</strong>g>China</str<strong>on</strong>g><br />
Jie Xiao<br />
Department of Geology Peking University <str<strong>on</strong>g>Beijing</str<strong>on</strong>g> 100871 <str<strong>on</strong>g>China</str<strong>on</strong>g><br />
Liping Zhou<br />
College of Envir<strong>on</strong>mental Sciences, Peking University, <str<strong>on</strong>g>Beijing</str<strong>on</strong>g> 100871, <str<strong>on</strong>g>China</str<strong>on</strong>g><br />
<str<strong>on</strong>g>The</str<strong>on</strong>g> climate of Marine Isotope Stage 3 (MIS 3) was extremely variable <strong>on</strong> a millennial<br />
timescale, characterized by Dansgaard–Oeschger (DO) events and Heinrich (H) events. In this<br />
work, sediments from the upper part of Core 17954-2, located at the upwelling area off the<br />
Vietnam coast in the western SCS, was analyzed to uncover how the rapid climate changes in<br />
this regi<strong>on</strong> resp<strong>on</strong>ded to that in high-latitude regi<strong>on</strong> of the Northern Hemisphere during MIS 3,<br />
by discussing the changes of surface sea temperature (SST), depth of thermocline (DOT) and<br />
primary productivity with AMS14C dating and stable oxygen isotope analysis <strong>on</strong> the basis of<br />
analysis of plankt<strong>on</strong>ic foraminifera species.<str<strong>on</strong>g>The</str<strong>on</strong>g> records of plankt<strong>on</strong>ic foraminifera in Core<br />
17954-2 resp<strong>on</strong>ded to rapid climate events in the records of GISP2. Besides, there were more<br />
changes similar to these observed in this work.. In certain of IS events, the c<strong>on</strong>diti<strong>on</strong>s of low<br />
SST, shallow DOT and high productivity implied upwelling taking place when it was warm. It<br />
was estimated that East Asian M<strong>on</strong>so<strong>on</strong> enhanced during these warm events. On the other<br />
hand, three stages showed in some indexes also supported a c<strong>on</strong>cept that enhanced East<br />
Asian summer m<strong>on</strong>so<strong>on</strong> could influence this regi<strong>on</strong>.<br />
Wavelet Based Fractal Analysis of El Niño Episodes<br />
Zhiy<strong>on</strong>g Huang<br />
Graduate School of Envir<strong>on</strong>mental Studies, Nagoya University, Japan<br />
s050109d@mbox.nagoya-u.ac.jp<br />
Hiroshi Morimoto<br />
Graduate School of Envir<strong>on</strong>mental Studies, Nagoya University, Japan<br />
118
Fractal widely exists in nature, and has been developed both in theory and applicati<strong>on</strong>.<br />
Self-organized criticality (SOC) is <strong>on</strong>e possible explanati<strong>on</strong> for fractal behavior. <str<strong>on</strong>g>The</str<strong>on</strong>g><br />
temporal-spatial fractal characters of sea surface temperatures (SSTs) have been<br />
documented in many articles. El Niño event may be a result of the phenomena of SOC.<br />
However, how El Niño affects the fractal characters of SST? Can we show the adequate<br />
features of SOC for the El Niño events? In this study, we applied discrete sec<strong>on</strong>d-order<br />
Daubechies wavelet transform method using the HadISST data sets from 1870-2005. We<br />
examined the SOC features for El Niño event <strong>on</strong> the scale of Quasi- Biennial-Oscillati<strong>on</strong><br />
(QBO). <str<strong>on</strong>g>The</str<strong>on</strong>g> results c<strong>on</strong>firmed that QBO was important for El Niño event, and represented that<br />
some El Niño events are due to the result of SOC <strong>on</strong> the timescale of QBO, especially after<br />
1990. Hence, SOC also offered a statistical explanati<strong>on</strong> for El Niño event, in additi<strong>on</strong> to the<br />
variant physical explanati<strong>on</strong>s. Moreover, we found that there were two distinct periods, i.e.<br />
1894-1923 and 1978-2000, during which the trend of the oscillati<strong>on</strong> of ENSO-event-index well<br />
meets with that of fractal dimensi<strong>on</strong>, i.e., Hurst coefficient “H”. <str<strong>on</strong>g>The</str<strong>on</strong>g> inverse trends between<br />
ENSO-index and “H” were normally due to the influence of La Niña events. <str<strong>on</strong>g>The</str<strong>on</strong>g> mechanisms<br />
of El Niño and La Niña events may be certain distinct in the inner mechanisms. This study may<br />
help understanding of El Niño phenomena, and will help for forecasting of El Niño.<br />
Global average surface temperature anomalies with COBE-SST<br />
Koji Ishihara<br />
Meteorological Research Institute, Japan Meteorological Agency<br />
kishihar@mri-jma.go.jp<br />
For the purpose of m<strong>on</strong>itoring the global warming, Japan Meteorological Agency has so<br />
far estimated operati<strong>on</strong>ally the l<strong>on</strong>g-term change of global average surface temperature<br />
anomalies with both observed data at meteorological stati<strong>on</strong>s and the historical SST analysis<br />
(COBE-SST).<str<strong>on</strong>g>The</str<strong>on</strong>g> result shows that the global average surface temperature has been rising at<br />
a rate of about 0.67 ゚ C per 100 years since 1891.<str<strong>on</strong>g>The</str<strong>on</strong>g> standard error of the globally and<br />
annually averaged temperature time series is also computed to be around 0.08 ゚ C for these<br />
few decades.<br />
Multi-timescale Analysis, Rec<strong>on</strong>structi<strong>on</strong> and Estimati<strong>on</strong> for Global Sun Solar in January and<br />
North Hemispherical Temperature Anomalies Data<br />
Ji Lingling<br />
Nanjing Normal University<br />
jll0011@126.com<br />
Lin Zhenshan<br />
119
Nanjing Normal University<br />
Cao Liqing<br />
Nanjing Normal University<br />
Assumed that climate change is a period signal <strong>on</strong>ly changed with time, and a<br />
compositi<strong>on</strong> of multi-timescale signals without regard to the affect of other physical factors,<br />
such as sunspots, radiati<strong>on</strong> etc., then each periods of climatic data can be decomposed by<br />
EMD method and the model can be built using n<strong>on</strong>linear minimizati<strong>on</strong> procedures to<br />
rec<strong>on</strong>struct this climate data. Further, the future climate change can be estimated by using this<br />
model. <str<strong>on</strong>g>The</str<strong>on</strong>g> experimentati<strong>on</strong>s <strong>on</strong> two different real time series, global sun solar in January and<br />
North hemispherical temperature anomalies data from NOAA.CDC., indicate that this method<br />
is able to get very good fit results. <str<strong>on</strong>g>The</str<strong>on</strong>g>refore, the method used in this paper show great<br />
promise for revealing patterns in historical data.<br />
Key Words: Climatic Time Series; Empirical Mode Decompositi<strong>on</strong>(EMD); Data Rec<strong>on</strong>structi<strong>on</strong><br />
L<strong>on</strong>g-term climatology of droughts in the Limpopo Province of South Africa<br />
T. A. Kabanda<br />
University of Venda, South Africa<br />
kabanda@univen.ac.za<br />
This paper examines the nature of l<strong>on</strong>g-term climatology of droughts in the Vhembe<br />
District of the Limpopo Province in South Africa. One of its focus areas is the assessment of<br />
the l<strong>on</strong>g-term rainfall characteristics in the district to determine changes over time, frequency<br />
and durati<strong>on</strong> of dry spells. Drought is described as a severe event, therefore the frequency of<br />
occurrence and intensity need to be explained by using criteria that distinguish normal dry<br />
spells from real drought. <str<strong>on</strong>g>The</str<strong>on</strong>g> study examines the geographical variability of dry spells in the<br />
area and analyses seas<strong>on</strong>al drought in detail to reveal its frequency, spatial coverage, and<br />
persistence.<br />
<str<strong>on</strong>g>The</str<strong>on</strong>g> required data in this study is the area rainfall, obtained from South Africa Weather<br />
Service (SAWS). All stati<strong>on</strong> data were intercorrelated to produce blocks of highly correlating<br />
sites. All the blocks were subjected to principal comp<strong>on</strong>ent analysis (PCA) to determine their<br />
homogeneity in space. Rainfall data for 40 years (1960-1999) were used. Standardized<br />
Precipitati<strong>on</strong> Indices (SPIs) was employed to determine the statistical rarity of drought<br />
episodes, drought <strong>on</strong>set, intensity and cessati<strong>on</strong>.<br />
From rainfall time series, abnormally extended dry spells and c<strong>on</strong>secutive l<strong>on</strong>g dry spells<br />
are precursors of drought. <str<strong>on</strong>g>The</str<strong>on</strong>g> SPI detects negative values that indicate less than median<br />
precipitati<strong>on</strong>, and if they persists to reach SPI value of -1.0 or less it is a sign of occurrence of<br />
drought. Findings of this research dem<strong>on</strong>strate the nature of the l<strong>on</strong>g-term climatology of<br />
drought in Limpopo Province and are of use in agriculture, water resource management,<br />
drought m<strong>on</strong>itoring and early warning and also in formulating drought policies.<br />
120
Rescue of historical climate data: Compilati<strong>on</strong> of a new historical data-base for Germany<br />
Alice Kapala<br />
Meteorological Institute, B<strong>on</strong>n<br />
akapala@uni-b<strong>on</strong>n.de<br />
Susanne Bachner<br />
Meteorological Institute, B<strong>on</strong>n<br />
Hermann Maechel<br />
German Weather Service<br />
Johannes Behrendt<br />
German Weather Service<br />
<str<strong>on</strong>g>The</str<strong>on</strong>g> sequence of disastrous floods and unusual hot summer in the last decade result in<br />
growing scientific interest in studies in changes in extreme weather and climate events. For the<br />
assessment of changes in climate extremes, high resoluti<strong>on</strong>, gap free l<strong>on</strong>g-term observati<strong>on</strong>al<br />
records are needed. However, in the majority of the countries, and also in Germany, such<br />
climate data are rare. In this c<strong>on</strong>tributi<strong>on</strong> an overview will be given about efforts, which have<br />
been made in the rescue of historical climate data in Germany. Presented are the digitalizati<strong>on</strong><br />
and quality c<strong>on</strong>trol techniques as well as homogenisati<strong>on</strong> methods of the daily climatic<br />
records.<br />
Annual and seas<strong>on</strong>al precipitati<strong>on</strong> trend investigati<strong>on</strong> in central regi<strong>on</strong> of Iran using<br />
n<strong>on</strong>-parametric methods<br />
Yo<strong>on</strong>es Khoshkhoo<br />
Tehran University<br />
yo<strong>on</strong>es.khoshkhoo@gmail.com<br />
Sohrab Hajjam<br />
Institute of Geophysics, University of Tehran<br />
In this paper annual and seas<strong>on</strong>al precipitati<strong>on</strong> trends of some 48 meteorological stati<strong>on</strong>s<br />
of central regi<strong>on</strong> of Iran during the (1971-2000) period were investigated using Mann-Kendall<br />
and Sen's Estimator Slope n<strong>on</strong>-parametric methods. Results show that the applicati<strong>on</strong> of these<br />
two methods is almost similar. the Sen's Estimator Slope method showed better performance<br />
where the number of zero in the time series of data was c<strong>on</strong>siderable. <str<strong>on</strong>g>The</str<strong>on</strong>g> results showed a<br />
significant negative trend in both test in some of the time series. But no significant positive<br />
trend for both test was c<strong>on</strong>firmed. Since the number of series with significant trend comparing<br />
with series without any trend was small, therefore a general trend can not be attributed to the<br />
regi<strong>on</strong>.<br />
121
Keywords: precipitati<strong>on</strong> trend, N<strong>on</strong>-parametric methods, Mann-Kendall, Sen's Estimator Slope,<br />
Iran<br />
L<strong>on</strong>g-range correlati<strong>on</strong>s of ERA-40 temperature data: Geographic patterns and height<br />
dependence<br />
Andrea Kiraly<br />
Department of Physics of Complex Systems, Lorand Eotvos University, Budapest, Hungary<br />
kiralya@lecso.elte.hu<br />
Imre M. Janosi<br />
Department of Physics of Complex Systems, Lorand Eotvos University, Budapest, Hungary<br />
Global temperature data from six pressure levels (1000hPa, 850hPa, 600hPa, 400hPa,<br />
200hPa, 100hPa) of the ERA-40 re-analisys data bank (temporal resoluti<strong>on</strong> of 6 hours,<br />
covered interval of 45 years, spatial resoluti<strong>on</strong> of 2.5°×2.5° lat/l<strong>on</strong>g) are analyzed in order to<br />
quantitatively characterize correlati<strong>on</strong> properties.<str<strong>on</strong>g>The</str<strong>on</strong>g> method of detrended fluctuati<strong>on</strong> analysis<br />
(DFA) is exploited, which has proven useful in revealing the extent of l<strong>on</strong>g-range correlati<strong>on</strong>s<br />
in various time series.<str<strong>on</strong>g>The</str<strong>on</strong>g> temperature records exhibit l<strong>on</strong>g-range temporal power-law<br />
correlati<strong>on</strong>s extending up to several years for all grid points.<str<strong>on</strong>g>The</str<strong>on</strong>g> correlati<strong>on</strong> exp<strong>on</strong>ent's<br />
geographic distributi<strong>on</strong> is quite complex at the lowermost pressure level 1000hPa, but it<br />
reproduces the spatial patterns detected for the observati<strong>on</strong>al data (e.g. several thousands of<br />
terrestrial daily temperature records from the Global Daily Climatology Network, GDCN).At<br />
higher levels the modifying effects of the surface are weaker, the spatial distributi<strong>on</strong> of<br />
exp<strong>on</strong>ent values becomes much smoother. Near the equator (between 15° S and 15° N) the<br />
level of correlati<strong>on</strong>s is str<strong>on</strong>g, inside the 30°-60° band exhibits a local minimum and towards<br />
the poles it becomes higher again <strong>on</strong> both hemispheres. This geographic pattern is similar to<br />
the distributi<strong>on</strong>s observed for some other meteorological parameters, e.g. the correlati<strong>on</strong><br />
exp<strong>on</strong>ent for oz<strong>on</strong>e c<strong>on</strong>centrati<strong>on</strong>s.<str<strong>on</strong>g>The</str<strong>on</strong>g>se results can serve as useful testbed for validating<br />
globally coupled numerical ocean-atmosphere models.<br />
Interpolati<strong>on</strong> methods of weather generator parameters<br />
Stanislava Kliegrova<br />
Czech Hydrometeorological Institute, Czech Republic<br />
stanislava.kliegrova@chmi.cz<br />
Martin Dubrovsky<br />
Institute of Atmospheric Physics, Czech Republic<br />
Ladislav Metelka<br />
Czech Hydrometeorological Institute, Czech Republic<br />
122
D. Semeradova<br />
Institute of Landscape Ecology, Czech Republic<br />
Olga Halasova<br />
Czech Hydrometeorological Institute, Czech Republic<br />
Stochastic weather generators (WGs) are used to provide observed like synthetic weather<br />
series. <str<strong>on</strong>g>The</str<strong>on</strong>g> synthetic series may be generated for both present and changed climate<br />
c<strong>on</strong>diti<strong>on</strong>s and serve typically as an input to various weather dependent models (e.g. crop<br />
models and rainfall runoff models). A stochastic single site 4 variate daily weather generator<br />
Met&Roll is used here. Met&Roll uses Markov chain (order = 1 to 3) to model precipitati<strong>on</strong><br />
occurrence, Gamma distributi<strong>on</strong> to model precipitati<strong>on</strong> amount and first order autoregressive<br />
model to model solar radiati<strong>on</strong> and daily extreme temperatures.<br />
<str<strong>on</strong>g>The</str<strong>on</strong>g> main aim of the paper is comparis<strong>on</strong> of methods of interpolating of WG parameters<br />
from stati<strong>on</strong>s to sites with n<strong>on</strong> existing or incomplete historical observati<strong>on</strong>s. Three<br />
interpolati<strong>on</strong> techniques were tested: kriging or co kriging run from ArcGIS, neural networks<br />
and weighted nearest neighbours. Kriging is an advanced geostatistical procedure that<br />
generates an estimated surface from a scattered set of points with z-values. Weighted nearest<br />
neighbours interpolator defines the interpolated value as a weighted average from the<br />
surrounding stati<strong>on</strong>s using a bell shaped distance based weight. Neural networks are<br />
sophisticated techniques (generally n<strong>on</strong>-linear), capable of modelling extremely complex<br />
functi<strong>on</strong>s.<str<strong>on</strong>g>The</str<strong>on</strong>g> performance of the interpolati<strong>on</strong> techniques is examined in two ways: (i)<br />
accuracy of interpolati<strong>on</strong> of individual WG parameters is assessed in terms of the Root Mean<br />
Square Error and Reducti<strong>on</strong>-of Variance of individual WG parameters. (ii) Climatic<br />
characteristics derived from the synthetic series produced by the interpolated weather<br />
generator are compared with those derived from the series produced by WG calibrated with<br />
the site specific observed weather data. <str<strong>on</strong>g>The</str<strong>on</strong>g> experiments are based <strong>on</strong> 1961-90 weather<br />
series from a set of 125 Czech stati<strong>on</strong>s and a stress is put <strong>on</strong> precipitati<strong>on</strong> characteristic<br />
(parameters of Gamma distributi<strong>on</strong>, parameters of the first-order Markov chain, some extreme<br />
precipitati<strong>on</strong> characteristics).<br />
Acknowledgement: <str<strong>on</strong>g>The</str<strong>on</strong>g> c<strong>on</strong>tributi<strong>on</strong> is an outcome of the CaliM&Ro project sp<strong>on</strong>sored by<br />
the Grant Agency of the Czech Republic (project 205/05/2265).<br />
Intra-seas<strong>on</strong>al Variability of Indian M<strong>on</strong>so<strong>on</strong> Precipitati<strong>on</strong> in Coupled Climate Model<br />
Simulati<strong>on</strong>s and Projecti<strong>on</strong>s under IPCC AR4<br />
ASHWINI KULKARNI<br />
INDIAN INSTITUTE OF TROPICAL METEOROLOGY, PUNE, INDIA<br />
ashwini@tropmet.res.in<br />
S S SABADE<br />
INDIAN INSTITUTE OF TROPICAL METEOROLOGY, PUNE, INDIA<br />
R H KRIPALANI<br />
INDIAN INSTITUTE OF TROPICAL METEOROLOGY, PUNE, INDIA<br />
123
<str<strong>on</strong>g>The</str<strong>on</strong>g> intra-seas<strong>on</strong>al variability of the Indian m<strong>on</strong>so<strong>on</strong> rainfall plays a dominant role in<br />
deciding the seas<strong>on</strong>al strength of the m<strong>on</strong>so<strong>on</strong>. <str<strong>on</strong>g>The</str<strong>on</strong>g> Indian m<strong>on</strong>so<strong>on</strong> is known to exhibit two<br />
dominant periodicities of intra-seas<strong>on</strong>al oscillati<strong>on</strong>s 30-60 days and 10-20 days <strong>on</strong> the spatial<br />
scale of entire landmass. In this paper the nature and intensity of these dominant periodicities<br />
have been studied <strong>on</strong> smaller spatial domains during all-India droughts and floods. <str<strong>on</strong>g>The</str<strong>on</strong>g> high<br />
resoluti<strong>on</strong> data 1o x 1o latitude/l<strong>on</strong>gitude over Indian domain for the recent period of<br />
1951-2003 provided by India Meteorological Department have been used in this analysis. <str<strong>on</strong>g>The</str<strong>on</strong>g><br />
powerful tools of mathematical statistics (thoroughly discussed by Storch and Zwiers, 1999)<br />
are applied to analyse the daily rainfall time series of high resoluti<strong>on</strong> data over Indian domain.<br />
<str<strong>on</strong>g>The</str<strong>on</strong>g> multi-taper spectrum analysis method (Ghil et al, 2002) has been applied to identify the<br />
periodicities over four homogeneous regi<strong>on</strong>s. This method shows that 30-60 days periodicity is<br />
dominant over west coast and central India during droughts while the floods are characterized<br />
by high frequency oscillati<strong>on</strong>s (Kulkarni et al, <str<strong>on</strong>g>2007</str<strong>on</strong>g>) To examine the time variability of dominant<br />
periodicities over these four regi<strong>on</strong>s, wavelet analysis has been applied to daily time series<br />
over every grid for each of all-India drought and flood years. <str<strong>on</strong>g>The</str<strong>on</strong>g> average spectrum shows that<br />
over west coast the 30-60 days oscillati<strong>on</strong>s are dominant in later half of the seas<strong>on</strong>,<br />
August-September during all-India droughts while during floods they dominate at the end of<br />
the seas<strong>on</strong>, September (Kulkarni et al, 2006). Over Central India 30-60 days oscillati<strong>on</strong>s are<br />
dominant in the vital m<strong>on</strong>ths of the seas<strong>on</strong>, July and September during droughts <str<strong>on</strong>g>The</str<strong>on</strong>g><br />
space-time variability of two most dominant modes of ISV of Indian m<strong>on</strong>so<strong>on</strong> is studied by<br />
applying Empirical Orthog<strong>on</strong>al Functi<strong>on</strong> (EOF) technique to the 53 spatial patterns of<br />
explained variance by these two modes. <str<strong>on</strong>g>The</str<strong>on</strong>g> most dominant pattern explains 23.6% (30-60<br />
days mode) and 11.5% (10-20 days mode) variance. <str<strong>on</strong>g>The</str<strong>on</strong>g> corresp<strong>on</strong>ding principal comp<strong>on</strong>ent<br />
time series reveal that both the oscillati<strong>on</strong>s have weakened after 1975. Kripalani et al (<str<strong>on</strong>g>2007</str<strong>on</strong>g>)<br />
have shown that <strong>on</strong>ly 6 coupled climate models under IPCC AR4 (cccma_cgcm3.1, cnrm_cm3,<br />
mpi_echam5, miroc3_medres, miroc3_hires and ukmo_hadcm3) are able to simulate the<br />
seas<strong>on</strong>al mean m<strong>on</strong>so<strong>on</strong> precipitati<strong>on</strong> over India reas<strong>on</strong>ably well. We are trying to examine<br />
the capability of these models to simulate the characteristics of intra-seas<strong>on</strong>al variability of<br />
Indian m<strong>on</strong>so<strong>on</strong> precipitati<strong>on</strong> which are discussed above. Also the intra-seas<strong>on</strong>al variability in<br />
future will be studied in SRES projecti<strong>on</strong> scenarios. <str<strong>on</strong>g>The</str<strong>on</strong>g> work is under progress and the results<br />
will be presented at the c<strong>on</strong>ference.<br />
References:<br />
Ghil M and 10 others 2002. Advanced spectral methods for climatic time series. Review of<br />
Geophysics .40 : 1-1 – 1-41<br />
Kripalani R H, Oh J H, Kulkarni Ashwini, Sabade S S and Chaudhari H S <str<strong>on</strong>g>2007</str<strong>on</strong>g> South<br />
Asian summer m<strong>on</strong>so<strong>on</strong> precipitati<strong>on</strong> variability: Coupled climate model simulati<strong>on</strong>s and<br />
projecti<strong>on</strong>s under IPCC AR4 <str<strong>on</strong>g>The</str<strong>on</strong>g>oretical and Applied Climatology DOI<br />
10.1007/s00704-006-0282-0<br />
Kulkarni Ashwini, Sabade SS and Kripalani RH 2006 Intra-seas<strong>on</strong>al vagaries of Indian<br />
summer m<strong>on</strong>so<strong>on</strong> rainfall IITM Research Report ISSN 0252-1075, No RR-114, 51 pp<br />
124
Kulkarni Ashwini, Sabade S S and Kripalani R H, <str<strong>on</strong>g>2007</str<strong>on</strong>g> Spatial variability of intra-seas<strong>on</strong>al<br />
oscillati<strong>on</strong>s during extreme Indian m<strong>on</strong>so<strong>on</strong>s, <str<strong>on</strong>g>Internati<strong>on</strong>al</str<strong>on</strong>g> Journal of Climatology (submitted<br />
revised manuscript)<br />
Storch Hans v<strong>on</strong> and Zwiers Francis 1999 Statistical Analysis in Climate Research,<br />
Cambridge University Press, 484 pp<br />
Statistical analysis of definiteness of selected climate classificati<strong>on</strong>s from a view of climate change<br />
KVETON, VIT<br />
Czech Hydrometeorological Institute<br />
vit.kvet<strong>on</strong>@chmi.cz<br />
ZAK, M.<br />
Czech Hydrometeorological Institute<br />
More climate classificati<strong>on</strong>s are used for different fields of ec<strong>on</strong>omy, especially in<br />
agriculture and forestry. Am<strong>on</strong>g specialists arises the questi<strong>on</strong>, what changes of climate<br />
regi<strong>on</strong>s borders will occur in associati<strong>on</strong> with climate change. Presentati<strong>on</strong> deals with problem<br />
of uncompromisingness of Quitt’s regi<strong>on</strong>al climate classificati<strong>on</strong> which is frequently used in the<br />
Czech Republic. Statistical evaluati<strong>on</strong> of uncompromisingness of climate regi<strong>on</strong>s in 0.5 km<br />
squares is presented. Capabilities of using of fuzzy sets methods for computerized creating of<br />
digital maps of similar climate classificati<strong>on</strong> are discusses, too. Results show that the<br />
discussed type of the climate classificati<strong>on</strong> is unambiguous from the principle and it is not<br />
suitable for climate change studies. Koeppen’s classificati<strong>on</strong> is discussed from above<br />
menti<strong>on</strong>ed view, too.<br />
<str<strong>on</strong>g>The</str<strong>on</strong>g> structure of predictability in a quasigeostrophic atmospheric model<br />
Frank Kwasniok<br />
University of Exeter, United Kingdom<br />
F.Kwasniok@exeter.ac.uk<br />
Ulrike Feudel<br />
University of Oldenburg, Germany<br />
<str<strong>on</strong>g>The</str<strong>on</strong>g> local predictability of planetary atmospheric flow is investigated in the framework of a<br />
three-level quasigeostrophic (QG) model with realistic climatological mean state and variance<br />
pattern as well as Pacific/North America and North Atlantic Oscillati<strong>on</strong> telec<strong>on</strong>necti<strong>on</strong> patterns.<br />
Local predictability is quantified by instantaneous and finite-time Lyapunov exp<strong>on</strong>ents and<br />
125
vectors. <str<strong>on</strong>g>The</str<strong>on</strong>g> variati<strong>on</strong> of local predictability across state space is examined. <str<strong>on</strong>g>The</str<strong>on</strong>g> study also<br />
aims to infer predictability informati<strong>on</strong> in geographical rather than spectral space. To this end,<br />
local growth exp<strong>on</strong>ents are calculated from the Lyapunov vectors and their time evoluti<strong>on</strong>.<br />
Moreover, a local Lyapunov vector dimensi<strong>on</strong> is introduced to measure the dimensi<strong>on</strong> of the<br />
space spanned by the leading Lyapunov vectors locally in geographical space.<br />
<str<strong>on</strong>g>The</str<strong>on</strong>g> methodology of cluster-weighted modeling is used to derive a probabilistic model of<br />
the first Lyapunov exp<strong>on</strong>ent c<strong>on</strong>diti<strong>on</strong>ed <strong>on</strong> the leading empirical orthog<strong>on</strong>al functi<strong>on</strong>s (EOFs)<br />
of the QG model. This approach allows the identificati<strong>on</strong> of regimes in the large-scale<br />
circulati<strong>on</strong> that tend to be associated with large or small finite-time Lyapunov exp<strong>on</strong>ents as<br />
quantified by a regime-weighted mean Lyapunov exp<strong>on</strong>ent.<br />
Projected change in mean and extreme climate over Korea<br />
W<strong>on</strong>-Tae Kw<strong>on</strong><br />
Climate Research Lab., Meteorological Research Institute, Korea Meteorological Administrati<strong>on</strong>,<br />
Korea<br />
w<strong>on</strong>tk@metri.re.kr<br />
Eun-So<strong>on</strong> Im<br />
Earth System Physics Secti<strong>on</strong>, ICTP, Italy<br />
Mo<strong>on</strong>-Hyun Kim<br />
Climate Research Lab., Meteorological Research Institute, Korea Meteorological Administrati<strong>on</strong>,<br />
Korea<br />
We present an analysis of a simulated climate projecti<strong>on</strong> covering the period 1971-2080<br />
over the Korean Peninsula with a regi<strong>on</strong>al climate model (RegCM3) using a <strong>on</strong>e-way<br />
double-nested system. <str<strong>on</strong>g>The</str<strong>on</strong>g> mean climate state as well as frequency and intensity of daily<br />
extreme events are investigated at various temporal and spatial scales, with a focus <strong>on</strong><br />
surface air temperature and precipitati<strong>on</strong>.In order to obtain c<strong>on</strong>fidence of future climate<br />
projecti<strong>on</strong>, we first evaluated the reference scenario (1971-2000) against a dense observati<strong>on</strong><br />
network over the Korean territory. <str<strong>on</strong>g>The</str<strong>on</strong>g> RegCM3 successfully simulates the fine scale structure<br />
of the temperature field due to topographic forcing but it shows a systematic cold bias mostly<br />
due to an underestimate of maximum temperature. <str<strong>on</strong>g>The</str<strong>on</strong>g> frequency distributi<strong>on</strong> of simulated<br />
daily mean temperature agrees well with the observed seas<strong>on</strong>al and spatial patterns. In the<br />
summer seas<strong>on</strong>, however, daily variability is underestimated. <str<strong>on</strong>g>The</str<strong>on</strong>g> RegCM3 simulati<strong>on</strong><br />
adequately captures the seas<strong>on</strong>al evoluti<strong>on</strong> of precipitati<strong>on</strong> associated to the East Asian<br />
m<strong>on</strong>so<strong>on</strong>. In particular, the simulated winter precipitati<strong>on</strong> is remarkably good. Although<br />
summer precipitati<strong>on</strong> is underestimated, area-averaged time series of precipitati<strong>on</strong> over Korea<br />
show that the RegCM3 agrees better with observati<strong>on</strong>s than ECHO-G both in terms of<br />
seas<strong>on</strong>al evoluti<strong>on</strong> and precipitati<strong>on</strong> amounts. Heavy rainfall phenomena exceeding 300<br />
mm/day are simulated <strong>on</strong>ly at the high resoluti<strong>on</strong> of the double nested domain. Projected<br />
changes in both temperature and precipitati<strong>on</strong> fields provide str<strong>on</strong>g evidence that East Asia<br />
including the Korean Peninsula undergoes a more warmer and wetter climate regime in<br />
resp<strong>on</strong>se to the intensificati<strong>on</strong> of the summer m<strong>on</strong>so<strong>on</strong> and weakening of the winter m<strong>on</strong>so<strong>on</strong>.<br />
126
<str<strong>on</strong>g>The</str<strong>on</strong>g> magnitude of the change signals both in mean and extremes of temperature and<br />
precipitati<strong>on</strong> in resp<strong>on</strong>se to anthropogenic forcings is more pr<strong>on</strong>ounced in 2051-2080<br />
compared to the period of 2021-2050 as GHG c<strong>on</strong>centrati<strong>on</strong> increased. <str<strong>on</strong>g>The</str<strong>on</strong>g> temperature<br />
exhibits a positively persistent trend throughout whole period increasing by 3.2°C for 2070s<br />
while precipitati<strong>on</strong> is characterized by pr<strong>on</strong>ounced interdecadal variati<strong>on</strong>s, with gradual<br />
amplificati<strong>on</strong> of the fluctuati<strong>on</strong> range. During wet period, the summer m<strong>on</strong>so<strong>on</strong> is intensified<br />
due to str<strong>on</strong>ger southeasterly flow, favorable for advecti<strong>on</strong> of lower level warm and moist air<br />
from the Pacific Ocean. A significant increase (decrease) of hot (frost) spells is found al<strong>on</strong>g<br />
with increasing (decreasing) of maximum (minimum) temperature. <str<strong>on</strong>g>The</str<strong>on</strong>g> frequency distributi<strong>on</strong><br />
of daily precipitati<strong>on</strong> during 2051-2080 indicates heavy rainfall over 400 mm/day, suggesting<br />
the possibility of increasing frequency of flood events. Wet spells of l<strong>on</strong>g periods tend to be<br />
more frequent as well, accompanied with an increase of precipitati<strong>on</strong> amounts<br />
Trend Indicators of Atmospheric Climate Change based <strong>on</strong> Reanalyses and Global Climate<br />
Model Scenarios<br />
Bettina C. Lackner<br />
bettina.lackner@uni-graz.at<br />
Andrea K. Steiner<br />
Florian Ladstaedter<br />
Gottfried Kirchengast<br />
Wegener Center for Climate and Global Change (WegCenter), University of Graz, and Institute for<br />
Geophysics, Astrophysics, and Meteorology (IGAM), University of Graz, Austria<br />
<str<strong>on</strong>g>The</str<strong>on</strong>g> upper troposphere-lower stratosphere (UTLS) regi<strong>on</strong> is re-acting particularly<br />
sensitive to climate change. Thus, changes of the thermodynamic state of this part of the<br />
atmosphere, especially variati<strong>on</strong>s of its key parameters, are promising candidates for the<br />
m<strong>on</strong>itoring and diagnosis of climate change.<br />
This study aims at revealing optimal atmospheric climate change indicators with respect<br />
to radio occultati<strong>on</strong> (RO) measurements, which feature high accuracy, l<strong>on</strong>g-term stability, and<br />
global coverage. As a first step, due to the currently limited time length of RO observati<strong>on</strong>s, we<br />
investigate ‘proxy’ climatologies from reanalyses and global climate model runs. We use two<br />
reanalysis data sets and three representative climate models with two representative<br />
scenarios for the IPCC 4th Assessment Report serving as multi-decadal datasets out to year<br />
2050. <str<strong>on</strong>g>The</str<strong>on</strong>g> datasets are systematically explored for finding the most robust and sensitive trend<br />
indicators by testing pre-defined potentially useful atmospheric parameters such as refractivity,<br />
geopotential height, temperature, and specific humidity. <str<strong>on</strong>g>The</str<strong>on</strong>g>se key climate variables were<br />
chosen since they are provided by RO measurements with highest accuracy.<br />
Temporal characteristics of trends are analyzed <strong>on</strong> the basis of a seas<strong>on</strong>al resoluti<strong>on</strong>. Different<br />
investigated spatial domains (e.g., northern/southern hemisphere, tropics, mid-latitudes, as<br />
well as UT, LS) allow a mapping of regi<strong>on</strong>s, which are particularly suitable for trend indicators.<br />
127
Least squares fitting of a linear trend provide parameter estimates (slope, intercept) and<br />
interval estimates (standard deviati<strong>on</strong>s of the parameters). <str<strong>on</strong>g>The</str<strong>on</strong>g> significance of the trend is<br />
derived for an estimate of the signal to noise ratio (SNR). Sensitive and robust indicators need<br />
comparatively low residual variance and favorable SNR for all scenarios of the multi-ensemble<br />
database.<br />
First results for optimal UTLS trend indicators of climate change, including the most<br />
promising parameters and their spatio-temporal characteristics, will be presented.<br />
Bayesian Detecti<strong>on</strong> and Attributi<strong>on</strong> of Climate Change <strong>on</strong> a Regi<strong>on</strong> of Northeast Asia<br />
Je<strong>on</strong>g-Hye<strong>on</strong>g Lee<br />
Divisi<strong>on</strong> of Management Informati<strong>on</strong> Science, D<strong>on</strong>g-A University, Korea<br />
je<strong>on</strong>glee@dau.ac.kr<br />
Ke<strong>on</strong>-Tae Sohn<br />
Department of Statistics, Pusan Nati<strong>on</strong>al University, Korea<br />
Kyung-Ja Ha<br />
Department of Atmospheric Sciences, Pusan Nati<strong>on</strong>al University, Korea<br />
In this study, we performed that climate change signal detecti<strong>on</strong> and attributi<strong>on</strong> were<br />
studied for the surface air temperature in a regi<strong>on</strong> of Northeast Asia (100-150°E, 20-60°N). We<br />
use a Bayesian fingerprints methodology to compare annual data from ERA40 reanalysis and<br />
MRI coupled atmosphere-ocean general circulati<strong>on</strong> model. It is exemplified with ERA40<br />
reanalysis data from 1961 to 2000 as an observati<strong>on</strong>, 1% a year CO2 increase experiment to<br />
doubling with realizati<strong>on</strong>s. A Bayesian fingerprint analysis of the evidence for anthropogenic<br />
climate change in the Northeast Asian regi<strong>on</strong> surface air temperature observati<strong>on</strong>s is<br />
described with changes in a climate change scenarios.Our findings are shown that there is a<br />
statistically significant anthropogenic climate change in the Northeast Asian surface air<br />
temperature change over the past four decades (1961-1970, 1971-1980, 1981-1990, and<br />
1991-2000) and there is a evidence for attributi<strong>on</strong> assessments to represented in our<br />
fingerprints and specific definiti<strong>on</strong> of the attributi<strong>on</strong> regi<strong>on</strong>.<br />
Stochastic downscaling of climate model outputs for c<strong>on</strong>tinuous hydrological simulati<strong>on</strong><br />
Nadja Leith<br />
University College L<strong>on</strong>d<strong>on</strong><br />
Christian Onof<br />
Imperial College L<strong>on</strong>d<strong>on</strong><br />
128
Richard E. Chandler<br />
University College L<strong>on</strong>d<strong>on</strong><br />
Valerie Isham<br />
University College L<strong>on</strong>d<strong>on</strong><br />
Howard Wheater<br />
Imperial College L<strong>on</strong>d<strong>on</strong><br />
<str<strong>on</strong>g>The</str<strong>on</strong>g>re is increasing recogniti<strong>on</strong> that, in hydrological problems such as flood risk<br />
assessment and management, it is desirable to simulate catchment processes over extended<br />
time periods. Such ’c<strong>on</strong>tinuous simulati<strong>on</strong>’ requires the ability to generate l<strong>on</strong>g sequences of<br />
rainfall data, at an appropriate spatial and temporal scale, for input to hydrological models of<br />
catchment resp<strong>on</strong>se. Moreover, for medium and l<strong>on</strong>g term planning it is necessary to account<br />
for climate change. This talk will describe research at UCL and at Imperial College L<strong>on</strong>d<strong>on</strong>,<br />
which aims to provide the UK with a nati<strong>on</strong>al capability for the generati<strong>on</strong> of future rainfall<br />
sequences at daily and subdaily time scales. <str<strong>on</strong>g>The</str<strong>on</strong>g> methodology exploits informati<strong>on</strong> from<br />
numerical climate models, while recognising that there are questi<strong>on</strong>s regarding the ability of<br />
these models to represent rainfall at scales of hydrological relevance. <str<strong>on</strong>g>The</str<strong>on</strong>g> work falls into two<br />
parts. First, generalized linear models (GLMs) are used to parameterise relati<strong>on</strong>ships between<br />
observed daily raingauge data and large-scale atmospheric variables that are represented<br />
reas<strong>on</strong>ably well by the climate models. It is shown that GLM simulati<strong>on</strong>s are able to reproduce<br />
closely the properties of historical rainfall sequences, including measures of interannual<br />
variability and extremes. In the sec<strong>on</strong>d stage, relati<strong>on</strong>ships are identified between rainfall<br />
properties at different temporal scales; these relati<strong>on</strong>ships appear invariant over a wide range<br />
of different climatic c<strong>on</strong>diti<strong>on</strong>s (represented by different m<strong>on</strong>ths of the year and different<br />
locati<strong>on</strong>s), and hence enable the properties of subdaily rainfall sequences to be deduced from<br />
those of daily sequences in an altered climate that is<br />
<str<strong>on</strong>g>The</str<strong>on</strong>g> seas<strong>on</strong>al characteristic of ChangSha's climate warming<br />
Liao Chunhua<br />
Weather service of Hunan Province<br />
liaochunhua_chat@126.com<br />
Liu Tiantian<br />
Weather service of Hunan Province<br />
This article statistics the air temperature data of ChangSha m<strong>on</strong>thly,the results are<br />
found:1.<str<strong>on</strong>g>The</str<strong>on</strong>g> air temperature of ChangSha has been rising in more than half century.2.<str<strong>on</strong>g>The</str<strong>on</strong>g><br />
characteristic of elevated temperature exist a notable seas<strong>on</strong>al difference in ChangSha,which<br />
is distinct in spring,but is unclear in summer.3.<str<strong>on</strong>g>The</str<strong>on</strong>g> climate warming of ChangSha is stand out<br />
in the recent 10 years.<br />
129
Rainfall and Synoptic characteristics of the flood discharge events at Xin'anjiang, eastern <str<strong>on</strong>g>China</str<strong>on</strong>g>,<br />
during the 1980s-1990s<br />
H<strong>on</strong>gtao Liu<br />
.College of Atmospheric Sciences, Lanzhou University<br />
liuht@tea.ac.cn<br />
Yan Zh<strong>on</strong>gwei<br />
Key Laboratory of Regi<strong>on</strong>al Climate-Envir<strong>on</strong>ment Research for Temperate East<br />
Asia(RCE-TEA),Institute of Atmospheric Physics, Chinese Academy of Sciences<br />
Dai Xingang<br />
Key Laboratory of Regi<strong>on</strong>al Climate-Envir<strong>on</strong>ment Research for Temperate East<br />
Asia(RCE-TEA),Institute of Atmospheric Physics, Chinese Academy of Sciences<br />
Huang Gang<br />
Key Laboratory of Regi<strong>on</strong>al Climate-Envir<strong>on</strong>ment Research for Temperate East<br />
Asia(RCE-TEA),Institute of Atmospheric Physics, Chinese Academy of Sciences<br />
Rainstorms in eastern <str<strong>on</strong>g>China</str<strong>on</strong>g> tended to be more frequent and enhanced after the 1970s.<br />
Subsequently there were quite a few flood discharge events during the 1980s-1990s at the<br />
Xin’anjiang Reservoir and Hydropower Stati<strong>on</strong>, which supplies electricity and water for the<br />
area including Shanghai and Hangzhou, eastern <str<strong>on</strong>g>China</str<strong>on</strong>g>. A study of the rainfall and synoptic<br />
characteristics in the regi<strong>on</strong> for the years of flood discharges was carried out, in order to help<br />
improving the reservoir management. Daily precipitati<strong>on</strong> data of surrounding stati<strong>on</strong>s and the<br />
ERA-40 reanalysis data for the rainy seas<strong>on</strong> (April-July) of 4 flood discharge years were<br />
analyzed. A comm<strong>on</strong> feature for the flood discharge years was revealed that the accumulated<br />
daily rainfall kept positively anomalous (above climatological mean level) since mid-April,<br />
followed by some unusually heavy rainfall process in late June just before the decisi<strong>on</strong>-making<br />
for flood discharge. <str<strong>on</strong>g>The</str<strong>on</strong>g> Meiyu period was l<strong>on</strong>ger than usual for the 4 years. Anomalously<br />
westward expansi<strong>on</strong> of the Subtropical High in the western Pacific and early burst of the Asian<br />
summer m<strong>on</strong>so<strong>on</strong> might have played a role in forming the anomalous rainfall process in<br />
eastern <str<strong>on</strong>g>China</str<strong>on</strong>g>.<br />
<str<strong>on</strong>g>The</str<strong>on</strong>g> Analysis and Study <strong>on</strong> Mesoscale c<strong>on</strong>vective Cloud Clusters and the Torrential Rains of the<br />
Middle Yangtze River During Meiyu Seas<strong>on</strong><br />
Tiantian Liu<br />
Hunan meterological office<br />
fbbt114@163.com<br />
Main c<strong>on</strong>clusi<strong>on</strong>s in this paper are in the following:<br />
(1)According to the c<strong>on</strong>crete situati<strong>on</strong> of Yangtze River,from the basic feature of mesoscale<br />
130
c<strong>on</strong>vective cloud clusters when they develop vigorously,this paper gives a definiti<strong>on</strong> to it. It<br />
comes to several statistical c<strong>on</strong>cluti<strong>on</strong>s by investgating the whole process from starting to<br />
disappearing of mesoscale c<strong>on</strong>vective cloud.<br />
(2)Raising a new point about the origin of the mesoscale c<strong>on</strong>vective cloud clusters,it is<br />
c<strong>on</strong>sidered that the fundamental reas<strong>on</strong> which causes the mesoscale c<strong>on</strong>vective cloud<br />
clusters is heating in local and dry layer;rather than upper trough or surface fr<strong>on</strong>t.<br />
(3)Analyses show that 74% mesoscale c<strong>on</strong>vective cloud clusters can cause torrential rains of<br />
the middle Yangtze River during meiyu seas<strong>on</strong>,44% torrential rains of the middle Yangtze<br />
River during meiyu seas<strong>on</strong> are caused by mesoscale c<strong>on</strong>vective cloud clusters.So to do well in<br />
the torrential rains of the middle Yangtze River during meiyu seas<strong>on</strong>,the analysis of mesoscale<br />
c<strong>on</strong>vective cloud clusters is essential.<br />
<str<strong>on</strong>g>The</str<strong>on</strong>g> Study of <str<strong>on</strong>g>The</str<strong>on</strong>g> Effect of D<strong>on</strong>gting Lake <strong>on</strong> <str<strong>on</strong>g>The</str<strong>on</strong>g> Temperature<br />
Tiantian Liu<br />
Hunan meteorologiacal offcie<br />
fbbt114@163.com<br />
Abstract:According to the climatic datas about 101 stati<strong>on</strong>s of Hunan province from 1951<br />
to 1980,and the datas hour by hour from part of observati<strong>on</strong>al stati<strong>on</strong>s in Hunan, in climatic<br />
and meteorologial term,in macroscopic and microcosmic term,this paper analyses the effect of<br />
D<strong>on</strong>gting Lake <strong>on</strong> the temperature,coming out:1.<str<strong>on</strong>g>The</str<strong>on</strong>g> effect of D<strong>on</strong>gting Lake <strong>on</strong> the daily<br />
variati<strong>on</strong> of air temperature is very obvious,Yueyang is by the east of the D<strong>on</strong>gting Lake,its<br />
daily maximum temperatures appear at 17 in average,even meteorologists in the lake district<br />
have not perceived this definitely before;2.<str<strong>on</strong>g>The</str<strong>on</strong>g> extreme maximum temperature of D<strong>on</strong>gting<br />
Lake district is lower than surrounding regi<strong>on</strong>s,and its extreme minimun temperature is higher<br />
than surrounding regi<strong>on</strong>s;3.<str<strong>on</strong>g>The</str<strong>on</strong>g> mean annual maximum temperature of D<strong>on</strong>gting Lake is lower<br />
than surrounding regi<strong>on</strong>s,and its mean annual minimum temperature is higher than<br />
surrounding regi<strong>on</strong>s,the data is about 1 ;4.<str<strong>on</strong>g>The</str<strong>on</strong>g> daily range of temperatures of D<strong>on</strong>gting Lake<br />
are smaller than other regi<strong>on</strong>s in Hunan province;5.<str<strong>on</strong>g>The</str<strong>on</strong>g> high-temperature days and<br />
low-temperature days of lake district are fewer than others.<br />
<str<strong>on</strong>g>The</str<strong>on</strong>g> Study of Reas<strong>on</strong>s of Drought of Northwestern Regi<strong>on</strong> of Iran<br />
Fardin Saberi Louyeh<br />
Danesh scientail and cultural institute, Tehran, Iran<br />
fardinlouyeh@yahoo.com<br />
Dr.Mjgan Afshar<br />
Azad University, central branch, Tehran, Iran<br />
131
<str<strong>on</strong>g>The</str<strong>on</strong>g> prevailing climate <strong>on</strong> our country is due to its locati<strong>on</strong> in dry and semi-dry district,<br />
as a result, drought is the comm<strong>on</strong>est phenomen<strong>on</strong> in this country. One of the drought and<br />
climatologic drought's definiti<strong>on</strong>s is as follow. If the precipitati<strong>on</strong> is less than average during<br />
l<strong>on</strong>g-term period, it is called drought. <str<strong>on</strong>g>The</str<strong>on</strong>g> drought of northwestern of Iran which is due to the<br />
shortage of precipitati<strong>on</strong> has caused starvati<strong>on</strong> and poverty.First, the research framework,<br />
theoretical principle, and study of precipitati<strong>on</strong> fluctuati<strong>on</strong>s, trend, temperature, humidity, wind,<br />
evapotranspirati<strong>on</strong> of stati<strong>on</strong>s are under study. <str<strong>on</strong>g>The</str<strong>on</strong>g>n the precipitati<strong>on</strong> correlati<strong>on</strong> between<br />
stati<strong>on</strong>s and precipitati<strong>on</strong> and temperature correlati<strong>on</strong> with respect to altitudes have been<br />
studied. In order to determine the reas<strong>on</strong>s of drought in the regi<strong>on</strong> which is under study,<br />
primarily, the fluctuati<strong>on</strong>s of time, frequency and degree of drought as per Z score have been<br />
examined which prove in statistical and synoptic network that due to simultaneous drought in<br />
regi<strong>on</strong> in terms of severity, weakness frequency, time, locati<strong>on</strong> at different stati<strong>on</strong>s are different.<br />
And later <strong>on</strong> study of reas<strong>on</strong>s of drought with regard to the pattern movement of general<br />
circulati<strong>on</strong> of climate with Tel c<strong>on</strong>necti<strong>on</strong> which results in changing in pattern pressure in<br />
regi<strong>on</strong> and movement of circumpolar western line and blocking systems by benefiting from<br />
normal distributi<strong>on</strong> probability the return period 2,5,20,100,1000 were determined and the<br />
occurrence of probability in distributi<strong>on</strong> %20 & 80% was calculated and return period with<br />
5-year drought range and 5-year humid period range.<br />
Quantifying Uncertanties Associated With Climate Variaiblity and Climate Change Studies: the<br />
Cox´S Semiparametric Approach<br />
Aline de Holanda Nunes Maia<br />
e-mail:ahmaia@cnpma.embrapa.br<br />
Embrapa Meio Ambiente<br />
Holger Meinke<br />
e-mail:holger.meinke@wur.nl<br />
Wageningen University, Department of Plant Sciences<br />
A wide range of probabilistic approaches have been used for assessing climatic risks and<br />
associated uncertainties: multiple linear regressi<strong>on</strong> (Martis et al, 2002), logistic regressi<strong>on</strong><br />
(Nichols, 1984; Lo et al, <str<strong>on</strong>g>2007</str<strong>on</strong>g>), n<strong>on</strong>parametric approaches based <strong>on</strong> empirical cumulative<br />
distributi<strong>on</strong> functi<strong>on</strong>s (Maia & Meinke, 1998; Maia et al, 2004), am<strong>on</strong>g others.<br />
In this paper, we quantify risks by using probability of exeedance curves (PECs) and<br />
propose the use of the proporti<strong>on</strong>al hazards model (also referred to as Cox model - Cox, 1972;<br />
CPH model) to investigate the influence of c<strong>on</strong>tinuous (e.g. oceanic/atmospheric indexes) or<br />
categorical predictors (e.g. classes derived from El Niño/Southern Oscillati<strong>on</strong>) <strong>on</strong> these risks.<br />
CPH model is widely used in medical analyses of survival data that examine the effect of<br />
explanatory variables <strong>on</strong> survival times. This allows the ranking of risk factors and quantitative<br />
assessments of their impacts. <str<strong>on</strong>g>The</str<strong>on</strong>g>se methods are well established in medical research and<br />
used routinely for risk assessment in medical studies (e.g. Finkelstein et al, 1993; De Lorgeril,<br />
132
1999; Smith et al, 2001; Gibb<strong>on</strong>s, 2002) where data are rarely normally distributed and often<br />
incomplete. To our knowledge, this study is the first using the CPH framework to analyse the<br />
linkage am<strong>on</strong>g oceanic/atmospheric indexes and climate risks. This c<strong>on</strong>stitutes a major step<br />
towards better quantificati<strong>on</strong> of climate related uncertainties in climate variability and climate<br />
change studies.<br />
Some of the advantages of using the CPH model include:<br />
a) the method was developed to accommodate censored data (incomplete informati<strong>on</strong>)<br />
without the need to balance the data set thereby discarding potentially valuable informati<strong>on</strong>;b)<br />
in c<strong>on</strong>trast to ordinary least squares multiple linear regressi<strong>on</strong> or logistic regressi<strong>on</strong>, CPH<br />
model does not require assumpti<strong>on</strong>s regarding the type of underlying probability distributi<strong>on</strong>s;<br />
proporti<strong>on</strong>ality of hazards is the <strong>on</strong>ly assumpti<strong>on</strong> necessary for CPH model, and even this<br />
can be relaxed via an appropriate generalizati<strong>on</strong>;c) it overcomes the problem of having to<br />
estimate probabilities of exceedance for each threshold in order to compose a PEC, a<br />
limitati<strong>on</strong> of the logistic regressi<strong>on</strong> approach as used in Lo et al (<str<strong>on</strong>g>2007</str<strong>on</strong>g>);d) when compared with<br />
the n<strong>on</strong>parametric approach used by Maia et al (<str<strong>on</strong>g>2007</str<strong>on</strong>g>), CPH framework is superior because it<br />
allows investigating simultaneously influences of many predictors <strong>on</strong> risks; the c<strong>on</strong>tributi<strong>on</strong> of<br />
each ‘candidate’ can objectively be evaluated via likelihood tests;e) methods for assessing<br />
uncertainties of PEC (and therefore uncertainties of risk estimates) are readily available.<br />
<str<strong>on</strong>g>The</str<strong>on</strong>g>se methods have well established theoretical basis (Kalbfleisch and Prentice, 1980);<br />
We dem<strong>on</strong>strate the adequacy and usefulness of the proposed approach by analysing the<br />
influence of two oceanic/atmospheric indexes <strong>on</strong> the <strong>on</strong>set of m<strong>on</strong>so<strong>on</strong>al wet seas<strong>on</strong> at<br />
Darwin, Australia, as suggested by Lo et al (<str<strong>on</strong>g>2007</str<strong>on</strong>g>): the Southern Oscillati<strong>on</strong> Index (mean of the<br />
July and August m<strong>on</strong>thly SOI values) and the first rotated principal comp<strong>on</strong>ent (SST1) of large<br />
scale Sea Surface Temperatures anomalies (Drosdowsky and Chambers, 2001).<br />
When applied to grided data, the CPH approach allows objective spatial assessment of<br />
either individual or joint influences of such predictors <strong>on</strong> risks. Mapping the coefficients of the<br />
Cox model (which express the magnitude of the predictor’s influence) and p-values resulting<br />
from likelihood tests provides a complete descriptive and inferential assessment of predictor<br />
influence <strong>on</strong> the risks under investigati<strong>on</strong>. Once the str<strong>on</strong>gest predictors are selected at a<br />
locati<strong>on</strong>, probabilities of exceeding any particular threshold (preferably within the range of<br />
observed data) can be estimated for any combinati<strong>on</strong> of predictor values. <str<strong>on</strong>g>The</str<strong>on</strong>g> resulting risk<br />
estimates and their respective uncertainties provide valuable informati<strong>on</strong> for decisi<strong>on</strong> making<br />
in climate sensitive industries.<br />
References<br />
Drosdowsky, W. and L. E. Chambers, 2001: Near-global sea surface temperature anomalies<br />
as predictors of Australian seas<strong>on</strong>al rainfall, Journal of Climate, 14, 1677-1687.<br />
Cox, D.R,1972: “Regressi<strong>on</strong> Models and Life-Tables (with Discussi<strong>on</strong>),” Journal<br />
of the Royal Statistical Society, Series B, 34, 187–220.<br />
De Lorgeril M.; Salen P.; Martin J-L.; M<strong>on</strong>jaud I.; Delaye J.; N. Mamelle, 1999: Mediterranean<br />
diet, traditi<strong>on</strong>al risk factors, and the rate of cardiovascular complicati<strong>on</strong>s after myocardial<br />
infarcti<strong>on</strong>. Final report of the Ly<strong>on</strong> Diet Heart Study. Circulati<strong>on</strong>, 99, 779-85.<br />
133
Finkelstein, D. M.; Moore, D. F.; D. A. Schoenfeld, 1993: A Proporti<strong>on</strong>al Hazards Model for<br />
Truncated AIDS Data. Biometrics, 49 (3), 731-740.<br />
Gibb<strong>on</strong>s, L.E.; Teri L.; Logsd<strong>on</strong> R.; McCurry S.M.; Kukull W.2; Bowen J.; McCormick W.; E.<br />
Lars<strong>on</strong>, 2002: Anxiety Symptoms as Predictors of Nursing Home Placement in Patients with<br />
Alzheimer's Disease. Journal of Clinical Geropsychology, 8 (4), 335-342.<br />
Kalbfleisch, J.D. and Prentice,R.L.,1980:<str<strong>on</strong>g>The</str<strong>on</strong>g> Statistical Analysis of Failure Time Data, New<br />
York: John Wiley & S<strong>on</strong>s, Inc.<br />
Lo F., M. Wheeler, H. Meinke and A. D<strong>on</strong>ald,<str<strong>on</strong>g>2007</str<strong>on</strong>g>: Probabilistic forecasts of the <strong>on</strong>set of the<br />
north Australian wet seas<strong>on</strong>. M<strong>on</strong>thly Weather Review (in press).<br />
Maia, A. de H.N. and H. Meinke, 1999: N<strong>on</strong>-parametrical survival analysis as a statistical tool<br />
in agricultural decisi<strong>on</strong> making. <str<strong>on</strong>g>Internati<strong>on</strong>al</str<strong>on</strong>g> Symposium, Modeling Cropping Systems,<br />
Proceedings European Soc. For Agr<strong>on</strong>omy, Div. Agroclimatology and Agr<strong>on</strong>omic Modeling,<br />
Lleida, Spain, 21-23 June 1999, 103-104.<br />
Maia, A. H. N.; Meinke, H.; S. Lennox, 2004: Assessment of probabilistic forecast ‘skill’ using<br />
p-values, Proc. 4th <str<strong>on</strong>g>Internati<strong>on</strong>al</str<strong>on</strong>g> Crop Science C<strong>on</strong>gress, Brisbane, Australia, available at:<br />
http://www.cropscience.org.au/icsc2004/poster/2/6/1360 maiaa.htm.<br />
Maia, A. H. N.; H. Meinke, S. Lennox; R. C. St<strong>on</strong>e, <str<strong>on</strong>g>2007</str<strong>on</strong>g>: Inferential, n<strong>on</strong>-parametric statistics<br />
to assess quality of probabilistic forecast systems. M<strong>on</strong>thly Weather Review, 135(2), 351-362.<br />
Martis, A.; G. J. van Oldenborgh; G. Burgers, 2002: Predicting rainfall in the Dutch Caribbean<br />
– more than El Niño? Int. J. Climatology, 22, 1219-1234.<br />
Nicholls, N., 1984: A system for predicting the <strong>on</strong>set of the north Australian wet-seas<strong>on</strong>,<br />
Journal of Climatology, 4, 425-435.<br />
Nicholls, N.; McBride, J. L.; R.J. Ormerod, 1982: On predicting the <strong>on</strong>set of the Australian<br />
wet-seas<strong>on</strong> at Darwin, M<strong>on</strong>thly Weather Review, 110, 14-17.<br />
Smith, G. E.; O’Brien, P. C.; Ivnik, R. J.; Kokmen, E. G. Tangalos, 2001: Prospective analysis<br />
of risk factors for nursing home placement of dementia patients. Neurology, 57:1467-1473.<br />
<str<strong>on</strong>g>The</str<strong>on</strong>g> Dominant Indian Ocean Dipole Influence <strong>on</strong> Southeastern African Seas<strong>on</strong>al Rainfall<br />
Variability<br />
Desm<strong>on</strong>d Manatsa<br />
Bindura University of Science Educati<strong>on</strong><br />
134
dmanatsa@buse.ac.zw<br />
Wisemen Chingombe<br />
Bindura University of Science Educati<strong>on</strong><br />
C.H Matarira<br />
Bindura University of Science Educati<strong>on</strong><br />
Southern Africa is semi arid and hence is characterized by high seas<strong>on</strong>al rainfall variability.<br />
<str<strong>on</strong>g>The</str<strong>on</strong>g>refore the regi<strong>on</strong> is very vulnerable to recurring floods and droughts, with recovery taking<br />
ages to attain <strong>on</strong>ce the climate related disaster occurs. This makes reliable early warning<br />
schemes very essential in this regi<strong>on</strong> if mitigatory efforts are to be fully realized. However, this<br />
is not possible without a sound knowledge of the processes that c<strong>on</strong>trol southern African<br />
seas<strong>on</strong>al rainfall. This study uses observati<strong>on</strong>al data <strong>on</strong> the Indian Ocean Dipole (IOD), El<br />
Nino Southern Oscillati<strong>on</strong> (ENSO) and Zimbabwe seas<strong>on</strong>al rainfall to show that the recently<br />
discovered IOD is not <strong>on</strong>ly a simple additi<strong>on</strong>al climatic mode, which also influences southern<br />
African seas<strong>on</strong>al rainfall, but is significantly dominant over ENSO. Simple statistical methods<br />
including partial correlati<strong>on</strong> and composite techniques are employed in order to unravel this<br />
relati<strong>on</strong>ship. Zimbabwe seas<strong>on</strong>al rainfall is mostly sensitive to the positive phase of the IOD,<br />
which induces very severe rainfall deficits. On the other hand, an ENSO warm event <strong>on</strong>ly<br />
induces rainfall deficits in the company of a positive IOD event. At the same time, an ENSO<br />
warm event is unable to influence seas<strong>on</strong>al rainfall deficits over the sub regi<strong>on</strong>, if it does not<br />
co-occur with a positive IOD event. This discovery is noteworthy as it c<strong>on</strong>tradicts the<br />
c<strong>on</strong>vecti<strong>on</strong>al knowledge which links ENSO warm events to droughts over southern Africa.<br />
Climate Predicti<strong>on</strong> Techniques for Small Scale Farmers Using Daily Rainfall Data in Southern<br />
Province - Zambia<br />
Munalula Mate<br />
Zambia Meteorological Sevices<br />
mmate@microlink.zm/ mate_mu@yahoo.co.uk<br />
Jeremiah Ch<strong>on</strong>go<br />
Care Zambia<br />
Lys<strong>on</strong> Phiri<br />
Zambia Met. Sevices<br />
Background<br />
In Zambia 80-90% of staple food producti<strong>on</strong> currently comes from rain-fed farming<br />
systems. Southern Province (SOUTHERN PROVINCE) of Zambia, which was <strong>on</strong>ce the maize<br />
belt. Of the country draws much interest for climate change and adaptati<strong>on</strong> to suitable farming<br />
practices. High poverty levels, HIV/AIDS and rampart food shortage resulting from high rainfall<br />
variability are major c<strong>on</strong>cerns especially for the vulnerable small-scale farmers. <str<strong>on</strong>g>The</str<strong>on</strong>g>se farmers<br />
are increasing migrating to the northern parts of Zambia citing climate change as the cause.<br />
Recent studies, which were carried out using daily rainfall for selected stati<strong>on</strong>s show no<br />
evidence of climate change but indicates high variability of climate in the regi<strong>on</strong>. Food<br />
135
household shortages were mainly attributed to lack of poor farming practices. A decentralised<br />
agro meteorological secti<strong>on</strong> of the Department of Meteorology in Southern Province has been<br />
working with small farming communities to help them understand issues related to weather<br />
and climate since 1995.<br />
Approach and Achievements<br />
<str<strong>on</strong>g>The</str<strong>on</strong>g> small farming community, in Southern Province has been sensitised to be in c<strong>on</strong>stant<br />
touch with the Department of Meteorology (Climatology) and work closely and apply the<br />
knowledge provided judiciously. <str<strong>on</strong>g>The</str<strong>on</strong>g> package included; short and l<strong>on</strong>g term forecasts, rainfall<br />
observati<strong>on</strong>s, crop-weather reports, bulletin producti<strong>on</strong> and any other relevant and useful<br />
informati<strong>on</strong> during growing seas<strong>on</strong> from October to March. Further details from the study of<br />
climate in Southern Province include planting dates, start and end of the seas<strong>on</strong>, planting<br />
opportunities, choice of seed, risks of dry or wet Southern Province spells within growing<br />
seas<strong>on</strong>. <str<strong>on</strong>g>Meetings</str<strong>on</strong>g>, workshops before and after each seas<strong>on</strong> have been used as platform to<br />
share climate issues. Drama, plays, leaflets and faces to face discussi<strong>on</strong>s in English and local<br />
languages have been instrumental.<br />
Linkages with internati<strong>on</strong>al scientists in climate helped to facilitate training and studies in<br />
Climatology of Southern Province. NGOs, government have stared addressed the c<strong>on</strong>cerns by<br />
adopting crop diversificati<strong>on</strong> and other practices to achieve food security. Investment in rain<br />
harvesting techniques is taking off.<br />
Southern Province is the <strong>on</strong>ly <strong>on</strong>e decentralised to this level worldwide. This is an<br />
opportunity to sell the idea and practicability of the model to other parts of the world.<br />
Statistical Analysis of variati<strong>on</strong> and precipitati<strong>on</strong> trend in arid regi<strong>on</strong>, central IRAN<br />
Nasr Isfahani Mehrdad<br />
mnasr49@yahoo.com<br />
Precipitati<strong>on</strong> is important element which affect climate c<strong>on</strong>diti<strong>on</strong> and climate<br />
change .Increase or decrease trends of rainfall may be sign of climate changes.In this<br />
research study, in order to recover probable local climate changes, time series of m<strong>on</strong>thly and<br />
annual precipitati<strong>on</strong> in arid regi<strong>on</strong>,central iran c<strong>on</strong>sidered.It has been studied of synoptic<br />
stati<strong>on</strong>s during of province center the statistical period from 1951 to 2003 .Statistical studies of<br />
climate change usually analyze homogeneity , trend and jump in the climate series. In this<br />
study, homogeneity of menti<strong>on</strong>ed climatic series was tested by cumulative deviati<strong>on</strong>s and run<br />
test.Trend was tested by different parametric and n<strong>on</strong>-parametric tests c<strong>on</strong>sist of Mann-Kendal,<br />
correlati<strong>on</strong> coefficient Pears<strong>on</strong>, t-student and Spearman tests .Precipitati<strong>on</strong> trend in Zahedan<br />
was decreasing and it had significant trend. Jump in series was tested by LEVEN test<br />
(Compare of Two Variances) . <str<strong>on</strong>g>The</str<strong>on</strong>g> aim of analyzing time series is determinati<strong>on</strong> of l<strong>on</strong>g-term<br />
behavior of observati<strong>on</strong> data finding changes model to use for engineering designs and other<br />
projects.<br />
136
<str<strong>on</strong>g>The</str<strong>on</strong>g> Relati<strong>on</strong> Between PCA and SOM in Processing of Multivariate Datasets<br />
Ladislav METELKA<br />
Czech Hydrometeorological Institute, Czech Republic<br />
metelka@chmi.cz<br />
Radan HUTH<br />
Institute of Atmospheric Physics, Czech republic<br />
<str<strong>on</strong>g>The</str<strong>on</strong>g> c<strong>on</strong>tributi<strong>on</strong> is focused <strong>on</strong> the comparis<strong>on</strong> of two different methods of robust pattern<br />
variability identificati<strong>on</strong>. Well-known method of Principal Comp<strong>on</strong>ent Analysis (PCA) is<br />
compared to a relatively new technique based <strong>on</strong> Artificial Intelligence – Koh<strong>on</strong>en Self<br />
Organizing Maps (SOM). Koh<strong>on</strong>en SOM is a 2-layered neural network with radial units<br />
organized typically (but not necessarily) in a 2-dimensi<strong>on</strong>al output layer (topological map).<br />
Koh<strong>on</strong>en networks use the unsupervised learning algorithm which attempts to locate clusters<br />
in the input data. In c<strong>on</strong>trast to PCA, SOM is a n<strong>on</strong>-linear method.<str<strong>on</strong>g>The</str<strong>on</strong>g> performance of SOM<br />
was tested <strong>on</strong> PCA-preprocessed synthetic datasets that were derived from m<strong>on</strong>thly fields of<br />
NCEP/NCAR 500 hPa geopotential level reanalyses, 1950-2003, from the regi<strong>on</strong> 90˚W-50˚E,<br />
10˚N-80˚N. As the z<strong>on</strong>al distances between neighboring grid points decrease poleward in the<br />
geographical grid, the data were transformed to more “regular” grid with each grid point<br />
representing similar area. <str<strong>on</strong>g>The</str<strong>on</strong>g>n, anomalies from 1961-1990 means were calculated for each<br />
grid point and each m<strong>on</strong>th and data were pre-processed by means of PCA. <str<strong>on</strong>g>The</str<strong>on</strong>g> 1st<br />
comp<strong>on</strong>ent represents “z<strong>on</strong>al” pattern c<strong>on</strong>nected with the annual course of geopotential<br />
heights, the 2nd comp<strong>on</strong>ent corresp<strong>on</strong>ds to NAO and the 3rd <strong>on</strong>e to EA pattern. Next, 3<br />
testing (synthetic) datasets were rec<strong>on</strong>structed from selected leading principal comp<strong>on</strong>ents;<br />
„1-D“ dataset from the first comp<strong>on</strong>ent <strong>on</strong>ly, “2-D“ dataset from principal comp<strong>on</strong>ents 1-2 and<br />
“3-D” dataset from principal comp<strong>on</strong>ents 1-3. Those datasets were then mapped <strong>on</strong>to<br />
2-dimensi<strong>on</strong>al Koh<strong>on</strong>en SOMs with 20 nodes (5x4 nodes).<str<strong>on</strong>g>The</str<strong>on</strong>g> results indicate that for “1-D”<br />
dataset SOM maps the <strong>on</strong>ly principal comp<strong>on</strong>ent al<strong>on</strong>g the l<strong>on</strong>ger side of SOM map, for “2-D”<br />
dataset, two principal comp<strong>on</strong>ents are mapped al<strong>on</strong>g diag<strong>on</strong>als of the SOM. Those results are<br />
similar to PCA with the <strong>on</strong>ly difference in their n<strong>on</strong>-linearity. For “3-D” dataset some<br />
“dimensi<strong>on</strong>ality reducti<strong>on</strong>” is needed to map the “3-D” dataset <strong>on</strong>to 2-dimensi<strong>on</strong>al SOM. As the<br />
mapping is intrinsically n<strong>on</strong>-linear and results are categorical (clusters), this case is similar to<br />
“categorical 2-dimensi<strong>on</strong>al n<strong>on</strong>-linear Principal Comp<strong>on</strong>ent Analysis”.<br />
This study is supported by the Czech Science Foundati<strong>on</strong>, c<strong>on</strong>tract No. 205/05/2282<br />
Probabilistic Climate Change Predicti<strong>on</strong>s Applying Bayesian Model Averaging<br />
Seung-Ki Min<br />
Climate Research Divisi<strong>on</strong>, Envir<strong>on</strong>ment Canada<br />
seung-ki.min@ec.gc.ca<br />
Daniel Sim<strong>on</strong>is<br />
Meteorological Institute, University of B<strong>on</strong>n, Germany<br />
137
Andreas Hense<br />
Meteorological Institute, University of B<strong>on</strong>n, Germany<br />
This study explores the sensitivity of probabilistic predicti<strong>on</strong>s of the 21st century surface<br />
air temperature (SAT) changes to different multi-model averaging methods using available<br />
simulati<strong>on</strong>s from the Intergovernmental Panel <strong>on</strong> Climate Change (IPCC) Fourth Assessment<br />
Report (AR4). A way of observati<strong>on</strong>ally-c<strong>on</strong>strained predicti<strong>on</strong> is provided by training<br />
multi-model simulati<strong>on</strong>s for the sec<strong>on</strong>d half of the 20th century with respect to l<strong>on</strong>g-term<br />
comp<strong>on</strong>ents. <str<strong>on</strong>g>The</str<strong>on</strong>g> Bayesian model averaging (BMA) produces weighted probability density<br />
functi<strong>on</strong>s (PDFs) and we compare two methods of estimating weighting factors: Bayes factor<br />
(BF) and Expectati<strong>on</strong>-Maximizati<strong>on</strong> (EM) algorithm. It is shown that Bayesian weighted PDFs<br />
for the global mean SAT changes are characterized by multi-modal structures from the middle<br />
of the 21st century <strong>on</strong>ward, that are not clearly seen in arithmetic ensemble mean (AEM). This<br />
occurs because BMA tends to select a few high-skilled models and down-weight the others.<br />
Additi<strong>on</strong>ally Bayesian results exhibit larger means and broader PDFs in the global mean<br />
predicti<strong>on</strong>s than the unweighted AEM. Multi-modality is more pr<strong>on</strong>ounced in the c<strong>on</strong>tinental<br />
analysis using 30-yr mean (2070-99) SATs while there is <strong>on</strong>ly a little effect of Bayesian<br />
weighting <strong>on</strong> the 5-95% range. <str<strong>on</strong>g>The</str<strong>on</strong>g>se results indicate that this approach to<br />
observati<strong>on</strong>ally-c<strong>on</strong>strained probabilistic predicti<strong>on</strong>s can be highly sensitive to the method of<br />
training, particularly for the later half of the 21st century, and that a more comprehensive<br />
approach combining different regi<strong>on</strong>s and/or variables is required.<br />
Linking atmospheric circulati<strong>on</strong> to daily rainfall patterns over the territory of Bulgaria using<br />
Hidden Markov Models<br />
Neyko M. Neykov<br />
Nat. Inst. of Meteorology and Hydrology, Bulgarian Academy of Sciences<br />
neyko.neykov@meteo.bg<br />
Plamen N. Neytchev<br />
Nat. Inst. of Meteorology and Hydrology, Bulgarian Academy of Sciences<br />
Walter Zucchini<br />
Institute of Statistics and Ec<strong>on</strong>ometrics, University of Göttingen<br />
Hristo P. Hristov<br />
Nat. Inst. of Meteorology and Hydrology, Bulgarian A<br />
N<strong>on</strong>-homogenous hidden Markov Models (NHMMs) have found widespread applicati<strong>on</strong> in<br />
meteorology and hydrology in Australia and New Zealand, North and South America, e.g., in<br />
studies of climate variability or climate change, and in statistical downscaling of daily<br />
precipitati<strong>on</strong> from observed and numerical climate model simulati<strong>on</strong>s. However, the NHMM<br />
methodology has not been yet employed for similar purposes in Europe. <str<strong>on</strong>g>The</str<strong>on</strong>g> NHMM links<br />
large-scale atmospheric patterns to daily precipitati<strong>on</strong> data at a network of rain gauge stati<strong>on</strong>s,<br />
via several hidden (unobserved) states called the “weather states”. <str<strong>on</strong>g>The</str<strong>on</strong>g> evoluti<strong>on</strong> of these<br />
states is modeled as a first-order Markov process with state-to-state transiti<strong>on</strong> probabilities<br />
138
c<strong>on</strong>diti<strong>on</strong>ed <strong>on</strong> some indices of the atmospheric variables. Due to these weather states the<br />
spatial precipitati<strong>on</strong> dependence can be partially or completely captured. In the present study<br />
various NHMMs are used to relate daily precipitati<strong>on</strong> at 30 rain gauge stati<strong>on</strong>s covering<br />
broadly the territory of Bulgaria to synoptic atmospheric data. At each site a 40-year record<br />
(1960-2000) of daily precipitati<strong>on</strong> amounts is modeled. <str<strong>on</strong>g>The</str<strong>on</strong>g> atmospheric data c<strong>on</strong>sists of daily<br />
sea-level pressure, geopotential height at 500 hPa, air temperature at 850 hPa and relative<br />
humidity at 700 hPa (subset of NCEP-NCAR reanalysis dataset) <strong>on</strong> a 2.5° x 2.5° grid covering<br />
the Europe-Atlantic sector 30°W–60°E, 20°N–70°N for the same period. <str<strong>on</strong>g>The</str<strong>on</strong>g> first 30 years<br />
data are used for model fitting purposes while the remaining 10 years are used for model<br />
evaluati<strong>on</strong>. Detailed model validati<strong>on</strong> is carried out <strong>on</strong> various aspects. <str<strong>on</strong>g>The</str<strong>on</strong>g> identified weather<br />
states are found to be physically interpretable in terms of regi<strong>on</strong>al climatology. A comparis<strong>on</strong> is<br />
also made between the NHMM and classical at site two-state first-order n<strong>on</strong>-stati<strong>on</strong>ary Markov<br />
stochastic daily precipitati<strong>on</strong> model, c<strong>on</strong>diti<strong>on</strong>al <strong>on</strong> a summary of 5 pseudotemps (based <strong>on</strong> all<br />
atmospheric variables in NCEP-NCAR reanalysis dataset) surrounding the territory of<br />
Bulgaria.<br />
References<br />
Neytchev, P., Zucchini,W., Hristov, H. and Neykov, N.M. (2006) Development of a multisite<br />
daily precipitati<strong>on</strong> model for Bulgaria using hidden Markov models. In: Proc. of the XXIIIrd<br />
c<strong>on</strong>ference of Danubian countries <strong>on</strong> the hydrological forecasting and hydrological bases of<br />
water management. Belgrade, Serbia, 28- 31 August.<br />
Bridging the gap between simulated climate and local weather<br />
Heiko Paeth<br />
Institute of Geography, University of Wuerzburg<br />
Heiko.Paeth@uni-wuerzburg.de<br />
Data from global and regi<strong>on</strong>al climate models usually refer to grid cells and are, hence,<br />
basically different from stati<strong>on</strong> data. This particularly holds for variables with enhanced<br />
spatio-temporal variability like precipitati<strong>on</strong>. On the other hand, many follow-up modelling<br />
study require atmospheric data with the statistical characteristics of stati<strong>on</strong> data in order to<br />
simulate for instance realistic surface runoff or erosi<strong>on</strong> rates.<br />
Here, a dynamical-statistical tool is presented to derive virtual stati<strong>on</strong> data from regi<strong>on</strong>al<br />
climate model output in tropical West Africa. This weather generator incorporates daily gridded<br />
rainfall from the model, an orographic term and a stochastic term, accounting for the chaotic<br />
spatial distributi<strong>on</strong> of local rain events within the model grid box. Total sums and the probability<br />
density functi<strong>on</strong> of daily precipitati<strong>on</strong> are adjusted to available stati<strong>on</strong> data.It is also assured<br />
that the generated data are still c<strong>on</strong>sistent with other model parameters like cloudiness and<br />
atmospheric circulati<strong>on</strong>. <str<strong>on</strong>g>The</str<strong>on</strong>g> resulting virtual stati<strong>on</strong> data are in excellent agreement with<br />
various observed characteristics, which do not enter explicitly the weather generator. algorithm.<br />
This holds for the mean daily rainfall intensity and variability, the relative number of rainless<br />
days and the scaling of precipitati<strong>on</strong> over different time scales.<br />
139
Comparis<strong>on</strong> of past and future trends of extreme climate indices for Central/Eastern Europe<br />
R. P<strong>on</strong>gracz<br />
Dept. of Meteorology, Eotvos Lorand University, Budapest, Hungary<br />
bari@ludens.elte.hu<br />
J. Bartholy<br />
Dept. of Meteorology, Eotvos Lorand University, Budapest, Hungary<br />
GY. Gelybo<br />
Dept. of Meteorology, Eotvos Lorand University, Budapest, Hungary<br />
Several climate extreme indices are analyzed and compared for the Carpathian basin<br />
(located in Central/Eastern Europe) following the guidelines suggested by the joint<br />
WMO-CCl/CLIVAR Working Group <strong>on</strong> climate change detecti<strong>on</strong>. <str<strong>on</strong>g>The</str<strong>on</strong>g>se climate extreme<br />
indices are determined <strong>on</strong> the basis of daily maximum, minimum and mean temperature<br />
values, and daily precipitati<strong>on</strong> amounts. <str<strong>on</strong>g>The</str<strong>on</strong>g> statistical trend analysis includes the evaluati<strong>on</strong><br />
of 27 extreme indices, e.g., the numbers of severe cold days, winter days, frost days, cold<br />
days, warm days, summer days, hot days, extremely hot days, cold nights, warm nights, the<br />
intra-annual extreme temperature range, the heat wave durati<strong>on</strong>, the growing seas<strong>on</strong> length,<br />
the number of wet days (using several threshold values defining extremes), the maximum<br />
number of c<strong>on</strong>secutive dry days, the highest 1-day precipitati<strong>on</strong> amount, the greatest 5-day<br />
rainfall total, the annual fracti<strong>on</strong> due to extreme precipitati<strong>on</strong> events, etc. In order to analyze<br />
the past trends, daily meteorological observati<strong>on</strong>s are used to calculate the time series of<br />
extreme temperature and precipitati<strong>on</strong> indices for the 31 selected stati<strong>on</strong>s for the 20th century.<br />
Because of the lack of century-l<strong>on</strong>g meteorological time series, the analysis focuses mainly <strong>on</strong><br />
the sec<strong>on</strong>d half of the 20th century. However, the analysis is extended for the entire century in<br />
case of some stati<strong>on</strong>s, where sufficient data was available. <str<strong>on</strong>g>The</str<strong>on</strong>g> results suggest that similarly to<br />
the global and c<strong>on</strong>tinental trends, regi<strong>on</strong>al temperature of Central/Eastern Europe got warmer<br />
during the sec<strong>on</strong>d half of the 20th century. Furthermore, regi<strong>on</strong>al intensity and frequency of<br />
extreme precipitati<strong>on</strong> increased, while the total precipitati<strong>on</strong> decreased in the regi<strong>on</strong> and the<br />
mean climate became drier. In case of the future trends (2071-2100), daily values of<br />
meteorological variables are obtained from the outputs of various regi<strong>on</strong>al climate model<br />
(RCM) experiments accomplished in the frame of the completed EU-project PRUDENCE (the<br />
horiz<strong>on</strong>tal resoluti<strong>on</strong> of RCMs is 50 km). Both scenarios A2 and B2 are used to compare past<br />
and future trends of the extreme climate indices for the Carpathian basin.<br />
Past climate rec<strong>on</strong>structi<strong>on</strong> for the Carpathian basin using documentary sources<br />
R. P<strong>on</strong>gracz<br />
Dept. of Meteorology, Eotvos Lorand University, Budapest, Hungary<br />
140
ari@ludens.elte.hu<br />
J. Bartholy<br />
Dept. of Meteorology, Eotvos Lorand University, Budapest, Hungary<br />
In order to cover several centuries of the past climate, various proxy data series play an<br />
essential role since regular meteorological observati<strong>on</strong>s being reliable started <strong>on</strong>ly in the<br />
1800s. Am<strong>on</strong>g many others, the proxy climate sources include the historical documentary data.<br />
Written documentary sources can be used to evaluate the occurrence, durati<strong>on</strong> and<br />
geographical locati<strong>on</strong> of climatic events of the past centuries when no or <strong>on</strong>ly scarce<br />
instrumental time series are available. For the Carpathian basin (located in Central/Eastern<br />
Europe), Antal Réthly (a Hungarian climatologist of the 20th century) collected historical<br />
documents in their original form c<strong>on</strong>taining meteorology-related informati<strong>on</strong> into the<br />
2500-page-l<strong>on</strong>g book series, titled 'Meteorological events and natural disasters in the<br />
Carpathian basin'. In order to facilitate the detailed analysis of this documentary collecti<strong>on</strong>, a<br />
special code system using hierarchical subclasses has been defined. <str<strong>on</strong>g>The</str<strong>on</strong>g> applied code<br />
system distinguishes three main categories of climate informati<strong>on</strong>: temperature, precipitati<strong>on</strong><br />
and wind related events, c<strong>on</strong>taining about 3800, 10000, and 1300 informati<strong>on</strong> items,<br />
respectively. Furthermore, the three level subclass system involves 10 sec<strong>on</strong>d-level classes<br />
and 61 third-level classes. In case of temperature related documents, reports <strong>on</strong> cold<br />
c<strong>on</strong>diti<strong>on</strong>s dominate (65%), while in case of wind related events, most of the archive records<br />
menti<strong>on</strong> the strength. Precipitati<strong>on</strong> informati<strong>on</strong> takes 66% of the total collecti<strong>on</strong> and the most<br />
often reported event is the 'rain', which can be explained by the source types (many estate<br />
records and account rolls) and by the agricultural importance of water. Other frequent classes<br />
of precipitati<strong>on</strong> are 'thunderstorm', 'hail', 'flood', and 'drought'. Besides the event classificati<strong>on</strong>,<br />
the coded database c<strong>on</strong>tains full geographical informati<strong>on</strong> about the locati<strong>on</strong> of the<br />
meteorological events (e.g., settlement, geographical coordinates, and subregi<strong>on</strong><br />
identificati<strong>on</strong>). Spatial and temporal distributi<strong>on</strong> of precipitati<strong>on</strong>, temperature, and wind related<br />
climate events and extremes have been investigated using both settlement and subregi<strong>on</strong>al<br />
scales. Geographical distributi<strong>on</strong> of extreme climate events has been mapped. Decadal,<br />
annual, and seas<strong>on</strong>al time series have been analysed for the Carpathian Basin, and compared<br />
to other rec<strong>on</strong>structed temperature and precipitati<strong>on</strong> index time series from other geographical<br />
locati<strong>on</strong>s in Central/Eastern Europe.<br />
Predicti<strong>on</strong> of M<strong>on</strong>so<strong>on</strong> rainfall over Peninsular India using parameters over Arabian Sea and<br />
adjacent seas<br />
Rajesh J<br />
Department of Atmospheric Sciences, Cochin University of Science and Technology<br />
rajeshj@cusat.ac.in<br />
Lorna R. Nayagam<br />
Department of Atmospheric Sciences, Cochin University of Science and Technology<br />
H. S. Ram Mohan<br />
Department of Atmospheric Sciences, Cochin University of Science and Technology<br />
141
K. Mohankumar<br />
Department of Atmospheric Sciences, Cochin University of Science and Technology<br />
This study aims to c<strong>on</strong>nect different meteorological and oceanographic parameters over<br />
the Arabian Sea and adjacent seas with the summer m<strong>on</strong>so<strong>on</strong> rainfall over Peninsular India.<br />
Correlati<strong>on</strong> between Rainfall and several global parameters were found and those areas<br />
having 99% significance were selected for making indices. To check the c<strong>on</strong>sistency of the<br />
relati<strong>on</strong>ship between these candidate predictors and the predictant, a 15-year sliding window<br />
correlati<strong>on</strong> (significant at 5% level) was d<strong>on</strong>e. Nine indices having high correlati<strong>on</strong> were<br />
selected. Indices are relative humidity at 925hPa (Mar and May), sea surface temperature<br />
(Dec), z<strong>on</strong>al wind at 925 hPa and 850 hPa (Mar), air temperature at 925 hPa (Mar and May),<br />
surface sensible heat flux (Mar) and meridi<strong>on</strong>al wind at 700 hPa (Jan) over different spatial<br />
locati<strong>on</strong>s. PCA is d<strong>on</strong>e using these nine indices, for the period 1975-2003. Seven comp<strong>on</strong>ents<br />
that explain the maximum variance were retained for further analysis. A multiple linear<br />
regressi<strong>on</strong> model was developed using these comp<strong>on</strong>ents for the period 1975-1997. <str<strong>on</strong>g>The</str<strong>on</strong>g><br />
model has a multiple correlati<strong>on</strong> of 0.84 and coefficient of determinati<strong>on</strong> of 71.2 %. <str<strong>on</strong>g>The</str<strong>on</strong>g> VIF<br />
analysis of all the parameters that is retained in the model have values less than 2 indicating<br />
an insignificant level of multicollinearity and has a Durbin Wats<strong>on</strong> value of 1.856. <str<strong>on</strong>g>The</str<strong>on</strong>g> model<br />
performance was assessed for a period 1998-2003. <str<strong>on</strong>g>The</str<strong>on</strong>g> model has a RMSE of 8.6 %, BIAS of<br />
0% and ABSE of 7.2% of LPA. For the test period this becomes 23.68%, 18.13% and 4.86%<br />
respectively. Climatological predicti<strong>on</strong>s were also made and found that RMSE, BIAS and<br />
ABSE are 8.7%, 7.07% and 7.57% of LPA respectively.<br />
Statistical downscaling of a specific weather pattern for rainfall forecast using techniques of<br />
artificial intelligence<br />
María Cleof Valverde Ramírez<br />
Centro de Previsão de Tempo e Estudos Climáticos (CPTEC), Instituto Naci<strong>on</strong>al de Pesquisas<br />
Espaciais (INPE)<br />
valverde@cptec.inpe.br<br />
A statistical downscaling procedure derived from artificial neural network (ANN) and fuzzy<br />
logic (FL) were development to generate quantitative forecasts of daily rainfall to specific<br />
weather patterns. Weather pattern methods involve linking observati<strong>on</strong>al stati<strong>on</strong> data to given<br />
weather classificati<strong>on</strong> schemes. In this case the classificati<strong>on</strong> is subjective and a specific<br />
weather pattern namely SACZ-ULCV pattern was selected. This weather pattern is the<br />
interacti<strong>on</strong> between the upper level cycl<strong>on</strong>ic vortices (ULCV) in the vicinity of Northeast Brazil<br />
and South Atlantic C<strong>on</strong>vergence Z<strong>on</strong>e (SACZ). This interacti<strong>on</strong> is associated with severe<br />
rainfall and thunderstorms over Southeastern of Brazil. <str<strong>on</strong>g>The</str<strong>on</strong>g> SACZ-ULCV pattern is well<br />
simulated by regi<strong>on</strong>al Eta model of Center for Weather Forecasts and Climate Studies<br />
(CPTEC) in Brazil, for this reas<strong>on</strong> the outputs of this model to period from December, January<br />
and February of 2000-2003 were used to generate statistical downscaling. <str<strong>on</strong>g>The</str<strong>on</strong>g> predictors<br />
were the dynamical meteorological variables of Eta model related to SACZ-ULCV and surface<br />
142
ainfall as predictand. Additi<strong>on</strong>ally, was c<strong>on</strong>structed another experiment but in this case, it was<br />
c<strong>on</strong>sidered all summer period, that is, other summer weather type besides of SACZ-ULCV<br />
pattern were included. Forecast experiments were c<strong>on</strong>ducted for 12 major urban centres in the<br />
S.Paulo regi<strong>on</strong>. Several statistics are calculated to examine the performance of different<br />
experiments. Generally it was observed that a good rain forecast performance were<br />
associated with well-defined events, in this case when was <strong>on</strong>ly c<strong>on</strong>sidered the downscaling to<br />
SACZ- ULCV pattern (i.e., the forecast should be better when the rainfall is predominantly<br />
generated by similar dynamical process). <str<strong>on</strong>g>The</str<strong>on</strong>g> results generated by the model neural<br />
presented a good performance in the forecasts. When it was compared with the FL technique<br />
showed very close results to the generated by ANN. <str<strong>on</strong>g>The</str<strong>on</strong>g> obtained results suggest that FL<br />
technique can be applied for forecast applicati<strong>on</strong>s. On the other hand, the downscaled<br />
precipitati<strong>on</strong> is more realistic than the precipitati<strong>on</strong> simulated by Eta model.<br />
Palavras-Chave: Downscaling Estatístico, Previsão de Chuva, Redes Neurais Artificiais,<br />
Lógica Fuzzy<br />
Determining Africa Socio-Ec<strong>on</strong>omic Challenges to Climate Sensitivity: the Need to Work<br />
Together<br />
Ayadiani Kenneth Rumi<br />
Nigerian Meteorological Agency<br />
kenrumi4us@yahoo.com<br />
<str<strong>on</strong>g>The</str<strong>on</strong>g> primary objective of the paper is how climate sensitivity can be properly evaluated<br />
over the West Africa sub-regi<strong>on</strong> whose socio-ec<strong>on</strong>omic survival is largely agro-based, a sector<br />
most sensitive to weather and climate variability. Having reviewed the sources of statistical<br />
problem c<strong>on</strong>fr<strong>on</strong>ting climatology which is found to be deeply rooted in the complexity involved<br />
in detecting climate variability which often leads to great apprehensi<strong>on</strong> especially <strong>on</strong> the part of<br />
farmers and water resources managers c<strong>on</strong>cerning their expectati<strong>on</strong>s in the near term, and<br />
its attributi<strong>on</strong> to some certain influences coupled with the method currently used to tackle<br />
these problems, the paper opined that the possibility of adopting adequate resp<strong>on</strong>se to present<br />
and anticipate future scenarios to these anomalous changes through exchange of expertise<br />
ideas and c<strong>on</strong>cepts must be given priority attenti<strong>on</strong> if the relevant anticipated United<br />
Millennium Development Goals (MDGs) must be met for the c<strong>on</strong>tinent.<br />
To achieve this, the understanding of the role and interacti<strong>on</strong> between climate and the<br />
socio-ec<strong>on</strong>omic elements sensitive to it must carefully be analyzed empirically using advance<br />
but relevant statistical techniques for case study situati<strong>on</strong>s. From this, it is believed that<br />
synthesized results and insights will evolve which will help put in place policies to address the<br />
challenges of future scenario within a specific framework. Such a synergetic outcome is what<br />
the paper sought to appraise.<br />
143
A GEV fit to Annual Temperature Extremes in Argentina: a Study of the 1976-77 Climate Shift<br />
Matilde Rusticucci<br />
Departamento de Ciencias de la Atmósfera y los Océanos, FCEN, Universidad de Buenos Aires,<br />
Argentina<br />
mati@at.fcen.uba.ar<br />
Bárbara Tencer<br />
CONICET, Argentina<br />
Temperature extreme events are <strong>on</strong>e of the most studied extreme events since their<br />
occurrence has a huge impact <strong>on</strong> society. In this study we fit a GEV distributi<strong>on</strong> to annual<br />
temperature extremes in Argentina by the method of maximum likelihood estimati<strong>on</strong> with the<br />
aim of studying the influence of the 1976-77 climate shift <strong>on</strong> the frequency of occurrence of<br />
temperature extreme events. A Kolmogorov-Smirnov goodness-of-fit test is performed in order<br />
to study whether the GEV distributi<strong>on</strong> fits the observed annual temperature extremes<br />
satisfactorily. <str<strong>on</strong>g>The</str<strong>on</strong>g> bootstrapping technique is used to determine the critical value of the K-S<br />
statistic.Based <strong>on</strong> daily data, four different annual extremes are defined: the highest maximum<br />
(minimum) temperature of the year, and the lowest maximum (minimum) temperature of the<br />
year. <str<strong>on</strong>g>The</str<strong>on</strong>g> spatial distributi<strong>on</strong> of return values of annual temperature extremes in Argentina for<br />
the period 1956-2003 shows that while maximum temperature (Tx) is expected to be greater or<br />
equal to 32℃ at least <strong>on</strong>ce every 100 years throughout the country -reaching values even<br />
higher than 46℃ in the central regi<strong>on</strong>s-, minimum temperature (Tn) is expected to exceed<br />
16℃ -reaching 30℃ in the central and northern regi<strong>on</strong>s-. Cold annual extremes show larger<br />
gradients across the country, with Tx being lower than 8℃ at least <strong>on</strong>ce every 100 years, and<br />
Tn lower than 0℃ every two years with values even less than -10℃ in the southeastern part of<br />
the country.However, the frequency of occurrence of climatic extremes has changed<br />
throughout the globe during the twentieth century. Changes in return values of annual<br />
temperature extremes due to the climatic shift of 1976-77 in six l<strong>on</strong>g-term data sets are<br />
analysed. <str<strong>on</strong>g>The</str<strong>on</strong>g> lowest Tx of the year is the variable in which the shift 1976-77 is less noticeable.<br />
In most of the stati<strong>on</strong>s there is a decrease in the probability of occurrence of the highest Tx if<br />
we based our study <strong>on</strong> the more recent epoch, while the frequency of occurrence of the<br />
highest Tn enlarges. <str<strong>on</strong>g>The</str<strong>on</strong>g> most noticeable change in return values due to the shift 76-77 is<br />
seen in Río Gallegos where the 10-yr return value for the highest Tn increases from 13.7℃<br />
before 1976 to 18.6℃ after 1977.<br />
144
Impact of ENSO PHASES <strong>on</strong> Amaz<strong>on</strong>ia Seas<strong>on</strong>al Rainfall<br />
Clovis Angeli Sansigolo<br />
DCM, CPTEC, Nati<strong>on</strong>al Institute for Space Research, São José dos Campos, São Paulo, Brazil<br />
sansigol@cptec.inpe.br<br />
<str<strong>on</strong>g>The</str<strong>on</strong>g> influence of ENSO events <strong>on</strong> the probabilistic seas<strong>on</strong>al rainfall anomalies over the<br />
Brazilian Amaz<strong>on</strong>ia is analyzed. Composites of seas<strong>on</strong>al rainfall tercils, observed at 30<br />
climatological stati<strong>on</strong>s during the 5, 8 and 11 most significant events of El Ninõ and La Niña<br />
between 1950/51 and 2000/01, were used to characterize the ENSO phases typical impacts<br />
over the regi<strong>on</strong>al rainfall. <str<strong>on</strong>g>The</str<strong>on</strong>g> probabilities of below, near and above-normal seas<strong>on</strong>al rainfall<br />
associated with El Niño and La Niña events, in a 3x2 c<strong>on</strong>tingency tables, were obtained using<br />
a test based <strong>on</strong> the hypergeometric distributi<strong>on</strong>. <str<strong>on</strong>g>The</str<strong>on</strong>g> El Niños major impact in Amaz<strong>on</strong>ia was<br />
observed in the Austral Summer (DJF), when the events were in their mature phases. In these<br />
cases, they were significantly associated with below-normal rainfall in the Central and<br />
Northern part of the regi<strong>on</strong>, simultaneously and lagged by 1 and 3 m<strong>on</strong>ths. In their typical<br />
developing (SON) and decreasing phases (MAM) the El Niños were respectively associated<br />
with 3 and 1-m<strong>on</strong>th lagged below-normal rainfall in Central Amaz<strong>on</strong>ia. La Niñas during their<br />
typical developing phases (SON) were significantly associated with above-normal rainfall in<br />
the beginning of the rainy seas<strong>on</strong> in the Central and Eastern part of the regi<strong>on</strong>. La Niñas in<br />
JJA were significantly associated simultaneously and 1 and 3-m<strong>on</strong>th lagged above- normal<br />
rainfall in the rainiest period of the year in the North-Western part of the regi<strong>on</strong>. <str<strong>on</strong>g>The</str<strong>on</strong>g>re is a<br />
remarkable asymmetry in the effects of both events, related to the seas<strong>on</strong>s (phases) and<br />
extent of significant impact. <str<strong>on</strong>g>The</str<strong>on</strong>g> high ENSO predictability and its great impact over Amaz<strong>on</strong>ia<br />
rainfall provide a significant source of predictability of seas<strong>on</strong>al rainfall variability in the regi<strong>on</strong>.<br />
Climate Data Homogenizati<strong>on</strong> and Climate Trend/Variability Assessment<br />
Nazaryan Satenik<br />
Armstatehydromet<br />
n<strong>on</strong>a_nazarian@yahoo.com<br />
Global system climate c<strong>on</strong>trol gives a great importance to the preparati<strong>on</strong> of l<strong>on</strong>g-term<br />
similar climatic data of high quality. During the operati<strong>on</strong> of meteorological system in Armenia<br />
observati<strong>on</strong>s took place in 123 weather-stati<strong>on</strong>s. Periodically some stati<strong>on</strong>s were closed<br />
and new <strong>on</strong>es were opened. About 30% of stati<strong>on</strong>s have 60 or more years, 10% - 70 or more<br />
years and 5 stati<strong>on</strong>s more than 100 years observati<strong>on</strong> series. Today 43 synoptic services<br />
work.All data are divided into 3 parts:<br />
• Data in machine-readable form ( data <strong>on</strong> machine-readable bearer )<br />
• Data <strong>on</strong> paper (tables, maps, texts etc.)<br />
• Data <strong>on</strong> the photos ( microfilms, microfiches, microprints )<br />
145
For creating historical data of base a whole series of problems are solved.<br />
• Rescue of historical data, recording data using modern technologies.<br />
• Forming of historical data in united size (format).<br />
• Forming of metadata of appropriate stati<strong>on</strong>s.<br />
• Eliminati<strong>on</strong> of heterogeneity in meteorological variable c<strong>on</strong>nected with the changes in<br />
methodic of observati<strong>on</strong> and processing and changes of devices.<br />
• Providing with ability of regular replenishment of current informati<strong>on</strong>.<br />
During the formati<strong>on</strong> of historical series the problem of filling the lack of meteorological<br />
data, which evenly appeared in different periods of creating archives, is solved ( during<br />
overwriting of informati<strong>on</strong> from punched card to magnetic tape, during overwriting from old<br />
magnetic tape to modern technical methods ).<br />
For the formati<strong>on</strong> of historical data in united size (format) and of metadata special attenti<strong>on</strong> is<br />
paid <strong>on</strong> the c<strong>on</strong>trol of the quality of data and eliminati<strong>on</strong> of heterogeneity. <str<strong>on</strong>g>The</str<strong>on</strong>g> cause of<br />
heterogeneity in data is changes in methodic of observati<strong>on</strong> (change of quantity of term of<br />
observati<strong>on</strong>), replacement of devices, changes in methodic of processing data of<br />
observati<strong>on</strong>.<str<strong>on</strong>g>The</str<strong>on</strong>g>re are no program methods for homogenizing historical series in Armenia <strong>on</strong><br />
this stage, but it is very important. It is handmade.<br />
Starting from aforesaid it becomes clear that for integrated solving of the problem of<br />
homogeneous data formati<strong>on</strong>, it is important to eliminate heterogeneity in the series of<br />
meteorological elements c<strong>on</strong>nected with the changes in the methodic of observati<strong>on</strong> and<br />
processing, changes of devices, etc.<br />
<str<strong>on</strong>g>The</str<strong>on</strong>g> KMA Ensemble Predicti<strong>on</strong> System : the impact of Ensemble size increase<br />
Joo-Hyung S<strong>on</strong><br />
Numerical Predicti<strong>on</strong> Center, KMA<br />
jhs<strong>on</strong>@kma.go.kr<br />
Hyung-Sook Jung<br />
Numerical Predicti<strong>on</strong> Center, KMA<br />
Se<strong>on</strong>-Ok Mo<strong>on</strong><br />
Numerical Predicti<strong>on</strong> Center, KMA<br />
Eun-Hee Je<strong>on</strong><br />
Numerical Predicti<strong>on</strong> Center, KMA<br />
D<strong>on</strong>g-Jo<strong>on</strong> Kim<br />
Numerical Predicti<strong>on</strong> Center, KMA<br />
<str<strong>on</strong>g>The</str<strong>on</strong>g> Ensemble Predicti<strong>on</strong> System (EPS), based <strong>on</strong> the breeding method with the global<br />
spectral (KMA GDAPS) model was <strong>on</strong> operati<strong>on</strong> at March 2001 at KMA. Since the revised<br />
GDAPS (T426L40) was implemented for operati<strong>on</strong>, the EPS has also been c<strong>on</strong>structed with<br />
T213L40M32 versi<strong>on</strong> at 00 and 12 UTC in July 2006.<br />
<str<strong>on</strong>g>The</str<strong>on</strong>g> global spectral model with the slightly different initial c<strong>on</strong>diti<strong>on</strong>s run 17 times included<br />
the c<strong>on</strong>trol forecast at 00 UTC and 12UTC. And then we have 32 members from the 12hourly<br />
146
time lag. Both perturbed analysis and c<strong>on</strong>trol analysis are projected to 24 hours with the model,<br />
and the departures from the c<strong>on</strong>trol analysis at 24 hours are scaled down to the norm of initial<br />
perturbati<strong>on</strong>s. For effective ensemble spread, we designed that 12h-evolved perturbati<strong>on</strong>s<br />
were rotated by using the Factor Rotati<strong>on</strong>. <str<strong>on</strong>g>The</str<strong>on</strong>g>n the rotated perturbati<strong>on</strong>s were re-evolved for<br />
12 hours.<br />
In this study, the effect of horiz<strong>on</strong>tal resoluti<strong>on</strong> and ensemble size <strong>on</strong> the performance of<br />
the KMA EPS assessed for the forecasts of 500hPa geopotential height, 850hPa temperature,<br />
and 850hPa wind speed. <str<strong>on</strong>g>The</str<strong>on</strong>g> overall c<strong>on</strong>clusi<strong>on</strong> is that the skill score of the KMA EPS<br />
increases with increaseing numbers of ensemble members in terms of BSS, ROC, ROSSS,<br />
CRPSS. Increasing the model resoluti<strong>on</strong> has small but positive impact <strong>on</strong> EPS performance<br />
for ensemble c<strong>on</strong>figurati<strong>on</strong>s with the same number of members. But, an ensemble size<br />
increase improves the average skill of the ensemble mean after forecast day 5.<br />
Arctic heat spells - a case study of the warm spring 2006 at Svalbard<br />
Dag Johan Steinskog<br />
Nansen Envir<strong>on</strong>mental and Remote Sesing Center, Bergen, Norway<br />
dag.johan.steinskog@nersc.no<br />
In April 2006 a l<strong>on</strong>g-lasting heat spell occurred in Svalbard, in the North Atlantic regi<strong>on</strong>. It<br />
was statistically c<strong>on</strong>sidered as a very extreme event, with temperatures up to 4 standard<br />
deviati<strong>on</strong>s above the mean April surface temperature for the period 1961-1990. Observati<strong>on</strong>s<br />
from Svalbard Airport are compared with simulati<strong>on</strong> output from 10 different coupled General<br />
Circulati<strong>on</strong> Models from the Fourth Assessment Report of Intergovernmental Panel <strong>on</strong> Climate<br />
Change. <str<strong>on</strong>g>The</str<strong>on</strong>g> mean temperature in heat spell in April 2006 is similar to the expected mean<br />
surface temperature late in the 21st century. An anti-cycl<strong>on</strong>e created a blocking effect<br />
South-East of Svalbard, caused the heat spell. With the present climate, the return period of<br />
the April 2006 heat spell is estimated to be 70.8 years. A climate change under enhanced<br />
atmospheric greenhouse-gas c<strong>on</strong>centrati<strong>on</strong>s will increase the frequency of heat spell in this<br />
regi<strong>on</strong>, and thus reduce the return period.<br />
West African Weather Systems in the Development of Tropical Cycl<strong>on</strong>es<br />
Salami Tairu<br />
Nigerian Meteorological Agency<br />
adesat2002@yahoo.com<br />
Idowu O.S<br />
Nigerian Meteorological Agency<br />
E.E Balogun<br />
Department of PhysicsObafemi Awolowo University Ile Ife Osun State<br />
147
Tropical cycl<strong>on</strong>es have their origins from areas of low atmospheric pressure over warm<br />
waters in the tropics or subtropics. We have carefully studied the interc<strong>on</strong>necti<strong>on</strong> between the<br />
West African Weather Systems (WAWS) and their subsequent development into Tropical<br />
Cycl<strong>on</strong>es.<br />
Between 2004 and 2005, we studied the interc<strong>on</strong>necti<strong>on</strong> and the telec<strong>on</strong>necti<strong>on</strong> between<br />
the WAWS and the various occurrences of Tropical Cycl<strong>on</strong>es and their eventual development<br />
into Hurricanes. We noted that critical synoptic characteristic and the envir<strong>on</strong>mental properties<br />
of the Systems; the thermodynamic c<strong>on</strong>diti<strong>on</strong>s of the storms trajectory and the c<strong>on</strong>diti<strong>on</strong>s of<br />
the ocean are all closely linked. It is therefore believed that proper understanding and<br />
m<strong>on</strong>itoring of these systems will play a very vital role in early detecti<strong>on</strong> of potential WAWS that<br />
may develop into Tropical Cycl<strong>on</strong>es and even Hurricanes. More practical issues will be<br />
presented.<br />
It was recorded that over the period 1992-2001, weather and climate-related disasters<br />
especially those of Tropical Cycl<strong>on</strong>es origin killed about 622 000 people, affected more than<br />
two billi<strong>on</strong>, left milli<strong>on</strong>s more homeless, devastated arable land and spread diseases.<br />
Intense Precipitati<strong>on</strong> Events in the Reanalysis Datasets over the Asia<br />
Kiyotoshi Takahashi<br />
Meteorological Research Institute, JMA<br />
ktakahas@mri-jma.go.jp<br />
Nobuo Yamazaki<br />
Meteorological Colledge, JMA<br />
Masaru Chiba<br />
Meteorological Research Institute, JMA<br />
Hirotaka Kamahori<br />
Japan Meteorological Agency<br />
Recently, many studies for occurrance trends of intense precipitati<strong>on</strong> have been<br />
c<strong>on</strong>ducted based <strong>on</strong> both observati<strong>on</strong>al data analysis and model simulati<strong>on</strong> in associati<strong>on</strong> with<br />
the global warming. Basically detecti<strong>on</strong> of such trends should be based <strong>on</strong> the l<strong>on</strong>g-term<br />
surface observati<strong>on</strong>, but there is a problem that its distributi<strong>on</strong> is not homogeneous and<br />
localized geographically. On the other hand, estimati<strong>on</strong> based <strong>on</strong> satellite observati<strong>on</strong> is<br />
homogenous spatially. However, its temporal coverage is limited for just recent ten years for<br />
daily base products. As another available data sources, there are atmospheric reanalysis<br />
datasets, which are useful because they provide not <strong>on</strong>ly precipitati<strong>on</strong> but also other quantities<br />
with spatial homogeneity and physical c<strong>on</strong>sistency although reanalysis datasets may suffer<br />
from artificial trends due to changes in observati<strong>on</strong>al input data.In this study, statistical<br />
characteristics of intense precipitati<strong>on</strong> events in reanalysis datasets are examined by<br />
comparis<strong>on</strong> with newly produced observati<strong>on</strong>al gridded precipitati<strong>on</strong> data for India and<br />
<str<strong>on</strong>g>China</str<strong>on</strong>g>.<str<strong>on</strong>g>The</str<strong>on</strong>g> annual index for intense precipitati<strong>on</strong> used in Takahashi, K. et al (2006) as well as<br />
annual precipitati<strong>on</strong> calculated from each reanalysis dataset, especially the latest product<br />
JRA-25, shows significant correlati<strong>on</strong> with observati<strong>on</strong> at <strong>on</strong>e percent level.<br />
148
Relati<strong>on</strong>ship Between Ensemble Mean Square and Ensemble Mean Skill in Four Climate Models<br />
Youmin Tang<br />
University of Northern British Columbia, Canada<br />
ytang@unbc.ca<br />
Hai Lin<br />
RPN, Meteorological Service of Canada<br />
Andrew Moore<br />
Uni. of California at Santa Cruz<br />
In this study, we investigated the reliability of ensemble predicti<strong>on</strong> of the El Nino and<br />
Southern Oscillati<strong>on</strong> (ENSO) and the Arctic Oscillati<strong>on</strong> (AO), using four different climate<br />
models and various ensemble schemes. Several important issues related to climate<br />
predictability, including reliability measures and dominant precursors that c<strong>on</strong>trol the reliability,<br />
were addressed. It was found that the ensemble mean (EM) square is a useful measure for the<br />
reliability of both the ENSO and the AO dynamical predicti<strong>on</strong>.<str<strong>on</strong>g>The</str<strong>on</strong>g> relati<strong>on</strong>ship between EM^{2}<br />
and the predicti<strong>on</strong> skill depends <strong>on</strong> the measure of skill. When correlati<strong>on</strong>-based measures are<br />
used, the predicti<strong>on</strong> skill is likely to be a linear functi<strong>on</strong> of EM^{2}, i.e., the larger the EM^{2}<br />
the higher skill the predicti<strong>on</strong>; whereas when MSE-based (mean square of error) metrics are<br />
used, a ``triangular relati<strong>on</strong>ship'' is suggested between them, such that when EM^{2} is large,<br />
the predicti<strong>on</strong> is likely to be reliable whereas when EM^{2} is small, the predicti<strong>on</strong> skill is highly<br />
variable.<br />
In c<strong>on</strong>trast to ensemble numerical weather predicti<strong>on</strong>s (NWP), the ensemble spread in the<br />
ensemble predicti<strong>on</strong> of these climate models was found to have little c<strong>on</strong>necti<strong>on</strong> with the<br />
predicti<strong>on</strong> skill. This is probably due to a small variati<strong>on</strong> of ensemble spread in the climate<br />
models which may be associated with the intrinsic nature of ensemble climate predicti<strong>on</strong>s. <str<strong>on</strong>g>The</str<strong>on</strong>g><br />
predictability of these models can be characterized fairly well using a Gaussian framework with<br />
c<strong>on</strong>stant variances.<br />
A Methodology in Predicting the Influence of Climatic<br />
Herminia C. Tanguilig<br />
D<strong>on</strong> Mariano Marcos Memorial State University<br />
hermtang@yahoo.com<br />
Weather interacts with comp<strong>on</strong>ents of agricultural producti<strong>on</strong> system. An understanding of<br />
these interacti<strong>on</strong>s is essential in formulating crop producti<strong>on</strong> strategies.On <strong>on</strong>e hand, it is<br />
difficult to establish quantitatively this complex interacti<strong>on</strong> with some reas<strong>on</strong>able degree of<br />
reliability. <str<strong>on</strong>g>The</str<strong>on</strong>g> most feasible approach is to c<strong>on</strong>duct l<strong>on</strong>g-term experiments involving<br />
c<strong>on</strong>tinuous cropping and subject to analysis to generate rati<strong>on</strong>al or statistical relati<strong>on</strong>s.On the<br />
149
other hand, crops react differently to climatic parameters at various stages of development and<br />
these resp<strong>on</strong>ses are usually manifested in the final yield of the crop, hence not <strong>on</strong>ly reliable<br />
climatological data for the whole seas<strong>on</strong> is needed but it is also essential to know the temporal<br />
distributi<strong>on</strong> of a climatological variable at each growth stage.In the c<strong>on</strong>text of studying the<br />
influence of a single weather parameter over a given period, effect <strong>on</strong> yield was determined by<br />
dividing the growth period into seven-day periods. Such analysis based <strong>on</strong> weekly weather<br />
data determined the effect of seas<strong>on</strong>al variati<strong>on</strong> of weather factors more accurately than<br />
m<strong>on</strong>thly weather data using the predicti<strong>on</strong> equati<strong>on</strong><br />
Intelligent data processing center (IDPC) of climate and rural development in Iran (case study:<br />
sistan regi<strong>on</strong>)<br />
Mortaza tavakoli<br />
Geography department; Zabol University; jihad square; zabol; sistan – balochestan province ; IRAN .<br />
As we know climatology has a locati<strong>on</strong> essence with in reas<strong>on</strong> of self subjective and can<br />
be use from principles of others field's science. One of the most dimensi<strong>on</strong>s climatology is<br />
applied that has value in planning and development special for rural. <str<strong>on</strong>g>The</str<strong>on</strong>g> sistan regi<strong>on</strong> is<br />
located in east of Iran and that’s regi<strong>on</strong> have special c<strong>on</strong>diti<strong>on</strong>s. Such as: wind; sun shine; dust;<br />
moisture; rain; evaporati<strong>on</strong> and temperature. This regi<strong>on</strong> has 120 days violent wind in the year.<br />
<str<strong>on</strong>g>The</str<strong>on</strong>g>se c<strong>on</strong>diti<strong>on</strong>s imposed circumstance in the field of subsistence and activity for rural<br />
development. Furthermore in this regi<strong>on</strong> haven’t any data processing center; the<br />
envir<strong>on</strong>mental c<strong>on</strong>diti<strong>on</strong>s can be multiplier inflexibility in decisi<strong>on</strong> making. This research doing<br />
with use of questi<strong>on</strong>naire and SWOT technique. <str<strong>on</strong>g>The</str<strong>on</strong>g> result of research showing that provide<br />
intelligent data processing center is need for rural development in sistan regi<strong>on</strong>.<br />
Key words: applied climatology; intelligent data center; rural development; climate c<strong>on</strong>diti<strong>on</strong>s;<br />
statistical SWOT technique; sistan regi<strong>on</strong>.<br />
Climatic jumps in precipitati<strong>on</strong> extremes in associati<strong>on</strong> with recent drying process in North<br />
<str<strong>on</strong>g>China</str<strong>on</strong>g><br />
Tu Kai<br />
RCE-TEA, Institute of Atmospheric Physics, <str<strong>on</strong>g>China</str<strong>on</strong>g><br />
tukai@tea.ac.cn<br />
Yan Zh<strong>on</strong>gwei<br />
RCE-TEA, Institute of Atmospheric Physics, <str<strong>on</strong>g>China</str<strong>on</strong>g><br />
Changes in climate extremes, particularly in associati<strong>on</strong> with the drying jumps (stepwise<br />
changes) in North <str<strong>on</strong>g>China</str<strong>on</strong>g> during the sec<strong>on</strong>d half of the 20th century, were analyzed based <strong>on</strong><br />
daily rainfall data from 329 stati<strong>on</strong>s during 1954-2000. Rainfall extremes defined in different<br />
150
ways were c<strong>on</strong>sidered. Four z<strong>on</strong>es, from the north to the south in the east half of <str<strong>on</strong>g>China</str<strong>on</strong>g>, were<br />
divided according to the different features of climatic jumps. A significant jump signal in<br />
summer rainfall happened in the late 1970s and early 1980s, almost simultaneous over these<br />
four z<strong>on</strong>es. Increasing jumps are found over the Northeast and Yangtze-Huai area, while<br />
decreasing jumps over North <str<strong>on</strong>g>China</str<strong>on</strong>g> and the South to Yangtze River. In North <str<strong>on</strong>g>China</str<strong>on</strong>g>, another<br />
decreasing jump happened in the mid-1960s. <str<strong>on</strong>g>The</str<strong>on</strong>g> step-wise decreases of rainfall in North<br />
<str<strong>on</strong>g>China</str<strong>on</strong>g> have caused severe droughts with widespread c<strong>on</strong>cerns.<br />
For North <str<strong>on</strong>g>China</str<strong>on</strong>g>, rainfall amount was categorized into six grades with fixed intervals:<br />
rainstorm, heavy rain, moderate rain, light rain, trace rain and no-rain. <str<strong>on</strong>g>The</str<strong>on</strong>g> number of each<br />
grade rainfall days in summer was examined. <str<strong>on</strong>g>The</str<strong>on</strong>g> larger the grade is, the more similarity is<br />
between the changes of the number of the grade rainfall days and the overall rainfall amount.<br />
Particularly, there was a decreasing jump in the 1960s, clearly for the series of total rainfall<br />
amount and the number of rainfall days for rainstorm but unclearly for others; the decreasing<br />
jump in the 1980s appeared in all series except that of light rain.<br />
For relative extremes defined against a climatological seas<strong>on</strong>al cycle at each stati<strong>on</strong>, the<br />
extreme rainfall frequency and strength in North <str<strong>on</strong>g>China</str<strong>on</strong>g> also experienced two decreasing jumps,<br />
a weak <strong>on</strong>e in the mid 1960s and a str<strong>on</strong>g <strong>on</strong>e in 1979-1980. However, the proporti<strong>on</strong> of the<br />
extreme rainfall amount to the annual rainfall amount exhibited different trends, without<br />
significant jumps. <str<strong>on</strong>g>The</str<strong>on</strong>g> increasing proporti<strong>on</strong> of extremes since the 1980s suggested more<br />
extreme rainfall events under an overall dryer background in recent decades than before. <str<strong>on</strong>g>The</str<strong>on</strong>g><br />
interannual variability of the frequency and that of the extreme strength are similar. Changes in<br />
atmospheric circulati<strong>on</strong> such as the East Asian summer m<strong>on</strong>so<strong>on</strong> were analyzed to explain the<br />
typical drying process in North <str<strong>on</strong>g>China</str<strong>on</strong>g>.<br />
Water vapour transport from the tropical Atlantic and summer rainfall over tropical southern<br />
Africa<br />
Nicolas Vigaud<br />
UCT, Dept of Oceanography<br />
nvigaud@ocean.uct.ac.za<br />
Yves Richard<br />
Universite of Bourgogne, Centre de Recherche en Climatologie<br />
Mathieu Rouault<br />
UCT, Dept of Oceanography<br />
Nicolas Fauchereau<br />
Universite of Bourgogne, Centre de Recherche en Climatologie<br />
An EOF analysis of the <strong>on</strong>shore flow of moisture al<strong>on</strong>g the west coast of southern Africa<br />
using NCEP-DOE AMIP II Re-analyses suggests two dominant modes of variability that are<br />
linked to (a) variati<strong>on</strong>s within the South Atlantic anticycl<strong>on</strong>e (b) the intensity of the flow that<br />
penetrates from the tropical Atlantic. <str<strong>on</strong>g>The</str<strong>on</strong>g> sec<strong>on</strong>d mode, referred as the Equatorial Westerly<br />
mode, c<strong>on</strong>tributes the most to moisture input from the Atlantic <strong>on</strong>to the subc<strong>on</strong>tinent at tropical<br />
latitudes.<br />
151
Substantial correlati<strong>on</strong>s in austral summer between the Atlantic moisture flux in the tropics<br />
and rainfall over the upper lands surrounding the C<strong>on</strong>go basin suggest the potential role<br />
played by this z<strong>on</strong>al mode of water vapour transport.<br />
Composites for austral summer m<strong>on</strong>ths when this Equatorial Westerly mode had a<br />
particularly str<strong>on</strong>g expressi<strong>on</strong>, show an enhanced moisture input at tropical latitudes that feeds<br />
into the deep c<strong>on</strong>vecti<strong>on</strong> occuring over the C<strong>on</strong>go basin. Sustained meridi<strong>on</strong>al energy fluxes<br />
result in above normal rainfall east and south of the C<strong>on</strong>go belt.<br />
During years of reduced equatorial westerly moisture flux, a deficit of available humidity<br />
occurs in the southern tropics. A c<strong>on</strong>comitant eastward shift of deep c<strong>on</strong>vecti<strong>on</strong> to the<br />
southwest Indian ocean and southeastern Africa, leads to below normal rainfall over the<br />
uplands surrounding the C<strong>on</strong>go basin.<br />
Regi<strong>on</strong>al scale and downscaled climate projecti<strong>on</strong>s for Croatia<br />
Visnja Vucetic<br />
Meteorological and Hydrological Service, Zagreb, Croatia<br />
vucetic@cirus.dhz.hr<br />
In order to estimate climate projecti<strong>on</strong>s for Croatia, the synthetic meteorological series<br />
was created by the stochastic weather generator (WG) Met&Roll, which was designed by<br />
Dubrovský, both for present climate and different climate change scenarios. <str<strong>on</strong>g>The</str<strong>on</strong>g> WG<br />
parameters were derived from the l<strong>on</strong>g time series (1949–2004) for the Zagreb-Maksimir<br />
stati<strong>on</strong> in the NW c<strong>on</strong>tinental part of Croatia. <str<strong>on</strong>g>The</str<strong>on</strong>g> WG Met&Roll provided the synthetic<br />
meteorological series of daily data of global solar radiati<strong>on</strong> (SRAD), maximum (Tmax) and<br />
minimum (Tmin) air temperatures and precipitati<strong>on</strong> amount (PREC). Precipitati<strong>on</strong> occurrence<br />
was modelled by the first-order Markov chain model and precipitati<strong>on</strong> amount by the Gamma<br />
distributi<strong>on</strong>. <str<strong>on</strong>g>The</str<strong>on</strong>g> standardised deviati<strong>on</strong>s of SRAD, Tmax, and Tmin from their means were<br />
modelled by the first-order autoregressive model, separately for the days with and without<br />
precipitati<strong>on</strong> (wet and dry days). As the purpose of the weather generator produces data which<br />
are statistically similar to the observed data, the results of validati<strong>on</strong> of the WG Met&Roll are<br />
presented as follows:<br />
- <str<strong>on</strong>g>The</str<strong>on</strong>g> coefficients of skewness and kurtosis for the synthetic and observed SRAD for dry<br />
days and Tmin differ the most from normally distributed variables in winter m<strong>on</strong>ths;<br />
- Discrepancies between the synthetic and observed deviati<strong>on</strong>s of the mean value and<br />
standard deviati<strong>on</strong> derived from the SRAD and Tmin values are the greatest in April for wet<br />
days;<br />
- A shape parameter of the Gamma distributi<strong>on</strong> for the observed and synthetic series of<br />
PREC shows the greatest deviati<strong>on</strong> in August;<br />
- Am<strong>on</strong>g all correlati<strong>on</strong>s between three variables, <strong>on</strong>ly the correlati<strong>on</strong> between SRAD and<br />
Tmin is negative;<br />
152
- M<strong>on</strong>thly ratios of synthetic and observed standard deviati<strong>on</strong> differ from 1 the most for<br />
PREC in October and March and for SRAD in February.<br />
<str<strong>on</strong>g>The</str<strong>on</strong>g> WG Met&Roll preserved well some features of the stochastic structures of daily<br />
meteorological series, but the discrepancies were found in reproducing the shape of the<br />
distributi<strong>on</strong>s of SRAD and PREC.<str<strong>on</strong>g>The</str<strong>on</strong>g> climate change scenarios were prepared by the pattern<br />
scaling technique using the global climate models (ECHAM4/OPYC3, HadCM3 and<br />
CSIRO-Mk2). Scaling factors used in this study were for the middle emissi<strong>on</strong> scenario and<br />
intermediate climate sensitivity (the increase in global mean temperature of 2.5°C) for the<br />
years 2050 and 2100. Using the climate change scenarios, the WG Met&Roll was applied to<br />
generate a 99-years synthetic meteorological series representing the changed climate.In the<br />
current climate the linear trend analysis of four meteorological elements in the NW part of<br />
Croatia over the 56-year period showed the significant positive linear trend <strong>on</strong>ly in Tmin<br />
(0.4°C/10 ys) which started in the late 1980s.In the future climate all climate change scenarios<br />
at the end of the 21st century projected an increase: in SRAD 3–7%, in Tmin around 3°C and<br />
in Tmax 3–4°C. A slightly increase in PREC (2%) has been shown <strong>on</strong>ly in the climate change<br />
scenario using the global climatic models HadCM3. Others climate scenarios showed a<br />
decrease in PREC for 8%. <str<strong>on</strong>g>The</str<strong>on</strong>g> results from the climate change scenarios lead to an increase<br />
in weather stability in the NW c<strong>on</strong>tinental part of Croatia.<br />
Climate change impact <strong>on</strong> the increase of forest fire risk <strong>on</strong> the Croatian Adriatic coast<br />
Marko Vučetić<br />
Meteorological and Hydrological Service, Grič 3, 10000 Zagreb, Croatia<br />
mvucetic@cirus.dhz.hr<br />
<str<strong>on</strong>g>The</str<strong>on</strong>g> Croatian part of the Adriatic coast and the islands with the predominantly<br />
Mediterranean climate are at high risk of forest fires that inflict serious damage <strong>on</strong> the<br />
agricultural sites and forestland in summer m<strong>on</strong>ths. Summer in this regi<strong>on</strong> is characterized by<br />
dry spell, high air temperature and l<strong>on</strong>g-lasting insolati<strong>on</strong> durati<strong>on</strong>. <str<strong>on</strong>g>The</str<strong>on</strong>g> goal of this study is to<br />
establish the regi<strong>on</strong>al impact of climate change <strong>on</strong> the potential greater danger of forest fires<br />
<strong>on</strong> the Adriatic area.M<strong>on</strong>thly severity rating (MSR), as <strong>on</strong>e of the products of the Canadian<br />
Forest Fire Weather Index System, is an index for the potential risk assessment of forest fires.<br />
<str<strong>on</strong>g>The</str<strong>on</strong>g> input meteorological data for the MSR assessment include the air temperature, relative air<br />
humidity, and wind speed in the warmest part of the day, at 12 UTC, and the daily amount of<br />
precipitati<strong>on</strong>. In the warm seas<strong>on</strong>, from May to September, the secular variati<strong>on</strong>s of MSR were<br />
analyzed using the l<strong>on</strong>g-term series of Crikvenica (1891–2005) and Hvar (1867–2005),<br />
stati<strong>on</strong>s which represent the northern and middle Croatian coast and islands. <str<strong>on</strong>g>The</str<strong>on</strong>g> mean value<br />
of warm seas<strong>on</strong> air temperature is 20.9°C for Crikvenica and 22.4°C for Hvar. <str<strong>on</strong>g>The</str<strong>on</strong>g> mean<br />
amount of precipitati<strong>on</strong> for the same seas<strong>on</strong> is 471 mm for Crikvenica and 194 mm for Hvar.<br />
Due to higher mean air temperature and lower precipitati<strong>on</strong> amount in Hvar than in Crikvenica,<br />
the MSR values are about three times greater in the mid-Adriatic related to the northern.<str<strong>on</strong>g>The</str<strong>on</strong>g><br />
153
analysis of the secular linear MSR trend for Crikvenica and Hvar as well as the applicati<strong>on</strong> of<br />
n<strong>on</strong>-parametric Mann-Kendall rank test indicate an increase in the MSR for both stati<strong>on</strong>s in all<br />
m<strong>on</strong>ths of the warm seas<strong>on</strong> except in May, where slightly negative trend was noticed for Hvar.<br />
Significant m<strong>on</strong>thly increase (c<strong>on</strong>fidence level is 0.05) in the MSR were observed for<br />
Crikvenica for all m<strong>on</strong>ths of the period c<strong>on</strong>sidered and for Hvar <strong>on</strong>ly for June and July. This<br />
increase is particularly important for June, as it indicates the possibility of the earlier <strong>on</strong>set of<br />
the forest fire seas<strong>on</strong> <strong>on</strong> the Adriatic area.<str<strong>on</strong>g>The</str<strong>on</strong>g> analysis also showed that higher risk for forest<br />
fire has been spread from the middle Adriatic to the northern, especially in July and August.<br />
<str<strong>on</strong>g>The</str<strong>on</strong>g> reas<strong>on</strong> for that is the significant increase in the mean m<strong>on</strong>thly air temperature and<br />
decrease in the m<strong>on</strong>thly precipitati<strong>on</strong> amount in summer m<strong>on</strong>ths.<br />
Fitting a power law model for low frequencies of ERA40 air temperature spectra<br />
Dmitry Vyushin<br />
Department of Physics, University of Tor<strong>on</strong>to<br />
vyushin@atmosp.physics.utor<strong>on</strong>to.ca<br />
<str<strong>on</strong>g>The</str<strong>on</strong>g> questi<strong>on</strong> of which statistical model best describes the low frequency behavior of<br />
climatic variables is an important <strong>on</strong>e that relates to the predictability of such variables and to<br />
c<strong>on</strong>fidence intervals for detecting trends and periodicities. Dating from the seminal papers of<br />
Hasselmann over 30 years ago, the dominant model for climatic spectra has been an<br />
autoregressive model of the first order (AR1). But more recent studies indicate that<br />
geophysical time series do not always follow the AR1 or at least that it is not superior to an<br />
alternative power law approximati<strong>on</strong>. We investigate the spatial distributi<strong>on</strong> of ERA40 air<br />
temperature power law exp<strong>on</strong>ents estimated by means of five different statistical methods:<br />
detrended fluctuati<strong>on</strong> analysis (DFA), Geweke Porter-Hudak estimator, Gaussian<br />
semiparametric estimator, and multitapered versi<strong>on</strong>s of the last two. We also test the<br />
sensitivity of these spatial distributi<strong>on</strong>s to filtering of various climatic modes of variability, such<br />
as linear trend, QBO, ENSO, etc. We find that the DFA method is particularly n<strong>on</strong>-robust in the<br />
presence of periodic signals, and that for all these methods significant power exp<strong>on</strong>ents are<br />
c<strong>on</strong>centrated in the tropical troposphere and the subtropical stratosphere. We present<br />
preliminary evidence that links the tropical power exp<strong>on</strong>ents to ENSO and the subtropical<br />
stratospheric power exp<strong>on</strong>ents to volcanic forcing.<br />
Impact of L<strong>on</strong>g-Range Correlati<strong>on</strong>s <strong>on</strong> Trend Detecti<strong>on</strong> in Total Oz<strong>on</strong>e<br />
Dmitry Vyushin<br />
Department of Physics, University of Tor<strong>on</strong>to<br />
vyushin@atmosp.physics.utor<strong>on</strong>to.ca<br />
154
Total oz<strong>on</strong>e trends are typically studied using linear regressi<strong>on</strong> models that assume a<br />
first order autoregressi<strong>on</strong> of the residuals (so-called AR(1) models). We c<strong>on</strong>sider total oz<strong>on</strong>e<br />
time series over 60S-60N from 1979-2005 and show that most latitude bands exhibit<br />
l<strong>on</strong>g-range correlated (LRC) behavior, meaning that oz<strong>on</strong>e autocorrelati<strong>on</strong> functi<strong>on</strong>s decay by<br />
a power law rather than exp<strong>on</strong>entially as in AR(1). At such latitudes the uncertainties of total<br />
oz<strong>on</strong>e trends are greater than those obtained from AR(1) models, and the expected time<br />
required to detect oz<strong>on</strong>e recovery corresp<strong>on</strong>dingly l<strong>on</strong>ger. We find no evidence of LRC<br />
behavior in southern middle and high sub-polar latitudes (45-60S), where the l<strong>on</strong>g-term oz<strong>on</strong>e<br />
decline attributable to anthropogenic chlorine is the greatest. We thus c<strong>on</strong>firm an earlier<br />
predicti<strong>on</strong> based <strong>on</strong> an AR(1) analysis that this regi<strong>on</strong> (especially the highest latitudes, and<br />
especially the South Atlantic) is the optimal locati<strong>on</strong> for the detecti<strong>on</strong> of oz<strong>on</strong>e recovery, with a<br />
statistically significant oz<strong>on</strong>e increase attributable to chlorine likely to be detectable by the end<br />
of the next decade. In northern middle and high latitudes, <strong>on</strong> the other hand, there is clear<br />
evidence of LRC behavior. This increases the uncertainties <strong>on</strong> the l<strong>on</strong>g-term trend attributable<br />
to anthropogenic chlorine by about a factor of 1.5, and lengthens the expected time to detect<br />
oz<strong>on</strong>e recovery by a similar amount (from ~2030 to ~2045).<br />
Crytic Period Analysis Model of Hydrological Process Based <strong>on</strong> Herteroskedasticity Test and Its<br />
Applicati<strong>on</strong><br />
H<strong>on</strong>grui Wang<br />
College of Water Sciences-Key Laboratory for Water and Sediment Sciences Ministry of Educati<strong>on</strong>,<br />
<str<strong>on</strong>g>Beijing</str<strong>on</strong>g> Normal University, <str<strong>on</strong>g>Beijing</str<strong>on</strong>g>, 100875<br />
henryzsr@bnu.edu.cn<br />
Lin xin<br />
College of Water Sciences-Key Laboratory for Water and Sediment Sciences Ministry of Educati<strong>on</strong>,<br />
<str<strong>on</strong>g>Beijing</str<strong>on</strong>g> Normal University, <str<strong>on</strong>g>Beijing</str<strong>on</strong>g>, 100875<br />
Yang Chi<br />
College of Water Sciences-Key Laboratory for Water and Sediment Sciences Ministry of Educati<strong>on</strong>,<br />
<str<strong>on</strong>g>Beijing</str<strong>on</strong>g> Normal University, <str<strong>on</strong>g>Beijing</str<strong>on</strong>g>, 100875<br />
Qian L<strong>on</strong>gxia<br />
College of Water Sciences-Key Laboratory for Water and Sediment Sciences Ministry of Educati<strong>on</strong>,<br />
<str<strong>on</strong>g>Beijing</str<strong>on</strong>g> Normal University, <str<strong>on</strong>g>Beijing</str<strong>on</strong>g>, 100875<br />
<str<strong>on</strong>g>The</str<strong>on</strong>g> hydrological process is very complicated, which is influenced by both deterministic<br />
and stochastic factors. It is difficult to analyze its critic period, because hydrological time series<br />
is probably characterized by herteroskedasticity. To find out the cryptic period, a model is put<br />
forward as follows: (1) to apply zero-mean-value to the data, to have ADF stati<strong>on</strong>ary test for<br />
the sequence and to develop the corresp<strong>on</strong>ding AR(p) model, and then to have ARCH effects<br />
test and white noise test for residual series, (2) for the time series unfit for ARCH test, to<br />
155
transform the logarithm to reduce the herteroskedasticity, and then to repeat the step (1) until<br />
they pass through ARCH test and stati<strong>on</strong>ary test, (3) to determine the comp<strong>on</strong>ent of the prime<br />
period by periodogram analysis, and to put forward three kinds of tests to determine<br />
significance level of the prime period. According to the new model, the naturalized streamflows<br />
from 1784 to 1997, from Alaer and Xinquman gaging Stati<strong>on</strong> are analyzed respectively. When<br />
reducing their herteroskedasticity, AR(4) Model and AR(2) Model are developed respectively.<br />
It is c<strong>on</strong>cluded that the naturalized streamflows in the two stati<strong>on</strong>s have the same cryptic<br />
period of 42.7 years.<br />
Examining the Oceanic Fresh Water Flux in the NCEP Reanalyses and Global Models<br />
Pingping Xie<br />
NOAA Climate Predicti<strong>on</strong> Center<br />
Pingping.Xie@noaa.gov<br />
John E. Janowiak<br />
NOAA Climate Predicti<strong>on</strong> Center<br />
Mingyue Chen<br />
NOAA Climate Predicti<strong>on</strong> Center<br />
C.-L. Shie<br />
UMBC/Goddard Earth Sciences and Technology Center<br />
L. Chiu<br />
GMU / Center for Earth Sciences and Space Research<br />
Seas<strong>on</strong>al and interannual variati<strong>on</strong>s of global oceanic precipitati<strong>on</strong> and evaporati<strong>on</strong><br />
generated by the NCEP CDAS, CDAS2, GDAS, GFS AMIP runs, and the CFS coupled<br />
simulati<strong>on</strong>s have been examined and compared with those of the observati<strong>on</strong>s from CMAP<br />
and GSSTF2. In general, large-scale distributi<strong>on</strong> and seas<strong>on</strong>al variati<strong>on</strong> patterns of global<br />
oceanic precipitati<strong>on</strong>, evaporati<strong>on</strong> and fresh water flux are relatively well re-produced by the<br />
NCEP reanalyses and the climate models. Systematic differences, however, are observed in<br />
the magnitude of the precipitati<strong>on</strong> and evaporati<strong>on</strong> compared to the CMAP and GSSTF2. For<br />
instance, both the precipitati<strong>on</strong> and the evaporati<strong>on</strong> in the CDAS2 are over-produced, while<br />
their differences (fresh water flux) are in general agreement with the observati<strong>on</strong>s over tropical<br />
and sub-tropical oceans. Interannual variability of precipitati<strong>on</strong> and evaporati<strong>on</strong> associated<br />
with the ENSO, NAO, AO and PNA is reas<strong>on</strong>ably well captured in the reanalyses and model<br />
simulati<strong>on</strong>s examined here. Quantitative agreements between the reanalyses and the<br />
observati<strong>on</strong>s, however, are less desirable, especially over tropical oceans. M<strong>on</strong>thly anomaly<br />
correlati<strong>on</strong> between the NCEP reanalysis 2 (CDAS2) and observati<strong>on</strong> is less than 0.4 for both<br />
precipitati<strong>on</strong> and evaporati<strong>on</strong> over most of the global tropical oceanic regi<strong>on</strong>s. Further work is<br />
underway to examine the surface wind, temperature, humidity and other related atmospheric<br />
and oceanic fields to better understand the differences with the observati<strong>on</strong>s and am<strong>on</strong>g the<br />
reanalyses and model simulati<strong>on</strong>s.<br />
156
Impact of Urban Expansi<strong>on</strong> <strong>on</strong> Regi<strong>on</strong>al Temperature Change in the Yangtze River Delta<br />
Zhiqing Xie<br />
Jiangsu Institute of Meteorlogical Sciences, Nanjing<br />
Du yin<br />
Department of Atmospheric Sciences, Nanjing University<br />
Zeng Yan<br />
Jiangsu Institute of Meteorlogical Sciences, Nanjing<br />
Shi Yafeng<br />
Nanjing Institute of Geography and Limnology, CAS, Nanjing<br />
Wu Jingang<br />
Jiangsu Institute of Meteorlogical Sciences, Nanjing<br />
Based <strong>on</strong> n<strong>on</strong>-radiance-calibrated DMSP/OLS nighttime light imagery from 1992 to 2003,<br />
urban land area statistical data, meteorological data and land surface temperature data<br />
retrieved by MODIS and NOAA/AVHRR data, the urbanizati<strong>on</strong> influence <strong>on</strong> regi<strong>on</strong>al climate<br />
trend of temperature in the Yangtze River Delta was analyzed. C<strong>on</strong>clusi<strong>on</strong>s are as follows:<br />
<str<strong>on</strong>g>The</str<strong>on</strong>g>re is a significant urbanizati<strong>on</strong> process from 1992 to 2003 in the Yangtze River Delta.<br />
Four city clusters of Nanjing-Zhenjiang-Yangzhou, Suzhou-Wuxi-Changzhou, Shanghai and<br />
Hangchow Bay form a zigzag city belt. <str<strong>on</strong>g>The</str<strong>on</strong>g> increase rate of year average air temperature in<br />
city-belt is 0.28-0.44 /10a from1991 to 2005, which is far larger than that of n<strong>on</strong>-city-belt.<br />
<str<strong>on</strong>g>The</str<strong>on</strong>g> urban heat island (UHI) effect <strong>on</strong> regi<strong>on</strong>al average air temperature in different seas<strong>on</strong>s<br />
is summer>autumn>spring>winter. <str<strong>on</strong>g>The</str<strong>on</strong>g> UHI intensity and the urban total populati<strong>on</strong><br />
logarithm are creditable correlated. <str<strong>on</strong>g>The</str<strong>on</strong>g> UHI effect made the regi<strong>on</strong>al year average air<br />
temperature increased 0.072 from 1961 to 2005 and 0.047 , and the year maximum air<br />
temperature increased 0.162 and 0.083 from 1991 to 2005, all these indicates that the<br />
urban expansi<strong>on</strong> in the Yangtze River Delta from 1991 to 2005 may be regarded as a serious<br />
climate signal.<br />
Detecting Inhomogeneity in Daily Climate Series Using Wavelet Analysis<br />
Zh<strong>on</strong>gwei Yan<br />
Institute of Atmospheric Physics, <str<strong>on</strong>g>Beijing</str<strong>on</strong>g><br />
yzw@tea.ac.cn<br />
Phil J<strong>on</strong>es<br />
Climate Research Unit, Norwich<br />
Daily meteorological observati<strong>on</strong>s have increasingly been used in the study of climate<br />
extremes. However, the l<strong>on</strong>g-term homogeneity of daily data remains questi<strong>on</strong>able, due to<br />
untraceable changes in observing system or subjective data processing. Early studies of<br />
157
homogeneity were mainly c<strong>on</strong>cerned with l<strong>on</strong>g-term mean values (and hence adjustments of<br />
level jumps). C<strong>on</strong>venti<strong>on</strong>al statistics may help identify unusual changes in variance but d<strong>on</strong>'t<br />
indicate the right way of adjustment regarding variability across different timescales. For daily<br />
series, the shortest timescale variability, daily variability, is sensitive to changes in local<br />
observing systems and hence may influence homogeneity more than l<strong>on</strong>ger-term large-scale<br />
variability may do.<br />
A wavelet method was applied to detect inhomogeneities in a few well-established<br />
l<strong>on</strong>g-term daily temperature series back to the 18th century, which have been 'homogenized'<br />
with c<strong>on</strong>venti<strong>on</strong>al approaches. Various types of problems remaining in the series were<br />
revealed. As these inhomogeneities deal with daily and weather timescale fluctuati<strong>on</strong>s, their<br />
existence will seriously influence analysis of changes in climate extremes deduced from the<br />
daily data.<br />
By analyzing inhomogeneities with regard to specific timescales, the present results not<br />
<strong>on</strong>ly have importance for understanding issues in c<strong>on</strong>venti<strong>on</strong>al climate data processing, but<br />
also imply potential for developing more comprehensive methods of homogenizati<strong>on</strong> for<br />
l<strong>on</strong>g-term daily climate series, in order to improve analysis of climate extremes based <strong>on</strong> daily<br />
data.<br />
Changing Trends of Climate in Jiangsu Province during 1961 to 2000<br />
Xiliang Zhang<br />
Nanjing University of Infoemati<strong>on</strong> and Technology<br />
Qiu Xinfa<br />
Nanjing University of Infoemati<strong>on</strong> and Technology<br />
Abstract: Based <strong>on</strong> the meteorological data, observed in 63 meteorological stati<strong>on</strong>s of<br />
Jiangsu Province from 1961-2005, variati<strong>on</strong> trends of average temperature, precipitati<strong>on</strong> and<br />
sunshine percentage in recent 45 years are studied. <str<strong>on</strong>g>The</str<strong>on</strong>g> results show that, annual average<br />
temperature in Jiangsu Province presents a significant increase, that is, the temperature<br />
increases slightly in the summer while obviously in the other three seas<strong>on</strong>s; the temperature<br />
raises the most in the winter and has the largest c<strong>on</strong>tributi<strong>on</strong> to the annual temperature rising.<br />
Precipitati<strong>on</strong> decreases significantly in the autumn while increases obviously in the winter, but<br />
the variati<strong>on</strong>s of annual precipitati<strong>on</strong>, the precipitati<strong>on</strong> in the spring and the summer is not so<br />
significant; extreme precipitati<strong>on</strong> amount and its frequency appears an obvious increase in the<br />
summer, and the intensity of extreme precipitati<strong>on</strong> in the autumn decreases apparently.<br />
Annual sunshine percentage and sunshine percentage of the four seas<strong>on</strong>s have some<br />
decrease generally; the annual sunshine percentage and the sunshine percentage in the<br />
summer and winter reduce obviously.<br />
Key words:average temperature ;precipitati<strong>on</strong>;sunshine percentage;changing trends<br />
158
Calibrating and evaluating reanalyses surface temperature bias by topographic correcti<strong>on</strong><br />
Tianbao Zhao<br />
Institute of Atmospheric Physics, Chinese Academy of Sciences<br />
zhaotb@tea.ac.cn<br />
Weid<strong>on</strong>g Guo<br />
Institute of Atmospheric Physics, Chinese Academy of Sciences<br />
C<strong>on</strong>gbin Fu<br />
Institute of Atmospheric Physics, Chinese Academy of Sciences<br />
Based <strong>on</strong> the observed daily surface air temperature data from 597 stati<strong>on</strong>s over<br />
c<strong>on</strong>tinental <str<strong>on</strong>g>China</str<strong>on</strong>g> and 2 sets of reanalysis data (NCEP/NCAR and ERA-40) during 1979-<br />
2001, the altitude effects in calibrating and evaluating reanalyzed surface temperature errors<br />
are studied. <str<strong>on</strong>g>The</str<strong>on</strong>g> results indicate that accuracy of interpolated surface temperature from the<br />
reanalyzed grid point value or the stati<strong>on</strong> observati<strong>on</strong>s depends much <strong>on</strong> the altitudes of<br />
original data. Bias of interpolated temperature is usually in proporti<strong>on</strong> to the increase of local<br />
elevati<strong>on</strong> and topographical complexity. Notable improvements of interpolated surface<br />
temperature have been achieved through “topographic correcti<strong>on</strong>”, especially for ERA-40<br />
reanalysis, which highlights the necessity of removal of “elevati<strong>on</strong>–induced bias” when using<br />
and evaluating reanalyzed surface temperature.<br />
A Statistical Predicti<strong>on</strong> of the Seas<strong>on</strong>al Mean Circulati<strong>on</strong> and a Comparis<strong>on</strong> with Dynamical<br />
Ensemble Predicti<strong>on</strong> using NCEP’s CFS<br />
Xiaogu Zheng<br />
Nati<strong>on</strong>al Institute of Water and Atmospheric Research, Wellingt<strong>on</strong>, New Zealand<br />
x.zheng@niwa.co.nz<br />
David Straus<br />
George Mas<strong>on</strong> University, Fairfax, Virginia and Center for Ocean-Land-Atmosphere Studies,<br />
Calvert<strong>on</strong>, Maryland, USA<br />
Carstern S. Frederiksen<br />
Bureau of Meteorology Research Centre, Melbourne, Australia<br />
Reanalysis data and a recently developed variance decompositi<strong>on</strong> approach are applied<br />
to statistically predict seas<strong>on</strong>al mean 500hPa geopotential height anomalies in both the<br />
Northern and Southern Hemisphere. <str<strong>on</strong>g>The</str<strong>on</strong>g> statistical predicti<strong>on</strong> is compared with the dynamical<br />
ensemble predicti<strong>on</strong> of the Nati<strong>on</strong>al Center for Envir<strong>on</strong>mental Predicti<strong>on</strong>’s coupled Climate<br />
Forecast System. (CFS). Generally speaking, the statistical scheme produces a lower<br />
predicti<strong>on</strong> error than the dynamical predicti<strong>on</strong> scheme. Using a combined spatio-temporal<br />
correlati<strong>on</strong> measure, we find that the CFS dynamical predicti<strong>on</strong>s have slightly higher skill<br />
159
compared to the statistical predicti<strong>on</strong>s in Northern Hemisphere, but slightly lower skill in the<br />
Southern Hemisphere.<br />
However, because coupled general circulati<strong>on</strong> models have the potential to simulate the<br />
c<strong>on</strong>temporaneous air-sea interacti<strong>on</strong>s, they have the potential to predict the seas<strong>on</strong>al mean<br />
circulati<strong>on</strong> patterns forced by such interacti<strong>on</strong>s. By c<strong>on</strong>trast, statistical predicti<strong>on</strong> relies <strong>on</strong> a<br />
lagged SST or circulati<strong>on</strong> index relati<strong>on</strong>ship, which precludes the predicti<strong>on</strong> of modes for which<br />
c<strong>on</strong>temporaneous interacti<strong>on</strong>s are important. Here, we provide two striking examples: the<br />
boreal winter western Pacific oscillati<strong>on</strong> and the austral winter meridi<strong>on</strong>al wave train. <str<strong>on</strong>g>The</str<strong>on</strong>g>ir<br />
inter-annual variati<strong>on</strong>s are successfully predicted by the dynamical model, but could not be<br />
included in the proposed statistical predicti<strong>on</strong> scheme due to a lack of lagged predictors.<br />
A Statistical Predicti<strong>on</strong> of the Seas<strong>on</strong>al Mean Circulati<strong>on</strong><br />
Xiaogu Zheng<br />
Nati<strong>on</strong>al Institute of Water and Atmospheric Research, Wellingt<strong>on</strong>, New Zealand<br />
x.zheng@niwa.co.nz<br />
David Straus<br />
George Mas<strong>on</strong> University, Fairfax, Virginia<br />
Carstern S. Frederiksen<br />
Bureau of Meteorology Research Centre, Melbourne, Australia<br />
Reanalysis data and a recently developed variance decompositi<strong>on</strong> approach are applied<br />
to statistically predict seas<strong>on</strong>al mean 500hPa geopotential height anomalies in both the<br />
Northern and Southern Hemisphere. <str<strong>on</strong>g>The</str<strong>on</strong>g> statistical predicti<strong>on</strong> is compared with the dynamical<br />
ensemble predicti<strong>on</strong> of the Nati<strong>on</strong>al Center for Envir<strong>on</strong>mental Predicti<strong>on</strong>’s coupled Climate<br />
Forecast System. (CFS). Generally speaking, the statistical scheme produces a lower<br />
predicti<strong>on</strong> error than the dynamical predicti<strong>on</strong> scheme. Using a combined spatio-temporal<br />
correlati<strong>on</strong> measure, we find that the CFS dynamical predicti<strong>on</strong>s have slightly higher skill<br />
compared to the statistical predicti<strong>on</strong>s in Northern Hemisphere, but slightly lower skill in the<br />
Southern Hemisphere.However, because coupled general circulati<strong>on</strong> models have the<br />
potential to simulate the c<strong>on</strong>temporaneous air-sea interacti<strong>on</strong>s, they have the potential to<br />
predict the seas<strong>on</strong>al mean circulati<strong>on</strong> patterns forced by such interacti<strong>on</strong>s. By c<strong>on</strong>trast,<br />
statistical predicti<strong>on</strong> relies <strong>on</strong> a lagged SST or circulati<strong>on</strong> index relati<strong>on</strong>ship, which precludes<br />
the predicti<strong>on</strong> of modes for which c<strong>on</strong>temporaneous interacti<strong>on</strong>s are important. Here, we<br />
provide two striking examples: the boreal winter western Pacific oscillati<strong>on</strong> and the austral<br />
winter meridi<strong>on</strong>al wave train. <str<strong>on</strong>g>The</str<strong>on</strong>g>ir inter-annual variati<strong>on</strong>s are successfully predicted by the<br />
dynamical model, but could not be included in the proposed statistical predicti<strong>on</strong> scheme due<br />
to a lack of lagged predictors.<br />
160
To explore an optimal climate decisi<strong>on</strong>-making method suitable for medium-sized reservoir<br />
management<br />
Zou Xiyun<br />
Yiyang City Meteorological Bureau, Meteorological Service of Hunan Province<br />
biyuan_lin@tom.com<br />
LIU Dian-ying, ZHANG D<strong>on</strong>g-zhi<br />
Yiyang City Meteorological Bureau, Meteorological Service of Hunan Province<br />
Made full use of climate resources,dispatched water level (volume) of the reservoir, and<br />
played reservoir’s ec<strong>on</strong>omic benefit in fighting the drought and generating electricity, reservoir<br />
operati<strong>on</strong> decisi<strong>on</strong>s that must be resolved was currently an important issue .According to<br />
weather and ec<strong>on</strong>omic principles, applyed c<strong>on</strong>tinuous functi<strong>on</strong> for extreme methods, used<br />
related ec<strong>on</strong>omic parameters of yangquan reservoir, Based <strong>on</strong> reservoirs climate the best<br />
activati<strong>on</strong> patterns were established, which could achieve remarkable results for reservoir<br />
optimizati<strong>on</strong> activati<strong>on</strong> with a scientific basis.<br />
Key words: climate applicati<strong>on</strong>s;reservoir operati<strong>on</strong>;mothod study;optimal decisi<strong>on</strong><br />
161

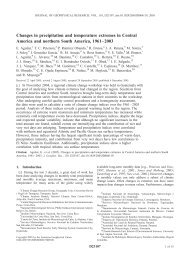

![final_program_abstracts[1]](https://img.yumpu.com/19102520/1/174x260/final-program-abstracts1.jpg?quality=85)