
Create successful ePaper yourself
Turn your PDF publications into a flip-book with our unique Google optimized e-Paper software.
AIR TRANSPORT MARKET ANALYSIS<br />
DECEMBER 2010<br />
KEY POINTS<br />
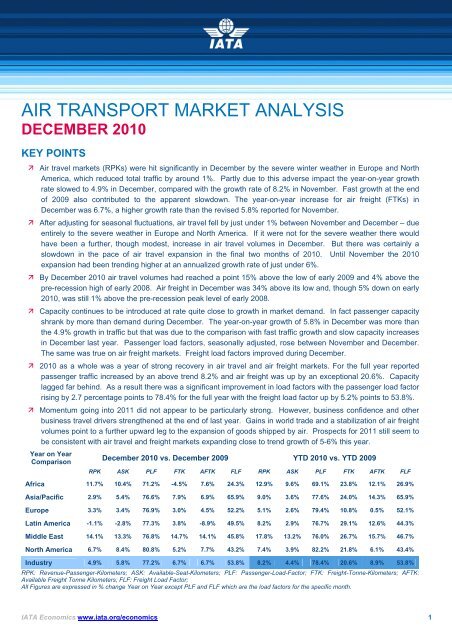
Air travel markets (RPKs) were hit significantly in <strong>December</strong> by the severe winter weather in Europe and North<br />
America, which reduced total traffic by around 1%. Partly due to this adverse impact the year-on-year growth<br />
rate slowed to 4.9% in <strong>December</strong>, compared with the growth rate of 8.2% in November. Fast growth at the end<br />
of 2009 also contributed to the apparent slowdown. The year-on-year increase for air freight (FTKs) in<br />
<strong>December</strong> was 6.7%, a higher growth rate than the revised 5.8% reported for November.<br />
After adjusting for seasonal fluctuations, air travel fell by just under 1% between November and <strong>December</strong> – due<br />
entirely to the severe weather in Europe and North America. If it were not for the severe weather there would<br />
have been a further, though modest, increase in air travel volumes in <strong>December</strong>. But there was certainly a<br />
slowdown in the pace of air travel expansion in the final two months of 2010. Until November the 2010<br />
expansion had been trending higher at an annualized growth rate of just under 6%.<br />
By <strong>December</strong> 2010 air travel volumes had reached a point 15% above the low of early 2009 and 4% above the<br />
pre-recession high of early 2008. Air freight in <strong>December</strong> was 34% above its low and, though 5% down on early<br />
2010, was still 1% above the pre-recession peak level of early 2008.<br />
Capacity continues to be introduced at rate quite close to growth in market demand. In fact passenger capacity<br />
shrank by more than demand during <strong>December</strong>. The year-on-year growth of 5.8% in <strong>December</strong> was more than<br />
the 4.9% growth in traffic but that was due to the comparison with fast traffic growth and slow capacity increases<br />
in <strong>December</strong> last year. Passenger load factors, seasonally adjusted, rose between November and <strong>December</strong>.<br />
The same was true on air freight markets. Freight load factors improved during <strong>December</strong>.<br />
2010 as a whole was a year of strong recovery in air travel and air freight markets. For the full year reported<br />
passenger traffic increased by an above trend 8.2% and air freight was up by an exceptional 20.6%. Capacity<br />
lagged far behind. As a result there was a significant improvement in load factors with the passenger load factor<br />
rising by 2.7 percentage points to 78.4% for the full year with the freight load factor up by 5.2% points to 53.8%.<br />
Momentum going into 2011 did not appear to be particularly strong. However, business confidence and other<br />
business travel drivers strengthened at the end of last year. Gains in world trade and a stabilization of air freight<br />
volumes point to a further upward leg to the expansion of goods shipped by air. Prospects for 2011 still seem to<br />
be consistent with air travel and freight markets expanding close to trend growth of 5-6% this year.<br />
Year on Year<br />
<strong>December</strong> 2010 vs. <strong>December</strong> 2009 YTD 2010 vs. YTD 2009<br />
Comparison<br />
RPK ASK PLF FTK AFTK FLF RPK ASK PLF FTK AFTK FLF<br />
Africa 11.7% 10.4% 71.2% -4.5% 7.6% 24.3% 12.9% 9.6% 69.1% 23.8% 12.1% 26.9%<br />
Asia/Pacific 2.9% 5.4% 76.6% 7.9% 6.9% 65.9% 9.0% 3.6% 77.6% 24.0% 14.3% 65.9%<br />
Europe 3.3% 3.4% 76.9% 3.0% 4.5% 52.2% 5.1% 2.6% 79.4% 10.8% 0.5% 52.1%<br />
Latin America -1.1% -2.8% 77.3% 3.8% -8.9% 49.5% 8.2% 2.9% 76.7% 29.1% 12.6% 44.3%<br />
Middle East 14.1% 13.3% 76.8% 14.7% 14.1% 45.8% 17.8% 13.2% 76.0% 26.7% 15.7% 46.7%<br />
North America 6.7% 8.4% 80.8% 5.2% 7.7% 43.2% 7.4% 3.9% 82.2% 21.8% 6.1% 43.4%<br />
Industry 4.9% 5.8% 77.2% 6.7% 6.7% 53.8% 8.2% 4.4% 78.4% 20.6% 8.9% 53.8%<br />
RPK: Revenue-Passenger-Kilometers; ASK: Available-Seat-Kilometers; PLF: Passenger-Load-Factor; FTK: Freight-Tonne-Kilometers; AFTK:<br />
Available Freight Tonne Kilometers; FLF: Freight Load Factor;<br />
All Figures are expressed in % change Year on Year except PLF and FLF which are the load factors for the specific month.<br />
<strong>IATA</strong> Economics www.iata.org/economics 1
Air Transport Market Analysis<br />
<strong>December</strong> 2010<br />
COMPARING DECEMBER TO NOVEMBER<br />
Month on<br />
Month<br />
Comparison<br />
<strong>December</strong> 2010 vs. November 2010<br />
RPK ASK PLF pt FTK AFTK FLF pt<br />
Africa 1.2% -0.7% 1.3% -4.1% -3.3% -0.2%<br />
Asia/Pacific -0.2% 0.2% -0.3% 1.9% -0.1% 1.3%<br />
Europe -1.9% -3.1% 1.0% -1.3% -0.1% -0.6%<br />
Latin America -0.6% -0.4% -0.2% -1.3% -1.4% 0.0%<br />
Middle East 0.3% -0.1% 0.3% 2.0% -0.4% 1.1%<br />
North America 0.0% 0.0% 0.0% 5.4% 1.5% 1.6%<br />
Industry -0.7% -1.2% 0.4% 1.5% 0.0% 0.8%<br />
Data are seasonally adjusted.<br />
All figures are expressed in % change month on month except, PLF pt and FLF<br />
pt which are the percentage point difference between load factors of two<br />
consecutive months.<br />
On a seasonally adjusted basis whilst<br />
passenger traffic declined by just under<br />
1%, freight traffic increased by some 1.5%<br />
Adjusting for the effects of the severe<br />
winter weather suggests that passenger<br />
traffic rose moderately.<br />
Europe in particular was affected by the<br />
severe winter weather which is reflected in<br />
the monthly figures.<br />
The bankruptcy of Mexicana continues to<br />
have an impact on Latin America although<br />
this will continue to diminish.<br />
In terms of freight North America was up<br />
by some 5.4% although this should be<br />
looked at against the November figures<br />
where there was a decline of some 7% in<br />
FTKs which suggests a timing issue.<br />
AIR TRAVEL VOLUME GROWTH TEMPORARILY DENTED BY WEATHER<br />
300<br />
International Passenger Traffic<br />
Source: <strong>IATA</strong><br />
20<br />
Passenger Growth By Region<br />
Source: <strong>IATA</strong><br />
Nov-10<br />
Dec-10<br />
Monthly RPKs (Billion)<br />
280<br />
260<br />
240<br />
220<br />
200<br />
180<br />
160<br />
Actual<br />
Seasonally Adjusted<br />
% Growth in RPKs<br />
15<br />
10<br />
5<br />
0<br />
13.3<br />
11.7<br />
5.6<br />
2.9<br />
7.8<br />
3.3<br />
0.6<br />
-1.1<br />
16.8<br />
14.1<br />
9.5<br />
6.7<br />
8.2<br />
4.9<br />
May-05<br />
Aug-05<br />
Nov-05<br />
Feb-06<br />
May-06<br />
Aug-06<br />
Nov-06<br />
Feb-07<br />
May-07<br />
Aug-07<br />
Nov-07<br />
Feb-08<br />
May-08<br />
Aug-08<br />
Nov-08<br />
Feb-09<br />
May-09<br />
Aug-09<br />
Nov-09<br />
Feb-10<br />
May-10<br />
Aug-10<br />
Nov-10<br />
-5<br />
Africa Asia Pacific Europe Latin<br />
America<br />
Middle East<br />
North<br />
America<br />
Total<br />
International passenger traffic was some 4.9% higher than in <strong>December</strong> 2009; the slowing in the reported growth<br />
rate from the 8.2% for November reflects a number of factors; firstly we estimate that the severe winter weather<br />
in Europe and North America reduced the headline figure by about 1%, secondly <strong>December</strong>’s starting point was<br />
more demanding in that traffic in <strong>December</strong> 2009 was some 4.5% up on <strong>December</strong> 2008’s outcome, whilst<br />
November 2009 was up by 2.1% on November 2008. Using 2008 as the starting point then in November 2010<br />
traffic was some 10.4% higher than in November 2008 whilst for <strong>December</strong>, before the weather adjustment<br />
traffic was some 9.6% higher, or some 10.6% when we add back the 1% for the weather disruption suggesting<br />
that the underlying trend remains in place.<br />
The greatest monthly variation was evident in the Asia-Pacific region - however this needs to be set against what<br />
was occurring a year ago; In <strong>December</strong> 2009 passenger traffic was some 8% higher than in <strong>December</strong> 2008 –<br />
for November, the increase over 2008 had been 5.1%. Using the corresponding months in 2008 as the<br />
reference point this suggests that in November 2010 traffic was up by just over 11% compared with November<br />
2008 and 11% higher for <strong>December</strong> 2010 compared with <strong>December</strong> 2008. – Again still on trend.<br />
For the full year passenger traffic was up by 8.2% with the final quarter up by some 7.7% on a reported basis; on<br />
a seasonally adjusted basis traffic in the final quarter of 2010 was some 7.4% above the level in the<br />
corresponding quarter of 2009.<br />
The key features for 2010 are the capacity discipline in the North American market where full year ASKs were<br />
up by just 3.9% and, with traffic up by almost twice that amount, this has shown through not only in a sharp<br />
<strong>IATA</strong> Economics www.iata.org/economics 2
Air Transport Market Analysis<br />
<strong>December</strong> 2010<br />
recovery in the financial peformance but the prospect of a record outcome for 2010. The passenger load factor<br />
at 82.2% for the full year (up from 79.6% in 2009) may prove difficult to maintain if capacity additions accelerate<br />
over the period ahead. For the full year traffic was some 7.4% above 2009’s total and just over 1% higher than<br />
in 2008.<br />
The growth reported by the Middle East airlines during 2010 is unsurprising given the delivery schedules of the<br />
Gulf based airlines in particular; here passenger load factors increased by 3% points to 76.0%. Traffic in both<br />
November and <strong>December</strong> 2010 was some 35% higher than in was in the corresponding months in 2008 which<br />
gives some indication of the structural change that is occuring. On an annual basis, traffic in 2010 was some<br />
31% greater than the total for 2008.<br />
Whilst the monthly figures for Latin America reflect the demise of Mexicana, the reality is that compared with<br />
<strong>December</strong> 2008, the figures for the latest month show growth of some 5%, and for 2010 overall the total is<br />
almost 8% more than that reported in 2008, although this includes 7 months of traffic from Mexicana -<br />
conversely there are 5 months when Mexicana was not operating.<br />
AIR FREIGHT VOLUME GROWTH STABILIZING<br />
15<br />
14<br />
International Freight Traffic<br />
Source: <strong>IATA</strong><br />
15<br />
13<br />
Freight Growth By Region<br />
Source: <strong>IATA</strong><br />
12.2<br />
14.7<br />
Nov-10<br />
Dec-10<br />
Monthly FTKs (Billion)<br />
13<br />
12<br />
11<br />
10<br />
% Growth in FTKs<br />
11<br />
9<br />
7<br />
5<br />
3<br />
1<br />
1.5<br />
4.6<br />
7.9<br />
6.7<br />
3.0<br />
10.3<br />
3.8<br />
3.0<br />
5.2<br />
5.8<br />
6.7<br />
9<br />
8<br />
May-05<br />
Aug-05<br />
Nov-05<br />
Feb-06<br />
May-06<br />
Actual<br />
Seasonally Adjusted<br />
Aug-06<br />
Nov-06<br />
Feb-07<br />
May-07<br />
Aug-07<br />
Nov-07<br />
Feb-08<br />
May-08<br />
Aug-08<br />
Nov-08<br />
Feb-09<br />
May-09<br />
Aug-09<br />
Nov-09<br />
Feb-10<br />
May-10<br />
Aug-10<br />
Nov-10<br />
-1<br />
-3<br />
-5<br />
-4.5<br />
Africa Asia Pacific Europe Latin<br />
America<br />
Middle East<br />
North<br />
America<br />
Total<br />
In <strong>December</strong> International air freight volumes were some 6.7% higher than <strong>December</strong> 2009 which compares with<br />
a growth rate of 5.8% for November; if the reference months are in 2008 then FTKs in <strong>December</strong> 2010 were a<br />
third more than in <strong>December</strong> 2008 whereas FTKs in November 2010 were 17% above the level reported in<br />
November 2008. Just as November might appear to have been an aberration there is a risk that <strong>December</strong><br />
could be too.<br />
The regional variation in freight growth rates remains particularly marked however it is necessary to put into<br />
perspective the relative size of each region and the respective impacts on industry growth rates; In particular,<br />
freight traffic carried by Asia Pacific airlines in volume terms is some 4.2 times that carried by the Middle East<br />
airlines; Indeed in <strong>December</strong> the Asia Pacific Airlines accounted for some 45% of FTKs compared with just over<br />
10% for the Middle East airlines.<br />
Over the last twelve months all regions have experienced significant variation in the reported freight growth rates;<br />
for the industry overall the range has been between 5.8% (November 2010) and 35.2% (May 2010); for the<br />
Middle East 12.2% (November 2010) and 38.7% (May 2010); Asia Pacific 4.6% (November 2010) and 39.9%<br />
(May 2010); the greatest range of almost 60% points was experienced by the Latin American airlines 3.8%<br />
(<strong>December</strong> 2010 and 63.0% (April 2010). There is an inevitability that reported growth rates will slow as<br />
comparisons become more onerous given that in H1 2010 FTKs increased at an average rate of almost 29%.<br />
So much for the history, what about the future and here there are several factors at play; there are some<br />
concerns over the strength of consumer demand and not just in the developed world where fundamental<br />
demand remains an issue; however underlying production data still suggests a phase of expansion for emerging<br />
economies which will provide support for further growth in freight markets, although at closer to 5-6% historical<br />
trend levels than the faster rates seen in the post recession period so far.<br />
<strong>IATA</strong> Economics www.iata.org/economics 3
Air Transport Market Analysis<br />
<strong>December</strong> 2010<br />
PASSENGER LOAD FACTORS REMAIN IN STABLE RANGE<br />
Whilst passenger load factors in <strong>December</strong> at the industry level remained within the 77-79% range, there<br />
continues to be a marked variation across the regions; for the North American carriers passenger overall load<br />
factors of almost 81% for <strong>December</strong>, and just over 82%, for the full year are close to those seen in the so-called<br />
LCC segment of the market; however the capacity discipline associated with these load factors has been clearly<br />
evident in the financial performances of most airlines in the region. The risk is now is that to accommodate<br />
growth, too much capacity is introduced/re-introduced too quickly against a still uncertain background.<br />
Whilst the load factor tells us how much capacity has been used, the more useful figure is the gap between the<br />
achieved load factor and the breakeven load factor; In our latest forecasts which also include the effects of<br />
freight, we expect that there will have been a slight decline in the breakeven load factor in 2010 compared to<br />
2009, with the main driver of profitability being volumes (as well as a partial recovery in premium traffic);<br />
however for 2011 we currently expect the break even load factor to increase and the achieved load factor to<br />
decline - each 0.1% change in the gap between the achieved load factor and breakeven has the potential to<br />
swing the result by some $800m underlining how fine the balance is ultimately between supply, demand and<br />
yields.<br />
80%<br />
Passenger Load Factor on International Market<br />
Seasonally Adjusted<br />
Source: <strong>IATA</strong><br />
85<br />
81<br />
Dec-09<br />
Dec-10<br />
Passenger Load Factor By Region<br />
Source: <strong>IATA</strong><br />
82.1<br />
80.8<br />
% of ASKs<br />
78%<br />
76%<br />
74%<br />
% of ASKs<br />
77<br />
73<br />
69<br />
71.2<br />
70.4<br />
78.5<br />
76.6<br />
77.0 76.9<br />
77.3<br />
76.8<br />
76.0 76.2<br />
77.8<br />
77.2<br />
72%<br />
Jan-06<br />
Apr-06<br />
Jul-06<br />
Oct-06<br />
Jan-07<br />
Apr-07<br />
Jul-07<br />
Oct-07<br />
Jan-08<br />
Apr-08<br />
Jul-08<br />
Oct-08<br />
Jan-09<br />
Apr-09<br />
Jul-09<br />
Oct-09<br />
Jan-10<br />
Apr-10<br />
Jul-10<br />
Oct-10<br />
65<br />
Africa Asia Pacific Europe Latin<br />
America<br />
Middle East<br />
North<br />
America<br />
Total<br />
FREIGHT LOAD FACTORS SETTLING?<br />
After a period of rapid recovery and then a small decline, freight load factors have settled down at a slightly<br />
higher level than before the downturn; yield remains a key driver in minds of airline cargo departments.<br />
58%<br />
Freight Load Factor on International Market<br />
Seasonally Adjusted<br />
Source: <strong>IATA</strong><br />
68<br />
65.2 65.9<br />
Freight Load Factor By Region<br />
Source: <strong>IATA</strong><br />
Dec-09<br />
56%<br />
60<br />
Dec-10<br />
% of AFTKs<br />
54%<br />
52%<br />
50%<br />
48%<br />
46%<br />
% of AFTKs<br />
52<br />
44<br />
36<br />
52.9 52.2<br />
43.5<br />
49.5<br />
45.6 45.8<br />
44.2<br />
43.2<br />
53.8 53.8<br />
44%<br />
28<br />
27.4<br />
24.3<br />
42%<br />
Jan-06<br />
Apr-06<br />
Jul-06<br />
Oct-06<br />
Jan-07<br />
Apr-07<br />
Jul-07<br />
Oct-07<br />
Jan-08<br />
Apr-08<br />
Jul-08<br />
Oct-08<br />
Jan-09<br />
Apr-09<br />
Jul-09<br />
Oct-09<br />
Jan-10<br />
Apr-10<br />
Jul-10<br />
Oct-10<br />
20<br />
Africa Asia Pacific Europe Latin<br />
America<br />
Middle East<br />
North<br />
America<br />
Total<br />
<strong>IATA</strong> Economics E-Mail: economics@iata.org 2 February 2011<br />
FURTHER ANALYSIS AND DATA<br />
Access video commentary and<br />
chart data related to this briefing<br />
<strong>IATA</strong> Economics www.iata.org/economics through the Enhanced Edition:<br />
4<br />
www.iata.org/market-analysis