MHR • Calculus and Vectors 12 Solutions 485 Chapter 5 Section 1 ...
MHR • Calculus and Vectors 12 Solutions 485 Chapter 5 Section 1 ...
MHR • Calculus and Vectors 12 Solutions 485 Chapter 5 Section 1 ...

Create successful ePaper yourself
Turn your PDF publications into a flip-book with our unique Google optimized e-Paper software.
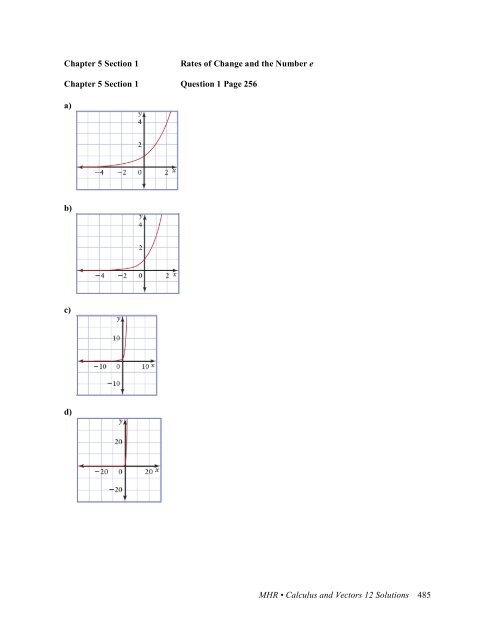
<strong>Chapter</strong> 5 <strong>Section</strong> 1<br />
Rates of Change <strong>and</strong> the Number e<br />
<strong>Chapter</strong> 5 <strong>Section</strong> 1 Question 1 Page 256<br />
a)<br />
b)<br />
c)<br />
d)<br />
<strong>MHR</strong> <strong>•</strong> <strong>Calculus</strong> <strong>and</strong> <strong>Vectors</strong> <strong>12</strong> <strong>Solutions</strong> <strong>485</strong>
<strong>Chapter</strong> 5 <strong>Section</strong> 1 Question 2 Page 256<br />
a)<br />
b)<br />
c)<br />
d)<br />
<strong>Chapter</strong> 5 <strong>Section</strong> 1 Question 3 Page 256<br />
a) f ( x ) = 2 x : {x !!}<br />
b) No<br />
c) No<br />
x<br />
f ( x)<br />
= e : {x !!}<br />
<strong>MHR</strong> <strong>•</strong> <strong>Calculus</strong> <strong>and</strong> <strong>Vectors</strong> <strong>12</strong> <strong>Solutions</strong> 486
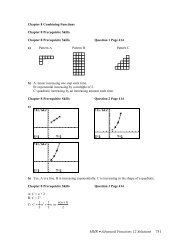
<strong>Chapter</strong> 5 <strong>Section</strong> 1 Question 4 Page 257<br />
a) B. The graph of the derivative of a quadratic function is a straight line.<br />
b) C. The graph of the derivative of a line is of the form y = a, where a is a constant.<br />
c) D. The graph of the derivative of an exponential function is also an exponential function.<br />
d) A. The graph of the derivative of a cubic function is a quadratic function.<br />
<strong>Chapter</strong> 5 <strong>Section</strong> 1 Question 5 Page 257<br />
a) b > e<br />
b) 0 ≤ b < e<br />
<strong>Chapter</strong> 5 <strong>Section</strong> 1 Question 6 Page 258<br />
a)<br />
b) Answers may vary. For example:<br />
The graph of the rate of change of<br />
y in the x-axis.<br />
c)<br />
! 1 "<br />
y = # $<br />
% 2 &<br />
x<br />
will be a compression <strong>and</strong> a reflection of the graph of<br />
<strong>MHR</strong> <strong>•</strong> <strong>Calculus</strong> <strong>and</strong> <strong>Vectors</strong> <strong>12</strong> <strong>Solutions</strong> 487
<strong>Chapter</strong> 5 <strong>Section</strong> 1 Question 7 Page 258<br />
Answers may vary. For example:<br />
x<br />
If 0 < b < 1, the graph of y = b will be above the x-axis <strong>and</strong> the graph of the rate of change of this<br />
x<br />
function will be below the x-axis. If b > 1, the graph of y = b <strong>and</strong> the graph of the rate of change of<br />
this function will both be above the x-axis.<br />
<strong>Chapter</strong> 5 <strong>Section</strong> 1 Question 8 Page 258<br />
a)<br />
b)<br />
c) Answers may vary. For example:<br />
The graph of the combined function g( x ) will be a horizontal straight line.<br />
<strong>MHR</strong> <strong>•</strong> <strong>Calculus</strong> <strong>and</strong> <strong>Vectors</strong> <strong>12</strong> <strong>Solutions</strong> 488
d)<br />
Answers may vary. For example:<br />
The graph of g( x ) = ln 4 is a constant function. Therefore the graph is a horizontal straight line.<br />
<strong>Chapter</strong> 5 <strong>Section</strong> 1 Question 9 Page 258<br />
a) Answers may vary. For example:<br />
No. The shape of the graph of g will not change. The shape of the graph of g will be a horizontal<br />
straight line. If the base is other than 4, the graph will be parallel to the graph of g <strong>and</strong> shifted up or<br />
down depending on the numerical value of the base.<br />
If the value of the base is greater than 4, the graph will be shifted up. If the value of the base is<br />
greater than 1 <strong>and</strong> less than 4, the graph will be shifted down, but will still be above the x-axis.<br />
If the value of the base is greater than 0 <strong>and</strong> less than 1, the graph will be shifted down <strong>and</strong> will be<br />
below the x-axis.<br />
b) The graph is the line g( x) = ln e , which is the horizontal straight line<br />
f !( x)<br />
g( x)<br />
= where g( x ) = 1.<br />
f ( x)<br />
<strong>Chapter</strong> 5 <strong>Section</strong> 1 Question 10 Page 258<br />
<strong>Solutions</strong> to the Achievement Checks are shown in the Teacher’s Resource.<br />
<strong>Chapter</strong> 5 <strong>Section</strong> 1 Question 11 Page 258<br />
a) Answers may vary. For example:<br />
The graph of the function g! ( x)<br />
will be the horizontal straight line, y = 0.<br />
b) Answers may vary. For example:<br />
x<br />
If f ( x ) = 2 x<br />
x<br />
2 ln 2<br />
, then f !( x) = 2 ln 2 , <strong>and</strong> g( x ) = .<br />
x<br />
2<br />
g( x ) = ln 2 , which is just a constant so g! ( x)<br />
= 0. This is applicable for any base. Therefore, the<br />
graph of g! ( x)<br />
will be the graph of y = 0.<br />
The graph of g( x ) is a constant function. The derivative of a constant function is 0.<br />
<strong>MHR</strong> <strong>•</strong> <strong>Calculus</strong> <strong>and</strong> <strong>Vectors</strong> <strong>12</strong> <strong>Solutions</strong> 489