www.afm-journal.dewww.MaterialsViews.comFULL PAPERFigure 4. Thermal hysteresis values in Ti–Ni based SMAs. a) DT forTi–Ni–Cu–Pd alloys and b) ternary Ti–Ni–X alloys (X ¼ Cu [6], Pd [6], Au[7], Pt [7]) plotted against l 2 . The dashed line indicates as-measured valuesfor l 2 , color-coded data points are corrected for residual strain (seeExperimental for details). Lines are guides to the eye.convergence <strong>of</strong> the thermal hysteresis towards zero for alloycompositions approaching l 2 ¼ 1. Despite the fact that a variety <strong>of</strong>sample preparation methods and measurement techniques wereused in the investigation <strong>of</strong> the different samples, the overall trend<strong>of</strong> decreasing DTvalues for alloy compositions approaching l 2 ¼ 1is compelling. Other parameters (e.g., elastic modulus, interfacialenergy density, and latent heat <strong>of</strong> transformation) are not expectedto vary significantly for the investigated alloys, and thus areconcluded to have only a negligible effect on DT. [7]The transformation behavior in the investigated quaternaryTi–Ni–Cu–Pd system is dominated by the Pd content, as evidentfrom the large composition region showing a B2!B19 Pd phasetransformation (Fig. 1) and the strong dependence <strong>of</strong> the R(T)characteristic on the Pd content (Figs. 2 and 3). The stronginfluence <strong>of</strong> Pd on the transformation characteristics and latticeparameters and thus l 2 can be rationalized by the substitutionbehavior <strong>of</strong> Pd, which is known to occupy Ni sites, irrespectively <strong>of</strong>concentration, [22] and has a comparatively larger atomic volume. Incontrast, Cu atoms show no site preference [22] and havecomparable atomic volume to that <strong>of</strong> Ni. Thus, for additions <strong>of</strong>Cu, the sensitivity <strong>of</strong> DT to l 2 is nearly one order <strong>of</strong> magnitudesmaller than that for Pd. [6]In order to transfer the identified thin-film Ti–Ni–Cu–Pdcompositions to bulk, we performed a systematic synthesis <strong>of</strong> bulkalloys based on the composition–structure–property relationshipdetermined using the combinatorial thin-film approach, that is,the strong correlation <strong>of</strong> phase-transformation properties on theNi to Pd ratio, while Ti and Cu contents remain constant (Fig. 3). Adirect scale-up <strong>of</strong> the thin-film compositions is not possible due tothe uncertainty associated <strong>with</strong> the determination <strong>of</strong> thecomposition <strong>of</strong> the transforming phase in the thin film (seeExperimental), thin film stresses, and the usually smaller grainsizes in thin films as compared to their bulk counterparts. [23,24] Wethus prepared Ti–Ni–Cu–Pd bulk materials by arc-melting <strong>with</strong> thedescribed systematic compositional variation and characterizedtheir phase-transformation behavior. The most common characterizationtechnique for bulk alloys, differential scanningcalorimetry (DSC), was found to be inadequate for characterizingand comparing phase transformations <strong>with</strong> exceedingly small DT,due to the inherent delay <strong>of</strong> the measurement signal (seeExperimental and Supporting Information, Fig. 2). [23]Thus, we used the temperature-dependent alternating currentpotential drop method (ACPD) technique, which we havepreviously established as a reliable method for comparativemeasurements <strong>of</strong> transformation temperatures and hysteresis forbulk alloys. [23] For comparison, Ti 50 Ni 50 (l 2 ¼ 0.969), [25]Ti 50 Ni 35 Cu 15 (l 2 ¼ 0.995), [25] and Ti 50 Ni 39 Pd 11 (l 2 ¼ 1.008) alloyswere also prepared and characterized by the same methods as thequaternary Ti–Ni–Cu–Pd SMAs. Earlier measurements haveestablished both Ti 50 Ni 35 Cu 15 and Ti 50 Ni 39 Pd 11 as the alloys <strong>with</strong>the lowest l 2 values <strong>with</strong>in the corresponding ternary system. [25]Figure 5a shows the normalized R(T) curves <strong>of</strong> the bulk alloys(equally scaled and <strong>of</strong>fset for clarity). These curves confirm theremarkable decrease in DT as the alloy compositions approachl 2 ¼ 1 and, indeed, immeasurably small or near-zero thermalhysteresis was found for the alloy Ti 50.2 Ni 34.4 Cu 12.3 Pd 3.1 .The characteristic shapes <strong>of</strong> the R(T) curves for ternaryand quaternary bulk alloys closely resemble those observedfor thin films (Fig. 3). The reversible phase transformation forthe quaternary Ti 50.2 Ni 34.4 Cu 12.3 Pd 3.1 alloy was confirmed bytemperature-dependent X-ray diffraction (XRD(T)), as shownin Figure 5b. The XRD(T) spectra recorded during heatingfrom 0 to 120 8C show a phase transformation from anorthorhombic martensite (B19 Cu ) to austenite (B2) between 60and 70 8C and no precipitates. Similarly, the reverse phasetransformation was observed to occur during cooling (not shownhere). Thus, we have demonstrated the ability to transfer the thinfilmresults to bulk, based on the composition–structure–propertyrelationship determined using the combinatorial thin filmapproach.In order to relate the decrease in DT to the functional fatiguecharacteristics, we investigated the functional stability <strong>of</strong> Ti 50 Ni 50 ,Ti 50 Ni 35 Cu 15 ,Ti 50 Ni 39 Pd 11 , and Ti 50.2 Ni 34.4 Cu 12.3 Pd 3.1 by thermalcycling using DSC. Figure 6a–d shows compilations <strong>of</strong> 20 DSCcycles for the binary and ternary alloys and 80 DSC cycles forTi 50.2 Ni 34.4 Cu 12.3 Pd 3.1 . Insets highlight the shifting <strong>of</strong> the DSCcurves upon thermal cycling (Fig. 6b–d), which is most clearlyvisible for the Ti 50 Ni 50 alloy (Fig. 6a). The shifting <strong>of</strong> thetransformation temperature during each cycle is associated <strong>with</strong>an increase in dislocation density (transformation plasticity).Stress fields around the dislocations introduced by thermal cycling1920 ß 2010 WILEY-VCH Verlag GmbH & Co. KGaA, Weinheim Adv. Funct. Mater. 2010, 20,1917–1923
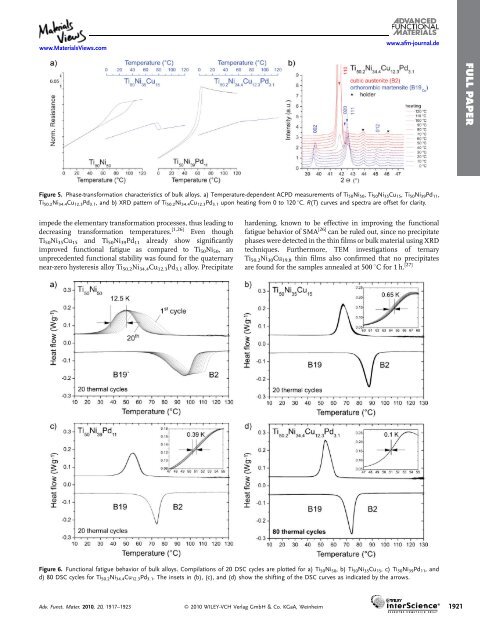
www.MaterialsViews.comwww.afm-journal.deFULL PAPERFigure 5. Phase-transformation characteristics <strong>of</strong> bulk alloys. a) Temperature-dependent ACPD measurements <strong>of</strong> Ti 50 Ni 50 ,Ti 50 Ni 35 Cu 15 ,Ti 50 Ni 39 Pd 11 ,Ti 50.2 Ni 34.4 Cu 12.3 Pd 3.1 , and b) XRD pattern <strong>of</strong> Ti 50.2 Ni 34.4 Cu 12.3 Pd 3.1 upon heating from 0 to 120 8C. R(T) curves and spectra are <strong>of</strong>fset for clarity.impede the elementary transformation processes, thus leading todecreasing transformation temperatures. [1,26] Even thoughTi 50 Ni 35 Cu 15 and Ti 50 Ni 39 Pd 11 already show significantlyimproved functional fatigue as compared to Ti 50 Ni 50 , anunprecedented functional stability was found for the quaternarynear-zero hysteresis alloy Ti 50.2 Ni 34.4 Cu 12.3 Pd 3.1 alloy. Precipitatehardening, known to be effective in improving the functionalfatigue behavior <strong>of</strong> SMA [26] can be ruled out, since no precipitatephases were detected in the thin films or bulk material using XRDtechniques. Furthermore, TEM investigations <strong>of</strong> ternaryTi 50.2 Ni 30 Cu 19.8 thin films also confirmed that no precipitatesare found for the samples annealed at 500 8C for 1 h. [27]Figure 6. Functional fatigue behavior <strong>of</strong> bulk alloys. Compilations <strong>of</strong> 20 DSC cycles are plotted for a) Ti 50 Ni 50 ,b)Ti 50 Ni 35 Cu 15 ,c)Ti 50 Ni 39 Pd 11 , andd) 80 DSC cycles for Ti 50.2 Ni 34.4 Cu 12.3 Pd 3.1 . The insets in (b), (c), and (d) show the shifting <strong>of</strong> the DSC curves as indicated by the arrows.Adv. Funct. Mater. 2010, 20,1917–1923 ß 2010 WILEY-VCH Verlag GmbH & Co. KGaA, Weinheim 1921