LCA Food 2012 in Saint Malo, France! - Manifestations et colloques ...
LCA Food 2012 in Saint Malo, France! - Manifestations et colloques ...
LCA Food 2012 in Saint Malo, France! - Manifestations et colloques ...

Create successful ePaper yourself
Turn your PDF publications into a flip-book with our unique Google optimized e-Paper software.
colloque.<strong>in</strong>ra.fr/lcafood<strong>2012</strong><br />
Proceed<strong>in</strong>gs<br />
8 th International Conference on<br />
Life Cycle Assessment<br />
<strong>in</strong> the Agri-<strong>Food</strong> Sector<br />
October 1-4<br />
<strong>2012</strong><br />
Sa<strong>in</strong>t-<strong>Malo</strong><br />
<strong>France</strong>
colloque.<strong>in</strong>ra.fr/lcafood<strong>2012</strong><br />
Proceed<strong>in</strong>gs<br />
8 th International Conference on<br />
Life Cycle Assessment<br />
<strong>in</strong> the Agri-<strong>Food</strong> Sector<br />
October 1-4, <strong>2012</strong> • Sa<strong>in</strong>t-<strong>Malo</strong>, <strong>France</strong><br />
Editors<br />
Michael S. Corson,<br />
Hayo M.G. van der Werf
Please cite this publication as:<br />
Corson, M.S., van der Werf, H.M.G. (Eds.), <strong>2012</strong>. Proceed<strong>in</strong>gs of the 8 th International Conference<br />
on Life Cycle Assessment <strong>in</strong> the Agri-<strong>Food</strong> Sector (<strong>LCA</strong> <strong>Food</strong> <strong>2012</strong>), 1-4 October <strong>2012</strong>, Sa<strong>in</strong>t<br />
<strong>Malo</strong>, <strong>France</strong>. INRA, Rennes, <strong>France</strong>.<br />
Please cite a paper or abstract <strong>in</strong> this publication as:<br />
Proust, V.L.G.E.M., <strong>2012</strong>. In search of lost time, <strong>in</strong>: Corson, M.S., van der Werf, H.M.G. (Eds.),<br />
Proceed<strong>in</strong>gs of the 8 th International Conference on Life Cycle Assessment <strong>in</strong> the Agri-<strong>Food</strong> Sector<br />
(<strong>LCA</strong> <strong>Food</strong> <strong>2012</strong>), 1-4 October <strong>2012</strong>, Sa<strong>in</strong>t <strong>Malo</strong>, <strong>France</strong>. INRA, Rennes, <strong>France</strong>, p. 20-25.
Table of Contents<br />
Welcome .................................................................................................... ii<br />
Scientific and Organis<strong>in</strong>g Committees ...................................................... iii<br />
Programme Overview ............................................................................... iv<br />
General Information.................................................................................... v<br />
Conference Centre Map ............................................................................ vi<br />
Table of Contents for Sessions................................................................. vii<br />
Oral-Session Papers .................................................................................... 1<br />
Poster-Session Abstracts ......................................................................... 648
Welcome<br />
ii<br />
Soyez les bienvenus à <strong>LCA</strong> <strong>Food</strong> <strong>2012</strong> à Sa<strong>in</strong>t-<strong>Malo</strong>, <strong>France</strong> !<br />
Welcome to <strong>LCA</strong> <strong>Food</strong> <strong>2012</strong> <strong>in</strong> Sa<strong>in</strong>t <strong>Malo</strong>, <strong>France</strong>!<br />
“Towards Susta<strong>in</strong>able <strong>Food</strong> Systems”<br />
The <strong>LCA</strong> FOOD conference series is the world’s premier scientific and technical forum on Life<br />
Cycle Assessment <strong>in</strong> the agri-food sector. We hope that you will f<strong>in</strong>d the conference <strong>in</strong>terest<strong>in</strong>g and<br />
enjoyable and that you will “harvest” new ideas and contacts. Your <strong>in</strong>put to the conference will<br />
contribute to its success.<br />
The previous conferences <strong>in</strong> this series took place <strong>in</strong> Brussels (1996, 1998), Gothenburg (2001, 2007), Horsens<br />
(2003), Zürich (2008) and Bari (2010). This year, for the first time, the conference takes place <strong>in</strong> <strong>France</strong>.<br />
It has been organised by INRA, the French National Institute for Agricultural Research, with the support of<br />
ADEME, the French Environment and Energy Management Agency.<br />
Objectives of the conference<br />
The production, transformation, distribution and consumption of food and dr<strong>in</strong>k contribute strongly to human<br />
prosperity and health. However, the food and agriculture sector also contributes a large part of the environmental<br />
impacts caused by human activities. Because these impacts, <strong>in</strong> particular climate change and biodiversity<br />
loss, need to be reduced urgently, a shift towards susta<strong>in</strong>able food systems is essential.<br />
Over the last two decades the Life Cycle Assessment (<strong>LCA</strong>) m<strong>et</strong>hodology has been developed and applied <strong>in</strong><br />
the agriculture and food sectors to quantify environmental impacts and assist decision mak<strong>in</strong>g. In recent<br />
years, <strong>LCA</strong> <strong>in</strong> the agri-food sector has developed rapidly, <strong>in</strong> particular for susta<strong>in</strong>ability assessments of agricultural<br />
systems and their products, and for guid<strong>in</strong>g consumers toward susta<strong>in</strong>able food-consumption patterns<br />
(e.g., via eco-labell<strong>in</strong>g).<br />
<strong>LCA</strong> <strong>Food</strong> <strong>2012</strong> will serve as a global forum <strong>in</strong> which to share recent developments <strong>in</strong> <strong>LCA</strong> m<strong>et</strong>hodology,<br />
databases and tools, as well as applications of <strong>LCA</strong> to food-production systems and food-consumption patterns.<br />
All of this will contribute, we hope, to achiev<strong>in</strong>g the <strong>2012</strong> conference motto: “Towards Susta<strong>in</strong>able<br />
<strong>Food</strong> Systems”.<br />
From the 362 abstracts submitted, the conference is scheduled to have 121 oral presentations and 183 posters,<br />
and at the time of writ<strong>in</strong>g, we expect more than 420 participants from at least 42 countries. In addition to<br />
this book of abstracts, which conta<strong>in</strong>s 2-page abstracts for most oral presentations and posters, you will f<strong>in</strong>d<br />
6-page papers for most oral presentations, along with the poster abstracts, <strong>in</strong> the conference proceed<strong>in</strong>gs,<br />
provided as a PDF file on the memory stick <strong>in</strong> your conference beach bag.<br />
We want to thank the authors for their presentations and posters. We are very grateful to the 23 members of<br />
our scientific committee for their efforts <strong>in</strong> review<strong>in</strong>g the abstracts and select<strong>in</strong>g the papers for oral presentations.<br />
We warmly thank our sponsors for support<strong>in</strong>g the conference. Last but not least, we want to thank our<br />
<strong>in</strong>defatigable INRA colleagues of the organis<strong>in</strong>g committee for their essential contribution to the success of<br />
the conference.<br />
We hope you will appreciate the scientific and technical content of the conference, contacts with participants,<br />
the French and Br<strong>et</strong>on cuis<strong>in</strong>e dur<strong>in</strong>g the lunches and Gala D<strong>in</strong>ner, and the city of Sa<strong>in</strong>t <strong>Malo</strong> and its seaside.<br />
We are delighted to welcome you to this beautiful region to jo<strong>in</strong> the rapidly grow<strong>in</strong>g <strong>LCA</strong> <strong>Food</strong> community<br />
and hope you will me<strong>et</strong> old friends and make new ones.<br />
Michael Corson Hayo van der Werf<br />
<strong>LCA</strong> <strong>Food</strong> <strong>2012</strong> co-chair <strong>LCA</strong> <strong>Food</strong> <strong>2012</strong> co-chair
<strong>LCA</strong> <strong>Food</strong> <strong>2012</strong> Committees<br />
Scientific Committee<br />
Hayo van der Werf INRA, Rennes, <strong>France</strong> (co-chair)<br />
Michael Corson INRA, Rennes, <strong>France</strong> (co-chair)<br />
Assumpció Anton IRTA, Cabril, Spa<strong>in</strong><br />
Joël Aub<strong>in</strong> INRA, Rennes, <strong>France</strong><br />
Claud<strong>in</strong>e Bass<strong>et</strong>-Mens CIRAD, Montpellier, <strong>France</strong><br />
Cécile Bessou CIRAD, Montpellier, <strong>France</strong><br />
Christel Cederberg SIK, Göteborg, Sweden<br />
Leda Coltro Institute of <strong>Food</strong> Technology, Camp<strong>in</strong>as, Brazil<br />
Imke de Boer WUR, Wagen<strong>in</strong>gen, N<strong>et</strong>herlands<br />
Ulrike Eberle Corsus, Hamburg, Germany<br />
Benoît Gabrielle AgroParisTech, Paris, <strong>France</strong><br />
Geneviève Gesan-Guiziou INRA, Rennes, <strong>France</strong><br />
Jeroen Gu<strong>in</strong>ée CML, University of Leiden, N<strong>et</strong>herlands<br />
Kiyotada Hayashi National Agriculture and <strong>Food</strong> Research Organisation, Tsukuba, Japan<br />
Niels Jungbluth ESU services Ltd., Uster, Switzerland<br />
Llorenç Milà i Canals Unilever, Sharnbrook, United K<strong>in</strong>gdom<br />
Rattanawan Mungkung Kas<strong>et</strong>sart University, Bangkok, Thailand<br />
Thomas Nemecek ART, Zürich, Switzerland<br />
Bruno Notarnicola University of Bari Aldo Moro, Bari, Italy<br />
Brad Ridoutt CSIRO, Melbourne, Australia<br />
Rita Schenk Institute for Environmental Research and Education, Vashon, WA, USA<br />
Ulf Sonesson SIK, Göteborg, Sweden<br />
Marlies Zonderland-Thomassen AgResearch, Hamilton, New Zealand<br />
Organis<strong>in</strong>g Committee<br />
Aurélie Wilfart Thi Tuy<strong>et</strong> Hanh Nguyen<br />
Eric Beaumont Maryvonne Pertué<br />
Sylva<strong>in</strong>e Bitteur Barbara Redl<strong>in</strong>gshöfer<br />
Xiaobo Chen Thibault Salou<br />
Michael Corson Thierry Troch<strong>et</strong><br />
Kar<strong>in</strong>e Derrien Hayo van der Werf<br />
Emmanuelle Garrigues<br />
iii
Programme<br />
Overview<br />
Room color code:<br />
Auditorium<br />
Châteaubriand<br />
Rotonde Surcouf<br />
Amphithéâtre<br />
Maupertuis<br />
<strong>LCA</strong> FOOD <strong>2012</strong><br />
1-4 October <strong>2012</strong> • Sa<strong>in</strong>t <strong>Malo</strong>, <strong>France</strong><br />
PROGRAMME<br />
8<br />
Life Cycle Assessment <strong>in</strong> the Agri-<strong>Food</strong> Sector<br />
th International Conference on<br />
Monday, October 1 st<br />
16:00 - 18:30 Participant arrival and registration<br />
18:30 - 20:30 Welcome reception : cocktail and buff<strong>et</strong><br />
Tuesday, October 2 nd<br />
08:00 - 08:50 Participant arrival<br />
08:50 - 09:10 Open<strong>in</strong>g session<br />
09:10 - 11:10 Keynote session<br />
11:10 - 11:40 Break<br />
11:40 - 13:00 Parallel session 1a Parallel session 1b Parallel session 1c<br />
13:00 - 14:30 Lunch<br />
14:30 - 15:50 Plenary session 1<br />
15:50 - 16:20 Break<br />
16:20 - 16:50 Poster session A<br />
16:50 - 18:30 Parallel session 2a Parallel session 2b Parallel session 2c<br />
Wednesday, October 3 rd<br />
08:30 - 08:50 Open<strong>in</strong>g of the Conference Centre Quantis Workshop<br />
Amphithéâtre Maupertuis<br />
08:50 - 10:30 Plenary session 2<br />
10:30 - 11:00 Break<br />
11:00 - 13:00 Parallel session 3a Parallel session 3b Parallel session 3c<br />
13:00 - 14:30 Lunch<br />
14:30 - 15:50 Plenary session 3: <strong>Food</strong><br />
15:50 - 16:20 Break<br />
16:20 - 16:50 Poster session B<br />
16:50 - 18:30 Parallel session 4a Parallel session 4b Parallel session 4c<br />
19:30 - 24:00 Congress Gala d<strong>in</strong>ner<br />
Thursday, October 4 th<br />
08:30 - 08:50 Open<strong>in</strong>g of the Conference Centre GaBi Workshop<br />
Amphithéâtre Maupertuis<br />
08:50 - 10:30 Parallel session 5a Parallel session 5b<br />
10:30 - 11:00 Break<br />
11:00 - 13:00 Parallel session 6a Parallel session 6b Parallel session 6c<br />
13:00 - 14:30 Lunch<br />
14:30 - 16:10 Parallel session 7a Parallel session 7b Parallel session 7c<br />
16:10 - 16:40 Conference Closure<br />
Friday, October 5 th<br />
08:30 - 14:00 Optional tour of Mont Sa<strong>in</strong>t-Michel or D<strong>in</strong>an/D<strong>in</strong>ard<br />
09:00 - 16:30 3 rd International eco<strong>in</strong>vent Me<strong>et</strong><strong>in</strong>g<br />
iv
GENERAL INFORMATION<br />
8 th International Conference on<br />
Life Cycle Assessment <strong>in</strong> the Agri-<strong>Food</strong> Sector<br />
October 1-4<br />
<strong>2012</strong><br />
Sa<strong>in</strong>t-<strong>Malo</strong><br />
<strong>France</strong>
General Information<br />
8 th International Conference on <strong>LCA</strong> <strong>in</strong> the Agri-<strong>Food</strong> Sector, 1-4 Oct <strong>2012</strong><br />
Conference venue<br />
The conference takes place <strong>in</strong> the Palais du Grand Large, 1 Quai Duguay Trou<strong>in</strong>, 35400 Sa<strong>in</strong>t <strong>Malo</strong>, <strong>France</strong>. Tel. +33 2 99 20 60 20.<br />
Smok<strong>in</strong>g is prohibited <strong>in</strong> the conference centre.<br />
Registration<br />
The registration fees <strong>in</strong>clude:<br />
Admission to all conference sessions, poster sessions and the exhibition area<br />
A conference beach bag, <strong>in</strong>clud<strong>in</strong>g this book of abstracts, your badge, an electronic version of the proceed<strong>in</strong>gs on a memory<br />
stick, the conference programme, a list of participants, a conference mug, and an INRA pen.<br />
Welcome reception: cocktail and buff<strong>et</strong> on 1 October, 18.30 hours<br />
Lunches: 2, 3 and 4 October, 13.00-14.30 hours<br />
Gala D<strong>in</strong>ner: 3 October, 19.30-24.00 hours<br />
Refreshments dur<strong>in</strong>g session breaks<br />
Access to the Quantis and PE International workshops<br />
Upon registration you will receive a badge to be worn dur<strong>in</strong>g the conference.<br />
The Young Researcher Wall<br />
<strong>LCA</strong> <strong>Food</strong> <strong>2012</strong> is happy to offer Ph.D. students and other young researchers an opportunity to connect with research <strong>in</strong>stitutes and<br />
private companies by publish<strong>in</strong>g their CVs on the conference web site as well as dur<strong>in</strong>g the conference on the Young Researcher<br />
Wall, located at the entrance of the Salle du Grand Large (level 1). Research <strong>in</strong>stitutes and private companies can also publish their<br />
job offers on our web site and on the Young Researcher Wall dur<strong>in</strong>g the conference.<br />
Oral presentations<br />
Plenary-session presentations will occur <strong>in</strong> the Auditorium Chateaubriand (level 0). Parallel-session presentations will occur <strong>in</strong> the<br />
Auditorium Chateaubriand and two rooms on level 2: Rotonde Surcouf and Amphithéâtre Maupertuis.<br />
Ideally, presentations should not exceed 15 m<strong>in</strong>utes <strong>in</strong> length; timekeepers will sound a bell to <strong>in</strong>dicate when 2 m<strong>in</strong>utes rema<strong>in</strong>. Any<br />
time rema<strong>in</strong><strong>in</strong>g <strong>in</strong> the presentation slot will be available for questions. Timekeep<strong>in</strong>g will be strict to allow participants to switch<br />
b<strong>et</strong>ween sessions.<br />
For those who have not sent <strong>in</strong> their presentation before the conference, please give it to Thierry Troch<strong>et</strong> <strong>in</strong> the Preview Room <strong>in</strong><br />
Salle Charcot (level 1) the day before the presentation is scheduled.<br />
Poster sessions<br />
Posters should be put up <strong>in</strong> the Salle du Grand Large (level 1) on October 2 b<strong>et</strong>ween 7.00 and 8.50 hours and stay up for the entire<br />
conference. Posters have been grouped accord<strong>in</strong>g to topic. Two poster sessions have been scheduled: session A on 2 October, 16.20-<br />
16.50 hours, and session B on 3 October, 16.20-16.50 hours. Poster authors should stand next to their poster dur<strong>in</strong>g the session <strong>in</strong><br />
which their poster has been scheduled.<br />
Exhibition booths and Breaks<br />
Sponsors have exhibition booths available to present their products and services <strong>in</strong> the Rotonde Jacques Cartier (level 1), where<br />
refreshments will be served dur<strong>in</strong>g morn<strong>in</strong>g and afternoon session breaks.<br />
Lunches and Gala D<strong>in</strong>ner<br />
Lunches will be served from 13.00-14.30 hours <strong>in</strong> the Espace Lammenais (level 3). Special food requirements (veg<strong>et</strong>arian, fish)<br />
expressed dur<strong>in</strong>g onl<strong>in</strong>e registration have been taken <strong>in</strong>to account. Those who registered their desire for a special meal should be sure<br />
to wear their badge dur<strong>in</strong>g the meal so they can be identified by the wait staff. Persons hav<strong>in</strong>g other requirements (e.g. vegan, allergies)<br />
should <strong>in</strong>form wait staff.<br />
The Gala D<strong>in</strong>ner will be served on 3 October from 19.30-24.00 hours <strong>in</strong> the Espace Lammenais.<br />
Intern<strong>et</strong> access<br />
Six computers with Intern<strong>et</strong> access are available <strong>in</strong> the Salle Bouv<strong>et</strong> (level 1). Intern<strong>et</strong> access via wifi is available on levels 1 and 2. A<br />
password is not required.<br />
Cloakroom<br />
On Thursday, 4 October, a staffed cloakroom will be available on level 0 to keep your luggage.<br />
Questions?<br />
The members of our local organis<strong>in</strong>g committee will be happy to answer any questions you may have. They wear pistachio-green Tshirts<br />
with the <strong>LCA</strong> <strong>Food</strong> <strong>2012</strong> logo on the back. In the Salle Charcot (level 1) you will f<strong>in</strong>d conference secr<strong>et</strong>aries Kar<strong>in</strong>e Derrien<br />
and Maryvonne Pertué for adm<strong>in</strong>istrative matters (e.g., attendance certificate).<br />
v
Conference Centre Map<br />
vi<br />
8 th International Conference on <strong>LCA</strong> <strong>in</strong> the Agri-<strong>Food</strong> Sector, 1-4 Oct <strong>2012</strong>
Table of Contents for Sessions<br />
TUESDAY, 2 OCTOBER<br />
8 th International Conference on <strong>LCA</strong> <strong>in</strong> the Agri-<strong>Food</strong> Sector, 1-4 Oct <strong>2012</strong><br />
KEYNOTE SESSION<br />
Susta<strong>in</strong>able food, a component of the green economy<br />
Dom<strong>in</strong>ique Dron .................................................................................................................................................................................................................... 1<br />
Research priorities for susta<strong>in</strong>able agri-food systems and <strong>LCA</strong><br />
Jean-François Soussana ......................................................................................................................................................................................................... 8<br />
Three perspectives on susta<strong>in</strong>able food security: efficiency, demand restra<strong>in</strong>t, food system transformation. What<br />
role for <strong>LCA</strong>?<br />
Tara Garn<strong>et</strong>t.......................................................................................................................................................................................................................... 15<br />
Challenges for <strong>LCA</strong> <strong>in</strong> the agri-food sector, perspectives from Thailand and Southeast Asia<br />
Shabbir H. Gheewala 1,2 ........................................................................................................................................................................................................ 26<br />
The yield performance of organic agriculture<br />
Verena Seufert 1,* , Nav<strong>in</strong> Ramankutty 1 , Jonathan A. Foley 2 .............................................................................................................................................. 31<br />
ENVIFOOD Protocol: launch of the collectively-agreed sectorial m<strong>et</strong>hodology for assess<strong>in</strong>g the environmental<br />
performance of food and dr<strong>in</strong>k products <strong>in</strong> Europe<br />
Camillo De Camillis 1,* , Jean-Christophe Bligny 2 , David Penn<strong>in</strong>gton 1 , Balázs Pályi 3 , Christian Bauer 4 , Urs Schenker 5 , Henry K<strong>in</strong>g 6 , Lars<br />
Lundquist 5 , Nicolas Mart<strong>in</strong> 7 , Nicole Unger 6 , Laura Draucker 8 , Øyv<strong>in</strong>d Vessia 9 , Coen Blomsma 10 , Nathan Pell<strong>et</strong>ier 1 , Hans Blonk 11 , Rudi<br />
Sueys 12 , Anna Papagrigoraki 13 , Pascal Gréverath 14 , Herbert Aich<strong>in</strong>ger 15 , Jean-Pierre Rennaud 16 ................................................................................. 37<br />
PARALLEL SESSION 1A: WATER FOOTPRINT<br />
Water footpr<strong>in</strong>t of pastoral farm<strong>in</strong>g systems <strong>in</strong> New Zealand<br />
Marlies A. Zonderland-Thomassen 1* , Stewart F. Ledgard 1 , Mark Lieffer<strong>in</strong>g 2 ................................................................................................................ 41<br />
Water footpr<strong>in</strong>t account<strong>in</strong>g of organic and non-organic strawberries <strong>in</strong>clud<strong>in</strong>g ancillary materials: a case study<br />
Manzardo Alessandro * , Anna Mazzi, Monia Niero, Sara Toniolo, Antonio Scipioni .................................................................................................... 45<br />
Water footpr<strong>in</strong>t of cradle to farm gate milk production <strong>in</strong> the U.S.<br />
L<strong>in</strong>dsay Lessard 1,* , Samuel Vionn<strong>et</strong> 1 , Jon D<strong>et</strong>tl<strong>in</strong>g 1 , Sebastien Humbert 1 , Andrew Henderson 2 , Olivier Jolli<strong>et</strong> 2 , Y<strong>in</strong>g Wang 3 .................................. 51<br />
Monthly characterisation factors for water consumption and application to temporally explicit cereals <strong>in</strong>ventory<br />
Stephan Pfister * , Julia Baumann ......................................................................................................................................................................................... 56<br />
PARALLEL SESSION 1B: TOWARDS LIFE CYCLE SUSTAINABILITY ASSESSMENT<br />
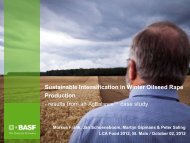
Holistic susta<strong>in</strong>ability assessment of w<strong>in</strong>ter oilseed rape production us<strong>in</strong>g the AgBalance TM m<strong>et</strong>hod – an example<br />
of ‘susta<strong>in</strong>able <strong>in</strong>tensification’?<br />
Markus Frank 1 *, Jan Schöneboom 2 , Martijn Gipmans 3 , P<strong>et</strong>er Sal<strong>in</strong>g 2 ............................................................................................................................ 62<br />
Assessment of exist<strong>in</strong>g and potential cereal food and non food uses by comb<strong>in</strong><strong>in</strong>g E-<strong>LCA</strong> and S-<strong>LCA</strong><br />
Florence Van Stappen 1 * , Alice Delcour 2,4 , Stéphanie Gheysens 3 , Virg<strong>in</strong>ie Decruyenaere 3 , Didier Stilmant 4 , Philippe Burny 2 , Fabienne Rabier 5 ,<br />
Jean-Pierre Goffart 2 ............................................................................................................................................................................................................. 68<br />
Life cycle cost<strong>in</strong>g of farm milk production – cost assessment of carbon footpr<strong>in</strong>t mitigation strategies<br />
Anne C. Assel<strong>in</strong>-Balençon * , Olivier Jolli<strong>et</strong> ........................................................................................................................................................................ 74<br />
Compar<strong>in</strong>g <strong>in</strong>tegral susta<strong>in</strong>ability performance of conventional farms with farms focuss<strong>in</strong>g on <strong>in</strong>ternal recycl<strong>in</strong>g<br />
of nutrients<br />
Mark A. Dolman 1,2,* , Marthijn P.W. Sonneveld 3 , Herman Mollenhorst 2,4 , Imke J.M. de Boer 2 .................................................................................. 80<br />
PARALLEL SESSION 1C: ECODESIGN AND ENVIRONMENTAL MANAGEMENT<br />
Environmental improvement of a chicken product through life cycle assessment m<strong>et</strong>hodology<br />
Guillermo Pardo 1,* , Ascensión Ciruelos 2 , Nuria López 3 , Lorenzo González 4 , Saioa Ramos 1 , Jaime Zufía 1 ................................................................. 86<br />
Product-Oriented Environmental Management System (POEMS) <strong>in</strong> the agri-food sector: ma<strong>in</strong> results of the<br />
EMAF project<br />
Roberta Salomone 1 , Maria Teresa Clasadonte 2 , Maria Proto 3 , Andrea Raggi 4 , Ioannis Arzoumanidis 4 , Giuseppe Ioppolo 1 , Agata Lo Giudice 2 ,<br />
Ornella Malandr<strong>in</strong>o 3 , Agata Matarazzo 2 , Luigia P<strong>et</strong>ti 4 , Giuseppe Saija 1 , Stefania Sup<strong>in</strong>o 3 , Alessandra Zamagni 4 ..................................................... 92<br />
An <strong>LCA</strong> support tool for management of protected horticultural systems<br />
Marta Torrellas 1,* , Assumpció Antón 1 , Marc Ruijs 2 , Nieves García Victoria 2 , Juan Ignacio Montero 1 ........................................................................ 98<br />
PLENARY SESSION 1: FOOD<br />
Environmental impacts of food consumption and its reduction potentials<br />
Niels Jungbluth * , René Itten, Salome Schori ...................................................................................................................................................................104<br />
Gender and di<strong>et</strong>ary recommendations <strong>in</strong> an IO-<strong>LCA</strong> of food consumption <strong>in</strong> Germany<br />
Toni Meier * , Olaf Christen ................................................................................................................................................................................................110<br />
Compar<strong>in</strong>g environmental impacts of end-of-life treatments of food waste<br />
Mischa Zschokke * , Thomas Kägi, Fredy D<strong>in</strong>kel .............................................................................................................................................................116<br />
High nutritional quality is not associated with low greenhouse gas emissions <strong>in</strong> self-selected di<strong>et</strong>s of French adults<br />
Florent Vieux 1 , Louis-Georges Soler 2 , Djilali Touazi 2 , Nicole Darmon 1,* ....................................................................................................................122<br />
vii
viii<br />
8 th International Conference on <strong>LCA</strong> <strong>in</strong> the Agri-<strong>Food</strong> Sector, 1-4 Oct <strong>2012</strong><br />
PARALLEL SESSION 2A: LAND USE<br />
Application of new UNEP/SETAC life cycle <strong>in</strong>itiative m<strong>et</strong>hods for land use impact assessment. Land use impacts<br />
of margar<strong>in</strong>e<br />
Llorenç Milà i Canals * , Giles Rigarlsford, Sarah Sim .....................................................................................................................................................128<br />
Development of an <strong>in</strong>tegrated <strong>in</strong>dicator for land use based on the economic value of ecosystem services<br />
Viêt Cao 1,2,* , Manuele Margni 2 , Basil D. Favis 3 , Louise Deschênes 1 .............................................................................................................................133<br />
Land requirements for food <strong>in</strong> the N<strong>et</strong>herlands, a historical analysis over 200 years<br />
Sander<strong>in</strong>e Nonhebel 1,* , Jan Hessels Miedema 1 , Thomas Kastner 2 ................................................................................................................................138<br />
Organic farm<strong>in</strong>g without fossil fuels – <strong>LCA</strong> of energy self-sufficiency<br />
Cecilia Sundberg 1,* , Marie Kimm<strong>in</strong>g 1 , Åke Nordberg 1,2 , Andras Baky 2 , Per-Anders Hansson 1 ..................................................................................143<br />
Peri-urban expansion: application of consequential <strong>LCA</strong> to assess land for food or hous<strong>in</strong>g<br />
Alison Rothwell 1 , Brad Ridoutt 2 , Girija Page 1 , Bill Bellotti 1 ..........................................................................................................................................149<br />
PARALLEL SESSION 2B: EMISSIONS MODELLING<br />
Soil, climate and cropp<strong>in</strong>g system effects on N2O account<strong>in</strong>g <strong>in</strong> the <strong>LCA</strong> of faba bean and cereals<br />
Pi<strong>et</strong>ro Goglio 1, 2,* , Carol<strong>in</strong>e Colnenne-David 3,4 , Claudia Di Bene 2 , Simona Bosco 2 , Patricia Laville 1 , Roma<strong>in</strong> Roche 1 , Giorgio Ragagl<strong>in</strong>i 2 ,<br />
Thierry Doré 4,3 , Marco Mazzonc<strong>in</strong>i 5,6 , Benoit Gabrielle 1 , Enrico Bonari 2 .....................................................................................................................155<br />
Us<strong>in</strong>g a model-based <strong>LCA</strong> to explore options for reduc<strong>in</strong>g national greenhouse gas emissions from crop and<br />
livestock production systems<br />
Eric Audsley 1,* , Mike Wilk<strong>in</strong>son 2 .....................................................................................................................................................................................161<br />
Improv<strong>in</strong>g estimates of life cycle nitrous oxide emissions from crop-based food products<br />
Jeremy Wiltshire 1,* , Sarah Wynn 1 , Roger Sylvester-Bradley 1 , Daniel K<strong>in</strong>dred 1 , Nigel Mortimer 2 , Anna Evans 2 , Charlotte Hatto 2 , Onesmus<br />
Mwabonje 2 ..........................................................................................................................................................................................................................167<br />
Introduction of a national m<strong>et</strong>hod to estimate direct nitrous oxide emissions from m<strong>in</strong>eral soils for F<strong>in</strong>nish product<br />
carbon footpr<strong>in</strong>t<strong>in</strong>g<br />
Hannele Pulkk<strong>in</strong>en 1, *, Kristi<strong>in</strong>a Reg<strong>in</strong>a 2 , Juha-Matti Katajajuuri 1 .................................................................................................................................173<br />
Modell<strong>in</strong>g N2O emissions from organic fertilisers for <strong>LCA</strong> <strong>in</strong>ventories<br />
Matthias S. Meier * , Christian Schader, Alfred Berner, Andreas Gatt<strong>in</strong>ger....................................................................................................................177<br />
PARALLEL SESSION 2C: QUANTIFICATION AND REDUCTION OF UNCERTAINTY<br />
Susta<strong>in</strong>able meat consumption to me<strong>et</strong> climate and health goals - implications of variations <strong>in</strong> consumption<br />
statistics<br />
El<strong>in</strong>or Hallström * , P. Börjesson ........................................................................................................................................................................................183<br />
Assess<strong>in</strong>g the optimum level of d<strong>et</strong>ail for secondary GHG emissions databases<br />
Ricardo Teixeira * ...............................................................................................................................................................................................................188<br />
A protocol for approach<strong>in</strong>g uncerta<strong>in</strong>ties <strong>in</strong> life cycle <strong>in</strong>ventories<br />
P.J.G Henriksson * , J.B. Gu<strong>in</strong>ée, R. Heijungs, A. de Kon<strong>in</strong>g ..........................................................................................................................................193<br />
Quantify<strong>in</strong>g environmental impacts and their uncerta<strong>in</strong>ties for UK broiler and egg production systems<br />
Ilkka Le<strong>in</strong>onen 1,* , Adrian Williams 2 , Ilias Kyriazakis 1 ...................................................................................................................................................198<br />
Influence of scenario uncerta<strong>in</strong>ty <strong>in</strong> agricultural <strong>in</strong>puts on <strong>LCA</strong> results for agricultural production systems<br />
Kiyotada Hayashi 1,* , Naoki Mak<strong>in</strong>o 2 , Koichi Shobatake 2 , Sh<strong>in</strong>go Hokazono 1 .............................................................................................................204<br />
WEDNESDAY, 3 OCTOBER<br />
PLENARY SESSION 2: METHODOLOGICAL CHALLENGES FOR ANIMAL PRODUCTION SYSTEMS<br />
Us<strong>in</strong>g systems-based <strong>LCA</strong> to <strong>in</strong>vestigate the environmental and economic impacts and benefits of the livestock<br />
sector <strong>in</strong> the UK<br />
Julia Chatterton * , Eric Audsley, Anil Graves, Joe Morris, Adrian Williams .................................................................................................................210<br />
Modell<strong>in</strong>g GHG emissions of dairy cow production systems differ<strong>in</strong>g <strong>in</strong> milk yield and breed – the impact of<br />
uncerta<strong>in</strong>ty<br />
Monika Zeh<strong>et</strong>meier *1 , Markus Gandorfer 2 , Alois Heißenhuber 1 , Imke J.M. de Boer 3 .................................................................................................216<br />
Towards a susta<strong>in</strong>able animal production sector: potential and problems of <strong>LCA</strong><br />
Imke J.M. de Boer * , Cor<strong>in</strong>a E. van Middelaar .................................................................................................................................................................222<br />
Lessons learned from <strong>in</strong>tegrated environmental and socioeconomic life cycle assessments<br />
Jean-Michel Couture 1,* , Julie Parent 2 , Mia Lafonta<strong>in</strong>e 3 , Jean-Pierre Revér<strong>et</strong> 1,2 ............................................................................................................227<br />
Susta<strong>in</strong>ability assessment of U.S. dairy: environmental, economic and social<br />
G<strong>in</strong>a Vickery-Niederman 4 , Greg Thoma 1* , Jennie Popp 2 , Marty Matlock 2 , Cather<strong>in</strong>e Benoît-Norris 3 , David Shonnard 5,6 , Felix Adom 5,6 , Eric<br />
Cumm<strong>in</strong>gs 2 , Zara Niederman 2 ...........................................................................................................................................................................................233<br />
PARALLEL SESSION 3A: LAND USE CHANGE<br />
Bioenergy production from perennial energy crops: a consequential <strong>LCA</strong> of 12 bioenergy cha<strong>in</strong>s <strong>in</strong>clud<strong>in</strong>g land<br />
use changes<br />
Lorie Hamel<strong>in</strong> 1* , Davide Ton<strong>in</strong>i 2 , Thomas Astrup 2 , Henrik Wenzel 1 ............................................................................................................................239<br />
A model of <strong>in</strong>direct land use change<br />
Jannick H Schmidt 1,* , Jürgen Re<strong>in</strong>hard 2 , Bo P Weidema 3 ..............................................................................................................................................245<br />
Land use change - GHG emissions from food and feedstuffs<br />
Stefan Hörtenhuber 1,2,* , Michaela Theurl 1 , Thomas L<strong>in</strong>denthal 1,3 ,Werner Zollitsch 2 ...................................................................................................252
8 th International Conference on <strong>LCA</strong> <strong>in</strong> the Agri-<strong>Food</strong> Sector, 1-4 Oct <strong>2012</strong><br />
<strong>LCA</strong> of sunflower oil address<strong>in</strong>g alternative land use change scenarios and practices<br />
Filipa Figueiredo, Érica Geraldes Castanheira, Fausto Freire * .......................................................................................................................................257<br />
System expansion and allocation <strong>in</strong> the life-cycle GHG assessment of soybean oil<br />
Érica Geraldes Castanheira * , Fausto Freire ......................................................................................................................................................................262<br />
Consider<strong>in</strong>g land use change and soil carbon dynamics <strong>in</strong> an <strong>LCA</strong> of French agricultural products<br />
Thibault Salou 1,2,* , Etienne Mathias 3 , Aurélie Tailleur 4 , Anne Paillier 5 , Hayo M.G. van der Werf 1,2 .........................................................................268<br />
PARALLEL SESSION 3B: PACKAGING<br />
Us<strong>in</strong>g packag<strong>in</strong>g to reduce food environmental impacts for commercial food service: an example<br />
Rita Schenck 1 , Matthew Leighton ....................................................................................................................................................................................274<br />
Recycl<strong>in</strong>g of aseptic milk packag<strong>in</strong>g and reverse logistic cha<strong>in</strong> account<strong>in</strong>g<br />
Anna Lúcia Mourad 1,* , Fernando von Zuben 2 , Eloísa E. Correia Garcia 1 .....................................................................................................................275<br />
A multicriteria analysis for food packag<strong>in</strong>g end-of-life optimisation based on a configurable life cycle assessment<br />
approach<br />
Claude Emma Komly 1 , Cather<strong>in</strong>e Azzaro-Pantel 2 , Anto<strong>in</strong>e Hubert 1 , Alan Jean-Marie 1 , Valérie Archambault 1 .......................................................281<br />
Environmental aspects used for food packag<strong>in</strong>g design and product carbon footpr<strong>in</strong>t assessment<br />
Carlos Naranjo 1,* , Juan Leal 1 , Oscar Agudelo 2 , Aura Ochoa 2 , Octavio Morales 3 , Diana Guevara 4 .............................................................................287<br />
The <strong>in</strong>fluence of packag<strong>in</strong>g attributes on consumer behaviour <strong>in</strong> food-packag<strong>in</strong>g <strong>LCA</strong> studies - a neglected topic<br />
Fredrik Wikström 1 , Helén Williams 1 , Karli Verghese 2 , Stephen Clune 2 .......................................................................................................................291<br />
Comparative <strong>LCA</strong> of fruit and veg<strong>et</strong>able packag<strong>in</strong>g trays<br />
Jean-François Ménard 1,* , Claude Belley 1 , Réjean Samson 1 , Dom<strong>in</strong>ique Maxime 1 , Mathieu Roberge 2 ......................................................................298<br />
PARALLEL SESSION 3C: SHEEP AND DAIRY PRODUCTION SYSTEMS<br />
A systems-<strong>LCA</strong> model of the stratified UK sheep <strong>in</strong>dustry<br />
Adrian Williams * , Eric Audsley, Daniel Sandars ............................................................................................................................................................304<br />
Carbon footpr<strong>in</strong>t of sheep farms <strong>in</strong> <strong>France</strong> and New Zealand and m<strong>et</strong>hodology analysis<br />
Armelle Gac 1 , Stewart Ledgard 2,* , Elise Lor<strong>in</strong>quer 1 , Mark Boyes 2 , André Le Gall 1 ....................................................................................................310<br />
Regionalised land use impact modell<strong>in</strong>g of milk production <strong>in</strong> the U.S.<br />
Rosie Saad 1,* , Dom<strong>in</strong>ique Maxime 2 , Manuele Margni 2 ..................................................................................................................................................315<br />
Greenhouse gas emissions from production of imported and local cattle feed<br />
Lisb<strong>et</strong>h Mogensen * , Troels Kristensen, Thu Lan T. Nguyen, Marie T. Knudsen .........................................................................................................321<br />
Environmental life cycle assessment of milk <strong>in</strong> Canada<br />
Mia Lafonta<strong>in</strong>e 1,* , Rosie Saad 1 , Diane Gilbert 2 , Manuele Margni 3 ................................................................................................................................327<br />
Quantification of the reduction potential of GHG mitigation measures <strong>in</strong> Swiss organic milk production us<strong>in</strong>g a<br />
life cycle assessment approach<br />
Christian Schader 1,* , Katja Jud 1,2 , Matthias S. Meier 1,* , Till Kuhn 1,3 , Bernad<strong>et</strong>te Oehen 1 , Andreas Gatt<strong>in</strong>ger 1 ..........................................................333<br />
PLENARY SESSION 3: METHODS FOR BIODIVERSITY AND SOIL QUALITY<br />
Produce beef or biodiversity? The trade-offs b<strong>et</strong>ween <strong>in</strong>tensive and extensive beef fatten<strong>in</strong>g<br />
Thomas Nemecek*, Frank Hayer, Mart<strong>in</strong>a Alig, Philippe Jeanner<strong>et</strong>, Gérard Gaillard.................................................................................................338<br />
Assess<strong>in</strong>g land use impacts on biodiversity on a regional scale: the case of crop production <strong>in</strong> Kenya<br />
Laura de Baan 1* , Michael Curran 2 , Stefanie Hellweg 2 , Thomas Koellner 3 ....................................................................................................................340<br />
Modell<strong>in</strong>g effects of river water withdrawals on aquatic biodiversity <strong>in</strong> LCIA<br />
Danielle Tendall 1,2,* , Stephan Pfister 2 , Stefanie Hellweg 2 , Gérard Gaillard 1 .................................................................................................................346<br />
Soil-quality <strong>in</strong>dicators <strong>in</strong> <strong>LCA</strong>: m<strong>et</strong>hod presentation with a case study<br />
Emmanuelle Garrigues 1,2,* , Michael S. Corson 1,2 , Christian Walter 2,1 , Denis A. Angers 3 , Hayo van der Werf 1,2 .......................................................347<br />
PARALLEL SESSION 4A: CARBON FOOTPRINT<br />
F<strong>in</strong>nish consumer understand<strong>in</strong>g of carbon footpr<strong>in</strong>t<strong>in</strong>g and food product labell<strong>in</strong>g<br />
Hanna Hartika<strong>in</strong>en * , Juha-Matti Katajajuuri, Hannele Pulkk<strong>in</strong>en, Taneli Ro<strong>in</strong><strong>in</strong>en .....................................................................................................353<br />
Application of PAS 2050-1 supplementary requirements for horticultural products: carbon footpr<strong>in</strong>t of pumpk<strong>in</strong><br />
and asparagus<br />
Michael Blanke * , Florian Schaefer ...................................................................................................................................................................................357<br />
Environmental and nutritional assessment of Br<strong>et</strong>on pâté production<br />
Anne Himeno, Lori Gustavus, Ricardo Teixeira * ............................................................................................................................................................362<br />
Estimat<strong>in</strong>g carbon footpr<strong>in</strong>ts of <strong>in</strong>dividual crops <strong>in</strong> organic arable crop rotations<br />
Marie Trydeman Knudsen 1* , John E. Hermansen 1 , Jørgen E. Olesen 1 , Andreas Meyer-Aurich 2 , Ngonidzashe Chir<strong>in</strong>da 1 ........................................368<br />
The carbon footpr<strong>in</strong>t of Brazilian canary melon<br />
Maria Cléa Brito de Figueirêdo 1,* , Imke J.M. de Boer 2 , Carolien Kroeze 3 , José Pott<strong>in</strong>g 3 , Viviane da Silva Barros 1 , Fernando Aragão 1 , Rubens<br />
Sonsol Gondim 1 .................................................................................................................................................................................................................373<br />
PARALLEL SESSION 4B: DIET<br />
Nutrient based functional unit for meals<br />
Thomas Kägi * , Mischa Zschokke, Fredy D<strong>in</strong>kel .............................................................................................................................................................378<br />
Carbon footpr<strong>in</strong>t of organic vs. conventional food consumption <strong>in</strong> <strong>France</strong><br />
Noëllie Oud<strong>et</strong> * , Perr<strong>in</strong>e Lavelle, Grégoire Thonier, Maxime Pousse, Eric Labouze ....................................................................................................383<br />
Nutrition <strong>in</strong> <strong>LCA</strong>: Are nutrition <strong>in</strong>dexes worth us<strong>in</strong>g?<br />
Merja Saar<strong>in</strong>en ...................................................................................................................................................................................................................389<br />
ix
x<br />
8 th International Conference on <strong>LCA</strong> <strong>in</strong> the Agri-<strong>Food</strong> Sector, 1-4 Oct <strong>2012</strong><br />
Compar<strong>in</strong>g the environmental impact of human di<strong>et</strong>s vary<strong>in</strong>g <strong>in</strong> amount of animal-source food – the impact of<br />
account<strong>in</strong>g for nutritional quality<br />
Heleen R.J. van Kernebeek * , Simon J. Oost<strong>in</strong>g, Imke J.M. de Boer ..............................................................................................................................395<br />
A novel nutrition-based functional equivalency m<strong>et</strong>ric for comparative life cycle assessment of food<br />
Mart<strong>in</strong> C. Heller * , Gregory A. Keoleian...........................................................................................................................................................................401<br />
PARALLEL SESSION 4C: CROP PRODUCTION SYSTEMS<br />
State of the art of <strong>LCA</strong> application <strong>in</strong> the fruit sector<br />
Alessandro K. Cerutti 1 , Simona Bosco 2 , Gabriele L. Beccaro 1 , Cristiana Peano 1 , Bruno Notarnicola 3 , Giancarlo Bounous 1 ...................................407<br />
An LCIA-based typology for more representative results and ref<strong>in</strong>ed data collection of a horticultural cropp<strong>in</strong>g<br />
system <strong>in</strong> the Tropics. The case of tomato production <strong>in</strong> Ben<strong>in</strong>, West Africa<br />
Aurélie Perr<strong>in</strong> 1,* , Claud<strong>in</strong>e Bass<strong>et</strong>-Mens 1 , Wilfried Yehouessi 2 , Joel Huat 1 , Benoit Gabrielle 3 ..................................................................................413<br />
French agricultural practices traceability system employed for environmental assessment<br />
Paul<strong>in</strong>e Maupu 1 ,,Amand<strong>in</strong>e Berthoud 1 , Ophélie Negri 1 , Edith Mart<strong>in</strong> 2 , Seheno Ratsimbazafy 2 , Noëllie Oud<strong>et</strong> 2 , Anto<strong>in</strong>e Poupart 1 .....................419<br />
<strong>LCA</strong> of starch potato from field to starch production plant gate<br />
Godard Carol<strong>in</strong>e 1,* , Boissy Joachim 1 , Sur<strong>et</strong> Camille 1 , Gabrielle Benoît 2 ......................................................................................................................425<br />
THURSDAY, 4 OCTOBER<br />
PARALLEL SESSION 5A: FOOD LABELLING<br />
Barilla EPD Process System to <strong>in</strong>crease reliability, comparability and communicability of <strong>LCA</strong> studies<br />
Luca Ru<strong>in</strong>i 1 , Laura Marchelli 1 , Massimo Mar<strong>in</strong>o 2 , Assunta Filar<strong>et</strong>o 2,* ..........................................................................................................................431<br />
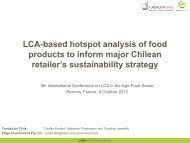
<strong>LCA</strong>-based hotspot analysis of food products to <strong>in</strong>form a major Chilean r<strong>et</strong>ailer’s susta<strong>in</strong>ability strategy<br />
Jonas Bengtsson, 1 Cristián Emhart, 2 Alejandro Florenzano, 2* Laura Guccione, 1 Carol<strong>in</strong>a Jaramillo 2 ........................................................................437<br />
Implementation by a large-scale r<strong>et</strong>ailer of a multi-criteria environmental labell<strong>in</strong>g for food products: the Cas<strong>in</strong>o<br />
Environmental Index<br />
Marion Sarteel * , Frédéric Croison, Bérénice Harfouf-Ponthus, Olivier Jan 1 , Eric Labouze ........................................................................................443<br />
Fateful and faithful: the success factors of eco-labell<strong>in</strong>g<br />
Flora D’Souza * , Alexander Liedke, Sab<strong>in</strong>e Deiml<strong>in</strong>g .....................................................................................................................................................449<br />
Carbon footpr<strong>in</strong>t<strong>in</strong>g and labell<strong>in</strong>g of agri-food products: practical issues for the development of Product Category<br />
Rules<br />
Rattanawan Mungkung 1,* , Shabbir H. Gheewala 2,3 .........................................................................................................................................................451<br />
PARALLEL SESSION 5B: METHODOLOGICAL CHALLENGES FOR CROP PRODUCTION SYSTEMS<br />
Characteris<strong>in</strong>g pesticide residues and related health impacts <strong>in</strong> LCIA<br />
Ronnie Juraske 1 , P<strong>et</strong>er Fantke 2 , Assumpció Antón 3 , Eva Sevigné Itoiz 3 , Olivier Jolli<strong>et</strong> 4,5 ..........................................................................................457<br />
Bridg<strong>in</strong>g the gap b<strong>et</strong>ween LCI and LCIA for toxicological assessments of pesticides used <strong>in</strong> crop production:<br />
application to banana grow<strong>in</strong>g<br />
Rosalie van Zelm 1 , Pyrene Larrey-Lassalle 2,* , Philippe Roux 2 .......................................................................................................................................459<br />
Allocation challenges <strong>in</strong> agricultural life cycle assessments and the Cereal Unit allocation procedure as a potential<br />
solution<br />
Gerhard Brankatschk * , Matthias F<strong>in</strong>kbe<strong>in</strong>er ....................................................................................................................................................................461<br />
<strong>LCA</strong> applied to pea-wheat <strong>in</strong>tercrops: the significance of allocation<br />
Christophe Naud<strong>in</strong> 1* , Hayo van der Werf 2,3 , Marie-Hélène Jeuffroy 4 , Guénaëlle Corre-Hellou 1 ................................................................................466<br />
Life cycle assessment at the regional scale: <strong>in</strong>novative <strong>in</strong>sights based on the systems approach used for uncerta<strong>in</strong>ty<br />
characterisation<br />
Ludiv<strong>in</strong>e Pradeleix 1,* , Véronique Bellon Maurel 2 , Philippe Roux 2 , Olivier Philippon 3 , Sami Bouarfa 1 .....................................................................472<br />
PARALLEL SESSION 6A: TOOLS AND DATABASES<br />
Generic model for calculat<strong>in</strong>g carbon footpr<strong>in</strong>t of milk - applied to Denmark and Sweden<br />
Randi Dalgaard 1,* , Anna Flysjö 2 , Jannick Schmidt 1 ........................................................................................................................................................478<br />
LCI-datas<strong>et</strong> gap bridg<strong>in</strong>g strategies <strong>in</strong> the program Agri-BALYSE<br />
P<strong>et</strong>er Koch 1,* , Gérard Gaillard 1 , Thibault Salou 2,3 Anne Paillier 4 ...................................................................................................................................484<br />
Cradle to gate life cycle <strong>in</strong>ventory and impact assessment of glyphosate<br />
Evan Griff<strong>in</strong>g 1,* , Kiyotada Hayashi 2 , Michael Overcash 1 ..............................................................................................................................................486<br />
GHG assessment for agriculture and forestry sectors: review of landscape calculators<br />
V<strong>in</strong>cent Colomb 1,* , Louis Bockel 2 , Jean-Luc Chotte 1 , Sarah Mart<strong>in</strong> 3 , Marianne T<strong>in</strong>lot, Ophélie Touchemoul<strong>in</strong>, Martial Bernoux 1,* .....................492<br />
Management and reduction of on-farm GHG emissions us<strong>in</strong>g the ‘Cool Farm Tool’: a case study on field tomato<br />
production<br />
Emma Keller 1,2,* , Jaqi Lee 1 , Roland Clift 1 , Llorenç Milà i Canals 2 , Henry K<strong>in</strong>g 2 , Jon Hillier 3 ...................................................................................497<br />
PalmGHG, the RSPO greenhouse gas calculator for oil palm products<br />
C. Bessou 1 , L. Chase 2 , I. Henson 3 , A.F.N. Abdul-Manan 4 , L. Milà i Canals 5 , F. Agus 6 , M. Sharma 7 .........................................................................498<br />
PARALLEL SESSION 6B: FISHIERIES, SOIL, AND EMERGY METHODS<br />
Review and future perspectives <strong>in</strong> the environmental assessment of seafood production systems<br />
Ian Vázquez-Rowe 1,2,* , Almudena Hospido 1 , María Teresa Moreira 1 , Gumers<strong>in</strong>do Feijoo 1 ........................................................................................505<br />
Overfish<strong>in</strong>g, overfishedness and wasted potential yield: new impact categories for biotic resources <strong>in</strong> <strong>LCA</strong><br />
Andreas Emanuelsson 1,2,* , Friederike Ziegler 1 , Leif Pihl 2 , Mattias Sköld 3 , Ulf Sonesson 1 ..........................................................................................511
8 th International Conference on <strong>LCA</strong> <strong>in</strong> the Agri-<strong>Food</strong> Sector, 1-4 Oct <strong>2012</strong><br />
Biotic resources extraction impact assessment <strong>in</strong> <strong>LCA</strong> of fisheries<br />
Juli<strong>et</strong>te Langlois 1,2* , Pierre Fréon 3 , Jean-Philippe Delgenes 2 , Jean-Philippe Steyer 2 , Arnaud Hélias 1,2 .......................................................................517<br />
Regionalised m<strong>et</strong>hod to assess soil erosion <strong>in</strong> <strong>LCA</strong><br />
Montse Núñez 1,2,* , Assumpció Antón 1,3 , Pere Muñoz 1 , Joan Rieradevall 4 .....................................................................................................................523<br />
The effect of crop management on soil organic matter <strong>in</strong> the carbon footpr<strong>in</strong>t of agricultural products<br />
Simona Bosco * , Claudia Di Bene, Enrico Bonari ............................................................................................................................................................528<br />
Life cycle assessment and eMergy application to the comparison b<strong>et</strong>ween organic and conventional productions<br />
Elena Neri 1,* , <strong>France</strong>sca Ross<strong>et</strong>ti 1 , Bened<strong>et</strong>to Rugani 2 , Federico M. Pulselli 3 , Valent<strong>in</strong>a Niccolucci 3 , Simone Bastianoni 1 , Nadia March<strong>et</strong>t<strong>in</strong>i 3 ...534<br />
PARALLEL SESSION 6C: POULTRY AND PORK PRODUCTION SYSTEMS<br />
Assessment of digestibility improv<strong>in</strong>g enzymes potential to reduce greenhouse gas emissions <strong>in</strong> broiler production<br />
Anja Marie Bundgaard 1,* , Randi Dalgaard 2 , Mikkel Thrane 3 , Trakarn Prapaspongsa 1,4 ...............................................................................................540<br />
Comparison of two production scenarios of chickens consumed <strong>in</strong> <strong>France</strong><br />
Vamilson Prudêncio da Silva Junior 1,* , Edivan Cherub<strong>in</strong>i 2 , Sebastião Roberto Soares 2 ..............................................................................................546<br />
Effect of <strong>et</strong>hics on <strong>in</strong>tegral ecological impact of organic eggs<br />
S.E.M. Dekker 1 , I.J.M. de Boer 2 , A.J.A. Aarn<strong>in</strong>k 3 , P.W.G., Groot Koerkamp 1 ............................................................................................................552<br />
Environmental impacts of different pork and chicken meat production systems <strong>in</strong> Switzerland and selected import<br />
sources<br />
Florian Grandl * , Mart<strong>in</strong>a Alig, Johanna Mieleitner, Thomas Nemecek, Gérard Gaillard ............................................................................................554<br />
Evaluation of the environmental susta<strong>in</strong>ability of different European pig production systems us<strong>in</strong>g life cycle<br />
assessment<br />
J.Y. Dourmad 1,2, *, J. Ryschawy 1,2 , T. Trousson 1,2 , M. Bonneau 1,2 , J. Gonzalez 3 , H.W.J. Houwers 4 , M. Hviid 5 , C. Zimmer 6 , T.L.T. Nguyen 7 , L.<br />
Morgensen 7 .........................................................................................................................................................................................................................560<br />
Life cycle assessment of pig slurry treatment technologies<br />
M. ten Hoeve 1,* , S. Bruun 1 , L.S. Jensen 1 , N.J. Hutch<strong>in</strong>gs 2 , R. Jensen 2 ..........................................................................................................................566<br />
PARALLEL SESSION 7A: CONSUMERS<br />
Communication of <strong>LCA</strong> results <strong>in</strong> the French environmental experimentation context: user-friendly web-based<br />
tool for the case of coffee<br />
Simone Pedrazz<strong>in</strong>i 1,* , Carole Dubois 1 , Raphael Halloran 1 , Christophe Porté 1 , Sandi Northey 2 , Urs Schenker 3 , Sebastien Humbert 1 ......................572<br />
<strong>Food</strong> labell<strong>in</strong>g from a consumers’ perspective<br />
Ulrike Eberle ......................................................................................................................................................................................................................576<br />
Communicat<strong>in</strong>g <strong>LCA</strong> results to the <strong>in</strong>terested consumer - development of a criteria-based meat guide<br />
El<strong>in</strong> Röös ............................................................................................................................................................................................................................581<br />
Life cycle impacts of prote<strong>in</strong>-rich foods for consumer <strong>in</strong>formation. How <strong>LCA</strong> results can be presented to<br />
consumers to make environmentally susta<strong>in</strong>able supermark<strong>et</strong> choices<br />
Marieke Head, Maartje Sevenster, Bart Krutwagen*, Harry Croezen ...........................................................................................................................587<br />
Environmental impact of different broiler production systems <strong>in</strong> Malaysia and consumer will<strong>in</strong>gness to pay for<br />
reduced impact<br />
Noraisah Spahat * , Jonathan H. Guy, Ilias Kyriazakis, Guy Garrod, Sandra A. Edwards .............................................................................................592<br />
PARALLEL SESSION 7B: BEEF PRODUCTION SYSTEMS<br />
Environmental impacts accompany<strong>in</strong>g the production of milk, bov<strong>in</strong>e meat and gra<strong>in</strong> under h<strong>et</strong>erogeneous<br />
conditions <strong>in</strong> Norway<br />
Anne-Gr<strong>et</strong>e Roer 1,* , Audun Korsa<strong>et</strong>h 2 , Astrid Johansen 3 , Anne Kjersti Bakken 3 , Krist<strong>in</strong> Daugstad 4 , Gustav Fystro 4 , Trond Maukon<br />
Henriksen 2 , Anders Hammer Strømman 1 .........................................................................................................................................................................598<br />
Assess<strong>in</strong>g carbon, water and land use footpr<strong>in</strong>ts for beef cattle production <strong>in</strong> southern Australia<br />
Bradley G Ridoutt 1,* , Girija Page 2 , Kimberley Opie 3 , J<strong>in</strong>g Huang 4 , William Bellotti 2 .................................................................................................599<br />
Effect of farm<strong>in</strong>g practices for greenhouse gas mitigation and subsequent alternative land-use on environmental<br />
impacts of beef-cattle production systems<br />
T.T.H. Nguyen 1,2,3,4,* , M. Doreau 1 , M. Eugène 1 , M.S. Corson 2,3 , F. Garcia-Launay 1,3,5 , G. Chesneau 4 , H.M.G. van der Werf 2,3 ..............................605<br />
An assessment of greenhouse gas emissions and economics of grass based suckler beef production systems<br />
Anne-Marie Clarke 1 , Paul Crosson 1,* , Padraig Brennan 2 ................................................................................................................................................611<br />
Could cultured meat reduce environmental impact of agriculture <strong>in</strong> Europe?<br />
Hanna L. Tuomisto 1,* , Avijit G. Roy 2 ...............................................................................................................................................................................615<br />
PARALLEL SESSION 7C: FOOD CHAIN AND FOOD WASTE<br />
The environmental effects of seasonal food purchase: a case study<br />
Chris Foster 1* , Mark Holmes 2 , Jeremy Wiltshire 2 , Sarah Wynn 2 ...................................................................................................................................620<br />
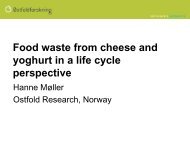
<strong>Food</strong> waste from cheese and yoghurt <strong>in</strong> a life cycle perspective<br />
Hanne Møller * , Vibeke Schakenda, Ole Jørgen Hanssen................................................................................................................................................626<br />
<strong>Food</strong> waste <strong>in</strong> the food cha<strong>in</strong> and related climate impacts<br />
Juha-Matti Katajajuuri*, Kirsi Silvenno<strong>in</strong>en, Hanna Hartika<strong>in</strong>en, Lotta Jalkanen, H<strong>et</strong>a-Kaisa Koivupuro, Anu Re<strong>in</strong>ika<strong>in</strong>en .................................631<br />
Product energy use with<strong>in</strong> the agri-food supply cha<strong>in</strong><br />
Carla Sarrouy 1,* , Joe Davidson 2 , Rob Lillywhite 1 ............................................................................................................................................................637<br />
Comparison of the life cycle impacts of ready-made and home-made meals<br />
Ximena Schmidt Rivera, Namy Esp<strong>in</strong>oza Orias, Adisa Azapagic * ................................................................................................................................643<br />
xi
xii<br />
8 th International Conference on <strong>LCA</strong> <strong>in</strong> the Agri-<strong>Food</strong> Sector, 1-4 Oct <strong>2012</strong><br />
POSTER SESSION A - TUESDAY, 2 OCTOBER, 16.20-16.50<br />
GROUP 1, SESSION A: ANIMAL PRODUCTION SYSTEMS<br />
1. Coupl<strong>in</strong>g <strong>LCA</strong> and GIS for the assessment of greenhouse gas emissions from global livestock production<br />
Alessandra Falcucci 1,* , Giuseppe Tempio 1 , Michael Macleod 1 , Carolyn Opio 1 , Theun Vell<strong>in</strong>ga 2 , Pierre Gerber 1 ....................................................648<br />
2. Comb<strong>in</strong>ed mass and economic allocation<br />
Erik Svanes .........................................................................................................................................................................................................................649<br />
3. Animal- and environmentally friendly beef production: a conflict?<br />
Mart<strong>in</strong>a Alig * , Florian Grandl, Johanna Mieleitner, Thomas Nemecek, Gérard Gaillard ............................................................................................650<br />
4. Allocation procedures <strong>in</strong> the beef life cycle assessment<br />
Claudio Mazz<strong>in</strong>i 1 , Nicola Br<strong>in</strong>a 1 , Sara Daga 1 , Fabrizio Boeri 2 , Massimo Mar<strong>in</strong>o 2 ,Sonia Pignatelli 2,* ........................................................................652<br />
5. Evaluation of the environmental impact of Belgian beef production systems through life cycle assessment<br />
m<strong>et</strong>hodology<br />
Loriers Astrid 1,* , Mathot Michael 2 , Stilmant Didier 2 .......................................................................................................................................................654<br />
6. Life cycle assessment on dairy and beef cattle farms <strong>in</strong> <strong>France</strong><br />
Jean Baptiste Dollé 1,* , Armelle Gac 2 , V<strong>in</strong>cent Manneville 3 , S<strong>in</strong>dy Moreau 4 , Elise Lor<strong>in</strong>quer 2 ...................................................................................655<br />
7. Life cycle assessment of four fatten<strong>in</strong>g calves systems <strong>in</strong> Spa<strong>in</strong><br />
Sandra Lartategui Arias 1,* , José Soler Rovira 2 .................................................................................................................................................................657<br />
8. Environmental impact of beef – role of slaughter<strong>in</strong>g, meat process<strong>in</strong>g and transport<br />
Johanna Mieleitner * , Mart<strong>in</strong>a Alig, Florian Grandl, Thomas Nemecek, Gérard Gaillard ............................................................................................659<br />
9. Life cycle assessment of Mediterranean buffalo milk<br />
Giacomo Pirlo 1 , Sara Carè 1 , Valent<strong>in</strong>a Fant<strong>in</strong> 2,* , <strong>France</strong>sca Falconi 3 , Patrizia Buttol 2 , Giusepp<strong>in</strong>a Terzano 4 , Paolo Masoni 2 .................................661<br />
10. Life cycle assessment of milk production <strong>in</strong> Italian <strong>in</strong>tensive dairy farms<br />
Matteo Guerci, Maddalena Zucali * , Anna Sandrucci, Alberto Tambur<strong>in</strong>i, Chiara Penati, Luciana Bava ...................................................................663<br />
11. Milk and meat biophysical allocation <strong>in</strong> dairy farms<br />
Jean Baptiste Dollé 1,* , Armelle Gac 2 ................................................................................................................................................................................665<br />
12. Functional unit and reference flow <strong>in</strong> the dairy cow <strong>LCA</strong><br />
Chun-Youl Baek 1 , Kun-Mo Lee 1,* , Kyu-Hyun Park 2 ......................................................................................................................................................667<br />
13. L<strong>in</strong>k<strong>in</strong>g environmental impact of milk production to the territory: the Qualaiter project<br />
Michaël Mathot 1,* , Michael S. Corson 2,3 , Didier Stilmant 1 .............................................................................................................................................668<br />
14. A matrix approach to spatialise impacts of US milk production<br />
Anne Assel<strong>in</strong>-Balençon 1,* , Andrew Henderson 1 , Marty Heller 1,3 , L<strong>in</strong>dsay Lessard 2 , Samuel Vionn<strong>et</strong> 2 , Sebastien Humbert 2 , Rosie Saad 4 ,<br />
Manuele Margni 4 , Greg Thoma 5 , Marty Matlock 6 , Olivier Jolli<strong>et</strong> 1 ................................................................................................................................669<br />
15. Environmental and socioeconomic references of French conventional pig systems<br />
Sandr<strong>in</strong>e Espagnol 1,* , Alexandre Rugani 1 , Christ<strong>in</strong>e Baratte 2 , Christ<strong>in</strong>e Rogu<strong>et</strong> 1 , Michel Marcon 1 , Aurélie Tailleur 5 , Cyrille Rigolot 2 , Jean-<br />
Yves Dourmad 3,4 ................................................................................................................................................................................................................671<br />
16. Environmental impact of the pork supply cha<strong>in</strong> depend<strong>in</strong>g on farm performances<br />
Karol<strong>in</strong>e Reckmann * , Joachim Kri<strong>et</strong>er .............................................................................................................................................................................673<br />
17. Characterisation of the pig systems panel for the production of environmental data <strong>in</strong> the program Agri-<br />
BALYSE<br />
Sandr<strong>in</strong>e Espagnol 1,* , Thibault Salou 2,3 , Hayo van der Werf 2,3 .......................................................................................................................................675<br />
18. Life cycle th<strong>in</strong>k<strong>in</strong>g applied to an immunological product (vacc<strong>in</strong>e) used for boar ta<strong>in</strong>t control <strong>in</strong> male pigs<br />
Paulo Moraes 1 , Jim Allison 1 , Joseph A. Rob<strong>in</strong>son 1 , Stéphan Mart<strong>in</strong> 1 , Gian Luca Baldo 2 , Paola Borla 2 .....................................................................676<br />
19. Emergy and life-cycle susta<strong>in</strong>ability of pig meat products<br />
Bened<strong>et</strong>to Rugani 1,* , Elena Neri 2 , Valent<strong>in</strong>a Niccolucci 3 , Federico M. Pulselli 3 , Simone Bastianoni 2 .......................................................................678<br />
20. Life cycle assessment of an <strong>in</strong>tensive Iberian pig farm<br />
Joel Gonzàlez * , Aitana Santamaria, Emma Fàbrega, Joan Tibau, Assumpció Antón ...................................................................................................680<br />
21. Comparison of environmental impacts of corn or sorghum as geese feed <strong>in</strong> foie gras production<br />
Julien Arroyo 1,3 , Laurence Fortun-Lamothe 1,* , Ala<strong>in</strong> Auvergne 1 , Jean-Pierre Dubois 3 , Joël Aub<strong>in</strong> 2 ..........................................................................682<br />
22. Nitrogen content allocation to handle co-products <strong>in</strong> livestock systems – case study on a poultry supply cha<strong>in</strong><br />
Alexandre Thevenot 1,* , Jonathan Vayssières 2 , Joel Aub<strong>in</strong> 3 , Emmanuel Tillard 1 ...........................................................................................................683<br />
23. Influence of allocation m<strong>et</strong>hods and system boundaries <strong>in</strong> <strong>LCA</strong> of broiler production<br />
Edivan Cherub<strong>in</strong>i 1,* , Vamilson Prudêncio da Silva Junior 2 , Sebastião Roberto Soares 1 , Marco Antônio Santos 3 .....................................................685<br />
24. Reduction of GHG emissions from broilers fed a phytogenic additive<br />
Stefan Hörtenhuber 1,2,* , Mart<strong>in</strong> Veit 3 ................................................................................................................................................................................687<br />
25. Allocation b<strong>et</strong>ween high value co-products from livestock: a case study from Australian sheep production<br />
Stephen Wiedemann ..........................................................................................................................................................................................................689<br />
26. How to decrease farmed fish environmental burdens through feed formulation and feed<strong>in</strong>g management<br />
Assunta Filar<strong>et</strong>o 1,* , Massimo Mar<strong>in</strong>o 1 , Umberto Luzzana 2 , Sonia Pignatelli 1 ...............................................................................................................691<br />
27. A multi-scale m<strong>et</strong>hod for assess<strong>in</strong>g ecological <strong>in</strong>tensification <strong>in</strong> aquaculture systems<br />
Aurélie Wilfart 1,2,* , Jéhane Prudhomme 1,2,3 , Jean-Paul Blanch<strong>et</strong>on 3 , Joël Aub<strong>in</strong> 1,2 .......................................................................................................693<br />
28. A participatory approach framework to <strong>in</strong>tegrate social aspects <strong>in</strong> <strong>LCA</strong>: the case of aquaculture systems<br />
Syndhia Mathé 1,* , Joël Aub<strong>in</strong> 2 , Aurélie Wilfart 2 , Hélène Rey-Val<strong>et</strong>te 3 , Myriam Callier 4 , Jean-Paul Blanch<strong>et</strong>on 4 ....................................................695
8 th International Conference on <strong>LCA</strong> <strong>in</strong> the Agri-<strong>Food</strong> Sector, 1-4 Oct <strong>2012</strong><br />
29. Compar<strong>in</strong>g environmental impacts of wild-caught and farmed fish products - a review of life cycle<br />
assessments<br />
E.A. Groen * , T.C. Vi<strong>et</strong>s, E.A.M. Bokkers, I.J.M. De Boer .............................................................................................................................................697<br />
30. Environmental consequences of gen<strong>et</strong>ic improvement by selective breed<strong>in</strong>g: a gilthead sea bream aquaculture<br />
case study<br />
Joël Aub<strong>in</strong> 1,2,* , Ivone Acosta Alba 1,2 , Pierrick Haffray 3 , Jérôme Bugeon 4 , Marc Vandeputte 5,6 ..................................................................................699<br />
31. Environmental assessment of trout production <strong>in</strong> <strong>France</strong>: <strong>in</strong>fluence of practices and production goals<br />
Joël Aub<strong>in</strong> 1,2,* , Elisab<strong>et</strong>h Samson 1,2,3 , Aurélien Tocqueville 4 .........................................................................................................................................700<br />
32. <strong>LCA</strong> of locally produced feeds for Peruvian aquaculture<br />
Angel Avadí 1,* , Pierre Fréon 2 , Jesús Núñez 3 , Camilo Cuba 4 ..........................................................................................................................................701<br />
33. A framework for susta<strong>in</strong>ability comparison of seafood supply cha<strong>in</strong>s<br />
Angel Avadí 1,* , Pierre Fréon 2 ............................................................................................................................................................................................703<br />
34. <strong>LCA</strong> of F<strong>in</strong>nish ra<strong>in</strong>bow trout, results and significance on different allocation m<strong>et</strong>hods<br />
Frans Silvenius 1,* , Juha Grönroos 2 , Hanna Hartika<strong>in</strong>en 1, , Sirpa Kurppa 1, , Markus Kanka<strong>in</strong>en 3 , Timo Mäk<strong>in</strong>en 3 , Raija Tahvonen 1, , Jouni<br />
Vielma 3 ...............................................................................................................................................................................................................................705<br />
35. Ma<strong>in</strong>stream<strong>in</strong>g Life Cycle Management <strong>in</strong> the seafood sector: us<strong>in</strong>g a sector based and regional approach <strong>in</strong><br />
Northern <strong>France</strong><br />
Cather<strong>in</strong>e Beut<strong>in</strong> 1,* , Jodie Bricout 2 , Naeem Adibi 2 , Christelle Demar<strong>et</strong>z 3 .....................................................................................................................707<br />
36. Life cycle assessment of <strong>in</strong>tegrated fish pond aquaculture of household farms <strong>in</strong> sub-Saharan Africa<br />
Thomas Efole Ewoukem 5,* , Joël Aub<strong>in</strong> 1,2 , Olivier Mikolasek 4 , Michael S. Corson 1,2 , Hayo van der Werf 1,2 , Dom<strong>in</strong>ique Ombredane 2,3 ................708<br />
37. Distribution of Norwegian fresh fish fill<strong>et</strong>s from an environmental and economic po<strong>in</strong>t of view<br />
Mie Vold * , Ole Jørgen Hanssen, Erik Svanes ..................................................................................................................................................................709<br />
38. System delimitation <strong>in</strong> life cycle assessment of aquaculture<br />
B<strong>in</strong>iam Samuel-Fitwi 1,2,* , Jan P. Schroeder 2 , Carsten Schulz 1,2 ......................................................................................................................................710<br />
GROUP 2, SESSION A: CARBON OR WATER FOOTPRINTS, SOIL, BIODIVERSITY<br />
39. The assessment of biodiversity with<strong>in</strong> UK farm<strong>in</strong>g systems us<strong>in</strong>g an extended <strong>LCA</strong> ecosystem approach<br />
Cather<strong>in</strong>e Keel<strong>in</strong>g, Rob Lillywhite * ..................................................................................................................................................................................711<br />
40. Proposal of a unified biodiversity impact assessment m<strong>et</strong>hod<br />
Jan P L<strong>in</strong>dner 1,* , Tabea Beck 2 , Sebastian Schwarz 3 , Ulrike Eberle 4 , Mart<strong>in</strong> Blumberg 5 ..............................................................................................712<br />
41. Display<strong>in</strong>g environmental footpr<strong>in</strong>ts of agricultural products: a “biodiversity” <strong>in</strong>dicator based on landscape<br />
features<br />
Anton<strong>in</strong> Vergez * , Mart<strong>in</strong> Bortzmeyer...............................................................................................................................................................................714<br />
42. Carbon footpr<strong>in</strong>t of the Chilean apple orchard system: study <strong>in</strong> the ma<strong>in</strong> southern hemisphere producer<br />
Alfredo Iriarte 1,2,* , Pablo Villalobos 3 , Pablo Yañez 3 , Carlos Huenchuleo 3 ....................................................................................................................716<br />
43. Assessment of carbon footpr<strong>in</strong>t m<strong>et</strong>hodologies used to evaluate Mediterranean horticultural production <strong>in</strong><br />
standard multi-tunnel greenhouses<br />
Rubén Beltrán-Palafox 1 , Julia Martínez-Blanco 2,* , Joan Rieradevall 2,3 , Assumpció Antón 4,5 , Pere Muñoz 5 ..............................................................717<br />
44. Carbon footpr<strong>in</strong>t and energy use of different options for greenhouse tomato production<br />
Joana Almeida 1,* , Wouter Achten 1,2 , Bruno Verbist 1 , Bart Muys 1,* ................................................................................................................................719<br />
45. Assessment of F<strong>in</strong>nish cultivation practices with carbon footpr<strong>in</strong>t and energy <strong>in</strong>dex<br />
Aki-Heikki F<strong>in</strong>ér * , Tero Hirvi, Jaakko Laur<strong>in</strong>en, Pasi Lähd<strong>et</strong>ie ....................................................................................................................................721<br />
46. Carbon footpr<strong>in</strong>t of Irish milk production<br />
M<strong>in</strong>g-Jia Yan 1 , James Humphreys 2 , Nicholas M. Holden 1,* ...........................................................................................................................................722<br />
47. Carbon footpr<strong>in</strong>t of the Australian dairy <strong>in</strong>dustry<br />
Sven Lundie 1 , Jake McLaren 2,* , Neil van Buuren 3 , Sebastian Gollnow 1,2 , Andrew Moore 2 , Larisa Maya Altamira 2 , Daniel Thylmann 1 , Barbara<br />
Nebel 2 , Hazel v. Rowley 4 , Manfred Lenzen 5 , Karen Christie 6 , Torsten Rehl 1 , Sab<strong>in</strong>e Deiml<strong>in</strong>g 1 ..............................................................................723<br />
48. Contribution of packag<strong>in</strong>g to the carbon footpr<strong>in</strong>t of canned tuna<br />
Ngamtip Poovarodom * , Chularat Ponnak, Natthaphon Manatphrom ............................................................................................................................725<br />
49. Carbon footpr<strong>in</strong>t of Canadian dairy products: national and regional assessments<br />
Xavier P. Vergé 1 , Dom<strong>in</strong>ique Maxime 2 , Raymond L. Desjard<strong>in</strong>s 3,* , Yves Arcand 4 , Devon Worth 3 ...........................................................................727<br />
50. Carbon footpr<strong>in</strong>t of Flemish livestock products<br />
Ellen Bracquené * , Valerie Vandermeulen, Marianne Fernagut ......................................................................................................................................729<br />
51. Carbon footpr<strong>in</strong>t of organic crop production <strong>in</strong> Sweden<br />
Christel Cederberg * , Magdalena Wallman, Maria Berglund, Jenny Gustavsson ..........................................................................................................731<br />
52. Guidel<strong>in</strong>es on <strong>in</strong>clusion of land use change emissions <strong>in</strong> carbon footpr<strong>in</strong>ts of food<br />
Hannele Pulkk<strong>in</strong>en * , Kristoffer Krogerus, Juha-Matti Katajajuuri.................................................................................................................................732<br />
53. A simplified tool for the estimation of N and P emissions due to the use of fertiliser <strong>in</strong> a <strong>LCA</strong> study<br />
Filippo Sessa 1,* , Massimo Mar<strong>in</strong>o 1 , Pierluigi Meriggi 2 , Matteo Ruggeri 3 , Michele Zerb<strong>in</strong>i 4 .......................................................................................733<br />
54. Soil and biogenic carbon account<strong>in</strong>g <strong>in</strong> carbon footpr<strong>in</strong>t: potential and challenges<br />
Edouard Périé 1,2,3,* , Sarah J. McLaren 1,3 , Brent E. Clothier 2,3 .........................................................................................................................................734<br />
55. Us<strong>in</strong>g <strong>LCA</strong> to <strong>in</strong>form policy for biochar <strong>in</strong> New Zealand<br />
Ruy Anaya de la Rosa 1 , Sarah J. McLaren 1,2,* , Jim Jones 1 , Ralph Sims 1 .......................................................................................................................735<br />
56. Soil quality aspects <strong>in</strong> food <strong>LCA</strong><br />
Taija S<strong>in</strong>kko * , Merja Saar<strong>in</strong>en ..........................................................................................................................................................................................736<br />
xiii
xiv<br />
8 th International Conference on <strong>LCA</strong> <strong>in</strong> the Agri-<strong>Food</strong> Sector, 1-4 Oct <strong>2012</strong><br />
57. The <strong>in</strong>fluence of m<strong>et</strong>hodology on the water footpr<strong>in</strong>t of selected UK produced and consumed products<br />
Rob Lillywhite 1 , Ashok Chapaga<strong>in</strong> 2 , Tim Hess 3 .............................................................................................................................................................737<br />
58. Water footpr<strong>in</strong>ts of wheat and maize: comparison b<strong>et</strong>ween Ch<strong>in</strong>a’s ma<strong>in</strong> breadbask<strong>et</strong> bas<strong>in</strong>s<br />
J<strong>in</strong>g Huang 1,2 , Bradley G Ridoutt 2 , Feng Huang 3 , Fu Chen 1,* .........................................................................................................................................738<br />
59. Environmental impact of green beans: the relevance of water use<br />
Thomas Kägi * , Silvan Rüttimann, Fredy D<strong>in</strong>kel .............................................................................................................................................................739<br />
60. Hands-on water footpr<strong>in</strong>t<strong>in</strong>g: putt<strong>in</strong>g the assessment of agricultural fresh water use <strong>in</strong>to practice<br />
Daniel Thylmann * , Ann<strong>et</strong>te Köhler, Sab<strong>in</strong>e Deiml<strong>in</strong>g ....................................................................................................................................................741<br />
61. A m<strong>et</strong>hod for estimat<strong>in</strong>g water use <strong>in</strong> food supply cha<strong>in</strong>s: liquid milk as an example<br />
Stefan Hörtenhuber 1,2,* , Ra<strong>in</strong>er Weißhaid<strong>in</strong>ger 1 , Thomas L<strong>in</strong>denthal 1,3 ,Werner Zollitsch 2 ..........................................................................................743<br />
62. Irrigation systems used <strong>in</strong> water scarce locations: <strong>LCA</strong> of three contrasted scenarios for watermelon grow<strong>in</strong>g<br />
Ludiv<strong>in</strong>e Pradeleix 1,* , Sami Bouarfa 1 , Philippe Roux 2 , M. Gueguen 2 , V. Bellon-Maurel 2 ...........................................................................................745<br />
63. Green, blue, and grey water use of Canadian wheat and maize<br />
Brian McConkey 1,* , Chao Chen 1 , Dom<strong>in</strong>ique Maxime 2 , Suren Kulshrestha 3 , Xavier Vergé 4 , Ray Desjard<strong>in</strong>s 5 , Devon Worth 5 , Jim Dyer 6 ............747<br />
64. Virtual water of sugar production <strong>in</strong> Spa<strong>in</strong><br />
J. Soler-Rovira * , P. Gómez de la Calle, J.M. Arroyo-Sanz .............................................................................................................................................749<br />
65. Modell<strong>in</strong>g sugar be<strong>et</strong> water use <strong>in</strong> Spa<strong>in</strong><br />
J. Soler-Rovira * , P. Gómez de la Calle, J.M. Arroyo-Sanz .............................................................................................................................................751<br />
66. Water footpr<strong>in</strong>t of milk at dairy farm<br />
Armelle Gac 1,* , S<strong>in</strong>dy Moreau 1 , Didier Moreau 2 , Samuel Vionn<strong>et</strong> 3 ...............................................................................................................................753<br />
67. <strong>Food</strong> production <strong>in</strong> Brazil: challenges for water footpr<strong>in</strong>t account<strong>in</strong>g<br />
Leda Coltro .........................................................................................................................................................................................................................755<br />
GROUP 3, SESSION A: LABELLING, CONSUMERS, DIET<br />
68. A life cycle C3 commons: communicate, collaborate, connect<br />
Shelly Grist * , Mark Toleman ............................................................................................................................................................................................757<br />
69. Assessment of the environmental impact of di<strong>et</strong>ary <strong>in</strong>take habits <strong>in</strong> the UK<br />
Jan<strong>et</strong> Kyle 1,* , Jennie Macdiarmid 2 and Tony Craig 3 ........................................................................................................................................................758<br />
70. Fish or meat? Is this a relevant question from an environmental po<strong>in</strong>t of view?<br />
Benedikt Buchspies 1 , Niels Jungbluth 2,* ...........................................................................................................................................................................759<br />
71. The impacts of food choices on the state of the Baltic Sea - example of the EIO<strong>LCA</strong> study<br />
Virpi Vorne 1,* , Yrjö Virtanen 2 , Sirpa Kurppa 2 , Sanna Hi<strong>et</strong>ala 1 , Matti Verta 3 , Juha Grönroos 3 , Li<strong>in</strong>a Laum<strong>et</strong>s 4 , El<strong>in</strong>a Līce 5 ....................................761<br />
72 Potential contribution of di<strong>et</strong>ary changes to improvements <strong>in</strong> the environment and human health<br />
G.A. Rood 1,* , H. Westhoek, A. de Marco 2 , J.P. Lesschen 3 , A. Leip 4 , D. Nijdam, S. Wagner 3,1 ..................................................................................762<br />
73. Benchmark<strong>in</strong>g Swedish cod and herr<strong>in</strong>g products by spatial-temporal life cycle assessment<br />
Andreas Emanuelsson 1,2,* , Friederike Ziegler 1 , Leif Pihl 2 , Mattias Sköld 3 , Sara Hornborg 1 , Ulf Sonesson 1 ..............................................................763<br />
74. L<strong>in</strong>k<strong>in</strong>g geographical certification and environmental declaration of food products: the apple Mela Rossa<br />
Cuneo (PGI) case study<br />
Alessandro K. Cerutti 1,* , Andrea Sacch<strong>et</strong>to 1 , Sander Bruun 2 , Dario Donno 1 , Gabriele L. Beccaro 1 , Giancarlo Bounous 1 ........................................765<br />
75. Eco-labell<strong>in</strong>g and <strong>in</strong>formation asymm<strong>et</strong>ry: <strong>in</strong>dependent consumer <strong>in</strong>formation through eco-labels <strong>in</strong> Bulgaria<br />
Elka Vasileva * , Daniela Ivanova, Stilian Stefanov, N<strong>in</strong>a Tipova ...................................................................................................................................766<br />
76. SENSE: harmonised environmental susta<strong>in</strong>ability <strong>in</strong> the European food and dr<strong>in</strong>k cha<strong>in</strong><br />
Guillermo Pardo 1,* , A<strong>in</strong>tzane Esturo 1 , Jaime Zufía 1 , Ulf Sonesson 2 , Thorkild Nielsen 3 , Erl<strong>in</strong>g Larsen 4 , Guðrún Ólafsdóttir 5 , David Barl<strong>in</strong>g 6 ,<br />
Begoña Perez Villarreal 1 ...................................................................................................................................................................................................767<br />
77. Life cycle assessment of rapeseed and sunflower oils<br />
Laureen Badey 1,* , Natie Lahitte, Francis Flen<strong>et</strong> 2 , Fabrice Bosque .................................................................................................................................769<br />
78. Effect of carbon footpr<strong>in</strong>t label on food purchase behaviour<br />
Aki-Heikki F<strong>in</strong>ér 1,* , Marika Kelokari 1 , Jussi Nikula 2 , Mira Povela<strong>in</strong>en 1 .......................................................................................................................771<br />
79. Bitterswe<strong>et</strong> comparability of carbon footpr<strong>in</strong>ts<br />
Silvia Marton ......................................................................................................................................................................................................................772<br />
80. Life cycle assessment as a basis for eco-labell<strong>in</strong>g of fish food products<br />
Erw<strong>in</strong> M. Schau 1,2,* , Annik M. F<strong>et</strong> 2 , Harald Ell<strong>in</strong>gsen 3 , Matthias F<strong>in</strong>kbe<strong>in</strong>er 1 ..............................................................................................................774<br />
81. Agrifood products: a comparison of exist<strong>in</strong>g carbon footpr<strong>in</strong>t systems <strong>in</strong> the world<br />
Stéphane Le Pochat * , Evelyne Lauren, Roberto Bell<strong>in</strong>o .................................................................................................................................................776<br />
82. F<strong>in</strong>nish carbon footpr<strong>in</strong>t protocol “<strong>Food</strong>pr<strong>in</strong>t” for food products<br />
Juha-Matti Katajajuuri * , Hannele Pulkk<strong>in</strong>en, Hanna Hartika<strong>in</strong>en, Kristoffer Krogerus, Merja Saar<strong>in</strong>en, Frans Silvenius, Kirsi Usva, Heli<br />
Yrjänä<strong>in</strong>en ..........................................................................................................................................................................................................................778<br />
83. How to measure susta<strong>in</strong>able agriculture? The GLOBAL 2000 adaptive susta<strong>in</strong>ability assessment approach for<br />
agricultural products<br />
Mart<strong>in</strong> Wildenberg * , Tanja Altaparmakova, Kew<strong>in</strong> Comploi, Dom<strong>in</strong>ik Friel<strong>in</strong>g, Lydia Matiasch, Helmut Burtscher .............................................779<br />
84. Product carbon footpr<strong>in</strong>t for a l<strong>in</strong>e of production of cookies<br />
C. Naranjo 1,* , O. López 2 , C. Montoya 2 , J. Leal 1 ..............................................................................................................................................................780<br />
85. <strong>LCA</strong> <strong>in</strong> organic and conventional product comparison: a review<br />
Matthias S. Meier 1,* , Christian Schader 1 , Franziska Stoessel 2 ........................................................................................................................................782
8 th International Conference on <strong>LCA</strong> <strong>in</strong> the Agri-<strong>Food</strong> Sector, 1-4 Oct <strong>2012</strong><br />
86. Environmental impacts and resource use <strong>in</strong> feed production for Atlantic salmon aquaculture<br />
Erik Skontorp Hognes 1,* , Friederike Ziegler 2 , Veronica Sund 2 ......................................................................................................................................784<br />
87. EPD of extra-virg<strong>in</strong> olive oil: an Italian experience<br />
Giulio Mario Cappell<strong>et</strong>ti 1 , Giuseppe Mart<strong>in</strong>o Nicol<strong>et</strong>ti 1 , Alessandro Leone 2 , Giuseppe Lopriore 3 , Carlo Russo * .....................................................786<br />
88. Communication strategies for product susta<strong>in</strong>ability messag<strong>in</strong>g aimed at end consumers<br />
Thomas Redd 1,* , Doug Harrison 2 , Laura Riley 2 , Greg Thoma 3 ......................................................................................................................................788<br />
89. The good egg <strong>in</strong> the bask<strong>et</strong>: improvements <strong>in</strong> egg production with<strong>in</strong> the Pro Plan<strong>et</strong> eco-labell<strong>in</strong>g scheme<br />
Kew<strong>in</strong> Comploi * , Mart<strong>in</strong> Wildenberg, Tanja Altaparmakova, Dom<strong>in</strong>ik Friel<strong>in</strong>g, Lydia Matiasch, Helmut Burtscher .............................................790<br />
90. Carbon labels worldwide- a review of approaches and <strong>in</strong>dices<br />
Michael M. Blanke * , Florian Schaefer .............................................................................................................................................................................791<br />
91. <strong>Food</strong> waste amounts and avoidability <strong>in</strong> Switzerland<br />
Claudio Ber<strong>et</strong>ta 1,* , Franziska Stoessel 1 , Stefanie Hellweg 1 , Urs Baier 2 .........................................................................................................................793<br />
POSTER SESSION B - WEDNESDAY, 3 OCTOBER, 16.20-16.50<br />
GROUP 4, SESSION B: CROP PRODUCTION SYSTEMS<br />
92. Life cycle assessment of alg<strong>in</strong>ate production<br />
Juli<strong>et</strong>te Langlois 1,2,* , Jean-François Sassi 3 , Jean-Philippe Delegenes 2 , Jean-Philippe Steyer 2 , Arnaud Helias 1,2 ........................................................795<br />
93. Sal<strong>in</strong>algue project: design<strong>in</strong>g a susta<strong>in</strong>able production system of biofuel and by-products from microalgae<br />
Mélissa Cornélus 1,* , Pierre Coll<strong>et</strong> 1 , Stéphane LePochat 3 , Roberto Bell<strong>in</strong>o 3 , Jean-Philippe Steyer 1 , Arnaud Hélias 1,2 ...............................................797<br />
94. Us<strong>in</strong>g life cycle analysis to compare the environmental performance of organic and conventional apple<br />
orchards<br />
Aude Alaphilippe 1,* , Sylva<strong>in</strong>e Simon 1 , Laurent Brun 1 , Frank Hayer 2 , Gérard Gaillard 2 ..............................................................................................799<br />
95. Assess<strong>in</strong>g environmental susta<strong>in</strong>ability of apple ancient vari<strong>et</strong>ies <strong>in</strong> Northern Italy<br />
Alessandro K. Cerutti 1,* , Daniela Galizia 1 , Sander Bruun 2 , Dario Donno 1 , Gabriele L. Beccaro 1 , Giancarlo Bounous 1 ...........................................801<br />
96. Life cycle GHG and energy balance of organic apples: a case study <strong>in</strong> Italy<br />
Maurizio Cellura 1,* , Mario Fontana 1 , Sonia Longo 1 , Mar<strong>in</strong>a Mistr<strong>et</strong>ta 2 , Flavio Paol<strong>et</strong>ti 3 .............................................................................................802<br />
97. Life cycle assessment comb<strong>in</strong>ed with eMergy for the evaluation of an organic apple production system<br />
<strong>France</strong>sca Ross<strong>et</strong>ti 1,* , Bened<strong>et</strong>to Rugani 2 , Elena Neri 1 , Nicol<strong>et</strong>ta Patrizi 1 , Simone Bastianoni 1 ..................................................................................803<br />
98. Prelim<strong>in</strong>ary research on the analysis of life cycle assessment <strong>in</strong> the production of rapeseed and biodiesel <strong>in</strong><br />
Poland<br />
Magdalena Borzecka-Walker * , Antoni Faber, Rafał Pudełko, Katarzyna Mizak ..........................................................................................................804<br />
99. The construction of a database for the evaluation of greenhouse gas emissions from cultivation of crops for<br />
biofuels <strong>in</strong> Poland<br />
Magdalena Borzecka-Walker * , Katarzyna Mizak, Antoni Faber, Al<strong>in</strong>a Syp, Rafal Pudelko .......................................................................................805<br />
100. Environmental implications of us<strong>in</strong>g biomass versus fossil fuels for energy production: the case of willow, an<br />
energy crop<br />
Thu Lan T. Nguyen * , John E. Hermansen ........................................................................................................................................................................806<br />
101. Influence of allocation m<strong>et</strong>hods <strong>in</strong> the quantification of the environmental impacts of compost application<br />
Julia Martínez-Blanco 1,* , Joan Rieradevall 1,2 , Pere Muñoz 3 , Assumpció Antón 3,4 ........................................................................................................807<br />
102. How to overcome time variation <strong>in</strong> <strong>LCA</strong><br />
Saioa Ramos * , Guillermo Pardo, Jaime Zufia ..................................................................................................................................................................808<br />
103. The role of spatial modell<strong>in</strong>g us<strong>in</strong>g GIS <strong>in</strong> the development of life cycle <strong>in</strong>ventory for Australian agriculture<br />
Jonathan Hercule 1 , Sandra Eady 2,* , Tim Grant 3 , Russell Lyons 4 ....................................................................................................................................809<br />
104. Us<strong>in</strong>g spatial data to def<strong>in</strong>e <strong>in</strong>dustry sub-sectors for Australian wheat<br />
Gonzalo Mata 1,* , Sandra Eady 2 , Tim Grant 3 ....................................................................................................................................................................810<br />
105. Improv<strong>in</strong>g pesticide account<strong>in</strong>g <strong>in</strong> agricultural life cycle assessment: a review of exist<strong>in</strong>g <strong>LCA</strong> practice and<br />
available <strong>LCA</strong> and Ecological Risk Assessment models<br />
Mitchell Burns 1,* , Philippe Roux 2 , Carole S<strong>in</strong>fort 3 , Claud<strong>in</strong>e Bass<strong>et</strong>-Mens 1 , Eric Malezieux 1 ....................................................................................811<br />
106. Comparison of assessment m<strong>et</strong>hods for the environmental impacts of pesticide production<br />
Kiyotada Hayashi 1,* , Koichi Shobatake 2 , Naoki Mak<strong>in</strong>o 2 ...............................................................................................................................................812<br />
107. Implement<strong>in</strong>g decision mak<strong>in</strong>g <strong>in</strong> irrigation management based on productive and environmental <strong>in</strong>dicators<br />
Maria José Amores 1,* , <strong>France</strong>sc Ferrer 2 , Orene Cabot 2 , Assumpció Anton 1,3 , Albert Duaigües 2 , <strong>France</strong>sc Castells 1 , Esk<strong>in</strong>der Demisse<br />
Gemechu 1 ...........................................................................................................................................................................................................................814<br />
108. <strong>LCA</strong>s for a large repertoire of F<strong>in</strong>nish outdoor plant products<br />
Merja Saar<strong>in</strong>en * , Yrjö Virtanen, Helena Hyvär<strong>in</strong>en ........................................................................................................................................................816<br />
109. Life cycle assessment of long-lived perennial cropp<strong>in</strong>g systems: almond and pistachio production <strong>in</strong><br />
California<br />
Elias Marv<strong>in</strong>ney 1,* , Alissa Kendall, Sonja Brodt, Theodore Dejong..............................................................................................................................818<br />
110. Land use key param<strong>et</strong>ers to be addressed <strong>in</strong> life cycle assessment study of soybean gra<strong>in</strong>s<br />
Anna Lúcia Mourad 1,* , Lília Sichmann Heiffig-del Aguila 2 ...........................................................................................................................................819<br />
111. Comparison of the susta<strong>in</strong>ability of different potato production systems: use of AgBalance m<strong>et</strong>hodology to<br />
identify strengths and weaknesses of organic, conventional and gen<strong>et</strong>ically modified disease-resistant potato<br />
cultivation<br />
Martijn Gipmans 1,* , Jan Schöneboom 2 , Brigitte Achatz 2 , Thorsten Storck 3 , Markus Prüfe 4 , Manuel Knauer 4 , P<strong>et</strong>er Sal<strong>in</strong>g 2 ...................................820<br />
xv
xvi<br />
8 th International Conference on <strong>LCA</strong> <strong>in</strong> the Agri-<strong>Food</strong> Sector, 1-4 Oct <strong>2012</strong><br />
112. Modell<strong>in</strong>g Estonian field crop farm types for <strong>LCA</strong><br />
Sirli Pehme * , Eve Veromann .............................................................................................................................................................................................822<br />
113. Develop<strong>in</strong>g <strong>in</strong>novative technical agronomical practices <strong>in</strong> sunflower cultivation for <strong>in</strong>dustrial applications:<br />
experience from central Italy<br />
<strong>France</strong>sco Razza 1,* , <strong>France</strong>sco Degli Innocenti 2 , Michele Falce 2 , Luciano Concezzi 3 , Andrea Massoli 3 ...................................................................823<br />
114. Effects of different crop management on durum wheat GHGs emission<br />
Salem Alhajj ali 1,* , Giuseppe De Mastro 1 , Luigi Tedone 1 , Stefano Bona 2 , Lucia Col<strong>et</strong>to 2 ..........................................................................................825<br />
115. Environmental and economic life cycle assessment of organic and conventional olive systems<br />
Ramez Mohamad 1,* , Annalisa De Boni 2 , Gianluigi Cardone 1 , Marie Re<strong>in</strong>e Bteich 1 , Michele Mor<strong>et</strong>ti 2 , Rocco Roma 2 , V<strong>in</strong>cenzo Verrastro 1 .........826<br />
116. A life cycle assessment of rice cultivation<br />
Torsten Rehl 1, , Barbara Dannenmann 2 , Sab<strong>in</strong>e Deiml<strong>in</strong>g 1 , Joachim Müller 2 ................................................................................................................827<br />
117. Environmental assessment of rice production <strong>in</strong> Camargue, <strong>France</strong><br />
Ancia Drocourt 1 , Yannick Mervant 1 , Franc ois Milhau 1 , Mireille Ch<strong>in</strong>al 2 , Arnaud Hélias 1,3,* ....................................................................................829<br />
118. Allocat<strong>in</strong>g environmental burdens from fertilisation to crops <strong>in</strong> a rotation<br />
Alice Gueud<strong>et</strong> 1,* , Hervé Bossuat 1 , Marilys Pradel 2 , Afsaneh Lellahi 3 , Aurélie Tailleur 3 .............................................................................................831<br />
119. Design<strong>in</strong>g susta<strong>in</strong>able crop rotations us<strong>in</strong>g life cycle assessment of crop sequences<br />
Frank Hayer 1 , Emmanuelle Bonn<strong>in</strong> 2 , Benoit Carrouée 3 , Gérard Gaillard 1 , Thomas Nemecek 1, , Anne Schneider 3 , and Christophe Vivier 4 ............833<br />
120. Life cycle assessment of various fertilisation systems <strong>in</strong> open field veg<strong>et</strong>able production, Flanders, Belgium<br />
Re<strong>in</strong>dert F. Heuts * , Jelle Van Loon, Eddie Schrevens ....................................................................................................................................................835<br />
121. Comparison of CO2 emissions <strong>in</strong> the w<strong>in</strong>e production from traditional and organic farm<strong>in</strong>g techniques. A<br />
Spanish case study<br />
A. Aranda * , S. Scarpell<strong>in</strong>i, G. Ferreira, D. Zambrana .....................................................................................................................................................837<br />
122. Grape life cycle assessment: which m<strong>et</strong>hodological choices for a comb<strong>in</strong>ed assessment with grape quality?<br />
Christel Renaud-Gentié 1,* , Frédérique Jourjon 1 , Marc Benoît 2 .......................................................................................................................................838<br />
GROUP 5, SESSION B: FOOD PRODUCTS<br />
123. Ecodesign opportunities for a farmer’s bread. Two case studies from north-western <strong>France</strong><br />
Michal Kulak, Thomas Nemecek 1 , Emmanuel Frossard 2 , Gerard Gaillard 1 ..................................................................................................................840<br />
124. How to adapt generic LCI data to be reliant on the orig<strong>in</strong>al recipe: case study of a biscuit<br />
Roberto Bell<strong>in</strong>o 1 , Marie Vuaillat 1 , Stéphane Le Pochat 1,* , Laure Vidal 2 , Stéphanie Capdeville 2 , Sylvie Mart<strong>in</strong>el 3 ...................................................842<br />
125. Prioritis<strong>in</strong>g r<strong>et</strong>ail food waste prevention - potatoes, tomatoes or carambolas?<br />
Ingrid Strid .........................................................................................................................................................................................................................844<br />
126. <strong>LCA</strong> of waste from olive oil manufactur<strong>in</strong>g<br />
Bruno Notarnicola 1,* , Bernardo De Gennaro 2 , Giuseppe Tassielli 1 , Pi<strong>et</strong>ro Alexander Renzulli 1 .................................................................................846<br />
127. Environmental impact of animal food products and their substitutes<br />
Trudy Rood 1 , Durk Nijdam, Henk Westhoek, A. Leip 2 , J.P. Lesschen 3 ........................................................................................................................847<br />
128. Industrial ecology and agri-food sector. Perspectives of implementation <strong>in</strong> an Italian regional cluster<br />
Raffaella Taddeo * , Alberto Simboli, Anna Morgante .....................................................................................................................................................848<br />
129. <strong>LCA</strong>s for animal products pork, beef, milk and eggs <strong>in</strong> F<strong>in</strong>land<br />
Kirsi Usva * , Jouni Nousia<strong>in</strong>en, Helena Hyvär<strong>in</strong>en, Yrjö Virtanen ................................................................................................................................850<br />
130. Greenhouse gas emissions related to saturated fat, sodium and di<strong>et</strong>ary fibre content of food products<br />
Corné van Dooren * , Annely Douma ................................................................................................................................................................................852<br />
131. Harmonis<strong>in</strong>g <strong>LCA</strong> m<strong>et</strong>hodology: A collaborative approach <strong>in</strong> a search for allocation rules for food sector<br />
Hanna Hartika<strong>in</strong>en * , Juha-Matti Katajajuuri, Frans Silvenius ........................................................................................................................................854<br />
132. Assessment of the life cycle of a Portuguese w<strong>in</strong>e: from viticulture to distribution<br />
Belmira A. F. N<strong>et</strong>o 1,* , Ana Cláudia Dias 2 , Mar<strong>in</strong>a Machado 3 ........................................................................................................................................856<br />
133. Can you afford to make an eco-di<strong>et</strong>?<br />
Sirpa Kurppa * , Kirsi Silvenno<strong>in</strong>en....................................................................................................................................................................................857<br />
134. Value of a life cycle approach <strong>in</strong> evaluat<strong>in</strong>g the environmental impacts of packag<strong>in</strong>g for food and beverage<br />
applications<br />
Sonia Valdivia 1 , Bruce Vigon 2 , Jim Fava 3 , Laura Flanigan 3,* .........................................................................................................................................858<br />
135. Spatial food-pr<strong>in</strong>t to supply livestock products to Paris, 19 th -21 st centuries<br />
P<strong>et</strong>ros Chatzimpiros ...........................................................................................................................................................................................................859<br />
136. Analysis of material and energy flow associated with food production and consumption <strong>in</strong> Japan<br />
Naoki Yoshikawa 1,* , Koji Amano 1 , Koji Shimada 2 .........................................................................................................................................................861<br />
137. Environmental impacts of pasta cook<strong>in</strong>g<br />
Luca Ru<strong>in</strong>i 1 , Roberto Bassi 1 , Massimo Mar<strong>in</strong>o 2 , Sonia Pignatelli 2,* ..............................................................................................................................863<br />
138. The development of robust Life Cycle Analysis for mycoprote<strong>in</strong> and the meat free brand Quorn TM<br />
Wayne Mart<strong>in</strong>dale 1,* , Louise Neville 2 , Muyiwa Ak<strong>in</strong>toye 2 , Tim F<strong>in</strong>nigan 2 ..................................................................................................................865<br />
139. Environmental evaluation of French olive oil production<br />
G. Buss<strong>et</strong> 1,2,3,4,* , JP Belaud 3,4 , F. Clarens 5 , J. Espi 5 , M. Montréjaud-Vignoles 1,2 , C. Sablayrolles 1,2 ............................................................................866<br />
140. <strong>LCA</strong> of food packag<strong>in</strong>g: soy-prote<strong>in</strong> based films versus PP film<br />
I. Lec<strong>et</strong>a 1 , P. Guerrero 1 , S. Cabezudo 2 , K. de la Caba 1,* ..................................................................................................................................................867<br />
141. Comparative <strong>LCA</strong> of reconstituted milk and recomb<strong>in</strong>ed milk process<strong>in</strong>g<br />
Farroudja Younsi 1,* , Krim Louhab 2 , Chawki Belblidia 3 ..................................................................................................................................................869
8 th International Conference on <strong>LCA</strong> <strong>in</strong> the Agri-<strong>Food</strong> Sector, 1-4 Oct <strong>2012</strong><br />
142. Improv<strong>in</strong>g the efficiency of agricultural and food systems by <strong>in</strong>troduc<strong>in</strong>g biodegradable and compostable<br />
products <strong>in</strong> strawberry supply cha<strong>in</strong>: experience from northern Italy<br />
<strong>France</strong>sco Razza 1,* , <strong>France</strong>sco Degli Innocenti 2 , Cristiana Peano 3 ,V<strong>in</strong>cenzo Girgenti 3 , Michele Bonous 3 ................................................................871<br />
143. <strong>LCA</strong> of one cup of espresso coffee: how to collect and validate <strong>LCA</strong> data along the coffee supply cha<strong>in</strong><br />
Stefania Furfori 1,* , Cristiano Portis 1 , Alberto Cabilli 1 , Alfredo Vanni 1 , Leo Breedveld 2 , Rosal<strong>in</strong>a Barrale 3 ..............................................................872<br />
144. Life cycle assessment of an artisanal Belgian blond beer<br />
Raphaëlle Melon 1,* , Roberto Renzoni 1 , Angélique Léonard 1 , V<strong>in</strong>cianne Wergifosse 2 .................................................................................................873<br />
145. Track<strong>in</strong>g environmental impact of food production cha<strong>in</strong>: a case study on fresh carrot cha<strong>in</strong> <strong>in</strong> Italy<br />
Simona Bosco 1,* , Giorgio Ragagl<strong>in</strong>i 1 , Giuseppe Garcea 2 , Roberta De Natale 3 , Enrico Bonari 1 ..................................................................................875<br />
146. Life cycle assessment of an Italian sparkl<strong>in</strong>g w<strong>in</strong>e production<br />
Paola Masotti 1,* , Luigia P<strong>et</strong>ti 2 , Serena Melchiori 3 ...........................................................................................................................................................877<br />
147. Influence of transport on environmental impacts of the production cha<strong>in</strong> of poultry <strong>in</strong> Brazil<br />
Sebastião Roberto Soares 1,* , Vamilson Prudêncio da Silva Junior 2 , Edivan Cherub<strong>in</strong>i 1 , Marco Antônio Santos 3 .....................................................879<br />
148. A m<strong>et</strong>hodological comparison of Life Cycle Susta<strong>in</strong>ability Assessment of fruit and veg<strong>et</strong>able logistics<br />
Pere Fullana i Palmer 1,* , Alba Bala 1 , Tabea Beck 2 , Stefan Albrecht 2 ............................................................................................................................880<br />
149. Comprehensive life cycle assessment for cheese and whey products <strong>in</strong> the U.S.<br />
Greg Thoma 1,* , Dar<strong>in</strong> Nutter 2 , Rick Ulrich 1 , Dae-Soo Kim 1 , Greg Norris 3 , Franco Milani 4 , Dean Sommer 4 .............................................................881<br />
150. Comprehensive life cycle assessment of fluid milk delivery systems<br />
Greg Thoma 1,* , Dar<strong>in</strong> Nutter 1 , Jasm<strong>in</strong>a Burek 1 , Dae-Soo Kim 1 , Susan Selke 2 , Rafael Auras 2 , Bev Sauer 3 , Sarah Cashman 3 ..................................883<br />
GROUP 6, SESSION B: METHODS, TOOLS, DATABASES<br />
151. AusAgLCI – build<strong>in</strong>g national lifecycle <strong>in</strong>ventory for Australian agriculture<br />
Sandra Eady 1,* , Tim Grant 2 , Simon W<strong>in</strong>ter 3 .....................................................................................................................................................................885<br />
152. The French agricultural <strong>LCA</strong> platform<br />
Anne Bouter 3,4,5 , Armelle Gac 1 , Aurélie Tailleur 2,* , Sandr<strong>in</strong>e Espagnol 5 , Aurélie Wilfart 3,4 ........................................................................................886<br />
153. A software and database platform for multi-criteria assessment of agri-food systems<br />
Hayo van der Werf 1,2,* , Julie Auberger 1,2 , Coralie Haese 1,2 , Geneviève Gésan-Guiziou 2,3 , Joël Aub<strong>in</strong> 1,2 ....................................................................887<br />
154. Availability and compl<strong>et</strong>eness of LCI of cereal products and related databases<br />
Evelyne Laurent, Roberto Bell<strong>in</strong>o, Stéphane Le Pochat * ................................................................................................................................................889<br />
155. The <strong>LCA</strong> world food database project: towards more accurate <strong>LCA</strong>s on agricultural and food products<br />
Laura Peano 1,* , Yves Loer<strong>in</strong>cik 1 , Sebastien Humbert 1 , Gérard Gaillard 2 , Thomas Nemecek 2 .....................................................................................891<br />
156. Seeds4green, a collaborative platform for <strong>LCA</strong><br />
Hélène Teulon * , Benjam<strong>in</strong> Canaguier ..............................................................................................................................................................................892<br />
157. ACYVIA: creation of a public LCI/LCIA database of the French food <strong>in</strong>dustry<br />
F. Bosque 1 , O.Réthoré 2 , S. Kerner 3 , H. Bortoli 2 , Laura Peano 4 , Sébastien Humbert 4,5 , G. Gaillard 6 , J. Lansche 6 ......................................................893<br />
158. <strong>LCA</strong> as an evaluation tool for new food preservation techniques<br />
Anna Aronsson * , Kar<strong>in</strong> Östergren, Christoffer Krewer ..................................................................................................................................................895<br />
159. Ecodesign of plant-based build<strong>in</strong>g materials us<strong>in</strong>g <strong>LCA</strong>: crop production and primary transformation of<br />
hemp<br />
Andrianandra<strong>in</strong>a 1,* , Hayo van der Werf 2,3 , Anne Ventura 4 , Rachida Idir 5 .....................................................................................................................897<br />
160. Comparison of two milk prote<strong>in</strong> separation processes: chromatography vs. filtration<br />
Sophie Omont 1 , Daniel Froelich 2,* , François Thueux 3 , Murielle Rabiller-Baudry 4 , Didier Beudon 5 , Lionel Tregr<strong>et</strong> 6 , Christian Buson 7 , David<br />
Auffr<strong>et</strong> 7 , Geneviève Gésan-Guiziou 8,9 ..............................................................................................................................................................................899<br />
161. Design of a model for estimat<strong>in</strong>g LCI data by means of the Farm Accountancy Data N<strong>et</strong>work. A citrus case<br />
study<br />
J. Ribal 1,* , N. Sanjuan 2 , G. Clemente 2 , M.L. Fenollosa 1 .................................................................................................................................................901<br />
162. A simple model to assess nitrate leach<strong>in</strong>g from annual crops for life cycle assessment at different spatial<br />
scales<br />
Aurélie Tailleur * , Jean-Pierre Cohan, François Laurent, Afsaneh Lellahi .....................................................................................................................903<br />
163. Life cycle susta<strong>in</strong>ability assessment of fertilis<strong>in</strong>g options<br />
Julia Martínez-Blanco 1,* , Annekatr<strong>in</strong> Lehmann 2,3 , Pere Muñoz 4 , Assumpció Antón 5 , Marzia Traverso 2 , Joan Rieradevall 1,6 , Matthias<br />
F<strong>in</strong>kbe<strong>in</strong>er 2 .........................................................................................................................................................................................................................905<br />
164. G<strong>et</strong> SET, an <strong>in</strong>novative holistic approach to implement more susta<strong>in</strong>able nutrition<br />
Georg Schöner * , Christoph Günther, Cristian Barcan, Krist<strong>in</strong>a Gräper .........................................................................................................................907<br />
165. Subcategory assessment m<strong>et</strong>hod: stakeholder workers<br />
Paola Kar<strong>in</strong>a Sánchez Ramirez 1,* , Luigia P<strong>et</strong>ti 1 , Cássia Maria Lie Ugaya 2 ...................................................................................................................908<br />
166. Supply-demand balances of food and energy <strong>in</strong> mounta<strong>in</strong>ous rural areas to help ensure regional susta<strong>in</strong>ability<br />
Kazutoshi Tsuda 1,* , Keishiro Hara 2 , Mich<strong>in</strong>ori Uwasu 2 ..................................................................................................................................................909<br />
167. AgBalance – holistic susta<strong>in</strong>ability assessment of agricultural production<br />
Jan Schöneboom 1,* , P<strong>et</strong>er Sal<strong>in</strong>g 1 , Richard van Gelder 1 , Markus Frank 2 , Dirk Voeste 2 , Martijn Gipmans 3 ...............................................................911<br />
168. Social life cycle assessment of milk production <strong>in</strong> Canada<br />
Jean-Michel Couture 1,* , Cather<strong>in</strong>e Brodeur 1 , Julie Parent 2 , Jean-Pierre Revér<strong>et</strong> 1,2 , Mia Lafonta<strong>in</strong>e 3 ..........................................................................912<br />
169. Environmental impact and social attributes of small- and large-scale dairy farms<br />
Luciana Bava, Matteo Guerci * , Anna Sandrucci, Alberto Tambur<strong>in</strong>i, Maddalena Zucali............................................................................................913<br />
xvii
xviii<br />
8 th International Conference on <strong>LCA</strong> <strong>in</strong> the Agri-<strong>Food</strong> Sector, 1-4 Oct <strong>2012</strong><br />
170. Guidel<strong>in</strong>es for address<strong>in</strong>g environmental and social <strong>LCA</strong> with<strong>in</strong> Quebec’s food process<strong>in</strong>g <strong>in</strong>dustry – Part 1:<br />
environmental aspects<br />
Julie-Anne Chayer 1,* , Rosie Saad 1 , Cather<strong>in</strong>e Brodeur 2 , Jean-Pierre Revérêt 2 ..............................................................................................................915<br />
171. Guidel<strong>in</strong>es for address<strong>in</strong>g environmental and social <strong>LCA</strong> with<strong>in</strong> Quebec’s food process<strong>in</strong>g <strong>in</strong>dustry – Part 2:<br />
socio-economic aspects<br />
Jean-Michel Couture 1,* , Cather<strong>in</strong>e Brodeur 1 , Jean-Pierre Revér<strong>et</strong> 1,2 , Julie-Anne Chayer 3 , Rosie Saad 3 .....................................................................916<br />
172. Aggregated <strong>in</strong>dicators of susta<strong>in</strong>able agricultural production and food security <strong>in</strong> the Central Maghreb<br />
J. Soler-Rovira 1,* , J.M. Arroyo-Sanz 1 , F. González-Torres 1 , C. Rojo-Hernández 1 , A. Marqu<strong>in</strong>a Barrio 2 . ..................................................................917<br />
173. Consistent <strong>in</strong>clusion of deforestation <strong>in</strong> food life cycle assessment<br />
Sebastien Humbert * , V<strong>in</strong>cent Rossi ..................................................................................................................................................................................919<br />
174. Comparison of current guidel<strong>in</strong>es to calculate the carbon footpr<strong>in</strong>t of carrots<br />
Svanes, Erik ........................................................................................................................................................................................................................920<br />
175. Establish<strong>in</strong>g a reference carbon calculator and policy options to promote low carbon farm<strong>in</strong>g practices <strong>in</strong> the<br />
EU<br />
Hanna L. Tuomisto * , V<strong>in</strong>cenzo Angileri, Camillo De Camillis, Adrian Leip, Nathan Pell<strong>et</strong>ier, Fabien Ramos, Palle Haastrup .............................921<br />
176. Survey<strong>in</strong>g tools and m<strong>et</strong>hods for <strong>LCA</strong> <strong>in</strong> the agri-food sector<br />
Ricardo Teixeira * , Lori Gustavus, Anne Himeno, Sara Pax ...........................................................................................................................................922<br />
177. PISC’n’TOOL: an operational tool for assess<strong>in</strong>g susta<strong>in</strong>ability <strong>in</strong> aquaculture systems<br />
Aurélie Wilfart 1,2,* , Thomas Merle, Syndhia Mathé 3 , Joël Aub<strong>in</strong> 1,2 ...............................................................................................................................924<br />
178. <strong>Food</strong> and climate change: FOODpr<strong>in</strong>t as a tool to support GHG reduction <strong>in</strong> the Thai agri-food sector<br />
Shabbir H. Gheewala 1,2,* , Rattanawan Mungkung 3 .........................................................................................................................................................926<br />
179. D<strong>et</strong>erm<strong>in</strong><strong>in</strong>g greenhouse gas emissions profiles for Australian agricultural products at a regional scale:<br />
m<strong>et</strong>hodological opportunities and obstacles<br />
Philippa M Brock 1,* , Phillip Graham 1 , David F Herridge 2 , Patrick Madden 1 , Graeme D Schwenke 1 .........................................................................927<br />
180. Energy analysis of agricultural systems: uncerta<strong>in</strong>ty associated with energy coefficients non-adapted to local<br />
conditions<br />
Mathieu Vigne * , Philippe Faverd<strong>in</strong>, Jean-Louis Peyraud ...............................................................................................................................................929<br />
181. Uncerta<strong>in</strong>ty analysis <strong>in</strong> a comparative <strong>LCA</strong> b<strong>et</strong>ween organic and conventional farm<strong>in</strong>g of soybean and barley<br />
Monia Niero * , Alessandro Manzardo, Sara Toniolo, Filippo Zuliani, Antonio Scipioni ..............................................................................................931<br />
182. Analysis and propagation of uncerta<strong>in</strong>ty <strong>in</strong> agricultural <strong>LCA</strong><br />
Xiaobo Chen 1,2,* , Michael Corson 1,2 .................................................................................................................................................................................933<br />
183. Quantify<strong>in</strong>g the impact of <strong>in</strong>-data variability and uncerta<strong>in</strong>ty on the life cycle assessment of dairy products<br />
Jacob Fels ...........................................................................................................................................................................................................................935
ORAL SESSIONS<br />
8 th International Conference on<br />
Life Cycle Assessment <strong>in</strong> the Agri-<strong>Food</strong> Sector<br />
October 1-4<br />
<strong>2012</strong><br />
Sa<strong>in</strong>t-<strong>Malo</strong><br />
<strong>France</strong>
KEYNOTE SESSION 8 th Int. Conference on <strong>LCA</strong> <strong>in</strong> the<br />
Agri-<strong>Food</strong> Sector, 1-4 Oct <strong>2012</strong><br />
Tuesday, 2 October<br />
Keynote session<br />
Susta<strong>in</strong>able food, a component of the green economy<br />
Dom<strong>in</strong>ique Dron<br />
Interm<strong>in</strong>isterial Delegate and General Commissioner for Susta<strong>in</strong>able Development, M<strong>in</strong>istry of Ecology, Susta<strong>in</strong>able Development<br />
and Energy, Paris, <strong>France</strong>.<br />
ABSTRACT<br />
From the French perspective, the green economy has both economic and environmental but also social objectives. Agriculture is at<br />
the crossroad of various environmental challenges and <strong>in</strong>volves liv<strong>in</strong>g organisms. Susta<strong>in</strong>able agriculture calls for new public policies<br />
which mobilise both consumers and producers. The proposal for environmental labell<strong>in</strong>g of products aims at launch<strong>in</strong>g signals to<br />
these different stakeholders to redirect their practices towards a low-carbon economy with low use of natural resources and pollution.<br />
Keywords: green economy, susta<strong>in</strong>able food, environmental labell<strong>in</strong>g<br />
1. The challenges of the green economy<br />
1.1 Roads towards a green economy after the "Rio+20" conference<br />
Firstly, dur<strong>in</strong>g the "Rio+20" summit, <strong>France</strong> defended a certa<strong>in</strong> view of what a green economy should be.<br />
It cannot be limited to a pure environmental approach, and even less to the question of climate change. This<br />
economy has to be friendly to natural balances (climate, ecosystems, <strong>et</strong>c.), spar<strong>in</strong>g resources and be also lowcarbon.<br />
Its objectives are environmental and economic, but also soci<strong>et</strong>al: it has to change consumption patterns<br />
<strong>in</strong> parallel with production m<strong>et</strong>hods. In fact, the green economy requires a new pattern of development<br />
with its cultural changes.<br />
It should be based on new technologies which spare energy, preserve natural resources and reduce greenhouse<br />
gases. Although new sectors have to emerge to modify the way our soci<strong>et</strong>ies work, all exist<strong>in</strong>g sectors,<br />
and agriculture <strong>in</strong> particular, must also change their production models.<br />
Refocus<strong>in</strong>g economic models requires different types of tools:<br />
• Wider knowledge and b<strong>et</strong>ter <strong>in</strong>formation available to stakeholders. Research is required for this, as is<br />
specific work to <strong>in</strong>form producers and consumers. In particular this requires work<strong>in</strong>g on <strong>in</strong>dicators<br />
downstream of science as these are means of convey<strong>in</strong>g or translat<strong>in</strong>g scientific knowledge to users,<br />
practitioners and citizens.<br />
• Regulatory <strong>in</strong>struments and economic <strong>in</strong>struments. Comply<strong>in</strong>g with the constitutional pr<strong>in</strong>ciple of<br />
polluter-pays <strong>in</strong> particular requires taxes and subsidies to be s<strong>et</strong>tled. Y<strong>et</strong> immediate economic <strong>in</strong>terests of<br />
some representatives of farm<strong>in</strong>g often oppose the former and do not enable the latter to be ideally targ<strong>et</strong>ed.<br />
Here aga<strong>in</strong>, scientific work upstream is essential to build a given <strong>in</strong>strument, prove its legitimacy and assess<br />
its <strong>in</strong>fluence and effects.<br />
The second element highlighted by Rio+20 is the necessity of mak<strong>in</strong>g progress on an <strong>in</strong>ternational level.<br />
The conference underl<strong>in</strong>ed the gap b<strong>et</strong>ween <strong>in</strong>dustrialised countries, emerg<strong>in</strong>g countries and develop<strong>in</strong>g<br />
countries with regard to the concept of green economy, whose global nature, particularly on the social level,<br />
is often desired but has not been recognised y<strong>et</strong>. We therefore welcome the <strong>in</strong>terest of <strong>in</strong>ternational work<br />
lead<strong>in</strong>g to general awareness rais<strong>in</strong>g, prior to action, such as the <strong>LCA</strong>-FOOD <strong>2012</strong> conference. B<strong>et</strong>ter identify<strong>in</strong>g<br />
the impact of production and consumption m<strong>et</strong>hods <strong>in</strong> different regions of the plan<strong>et</strong> is essential <strong>in</strong> the<br />
hope of establish<strong>in</strong>g fruitful and effective compromises <strong>in</strong> future. For this we need new, culturally shared<br />
tools on a scientific basis.<br />
F<strong>in</strong>ally, the third idea to be taken from Rio+20 is the ever <strong>in</strong>creas<strong>in</strong>g role of soci<strong>et</strong>y, often called “civil<br />
soci<strong>et</strong>y”, <strong>in</strong> negotiations. This mobilisation, and we could say this question<strong>in</strong>g, not only targ<strong>et</strong> States and<br />
public decision makers. They also address the research community. They should lead us to <strong>in</strong>crease <strong>in</strong>tegration<br />
of discipl<strong>in</strong>es and activities and to <strong>in</strong>volve soci<strong>et</strong>y <strong>in</strong> specialists' work far upstream.<br />
1.2 The agricultural nexus<br />
As to susta<strong>in</strong>able agriculture, the start<strong>in</strong>g po<strong>in</strong>t is the follow<strong>in</strong>g po<strong>in</strong>t shared by the research community<br />
and <strong>in</strong>ternational futurists: sufficient and varied food for 9 to 10 billion people <strong>in</strong> 2050 can be reached, but<br />
only if food production almost doubles.<br />
This scenario would imply a strong mobilisation of natural resources. Over the same period, energy demand<br />
will thus strongly <strong>in</strong>crease, as will pressure on water resources. The scale and success of the 6 th World<br />
Water Forum (March <strong>2012</strong> <strong>in</strong> Marseille) enabled these analyses to be shared. A nexus is now common-<br />
1
KEYNOTE SESSION 8 th Int. Conference on <strong>LCA</strong> <strong>in</strong> the<br />
Agri-<strong>Food</strong> Sector, 1-4 Oct <strong>2012</strong><br />
knowledged, illustrat<strong>in</strong>g the <strong>in</strong>tricate questions which are bundl<strong>in</strong>g the food/water/energy challenges, themselves<br />
l<strong>in</strong>ked to ecosystem functions as underl<strong>in</strong>ed dur<strong>in</strong>g the preparatory work for Rio+20. In addition, 43%<br />
of terrestrial area is already urbanised or cultivated, consequently reduc<strong>in</strong>g the regulatory capacity of ecosystems<br />
by almost half.<br />
Agriculture is at the heart of this nexus. And y<strong>et</strong> the question of large-scale agricultural production is still<br />
too often used as a simplistic watchword, mask<strong>in</strong>g the complexity of the actual situation. In reality, as the<br />
FAO says, "climate-smart farm<strong>in</strong>g systems that make efficient use of resources like water, land, and energy<br />
must become the basis of tomorrow's green economy". We must add the dependence of conventional systems<br />
on non-renewable materials like phosphate deposits, and essential soil conservation.<br />
Our preoccupation is therefore to commit to change towards susta<strong>in</strong>able systems. This was highlighted by<br />
the Grenelle programm<strong>in</strong>g law, propos<strong>in</strong>g to generalise susta<strong>in</strong>able and productive farm<strong>in</strong>g practices.<br />
1.3 Widen<strong>in</strong>g the concept of nexus: climate change and biodiversity<br />
The idea of a nexus leads to mobilis<strong>in</strong>g multiple resources; it underl<strong>in</strong>es the l<strong>in</strong>ks b<strong>et</strong>ween economy and<br />
environment. It is useful but rema<strong>in</strong>s <strong>in</strong>compl<strong>et</strong>e, notably because, as we have seen, it does not really take<br />
<strong>in</strong>to account biodiversity or climate change. Thus it only addresses environmental challenges <strong>in</strong> so far as they<br />
directly contribute to production. But as we look deeper <strong>in</strong>side natural processes, for reasons of susta<strong>in</strong>able<br />
development, and consider<strong>in</strong>g the precautionary pr<strong>in</strong>ciple and the notion of strong susta<strong>in</strong>ability, preservation<br />
of natural environment must be added to it.<br />
The work of INRA has highlighted the depressant effect of climate change on wheat yields. This effect is<br />
seen <strong>in</strong> European countries that have sought to free themselves as far as possible from natural production<br />
conditions to obta<strong>in</strong> the highest yields <strong>in</strong> the world. They are also observed <strong>in</strong> wheat and other crops <strong>in</strong> other<br />
countries <strong>in</strong> the world (Lobell <strong>et</strong> al., 2011). After a long period of wheat yields growth, their stagnation s<strong>in</strong>ce<br />
the 1990s or even the 1980s can be related to the hydric and thermal stress caused by climate change. As far<br />
as agriculture is concerned, climate must be considered as a natural resource <strong>in</strong> itself, a challenge dist<strong>in</strong>ct<br />
from the energy subject.<br />
A lot rema<strong>in</strong>s to be understood about the functions of liv<strong>in</strong>g organisms and the relationships that agricultural<br />
production forges with its environment. Biologists are highlight<strong>in</strong>g complex equilibria <strong>in</strong> which every<br />
liv<strong>in</strong>g component plays a role. Dupraz and Capillon (2005) and Dupraz, Liagre and Borrell (2005) recognised<br />
the roles played by trees <strong>in</strong> promot<strong>in</strong>g and protect<strong>in</strong>g crops. We therefore have to b<strong>et</strong>ter identify and<br />
characterise ecosystems, focus<strong>in</strong>g on the ecosystem services provided. This is the purpose of numerous studies<br />
worldwide, to which your research <strong>in</strong>stitutions are contribut<strong>in</strong>g.<br />
We know that ecosystems and their different components do not provide <strong>in</strong>terchangeable services; there<br />
is no pr<strong>in</strong>ciple of general equivalence b<strong>et</strong>ween the various elements of the natural environment. The services<br />
provided by ecosystems must be quantified and valued for economies and soci<strong>et</strong>ies to measure to what extent<br />
and for which reasons they are depend<strong>in</strong>g on them. This absolutely does not mean that ecosystem exchange<br />
mark<strong>et</strong>s have an environmental science-based foot<strong>in</strong>g, nor that money could replace a natural service. Non<strong>et</strong>heless,<br />
the value of biodiversity - to concentrate on this - is on the agenda for public decision makers and<br />
research. The purpose of the assessment is above all to underl<strong>in</strong>e the challenges. It must be equally qualitative<br />
and quantitative, and be expressed <strong>in</strong> physical volumes and mon<strong>et</strong>ary value to progress towards economic<br />
<strong>in</strong>struments for preservation.<br />
As a conclusion to these <strong>in</strong>itial remarks, a few po<strong>in</strong>ts can be highlighted at this stage:<br />
The l<strong>in</strong>k b<strong>et</strong>ween production and consumption, and the need to change simultaneously both parts of<br />
the equation <strong>in</strong> order to move towards a green economy which could be viable for a population of 9<br />
to 10 billion shar<strong>in</strong>g the same plan<strong>et</strong>.<br />
The role of soci<strong>et</strong>y and of <strong>in</strong>teraction with all stakeholders, to build viable models for the future.<br />
The strong l<strong>in</strong>kages b<strong>et</strong>ween natural resources and environment <strong>in</strong> general on one side, and economy<br />
and production on the other.<br />
The multi-criteria nature of the environmental challenge, which <strong>in</strong> reality covers several fields, all<br />
the more so when consider<strong>in</strong>g the aim of susta<strong>in</strong>able development. Therefore, we must consider that<br />
there is no absolute <strong>in</strong>dicator and that a s<strong>et</strong> of <strong>in</strong>dicators is required <strong>in</strong> spite of legitimate demands<br />
for simplification.<br />
The need for research <strong>in</strong> numerous fields: identification and characterisation of ecosystem services,<br />
environmental impacts, their measurement, and the assessment of their value and their functional<br />
l<strong>in</strong>ks with a view to susta<strong>in</strong>able production.<br />
2
KEYNOTE SESSION 8 th Int. Conference on <strong>LCA</strong> <strong>in</strong> the<br />
Agri-<strong>Food</strong> Sector, 1-4 Oct <strong>2012</strong><br />
2. Tools for susta<strong>in</strong>able food<br />
Susta<strong>in</strong>able food is one component of a green economy. It is also an emerg<strong>in</strong>g theme that needs to be<br />
characterised <strong>in</strong> order to establish suitable areas to focus on and identify the tools needed to achieve it.<br />
2.1 State <strong>in</strong>centives<br />
<strong>Food</strong> is a major susta<strong>in</strong>ability challenge. Accord<strong>in</strong>g to the EIPRO (Tukker <strong>et</strong> al., 2006) study, it represents<br />
20 to 30% of all consumption impacts. Susta<strong>in</strong>able food s<strong>et</strong>s the challenge of correctly feed<strong>in</strong>g, <strong>in</strong> quality<br />
and quantity, 9 to 10 billion people <strong>in</strong> 2050, whilst preserv<strong>in</strong>g the vital functions of our plan<strong>et</strong>. The importance<br />
of health <strong>in</strong> the social pillar of susta<strong>in</strong>able development is a characteristic of susta<strong>in</strong>able food. The<br />
susta<strong>in</strong>ability of food systems is therefore a complex question with no s<strong>in</strong>gle solution.<br />
Research on agricultural production m<strong>et</strong>hods that have proven to be susta<strong>in</strong>able both today and historically<br />
is one part of the answer, as the former example of trees and crops shows. One of these production<br />
m<strong>et</strong>hods is organic farm<strong>in</strong>g. It proved its environmental quality: scientific evidence attests the positive impact<br />
of organic farm<strong>in</strong>g on soil fertility, water resources, ecosystemic functions, landscape and biodiversity.<br />
This led to the ambitious objectives be<strong>in</strong>g s<strong>et</strong> for supply and consumption of organic products by the "Grenelle<br />
de l'Environnement" <strong>in</strong> <strong>France</strong>: 6% of the national total cultivated area devoted to organic farm<strong>in</strong>g <strong>in</strong><br />
<strong>2012</strong> and 20% <strong>in</strong> 2020. Organic farm<strong>in</strong>g has also demonstrated its capacity to produce <strong>in</strong> large volumes <strong>in</strong>sofar<br />
as it is not limited <strong>in</strong> nitrogen (Seufert <strong>et</strong> al., <strong>2012</strong>).<br />
In addition, public authorities are encourag<strong>in</strong>g the diversity of agri-food mark<strong>et</strong><strong>in</strong>g channels, thus respond<strong>in</strong>g<br />
to a social demand which is itself diversified. They are do<strong>in</strong>g this through support<strong>in</strong>g the development<br />
of alternative mark<strong>et</strong><strong>in</strong>g channels, <strong>in</strong> addition to the dom<strong>in</strong>ant mark<strong>et</strong><strong>in</strong>g model of supermark<strong>et</strong> distribution.<br />
For example, short distribution circuits and fair trade enable socio-economic factors to be b<strong>et</strong>ter <strong>in</strong>tegrated<br />
<strong>in</strong>to commercial exchanges. Both are examples of food policies implemented <strong>in</strong> <strong>France</strong>.<br />
However, the challenge of susta<strong>in</strong>ability <strong>in</strong> the whole agri-food sector requires more global approaches.<br />
The Government is contribut<strong>in</strong>g to this <strong>in</strong> particular through the development of "public green mark<strong>et</strong>s"<br />
which consist <strong>in</strong> <strong>in</strong>clud<strong>in</strong>g environmental criteria <strong>in</strong> public mark<strong>et</strong>s and thus <strong>in</strong>creas<strong>in</strong>g the purchase of ecological<br />
products by the public sector. The correct environmental criteria rema<strong>in</strong> to be identified, which po<strong>in</strong>ts<br />
at the former discussion about <strong>LCA</strong>s.<br />
2.2 Industrialists' approaches to environmental management<br />
Tools have also been implemented to enable bus<strong>in</strong>ess to move towards <strong>in</strong>tegrated susta<strong>in</strong>able approaches.<br />
The agri-food sector understood that susta<strong>in</strong>ability could be a source of <strong>in</strong>novation and comp<strong>et</strong>itiveness.<br />
Notably, for several years it has been undertak<strong>in</strong>g work on Corporate Social Responsibility (CSR). Accord<strong>in</strong>g<br />
to standard ISO 26000, this is "the responsibility of an organization for the impacts of its decisions and<br />
activities on soci<strong>et</strong>y and the environment". This is expressed <strong>in</strong> particular "through transparent and <strong>et</strong>hical<br />
behaviour that contributes to susta<strong>in</strong>able development, <strong>in</strong>clud<strong>in</strong>g health and the welfare of soci<strong>et</strong>y [and]<br />
takes <strong>in</strong>to account the expectations of stakeholders". CSR leads professionals to ask to themselves several<br />
questions on the impacts of the organisation and its stakeholders, as well as on possible areas for improvement.<br />
It illustrates the possible role of <strong>in</strong>dustrialists <strong>in</strong> susta<strong>in</strong>ability, consider<strong>in</strong>g all the stakeholders <strong>in</strong>volved.<br />
The ANIA (French National Association of the <strong>Food</strong> Industries), Coop de <strong>France</strong> (French federation of<br />
cooperatives) and AFNOR (French Standardisation Agency) have worked tog<strong>et</strong>her to develop a guide to<br />
us<strong>in</strong>g standard ISO 26000 for the agri-food sector. This tool can help <strong>in</strong>dustrialists who wish to materialise<br />
their action to promote susta<strong>in</strong>ability. In particular, it identifies the specific challenges of CSR for the sector.<br />
We particularly note its proposals of challenges and actions to take <strong>in</strong>to consideration the agricultural production<br />
level and encourage its participation when apply<strong>in</strong>g the CSR approach.<br />
This work represents an important step towards susta<strong>in</strong>ability to be taken <strong>in</strong>to account by the agri-food<br />
bus<strong>in</strong>ess. Both organic farm<strong>in</strong>g and CSR are mobilis<strong>in</strong>g certification and environmental management tools.<br />
These start from voluntary approaches of stakeholders and not from regulatory <strong>in</strong>struments. The State's <strong>in</strong>tervention<br />
consists <strong>in</strong> ensur<strong>in</strong>g that the regulatory framework necessary to these approaches is <strong>in</strong> order and <strong>in</strong><br />
economic support of organic farm<strong>in</strong>g and, to a far lesser extent, short distribution circuits.<br />
2.3 Action on consumption patterns<br />
3
KEYNOTE SESSION 8 th Int. Conference on <strong>LCA</strong> <strong>in</strong> the<br />
Agri-<strong>Food</strong> Sector, 1-4 Oct <strong>2012</strong><br />
We could not feature talk<strong>in</strong>g about susta<strong>in</strong>able food systems without discuss<strong>in</strong>g the role of consumers.<br />
Indeed, the progress realised by sectors could not deliver if consumers did not adapt their behaviour. The<br />
Collective Scientific Expertise by INRA (Etiévant <strong>et</strong> al., 2010) on the d<strong>et</strong>erm<strong>in</strong><strong>in</strong>g factors on di<strong>et</strong>ary behaviour<br />
of French people underl<strong>in</strong>ed the difficulty of chang<strong>in</strong>g <strong>in</strong>dividual practices. Here aga<strong>in</strong>, a comb<strong>in</strong>ation<br />
of several tools appears to be necessary.<br />
In this field, the agri-food sector can be considered as a pioneer with regard to the nutritional aspects: generic<br />
consumer <strong>in</strong>formation such as "5 fruits or veg<strong>et</strong>ables a day", community schemes to distribute milk and<br />
fruit <strong>in</strong> schools, nutritional rules <strong>in</strong> French school canteens and the labell<strong>in</strong>g of nutritional characteristics on<br />
products are all tools created to educate consumers throughout their daily life with a view to eat<strong>in</strong>g a varied<br />
and balanced di<strong>et</strong>. Confronted with the new questions of susta<strong>in</strong>ability, the agri-food sector is now widen<strong>in</strong>g<br />
its consumer-focused action to me<strong>et</strong> other challenges. The profession is highly <strong>in</strong>volved <strong>in</strong> the development<br />
of environmental labell<strong>in</strong>g, particularly <strong>in</strong> <strong>France</strong> and Europe.<br />
A large amount of research rema<strong>in</strong>s to be conducted <strong>in</strong> the food sector, as highlighted by the Agrimonde<br />
(Paillard, Treyer and Dor<strong>in</strong>, 2010) and duALIne (Esnouf <strong>et</strong> al., 2011) foresight studies by INRA and CIRAD.<br />
These two studies converge <strong>in</strong> underl<strong>in</strong><strong>in</strong>g the importance of di<strong>et</strong> <strong>in</strong> susta<strong>in</strong>able food. In particular, with regard<br />
to the environmental impacts of eat<strong>in</strong>g habits, the essential role of both quantities consumed and the<br />
consumption of animal products <strong>in</strong> the di<strong>et</strong> has been stressed.<br />
DuALIne also shows that an <strong>in</strong>tegrated approach to susta<strong>in</strong>ability <strong>in</strong> food research must urgently be developed.<br />
Therefore the ANR (National Research Agency <strong>in</strong> <strong>France</strong>) launched the ALID (susta<strong>in</strong>able food<br />
systems) research program. After two years of calls for proposals, we can draw the conclusion that <strong>in</strong>duc<strong>in</strong>g<br />
communities of researchers to update their work<strong>in</strong>g m<strong>et</strong>hods and jo<strong>in</strong>tly address the three challenges of susta<strong>in</strong>able,<br />
economic, environmental and social development (<strong>in</strong>clud<strong>in</strong>g the significance of health <strong>in</strong> relation to<br />
food) is not easy. In <strong>2012</strong>, more projects were correspond<strong>in</strong>g to the spirit of the calls and this progress is to<br />
be praised. Two projects <strong>in</strong> particular are plann<strong>in</strong>g to work on the assessment of agri-food products accord<strong>in</strong>g<br />
to the three dimensions of susta<strong>in</strong>able development and <strong>in</strong> particular to reduce their impacts. Non<strong>et</strong>heless,<br />
this type of project rema<strong>in</strong>s all too rare. This demonstrates the scale of the challenge to be m<strong>et</strong> by research<br />
teams <strong>in</strong> terms of susta<strong>in</strong>able development.<br />
2.4 Action on agri-food processes<br />
<strong>Food</strong> susta<strong>in</strong>ability is also to be achieved through significant improvements <strong>in</strong> processes and channels.<br />
We would just mention here two directions for deliberation and research.<br />
The first one is <strong>in</strong>spired by the physiology of liv<strong>in</strong>g organisms: observ<strong>in</strong>g that to feed their chicks, adult Emperor<br />
pengu<strong>in</strong>s could regurgitate fish that had rema<strong>in</strong>ed fresh <strong>in</strong> their stomach after several days, Hubert<br />
Curien Institute <strong>in</strong> Strasbourg (<strong>France</strong>) understood the process and isolated a molecule which stops the d<strong>et</strong>erioration<br />
of tissues. This discovery was at the root of patented applications that replace the use of refrigerators.<br />
The second one arises from observ<strong>in</strong>g the <strong>in</strong>creas<strong>in</strong>g vulnerability of crops to various hazards, and the<br />
significant robustness of comb<strong>in</strong>ed or mixed crops, to question the capacity of agro-<strong>in</strong>dustries to <strong>in</strong>crease the<br />
security of their supply by improv<strong>in</strong>g their plasticity. Distributors and consumers will also be concerned!<br />
Follow<strong>in</strong>g conclusions can be drawn from these considerations on the susta<strong>in</strong>ability challenges for the<br />
agri-food sector:<br />
the necessity for the State and private stakeholders to comb<strong>in</strong>e a wide range of <strong>in</strong>struments for<br />
<strong>in</strong>tervention, as the challenges of susta<strong>in</strong>able food are themselves multiple and there cannot be a<br />
s<strong>in</strong>gle solution;<br />
the importance of actions targ<strong>et</strong><strong>in</strong>g consumers, with a result which rema<strong>in</strong>s unforeseeable; here<br />
aga<strong>in</strong>, a comb<strong>in</strong>ation of tools is essential to be effective;<br />
strengthen<strong>in</strong>g actions targ<strong>et</strong><strong>in</strong>g consumers for themes other than nutrition is one key of the<br />
susta<strong>in</strong>ability of the agri-food sector; the need for more objective environmental <strong>in</strong>formation <strong>in</strong><br />
particular has been identified, giv<strong>in</strong>g guarantees to the consumer;<br />
f<strong>in</strong>ally, the need for research to progress <strong>in</strong> the assessment of environmental and social impacts of<br />
both consumption and production, impacts that rema<strong>in</strong> complex if we want to take account of all the<br />
challenges; the question of di<strong>et</strong>s and their susta<strong>in</strong>ability is at the heart of the research questions:<br />
many foresight models show that a change <strong>in</strong> di<strong>et</strong> of rich populations through the world towards<br />
fewer animal prote<strong>in</strong>s is essential to prepar<strong>in</strong>g a plan<strong>et</strong> viable for 9 to 10 billion.<br />
4
KEYNOTE SESSION 8 th Int. Conference on <strong>LCA</strong> <strong>in</strong> the<br />
Agri-<strong>Food</strong> Sector, 1-4 Oct <strong>2012</strong><br />
3. The environmental labell<strong>in</strong>g project<br />
This last part puts an emphasis on labell<strong>in</strong>g products with regard to environmental impacts.<br />
3.1 The operational scheme <strong>in</strong> <strong>France</strong><br />
The French environmental labell<strong>in</strong>g project corresponds to actions targ<strong>et</strong><strong>in</strong>g consumers, to help them orientat<strong>in</strong>g<br />
their choices <strong>in</strong> favour of less impact<strong>in</strong>g products. This project arose from the "Grenelle de l'environnement":<br />
article 54 of law No. 2009-967 of 3 August 2009, known as "Grenelle 1", establishes the consumer<br />
right to "be given access to s<strong>in</strong>cere, objective and compl<strong>et</strong>e environmental <strong>in</strong>formation concern<strong>in</strong>g the<br />
overall characteristics of the product and packag<strong>in</strong>g".<br />
This strong Grenelle measure should enable consumers to <strong>in</strong>clude an environmental component when<br />
purchas<strong>in</strong>g, whilst provid<strong>in</strong>g the entire production and distribution cha<strong>in</strong> with new, specific management<br />
<strong>in</strong>dicators. It thus encourages the eco-design of products.<br />
The deployment of this project requires harmonised environmental assessment m<strong>et</strong>hodologies, the availability<br />
of the data necessary to the <strong>LCA</strong> calculation and access to the needed calculations for all.<br />
To achieve this, the ADEME-AFNOR (2011) platform has produced a general best practices guide for the<br />
assessment of products' environmental impacts, BPX-30-323-0. Sector-specific work<strong>in</strong>g groups have been<br />
put <strong>in</strong>to place with<strong>in</strong> the platform to develop sector-specific environmental assessment reference documents.<br />
The platform proves the efficiency of an exemplary governance: progress by consensus, free enrolment<br />
and participation, and an open process of establish<strong>in</strong>g technical reference documents. This enables it to br<strong>in</strong>g<br />
tog<strong>et</strong>her various stakeholders: <strong>LCA</strong> scientific experts, experts from various bus<strong>in</strong>esses and sectors, associations,<br />
federations, environmental NGOs, consumer associations, government m<strong>in</strong>istries, ADEME and AF-<br />
NOR. 1,200 participants are <strong>in</strong>volved and 700 bodies are represented with<strong>in</strong> the platform.<br />
The platform's No. 1 work<strong>in</strong>g group, dedicated to the agri-food sector, has established the environmental<br />
impact assessment reference document for food products, which has now been f<strong>in</strong>alised and validated. The<br />
ma<strong>in</strong> characteristics of this reference document are as follows:<br />
functional unit: 100g/100ml, or the portion when this can be def<strong>in</strong>ed;<br />
life cycle phases: production (<strong>in</strong>clud<strong>in</strong>g of packag<strong>in</strong>g), transport, manufactur<strong>in</strong>g process, mark<strong>et</strong><strong>in</strong>g<br />
and distribution, use and end of life of the product and packag<strong>in</strong>g;<br />
the environmental impacts adopted for the products <strong>in</strong> the sector and the calculation m<strong>et</strong>hods are:<br />
Environmental impact<br />
category<br />
Indicator Unit Impact calculation m<strong>et</strong>hod<br />
Climate Change Greenhouse gases<br />
emissions<br />
g CO2-equiv. IPCC 2007<br />
Water consumption Water consumption Litres N<strong>et</strong> consumption; Water released <strong>in</strong> another watershed from which it<br />
was withdrawn is not <strong>in</strong>cluded; sea water or stable groundwater (over<br />
3 years) is not <strong>in</strong>cluded<br />
Water quality Mar<strong>in</strong>e eutrophication<br />
g N-equiv. Recipe 2008<br />
Water quality Aquatic ecotoxicity CTUe USE Tox<br />
Biodiversity loss To be def<strong>in</strong>ed To be def<strong>in</strong>ed<br />
To be def<strong>in</strong>ed<br />
Agri-food sub-sectors are currently establish<strong>in</strong>g product category rules (PCRs) specific to their product<br />
family: oil, milk, w<strong>in</strong>e and spirits, m<strong>in</strong>eral water, coffee and p<strong>et</strong> food.<br />
In parallel, the national trial def<strong>in</strong>ed by article 228 of French law no. 2010-788, known as "Grenelle 2", is<br />
be<strong>in</strong>g used to verify the feasibility of the approach on a practical level.<br />
3.2 Work at a European scale<br />
Significant work on m<strong>et</strong>hodology is also be<strong>in</strong>g conducted at European level and, overall, is highly consistent<br />
with the French work. Both levels share a multi-criteria approach to assess<strong>in</strong>g the environmental impact<br />
of products which is not limited to the carbon footpr<strong>in</strong>t. In the agri-food sector, this approach enables the<br />
<strong>in</strong>clusion of the fight aga<strong>in</strong>st climate change, the preservation of biodiversity, water quality, <strong>et</strong>c.<br />
The European Commission is rely<strong>in</strong>g on its Jo<strong>in</strong>t Research Centre (JRC), to develop a European standard<br />
for assess<strong>in</strong>g products' environmental footpr<strong>in</strong>ts (PEF-guide). This document is currently be<strong>in</strong>g f<strong>in</strong>alised.<br />
European directives may later draw on the PEF-guide to implement larger scale policies on environmental<br />
<strong>in</strong>formation to consumers. The JRC and European agri-food sectors are also work<strong>in</strong>g tog<strong>et</strong>her on the assess-<br />
5
KEYNOTE SESSION 8 th Int. Conference on <strong>LCA</strong> <strong>in</strong> the<br />
Agri-<strong>Food</strong> Sector, 1-4 Oct <strong>2012</strong><br />
ment of products' environmental impacts through the <strong>Food</strong> SCP (Susta<strong>in</strong>able Consumption and Production)<br />
Round Table. This Round Table should f<strong>in</strong>alise the ENVIFOOD Protocol, a harmonised m<strong>et</strong>hodological<br />
guide to assess<strong>in</strong>g the environmental impacts of agri-food products, <strong>in</strong> autumn <strong>2012</strong>.<br />
<strong>France</strong> supports harmonisation <strong>in</strong> this field and is ready to adopt European m<strong>et</strong>hodological standards as<br />
soon as they have been established via multi-stakeholder consultation processes, as is currently the case.<br />
3.3 Which research for which project?<br />
There still rema<strong>in</strong>s a significant need for research to achieve a compl<strong>et</strong>e environmental assessment of<br />
agri-food products. Scientific advances, which concern all the participants to the <strong>LCA</strong>-FOOD <strong>2012</strong> conference,<br />
are particularly anticipated for certa<strong>in</strong> environmental challenges, namely:<br />
a "water footpr<strong>in</strong>t" approached with more d<strong>et</strong>ail and relevance to agriculture, <strong>in</strong> other words, tak<strong>in</strong>g<br />
account of the vulnerability of the environments from which water is abstracted,<br />
a "biodiversity footpr<strong>in</strong>t"; on this po<strong>in</strong>t, <strong>LCA</strong> approaches that put too much emphasis on the effect of<br />
land occupation are poorly understood by either agricultural producers or consumers. The MEDDE<br />
(M<strong>in</strong>istry of Ecology, Susta<strong>in</strong>able Development and Energy) believes important progress must be<br />
made to b<strong>et</strong>ter take <strong>in</strong>to account agriculture's impact on biodiversity and, at this stage, proposes<br />
putt<strong>in</strong>g the emphasis rather on areas of biodiversity on farms.<br />
More generally, tools are needed that can b<strong>et</strong>ter take <strong>in</strong>to account the environmental <strong>in</strong>terest of extensive<br />
farm<strong>in</strong>g's low use of <strong>in</strong>puts. The choice to use the functional unit of the kg or litre is liable to give a bonus to<br />
the most <strong>in</strong>tensive use of <strong>in</strong>puts, which makes sense for the overall environmental impacts but risks relegat<strong>in</strong>g<br />
local impacts to the background. We are wait<strong>in</strong>g for research to br<strong>in</strong>g an analytical view to this po<strong>in</strong>t <strong>in</strong><br />
order to <strong>in</strong>form the public decision.<br />
Another sensitive subject is the measurement of greenhouse gas emissions tak<strong>in</strong>g <strong>in</strong>to account carbon<br />
storage (Rabl <strong>et</strong> al., 2007 ; Benoist <strong>et</strong> al., <strong>2012</strong>). Agricultural areas effectively present the characteristic of<br />
not only be<strong>in</strong>g carbon emitters but also potential carbon s<strong>in</strong>ks. <strong>LCA</strong>s, which orig<strong>in</strong>ally stem from an <strong>in</strong>dustrial<br />
environment, are still struggl<strong>in</strong>g to take account of this dimension. And y<strong>et</strong> it is essential, both from the<br />
scientific po<strong>in</strong>t of view and to ensure <strong>LCA</strong> approach to be acceptable to agricultural producers.<br />
These po<strong>in</strong>ts lead to a more general remark on the relationship b<strong>et</strong>ween research and soci<strong>et</strong>y's stakeholders.<br />
As mentioned above, susta<strong>in</strong>able development requires an <strong>in</strong>creased dialogue b<strong>et</strong>ween all parts of<br />
soci<strong>et</strong>y. Notably, research must be conducted <strong>in</strong> <strong>in</strong>teraction with the needs and questions raised by bus<strong>in</strong>esses<br />
and NGOs, <strong>in</strong>clud<strong>in</strong>g by tak<strong>in</strong>g <strong>in</strong>to account their po<strong>in</strong>ts of view on what the research should be and how it<br />
should be conducted.<br />
Public and private stakeholders are called to work with research to democratise <strong>LCA</strong> and provide the necessary<br />
m<strong>et</strong>hods, tools and data. Research must lead to operational m<strong>et</strong>hods and robust data. In the agri-food<br />
sector, the short-term provision of data that responds to the diversity of the m<strong>et</strong>hods of production, process<strong>in</strong>g,<br />
distribution and use by consumers is essential. The <strong>in</strong>-depth work already conducted by several sectors<br />
should enable the calculation of new <strong>LCA</strong>s to be simplified.<br />
The operational <strong>in</strong>volvement of the scientific community is essential to ensur<strong>in</strong>g the rigour of the m<strong>et</strong>hods<br />
and tools as well as the quality of the data. Researchers are already <strong>in</strong>volved, particularly <strong>in</strong> French and<br />
European m<strong>et</strong>hodological work, but their <strong>in</strong>volvement must <strong>in</strong>crease further. This will enable all stakeholders,<br />
<strong>in</strong>clud<strong>in</strong>g the consumers, to appropriate the subject of the environment and act rapidly faced by the<br />
environmental crisis, <strong>in</strong> cooperation and by shar<strong>in</strong>g scientific evidence culturally appropriated.<br />
4. Conclusion<br />
environmental labell<strong>in</strong>g is an appropriate tool for promot<strong>in</strong>g susta<strong>in</strong>able development <strong>in</strong> the agrifood<br />
sector;<br />
the large-scale development of this tool requires m<strong>et</strong>hodologies, tools and data to be rapidly<br />
developed to calculate products' environmental impacts;<br />
to do this, the <strong>in</strong>volvement of and dialogue b<strong>et</strong>ween all stakeholders, <strong>in</strong>clud<strong>in</strong>g scientific<br />
communities, are essential; this is the price at which we will be able to confront the environmental<br />
crisis with the support of robust evidence properly appropriated;<br />
it may be useful to adopt temporary rules or provide rough data to beg<strong>in</strong> with, <strong>in</strong> order to be able to<br />
shed some light over the short term and enable bus<strong>in</strong>ess and consumers to act immediately;<br />
6
KEYNOTE SESSION 8 th Int. Conference on <strong>LCA</strong> <strong>in</strong> the<br />
Agri-<strong>Food</strong> Sector, 1-4 Oct <strong>2012</strong><br />
there is a significant need for research; the assessment of products' impacts on the functions of liv<strong>in</strong>g<br />
organisms <strong>in</strong> particular is of major importance to the agri-food sector and this subject should receive<br />
more attention <strong>in</strong> the <strong>in</strong>ternational research agenda.<br />
5. References<br />
ADEME-AFNOR, 2011. General pr<strong>in</strong>ciples for an environmental communication on mass mark<strong>et</strong> products: BPX-30-323-0, 38 p.<br />
Benoist, A., Dron, D., Zoughaib, A., <strong>2012</strong>. Orig<strong>in</strong>s of the debate on the life-cycle greenhouse gas emissions and energy consumption<br />
of first generation - A sensitivity analysis approach. Biomass and Bioenergy, février <strong>2012</strong>.<br />
Dupraz, C., Capillon, A., 2005, L’agroforesterie: une voie de diversification écologique de l’agriculture européenne ?, Cahier d’étude<br />
DEMETER.<br />
Dupraz C., Liagre F., Borrell T., 2005, “Economics of silvoarable systems us<strong>in</strong>g the Land Equivalent Ratio<br />
concept”, <strong>in</strong> Silvoarable Agroforestry For Europe) f<strong>in</strong>al Report, available at:<br />
http://www.agroof.n<strong>et</strong>/agroof_dev/documents/safe/Economics_silvoarable_systems_LER_approach.pdf<br />
Esnouf, C., Russel, M. <strong>et</strong> Bricas, N., (Editors), 2011. duALIne – durabilité de l'alimentation face à de nouveaux enjeux. Questions à<br />
la recherche, Rapport Inra-Cirad (<strong>France</strong>), 254 p. Chapitre 3 consacré à la présentation de l'étude de cas ADEME-INRA sur l'impact<br />
carbone de régimes alimentaires différenciés selon leur qualité nutritionnelle.<br />
Etiévant, P., Bellisle, F., Dallongeville, J., Etilé, F., Guichard, E., Padilla, M., Romon-Rousseaux, M. (editors), 2010. Les comportements<br />
alimentaires. Quels en sont les déterm<strong>in</strong>ants ? Quelles actions, pour quels eff<strong>et</strong>s ? Expertise scientifique collective, rapport,<br />
INRA (<strong>France</strong>), 277 p.<br />
Lobell, D. B., Schlenker, W. and Costa-Roberts J., 2011. Climate Trends and Global Crop Production S<strong>in</strong>ce 1980. Science, Vol. 333,<br />
n°. 6042, pp. 616-620.<br />
Rabl, A., Benoist, A., Dron, D., Peuportier, B., Spadaro, J., Zoughaib, A., 2007.How to account for CO2 emissions from biomass <strong>in</strong><br />
an <strong>LCA</strong>. Int J <strong>LCA</strong> 12 (5) 281, June 2007.<br />
Paillard, S., Treyer, S., Dor<strong>in</strong>, B., 2010. Agrimonde Scénarios <strong>et</strong> défis pour nourrir le monde en 2050. Ed. Quae, 295 p.<br />
Seufert, V., Ramankutty, N., Foley, J., <strong>2012</strong>. Compar<strong>in</strong>g the yields of organic and conventional agriculture. Nature 485, 229-232.<br />
Tukker, A., Huppes, G., Gu<strong>in</strong>ée, J., Heijungs, R., de Kon<strong>in</strong>g, A., van Oers, L., Suh, S., Geerken, T., Van Holderbeke, M., Jansen, B.,<br />
P. Nielsen, 2006. Environmental Impact of Products (EIPRO). Analysis of the life cycle environmental impacts related to the f<strong>in</strong>al<br />
consumption of the EU-25. Ma<strong>in</strong> report IPTS/ESTO project.<br />
7
KEYNOTE SESSION 8 th Int. Conference on <strong>LCA</strong> <strong>in</strong> the<br />
Agri-<strong>Food</strong> Sector, 1-4 Oct <strong>2012</strong><br />
8<br />
Research priorities for susta<strong>in</strong>able agri-food systems and <strong>LCA</strong><br />
INRA, Paris, <strong>France</strong><br />
E-mail: jfsoussana@paris.<strong>in</strong>ra.fr<br />
Jean-François Soussana<br />
ABSTRACT<br />
Recogniz<strong>in</strong>g that research for susta<strong>in</strong>able agri-food systems will be essential to me<strong>et</strong> global and European challenges <strong>in</strong> the com<strong>in</strong>g<br />
decades, European countries participate <strong>in</strong> two Jo<strong>in</strong>t Programm<strong>in</strong>g Initiatives (JPIs): Agriculture, <strong>Food</strong> Security and Climate Change<br />
(FACCE) and Healthy Di<strong>et</strong> for Healthy Life (HDHL). Mission oriented research agendas have been developed and are focused on<br />
deliver<strong>in</strong>g key outputs. For FACCE: i) to susta<strong>in</strong>ably <strong>in</strong>tensify European agriculture, ii) to operate agriculture with<strong>in</strong> greenhouse gas,<br />
energy, biodiversity and contam<strong>in</strong>ant limits and iii) to build resilience to climatic change <strong>in</strong> agricultural and food systems. For<br />
HDHL: i) d<strong>et</strong>erm<strong>in</strong>ants of di<strong>et</strong> and physical activity, ii) develop<strong>in</strong>g healthy, high-quality, safe and susta<strong>in</strong>able foods, iii) di<strong>et</strong>-related<br />
chronic diseases. The role of life cycle assessment (<strong>LCA</strong>) <strong>in</strong> the context of these research priorities is discussed. Bridg<strong>in</strong>g nature<br />
capital, on the one hand, and health issues, on the other, with the assessment of the life cycle may lead to breakthroughs <strong>in</strong> the susta<strong>in</strong>ability<br />
assessment of food systems.<br />
Keywords: food security, agriculture, climate change, health, di<strong>et</strong>s<br />
1. Introduction<br />
Today’s agriculture and the food systems that it underp<strong>in</strong>s are at crossroads. <strong>Food</strong> security – the availability<br />
of and access to sufficient and healthy foods and good nutrition - is central for the well be<strong>in</strong>g of people<br />
and nations. Until recently, it was expected that despite climate change and <strong>in</strong>creas<strong>in</strong>g world population,<br />
there would be several decades with food surplus - and low prices - ahead (IPCC, 2007). Contrary to this<br />
expectation, the volatility of world food prices has <strong>in</strong>creased and two out of the last three years have been<br />
characterised by large spikes <strong>in</strong> <strong>in</strong>ternational gra<strong>in</strong> prices with some gra<strong>in</strong>s more than doubl<strong>in</strong>g <strong>in</strong> cost (von<br />
Braun 2008).<br />
1.1 Agriculture, food security and climate change<br />
A key challenge is to <strong>in</strong>crease the global food supply to accommodate a world grow<strong>in</strong>g to 9 billion or<br />
more people by 2050 while preserv<strong>in</strong>g a safe operat<strong>in</strong>g space for humanity by avoid<strong>in</strong>g dangerous environmental<br />
change (Rockström <strong>et</strong> al., 2009). Climate change is already negatively impact<strong>in</strong>g food production<br />
(Lobell <strong>et</strong> al., 2011, Coumou and Rahmstorf, <strong>2012</strong>), while the agriculture, land use and forestry sectors contribute<br />
almost one third of total greenhouse gas emissions and have a high potential for mitigation (IPCC,<br />
2007). Y<strong>et</strong>, the Earth still provides enough. While a billion people go hungry, half a billion are obese. The<br />
global calories deficit reaches only a few percents of global supply by agriculture and could be compensated<br />
by reduc<strong>in</strong>g food over-consumption. Moreover, 40% of the gra<strong>in</strong>s are used to feed livestock and an additional<br />
6.5% for biofuels. Furthermore, 40% of the totality of global food products is either lost after harvest<br />
or wasted (Bedd<strong>in</strong>gton <strong>et</strong> al., <strong>2012</strong>).<br />
A number of recent studies (Bedd<strong>in</strong>gton <strong>et</strong> al., <strong>2012</strong>; Paillard <strong>et</strong> al., 2011; IPPC, 2007) have <strong>in</strong>dicated the<br />
need for <strong>in</strong>creas<strong>in</strong>g research efforts <strong>in</strong> the area of agriculture, food security and climate change. International<br />
research programs (e.g. the CGIAR research programme on Climate Change, Agriculture and <strong>Food</strong> Security,<br />
CCAFS) have been <strong>in</strong>itiated to address this for the develop<strong>in</strong>g world. A Global Research Alliance on agricultural<br />
greenhouse gases has also been launched (Shafer <strong>et</strong> al., 2011). The Jo<strong>in</strong>t Programm<strong>in</strong>g of research Initiative<br />
on Agriculture, <strong>Food</strong> Security and Climate Change (FACCE JPI) has been work<strong>in</strong>g over the past two<br />
years to def<strong>in</strong>e the critical research elements of a European response to food security under climate change.<br />
Agriculture is a significant contributor to land degradation and anthropogenic global greenhouse gas<br />
emissions, be<strong>in</strong>g responsible for 25% of carbon (largely from deforestation), 50% of m<strong>et</strong>hane, and more than<br />
75% of N2O emitted annually by human activities (Tubiello <strong>et</strong> al., 2007). An estimated one third of the<br />
world's cropland is los<strong>in</strong>g topsoil faster than new soil is form<strong>in</strong>g and many of the poor live on degraded land<br />
(Nkonya <strong>et</strong> al., 2011). Agricultural expansion <strong>in</strong> the tropics is ma<strong>in</strong>ly based on deforestation, s<strong>in</strong>ce 80% of<br />
new tropical croplands are replac<strong>in</strong>g forests (Foley <strong>et</strong> al., 2011), which affects biodiversity and key ecosystem<br />
services. Species-rich regions of the world are under pressure from agriculture conversion, putt<strong>in</strong>g at risk<br />
animal and plant species, <strong>in</strong>clud<strong>in</strong>g hundreds of medic<strong>in</strong>al plants that are the basis for global health care<br />
(TEEB, 2010). Land use change result<strong>in</strong>g from expansion of agricultural land significantly contributes to<br />
CO2 emission (IPCC, 2007). Unprecedented water shortages are also <strong>in</strong>creas<strong>in</strong>gly apparent <strong>in</strong> many parts of<br />
the world, <strong>in</strong>clud<strong>in</strong>g southern Europe (Fereres <strong>et</strong> al., 2011) and an <strong>in</strong>creased frequency of heatwaves and
KEYNOTE SESSION 8 th Int. Conference on <strong>LCA</strong> <strong>in</strong> the<br />
Agri-<strong>Food</strong> Sector, 1-4 Oct <strong>2012</strong><br />
precipitation extremes has caused widespread agricultural production losses <strong>in</strong> the last decade (Coumou and<br />
Rahmstorf, <strong>2012</strong>).<br />
In many European countries, the growth trends of the yields of major crops, especially wheat, have decl<strong>in</strong>ed<br />
over the past two decades (Olesen <strong>et</strong> al., 2011). Moreover, the variability of crop yields has <strong>in</strong>creased<br />
as a consequence of extreme climatic events, such as the summer heat of 2003 which led to 36 billion Euros<br />
economic losses for the agriculture sector <strong>in</strong> the EU (IPCC, 2007) and to large carbon losses from ecosystems<br />
(Ciais <strong>et</strong> al., 2005), the summer drought and heat <strong>in</strong> 2010 destroy<strong>in</strong>g vast areas of crop stands <strong>in</strong> Russia,<br />
and the 2011 spr<strong>in</strong>g drought <strong>in</strong> <strong>France</strong>. Future climate change impacts on the European agricultural ecosystems<br />
are likely to contrast <strong>in</strong>creases <strong>in</strong> yield and expansion of climatically suitable areas <strong>in</strong> northern Europe,<br />
and more frequent water shortages and extreme weather events (heat, drought, storms) <strong>in</strong> southern Europe<br />
(B<strong>in</strong>di and Olesen, 2011).<br />
1.2. Di<strong>et</strong>s and health<br />
The food system <strong>in</strong> its entir<strong>et</strong>y (<strong>in</strong>clud<strong>in</strong>g pre-cha<strong>in</strong> <strong>in</strong>puts, agricultural production, food process<strong>in</strong>g and<br />
r<strong>et</strong>ail<strong>in</strong>g) is by far the largest <strong>in</strong>dustrial sector <strong>in</strong> Europe (Eurostat, 2008). European governments are struggl<strong>in</strong>g<br />
with the grow<strong>in</strong>g social and economic consequences of the alarm<strong>in</strong>g <strong>in</strong>crease <strong>in</strong> obesity and di<strong>et</strong> related<br />
diseases, <strong>in</strong>clud<strong>in</strong>g malnutrition (Stratton, 2007) and micronutrient deficiencies and di<strong>et</strong>-related chronic diseases.<br />
Increased affluence and urbanisation tend to reduce daily physical activity and ready to eat foods with<br />
high energy densities tend to replace the traditional di<strong>et</strong>s. In 2008, across the 27 countries of the European<br />
Union, 59% of adult men and 48% of adult women were either overweight or obese. There is grow<strong>in</strong>g evidence<br />
that obesity cont<strong>in</strong>ues throughout the life cycle with associated health-related problems, such as type 2<br />
diab<strong>et</strong>es, cardiovascular diseases, hypertension, and a range of cancers. Such lifestyle-related diseases have a<br />
negative impact on life expectancy, reduce the quality of life and lead to <strong>in</strong>creased health costs (HDHL JPI,<br />
<strong>2012</strong>).<br />
2. Priorities <strong>in</strong> research<br />
Recogniz<strong>in</strong>g that research will be essential to me<strong>et</strong> global and European challenges <strong>in</strong> the com<strong>in</strong>g decades,<br />
European countries participate <strong>in</strong> Jo<strong>in</strong>t Programm<strong>in</strong>g Initiatives (JPIs). The mission of a JPI is to<br />
achieve, support and promote <strong>in</strong>tegration, alignment and jo<strong>in</strong>t implementation of national resources under a<br />
common research and <strong>in</strong>novation strategy for fac<strong>in</strong>g key soci<strong>et</strong>al challenges. Two JPIs are concerned with<br />
agri-food systems: Agriculture, <strong>Food</strong> Security and Climate Change (FACCE) and Healthy Di<strong>et</strong> for Healthy<br />
Life (HDHL). Both JPIs are develop<strong>in</strong>g strategic research agendas <strong>in</strong> consultation with stakeholders. A new<br />
European Era-N<strong>et</strong>, Susfood, on Susta<strong>in</strong>able <strong>Food</strong> Production and Consumption has also been launched. Its<br />
strategic goal is to maximize the contribution of research to the development of more susta<strong>in</strong>able food systems<br />
from farm to fork.<br />
2.1 Agriculture, <strong>Food</strong> Security and Climate Change (FACCE JPI)<br />
Twenty-one European countries contribute to the Agriculture, <strong>Food</strong> Security and Climate Change<br />
(FACCE) JPI (Soussana <strong>et</strong> al., <strong>2012</strong>) and develop a common research and <strong>in</strong>novation strategy for fac<strong>in</strong>g the<br />
challenges at the <strong>in</strong>tersection of agriculture, food security and climate change.<br />
An <strong>in</strong>tegrated scientific research agenda has been designed and is focused on deliver<strong>in</strong>g key outputs: i) to<br />
susta<strong>in</strong>ably <strong>in</strong>tensify European agriculture to avoid <strong>in</strong>creas<strong>in</strong>g the demand on food production <strong>in</strong> other (e.g.<br />
develop<strong>in</strong>g) world regions, ii) to operate agriculture with<strong>in</strong> greenhouse gas, energy, biodiversity and contam<strong>in</strong>ant<br />
limits and iii) to build resilience to climatic change <strong>in</strong> agricultural and food systems. Crop and animal<br />
production systems of <strong>in</strong>creased productivity with reduced environmental footpr<strong>in</strong>t per unit product<br />
should be developed. This will require accurate benchmark<strong>in</strong>g (genotype x environment x management) of<br />
the ma<strong>in</strong> drivers, <strong>in</strong>clud<strong>in</strong>g socio-economics, of current agro-ecosystems, and the design, experimentation,<br />
and modell<strong>in</strong>g of alternative systems. To substantiate this, a Scientific Research Agenda (FACCE - JPI,<br />
2011) has been agreed, <strong>in</strong>clud<strong>in</strong>g five evidence based <strong>in</strong>terdiscipl<strong>in</strong>ary core research themes, which will<br />
yield high r<strong>et</strong>urns with the prospect to re<strong>in</strong>force the contribution of Europe to global public goods.<br />
1. Susta<strong>in</strong>able food security under climate change, based on an <strong>in</strong>tegrated food systems perspective:<br />
modell<strong>in</strong>g, benchmark<strong>in</strong>g and policy research,<br />
2. Environmentally susta<strong>in</strong>able growth and <strong>in</strong>tensification of agricultural systems under current and future<br />
resource availability,<br />
3. Assess<strong>in</strong>g and reduc<strong>in</strong>g trade-offs b<strong>et</strong>ween food production, biodiversity and ecosystem services,<br />
9
KEYNOTE SESSION 8 th Int. Conference on <strong>LCA</strong> <strong>in</strong> the<br />
Agri-<strong>Food</strong> Sector, 1-4 Oct <strong>2012</strong><br />
4. Adaptation to climate change throughout the whole food cha<strong>in</strong>, <strong>in</strong>clud<strong>in</strong>g mark<strong>et</strong> repercussions,<br />
5. Greenhouse gas mitigation: N2O and CH4 mitigation <strong>in</strong> the agriculture and forestry sector, soil carbon<br />
sequestration, fossil fuel substitution and mitigat<strong>in</strong>g GHG emissions <strong>in</strong>duced by <strong>in</strong>direct land use<br />
change.<br />
To reach these goals a systemic understand<strong>in</strong>g should be ga<strong>in</strong>ed, by develop<strong>in</strong>g and <strong>in</strong>tegrat<strong>in</strong>g a large<br />
range of discipl<strong>in</strong>es, that must be strongly connected to a foundation of agro-ecological and socio-economic<br />
modell<strong>in</strong>g. Key European <strong>in</strong>frastructures need to be assembled and developed <strong>in</strong> order to <strong>in</strong>tegrate scenarios,<br />
observations, experiments and models, develop and <strong>in</strong>ter-compare agro-ecological and socio-economic projections<br />
while assess<strong>in</strong>g their uncerta<strong>in</strong>ties. This should result <strong>in</strong> possible pathways for <strong>in</strong>novative developments<br />
of European food systems and of a bioeconomy with a decadal time frame reach<strong>in</strong>g 2030 or 2050. For<br />
<strong>in</strong>stance, given the generation times <strong>in</strong>volved <strong>in</strong> breed<strong>in</strong>g major food crops, to have adapted commercial<br />
l<strong>in</strong>es for 2030 will require at least 15 years of development.<br />
The development of this research will require <strong>in</strong>creased tra<strong>in</strong><strong>in</strong>g and capacity build<strong>in</strong>g <strong>in</strong> a number of discipl<strong>in</strong>es<br />
which have been neglected over the past decades (e.g. agronomy and animal husbandry, farm<strong>in</strong>g<br />
systems) and that need to move toward more <strong>in</strong>tegrated systems approaches, by b<strong>et</strong>ter <strong>in</strong>tegrat<strong>in</strong>g developments<br />
from a range of other discipl<strong>in</strong>es such as ecology, earth sciences, social sciences, applied mathematics<br />
and comput<strong>in</strong>g. A pilot action has been launched by the FACCE JPI concern<strong>in</strong>g the modell<strong>in</strong>g of climate<br />
change risks <strong>in</strong> the form of a large collaborative n<strong>et</strong>work (see www.macsur.eu).<br />
2.2 Healthy Di<strong>et</strong>s for Healthy Lives (HDHL JPI)<br />
The scientific agenda of the HDHL <strong>in</strong>itiative stresses that b<strong>et</strong>ter di<strong>et</strong>s and <strong>in</strong>creased physical activity will<br />
contribute to prevent<strong>in</strong>g or reduc<strong>in</strong>g the risk of illness and to reduc<strong>in</strong>g the high costs of health services. Attempts<br />
to <strong>in</strong>crease public awareness of the best way to eat more healthily have not led to major changes <strong>in</strong><br />
patterns of food purchase and consumption. More attention must be given to f<strong>in</strong>d<strong>in</strong>g ways to <strong>in</strong>crease people’s<br />
motivation, abilities and opportunities to make healthy choices (Brug, 2006). Research has shown that<br />
knowledge is often not a direct d<strong>et</strong>erm<strong>in</strong>ant of eat<strong>in</strong>g behaviour: some nutrition knowledge appears to be<br />
necessary but an <strong>in</strong>sufficient prerequisite for health behaviour changes. The follow<strong>in</strong>g three key <strong>in</strong>teract<strong>in</strong>g<br />
research areas were identified by the HDHL JPI:<br />
1. D<strong>et</strong>erm<strong>in</strong>ants of di<strong>et</strong> and physical activity: ensur<strong>in</strong>g the healthy choice is the easy choice for all consumers.<br />
The challenge is to understand the most effective ways for improv<strong>in</strong>g public health through <strong>in</strong>terventions<br />
targ<strong>et</strong><strong>in</strong>g motivation, ability and opportunity to adopt and ma<strong>in</strong>ta<strong>in</strong> healthy di<strong>et</strong>ary and<br />
physical activity behaviours.<br />
2. Di<strong>et</strong> and food production: develop<strong>in</strong>g healthy, high-quality, safe and susta<strong>in</strong>able foods. The challenge is<br />
to stimulate the European consumers to select foods that fit <strong>in</strong>to a healthy di<strong>et</strong> and to stimulate the food<br />
<strong>in</strong>dustry to produce healthier, high-quality foods <strong>in</strong> a safe, susta<strong>in</strong>able and affordable way.<br />
3. Di<strong>et</strong>-related chronic diseases: prevent<strong>in</strong>g di<strong>et</strong>-related, chronic diseases and <strong>in</strong>creas<strong>in</strong>g the quality of life.<br />
The challenge is to prevent or delay the ons<strong>et</strong> of di<strong>et</strong>-related chronic diseases by ga<strong>in</strong><strong>in</strong>g a b<strong>et</strong>ter understand<strong>in</strong>g<br />
of the impact of nutrition and lifestyle across Europe on human health and diseases (HDHL<br />
JPI, <strong>2012</strong>).<br />
3. Some recent trends <strong>in</strong> environmental assessment m<strong>et</strong>hods<br />
The FACCE and HDHL jo<strong>in</strong>t programm<strong>in</strong>g <strong>in</strong>itiatives have s<strong>et</strong> mission oriented scientific agendas, underl<strong>in</strong><strong>in</strong>g<br />
the <strong>in</strong>terdependency b<strong>et</strong>ween climate change, environment, agriculture and health issues and stress<strong>in</strong>g the<br />
pivotal role of food systems. Given their complexity, such systemic issues are <strong>in</strong>tr<strong>in</strong>sically difficult to boil<br />
down to changes <strong>in</strong> agricultural systems, <strong>in</strong> food products designs and <strong>in</strong> consumers choices. Nevertheless,<br />
both research agendas require improved m<strong>et</strong>hodologies for assess<strong>in</strong>g the susta<strong>in</strong>ability of agricultural supply<br />
cha<strong>in</strong>s and of food systems with<strong>in</strong> Europe. In addition to environmental susta<strong>in</strong>ability, economical and social<br />
dimensions, <strong>in</strong>clud<strong>in</strong>g foremost food security and health are also identified as key challenges for susta<strong>in</strong>ability.<br />
3.1 Towards more holistic assessments of environmental susta<strong>in</strong>ability<br />
Increas<strong>in</strong>gly, environmental evaluation m<strong>et</strong>hods are mov<strong>in</strong>g towards <strong>in</strong>tegrated assessments by: i) <strong>in</strong>corporat<strong>in</strong>g<br />
several environmental dimensions, ii) connect<strong>in</strong>g local and global issues and iii) assess<strong>in</strong>g long term<br />
effects, as well as non l<strong>in</strong>earities and thresholds.<br />
10
KEYNOTE SESSION 8 th Int. Conference on <strong>LCA</strong> <strong>in</strong> the<br />
Agri-<strong>Food</strong> Sector, 1-4 Oct <strong>2012</strong><br />
First, there are many examples of recent assessments which have attempted to unify environmental dimensions<br />
which were previously seen as be<strong>in</strong>g dist<strong>in</strong>ct. For <strong>in</strong>stance, the European Nitrogen Assessment<br />
(Sutton <strong>et</strong> al., 2011) considers the fate of anthropogenic nitrogen as a cascade of reactive N forms and effects.<br />
This cascade highlights how policy responses to different reactive N forms and issues are <strong>in</strong>ter-related,<br />
and shows that a holistic approach is needed, maximiz<strong>in</strong>g the abatement synergies and m<strong>in</strong>imiz<strong>in</strong>g the tradeoffs.<br />
Another example is the Millenium Ecosystem Assessment (2005) which has provided a unified perspective<br />
on biodiversity and ecosystems, show<strong>in</strong>g their role for a number of basic services to mank<strong>in</strong>d: i) provision<strong>in</strong>g<br />
services (provid<strong>in</strong>g resources that are directly exploited by humans, such as food, fibres, water, raw<br />
materials and medic<strong>in</strong>es); ii) support<strong>in</strong>g services (processes that <strong>in</strong>directly allow exploitation of natural resources,<br />
such as primary production and poll<strong>in</strong>ation); iii) regulat<strong>in</strong>g services (natural mechanisms responsible<br />
for climate regulation, nutrient and water circulation, pest regulation, flood prevention, <strong>et</strong>c…); iv) cultural<br />
services (benefits people ga<strong>in</strong> from the natural environment for recreational, cultural and spiritual purposes).<br />
Second, plan<strong>et</strong>ary boundaries that must not be transgressed to prevent unacceptable environmental<br />
changes have been identified and to some extent quantified (Rockström <strong>et</strong> al., 2009). The <strong>in</strong>creas<strong>in</strong>gly perceived<br />
f<strong>in</strong>ite nature of world natural resources has provided support for connect<strong>in</strong>g local and global issues.<br />
For <strong>in</strong>stance, <strong>in</strong>direct land use changes aris<strong>in</strong>g from biofuel expansion on arable lands were identified as<br />
likely causes of tropical deforestation lead<strong>in</strong>g to large <strong>in</strong>direct emissions of carbon dioxide (Search<strong>in</strong>ger <strong>et</strong><br />
al., 2008).<br />
Third, more attention is now be<strong>in</strong>g paid to some of the long term consequences of current decisions and<br />
policies. The gradual <strong>in</strong>tegration of socio-economic and emission (SRES) scenarios, of climate models and<br />
of impacts, adaptation and mitigation studies (IPCC, 2007) has pioneered novel <strong>in</strong>tegrated modell<strong>in</strong>g studies<br />
which have also been used <strong>in</strong> other areas than climate change, such as biodiversity (Bellard <strong>et</strong> al., <strong>2012</strong>) and<br />
food security (Paillard <strong>et</strong> al., 2011). Some of the results, po<strong>in</strong>t to large scale irreversible changes, such as the<br />
decl<strong>in</strong>e of the Amazonian forest, the collapse of the Greenland ice she<strong>et</strong> (Lenton <strong>et</strong> al., 2008) and of ecological<br />
n<strong>et</strong>works (Barnosky <strong>et</strong> al., <strong>2012</strong>).<br />
3.2 Consumption and lifestyle based environmental assessment<br />
Most of these holistic approaches to environmental assessment aggregate sectors and regions and report<br />
global impacts, as well as impacts per unit production or per unit land. Be<strong>in</strong>g production oriented, such assessments<br />
tend to miss the global consequences of consumption patterns and lifestyles. A different picture is<br />
obta<strong>in</strong>ed by <strong>in</strong>clud<strong>in</strong>g imports and exports, thereby reflect<strong>in</strong>g the impacts of consumption patterns rather than<br />
those of production. For <strong>in</strong>stance, not only does the European Union’s own production result <strong>in</strong> significant<br />
greenhouse gas emissions, but as a n<strong>et</strong> importer of primary agricultural and <strong>in</strong>dustrial commodities it causes<br />
large greenhouse gas emissions elsewhere (e.g. <strong>in</strong> Ch<strong>in</strong>a and Lat<strong>in</strong> America, Davis and Caldeira, 2010). Another<br />
example concerns food systems, with studies show<strong>in</strong>g that reduc<strong>in</strong>g overconsumption and food wastes<br />
(Paillard <strong>et</strong> al., 2011) or, more specifically, reduc<strong>in</strong>g meat consumption (Stehfest <strong>et</strong> al., 2009) has large potential<br />
consequences for food security and for the environmental susta<strong>in</strong>ability of the agriculture sector.<br />
4. Life cycle assessment <strong>in</strong> the context of research priorities<br />
At a more disaggregated level, a number of m<strong>et</strong>hods have been used, such as material flow analysis, n<strong>et</strong><br />
energy analysis and life cycle assessment (<strong>LCA</strong>) to assess the environmental impacts associated to man made<br />
products. Given its flexibility and widespread use, <strong>LCA</strong> plays an important role <strong>in</strong> design<strong>in</strong>g products, orient<strong>in</strong>g<br />
consumer’s decisions and evaluat<strong>in</strong>g policy measures (e.g. Weiss and Leip, <strong>2012</strong>). However, the applicability<br />
of <strong>LCA</strong> to agricultural systems may be challenged by consider<strong>in</strong>g the boundaries of the system<br />
studied.<br />
4.1 Nature capital and life cycle assessment: towards a new synthesis?<br />
The emergence of <strong>LCA</strong> started with studies aim<strong>in</strong>g at reduc<strong>in</strong>g the consumption of energy and of raw materials<br />
<strong>in</strong> the <strong>in</strong>dustry. In this context, the life cycle of a product can easily be seen from ‘cradle to grave’,<br />
that is from resource extraction to product disposal. Such boundaries tend, however, to become fuzzy when<br />
consider<strong>in</strong>g agricultural and food products which have a majority of their life cycle nested <strong>in</strong>to biological<br />
processes. Ecosystem goods and services support the technological activities <strong>in</strong> the life cycle of agricultural<br />
and food products (Zhang <strong>et</strong> al., 2010a). Moreover because of their organic nature, food products and their<br />
associated by-products are ultimately recycled <strong>in</strong> multiple loops with<strong>in</strong> biogeochemical cycles such as the<br />
11
KEYNOTE SESSION 8 th Int. Conference on <strong>LCA</strong> <strong>in</strong> the<br />
Agri-<strong>Food</strong> Sector, 1-4 Oct <strong>2012</strong><br />
carbon and nitrogen cycles (Sutton <strong>et</strong> al., 2011). Account<strong>in</strong>g for such multiple loops would require complex<br />
‘cradle to cradle’ (McDonough and Braungart, 2002) approaches that may render even more complex the<br />
attribution of the environmental burden.<br />
Recently approaches aim<strong>in</strong>g at <strong>in</strong>clud<strong>in</strong>g natural resources, such as land and water, <strong>in</strong>to the <strong>LCA</strong> m<strong>et</strong>hodology<br />
have been proposed (e.g. Garrigues <strong>et</strong> al., <strong>2012</strong>; Pfister <strong>et</strong> al., 2009). First, it is crucial to consider soil<br />
quality <strong>in</strong> the environmental assessment of agriculture and forestry products given its major role for plant<br />
productivity. Ref<strong>in</strong><strong>in</strong>g soil quality impacts <strong>in</strong> <strong>LCA</strong> requires the estimation of soil properties, functions and<br />
processes (e.g., erosion, compaction) on a regional, or even local, basis given the large spatial variability of<br />
soil properties. Develop<strong>in</strong>g robust impact <strong>in</strong>dicators for <strong>in</strong>dividual soil processes before attempt<strong>in</strong>g to aggregate<br />
them <strong>in</strong>to a s<strong>in</strong>gle <strong>in</strong>dicator has been proposed as a way to make progress (Garrigues <strong>et</strong> al., <strong>2012</strong>). Second,<br />
Pfister <strong>et</strong> al., (2009) presented a regionalised approach for assess<strong>in</strong>g water-use related environmental<br />
impacts with<strong>in</strong> exist<strong>in</strong>g <strong>LCA</strong> m<strong>et</strong>hods, us<strong>in</strong>g the example of worldwide cotton production. Their m<strong>et</strong>hod is<br />
based on the watershed level, at which hydrological processes are connected, and on the use of the virtual<br />
water concept, which describes the amount of water that is lost by evapotranspiration dur<strong>in</strong>g agricultural<br />
production <strong>in</strong> a given region. Not surpris<strong>in</strong>gly, impacts from water consumption <strong>in</strong> the cotton <strong>in</strong>dustry were<br />
found to be highly variable rang<strong>in</strong>g from high damage levels (e.g. 77% <strong>in</strong> Egypt) <strong>in</strong> dry areas to virtually no<br />
impact <strong>in</strong> areas with ample water resources (Pfister <strong>et</strong> al., 2009).<br />
Bridg<strong>in</strong>g the gap b<strong>et</strong>ween <strong>LCA</strong> and natural capital assessment can be seen as a key targ<strong>et</strong> for future research<br />
on the environmental susta<strong>in</strong>ability of food systems. Such an approach focuses on <strong>in</strong>puts from nature<br />
rather than on emissions to nature. A step <strong>in</strong> this direction was proposed by Zhang <strong>et</strong> al., (2010b) through the<br />
development of an Ecologically Based <strong>LCA</strong> (Eco-<strong>LCA</strong>) that <strong>in</strong>cludes a large number of provision<strong>in</strong>g, regulat<strong>in</strong>g,<br />
and support<strong>in</strong>g ecosystem services as <strong>in</strong>puts to a life cycle model at the process or economy scale.<br />
Includ<strong>in</strong>g an ecosystem service like grassland soil carbon sequestration (Soussana <strong>et</strong> al., 2007, 2010) <strong>in</strong>to a<br />
<strong>LCA</strong> has led to significant changes <strong>in</strong> the estimate of GHG emissions from European livestock systems<br />
(Weiss <strong>et</strong> al., <strong>2012</strong>). However, further progress is needed <strong>in</strong> order to regionalise ecosystem services prior to<br />
their <strong>in</strong>clusion <strong>in</strong> a <strong>LCA</strong> framework. Such a regionalisation has already been attempted through the development<br />
of a first atlas of ecosystem services at the scale of Europe (Maes <strong>et</strong> al., 2011).<br />
F<strong>in</strong>ally, spatial issues like <strong>in</strong>direct land use changes and temporal issues, such as irreversible environmental<br />
changes, are not y<strong>et</strong> tackled by <strong>LCA</strong> m<strong>et</strong>hodologies and this may be required to match the criteria of<br />
holistic environmental assessments.<br />
4.2 Squar<strong>in</strong>g the circle: di<strong>et</strong>s, health and life cycle assessment<br />
The DUALINE study (Esnouf <strong>et</strong> al., 2011) has analysed some of the research needs for assess<strong>in</strong>g the environmental<br />
susta<strong>in</strong>ability of di<strong>et</strong>s and their impacts on health and food security. There are several dimensions<br />
to the nutritional impacts of di<strong>et</strong>s (e.g. calories, prote<strong>in</strong>s, essential am<strong>in</strong>o-acids, micronutrients, <strong>et</strong>c…)<br />
(Sands <strong>et</strong> al., 2009) and, moreover, di<strong>et</strong> impacts on health may also vary accord<strong>in</strong>g to a number of other<br />
drivers, <strong>in</strong>clud<strong>in</strong>g lifestyles and physical activity (HDHL JPI, <strong>2012</strong>).<br />
A well-known value established by the World Health Organization <strong>in</strong> <strong>LCA</strong> models, which has been applied<br />
to water use (Pfister <strong>et</strong> al., 2009) and air pollution (Sutton <strong>et</strong> al., 2011), could be used for the health<br />
effects of di<strong>et</strong>s. The disability-adjusted life year is a value that expresses the number of years a person’s<br />
healthy life will be shortened as a result of disease or premature death. Provided that an <strong>in</strong>creased understand<strong>in</strong>g<br />
of the consequences of di<strong>et</strong>s for chronic diseases and for premature deaths can be developed for a<br />
given population (e.g. accord<strong>in</strong>g to age and gender structure and to physical activity levels) <strong>in</strong> a given region,<br />
this <strong>in</strong>dex could be used to standardize the impacts of di<strong>et</strong>s on health. If at all possible, given the many potential<br />
<strong>in</strong>teractions across nutrients with<strong>in</strong> di<strong>et</strong>s, the <strong>in</strong>dividual contribution to this <strong>in</strong>dex of food products<br />
could also be calculated.<br />
Y<strong>et</strong>, assess<strong>in</strong>g the environmental impacts of aggregated di<strong>et</strong>s from the life cycle of <strong>in</strong>dividual products is<br />
also challeng<strong>in</strong>g. First, a consumption based approach would be required whereas most life cycle studies<br />
start from the cradle of <strong>in</strong>dividual products. Second, fully assess<strong>in</strong>g the complex product mix along the long<br />
supply cha<strong>in</strong>s characteris<strong>in</strong>g Western di<strong>et</strong>s and food systems may seem out of reach. F<strong>in</strong>ally, how to reconcile<br />
health oriented and nature capital oriented <strong>LCA</strong>s is still an open question.<br />
5. Conclusions<br />
Judicious use of the European land resources supported by agricultural sciences could adapt production to<br />
climate change, lower emissions, and elim<strong>in</strong>ate n<strong>et</strong> imports thus contribut<strong>in</strong>g to <strong>in</strong>creas<strong>in</strong>g global food security.<br />
Europe is well placed to address these issues s<strong>in</strong>ce it recognizes the significance of global climate<br />
12
KEYNOTE SESSION 8 th Int. Conference on <strong>LCA</strong> <strong>in</strong> the<br />
Agri-<strong>Food</strong> Sector, 1-4 Oct <strong>2012</strong><br />
change and could therefore provide a space for change, test<strong>in</strong>g an implementation of novel strategic concepts<br />
based on new bio-physical and socio-economic research (Soussana <strong>et</strong> al., <strong>2012</strong>). Moreover, European cultures<br />
have developed a large vari<strong>et</strong>y of di<strong>et</strong>s (e.g. ‘Mediterranean’ di<strong>et</strong>) and of traditional ways of food production<br />
and food consumption that may help <strong>in</strong> develop<strong>in</strong>g healthy di<strong>et</strong>s for a healthy life. However, this will<br />
depend ultimately on consumer’s choices that need to be b<strong>et</strong>ter <strong>in</strong>formed. Life cycle assessment can play an<br />
important role <strong>in</strong> design<strong>in</strong>g products, orient<strong>in</strong>g consumer’s decisions and fram<strong>in</strong>g policy options, but it needs<br />
to overcome several difficulties some of which have been addressed here. Bridg<strong>in</strong>g nature capital, on the one<br />
hand, and health issues, on the other, with the assessment of the life cycle may lead to breakthroughs <strong>in</strong> the<br />
susta<strong>in</strong>ability assessment of food systems.<br />
6. References<br />
Barnosky, A.D., Hadly, E.A., Bascompte, J. <strong>et</strong> al., <strong>2012</strong>. Approach<strong>in</strong>g a state shift <strong>in</strong> Earth’s biosphere. Nature 486, 52-57.<br />
Bedd<strong>in</strong>gton, J.R., Asaduzzaman, M., Clark, M.E. <strong>et</strong> al., <strong>2012</strong>. What next for agriculture after Durban? Science 335, 289-290.<br />
Bellard, C., Bertelsmeier, C., Leadley, P., <strong>et</strong> al., <strong>2012</strong>. Impacts of climate change on the future of biodiversity. Ecol. L<strong>et</strong>t. 15, 365-<br />
377.<br />
B<strong>in</strong>di, M., Olesen, J.E., 2011. The responses of agriculture <strong>in</strong> Europe to climate change. Reg. Envir. Change 11, 151-158.<br />
Brug, J., 2008. D<strong>et</strong>erm<strong>in</strong>ants of healthy eat<strong>in</strong>g: motivation, abilities and environmental opportunities. Family Practice 2008;25:i50i55.<br />
Ciais, P., Reichste<strong>in</strong>, M., Viovy <strong>et</strong> al., 2005. Europe-wide reduction <strong>in</strong> primary productivity caused by the heat and drought <strong>in</strong> 2003.<br />
Nature 437, 529-533.<br />
Coumou, D., Rahmstorf, S., <strong>2012</strong>. A decade of weather extremes. Nature Climate Change 452, 1-5.<br />
Davis, S.J., Caldeira, K. (2010) Consumption-based account<strong>in</strong>g of CO2 emissions. Proc Natl Acad Sci USA 107, 5687-5692.<br />
Esnouf, C., Russell, M. <strong>et</strong> Bricas, N. (eds) 2011. Dual<strong>in</strong>e, Durabilité de l’alimentation face à de nouveaux enjeux. Questions pour la<br />
recherche. QUAE, Paris, 288 pp.<br />
Eurostat, 2008. <strong>Food</strong>: from farm to fork statistics. Luxembourg: Office for Official Publications of the European Communities. 199<br />
pp. ISBN 978-92-79-08736-3.<br />
FACCE-JPI, 2011. Scientific Research Agenda of the ‘Agriculture, <strong>Food</strong> Security and Climate Change’ Jo<strong>in</strong>t Programm<strong>in</strong>g Research<br />
Initiative. See www.faccejpi.com.<br />
Fereres, E., Orgaz, F., Gonzalez-Dugo, V. 2011. Reflections on food security under water scarcity. J. Exp. Bot. 62, 4079-4086.<br />
Foley, J.A., Ramankutty, N., Brauman, K.A. <strong>et</strong> al., 2011. Solutions for a cultivated plan<strong>et</strong>. Nature 478, 337-342.<br />
Garrigues, E., Corson, M.S., Angers, D.A. <strong>et</strong> al., <strong>2012</strong>. Ecol. Indicators 18, 434-442.<br />
HDHL-JPI, <strong>2012</strong>. Strategic Research Agenda of the Jo<strong>in</strong>t Programm<strong>in</strong>g Initiative ‘A healthy di<strong>et</strong> for a healthy life’. See<br />
www.healthydi<strong>et</strong>forhealthylife.eu<br />
Intergovernmental Panel on Climate Change, IPCC, 2007. Climate change: impacts, adaptation and vulnerability, Contribution of<br />
Work<strong>in</strong>g Group II to the Fourth Assessment Report of the Intergovernmental Panel on Climate Change (eds. Parry ML, Canziani<br />
OF, Palutikof JP, van der L<strong>in</strong>den PJ, Hanson CE). Cambridge University Press, Cambridge, New York.<br />
Lenton, T., Held, H., Kriegler, E. <strong>et</strong> al., 2008. Tipp<strong>in</strong>g elements <strong>in</strong> the Earth’s climate system. Proc Natl Acad Sci USA 105, 1786-<br />
1793.<br />
Lobell, B., Schlenker, W., Costa-Roberts, J. 2011. Climate trends and global crop production s<strong>in</strong>ce 1980. Science 333, 616-620.<br />
Maes, J., Paracch<strong>in</strong>i, M.L., Zulian, G., 2011. A European assessment of the provision of ecosystem services. European Commission,<br />
JRC, Institute for Environment and Susta<strong>in</strong>ability, 88 pp. EUR 24750 EN – 2011 ISBN 978-92-79-19663-8. Luxembourg:<br />
Publications Office of the European Union.<br />
McDonough, W., Braungart, M. 2002. Cradle to cradle: remak<strong>in</strong>g the way we make th<strong>in</strong>gs. V<strong>in</strong>tage publisher, New-York, 208 pp.<br />
Millennium Ecosystem Assessment, 2005. Ecosystems and Human Well-be<strong>in</strong>g: Synthesis. Island Press, Wash<strong>in</strong>gton, DC., 155 pp.<br />
Nkonya, E., Gerber, N., Baumgartner, P. <strong>et</strong> al., 2011. The Economics of Land Degradation Toward an Integrated Global Assessment.<br />
Development Economics and Policy. Volume 66. Spr<strong>in</strong>ger, Frankfurt am Ma<strong>in</strong>, Berl<strong>in</strong>, Bern, Bruxelles, New York, Oxford,<br />
Wien.<br />
Olesen, J.E., Trnka, M., Kersebaum, K.C. <strong>et</strong> al., 2011. Impacts and adaptation of European crop production systems to climate<br />
change. European J. Agron. 34, 96-112.<br />
Paillard, S., Treyer, S., Dor<strong>in</strong>, B., eds. 2011. Agrimonde: Scenarios and Challenges for Feed<strong>in</strong>g the World <strong>in</strong> 2050. Éditions Quae,<br />
Versailles.<br />
Pfister, S., Koehler, A., Hellweg, S., <strong>et</strong> al., 2009. Assess<strong>in</strong>g the Environmental Impacts of Freshwater Consumption <strong>in</strong> <strong>LCA</strong>. Environ.<br />
Sci. Technol., 43, 4098–4104<br />
Rockström, J., Steffen, W., Noone, K. <strong>et</strong> al., 2009. A safe operat<strong>in</strong>g space for humanity. Nature 461, 472-475.<br />
Sands, D.C., Morris, C.E., Dratz, E.A., 2009. Elevat<strong>in</strong>g optimal human nutrition to a central goal of plant breed<strong>in</strong>g and production of<br />
plant-based foods. Plant Science 177, 377–389.<br />
Search<strong>in</strong>ger, T., Heimlich, R., Houghton, R.A., <strong>et</strong> al., 2008. Use of US croplands for biofuels <strong>in</strong>creases greenhouse gases through<br />
emissions from land-use change. Science, 319, 1238-1240.<br />
Shafer, S., Walthall, C.L., Fransluebbers, S.R. <strong>et</strong> al., 2011. Editorial. emergence of the global research alliance on greenhouse gas<br />
mitigation. Carbon Management 2, 1-5.<br />
Soussana, J.F., Allard, V., Pilegaard, K. <strong>et</strong> al., 2007. Full account<strong>in</strong>g of the greenhouse gas (CO2, N2O, CH4) budg<strong>et</strong> of n<strong>in</strong>e European<br />
grassland sites Agric. Ecosyst. Envir. 121, 121-134.<br />
Soussana, J.-F., Fereres, E., Long, S.P., Mohren, G.M.J., Pandya-Lorch, R., Peltonen-Sa<strong>in</strong>io, P., Porter, J.R., Rosswall, T., von<br />
Braun, J.; <strong>2012</strong>. A European science plan to susta<strong>in</strong>ably <strong>in</strong>crease food security under climate change. Global Change Biology.<br />
DOI: 10.1111/j.1365-2486.<strong>2012</strong>.02746.x<br />
13
KEYNOTE SESSION 8 th Int. Conference on <strong>LCA</strong> <strong>in</strong> the<br />
Agri-<strong>Food</strong> Sector, 1-4 Oct <strong>2012</strong><br />
Soussana, J.F., Tallec, T., Blanfort, V., 2010 Mitigat<strong>in</strong>g the greenhouse gas balance of rum<strong>in</strong>ant production systems through carbon<br />
sequestration <strong>in</strong> grasslands. Animal 4, 334-350.<br />
Stehfest, E., Bouwman, L., van Vuuren, D.P. <strong>et</strong> al., 2009. Climate benefits of chang<strong>in</strong>g di<strong>et</strong>. Climatic Change 95:83–102<br />
Stratton, R.J., 2007. Malnutrition: another health <strong>in</strong>equality? Proc. Nutr. Soc., 66:522-529.<br />
Sutton, M.A., Oenema, O., Erisman, J.W. <strong>et</strong> al., 2011. Too much of a good th<strong>in</strong>g. Nature, 472, 159-161.<br />
TEEB, 2009. The economics of ecosystems and biodiversity for national and <strong>in</strong>ternational policy makers – Summary: Respond<strong>in</strong>g to<br />
the Value of Nature. 47 p. United Nations Environment Program, ISBN 978-3-9813410-0-3.<br />
Tubiello, FN, Soussana, J-F, Howden S.M., 2007. Crop and pasture response to climate change. Proc Natl Acad Sci USA<br />
104:19686–19690.<br />
Von Braun, J., 2008. The food crisis isn't over. Nature 456, 701.<br />
Weiss, F., Leip, A., <strong>2012</strong>. Greenhouse gas emissions from the EU livestock sector: A life cycle assessment carried out with the CA-<br />
PRI model. Agric. Ecosyst. & Envir., 149, 124-134.<br />
Zhang, Y.I., S<strong>in</strong>gh, S.H, and Bakshi, B.R., 2010a. Account<strong>in</strong>g for ecosystem services <strong>in</strong> life cycle assessment, Part I: A Critical<br />
Review. Environ. Sci. Technol. 44, 2232–2242<br />
Zhang, Y.I., S<strong>in</strong>gh, S.H, and Bakshi, B.R., 2010b Account<strong>in</strong>g for ecosystem services <strong>in</strong> life cycle assessment, Part II: Toward an<br />
Ecologically Based <strong>LCA</strong> Environ. Sci. Technol. 44, 2624–2631<br />
14
KEYNOTE SESSION 8 th Int. Conference on <strong>LCA</strong> <strong>in</strong> the<br />
Agri-<strong>Food</strong> Sector, 1-4 Oct <strong>2012</strong><br />
Three perspectives on susta<strong>in</strong>able food security: efficiency, demand<br />
restra<strong>in</strong>t, food system transformation. What role for <strong>LCA</strong>?<br />
Tara Garn<strong>et</strong>t<br />
<strong>Food</strong> Climate Research N<strong>et</strong>work, Environmental Change Institute, University of Oxford<br />
-mail: taragarn<strong>et</strong>t@fcrn.org.uk<br />
ABSTRACT<br />
Achiev<strong>in</strong>g food system susta<strong>in</strong>ability is a global priority but there are different views on how it might be achieved. Broadly three<br />
perspectives are emerg<strong>in</strong>g, def<strong>in</strong>ed here as: efficiency oriented, demand restra<strong>in</strong>t and food system transformation. These reflect different<br />
conceptualisations on what is practically achievable, and what is desirable, underp<strong>in</strong>ned by different values and ideologies<br />
about the role of technology, our relationship with nature and fundamentally what is meant by a ‘good life.’ This paper describes<br />
these emerg<strong>in</strong>g perspectives and explores their underly<strong>in</strong>g values; highlights <strong>LCA</strong>’s role <strong>in</strong> shap<strong>in</strong>g these perspectives; and considers<br />
how <strong>LCA</strong> could be oriented to clarify th<strong>in</strong>k<strong>in</strong>g and advance policy-relevant knowledge. It argues that more work is needed to understand<br />
the values underly<strong>in</strong>g different approaches to the food susta<strong>in</strong>ability problem. This can shed light on why stakeholders disagree,<br />
where there are genu<strong>in</strong>e misunderstand<strong>in</strong>gs, and where common ground is possible and ways forward agreed.<br />
Keywords: climate change; food system; stakeholder perspectives; mitigation, life cycle analysis<br />
1. Introduction<br />
The food ‘problem’ has become a global obsession. How much and what k<strong>in</strong>d of food is produced, how<br />
and by whom; how it is moved, processed, packaged and sold and with what impacts; who g<strong>et</strong>s what and<br />
how much to eat, and at the expense of whom - and what the future might hold for all these variables; these<br />
questions are now the subject of measurement, analysis, critique and campaign<strong>in</strong>g <strong>in</strong> research journals, policy<br />
documents, newspapers and television screens worldwide.<br />
As such, the scale of the problems we face and their relationship with the food system are now well recognised<br />
and have been exhaustively described elsewhere (Godfray <strong>et</strong> al., 2010; Bedd<strong>in</strong>gton <strong>et</strong> al., 2011 Foresight<br />
2011). Put briefly: our global population is rapidly grow<strong>in</strong>g, urbanis<strong>in</strong>g and becom<strong>in</strong>g wealthier, one<br />
consequence be<strong>in</strong>g that our di<strong>et</strong>ary patterns are chang<strong>in</strong>g and our demand for land, resource and greenhouse<br />
gas (GHG) <strong>in</strong>tensive foods, such as meat and dairy products, is on the <strong>in</strong>crease. But while the demands we<br />
place on the earth may be grow<strong>in</strong>g, its available resources– of land, water, m<strong>in</strong>erals - are f<strong>in</strong>ite. The difficulties<br />
presented by this demand-supply imbalance are compounded by chang<strong>in</strong>g environmental conditions<br />
which make food production <strong>in</strong>creas<strong>in</strong>gly difficult or unpredictable <strong>in</strong> many regions of the world; and production<br />
systems that not only underm<strong>in</strong>e aspects of the ecosystem, such as biodiversity and water quality,<br />
upon which we ultimately depend, but also exacerbate zoonotic diseases and other risks that directly affect<br />
our health. Perhaps most starkly, <strong>in</strong>equities and distortions <strong>in</strong> how both the <strong>in</strong>puts to and outputs from food<br />
production are distributed have given rise to a paradoxical situation where<strong>in</strong> 1.4 billion people world wide is<br />
overweight or obese, while 850 million lack sufficient calories and are undernourished (Sw<strong>in</strong>burn <strong>et</strong> al.,<br />
2011; FAO 2011).The challenge is therefore to refashion the food system to deliver b<strong>et</strong>ter nutritional outcomes<br />
at less environmental cost. But while this much is clear, the proposed solutions have been less coherently<br />
articulated and are certa<strong>in</strong>ly more contested. Stakeholders - across and with<strong>in</strong> the food <strong>in</strong>dustry, civil<br />
soci<strong>et</strong>y, policy makers and the research community - have often strik<strong>in</strong>gly different views on what should be<br />
done.<br />
It is argued here that broadly three perspectives are emerg<strong>in</strong>g <strong>in</strong> the debate on food system susta<strong>in</strong>ability<br />
today. These <strong>in</strong> turn reflect different conceptualisations as to what is practically achievable given the variables<br />
of technological <strong>in</strong>novation, the function<strong>in</strong>g of the global economy and human motivations and behaviour<br />
- as well as different visions of what a susta<strong>in</strong>able food system actually looks like. These are <strong>in</strong> turn<br />
underp<strong>in</strong>ned by different values and ideologies about the role of technology, our relationship with nature and<br />
fundamentally of what is meant by a ‘good life.’<br />
The purpose of this paper is threefold: to describe these three emerg<strong>in</strong>g perspectives on the nutritionenvironment<br />
challenge and explore their underly<strong>in</strong>g values; to highlight the role that life cycle analysis<br />
(<strong>LCA</strong>) has played <strong>in</strong> shap<strong>in</strong>g these perspectives; and f<strong>in</strong>ally, to consider how <strong>LCA</strong> could be oriented and<br />
utilised <strong>in</strong> ways that clarify th<strong>in</strong>k<strong>in</strong>g and help advance policy-relevant knowledge <strong>in</strong> this field. It should be<br />
emphasised that, except at the extremes, these perspectives are not rigid and mutually exclusive. There will<br />
often be overlap b<strong>et</strong>ween them and they are perhaps b<strong>et</strong>ter viewed as ideological ‘tendencies’ rather than<br />
closed belief systems. The research community is represented across all three approaches.<br />
15
KEYNOTE SESSION 8 th Int. Conference on <strong>LCA</strong> <strong>in</strong> the<br />
Agri-<strong>Food</strong> Sector, 1-4 Oct <strong>2012</strong><br />
2. Perspectives on achiev<strong>in</strong>g food system susta<strong>in</strong>ability<br />
The three approaches are def<strong>in</strong>ed as follows: efficiency oriented; demand restra<strong>in</strong>t perspective; and food<br />
system transformation.<br />
2.1. Efficiency<br />
This is perhaps the dom<strong>in</strong>ant approach. Its advocates <strong>in</strong>clude governments and food <strong>in</strong>dustry actors such<br />
as agricultural <strong>in</strong>put bus<strong>in</strong>esses, farm<strong>in</strong>g unions, manufacturers and r<strong>et</strong>ailers. These stakeholders see technological<br />
<strong>in</strong>novations and managerial changes as key to reduc<strong>in</strong>g environmental impacts and enhanc<strong>in</strong>g nutrition<br />
(ADAS <strong>et</strong> al., 2011). Agricultural efficiencies can be achieved by, for example, optimis<strong>in</strong>g the tim<strong>in</strong>g<br />
and quantity of fertilisers applied, us<strong>in</strong>g drip irrigation and other precision agriculture techniques and deploy<strong>in</strong>g<br />
technologies, such as anaerobic digestion, that recover utility from agricultural waste (manure, crop residues).<br />
Productivity <strong>in</strong>creases <strong>in</strong> livestock can reduce emissions per unit of production, with approaches <strong>in</strong>clud<strong>in</strong>g:<br />
breed<strong>in</strong>g for higher yields (of meat, milk or eggs), formulat<strong>in</strong>g feeds to maximise yields while<br />
m<strong>in</strong>imis<strong>in</strong>g nitrogen or m<strong>et</strong>hane losses, and develop<strong>in</strong>g hous<strong>in</strong>g systems that optimise conditions for growth<br />
(Garn<strong>et</strong>t 2011). Post harvest, emissions can be reduced through the refrigeration, manufactur<strong>in</strong>g and transport<br />
technologies that are more energy efficient or based on renewable energy source. Waste is m<strong>in</strong>imised<br />
through b<strong>et</strong>ter <strong>in</strong>ventory management, by modify<strong>in</strong>g packag<strong>in</strong>g and portion sizes and through other approaches<br />
that either prolong the shelf life of foods or help consumers reduce food waste <strong>in</strong> other ways<br />
(WRAP <strong>2012</strong>).<br />
While this perspective does not explicitly argue for this approach on moral grounds, it is nevertheless underp<strong>in</strong>ned<br />
by a moral framework and s<strong>et</strong> of values - a sense not only of what constitutes progress for humanity<br />
but an optimism that it can be achieved. Thus, a strong component of a good life is one <strong>in</strong> which more<br />
people will achieve the material comforts enjoyed by affluent consumers <strong>in</strong> the develop<strong>in</strong>g world today – but<br />
with less environmental impact. Us<strong>in</strong>g technology, the boundaries of our environmental limits can be extended<br />
to accommodate us and, provided the right mark<strong>et</strong> signals are <strong>in</strong> place, the global economy will enable<br />
both the material and environmental benefits to trickle down to all sectors of soci<strong>et</strong>y.<br />
<strong>LCA</strong>’s <strong>in</strong>fluence on this approach has been critical. <strong>LCA</strong>s have helped companies identify environmental<br />
hotspots <strong>in</strong> the supply cha<strong>in</strong>, reassess ‘common sense’ assumptions that (for example) locally sourced, or<br />
organic food has a lower environmental impact, and identify foods with the most significant impact. (Williams<br />
<strong>et</strong> al., 2006, Edwards-Jones <strong>et</strong> al., 2008; Sim <strong>et</strong> al., 2007; Defra 2008; FAO 2010b; Nemecek <strong>et</strong> al.,<br />
<strong>2012</strong>) As recognition of the contribution that agriculturally <strong>in</strong>duced land use change makes to food’s GHG<br />
emissions has grown, (Burney <strong>et</strong> al., 2010; FAO 2006) so the need to raise productivity so as to ‘spare’ land<br />
from further agricultural encroachment and associated CO2 release is emphasised.<br />
However the <strong>LCA</strong> approach has not just <strong>in</strong>formed this perspective but has also been <strong>in</strong>fluenced by it - or<br />
rather the use of <strong>LCA</strong> has helped strengthen the efficiency m<strong>in</strong>ds<strong>et</strong>. For example, it generally draws upon<br />
attributional <strong>LCA</strong>s where like product is compared with like and an alternative consumption possibility is not<br />
considered. Through this lens, Spanish l<strong>et</strong>tuces are compared with, and found to be environmentally preferable<br />
to British l<strong>et</strong>tuces grown under glass out of season. The desirability of consum<strong>in</strong>g l<strong>et</strong>tuces out of season<br />
is not considered, nor are comparisons made b<strong>et</strong>ween l<strong>et</strong>tuces and a more seasonal substitute food, such as<br />
cabbage. Similarly for meat and dairy; the carbon footpr<strong>in</strong>t of meat or milk production needs to be reduced,<br />
but demand for meat or milk per se is not questioned (IDF 2009). Notably, the m<strong>et</strong>rics used are relative –<br />
impacts are expressed as GHGs per unit of production, not per absolute quantity produced or consumed. This<br />
choice of relative m<strong>et</strong>rics suggests implicit endorsement of an economic model predicated on growth, and<br />
the primacy of consumer choice.<br />
The problem of food waste is illustrative. Wasted food represents not only a waste of embedded GHG<br />
emissions and a threat to food security but, often, a f<strong>in</strong>ancial <strong>in</strong>efficiency (Parfitt <strong>et</strong> al., 2010; WRAP 2009;<br />
UNEP 2009) - reduc<strong>in</strong>g waste saves money. Triple w<strong>in</strong>s are possible. Implicit <strong>in</strong> this analysis of waste is the<br />
assumption that if less food were wasted this could have a role <strong>in</strong> address<strong>in</strong>g both GHGs and food security<br />
(WRAP 2011, Gustavsson <strong>et</strong> al., 2011, United Nations <strong>2012</strong>). However there is less recognition of the porous<br />
boundary b<strong>et</strong>ween food and other economic sectors, nor of the non-supply related causes of hunger.<br />
The supply of sufficient food on the mark<strong>et</strong> per se by no means guarantees food security (Sen 1981) an observation<br />
that motivates more systemic approaches to address<strong>in</strong>g the food challenge (below). As regards the<br />
<strong>in</strong>teraction b<strong>et</strong>ween food and other sectors, bus<strong>in</strong>esses may diversify <strong>in</strong>to non-food products, all of which<br />
carry an associated carbon footpr<strong>in</strong>t – and <strong>in</strong>deed this is often an explicit goal for many companies (Tesco<br />
<strong>2012</strong>). Consumers may use their saved money to buy other products or services that have an environmental<br />
impact, at least partially offs<strong>et</strong>t<strong>in</strong>g the emission reductions. In short, there is a rebound effect; relative im-<br />
16
KEYNOTE SESSION 8 th Int. Conference on <strong>LCA</strong> <strong>in</strong> the<br />
Agri-<strong>Food</strong> Sector, 1-4 Oct <strong>2012</strong><br />
provements <strong>in</strong> efficiency may be partly or wholly offs<strong>et</strong> by <strong>in</strong>creased emissions <strong>in</strong> other sectors (Druckman<br />
<strong>et</strong> al., 2011). From a demand restra<strong>in</strong>t perspective (discussed below) this underl<strong>in</strong>es the need to address consumption<br />
per se, of which food behaviours are just one component (Jackson 2010).<br />
For biodiversity, the priority is to avert further land use conversion to agriculture. Intellectual support is<br />
provided by model based research show<strong>in</strong>g that, for a given agricultural yield and a def<strong>in</strong>ed land area, more<br />
<strong>in</strong>tensive agricultural practices support greater biodiversity than less <strong>in</strong>tensive ‘wildlife friendly’ production,<br />
s<strong>in</strong>ce a dedicated block of land can be s<strong>et</strong> aside purely for wildlife (Phalan <strong>et</strong> al., 2011). While the latter<br />
system may foster greater biodiversity on farm, more land is needed to produce a given quantity of food, and<br />
so land available for wilderness is reduced. Moreover the species supported <strong>in</strong> wildlife friendly farm<strong>in</strong>g are<br />
of lesser conservation <strong>in</strong>terest than those found on virg<strong>in</strong> land. The strength of this approach is that it underl<strong>in</strong>es<br />
the importance of address<strong>in</strong>g the knock on effects of different agricultural systems on land use elsewhere<br />
– <strong>in</strong> essence a 'spatial rebound effect'. It is <strong>in</strong>creas<strong>in</strong>gly used to consider the impacts of biofuels<br />
(Search<strong>in</strong>ger <strong>et</strong> al., 2007) but needs to be more comprehensively applied to understand<strong>in</strong>g food production<br />
systems too.<br />
However, while this approach delivers a theor<strong>et</strong>ical <strong>in</strong>sight <strong>in</strong>to the relative benefits for biodiversity of<br />
different farm<strong>in</strong>g systems, less attention may be paid to the socio-economic context with<strong>in</strong> which farm<strong>in</strong>g is<br />
practiced. Critics suggest that the economics of high yield<strong>in</strong>g production create <strong>in</strong>centives to expand production<br />
<strong>in</strong>to ‘spared’ land to <strong>in</strong>crease profits further, thereby underm<strong>in</strong><strong>in</strong>g the theor<strong>et</strong>ical benefits (Fischer <strong>et</strong> al.,<br />
2011) an issue r<strong>et</strong>urned to below. Hence while, as noted this perspective implicitly endorses a growth-based<br />
economic model <strong>in</strong> other respects, it does not consider how the work<strong>in</strong>gs of the mark<strong>et</strong> might actually affect<br />
land spar<strong>in</strong>g approaches <strong>in</strong> practice.<br />
Regard<strong>in</strong>g food security and nutrition, the two are considered somewhat separately with<strong>in</strong> the efficiency<br />
m<strong>in</strong>ds<strong>et</strong>. The food security challenges is seen as one of <strong>in</strong>creas<strong>in</strong>g production to me<strong>et</strong> demand, with demand<br />
projections based on assumptions about <strong>in</strong>come growth and its relationship with demand for certa<strong>in</strong> foods,<br />
such as meat (Conforti 2011; Tilman <strong>et</strong> al., 2011; Foley <strong>et</strong> al., 2011). Less attention is paid to other dimensions<br />
of food security (access, utilisation, stability over time) (FAO 2008) or to the nutritional quality of<br />
food.<br />
Moreover, the efficiency approach tends to shy away from say<strong>in</strong>g what people should or should not be<br />
‘demand<strong>in</strong>g’ either for environmental reasons (as noted) or for health. Just as GHG efficiencies can be<br />
achieved us<strong>in</strong>g the <strong>in</strong>sights from <strong>LCA</strong> to targ<strong>et</strong> environmental hotspots <strong>in</strong> the supply cha<strong>in</strong>, so ‘health efficiencies’<br />
are to be secured through product reformulations that deliver foods similar <strong>in</strong> taste to the orig<strong>in</strong>als<br />
but, for example, lower <strong>in</strong> fat, sugar or salt or with enhanced nutrition (prebiotics, omega 3 fatty acids).<br />
Supported by appropriate <strong>in</strong>formation, the consumer is then free to choose the healthier option without fundamentally<br />
need<strong>in</strong>g to change their di<strong>et</strong>.<br />
As regards animal products – criticised both on environmental and nutritional grounds by others (below) -<br />
the efficiency perspective is more positive, argu<strong>in</strong>g, for <strong>in</strong>stance, that milk delivers greater value per environmental<br />
impact than many other beverages. It po<strong>in</strong>ts to research conclud<strong>in</strong>g that, for a comb<strong>in</strong>ation of<br />
nutrients delivered per unit of GHGs emitted, low fat milk represents b<strong>et</strong>ter nutritional ‘value for climate’<br />
than orange juice, milk substitutes and others (Smedman <strong>et</strong> al., 2010; ICUSD 2010). Notably, low fat milk is<br />
chosen as the subject for analysis. While the removed fat might be <strong>in</strong>corporated <strong>in</strong>to another product (a cake,<br />
say) the nutrient-climate impact of that product is not considered; a system expansion <strong>LCA</strong> approach might<br />
therefore yield different results. The emphasis, aga<strong>in</strong>, is on relative merits and there is no further analysis of<br />
what an ‘optimal’ level of consumption might look like - the m<strong>in</strong>imum quantity of milk needed to deliver<br />
nutritional benefits without <strong>in</strong>curr<strong>in</strong>g excessive GHG cost through ‘unnecessary’ consumption, surplus to<br />
requirements.<br />
In low <strong>in</strong>come countries, the nutritional priority is to address micronutrient deficiencies. <strong>Food</strong> fortification<br />
(post harvest) and biofortification (breed<strong>in</strong>g crops higher <strong>in</strong> targ<strong>et</strong> nutrients) are strategies that resonate<br />
with the efficiency perspective (HarvestPlus, undated), s<strong>in</strong>ce they offer a technical way forward. Biofortification<br />
is considered particularly promis<strong>in</strong>g: while <strong>in</strong>itial research <strong>in</strong>vestment costs are high, ex ante assessments<br />
suggest their cost effectiveness <strong>in</strong> address<strong>in</strong>g deficiencies is even greater. (Meenakshi <strong>et</strong> al., 2010).<br />
The approach, however has been criticised by the systems perspective as over-simplistic (below).<br />
2.2. Demand restra<strong>in</strong>t<br />
For the efficiency m<strong>in</strong>ds<strong>et</strong>, the onus is on producers to develop appropriate techniques and strategies to<br />
reduce emissions; for the demand restra<strong>in</strong>t perspective, the problem lies with the consumer and with the<br />
companies who promote unsusta<strong>in</strong>able consumption patterns. The end po<strong>in</strong>t <strong>in</strong> the supply cha<strong>in</strong> – the con-<br />
17
KEYNOTE SESSION 8 th Int. Conference on <strong>LCA</strong> <strong>in</strong> the<br />
Agri-<strong>Food</strong> Sector, 1-4 Oct <strong>2012</strong><br />
sumer – becomes the focus of concern. Central to this perspective lies the conviction that excessive consumption<br />
is a lead<strong>in</strong>g cause of the environmental crisis we face. Its vision of change is therefore an overtly<br />
moral one - it explicitly criticises the status quo rather than (for reasons that may also be morally motivated<br />
but less explicit) endors<strong>in</strong>g it.<br />
The priority is to curb consumption of high impact foods. While <strong>in</strong> the 1990s the focus was particularly<br />
on foods high <strong>in</strong> ‘food miles’, as the f<strong>in</strong>d<strong>in</strong>gs of <strong>LCA</strong> research filtered through to the environmental community,<br />
comb<strong>in</strong>ed with accusations of be<strong>in</strong>g ‘anti poor’ from poverty organisations, (MacGregor and Vorley),<br />
the locus of concern s<strong>in</strong>ce shifted to animal products. The FAO’s sem<strong>in</strong>al Long Shadow report (FAO 2006)<br />
and numerous <strong>LCA</strong>-<strong>in</strong>spired scientific and NGO publications have highlighted the heavy burden that livestock<br />
place on land, water, biodiversity – and their contribution to GHG emissions (Pell<strong>et</strong>ier and Tyedmers<br />
2010; EC 2006; Weber and Matthews 2008; Stehfest <strong>et</strong> al., 2009; McAlp<strong>in</strong>e <strong>et</strong> al., 2009).<br />
Thus, where the efficiency perspective uses <strong>LCA</strong> to identify opportunities where technology and management<br />
can improve production efficiency to reduce the relative ‘footpr<strong>in</strong>t’ of exist<strong>in</strong>g consumption patterns,<br />
the demand restra<strong>in</strong>t approach targ<strong>et</strong>s the consumption habits that ultimately drive production (they may also<br />
argue that the producers are seek<strong>in</strong>g to generate the demand <strong>in</strong> the first place). It also <strong>in</strong>vestigates alternatives<br />
to the status quo, should consumption patterns change. Thus it draws not only upon attributional ‘snapshot’<br />
<strong>LCA</strong>s that identify the most GHG <strong>in</strong>tensive foods but also on those that adopt a ‘what if?’ approach to<br />
consider<strong>in</strong>g alternative scenarios. Increas<strong>in</strong>gly, there is a focus on the opportunity cost and missed carbon<br />
sequestration potential aris<strong>in</strong>g from livestock production – arguably, if this land were not used for livestock it<br />
could regenerate naturally, or be used for other carbon sequester<strong>in</strong>g purposes (Audsley <strong>et</strong> al., 2009; Schmid<strong>in</strong>ger<br />
and Stehfest <strong>2012</strong>). In other words, while the efficiency perspective looks at the implications for land<br />
use of different production systems (extensive versus <strong>in</strong>tensive) the demand restra<strong>in</strong>t perspective complements<br />
this by consider<strong>in</strong>g different consumption patterns.<br />
For this perspective, the climate challenge is not separate from that of biodiversity or nutrition. They are all<br />
connected (CIWF 2010; Hamerschlag 2011). Livestock are not only dom<strong>in</strong>ant GHG contributors but also the<br />
ma<strong>in</strong> driver of land use change, deforestation and associated biodiversity loss; and they are associated with<br />
the rise <strong>in</strong> obesity and associated chronic diseases too (Popk<strong>in</strong> and Gordon-Larsen 2004; S<strong>in</strong>ha <strong>et</strong> al., 2009;<br />
FOE 2010; Pan <strong>et</strong> al., <strong>2012</strong>). Other <strong>et</strong>hical and environmental concerns are added to the mix, such as water<br />
use and pollution, animal welfare (conf<strong>in</strong>ed livestock <strong>in</strong> <strong>in</strong>dustrial scale units are a particular targ<strong>et</strong>) and labour<br />
conditions. Unlike the efficiency perspective, where technology holds the promise of expand<strong>in</strong>g or<br />
overcom<strong>in</strong>g environmental limits, for this perspective technology is at times problematic, limits are absolute<br />
and humans are, essentially, damag<strong>in</strong>g. Nature is not to be managed by humans – rather humans need to ‘g<strong>et</strong><br />
out of nature.’ This, arguably, is a darker, more misanthropic view of our relationship with the natural world,<br />
although to an extent both it and the efficiency perspective view nature as other - to be ‘spared’ for conservation<br />
without human <strong>in</strong>fluence.<br />
Regard<strong>in</strong>g nutrition and food security, this perspective draws upon an emerg<strong>in</strong>g body of <strong>LCA</strong>s exam<strong>in</strong><strong>in</strong>g<br />
the relationship b<strong>et</strong>ween environmental and nutritional goals. Studies, which tend to focus on developed<br />
countries, whose citizens typically enjoy access to a diverse range of plant foods, generally show that plant<br />
based di<strong>et</strong>s can supply an adequate balance of nutrients at lower GHG ‘cost’ than meat-dom<strong>in</strong>ated di<strong>et</strong>s.<br />
(WWF 2011; Carlsson-Kanyama and González 2009; Davis <strong>et</strong> al., 2010) In contrast with the efficiency perspective<br />
it focuses less on the positive nutrients found <strong>in</strong> animal products, such as calcium, iron and z<strong>in</strong>c, that<br />
are of critical importance to people on low <strong>in</strong>come <strong>in</strong> the develop<strong>in</strong>g world, particularly children (Dror and<br />
Allen 2011). Hence, these perspectives draw upon different m<strong>et</strong>rics to assess the nutrition-GHG relationship;<br />
one to endorse the status quo and the other to challenge it, offer<strong>in</strong>g a different vision of how we ought to<br />
consume.<br />
Much is made, by restra<strong>in</strong>t advocates, of the po<strong>in</strong>t that there is enough food <strong>in</strong> the world to feed everyone, <strong>in</strong><br />
contrast with the ‘more food’ emphasis <strong>in</strong> the efficiency perspective. The challenge is therefore to address<br />
<strong>in</strong>equitable and resource <strong>in</strong>tensive consumption patterns (Soil Association 2010), but a sophisticated analysis<br />
of how structural <strong>in</strong>equalities might be addressed is lack<strong>in</strong>g. For example, feed<strong>in</strong>g gra<strong>in</strong>s to livestock that<br />
could be more efficiently consumed directly by humans is identified as a ‘waste,’ (UNEP 2009) although<br />
some models f<strong>in</strong>d that due to global commodity price dynamics the effect on hunger reduction would be<br />
muted. Some argue that reductions <strong>in</strong> cereal prices would be partially offs<strong>et</strong> by <strong>in</strong>creases <strong>in</strong> prices of other<br />
foods, while lack of demand from the livestock sector would reduce farmers’ <strong>in</strong>centives to grow the crops <strong>in</strong><br />
the first place (Rosegrant <strong>et</strong> al., 1999; Msangi and Rosegrant 2001). Just as ‘efficiency’ may be underm<strong>in</strong>ed<br />
by the rebound effect (discussed above), so efficiency, redef<strong>in</strong>ed here by the restra<strong>in</strong>t community, may not<br />
translate <strong>in</strong>to substantially greater food availability and affordability for the poor. Both approaches are based<br />
18
KEYNOTE SESSION 8 th Int. Conference on <strong>LCA</strong> <strong>in</strong> the<br />
Agri-<strong>Food</strong> Sector, 1-4 Oct <strong>2012</strong><br />
on views about the way the world ought to work to ensure environmental benefits rather than the way it actually<br />
works, given current conditions.<br />
Similarly, the use of the word ‘efficiency’ is often used differently by the two perspectives. So, while the<br />
efficiency perspective concludes that gra<strong>in</strong> fed livestock <strong>in</strong> fact have a lower GHG footpr<strong>in</strong>t then those fed<br />
on grass and byproducts <strong>in</strong>edible to humans (Pell<strong>et</strong>ier <strong>et</strong> al., 2010) and that such production is thus more<br />
efficient, the demand restra<strong>in</strong>t approach uses <strong>LCA</strong> to highlight the GHG <strong>in</strong>efficiency of consum<strong>in</strong>g gra<strong>in</strong><br />
<strong>in</strong>directly (by eat<strong>in</strong>g meat) <strong>in</strong>stead of eat<strong>in</strong>g gra<strong>in</strong> products directly.<br />
2.3 <strong>Food</strong> system transformation<br />
Both the efficiency and the demand restra<strong>in</strong>t perspectives focus on the <strong>in</strong>dividual – wh<strong>et</strong>her the <strong>in</strong>dividual<br />
farmer or company who produces, processes and distributes, or the consumer or company consum<strong>in</strong>g or<br />
mark<strong>et</strong><strong>in</strong>g the product. From a third perspective however, the problems stem not from <strong>in</strong>dividuals or even<br />
<strong>in</strong>dividual <strong>in</strong>stitutions but from the dynamic <strong>in</strong>teractions among natural, technological, behavioural and economic<br />
systems. With<strong>in</strong> this perspective can be found a broad spectrum of op<strong>in</strong>ions, some more radical than<br />
others <strong>in</strong> their analysis of the problems and their vision of the solutions. For all, though, the central argument<br />
here is that the problems we face are socio-economic rather than simply technical or a consequence of<br />
<strong>in</strong>dividual decisions. Environmental susta<strong>in</strong>ability can only be achieved through structural change (IA-<br />
AKSTD 2009; Foresight 2011; Oxfam 2011). At the <strong>et</strong>hical heart of this perspective lies an emphasis on<br />
social justice – on the moral necessity of develop<strong>in</strong>g systems of production and consumption that explicitly<br />
address the needs of poor people. It shares with the demand restra<strong>in</strong>t perspective a moral explicitness, but<br />
the emphasis is on the responsibility of the system to deliver the desired objectives rather than on the <strong>in</strong>dividual.<br />
In common with the efficiency perspective it says little about what the limits to growth might be –<br />
growth is implicitly a good th<strong>in</strong>g – but it questions the ability of the mark<strong>et</strong>, as it stands, to deliver benefits<br />
equitably.<br />
How does this view engage with <strong>LCA</strong> m<strong>et</strong>hodologies and f<strong>in</strong>d<strong>in</strong>gs? By its very nature, an analysis of the<br />
problem that sees causes and outcomes as multiple and <strong>in</strong>teract<strong>in</strong>g will not accept the use of simple or s<strong>in</strong>gle<br />
m<strong>et</strong>rics to assess impacts or progress, s<strong>in</strong>ce such m<strong>et</strong>rics fail to capture relationships among the different<br />
components of the food system over space and time. This means that <strong>LCA</strong> has so far had limited resonance<br />
with this perspective, and <strong>in</strong>dicators aga<strong>in</strong>st which to measure progress have not y<strong>et</strong> been developed. How<br />
far they can be is <strong>in</strong>deed a matter for debate.<br />
To illustrate: s<strong>in</strong>ce agricultural production and its susta<strong>in</strong>ability, for this perspective, is very clearly about<br />
more than just the production of a given commodity, a simple functional unit such as kg CO2 eq/kg product<br />
will be an <strong>in</strong>adequate measure of the system’s success <strong>in</strong> deliver<strong>in</strong>g outputs relative to environmental impact.<br />
Outputs from the system <strong>in</strong>clude not just products with mark<strong>et</strong> or food energy value (wheat, maize, rice,<br />
milk) but may, depend<strong>in</strong>g on context, also <strong>in</strong>clude micronutrients (especially important <strong>in</strong> low <strong>in</strong>come s<strong>et</strong>t<strong>in</strong>gs),<br />
fibres for roof<strong>in</strong>g, cook<strong>in</strong>g fuels (timber, manure), animal traction, cultural identity and status and – as<br />
for livestock <strong>in</strong> develop<strong>in</strong>g countries - portable liquid ass<strong>et</strong>s that can be sold <strong>in</strong> times of need, such as sickness,<br />
or to pay for school fees. For many smallholders, the system’s resilience may also be a desired ‘output.’<br />
Where access to formal <strong>in</strong>surance is lack<strong>in</strong>g, this may be achieved by cultivat<strong>in</strong>g a diverse range of crops.<br />
While sub-optimal from a CO2 eq/ kg perspective, it can be essential for farmers who cannot afford to risk<br />
<strong>in</strong>vest<strong>in</strong>g land and resources <strong>in</strong> produc<strong>in</strong>g just one high yield<strong>in</strong>g commodity that may be vulnerable to pests<br />
or other shocks. More diverse multi-species systems (such as agroforestry) or mixed crop-livestock systems<br />
may represent more economically susta<strong>in</strong>able approaches. Wh<strong>et</strong>her they are also environmentally more susta<strong>in</strong>able<br />
depends on wh<strong>et</strong>her consumption is bounded by what is produced locally or wh<strong>et</strong>her shortfalls <strong>in</strong><br />
supply are either m<strong>et</strong> by external purchases, whose production will have had environmental effects elsewhere,<br />
or else lead to other changes (a move to the city to f<strong>in</strong>d jobs) that have GHG implications, positive or<br />
negative. In short, from the systems transformation perspective the environmental impacts of a production<br />
system cannot be assessed without understand<strong>in</strong>g the socio-economic context and the way <strong>in</strong> which environmental<br />
impacts can be transferred, as it were, from one area or sector to another.<br />
Ma<strong>in</strong>stream <strong>LCA</strong> conclusions about different livestock systems are particularly open to question here<br />
s<strong>in</strong>ce meat or milk, while clearly a desired output, is not the only one, nor is sheer volume of production the<br />
only goal. Table 1 illustrates how the choice of a different functional unit for a given livestock production<br />
system may alter conclusions as to its susta<strong>in</strong>ability even when consider<strong>in</strong>g GHGs alone.<br />
Alongside the challenge to ma<strong>in</strong>stream <strong>LCA</strong> conclusions on livestock, a substantial subs<strong>et</strong> from this perspective<br />
argues for more localised food production, despite the weight of <strong>LCA</strong> research conclud<strong>in</strong>g that<br />
transport distance does not correlate well with environmental impact, at least for GHG emissions. However<br />
19
KEYNOTE SESSION 8 th Int. Conference on <strong>LCA</strong> <strong>in</strong> the<br />
Agri-<strong>Food</strong> Sector, 1-4 Oct <strong>2012</strong><br />
the systems transformation perspective considers impacts that go beyond the atemporal, often very limited<br />
purview of much <strong>LCA</strong>, with its comparisons of like with like (Royal Gala apples with Royal Gala apples) at<br />
one po<strong>in</strong>t <strong>in</strong> time. It adopts a more dynamic perspective, consider<strong>in</strong>g the impacts of food production and<br />
consumption systems over time and with<strong>in</strong> a more complex spatial and socio-economic framework.<br />
Table 1. Different m<strong>et</strong>rics for assess<strong>in</strong>g the GHG <strong>in</strong>tensity of livestock systems<br />
Quantity based Comments<br />
kg CO2 eq / kg product Favours <strong>in</strong>tensive monogastric production, and<br />
kg CO2 eq / kg prote<strong>in</strong>, iron, calcium, fatty acid profile<br />
and so forth<br />
feed-based over grass based rum<strong>in</strong>ant systems<br />
Depends on nutrient: calcium and possibly iron<br />
may favour rum<strong>in</strong>ants; grass-fed rum<strong>in</strong>ants may<br />
have b<strong>et</strong>ter Omega 3-6 ratios than cereal fed<br />
animals (Aurousseau <strong>et</strong> al., 2004; Demirel <strong>et</strong> al.,<br />
2006) prote<strong>in</strong> as m<strong>et</strong>ric will favour <strong>in</strong>tensive<br />
monogastrics. All may also need to be compared<br />
with provision of these nutrients by plant based<br />
sources.<br />
Kg CO2 eq / per nutrient density This is a composite measure of various key nutrients<br />
<strong>in</strong> comb<strong>in</strong>ation. Balance here is unclear –<br />
aga<strong>in</strong> needs to be compared aga<strong>in</strong>st plant based<br />
alternatives<br />
kg CO2 eq / kg food and non food goods provided Variable; on balance likely to favour rum<strong>in</strong>ants <strong>in</strong><br />
(leather, wool, feathers, dung, traction)<br />
mixed systems<br />
Area based Comments<br />
kg CO2 eq per area of land Emissions lower for extensive systems and for<br />
monogastrics<br />
kg CO2 eq per area of prime arable land required Emissions lower for extensive systems, both<br />
rum<strong>in</strong>ant and monogastric<br />
Resources based Comments<br />
kg CO2 eq avoided through use of byproducts or poor<br />
quality land to rear livestock; approach quantifies the<br />
GHG and land opportunity cost of need<strong>in</strong>g to obta<strong>in</strong><br />
an equivalent quantity of nutrition from elsewhere<br />
kg edible output per specified quantity of ecosystem<br />
services provided on farmed land<br />
kg edible output per given area off the direct farmland<br />
eg. on land ‘spared’ for conservation or biomass<br />
production<br />
Favours extensive systems and particularly landless<br />
household pig and poultry reliant on scraps<br />
Depends on which ecosystem services are valued<br />
but may favours extensive rum<strong>in</strong>ant systems<br />
Favours <strong>in</strong>tensive systems, especially monogastrics<br />
Resilience based<br />
Adaptability to climate and environmental change May favour local breeds<br />
Adapted from Garn<strong>et</strong>t T (2011). Where are the best opportunities for reduc<strong>in</strong>g greenhouse gas emissions <strong>in</strong> the food<br />
system (<strong>in</strong>clud<strong>in</strong>g the food cha<strong>in</strong>)? <strong>Food</strong> Policy 36, S23-S32.<br />
Thus, it asks how might we consider transport’s GHG impacts once the need to recoup <strong>in</strong>vestment <strong>in</strong> support<strong>in</strong>g<br />
<strong>in</strong>frastructure is taken <strong>in</strong>to account, by <strong>in</strong>creas<strong>in</strong>g the throughflow of commodities? Moreover,<br />
transport is seen as <strong>in</strong>extricably l<strong>in</strong>ked with other energy us<strong>in</strong>g aspects of the food supply cha<strong>in</strong>, <strong>in</strong>clud<strong>in</strong>g<br />
refrigeration, packag<strong>in</strong>g, process<strong>in</strong>g and <strong>in</strong>formation technology. The transport of most foods <strong>in</strong>herently<br />
depends on refrigeration, while refrigeration makes possible longer supply cha<strong>in</strong>s. Thus, the availability of<br />
one technology enables heavier use of the other, the consequence be<strong>in</strong>g a ratch<strong>et</strong><strong>in</strong>g up of energy dependence.<br />
So far this reassessment of transport is still broadly with<strong>in</strong> the <strong>LCA</strong> ma<strong>in</strong>stream <strong>in</strong> so far as it urges the<br />
need for systems expansion. <strong>LCA</strong> m<strong>et</strong>hodology has also been advanced through models that consider the<br />
marg<strong>in</strong>al impact of changes <strong>in</strong> consumption on production and land use with<strong>in</strong> other regions, mediated by<br />
trade (Kløverpris <strong>et</strong> al., 2010). However this perspective goes further by consider<strong>in</strong>g the porous <strong>in</strong>terface<br />
b<strong>et</strong>ween the technical and human behavioural doma<strong>in</strong>s. For example: how do efficiencies <strong>in</strong> the supply cha<strong>in</strong><br />
<strong>in</strong>crease the supply and affordability of certa<strong>in</strong> foods which ultimately foster new behavioural norms and<br />
habits? How does wider provision of the environmentally ‘efficient’ option (an imported Spanish l<strong>et</strong>tuce, or<br />
less GHG <strong>in</strong>tensive meat) create behavioural ‘lock <strong>in</strong>,’ entrench<strong>in</strong>g patterns of consumption that are dependent<br />
on this nexus of <strong>in</strong>terdependent, energy us<strong>in</strong>g technologies - refrigeration-transport and IT nexus? A<br />
20
KEYNOTE SESSION 8 th Int. Conference on <strong>LCA</strong> <strong>in</strong> the<br />
Agri-<strong>Food</strong> Sector, 1-4 Oct <strong>2012</strong><br />
sense of movement <strong>in</strong> time and space is implicit <strong>in</strong> the analysis, while attention to the effects that technological<br />
developments have on human habits, assumptions and practices prompt questions about how the susta<strong>in</strong>ability<br />
of different technical approaches might be assessed.<br />
There is perhaps a deeper challenge to <strong>LCA</strong> with<strong>in</strong> this perspective, which br<strong>in</strong>gs <strong>in</strong> the concept of human<br />
agency and moral responsibility. Systems of production, distribution and consumption are viewed <strong>in</strong> terms of<br />
the power relationships b<strong>et</strong>ween <strong>in</strong>dividuals and b<strong>et</strong>ween countries, of cultural identity and ultimately about<br />
what constitutes progress. Instances of this approach can be found <strong>in</strong> local food <strong>in</strong>itiatives such as the Fife<br />
Di<strong>et</strong> <strong>in</strong> the UK (Fife Di<strong>et</strong>, undated) <strong>in</strong> overtly political ‘peasant’ movements such as La Via Campes<strong>in</strong>a who<br />
call for ‘food sovereignty’ and who oppose large scale corporations (La Via Campes<strong>in</strong>a, 2011) and among<br />
many with<strong>in</strong> the organic movement. While such analyses cast light on the <strong>in</strong>equities associated with current<br />
systems of production and consumption, and their damag<strong>in</strong>g consequences for health and human wellbe<strong>in</strong>g,<br />
the corollary assumption – that smallscale, localised production systems are necessarily more susta<strong>in</strong>able – is<br />
nevertheless a value judgment. For example, smallholder adoption of agroforestry practices may or may not<br />
halt deforestation, depend<strong>in</strong>g on the prevail<strong>in</strong>g socio-economic conditions. These conditions may <strong>in</strong>clude the<br />
presence or absence of land use rights, labour or forest protection legislation (Schroth <strong>et</strong> al., 2004). In both<br />
systems –large commercial and small scale subsistence - the governance framework which shapes production<br />
and consumption will <strong>in</strong>fluence the extent to which undesirable direct and <strong>in</strong>direct spatial (land use change)<br />
and consumption rebound effects ensue. Thus, while emphasis on improv<strong>in</strong>g rural livelihoods at one level<br />
reflects pragmatic recognition of how millions of people live today, for many with<strong>in</strong> this perspective agrarianism<br />
is perhaps synonymous with the good life. Both wellbe<strong>in</strong>g and susta<strong>in</strong>ability are achieved through the<br />
harmonious <strong>in</strong>tegration of humans with nature through rural liv<strong>in</strong>g– unlike the perspectives of demand restra<strong>in</strong>t<br />
with its emphasis on ‘humans out!’ or of efficiency with its emphasis on technology to expand limits<br />
while sav<strong>in</strong>g space for a separate wilderness.<br />
As regards nutrition, the system transformation perspective, as for demand restra<strong>in</strong>t, sees the nutritional,<br />
and environmental challenges as <strong>in</strong>terconnected and to be addressed holistically. ‘<strong>Food</strong> security’ is def<strong>in</strong>ed to<br />
<strong>in</strong>clude not just the ‘technical’ supply of nutrients but also the other key dimensions identified by the <strong>Food</strong><br />
and Agriculture Organisation, which <strong>in</strong>clude accessibility (<strong>in</strong>corporat<strong>in</strong>g affordability), utilisation and stability<br />
over time (FAO 2008). Often an argument is made for local, diverse agricultural systems produc<strong>in</strong>g <strong>in</strong>digenous<br />
crops and animal breeds. These are seen as b<strong>et</strong>ter able to provide the full range of micronutrients<br />
needed for good health than global supply cha<strong>in</strong>s which produce and distribute a simplified range of processed,<br />
energy- and fat-dense commodities (FAO 2010a; Toledo and Burl<strong>in</strong>game 2006). Nutritional and agricultural<br />
diversity are thus seen as connected, and essential. Fortification and biofortification strategies represent<br />
a second best strategy <strong>in</strong> that they merely ‘top up’ <strong>in</strong>herently <strong>in</strong>adequate di<strong>et</strong>s and food systems. While<br />
they may have a part to play, these techniques must be situated with<strong>in</strong> a broader food-based approach that<br />
emphasises greater nutritional and agricultural diversity with<strong>in</strong> the production system (Johns and Eyzaguirre<br />
2007).<br />
There is clearly a need for studies that consider the implications for GHG emissions, land use, biodiversity<br />
and nutrition of different agricultural systems <strong>in</strong>volv<strong>in</strong>g various comb<strong>in</strong>ations of crops, livestock and<br />
<strong>in</strong>novations such as biofortification. Such an approach would need to go beyond a simple consideration of<br />
the GHG emissions associated with different consumption patterns (such as WWF 2011, Carlsson-Kanyama<br />
and González 2009; Davis <strong>et</strong> al., 2010) s<strong>in</strong>ce it explicitly views health and environmental susta<strong>in</strong>ability as<br />
outcomes of a l<strong>in</strong>ked system of production-consumption rather than just of consumption. But even these<br />
approaches will be limited s<strong>in</strong>ce they may not be able to capture the economic value of different production<br />
systems and their translation <strong>in</strong>to health outcomes. For example, the nutritional contribution that livestock<br />
provide for people <strong>in</strong> low-<strong>in</strong>come countries is not necessarily a simple relationship along the l<strong>in</strong>es of “more<br />
production equals b<strong>et</strong>ter nutrition." The outcomes are mediated through impacts of livestock production on<br />
household <strong>in</strong>comes and the knock on effects of <strong>in</strong>come generation on health generally – for example on people’s<br />
ability to pay for health care or education, both of which have <strong>in</strong>dependent positive effects on health. In<br />
other words, the system transformation approach recognises that a more complex understand<strong>in</strong>g of healthsusta<strong>in</strong>ability<br />
l<strong>in</strong>kages is needed (Hawkes and Ruel 2006). Wh<strong>et</strong>her <strong>LCA</strong> or <strong>LCA</strong>-type analyses are able to<br />
capture and quantify these dynamic <strong>in</strong>teractions, however, is open to question.<br />
3. Discussion<br />
What do we mean by good nutrition? By biodiversity? By limit<strong>in</strong>g climate change? What are our <strong>et</strong>hical<br />
boundaries - livelihoods, labour standards, animal welfare, other species? These questions go far beyond<br />
<strong>LCA</strong>, but <strong>LCA</strong> researchers need to be m<strong>in</strong>dful that this is the context with<strong>in</strong> which they frame their research.<br />
21
KEYNOTE SESSION 8 th Int. Conference on <strong>LCA</strong> <strong>in</strong> the<br />
Agri-<strong>Food</strong> Sector, 1-4 Oct <strong>2012</strong><br />
This paper has broadly characterised three emerg<strong>in</strong>g perspectives <strong>in</strong> the discourse on food system susta<strong>in</strong>ability.<br />
The vision underly<strong>in</strong>g the efficiency perspective is to take current development goals – greater <strong>in</strong>comes<br />
for all, more material consumption, more food – and to use technology to deliver these goals with less<br />
environmental impact. At one level it is profoundly pragmatic: it is ‘human nature’ to want more; the way<br />
the world and the mark<strong>et</strong> operates cannot or should not radically be changed (past experiments, such as socialism,<br />
have failed); the challenge, therefore, is to improve the status quo. This perspective helps drive the<br />
development of technologies and practices that achieve greater efficiencies <strong>in</strong> production and enhance the<br />
nutritional qualities of foods that are currently mark<strong>et</strong>ed and becom<strong>in</strong>g more prevalent. Its strength lies <strong>in</strong><br />
careful measurement, <strong>in</strong> identify<strong>in</strong>g where reductions can be achieved, and <strong>in</strong> highlight<strong>in</strong>g the effects of different<br />
production approaches on land use elsewhere. It has also challenged ‘common sense’ assumptions<br />
about the impacts of particular stages <strong>in</strong> the supply cha<strong>in</strong>, or certa<strong>in</strong> production practices. Fundamentally,<br />
however, it fails to engage with the problem of absolute limits. It implicitly assumes that technological developments<br />
and the mark<strong>et</strong> as it operates today will ultimately be successful <strong>in</strong> decoupl<strong>in</strong>g production (and<br />
GDP growth) from negative environmental and health impacts and it accepts, som<strong>et</strong>imes even endorses, current<br />
trends <strong>in</strong> consumption. These assumptions are open to challenge (Jackson 2010). It also pays <strong>in</strong>sufficient<br />
attention to the porous <strong>in</strong>terface b<strong>et</strong>ween the technical and the socio-economic doma<strong>in</strong>s and the complex<br />
relationship b<strong>et</strong>ween technological developments and behavioural change.<br />
In order to strengthen this perspective, some questions it needs to address <strong>in</strong>clude: how can <strong>LCA</strong> g<strong>et</strong> to<br />
grips with assess<strong>in</strong>g susta<strong>in</strong>ability over different temporal and spatial scales? How can it b<strong>et</strong>ter understand<br />
and quantify the rebound effect, <strong>in</strong>clud<strong>in</strong>g ‘leakage’ from the food system <strong>in</strong>to other economic areas? If land<br />
spar<strong>in</strong>g approaches makes theor<strong>et</strong>ical sense, then what governance framework is needed so that profit considerations<br />
do not underm<strong>in</strong>e the land spar<strong>in</strong>g effect?<br />
The demand restra<strong>in</strong>t approach positions consumption as the cause of our environmental crisis. Environmental<br />
limits are absolute: rather than ‘t<strong>in</strong>ker<strong>in</strong>g at the edges’ we need to shr<strong>in</strong>k our footpr<strong>in</strong>t by consum<strong>in</strong>g<br />
less or reproduc<strong>in</strong>g less. While this perspective <strong>in</strong>cludes a strong social justice element (contraction and<br />
convergence) essentially its vision of the good life is an asc<strong>et</strong>ic one – liv<strong>in</strong>g b<strong>et</strong>ter by consum<strong>in</strong>g less. As<br />
such it has resonances with much religious th<strong>in</strong>k<strong>in</strong>g, or rather, environmentalism fills the gap that for many,<br />
can no longer be filled by religion (Dunlap 2006).<br />
The value of this approach lies <strong>in</strong> its question<strong>in</strong>g of the sufficiency of relative, rather than absolute limits; <strong>in</strong><br />
highlight<strong>in</strong>g the critical <strong>in</strong>fluence of consumption on the overall burden of impacts; and by provid<strong>in</strong>g a<br />
framework for see<strong>in</strong>g the connections b<strong>et</strong>ween problems and address<strong>in</strong>g them tog<strong>et</strong>her. Livestock are seen<br />
as a convergence issue for a range of <strong>in</strong>terconnected susta<strong>in</strong>ability concerns, to be addressed tog<strong>et</strong>her<br />
(through chang<strong>in</strong>g consumption) rather than as stand alone issues. However this perspective can suffer from<br />
a lack of nuance around livestock and their positive di<strong>et</strong>ary as well as environmental contributions, perhaps<br />
reflect<strong>in</strong>g this perspective’s developed world orig<strong>in</strong>s and focus. Its overtly moral vision can be offputt<strong>in</strong>g to<br />
some who do not share it. Moreover, a robust account of how behaviour might be changed is lack<strong>in</strong>g. This<br />
constitutes a priority research challenge. Other critical research questions for this perspective <strong>in</strong>clude: is it<br />
possible to def<strong>in</strong>e a m<strong>in</strong>imum level of meat and dairy consumption such that the micronutrient value of the<br />
nutrition package are not outweighed by GHGs result<strong>in</strong>g from delivery of ‘wasted’ nutrients (that is, those<br />
that are surplus to requirements)? There is also a need for more <strong>LCA</strong> based assessments of what constitutes<br />
a culturally acceptable, healthy susta<strong>in</strong>able di<strong>et</strong> <strong>in</strong> different low <strong>in</strong>come and emerg<strong>in</strong>g economies.<br />
The food system transformation approach is perhaps the most political <strong>in</strong> so far as it sees human behaviours<br />
as the outcomes of social structures, rather than just conscious <strong>in</strong>dividual decisions. It is the structure<br />
that needs to be changed rather than the <strong>in</strong>dividual, and this requires understand<strong>in</strong>g of the dynamic <strong>in</strong>teractions<br />
among its social, economic and environmental components over time and space. Its rejection of clear<br />
demarcations b<strong>et</strong>ween the environmental, technical and economic doma<strong>in</strong>s represent an important challenge<br />
to much <strong>LCA</strong> th<strong>in</strong>k<strong>in</strong>g. Its vision of a good life shares some of the redistributive morality of the demand<br />
restra<strong>in</strong>t perspective but it is more optimistic about the role of humans <strong>in</strong> the natural world – <strong>in</strong>tegration b<strong>et</strong>ween<br />
humans and nature is possible and can be achieved, among other th<strong>in</strong>gs, through a greater focus on<br />
social justice. However, some with<strong>in</strong> this perspective may romanticise the small scale and local, fail<strong>in</strong>g to<br />
subject these systems to critical scrut<strong>in</strong>y as they do <strong>in</strong> the case of commercial systems.<br />
Perhaps a central problem with this approach is that, while it is good at identify<strong>in</strong>g the complex nature of<br />
the food susta<strong>in</strong>ability challenge, this very complexity presents an obstacle to the development of specific<br />
recommendations as to the way forward. To add rigour to this perspective it is worth explor<strong>in</strong>g wh<strong>et</strong>her<br />
m<strong>et</strong>hodologies and m<strong>et</strong>rics can be developed that capture not just environmental impacts over time and space<br />
but also the socio-economic consequences of different production approaches, that <strong>in</strong> turn give rise to environmental<br />
impacts - and vice versa. Assessments need also to consider ways of measur<strong>in</strong>g outputs that are<br />
22
KEYNOTE SESSION 8 th Int. Conference on <strong>LCA</strong> <strong>in</strong> the<br />
Agri-<strong>Food</strong> Sector, 1-4 Oct <strong>2012</strong><br />
not only multiple but not som<strong>et</strong>imes <strong>in</strong>tangible. There is a need too for approaches that consider the <strong>in</strong>teractions<br />
b<strong>et</strong>ween different components of the system at different scales, and across scales (that is, the relationship<br />
b<strong>et</strong>ween local and global food systems). A few of these questions may be addressed by further developments<br />
<strong>in</strong> social and environmental <strong>LCA</strong> m<strong>et</strong>hodologies but most will require <strong>in</strong>terdiscipl<strong>in</strong>ary research,<br />
l<strong>in</strong>k<strong>in</strong>g <strong>LCA</strong> and other discipl<strong>in</strong>es.<br />
4. Conclusion<br />
While the three perspectives: efficiency, demand restra<strong>in</strong>t, and food system transformation, have been<br />
presented here as separate world views held by different stakeholders, clearly they are not. They are ‘tendencies’<br />
rather than stand alone ideologies (at least for most people) and <strong>in</strong>dividual people or <strong>in</strong>stitutions may<br />
adopt any one, or all three of these approaches at different times and to different degrees. Each perspective<br />
has its strengths as well as its weaknesses and <strong>in</strong>consistencies and, perhaps predictably, the reality is that a<br />
composite approach to tackl<strong>in</strong>g the food susta<strong>in</strong>ability problem, draw<strong>in</strong>g upon all three perspectives, will be<br />
needed. However <strong>in</strong>tegrat<strong>in</strong>g them <strong>in</strong>to a workable way forward requires greater understand<strong>in</strong>g of the values<br />
that underlie the <strong>in</strong>dividual perspectives and that give rise to differences of op<strong>in</strong>ion among stakeholders.<br />
Values matter, and they cannot be ignored if progress is to be made. Everybody wants ‘susta<strong>in</strong>ability’ and<br />
an end to hunger – but not everyone has the same vision of what the solution – the good life – might look<br />
like. The <strong>et</strong>hical perspectives people br<strong>in</strong>g to the food-susta<strong>in</strong>ability problem <strong>in</strong>fluence both their use of the<br />
evidence and the solutions they propose – and these often lead to stakeholders argu<strong>in</strong>g at cross-purposes, the<br />
result be<strong>in</strong>g conflict, or <strong>in</strong>action. Greater understand<strong>in</strong>g of what underlies the different approaches to the<br />
food susta<strong>in</strong>ability problem can help shed light on why stakeholders disagree, where there are genu<strong>in</strong>e misunderstand<strong>in</strong>gs,<br />
and where common ground among them may be possible and ways forward agreed. (Hulme<br />
2009; Garn<strong>et</strong>t and Godfray <strong>2012</strong>).<br />
5. References<br />
ADAS <strong>et</strong> al., 2011. Me<strong>et</strong><strong>in</strong>g the Challenge: Agriculture Industry GHG Action Plan Delivery of Phase I: 2010 - <strong>2012</strong> 04 April 2011,<br />
ADAS, AEA Agricultural Eng<strong>in</strong>eer<strong>in</strong>g Association, AHDB Agriculture and Horticulture Development Board, AIC Agriculture<br />
Industries Confederation, CLA Country Land and Bus<strong>in</strong>ess Association, Farm<strong>in</strong>g Futures, FWAG Farm Wildlife Advisory<br />
Group, LEAF L<strong>in</strong>k<strong>in</strong>g Environment And Farm<strong>in</strong>g, NFU National Farmers Union, NIAB/TAG National Institute of Agricultural<br />
Botany/The Arable Group, ORC Elm Farm Organic Research Centre, RASE Royal Agricultural Soci<strong>et</strong>y of England<br />
IAAKSTD, Agriculture at a Crossroads, 2009. The Global Report. International Assessment of Agricultural Knowledge, Science and<br />
Technology for Development, Island Press<br />
Audsley, E., Chatterton, J., Graves, A., Morris, J., Murphy-Bokern, D., Pearn, K., Sandars, D., Williams, A., 2009. <strong>Food</strong>, land and<br />
greenhouse gases. The effect of changes <strong>in</strong> UK food consumption on land requirements and greenhouse gas emissions. The<br />
Committee on Climate Change.<br />
Aurousseau, B., Bauchart, D., Calichon, E., Micol, D., Priolo, A., 2004. Effect of grass or concentrate feed<strong>in</strong>g systems and rate of<br />
growth on triglyceride and phospholipid and their fatty acids <strong>in</strong> the M. longissimus thoracis of lambs. Meat Sci. 66, 531–541.<br />
Bedd<strong>in</strong>gton, J., Asaduzzaman, M., Fernandez, A., Clark, M., Guillou, M., Jahn, M., Erda, L., Mamo, T., Van Bo, N., Nobre, C.A.,<br />
Scholes, R., Sharma, R., Wakhungu, J., 2011. Achiev<strong>in</strong>g food security <strong>in</strong> the face of climate change: Summary for policy makers<br />
from the Commission on Susta<strong>in</strong>able Agriculture and Climate Change. CGIAR Research Program on Climate Change, Agriculture<br />
and <strong>Food</strong> Security CCAFS. Copenhagen, Denmark.<br />
Burney, J., Davis, S.J., Lobell, D.B., 2010. Greenhouse gas mitigation by agricultural <strong>in</strong>tensification, PNAS, 107, 12052–12057<br />
Carlsson-Kanyama, A., González, A.D., 2009. Potential contributions of food consumption patterns to climate change. Am. J. Cl<strong>in</strong>.<br />
Nutr. 89 suppl:1704S–9S<br />
CIWF, 2009. Beyond Factory Farm<strong>in</strong>g: Susta<strong>in</strong>able Solutions for Animals,People and the Plan<strong>et</strong>, Compassion <strong>in</strong> World Farm<strong>in</strong>g,<br />
Godalm<strong>in</strong>g, Surrey, UK<br />
Conforti, P., 2011. Look<strong>in</strong>g Ahead <strong>in</strong> World <strong>Food</strong> and Agriculture: Perspectives to 2050, Rome: <strong>Food</strong> and Agriculture Organization,<br />
Rome.<br />
Davis, J., Sonesson, U., Baumgartner, D.U., Nemecek, T., 2010. Environmental impact of four meals with different prote<strong>in</strong> sources:<br />
Case studies <strong>in</strong> Spa<strong>in</strong> and Sweden. <strong>Food</strong> Res. Int. 43, 1874–1884.<br />
Defra, 2008. Comparative Life Cycle Assessment of <strong>Food</strong> Commodities Procured for UK Consumption through a Diversity of Supply<br />
Cha<strong>in</strong>s, research undertaken for Defra by AEA, ADAS, Ed Moorhouse, Paul Watkiss Associates, AHDBM, Mar<strong>in</strong>tek, Defra<br />
project FO0103<br />
Demirel, G., Ozp<strong>in</strong>ar, H., Nazli, B., Keser, O., 2006. Fatty acids of lamb meat from two breeds fed different forage: concentrate ratio.<br />
Meat Sci. 72, 229–235.<br />
Dror, D.K., Allen, L.H., 2011. The importance of milk and other animal-source foods for children <strong>in</strong> low-<strong>in</strong>come countries. <strong>Food</strong><br />
Nutr. Bull. 32, 227-24317<br />
Druckman, A., Chitnis, M., Sorrell, S., Jackson, T., 2011. Miss<strong>in</strong>g carbon reductions? Explor<strong>in</strong>g rebound and backfire effects <strong>in</strong> UK<br />
households. Energ. Policy 39, 3572–3581<br />
Dunlap, T.R., 2006. Environmentalism: A secular faith. Environ. Valu. 15, 321–30<br />
Edwards-Jones, G., Milà L., Canals, I., Hounsome, N., Trun<strong>in</strong>ger, M., Koerber, G., Hounsome, B., Cross, P., York, E.H., Hospido,<br />
A., Plassmann, K., Harris, I.M., Edwards, R.T., Day, G.A.S., Tomos, A.D., Cowell, S.J., Jones, D.L., 2008. Test<strong>in</strong>g the assertion<br />
that 'local food is best': the challenges of an evidence-based approach, Trends <strong>in</strong> <strong>Food</strong> Science & Technology 19: 265–274<br />
23
KEYNOTE SESSION 8 th Int. Conference on <strong>LCA</strong> <strong>in</strong> the<br />
Agri-<strong>Food</strong> Sector, 1-4 Oct <strong>2012</strong><br />
EC, 2006. Environmental impact of products EIPRO: Analysis of the life cycle environmental impacts related to the total f<strong>in</strong>al consumption<br />
of the EU25, European Commission Technical Report EUR 22284 EN<br />
FAO, 2006. Livestock’s Long Shadow, <strong>Food</strong> and Agriculture Organisation, Rome.<br />
FAO, 2008. An <strong>in</strong>troduction to the basic concepts of food security, FAO, 2008 EC – FAO <strong>Food</strong> Security Programme<br />
FAO, 2010a. F<strong>in</strong>al document: International Scientific Symposium Biodiversity and Susta<strong>in</strong>able Di<strong>et</strong>s: United aga<strong>in</strong>st Hunger. 3-5<br />
November 2010, <strong>Food</strong> and Agriculture Organisation, Rome<br />
FAO, 2010b. Greenhouse Gas Emissions from the Dairy Sector: A Life Cycle Assessment, <strong>Food</strong> and Agriculture Organisation,<br />
Rome, 2010.<br />
FAO, 2011. The State of <strong>Food</strong> Insecurity <strong>in</strong> the World, <strong>Food</strong> and Agriculture Organisation, Rome Fife Di<strong>et</strong>, undated<br />
http://www.fifedi<strong>et</strong>.co.uk/about-us/<br />
Fischer, J., Batáry, P., Bawa, K.S., Brussaard, L., Chappell, M.J., Clough, Y., Daily, G.C., Dorrough, J., Hartel, T., Jackson, L.E.,<br />
Kle<strong>in</strong>, A.M., Kremen, C., Kuemmerle, T., L<strong>in</strong>denmayer, D.B., Mooney, H.A., Perfecto, I., Philpott, S.M., Tscharntke, T., Vandermeer,<br />
J., Wanger, T.C., Von Wehrden H., 2011. Conservation: Limits of Land Spar<strong>in</strong>g. Science, 334, 594<br />
FOE, 2010. Healthy Plan<strong>et</strong> Eat<strong>in</strong>g: How lower meat di<strong>et</strong>s can save lives and the plan<strong>et</strong>, Friends of the Earth, UK.<br />
Foley, J.A., Rarmankutty, N., Brauman, K.A., Cassidy, E.S., Gerber, J.S., Johnstone, M., Mueller, N.D., O’Connell, C., Ray, D.K.,<br />
West, P.C., Balzer, C., Benn<strong>et</strong>t, E.M., Carpenter, S.R., Hill, J., Monfreda, C., Polasky, S., Rockström, J., Sheehan, J., Seibert, S.,<br />
Tilman, D., Zaks, D.P.M., 2011. Solutions for a cultivated plan<strong>et</strong>. Nature 478, 337–342<br />
Foresight, 2011. The Future of <strong>Food</strong> and Farm<strong>in</strong>g. F<strong>in</strong>al Project Report. The Government Office for Science, London.<br />
Garn<strong>et</strong>t, T. 2011. Where are the best opportunities for reduc<strong>in</strong>g greenhouse gas emissions <strong>in</strong> the food system <strong>in</strong>clud<strong>in</strong>g the food<br />
cha<strong>in</strong>? <strong>Food</strong> Policy 36, S23–S32<br />
Garn<strong>et</strong>t, T., Godfray, C., <strong>2012</strong>. Susta<strong>in</strong>able <strong>in</strong>tensification <strong>in</strong> agriculture. Navigat<strong>in</strong>g a course through comp<strong>et</strong><strong>in</strong>g food system priorities.<br />
<strong>Food</strong> Climate Research N<strong>et</strong>work and the Oxford Mart<strong>in</strong> Programme on the Future of <strong>Food</strong>, University of Oxford, UK<br />
Godfray, H.C. J., Bedd<strong>in</strong>gton, J.R., Crute, I.R., Haddad, L., Lawrence, D., Muir, J.F., Pr<strong>et</strong>ty, J., Rob<strong>in</strong>son, S., Thomas, S.M., Toulm<strong>in</strong>,<br />
C., 2010. <strong>Food</strong> Security: The Challenge of Feed<strong>in</strong>g 9 Billion People. Science, 327<br />
Gustavsson, J., Cederberg, C., Sonesson, U., 2011. Global food losses and food waste. Rome: <strong>Food</strong> and Agriculture. Organization of<br />
the United Nations.<br />
Hamerschlag K., 2011. Meat Eater’s Guide to Climate Change and Health, Environmental Work<strong>in</strong>g Group, Wash<strong>in</strong>gton DC, United<br />
States<br />
Hawkes, C., Ruel, M., 2006. Understand<strong>in</strong>g the l<strong>in</strong>ks b<strong>et</strong>ween agriculture and health, IFPRI, Wash<strong>in</strong>gton DC. Harvest Plus<br />
http://www.harvestplus.org/, ndated<br />
Hulme, M., 2009. Why We Disagree About Climate Change: Understand<strong>in</strong>g Controversy, Inaction and Opportunity. Cambridge<br />
University Press<br />
ICUSD, 2010. U.S. Dairy Susta<strong>in</strong>ability Commitment Progress Report, Innovation Center for US Dairy<br />
IDF, 2009. A global dairy agenda for action – climate change, International Dairy Federation, World Dairy Summit, Berl<strong>in</strong><br />
Jackson, T., 2010. Prosperity without Growth: Economics for a f<strong>in</strong>ite plan<strong>et</strong>. Earthscan.<br />
Johns, T., Eyzaguirre, P.B., 2007. Biofortification, biodiversity and di<strong>et</strong>: A search for complementary applications aga<strong>in</strong>st poverty<br />
and malnutrition, <strong>Food</strong> Policy 32 1–24J H Kløverpris,K Baltzer and P H Nielsen 2010. Life cycle <strong>in</strong>ventory modell<strong>in</strong>g of land<br />
use <strong>in</strong>duced by crop consumption Part 2: Example of wheat consumption <strong>in</strong> Brazil, Ch<strong>in</strong>a, Denmark and the USA. Int. J. Life<br />
Cycle Assess., 15, 90–103<br />
La Via Campes<strong>in</strong>a, 2011.<br />
http://viacampes<strong>in</strong>a.org/en/<strong>in</strong>dex.php?option=com_content&view=category&layout=blog&id=27&Itemid=44<br />
MacGregor, J., Vorley, B., 2006. “Fair miles"? The concept of "food miles" through a susta<strong>in</strong>able development lens. International<br />
Institute for Environment and Development, London.<br />
McAlp<strong>in</strong>e, C.A., Etter, A., Fearnside, P.M., Seabrook, L., Laurance, W.F., 2009. Increas<strong>in</strong>g world consumption of beef as a driver of<br />
regional and global change: A call for policy action based on evidence from Queensland Australia, Colombia and Brazil. Global<br />
Environ. Chang. 19, 21–33<br />
Meenakshi, J.V., Johnson, N.L., Manyong, V.M., Degroote, H., Javelosa, J., Yanggen, D., Naher, F., Gonzalez, C., Garcia, J., Meng,<br />
E., 2010. How Cost-Effective is Biofortification <strong>in</strong> Combat<strong>in</strong>g Micronutrient Malnutrition? An Ex ante Assessment. World Dev.,<br />
38, 64-75<br />
Msangi, S., Rosegrant, M.W., 2011. Feed<strong>in</strong>g the Future’s Chang<strong>in</strong>g Di<strong>et</strong>s Implications for Agriculture Mark<strong>et</strong>s, Nutrition, and Policy,<br />
IFPRI 2020 Conference: Leverag<strong>in</strong>g Agriculture for Improv<strong>in</strong>g Nutrition and Health February 10-12, New Delhi, India<br />
Nemecek, T., Weiler, K., Plassmann, K., Schn<strong>et</strong>zer, J., Gaillard, G., Jefferies, D., García–Suárez, T., K<strong>in</strong>g, H., Milà i Canals, L.,<br />
<strong>2012</strong>. Estimation of the variability <strong>in</strong> global warm<strong>in</strong>g potential of global crop production us<strong>in</strong>g a modular extrapolation approach<br />
MEXA<strong>LCA</strong>. J. Cleaner Prod. 31, 106-117<br />
Oxfam 2011. Grow<strong>in</strong>g a B<strong>et</strong>ter Future: <strong>Food</strong> justice <strong>in</strong> a resource-constra<strong>in</strong>ed world, Oxfam International<br />
Pan, A., Sun, Q., Bernste<strong>in</strong>, A.M., Schulze, M.B., Manson, J., Stampfer, M.J., Will<strong>et</strong>t, W.C., Hu, F.B., <strong>2012</strong>. Red Meat Consumption<br />
and Mortality Results From 2 Prospective Cohort Studies. Arch. Intern. Med. doi:10.1001/arch<strong>in</strong>ternmed.2011.2287<br />
Parfitt, J., Barthel, M., Macnaughton, S., 2010. <strong>Food</strong> waste with<strong>in</strong> food supply cha<strong>in</strong>s: quantification and potential for change to<br />
2050. Philos. T. R. Soc. B. 365, 3065–3081.<br />
Pell<strong>et</strong>ier, N., Tyedmers, P., 2010. Forecast<strong>in</strong>g potential global environmental costs of livestock production 2000–2050. PNAS published<br />
ahead of pr<strong>in</strong>t<br />
Pell<strong>et</strong>ier, N., Pirog, R., Rasmussen, R., 2010. "Comparative life cycle environmental impacts of three beef production strategies <strong>in</strong><br />
the Upper Midwestern United States". Agric. Syst. 103, 380–389<br />
Phalan, P., Onial, M., Balmford, A., Green, R.E., 2011. Reconcil<strong>in</strong>g food production and biodiversity conservation: Land shar<strong>in</strong>g and<br />
land spar<strong>in</strong>g compared. Science 333, 1289<br />
Popk<strong>in</strong>, B.M., Gordon-Larsen, P., 2004. The nutrition transition: worldwide obesity dynamics and their d<strong>et</strong>erm<strong>in</strong>ants International. J.<br />
Obesity. 28, S2–S9<br />
Rosegrant, M.W., Leach, N., Gerpacio, R.V., 1999. Plenary Lecture: Alternative futures for world cereal and meat consumption <strong>in</strong><br />
Meat or wheat for the next millennium?’ P. Nutr. Soc. 58, 219–234<br />
24
KEYNOTE SESSION 8 th Int. Conference on <strong>LCA</strong> <strong>in</strong> the<br />
Agri-<strong>Food</strong> Sector, 1-4 Oct <strong>2012</strong><br />
Schmid<strong>in</strong>ger, K, Stehfest, E., <strong>2012</strong>. Includ<strong>in</strong>g CO2 implications of land occupation <strong>in</strong> <strong>LCA</strong>s—m<strong>et</strong>hod and example for livestock<br />
products, Int. J. Life Cycle Ass., DOI: 10.1007/s11367-012-0434-7<br />
Schroth, G., da Fonseca, G.A.B., Harvey, C.A., Gascon, C., Vasconcelos, H.L., Izack, A.M., 2004 Agroforestry and Biodiversity<br />
Conservation <strong>in</strong> Tropical Landscapes, Island Press, Wash<strong>in</strong>gton DC.<br />
Search<strong>in</strong>ger, T., Heimlich, R, Houghton, R.A., Dong, F., Elobeid, A., Fabiosa, J., Tokgoz, S., Hayes, D., Yu, T.H., 2008. Greenhouse<br />
Gases Through Emissions from Use of U.S. Croplands for Biofuels Increases Land use Change. Science. 319, 1238.<br />
Sen, A., 1981. Poverty and Fam<strong>in</strong>es Oxford University Press, Oxford.<br />
Sim, S, Barry, M., Clift, R., Cowell, S.J., 2007. The Relative Importance of Transport <strong>in</strong> D<strong>et</strong>erm<strong>in</strong><strong>in</strong>g an Appropriate Susta<strong>in</strong>ability<br />
Strategy for <strong>Food</strong> Sourc<strong>in</strong>g. Int. J. Life Cycle Ass. 12, 422–431<br />
S<strong>in</strong>ha, R ., Cross, A.J., Graubard, B.I., Leitzmann, M.F., Schatzk<strong>in</strong>, A., 2009. Meat Intake and Mortality: A Prospective Study of<br />
Over Half a Million People. Arch. Intern. Med. 1696, 562-571<br />
Smedman, A., L<strong>in</strong>dmark-Månsson, H., Drewnoski, A., Mod<strong>in</strong> Edman, A.K., 2010. Nutrient density of beverages <strong>in</strong> relation to climate<br />
impact, <strong>Food</strong> Nutr. Res. 54, 5170<br />
Soil Association 2010, Tell<strong>in</strong>g porkies: The big fat lie about doubl<strong>in</strong>g food production. Soil Association, Bristol.<br />
Stehfest, E., Bouwman, L., van Vuuren, D.P., den Elzen, M.G.J., Eickhout, B., Kabat, P., 2009. Climate benefits of chang<strong>in</strong>g di<strong>et</strong>.<br />
Climatic Change. 95, 1-2<br />
Sw<strong>in</strong>burn, B A, Sacks, G, Hall, K.D., McPherson, K., F<strong>in</strong>egood, D.T., Moodie, M.L., Gortmaker, S.L., 2011. The global obesity<br />
pandemic: shaped by global drivers and local environments. The Lanc<strong>et</strong>, 378, 804 – 814.<br />
Tesco, <strong>2012</strong>. Annual Report <strong>2012</strong>, Tesco.<br />
Tilman, D., Balzer, C., Hill, J., Befort, B.L., 2011. Global food demand and the susta<strong>in</strong>able <strong>in</strong>tensification of agriculture. Proceed<strong>in</strong>gs<br />
of the National Academy of Sciences of the United States of America. 108, 20260-20264<br />
Toledo, A., Burl<strong>in</strong>game, B., 2006. Biodiversity and nutrition: A common path toward global food security and susta<strong>in</strong>able development.<br />
J. <strong>Food</strong> Comp. Anal. 19, 477–483<br />
UNEP, 2009. The environmental food crisis: The environment’s role <strong>in</strong> avert<strong>in</strong>g future food crises, Nairobi.<br />
United Nations, <strong>2012</strong>. FAO, partners, urge greater push to reduce food losses and waste, 13 June <strong>2012</strong>, <strong>Food</strong> and Agriculture Organisation,<br />
Rome http://un-foodsecurity.org/node/1345<br />
Weber, C., Matthews, H., 2008. <strong>Food</strong>-Miles and the Relative Climate Impacts of <strong>Food</strong> Choices <strong>in</strong> the United States. Environ. Sci.<br />
Technol. 4210, 3508-3513.<br />
Williams, A.G., Audsley, E., Sandars, D.L. ,2006. D<strong>et</strong>erm<strong>in</strong><strong>in</strong>g the environmental burdens and resource use <strong>in</strong> the production of<br />
agricultural and horticultural commodities. Ma<strong>in</strong> Report. Defra Research Project IS0205. Bedford: Cranfield University and Defra<br />
WRAP, 2011. Environmental Audit Committee: Written evidence submitted by WRAP, March<br />
2011http://www.publications.parliament.uk/pa/cm201012/cmselect/cmenvaud/879/879vw20.htm<br />
WRAP, <strong>2012</strong>. Courtauld Commitment 2 Voluntary agreement 2010 - <strong>2012</strong> Signatory case studies and quotes, Waste Resources<br />
Action Programme, <strong>2012</strong><br />
WRAP, 2009. Household <strong>Food</strong> and Dr<strong>in</strong>k Waste <strong>in</strong> the UK. Report prepared by WRAP. Banbury, UK.<br />
WWF, 2011. Relative contribution of different food groups to di<strong>et</strong> related GHG emissions. Livewell report, WWF, Godalm<strong>in</strong>g, UK.<br />
25
KEYNOTE SESSION 8 th Int. Conference on <strong>LCA</strong> <strong>in</strong> the<br />
Agri-<strong>Food</strong> Sector, 1-4 Oct <strong>2012</strong><br />
26<br />
Challenges for <strong>LCA</strong> <strong>in</strong> the agri-food sector, perspectives from<br />
Thailand and Southeast Asia<br />
Shabbir H. Gheewala 1,2<br />
1 The Jo<strong>in</strong>t Graduate School of Energy and Environment, K<strong>in</strong>g Mongkut’s University of Technology Thonburi, Bangkok, Thailand<br />
2 Center for Energy Technology and Environment, M<strong>in</strong>istry of Education, Thailand<br />
E-mail: shabbir_g@jgsee.kmutt.ac.th<br />
ABSTRACT<br />
Agriculture and agri-food <strong>in</strong>dustries are very important sectors <strong>in</strong> many Asian countries, especially <strong>in</strong> Southeast Asia. Thailand, an<br />
emerg<strong>in</strong>g economy, is a large producer and exporter of agri-food products. Life cycle assessment (<strong>LCA</strong>) has been used <strong>in</strong>creas<strong>in</strong>gly<br />
<strong>in</strong> the agriculture sector though much still rema<strong>in</strong>s to be done. This paper outl<strong>in</strong>es the brief historical development of <strong>LCA</strong> <strong>in</strong> Thailand<br />
focus<strong>in</strong>g particularly on the agri-food sector. The development process and status are described po<strong>in</strong>t<strong>in</strong>g out also the areas that<br />
need further development. Challenges for database development as well as m<strong>et</strong>hodology development are identified. The status of the<br />
development of <strong>LCA</strong> <strong>in</strong> the agri-food sector <strong>in</strong> some other countries <strong>in</strong> the region is also summarised along with the development of a<br />
regional <strong>in</strong>itiative <strong>in</strong> this area.<br />
Keywords: Agri-food, Database, <strong>LCA</strong>, Southeast Asia, Thailand<br />
1. Introduction<br />
Life cycle assessment (<strong>LCA</strong>) has been <strong>in</strong>troduced to Thailand about 15 years ago (Lohsomboon, 2002);<br />
though efforts towards its popularisation have gathered momentum <strong>in</strong> the last 7-8 years. In the <strong>in</strong>terim period,<br />
<strong>LCA</strong> has been taught <strong>in</strong> several universities <strong>in</strong> Thailand and numerous papers and research reports have<br />
been published based on <strong>LCA</strong> studies <strong>in</strong> various sectors, particularly agriculture and energy (e.g. Mungkung<br />
<strong>et</strong> al., 2006; Lebel <strong>et</strong> al., 2010, Nguyen and Gheewala, 2008a,b; Phumpradab <strong>et</strong> al., 2009; Suwanit and<br />
Gheewala, 2011; Gheewala, 2011). Consider<strong>in</strong>g the large agricultural base of Thailand, the focus on studies<br />
based on agriculture <strong>in</strong> not surpris<strong>in</strong>g. However, the data-<strong>in</strong>tensive nature of <strong>LCA</strong>s and the lack of <strong>in</strong>dustry’s<br />
understand<strong>in</strong>g on the utility of such studies has been a barrier <strong>in</strong> large-scale implementation. The recent<br />
popular appeal of product carbon footpr<strong>in</strong>t<strong>in</strong>g has <strong>in</strong>itiated a spate of studies and has curiously even encouraged<br />
<strong>in</strong>dustries to take a fresh look at full <strong>LCA</strong>s (Mungkung <strong>et</strong> al., <strong>2012</strong>).<br />
The idea of life cycle concept was actually <strong>in</strong>corporated first <strong>in</strong> the Thai Green Label (Figure 1a) <strong>in</strong>itiated<br />
by the Thailand Bus<strong>in</strong>ess Council for Susta<strong>in</strong>able Development (TBCSD) <strong>in</strong> 1993 and formally launched <strong>in</strong><br />
1994 by the Thailand Environment Institute (TEI) <strong>in</strong> association with the M<strong>in</strong>istry of Industry<br />
(http://www.tei.or.th/greenlabel/<strong>in</strong>dex.html). Though this is a Type I label which does not require conduct<strong>in</strong>g<br />
a full <strong>LCA</strong>, the criteria are based on the life cycle idea. The first life cycle <strong>in</strong>ventory of electricity was conducted<br />
<strong>in</strong> 1997 by TEI and a graduate level course <strong>in</strong> <strong>LCA</strong> <strong>in</strong>itiated <strong>in</strong> 1999. The Thai <strong>LCA</strong> N<strong>et</strong>work l<strong>in</strong>k<strong>in</strong>g<br />
<strong>LCA</strong> practitioners was <strong>in</strong>itiated <strong>in</strong> 2001. This paper briefly describes the activities <strong>in</strong> Thailand and the region<br />
vis-à-vis <strong>LCA</strong> <strong>in</strong> the agri-food sector<br />
2. <strong>LCA</strong> <strong>in</strong> the agri-food sector <strong>in</strong> Thailand<br />
Activities on <strong>LCA</strong> <strong>in</strong> Thailand dur<strong>in</strong>g the last decade have largely been dom<strong>in</strong>ated by <strong>in</strong>dividual research<br />
projects and graduate studies. One of the first sectors that received attention was shrimp which was studied<br />
first as a doctoral thesis and then as a national level project (Mungkung <strong>et</strong> al., 2006; Lebel <strong>et</strong> al., 2010). Several<br />
doctoral theses were also conducted on biofuels that <strong>in</strong>cluded agriculture as a very important part (e.g.<br />
Nguyen, 2007; Yutthitham, 2009; Silalertruksa, 2010). Some of the studies also looked particularly at food<br />
versus fuel issues because of the comp<strong>et</strong>ition for feedstock and resources (Silalertruksa and Gheewala, 2010,<br />
2011, <strong>2012</strong>). Research projects were also conducted <strong>in</strong>volv<strong>in</strong>g <strong>in</strong>dustries, particularly with the popularisation<br />
of product carbon footpr<strong>in</strong>t (Mungkung <strong>et</strong> al., 2010; Mungkung <strong>et</strong> al., <strong>2012</strong>). More recently, studies have<br />
been <strong>in</strong>itiated on water footpr<strong>in</strong>t which is a very important issue for agriculture (Nilsalab <strong>et</strong> al., <strong>2012</strong>). Once<br />
aga<strong>in</strong> these studies cover both work on the adaptation of m<strong>et</strong>hodology to the Thai context as well as research<br />
projects with <strong>in</strong>dustrial partnership.<br />
National level activities took an upward turn particularly with the <strong>in</strong>itiation of the national life cycle <strong>in</strong>ventory<br />
(LCI) database <strong>in</strong> 2005 (http://www.thailcidatabase.n<strong>et</strong>/). National database development was<br />
broadly focused on six sectors: (1) Energy, utilities and transportation, (2) Industrial materials, (3) Agriculture,<br />
(4) Commodity chemicals, (5) Build<strong>in</strong>g and construction materials and (6) Recycl<strong>in</strong>g and waste management.<br />
This activity is be<strong>in</strong>g led and coord<strong>in</strong>ated by the National M<strong>et</strong>al and Materials Technology Center<br />
(MTEC) under the National Science and Technology Development Agency (NSTDA), M<strong>in</strong>istry of Science
KEYNOTE SESSION 8 th Int. Conference on <strong>LCA</strong> <strong>in</strong> the<br />
Agri-<strong>Food</strong> Sector, 1-4 Oct <strong>2012</strong><br />
and Technology <strong>in</strong> collaboration with the Federation of Thai Industries, Department of Industrial Works<br />
(M<strong>in</strong>istry of Industry), TEI and Thailand Research Fund. Many universities and research <strong>in</strong>stitutes also participated<br />
<strong>in</strong> the effort for build<strong>in</strong>g up the database. A special work<strong>in</strong>g group dedicated to agriculture and<br />
agro-products is develop<strong>in</strong>g about 175 datas<strong>et</strong>s based on collat<strong>in</strong>g <strong>in</strong>formation from the exist<strong>in</strong>g research<br />
studies mentioned earlier (and <strong>in</strong>formation from the Department of Agriculture and Office of Agricultural<br />
Economics) as well as direct <strong>in</strong>terviews with companies.<br />
Another national level effort has been the development of product carbon footpr<strong>in</strong>t<strong>in</strong>g and labell<strong>in</strong>g (Figure<br />
1b) <strong>in</strong> Thailand which was <strong>in</strong>itiated <strong>in</strong> 2009 (http://www.tgo.or.th/english/). As part of the guidel<strong>in</strong>es<br />
development for product carbon footpr<strong>in</strong>t<strong>in</strong>g, 24 pilot projects were conducted. Many of the products were<br />
agriculture-based, for example, rice, chicken, p<strong>in</strong>eapple and tuna as well as their products. To date (as of<br />
May <strong>2012</strong>), 487 products (from 120 companies) have been labelled out of which almost 300 are from the<br />
agri-food sector (Figure 2). The agri-food CFP labelled products cover a wide range such as chicken meat,<br />
chicken season<strong>in</strong>g, jasm<strong>in</strong>e rice, canned food, fruit juice, beverage, animal feed, <strong>in</strong>stant rice vermicelli, food<br />
and beverage packag<strong>in</strong>g, <strong>et</strong>c.<br />
(a) Green label<br />
(b) Product carbon footpr<strong>in</strong>t label<br />
Figure 1. Environmental labels <strong>in</strong> Thailand based on life cycle concept<br />
Figure 2. Percentages of carbon labelled products <strong>in</strong> Thailand based on <strong>in</strong>dustry type<br />
The demand for carbon labell<strong>in</strong>g of products has been <strong>in</strong>creas<strong>in</strong>g ever s<strong>in</strong>ce the launch <strong>in</strong> 2009. Many<br />
small and medium enterprises have expressed their fervent <strong>in</strong>terest to participate <strong>in</strong> this scheme though they<br />
face barriers due to lack of technical expertise as well as f<strong>in</strong>ances to hire consultants. To facilitate the wider<br />
application of carbon footpr<strong>in</strong>t<strong>in</strong>g by the <strong>in</strong>dustry, especially to support bus<strong>in</strong>ess decisions rather than just<br />
for labell<strong>in</strong>g, a carbon footpr<strong>in</strong>t calculation tool is be<strong>in</strong>g developed for the Thai agri-food <strong>in</strong>dustry, so called<br />
“FOODpr<strong>in</strong>t”. This tool will help to coach the <strong>in</strong>dustry on data collection, sources of secondary data (such as<br />
from national database) and to assist <strong>in</strong> the calculation of carbon footpr<strong>in</strong>t (Gheewala and Mungkung, <strong>2012</strong>).<br />
27
KEYNOTE SESSION 8 th Int. Conference on <strong>LCA</strong> <strong>in</strong> the<br />
Agri-<strong>Food</strong> Sector, 1-4 Oct <strong>2012</strong><br />
National level product category rules (PCRs) 1 are also be<strong>in</strong>g developed for the agriculture sector <strong>in</strong>clud<strong>in</strong>g<br />
fruit and veg<strong>et</strong>ables, livestock, fisheries and aquaculture (Mungkung and Gheewala, <strong>2012</strong>).<br />
Along with the LCI database development and product carbon footpr<strong>in</strong>t<strong>in</strong>g activities, several tra<strong>in</strong><strong>in</strong>g<br />
programs on <strong>LCA</strong> and carbon footpr<strong>in</strong>t<strong>in</strong>g are be<strong>in</strong>g conducted throughout the country to develop human<br />
capacity – researchers, consultants as well as companies are be<strong>in</strong>g tra<strong>in</strong>ed. NSTDA has recently also commissioned<br />
the author to develop a research capacity build<strong>in</strong>g program <strong>in</strong> <strong>LCA</strong> for a period of three years, the<br />
focus be<strong>in</strong>g on human capacity development as well as produc<strong>in</strong>g papers <strong>in</strong> peer-reviewed <strong>in</strong>ternational<br />
journals. The program is also focused ma<strong>in</strong>ly on agriculture for food and fuel, especially related, though not<br />
limited, to effects on climate change.<br />
One of the major challenges be<strong>in</strong>g faced is the representativity of the agricultural databases as most crops<br />
are produced by small-holders som<strong>et</strong>imes runn<strong>in</strong>g <strong>in</strong>to several thousands; cultivation practices, agricultural<br />
<strong>in</strong>puts and yields can vary quite widely even b<strong>et</strong>ween adjacent farms. Processors often source crops from<br />
open mark<strong>et</strong>s with limited access to <strong>in</strong>formation on the actual cultivation sites. Another major issue is the<br />
need for development of <strong>in</strong>formation on impact assessment especially vis-à-vis land use change and biodiversity.<br />
At present, greenhouse gas emissions from land use change are usually estimated us<strong>in</strong>g default factors<br />
from IPCC’s tier 1 m<strong>et</strong>hod which are rather coarse; this can have a significant impact on the results<br />
(Siangjaeo <strong>et</strong> al., 2011). Biodiversity is usually not even be<strong>in</strong>g assessed <strong>in</strong> most studies due to lack of reliable<br />
<strong>in</strong>formation and assessment m<strong>et</strong>hods. These issues will be crucial particularly for susta<strong>in</strong>able production of<br />
food and (bio)fuel with the likely <strong>in</strong>crease of demands for both <strong>in</strong> the com<strong>in</strong>g years.<br />
3. <strong>LCA</strong> <strong>in</strong> the agri-food sector <strong>in</strong> the region<br />
Apart from Thailand, several countries <strong>in</strong> the region have had some experience with <strong>LCA</strong>, some countries<br />
more than others. Malaysia has recently done a national level study on life cycle greenhouse gas emissions <strong>in</strong><br />
the palm oil sector (Choo <strong>et</strong> al., 2011), though there have been many other research studies (e.g. Yee <strong>et</strong> al.,<br />
2009; Hassan <strong>et</strong> al., 2011; Hansen <strong>et</strong> al., <strong>2012</strong>). An LCI database, MY-LCID, has also been developed at the<br />
national level <strong>in</strong>clud<strong>in</strong>g the basic categories – energy carriers, materials (<strong>in</strong>clud<strong>in</strong>g agricultural production<br />
means), systems and transport services. The MY-LCID <strong>in</strong>cludes 150 regionalised datas<strong>et</strong>s (based on modelled<br />
data) and more than 50 datas<strong>et</strong>s based on actual production activities <strong>in</strong> the country (further <strong>in</strong>formation<br />
can be obta<strong>in</strong>ed by writ<strong>in</strong>g to mylcid@sirim.my). <strong>LCA</strong> is be<strong>in</strong>g <strong>in</strong>troduced <strong>in</strong> Indonesia too at the national<br />
level particularly to support the government’s plan to reduce GHG emissions; though there have been <strong>in</strong>dividual<br />
studies carried out by researchers (e.g. Kamahara <strong>et</strong> al., 2010; Harsono <strong>et</strong> al., <strong>2012</strong>). Vi<strong>et</strong>nam has y<strong>et</strong><br />
to start apply<strong>in</strong>g <strong>LCA</strong> at the national level, though there are some <strong>in</strong>dividual research studies reported <strong>in</strong><br />
literature (e.g. Phong <strong>et</strong> al., 2011).<br />
With the objective to promote <strong>LCA</strong> <strong>in</strong> the agri-food sector at the regional level, develop<strong>in</strong>g regional collaboration<br />
and develop<strong>in</strong>g an “Asian <strong>Food</strong> Database”, the <strong>LCA</strong> Agri-food N<strong>et</strong>work has recently been <strong>in</strong>itiated<br />
(lca-agrifood-asia.org). One of the first activities was the organisation of the first regional workshop on<br />
“<strong>LCA</strong> Agri-food Asia” <strong>in</strong> February <strong>2012</strong>. The workshop was organised by Kas<strong>et</strong>sart University, the Jo<strong>in</strong>t<br />
Graduate School of Energy and Environment, the Asian Institute of Technology and NSTDA of Thailand<br />
along with the National Agriculture and <strong>Food</strong> Organisation (Agriculture Research Centre) and TCO2 company<br />
of Japan. About 160 participants from 10 different countries attended the event. Experiences on <strong>LCA</strong> <strong>in</strong><br />
agri-food were shared from Indonesia, Japan, Korea, Malaysia and Thailand. Experiences from EU were<br />
shared by <strong>in</strong>vited experts from the University of Surrey, UK and the French Agricultural Research for Development<br />
Centre (CIRAD). The event led to the development of the <strong>LCA</strong> Agri-food Asia Forum. The next<br />
workshop is planned for 2013 <strong>in</strong> Indonesia.<br />
4. Outlook for the future<br />
By their very nature, <strong>LCA</strong>s str<strong>et</strong>ch across the entire life cycle of products which <strong>in</strong> this age of globalisation<br />
<strong>in</strong>cludes not only countries, but regions, cont<strong>in</strong>ents or even the whole world. Data requirements are thus<br />
not restricted to national boundaries. Develop<strong>in</strong>g national LCI databases is of course imperative, but not an<br />
end <strong>in</strong> itself. As outl<strong>in</strong>ed <strong>in</strong> the previous section, many countries <strong>in</strong> Asia are tak<strong>in</strong>g the first baby steps towards<br />
cooperation. The <strong>in</strong>dustrialised countries with more experience <strong>in</strong> develop<strong>in</strong>g databases as well as <strong>in</strong><br />
shar<strong>in</strong>g data will need to be actively <strong>in</strong>volved <strong>in</strong> capacity build<strong>in</strong>g efforts for both these aspects. A useful<br />
effort is be<strong>in</strong>g coord<strong>in</strong>ated by the United Nations Environment Programme (UNEP, 2011); the current popularity<br />
of carbon and water footpr<strong>in</strong>t<strong>in</strong>g as well as environmental labell<strong>in</strong>g <strong>in</strong> general, also provides a driv<strong>in</strong>g<br />
1 PCRs are s<strong>et</strong>s of specific rules, requirements and guidel<strong>in</strong>es for develop<strong>in</strong>g Type III environmental declarations for one or more<br />
product categories (BSI, 2008)<br />
28
KEYNOTE SESSION 8 th Int. Conference on <strong>LCA</strong> <strong>in</strong> the<br />
Agri-<strong>Food</strong> Sector, 1-4 Oct <strong>2012</strong><br />
force. Development of standardised data formats (e.g. ILCD) is a major step <strong>in</strong> the right direction. Capacity<br />
build<strong>in</strong>g of researchers, policy makers, and <strong>in</strong>dustry is another relevant step. Development of the national<br />
LCI database requires much effort <strong>in</strong> engagement of <strong>in</strong>dustrial associations for participat<strong>in</strong>g <strong>in</strong> the data collection<br />
efforts as well as to allay concerns of compromis<strong>in</strong>g confidentiality. Attempts at <strong>in</strong>ternational collaboration<br />
will exacerbate such concerns, especially vis-à-vis perceived impacts on <strong>in</strong>ternational trade. These<br />
issues will need to be urgently addressed to facilitate cooperation. It would be useful to learn from the experience<br />
of national and <strong>in</strong>ternational database efforts such as Agri-BALYSE (<strong>France</strong>), <strong>LCA</strong> food database<br />
(Denmark), Eco<strong>in</strong>vent, <strong>et</strong>c. on how they dealt with such issues. This would provide further directions for the<br />
future.<br />
5. Conclud<strong>in</strong>g remarks<br />
<strong>LCA</strong> <strong>in</strong> the agri-food sector has been recently established very strongly <strong>in</strong> Thailand through various national<br />
level <strong>in</strong>itiatives such as the development of the LCI database and product carbon footpr<strong>in</strong>t<strong>in</strong>g and labell<strong>in</strong>g.<br />
Of course much work still needs to be done on improv<strong>in</strong>g the quality, representativity and reliability<br />
of the data; this will support the further application of <strong>LCA</strong> especially by the <strong>in</strong>dustries. <strong>LCA</strong> is also on the<br />
rise <strong>in</strong> other countries <strong>in</strong> the region, though some countries are still far from realis<strong>in</strong>g its importance. M<strong>et</strong>hodological<br />
issues particularly perta<strong>in</strong><strong>in</strong>g to land use change and biodiversity need urgent attention. Efforts<br />
are ongo<strong>in</strong>g to dissem<strong>in</strong>ate knowledge and experience from Thailand to other countries which are still <strong>in</strong> the<br />
<strong>in</strong>itial stages of <strong>LCA</strong> development through the recently <strong>in</strong>itiated <strong>LCA</strong> Agri-food n<strong>et</strong>work. Japan has played<br />
an important role <strong>in</strong> partner<strong>in</strong>g with Thailand <strong>in</strong> this effort as have other countries such as Indonesia, Malaysia<br />
and Vi<strong>et</strong>nam. European countries can also be <strong>in</strong>terest<strong>in</strong>g partners as they have much experience <strong>in</strong> develop<strong>in</strong>g<br />
national and regional-level agriculture and food databases as well as assessment tools. These experiences<br />
would be very useful for the emerg<strong>in</strong>g countries <strong>in</strong> Asia so that they can leapfrog the <strong>in</strong>itial problems<br />
that the developed countries must have faced while <strong>in</strong>itiat<strong>in</strong>g their <strong>LCA</strong> activities <strong>in</strong> the agri-food sector. The<br />
developed countries on the other hand can also learn about agriculture and food <strong>in</strong>dustries <strong>in</strong> Asia which will<br />
be useful especially for the many environmental labell<strong>in</strong>g efforts that are ongo<strong>in</strong>g and where many of the<br />
upstream process of agriculture and food process<strong>in</strong>g are based <strong>in</strong> Asia. More engagement can also come<br />
through jo<strong>in</strong>t efforts at n<strong>et</strong>work<strong>in</strong>g; the <strong>LCA</strong> Agri-food Asia could also l<strong>in</strong>k up with exist<strong>in</strong>g n<strong>et</strong>works<br />
worldwide, such as <strong>in</strong>ter alia UNEP/SETAC Life Cycle Initiative, ENVIFOOD protocol and the Susta<strong>in</strong>ability<br />
Consortium, that have similar goals.<br />
6. Acknowledgements<br />
Dr. Thumrongrut Mungcharoen and Ms. Patcharaporn Pongpat of NSTDA, Thailand; Dr. Rattanawan<br />
Mungkung of Kas<strong>et</strong>sart University, Thailand and Dr. Chen Sau Soon of SIRIM Berhad, Malaysia are acknowledged<br />
for provid<strong>in</strong>g support<strong>in</strong>g <strong>in</strong>formation. Special thanks to Dr. Hayo van der Werf, French National<br />
Institute for Agricultural Research (INRA) for mak<strong>in</strong>g useful suggestions on the paper. The op<strong>in</strong>ions expressed<br />
<strong>in</strong> this article and any errors are the sole responsibility of the author.<br />
7. References<br />
BSI, 2008. PAS 2050:2008. Specification for the assessment of the life cycle greenhouse gas emissions of goods and services. British<br />
Standards Institution.<br />
Choo, Y.M., Muhamad, H., Hashim, Z., Subramanian, V., Puah, C.W., Tan, Y.A., 2011. D<strong>et</strong>erm<strong>in</strong>ation of GHG contributions by<br />
subsystems <strong>in</strong> the oil palm supply cha<strong>in</strong> us<strong>in</strong>g <strong>LCA</strong> approach. Int J Life Cycle Assess. 16, 669-681.<br />
Gheewala, S.H., 2011. Life Cycle Assessment (<strong>LCA</strong>) to evaluate environmental impacts of bioenergy projects. J Sust Energy Environ.<br />
Special Issue, 35-38.<br />
Gheewala, S.H., Mungkung, R., <strong>2012</strong>. FOODpr<strong>in</strong>t as a tool to support GHG reduction <strong>in</strong> the Thai agri-food sector. Proceed<strong>in</strong>gs of<br />
the 8th International Conference on <strong>LCA</strong> <strong>in</strong> the Agri-<strong>Food</strong> Sector, Rennes, <strong>France</strong>, 2-4 October <strong>2012</strong>.<br />
Hansen, S.B., Olsen, S.I., Ujang, Z. <strong>2012</strong>. Greenhouse gas reductions through enhanced use of residues <strong>in</strong> the life cycle of Malaysian<br />
palm oil derived biodiesel. Bioresource Technol. 104, 358-366.<br />
Harsono, S.S., Prochnow, A., Grundmann, P., Hansen, A., Hallmann, C., <strong>2012</strong>. Energy balances and greenhouse gas emissions of<br />
palm oil biodiesel <strong>in</strong> Indonesia. Glob Change Biol. 4, 213-228.<br />
Hassan, M.N.A., Jaramillo, P., Griff<strong>in</strong>, W.M., 2011. Life cycle GHG emissions from Malaysian oil palm bioenergy development.<br />
Energ Policy. 39, 2615-2625.<br />
Kamahara, H., Hasanud<strong>in</strong>, U., Widiyanto, A., TaDaimon, H., Tachibana, R., Atsuta, Y., Goto, N., Fujie, K., 2010. Improvement<br />
potential for n<strong>et</strong> energy balance of biodiesel derived from palm oil: A case study from Indonesian practice. Biomass Bioenerg.<br />
34, 1818-1824.<br />
Lebel, L., Mungkung, R., Gheewala, S.H., Lebel, P., 2010. Innovation cycles, niches and susta<strong>in</strong>ability <strong>in</strong> the shrimp aquaculture<br />
<strong>in</strong>dustry <strong>in</strong> Thailand. Environ Sci Policy. 13, 291-302.<br />
Lohsomboon, P., 2002. <strong>LCA</strong> Activities <strong>in</strong> Thailand. Int J Life Cycle Assess. 7, 181.<br />
Phong, L.T., de Boer, I.J.M., Udo, H.M.J., 2011. Life cycle assessment of food production <strong>in</strong> <strong>in</strong>tegrated agriculture-aquaculture<br />
systems of the Mekong Delta. Livest Sci. 139, 80-90.<br />
29
KEYNOTE SESSION 8 th Int. Conference on <strong>LCA</strong> <strong>in</strong> the<br />
Agri-<strong>Food</strong> Sector, 1-4 Oct <strong>2012</strong><br />
Mungkung, R., Gheewala, S.H., <strong>2012</strong>. Carbon footpr<strong>in</strong>t<strong>in</strong>g and labell<strong>in</strong>g of agri-food products: Practical issues for the development<br />
of Product Category Rules (PCR). Proceed<strong>in</strong>gs of the 8th International Conference on <strong>LCA</strong> <strong>in</strong> the Agri-<strong>Food</strong> Sector, Rennes,<br />
<strong>France</strong>, 2-4 October <strong>2012</strong>.<br />
Mungkung, R., Gheewala, S.H., Kanyarushoki, C., Hospido, A., van der Werf, H., Poovarodom, N., Bonn<strong>et</strong>, S., Aub<strong>in</strong>, J., Moreira,<br />
M.T., Feijoo, G., <strong>2012</strong>. Product carbon footpr<strong>in</strong>t<strong>in</strong>g <strong>in</strong> Thailand: A step towards susta<strong>in</strong>able consumption and production? Environmental<br />
Development 3, 100-108.<br />
arbon Footpr<strong>in</strong>t<strong>in</strong>g of<br />
Thai Rice Products: Practical Issues for a Harmonised M<strong>et</strong>hodology, 9th International Conference on Ecobalance, 09-12 November<br />
2010, Tokyo, Japan<br />
Mungkung, R., Udo de Haes, H.A., Clift, R., 2006. Potentials and Limitations of Life Cycle Assessment <strong>in</strong> S<strong>et</strong>t<strong>in</strong>g Ecolabell<strong>in</strong>g<br />
Criteria: A case study of Thai shrimp aquaculture product. Int J Life Cycle Assess. 11, 55-59.<br />
Nilsalab, P., Gheewala, S.H., Mungkung, R., <strong>2012</strong>. Water assessment of agrofuels feedstock cultivation: M<strong>et</strong>hodology approaches,<br />
Environment and Natural Resources Journal. (<strong>in</strong> press)<br />
Nguyen, T.L.T., 2007. Life-cycle assessment of bio-<strong>et</strong>hanol as an alternative transportation fuel <strong>in</strong> Thailand. Ph.D. dissertation, Jo<strong>in</strong>t<br />
Graduate School of Energy and Environment, K<strong>in</strong>g Mongkut’s University of Technology Thonburi, Bangkok, Thailand.<br />
Nguyen, T.L.T., Gheewala, S.H., 2008a. Life cycle assessment of fuel <strong>et</strong>hanol from cassava <strong>in</strong> Thailand, Int J Life Cycle Assess. 13,<br />
147-154.<br />
Nguyen, T.L.T., Gheewala, S.H., 2008b. Life cycle assessment of fuel <strong>et</strong>hanol from cane molasses <strong>in</strong> Thailand. Int J Life Cycle<br />
Assess. 13, 301-311.<br />
Phumpradab, K., Gheewala, S.H., Sagisaka, M., 2009. Life cycle assessment of natural gas power plants <strong>in</strong> Thailand. Int J Life Cycle<br />
Assess. 14, 354-363.<br />
Siangjaeo, S., Gheewala, S.H., Unnanon, K., Chidthaisong, A., 2011. Implications of land use change on the life cycle greenhouse<br />
gas emissions from palm biodiesel production <strong>in</strong> Thailand. Energy for Susta<strong>in</strong>able Development. 15, 1-7.<br />
Silalertruksa T., 2010. Susta<strong>in</strong>ability assessment of biofuels for transport <strong>in</strong> Thailand. Ph.D. dissertation, Jo<strong>in</strong>t Graduate School of<br />
Energy and Environment, K<strong>in</strong>g Mongkut’s University of Technology Thonburi, Bangkok, Thailand.<br />
Silalertruksa T., Gheewala, S.H., 2010. Security of feedstocks supply for future bio-<strong>et</strong>hanol production <strong>in</strong> Thailand, Energ Policy. 38,<br />
7476-7486.<br />
Silalertruksa T., Gheewala, S.H., 2011. Long-term bio-<strong>et</strong>hanol system and its implications on GHG emissions: A case study of Thailand,<br />
Environ Sci Technol. 39, 834-843.<br />
Silalertruksa, T., Gheewala, S.H., <strong>2012</strong>. <strong>Food</strong>, fuel and climate change: Is palm-based biodiesel a susta<strong>in</strong>able option for Thailand? J<br />
Ind Ecol. (<strong>in</strong> press)<br />
Suwanit W., Gheewala, S.H., 2011. Life cycle assessment of m<strong>in</strong>i-hydropower plants <strong>in</strong> Thailand. Int J Life Cycle Assess. 16, 849-<br />
858.<br />
UNEP, 2011. Global guidance pr<strong>in</strong>ciples for life cycle assessment databases – A basis for greener processes and products,<br />
UNEP/SETAC Life Cycle Initiative, United Nations Environment Programme.<br />
Yee, K.F., Tan, K.T., Abdullah, A.Z., Lee, K.T., 2009. Life cycle assessment of palm biodiesel: Reveal<strong>in</strong>g facts and benefits for<br />
susta<strong>in</strong>ability. Appl Energ. 86(Supplement 1), S189-S196.<br />
Yuttitham, M., 2009. Full carbon account<strong>in</strong>g <strong>in</strong> bioenergy production from sugarcane. Ph.D. dissertation, Jo<strong>in</strong>t Graduate School of<br />
Energy and Environment, K<strong>in</strong>g Mongkut’s University of Technology Thonburi, Bangkok, Thailand.<br />
30
KEYNOTE SESSION 8 th Int. Conference on <strong>LCA</strong> <strong>in</strong> the<br />
Agri-<strong>Food</strong> Sector, 1-4 Oct <strong>2012</strong><br />
The yield performance of organic agriculture<br />
Verena Seufert 1,* , Nav<strong>in</strong> Ramankutty 1 , Jonathan A. Foley 2<br />
1 Department of Geography and Global Environmental and Climate Change Center, McGill University, Quebec H2T 3A3, Canada<br />
2 Institute on the Environment (IonE), University of M<strong>in</strong>nesota, 1954 Buford Aevnue, St. Paul, M<strong>in</strong>nesota 55108, USA<br />
Correspond<strong>in</strong>g author. E-mail: verena.seufert@mail.mcgill.ca<br />
ABSTRACT<br />
Organic agriculture is often proposed as a solution to the challenge of produc<strong>in</strong>g sufficient food <strong>in</strong> a susta<strong>in</strong>able way. However,<br />
organic agriculture is also critizised for its purported lower productivity compared to conventional agriculture. Here we use a comprehensive<br />
m<strong>et</strong>a-analysis to exam<strong>in</strong>e the relative yield performance of organic and conventional farm<strong>in</strong>g systems globally. Our<br />
analysis of available data shows that, overall, organic yields are typically lower than conventional. The yield difference varies, however,<br />
depend<strong>in</strong>g on site and system characteristics. Under certa<strong>in</strong> conditions – i.e., with good management practices, particular crop<br />
types and grow<strong>in</strong>g conditions – organic systems can nearly match conventional yields, while under others it currently cannot. To<br />
establish organic agriculture as an important tool <strong>in</strong> susta<strong>in</strong>able food production, the factors limit<strong>in</strong>g organic yields need to be more<br />
fully understood, alongside assessments of the many social, environmental and economic benefits of organic farm<strong>in</strong>g systems.<br />
Keywords: organic agriculture, yields, m<strong>et</strong>a-analysis, susta<strong>in</strong>ability<br />
1. Introduction<br />
Agriculture is a major source of global environmental degradation (Foley <strong>et</strong> al., 2005). Numerous recent<br />
reports have emphasized the need for drastic changes <strong>in</strong> the food system <strong>in</strong> order to me<strong>et</strong> the double challenge<br />
of feed<strong>in</strong>g a grow<strong>in</strong>g population with a ris<strong>in</strong>g demand for high-quality di<strong>et</strong>s while m<strong>in</strong>imiz<strong>in</strong>g the environmental<br />
impacts of food production (Foley <strong>et</strong> al., 2011). ‘Alternative’ management practices that try to<br />
mimic ecological processes while m<strong>in</strong>imiz<strong>in</strong>g external <strong>in</strong>puts are often suggested as important tools <strong>in</strong> the<br />
solution to this problem (Schutter 2010). Organic agriculture, which currently covers 0.9% of global agricultural<br />
land (Willer and Kilcher 2011), is the most prom<strong>in</strong>ent of these alternative farm<strong>in</strong>g systems. It is a farm<strong>in</strong>g<br />
system aimed at produc<strong>in</strong>g food with m<strong>in</strong>imal harm to ecosystems, animals or humans.<br />
Driven by consumer concerns about food saf<strong>et</strong>y and environmental issues the mark<strong>et</strong> for organic products<br />
has grown rapidly and more than tripled <strong>in</strong> the last decade (Willer and Kilcher 2011). Notwithstand<strong>in</strong>g its<br />
<strong>in</strong>creas<strong>in</strong>g popularity amongst consumers, organic agriculture has many ardent opponents (Trewavas 2001).<br />
One of the ma<strong>in</strong> objections aga<strong>in</strong>st it is its purported lower productivity – critiques argue that organic agriculture<br />
would need considerable more land to produce the same amount of food, result<strong>in</strong>g <strong>in</strong> more widespread<br />
deforestation and biodiversity loss.<br />
A recent study attempted to address this criticism by analys<strong>in</strong>g data from the literature on 293 organic-toconventional<br />
yield comparisons (Badgley <strong>et</strong> al., 2007). They concluded that organic agriculture could, overall,<br />
provide sufficient food to feed the current population for the same amount of land used. This conclusion<br />
was, however, highly contested by several critiques who claimed that serious m<strong>et</strong>hodological flaws had led<br />
to an overestimation of organic yields (Avery 2007; Connor 2008).<br />
2. M<strong>et</strong>hods<br />
Here we have performed a comprehensive synthesis of the current scientific literature on organic-toconventional<br />
yield comparisons us<strong>in</strong>g formal m<strong>et</strong>a-analysis techniques. We compiled our own datas<strong>et</strong> of<br />
scientific studies compar<strong>in</strong>g organic and conventional yields. To address the criticisms of the Badgley <strong>et</strong> al.,<br />
(2007) study we used several selection criteria: (1) we restricted our analysis to studies on “truly” organic<br />
systems, def<strong>in</strong>ed as those with certified organic management or non-certified organic management, follow<strong>in</strong>g<br />
the standards of organic certification bodies; (2) only <strong>in</strong>cluded studies with comparable spatial and temporal<br />
scales for both organic and conventional systems; and (3) only <strong>in</strong>cluded studies report<strong>in</strong>g (or we could<br />
estimate) sample size and error. Conventional systems were either high- or low-<strong>in</strong>put commercial systems, or<br />
subsistence agriculture. 66 studies m<strong>et</strong> these criteria, represent<strong>in</strong>g 62 study sites, and report<strong>in</strong>g 316 organicto-conventional<br />
yield comparisons on 34 different crop species.<br />
We used the natural logarithm of the response ratio, which is the ratio b<strong>et</strong>ween organic and conventional<br />
yields, as effect size and calculated a weighted average by weight<strong>in</strong>g each observation by the <strong>in</strong>verse of the<br />
mixed-model variance (Hedges <strong>et</strong> al., 1999). An effect size is considered significant if its confidence <strong>in</strong>terval<br />
(CI) does not overlap one <strong>in</strong> the backtransformed response ratio. In addition to yields, we collected <strong>in</strong>formation<br />
on study characteristics like crop rotations, fertiliser type and experimental study design as well as <strong>in</strong>formation<br />
on the biophysical characteristics of the study site, and analysed their <strong>in</strong>fluence as well. To test for<br />
the <strong>in</strong>fluence of categorical variables on yield effect sizes we exam<strong>in</strong>ed the b<strong>et</strong>ween-group h<strong>et</strong>erogeneity<br />
31
KEYNOTE SESSION 8 th Int. Conference on <strong>LCA</strong> <strong>in</strong> the<br />
Agri-<strong>Food</strong> Sector, 1-4 Oct <strong>2012</strong><br />
(QB). A significant QB <strong>in</strong>dicates that there are differences <strong>in</strong> the effect sizes b<strong>et</strong>ween different classes of a<br />
categorical variable (Rosenberg <strong>et</strong> al., 2000). All statistical analyses were carried out <strong>in</strong> M<strong>et</strong>aW<strong>in</strong> 2.0<br />
(Rosenberg <strong>et</strong> al., 2000). For representation <strong>in</strong> graphs effect sizes were backtransformed to response ratios.<br />
3. Results<br />
The overall organic-to-conventional yield ratio is 0.75 (with a 95% CI of 0.71 to 0.79), mean<strong>in</strong>g that<br />
across the 316 yield comparisons organic yields are 25% lower than conventional yields (Fig. 1a). This result<br />
only changes slightly (yield ratio of 0.74) if the analysis is limited to studies follow<strong>in</strong>g high scientific quality<br />
standards (Fig. 2).<br />
Figure 1. Influence of different crop types (a), plant types (b) and crop species (c) on organic-to-conventional<br />
yield ratios. Only those crop types and crop species are shown that were represented by at least 10 observations<br />
and 2 different studies. Values are effect sizes with 95% CIs. A significant response is when the CI<br />
does not overlap 1. The number of yield observations <strong>in</strong> each class is shown <strong>in</strong> parentheses. The dotted l<strong>in</strong>e<br />
<strong>in</strong>dicates the cumulative effect size across all classes.<br />
The performance of organic systems varies substantially across crop types and species (Fig. 1a-c). Only<br />
categories with a significant QB are presented <strong>in</strong> Figures. Organic yields of fruits and oilseed crops show a<br />
small, but not statistically significant, difference to conventional crops (their CI overlap zero), whereas organic<br />
cereals and veg<strong>et</strong>ables have significantly lower yields (-26% and -33% respectively) (Fig. 1a). These<br />
differences seem to be related to the b<strong>et</strong>ter organic performance (referr<strong>in</strong>g to the relative yield of organic to<br />
conventional systems) of perennial over annual crops and of legumes over non-legumes (Fig. 1b). Marked<br />
differences can, however, also be observed b<strong>et</strong>ween crop species of the same crop type -- maize outperforms<br />
wheat and barley yields under organic management (Fig. 1c).<br />
Part of the yield response can be expla<strong>in</strong>ed by differences <strong>in</strong> the amount of nitrogen (N) <strong>in</strong>put received by<br />
the two systems (Fig. 3a). When organic systems receive higher quantities of N than conventional systems,<br />
organic performance improves, whereas conventional systems do not benefit from more N. In other words,<br />
organic systems appear to be N limited, whereas conventional systems are not. To achieve yields that are<br />
comparable to conventional systems, organic agriculture thus appears to require higher N <strong>in</strong>puts. This could<br />
be due to organic N <strong>in</strong>puts be<strong>in</strong>g less readily available to plants. Even if the total amount of N <strong>in</strong> soils managed<br />
with organic or conventional m<strong>et</strong>hods do not differ, the composition of the N pools often do (Stockdale<br />
<strong>et</strong> al., 2002). Soils under organic management often have high organic matter and organic N pools but low<br />
m<strong>in</strong>eral N content (Stockdale <strong>et</strong> al., 2002). The release of plant-available m<strong>in</strong>eral N from these organic pools<br />
is slow and does often not keep up with the high crop N demand dur<strong>in</strong>g the peak grow<strong>in</strong>g period (Berry <strong>et</strong><br />
al., 2002; Pang and L<strong>et</strong>ey 2000). Nitrogen availability has thus been found to be a major yield-limit<strong>in</strong>g factor<br />
<strong>in</strong> many organic systems (Berry <strong>et</strong> al., 2002; Clark <strong>et</strong> al., 1999).<br />
32<br />
a<br />
Crop type<br />
0.6 0.8 1 1.2<br />
Organic:conventional yield ratio<br />
All crops (316)<br />
Fruits (14)<br />
Oilseed crops (28)<br />
Cereals (161)<br />
Veg<strong>et</strong>ables (82)<br />
b<br />
Plant type<br />
0.6 0.8 1 1.2<br />
Organic:conventional yield ratio<br />
Legumes (34)<br />
Non-legumes (282)<br />
Perennials (25)<br />
Annuals (291)<br />
c<br />
Crop species<br />
0.6 0.8 1 1.2<br />
Organic:conventional yield ratio<br />
Maize (74)<br />
Barley (19)<br />
Wheat (53)<br />
Tomato (35)<br />
Soybean (25)
KEYNOTE SESSION 8 th Int. Conference on <strong>LCA</strong> <strong>in</strong> the<br />
Agri-<strong>Food</strong> Sector, 1-4 Oct <strong>2012</strong><br />
0.6 0.7 0.8 0.9 1<br />
Organic:conventional yield ratio<br />
Best study quality (165)<br />
Non-food rotation (240)<br />
Long-term studies (233)<br />
Typical conventional (167)<br />
Comparable systems (64)<br />
Best org. management (76)<br />
Legumes and perennials (55)<br />
Best org. performance 1 (36)<br />
Best org. performance 2 (150)<br />
Figure 2. Sensitivity study of organic-to-conventional yield ratios: ‘Best study quality’ - studies from peerreviewed<br />
journals us<strong>in</strong>g an appropriate study design and mak<strong>in</strong>g appropriate <strong>in</strong>ferences; ‘non-food rotation’ -<br />
studies where the organic and conventional systems rotations have a similar duration of non-food crops;<br />
‘long-term studies’ - excludes studies that are both very short and on recently converted plots; ‘typical conventional’<br />
- restricted to commercial conventional systems with conventional yields comparable to local<br />
averages; ‘comparable systems’ - studies that use appropriate study design and make appropriate <strong>in</strong>ferences,<br />
where organic and conventional have the same length of non-food rotation and receive similar amounts of N<br />
<strong>in</strong>puts; ‘best org management’ - excludes studies without BMP or crop rotations; ‘legumes and perennials’ -<br />
only legumes and perennials; ‘best org performance 1’ - ra<strong>in</strong>fed legumes and perennials on weak-acidic to<br />
weak-alkal<strong>in</strong>e soils; ‘best org performance 2’ - weak-acidic to weak-alkal<strong>in</strong>e soils under ra<strong>in</strong>fed conditions.<br />
The b<strong>et</strong>ter performance of organic legumes and perennials is, <strong>in</strong>stead, not because they received more N,<br />
but rather because they seem to be more efficient at us<strong>in</strong>g N. Legumes are not as dependent on external N<br />
sources as non-legumes, whereas perennials, ow<strong>in</strong>g to their longer grow<strong>in</strong>g period and extensive root systems,<br />
can achieve a b<strong>et</strong>ter synchrony b<strong>et</strong>ween nutrient demands and the slow release of N from organic matter<br />
(Crews 2005).<br />
Organic crops perform b<strong>et</strong>ter on weak-acididc to weak-alkal<strong>in</strong>e soils (that is, soils with a pH b<strong>et</strong>ween 5.5<br />
and 8.0, Fig. 3e). A possible explanation is the difficulty of manag<strong>in</strong>g phosphorus (P) <strong>in</strong> organic systems.<br />
Under strongly alkal<strong>in</strong>e and acidic conditions, P is less readily available to plants as it forms <strong>in</strong>soluble phosphates,<br />
and crops depend to a stronger degree on soil amendments and fertilisers. Organic systems often do<br />
not receive adequate P <strong>in</strong>puts to replenish the P lost through harvest (Oehl <strong>et</strong> al., 2002). To test this hypothesis<br />
we need further research on the performance and nutrient dynamics of organic agriculture on soils of<br />
vary<strong>in</strong>g pH.<br />
Studies that reported hav<strong>in</strong>g applied best management practices (BMP) <strong>in</strong> both systems show b<strong>et</strong>ter organic<br />
performance (Fig. 3c). Nutrient and pest management <strong>in</strong> organic systems rely on biological processes<br />
to deliver plant nutrients and to control weed and herbivore populations. Organic yields thus depend more on<br />
knowledge and good management practices than conventional yields.<br />
It is often reported that organic yields are low <strong>in</strong> the first years after conversion and gradually <strong>in</strong>crease<br />
over time, due to improvements <strong>in</strong> soil fertility and management skills (Mart<strong>in</strong>i <strong>et</strong> al., 2004). This is supported<br />
by our analysis: organic performance improves <strong>in</strong> studies that either lasted for more than two seasons,<br />
or were conducted on plots that have been organic for at least three years (Fig. 2, Fig. 3d).<br />
Water relations also <strong>in</strong>fluence organic yield ratios -- organic performance is -35% under irrigated, but<br />
only -17% under ra<strong>in</strong>fed conditions (Fig. 3e). This could be due to a relatively b<strong>et</strong>ter organic performance<br />
under variable moisture conditions <strong>in</strong> ra<strong>in</strong>fed systems. Soils managed with organic m<strong>et</strong>hods have shown<br />
b<strong>et</strong>ter water-hold<strong>in</strong>g capacity and water <strong>in</strong>filtration rates and have produced higher yields than conventional<br />
systems under drought conditions and excessive ra<strong>in</strong>fall (Lotter <strong>et</strong> al., 2003). This has been attributed to the<br />
higher soil organic matter content and the <strong>in</strong>creased aggregate stability of soils managed with organic m<strong>et</strong>hods<br />
(Stockdale <strong>et</strong> al., 2001). On the other hand, organic systems are often nutrient-limited (see earlier discussion),<br />
and thus probably do not respond as strongly to irrigation as conventional systems.<br />
33
KEYNOTE SESSION 8 th Int. Conference on <strong>LCA</strong> <strong>in</strong> the<br />
Agri-<strong>Food</strong> Sector, 1-4 Oct <strong>2012</strong><br />
Figure 3. Influence of the amount of N <strong>in</strong>put (a), soil pH (b), BMP (c), time s<strong>in</strong>ce conversion to organic<br />
management (d), irrigation (e) and country development (f) on organic-to-conventional yield ratios.<br />
The majority of studies <strong>in</strong> our m<strong>et</strong>a-analysis come from developed countries (Fig. 3f). Compar<strong>in</strong>g organic<br />
agriculture across the world, we f<strong>in</strong>d that <strong>in</strong> developed countries organic performance is, on average, -20%,<br />
whereas <strong>in</strong> develop<strong>in</strong>g countries it is -43% (Fig. 3f). This poor performance of organic <strong>in</strong> develop<strong>in</strong>g countries<br />
may be expla<strong>in</strong>ed by the fact that a majority of the data (58 of 67) from develop<strong>in</strong>g countries seem to<br />
have atypical conventional yields (>50% higher than local yield averages), com<strong>in</strong>g from irrigated lands (52<br />
of 67), experimental stations (54 of 67) and from systems not us<strong>in</strong>g BMP (67 of 67). In the few cases from<br />
develop<strong>in</strong>g countries where organic yields are compared to conventional yields typical for the location or<br />
where the yield data comes from surveys, organic yields do not differ significantly from conventional yields<br />
because of a wide confidence <strong>in</strong>terval result<strong>in</strong>g from the small sample size (N = 8 and N = 12 respectively).<br />
The results of our m<strong>et</strong>a-analysis differ dramatically from the previous results of Badgley <strong>et</strong> al., (2007).<br />
While our organic performance is lower than Badgley <strong>et</strong> al., (2007) <strong>in</strong> developed countries (-20% compared<br />
to -8%), our results are markedly different <strong>in</strong> develop<strong>in</strong>g countries (-43% compared to +80%). (But note that<br />
these figures are not directly comparable, as the Badgley <strong>et</strong> al., study used a simple arithm<strong>et</strong>ric mean, while<br />
we used a weighted effect size to analyse the central tendency of the data.) This is because they ma<strong>in</strong>ly <strong>in</strong>cluded<br />
yield comparisons from conventional low-<strong>in</strong>put subsistence systems, while our datas<strong>et</strong> ma<strong>in</strong>ly <strong>in</strong>cludes<br />
data from high-<strong>in</strong>put systems for develop<strong>in</strong>g countries. However, Badgley <strong>et</strong> al., (2007) compared<br />
subsistence systems to yields that were not truly organic, and/or from surveys of projects that lacked an adequate<br />
control. Not a s<strong>in</strong>gle study compar<strong>in</strong>g organic to subsistence systems m<strong>et</strong> our selection criteria and<br />
could be <strong>in</strong>cluded <strong>in</strong> the m<strong>et</strong>a-analysis. We cannot, therefore, rule out the claim (Scialabba and Hattam 2002)<br />
that organic agriculture can <strong>in</strong>crease yields <strong>in</strong> smallholder agriculture <strong>in</strong> develop<strong>in</strong>g countries. But ow<strong>in</strong>g to a<br />
lack of quantitative studies with appropriate controls we do not have sufficient scientific evidence to support<br />
it either. Fortunately, the Swiss Research Institute of Organic Agriculture (FiBL) recently established the<br />
first long-term comparison of organic and different conventional systems <strong>in</strong> the tropics (FiBL 2011). Such<br />
well- designed long-term field trials are urgently needed.<br />
4. Discussion<br />
Our analysis shows that yield differences b<strong>et</strong>ween organic and conventional agriculture do exist, but that<br />
they are highly contextual. When us<strong>in</strong>g best organic management practices yields are closer to (-13%) conventional<br />
yields (Fig. 2). Organic agriculture also performs b<strong>et</strong>ter under certa<strong>in</strong> agroecological conditions –<br />
e.g., organic legumes or perennials, on weak-acidic to weak-alkal<strong>in</strong>e soils, <strong>in</strong> ra<strong>in</strong>fed conditions, achieve<br />
yields that are only 5% lower than conventional yields (Fig. 2). On the other hand, when only the most comparable<br />
conventional and organic systems are considered, the yield difference is as high as 34% (Fig. 2).<br />
Although we were able to identify factors contribut<strong>in</strong>g to variations <strong>in</strong> organic performance, several other<br />
potentially important factors could not be tested due to a lack of appropriate studies. For example, we were<br />
not able to analyse tillage, crop residue or pest management. Also, most of the studies <strong>in</strong>cluded <strong>in</strong> our analysis<br />
experienced favourable grow<strong>in</strong>g conditions. Performance of organic agriculture under dry climates, short<br />
grow<strong>in</strong>g seasons and on unfertile soils should be studied more thoroughly and the potential mechanistic dif-<br />
34<br />
a<br />
N <strong>in</strong>put amount<br />
0.4 0.6 0.8 1<br />
d<br />
Time s<strong>in</strong>ce conversion<br />
0.4 0.6 0.8 1<br />
Organic:conventional yield ratio<br />
More <strong>in</strong> organic (64)<br />
Similar (71)<br />
More <strong>in</strong><br />
conventional (103)<br />
Recent (141)<br />
Young (34)<br />
Established (27)<br />
b<br />
Soil pH<br />
0.4 0.6 0.8 1<br />
e<br />
Irrigation<br />
0.4 0.6 0.8 1<br />
Organic:conventional yield ratio<br />
Strong acidic (57)<br />
Weak acidic to weak<br />
alkal<strong>in</strong>e (216)<br />
Strong alkal<strong>in</strong>e (37)<br />
Irrigated (125)<br />
Ra<strong>in</strong>-fed (191)<br />
c<br />
BMP<br />
0.4 0.6 0.8 1<br />
f<br />
Country development<br />
0.4 0.6 0.8 1<br />
Organic:conventional yield ratio<br />
No BMP (235)<br />
BMP used (81)<br />
Developed (249)<br />
Develop<strong>in</strong>g (67)
KEYNOTE SESSION 8 th Int. Conference on <strong>LCA</strong> <strong>in</strong> the<br />
Agri-<strong>Food</strong> Sector, 1-4 Oct <strong>2012</strong><br />
ferences with conventional agriculture under these biophysical conditions exam<strong>in</strong>ed. In addition, for a farm<strong>in</strong>g<br />
system comparison it would be desirable to exam<strong>in</strong>e a system m<strong>et</strong>ric like total human-edible calorie or<br />
n<strong>et</strong> energy yield of the entire crop rotation rather than biomass yield of a s<strong>in</strong>gle crop species. Probably most<br />
importantly, however, more studies on organic agriculture need to be conducted that are representative of the<br />
agricultural reality of the majority of farm<strong>in</strong>g systems. In this m<strong>et</strong>a-analysis organic systems were mostly<br />
compared to commercial high <strong>in</strong>put systems (which had predom<strong>in</strong>antly above-average yields and came from<br />
irrigated agriculture <strong>in</strong> develop<strong>in</strong>g countries). However, 75% of global cropland is not irrigated (Portmann <strong>et</strong><br />
al., 2010) and 50% of cropland receives fertiliser rates of less than 2.5 kg N ha -1 (Potter <strong>et</strong> al., 2010). The<br />
conventional systems <strong>in</strong> our database received on average 126 kg N ha -1 and the organic systems 118 kg N<br />
ha -1 .<br />
To b<strong>et</strong>ter understand the performance of organic agriculture, we should therefore: (1) systematically analyse<br />
the long-term performance of organic agriculture under different management regimes; (2) study organic<br />
systems under a wider range of biophysical conditions; (3) evaluate the productive performance of<br />
farm<strong>in</strong>g systems through holistic system m<strong>et</strong>rics and (4) exam<strong>in</strong>e the yield performance of organic and conventional<br />
agricultural systems of smallholder agriculture.<br />
Yields are, however, only part of a suite of economic, social and environmental factors that need to be<br />
considered when gaug<strong>in</strong>g the benefits of different farm<strong>in</strong>g systems. In developed countries, the central question<br />
is wh<strong>et</strong>her the environmental benefits of organic crop production would offs<strong>et</strong> the costs of any lower<br />
yield (such as <strong>in</strong>creased food prices and reduced food exports). Studies have shown that organic practices<br />
can have a reduced environmental impact (Bengtsson <strong>et</strong> al., 2005; Siegrist <strong>et</strong> al., 1998). However, although<br />
the overall environmental performance of organic agriculture is often positive, the environmental impact per<br />
unit output or per unit <strong>in</strong>put is not always b<strong>et</strong>ter than <strong>in</strong> conventional agriculture (Leifeld <strong>et</strong> al., 2009).<br />
In develop<strong>in</strong>g countries, <strong>in</strong>stead, a key question is wh<strong>et</strong>her organic agriculture can help alleviate poverty<br />
for small farmers and <strong>in</strong>crease food security. On the one hand, it has been suggested that organic agriculture<br />
may improve farmer livelihoods due to cheaper <strong>in</strong>puts, higher and more stable prices, the possibility of <strong>in</strong>tegrat<strong>in</strong>g<br />
traditional knowledge and risk diversification (Scialabba and Hattam 2002). On the other hand, organic<br />
agriculture <strong>in</strong> develop<strong>in</strong>g countries is often an export-oriented system tied to a certification process by<br />
<strong>in</strong>ternational bodies, and its profitability can vary <strong>in</strong> different locations and years (Raynolds 2004; Valkila<br />
2009).<br />
5. Conclusion<br />
The discourse on organic agriculture needs to move away from an ideologically charged to a more balanced<br />
debate that is <strong>in</strong>formed by empirical evidence. On the one hand, benefits and problems of organic agriculture<br />
need to be assessed objectively and organic practices improved accord<strong>in</strong>gly. The biophysical, economic<br />
and social conditions under which organic agriculture would be favourable should be <strong>in</strong>vestigated. A<br />
less dogmatic approach to organic agriculture might also be helpful. Organic certification systems should<br />
reconsider the roots of organic agriculture as a farm<strong>in</strong>g system concerned about environmental outcomes, not<br />
about ideological prohibitions of specific <strong>in</strong>puts. Organic agriculture should be first of all a management<br />
system that uses best environmental practices. If, as the results of this m<strong>et</strong>a-analysis imply, organic fertilisation<br />
requires higher nitrogen <strong>in</strong>puts than conventional agriculture for achiev<strong>in</strong>g high yields, m<strong>in</strong>eral fertilisers<br />
might be a b<strong>et</strong>ter option for <strong>in</strong>creas<strong>in</strong>g poor farmers productivity. Even those that promote the adoption<br />
of alternative, agro-ecological fram<strong>in</strong>g practices caution aga<strong>in</strong>st the total exclusion of m<strong>in</strong>eral fertilisers<br />
(Schutter 2010). On the other hand, conventional farm<strong>in</strong>g systems should take advantage of the experience<br />
ga<strong>in</strong>ed <strong>in</strong> succesful organic systems and implement those practices that can improve the environmental susta<strong>in</strong>ability<br />
while ma<strong>in</strong>ta<strong>in</strong><strong>in</strong>g the productivity of the system. Mixed approaches that comb<strong>in</strong>e the use of m<strong>in</strong>eral<br />
fertilisers with succesful practices from organic management, like cover cropp<strong>in</strong>g, mulch<strong>in</strong>g, use of crop<br />
residues and <strong>in</strong>creased crop diversity, can show both high yields and reduced environmental problems<br />
(Tonitto <strong>et</strong> al., 2006).<br />
From an agricultural perspective to achieve susta<strong>in</strong>able food security we need to produce more food at affordable<br />
prices, ensur<strong>in</strong>g livelihoods to farmers and us<strong>in</strong>g management practices that reduce the environmental<br />
costs of food production. Consider<strong>in</strong>g the scale of the challenge ahead of us there is a strong need to<br />
enhance our efforts of understand<strong>in</strong>g how different farm<strong>in</strong>g systems and management practices contribute to<br />
the provision of susta<strong>in</strong>able food.<br />
6. References<br />
Avery, A. A., 2007. 'Organic abundance' report: fatally flawed. Renew. Agric. <strong>Food</strong> Syst. 22, 321-323.<br />
Badgley, C., Moghtader, J., <strong>et</strong> al., 2007. Organic agriculture and the global food supply. Renew. Agric. <strong>Food</strong> Syst. 22, 86.<br />
35
KEYNOTE SESSION 8 th Int. Conference on <strong>LCA</strong> <strong>in</strong> the<br />
Agri-<strong>Food</strong> Sector, 1-4 Oct <strong>2012</strong><br />
Bengtsson, J., Ahnström, J.Weibull, A.-C., 2005. The effects of organic agriculture on biodiversity and abundance: a m<strong>et</strong>a-analysis.<br />
J. Appl. Ecol. 42, 261-269.<br />
Berry, P., Sylvester Bradley, R., <strong>et</strong> al., 2002. Is the productivity of organic farms restricted by the supply of available nitrogen? Soil<br />
Use Manage. 18, 248-255.<br />
Clark, M. S., Horwath, W. R., <strong>et</strong> al., 1999. Nitrogen, weeds and water as yield-limit<strong>in</strong>g factors <strong>in</strong> conventional, low-<strong>in</strong>put, and organic<br />
tomato systems. Agr. Ecosyst. Environ. 73, 257-270.<br />
Connor, D. J., 2008. Organic agriculture cannot feed the world. Field Crops Res. 106, 187-190.<br />
Crews, T., 2005. Perennial crops and endogenous nutrient supplies. Renew. Agric. <strong>Food</strong> Syst. 20, 25-37.<br />
FiBL, 2011, 22.07.2011. Farm<strong>in</strong>g System Comparison <strong>in</strong> the Tropics. R<strong>et</strong>rieved 23.08.2011, from http://www.systemscomparison.fibl.org/.<br />
Foley, J. A., Defries, R., <strong>et</strong> al., 2005. Global consequences of land use. Science 309, 570-574.<br />
Foley, J. A., Ramankutty, N., <strong>et</strong> al., 2011. Solutions for a cultivated plan<strong>et</strong>. Nature 478, 337-342.<br />
Hedges, L. V., Gurevitch, J.Curtis, P. S., 1999. The m<strong>et</strong>a-analysis of response ratios <strong>in</strong> experimental ecology. Ecology 80, 1150-<br />
1156.<br />
Leifeld, J., Reiser, R.Oberholzer, H.-R., 2009. Consequences of Conventional versus Organic farm<strong>in</strong>g on Soil Carbon: Results from a<br />
27-Year Field Experiment. Agron. J. 101, 1204.<br />
Lotter, D., Seidel, R.Liebhardt, W., 2003. The performance of organic and conventional cropp<strong>in</strong>g systems <strong>in</strong> an extreme climate year.<br />
Am. J. Alternative Agric. 18, 146-154.<br />
Mart<strong>in</strong>i, E., Buyer, J. S., <strong>et</strong> al., 2004. Yield <strong>in</strong>creases dur<strong>in</strong>g the organic transition: improv<strong>in</strong>g soil quality or <strong>in</strong>creas<strong>in</strong>g experience?<br />
Field Crops Res. 86, 255-266.<br />
Oehl, F., Oberson, A., <strong>et</strong> al., 2002. Phosphorus budg<strong>et</strong> and phosphorus availability <strong>in</strong> soils under organic and conventional farm<strong>in</strong>g.<br />
Nutr. Cycl. Agroecosys. 62, 25-35.<br />
Pang, X.L<strong>et</strong>ey, J., 2000. Organic farm<strong>in</strong>g: challenge of tim<strong>in</strong>g nitrogen availability to crop nitrogen requirements. Soil Sci. Soc. Am.<br />
J. 64, 247-253.<br />
Portmann, F. T., Siebert, S.Döll, P., 2010. MIRCA2000—Global monthly irrigated and ra<strong>in</strong>fed crop areas around the year 2000: A<br />
new high-resolution data s<strong>et</strong> for agricultural and hydrological model<strong>in</strong>g. Global Biogeochemical Cycles 24.<br />
Potter, P., Ramankutty, N., <strong>et</strong> al., 2010. Characteriz<strong>in</strong>g the spatial patterns of global fertilizer application and manure production.<br />
Earth Interactions 14, 1-22.<br />
Raynolds, L. T., 2004. The globalization of organic agro-food n<strong>et</strong>works. World Development 32, 725-743.<br />
Rosenberg, M. S., Gurevitch, J.Adams, D. C., 2000. M<strong>et</strong>aW<strong>in</strong>: Statistical Software for M<strong>et</strong>a-analysis: Version 2, S<strong>in</strong>auer.<br />
Schutter, O. d., 2010. Report submitted by the Special Rapporteur on the right to food. New York, United Nations: 21.<br />
Scialabba, N.Hattam, C., Eds. (2002). Organic agriculture, environment and food security. Environment and Natural Resources<br />
Series. Rome, <strong>Food</strong> and Agriculture Organization of the United Nations (FAO).<br />
Siegrist, S., Schaub, D., <strong>et</strong> al., 1998. Does organic agriculture reduce soil erodibility? The results of a long-term field study on loess<br />
<strong>in</strong> Switzerland. Agr. Ecosyst. Environ. 69, 253-264.<br />
Stockdale, E., Lampk<strong>in</strong>, N. H., <strong>et</strong> al., 2001. Agronomic and environmental implications of organic farm<strong>in</strong>g systems. Adv. Agron. 70,<br />
261-262.<br />
Stockdale, E., Shepherd, M., <strong>et</strong> al., 2002. Soil fertility <strong>in</strong> organic farm<strong>in</strong>g systems-fundamentally different? Soil Use Manage. 18,<br />
301-308.<br />
Tonitto, C., David, M. B.Dr<strong>in</strong>kwater, L. E., 2006. Replac<strong>in</strong>g bare fallows with cover crops <strong>in</strong> fertilizer-<strong>in</strong>tensive cropp<strong>in</strong>g systems: A<br />
m<strong>et</strong>a-analysis of crop yield and N dynamics. Agriculture Ecosystems & Environment 112, 58-72.<br />
Trewavas, A., 2001. Urban myths of organic farm<strong>in</strong>g. Nature 410, 409-410.<br />
Valkila, J., 2009. Fair trade organic coffee production <strong>in</strong> Nicaragua--Susta<strong>in</strong>able development or a poverty trap? Ecol. Econ. 68,<br />
3018-3025.<br />
Willer, H.Kilcher, L., 2011. The World of Organic Agriculture - Statistics and Emerg<strong>in</strong>g Trends 2011, IFOAM & FiBL, Bonn &<br />
Frick.<br />
36
KEYNOTE SESSION 8 th Int. Conference on <strong>LCA</strong> <strong>in</strong> the<br />
Agri-<strong>Food</strong> Sector, 1-4 Oct <strong>2012</strong><br />
ENVIFOOD Protocol: launch of the collectively-agreed sectorial<br />
m<strong>et</strong>hodology for assess<strong>in</strong>g the environmental performance of food and<br />
dr<strong>in</strong>k products <strong>in</strong> Europe<br />
Camillo De Camillis 1,* , Jean-Christophe Bligny 2 , David Penn<strong>in</strong>gton 1 , Balázs Pályi 3 , Christian Bauer 4 , Urs<br />
Schenker 5 , Henry K<strong>in</strong>g 6 , Lars Lundquist 5 , Nicolas Mart<strong>in</strong> 7 , Nicole Unger 6 , Laura Draucker 8 , Øyv<strong>in</strong>d Vessia 9 ,<br />
Coen Blomsma 10 , Nathan Pell<strong>et</strong>ier 1 , Hans Blonk 11 , Rudi Sueys 12 , Anna Papagrigoraki 13 , Pascal Gréverath 14 ,<br />
Herbert Aich<strong>in</strong>ger 15 , Jean-Pierre Rennaud 16<br />
1 European Commission, Jo<strong>in</strong>t Research Centre (JRC), Institute for Environment and Susta<strong>in</strong>ability (IES), via Enrico Fermi 2749,<br />
21027 Ispra (Va), Italy<br />
2 Danone, 11 Avenue Géneral Dupas, 74500 Evian, <strong>France</strong><br />
3 <strong>Food</strong>Dr<strong>in</strong>kEurope, Avenue des Arts 43, 1040 Brussels, Belgium<br />
4 SIG Combibloc, Rurstrasse 58, 52441 L<strong>in</strong>nich, Germany<br />
5 Nestec Ltd, Nestlé Research Center, Vers-chez-les-Blanc, 1000 Lausanne 26, Switzerland<br />
6 Unilever Saf<strong>et</strong>y and Environmental Assurance Centre, Colworth Park, Sharnbrook, MK44 1LQ Bedford, UK<br />
7 FEFAC, Rue de la Loi, 223, Bte 2 B-1040 Bruxelles, Belgium<br />
8 World Resources Institute (WRI), 10 G St. NE, Suite 800, 20002 Wash<strong>in</strong>gton, DC, USA<br />
9 European Commission, DG Energy, BRU-DM24 04/109, 1040 Brussels, Belgium<br />
10 FEDIOL, Avenue de Tervuren 168, 1150 Bruxelles, Belgium<br />
11 Blonk Milieu Advies, Grav<strong>in</strong> Beatrixstraat 34, 2805 PJ Gouda, The N<strong>et</strong>herlands<br />
12 Coca-Cola Europe, Bergense Steenweg 1424, 1070 Brussels, Belgium<br />
13 CEFS, Avenue de Tervuren 182, B-1150 Brussels, Belgium<br />
14 Nestlé, Avenue Nestlé 55, 1800 Vevey, Switzerland<br />
15 European Commission, DG Environment, Avenue de Beaulieu 5, 1049 Brussels, Belgium<br />
16 Danone Institute, Route Départementale 128, 91767 Palaiseau, <strong>France</strong><br />
Correspond<strong>in</strong>g author. E-mail: camillo.de-camillis@jrc.ec.europa.eu<br />
The views expressed <strong>in</strong> this paper are personal and do not necessarily reflect an official position of the European Commission.<br />
ABSTRACT<br />
Lack of consistency <strong>in</strong> both the substance and application of m<strong>et</strong>hodologies and guidel<strong>in</strong>es for assess<strong>in</strong>g and communicat<strong>in</strong>g the<br />
environmental performance of food and dr<strong>in</strong>k products has the potential to confuse consumers and other stakeholders <strong>in</strong>volved <strong>in</strong> the<br />
food and dr<strong>in</strong>k supply cha<strong>in</strong>s. Furthermore, it poses an unnecessary burden on those organisations requested to evaluate the environmental<br />
performance of their product accord<strong>in</strong>g to several different m<strong>et</strong>hodologies.<br />
In order to address this issue, bus<strong>in</strong>ess associations and other food supply cha<strong>in</strong> partners have <strong>in</strong>volved the European Commission <strong>in</strong><br />
establish<strong>in</strong>g the European <strong>Food</strong> Susta<strong>in</strong>able Consumption and Production (SCP) Round Table. S<strong>in</strong>ce 2009, Round Table members<br />
have been work<strong>in</strong>g tog<strong>et</strong>her on a commonly-agreed and science-based framework for assessment and communication of the environmental<br />
performance of food and beverage products <strong>in</strong> Europe. The first milestone was reached <strong>in</strong> 2010 when Round Table members<br />
agreed on a s<strong>et</strong> of pr<strong>in</strong>ciples to guide work<strong>in</strong>g groups <strong>in</strong> harmoniz<strong>in</strong>g relevant approaches for assessment and communication.<br />
On this basis, the Round Table Work<strong>in</strong>g Group 1 reached agreement on key m<strong>et</strong>hodological aspects for environmental assessment at<br />
a scientific workshop <strong>in</strong> 2010. A d<strong>et</strong>ailed analysis of relevant data, m<strong>et</strong>hodologies and guidel<strong>in</strong>es for assess<strong>in</strong>g the environmental<br />
performance of foods and dr<strong>in</strong>ks was conducted follow<strong>in</strong>g the 2010 workshop. This analysis identified aspects of Life Cycle Assessment<br />
(<strong>LCA</strong>) practice where exist<strong>in</strong>g m<strong>et</strong>hodologies agree, as well as <strong>in</strong>consistencies among exist<strong>in</strong>g approaches. A second workshop<br />
was organized <strong>in</strong> 2011 to reach consensus on the outstand<strong>in</strong>g <strong>in</strong>consistencies. Rema<strong>in</strong><strong>in</strong>g unresolved issues were further discussed<br />
with<strong>in</strong> Work<strong>in</strong>g Group 1, lead<strong>in</strong>g to the release of an advanced draft of what will be the future Round Table m<strong>et</strong>hodology for<br />
environmental assessment named the ENVIFOOD Protocol. A public consultation scheduled dur<strong>in</strong>g the last quarter of <strong>2012</strong> will be<br />
followed by the publication of the ENVIFOOD Protocol <strong>in</strong> 2013. In conjunction with its publication, the ENVIFOOD Protocol will<br />
be tested through a range of pilot studies and the feedback used for ref<strong>in</strong><strong>in</strong>g the guidance.<br />
The ENVIFOOD Protocol provides guidance to support those environmental assessments of food and dr<strong>in</strong>k products <strong>in</strong> Europe<br />
conducted <strong>in</strong> the context of:<br />
Bus<strong>in</strong>ess-to-bus<strong>in</strong>ess as well as bus<strong>in</strong>ess-to-consumer communication (focus of the Round Table Work<strong>in</strong>g Group 2);<br />
The identification of environmental improvement options (focus of the Round Table Work<strong>in</strong>g Group 3).<br />
This paper gives a general overview of the process to arrive at the ENVIFOOD Protocol. The paper also illustrates possible next<br />
steps of the Round Table Work<strong>in</strong>g Group 1. Round Table members are, <strong>in</strong> fact, discuss<strong>in</strong>g how to develop and adopt Product Category<br />
Rules (PCR) <strong>in</strong> l<strong>in</strong>e with the ENVIFOOD Protocol. In parallel, Round Table members are also discuss<strong>in</strong>g how to obta<strong>in</strong> adequate<br />
data for assessment and streaml<strong>in</strong>ed tools. The establishment of the ENVIFOOD Protocol and PCRs will allow the development<br />
of user-friendly and affordable tools for assessment and communication of environmental impacts, thus reduc<strong>in</strong>g the burdens of<br />
undertak<strong>in</strong>g such assessments, <strong>in</strong> particular for SME’s.<br />
Keywords: Round Table, susta<strong>in</strong>able consumption and production, harmonisation, assessment m<strong>et</strong>hodology, ENVIFOOD Protocol<br />
1. Introduction<br />
Members of the European <strong>Food</strong> Susta<strong>in</strong>able Consumption and Production Round Table (SCP Round Table)<br />
are committed to help<strong>in</strong>g consumers and other stakeholders make <strong>in</strong>formed choices by provid<strong>in</strong>g them<br />
37
KEYNOTE SESSION 8 th Int. Conference on <strong>LCA</strong> <strong>in</strong> the<br />
Agri-<strong>Food</strong> Sector, 1-4 Oct <strong>2012</strong><br />
with accurate and understandable <strong>in</strong>formation on relevant product characteristics, <strong>in</strong>clud<strong>in</strong>g environmental<br />
performance.<br />
In the framework of the Round Table, Work<strong>in</strong>g Group 1 (WG1) has been develop<strong>in</strong>g a harmonised m<strong>et</strong>hodology<br />
called the Protocol for the Environment Assessment of <strong>Food</strong> and Dr<strong>in</strong>k Products (ENVIFOOD Protocol).<br />
The ENVIFOOD Protocol is <strong>in</strong>tended to provide common guidance for assess<strong>in</strong>g the environmental<br />
performance of food and dr<strong>in</strong>k products, hence overcom<strong>in</strong>g the difficulties associated with the current proliferation<br />
of standards and guidance documents on this subject.<br />
The ma<strong>in</strong> purpose of the ENVIFOOD Protocol is the development of a common framework that will <strong>in</strong>crease<br />
the scientific reliability and consistency <strong>in</strong> studies <strong>in</strong>tended to support <strong>in</strong>formed choice. In particular,<br />
this will support environmental assessments conducted <strong>in</strong> the context of bus<strong>in</strong>ess-to-bus<strong>in</strong>ess as well as bus<strong>in</strong>ess-to-consumer<br />
communication, and the identification of environmental improvement options.<br />
This paper provides an overview of the multi-stakeholder approach to develop the ENVIFOOD Protocol,<br />
an overview of the Protocol itself, and possible next steps.<br />
2. ENVIFOOD Protocol: a stepwise process <strong>in</strong>volv<strong>in</strong>g a broad spectrum of stakeholders<br />
As a first step towards the ENVIFOOD Protocol, the European Commission Jo<strong>in</strong>t Research Centre (JRC)<br />
Institute for Environment and Susta<strong>in</strong>ability (IES) hosted a scientific workshop <strong>in</strong> 2010 aimed at arriv<strong>in</strong>g at a<br />
common understand<strong>in</strong>g of what is required for: reliable and robust environmental assessment of food and<br />
dr<strong>in</strong>k product supply cha<strong>in</strong>s; current limitations; and how to move towards more straightforward/focused<br />
criteria/guidance/tools (Peacock <strong>et</strong> al., 2011).<br />
On this basis, and tak<strong>in</strong>g <strong>in</strong>to account the Guid<strong>in</strong>g Pr<strong>in</strong>ciples of the Round Table (<strong>Food</strong> RT, 2010), WG1<br />
elaborated a Road Map for the development and dissem<strong>in</strong>ation of the ENVIFOOD Protocol. Major tasks<br />
planned <strong>in</strong> the Road Map over the time period 2010-<strong>2012</strong> were: a d<strong>et</strong>ailed analysis of data gaps and of m<strong>et</strong>hodological<br />
issues; draft<strong>in</strong>g of the ENVIFOOD Protocol; public consultation; and revision of the draft Protocol.<br />
In order to validate the ENVIFOOD Protocol and facilitate its application, the follow<strong>in</strong>g additional steps<br />
were <strong>in</strong>cluded <strong>in</strong> the Road Map: test<strong>in</strong>g and f<strong>in</strong>e-tun<strong>in</strong>g of the ENVIFOOD Protocol; and provision of product<br />
specific guidel<strong>in</strong>es, criteria, tools and datas<strong>et</strong>s. Tasks beyond the ENVIFOOD Protocol test<strong>in</strong>g and f<strong>in</strong><strong>et</strong>un<strong>in</strong>g<br />
are currently out of the WG1 mandate and thus subject to future discussion and agreement.<br />
As the goal of the ENVIFOOD Protocol was to be built on the exist<strong>in</strong>g science for the environmental assessment<br />
of food and dr<strong>in</strong>k products, rather than <strong>in</strong>vent<strong>in</strong>g a new m<strong>et</strong>hodology from scratch, the d<strong>et</strong>ailed<br />
analysis was focused on:<br />
Review of m<strong>et</strong>hodologies and guidance documents for the environmental assessment of food and<br />
dr<strong>in</strong>k products;<br />
Exist<strong>in</strong>g datas<strong>et</strong>s related to food and dr<strong>in</strong>k products.<br />
As a first step for the d<strong>et</strong>ailed analysis, WG1 focussed on <strong>in</strong>ventory<strong>in</strong>g reference m<strong>et</strong>hodologies, guidel<strong>in</strong>es<br />
and assessments. The start<strong>in</strong>g po<strong>in</strong>t for this <strong>in</strong>ventory was a survey of exist<strong>in</strong>g <strong>in</strong>itiatives deal<strong>in</strong>g with<br />
susta<strong>in</strong>ability issues worldwide. This <strong>in</strong>ventory was then complemented by: a literature search of both scientific<br />
databases (e.g. SCOPUS, Google Scholar and Web of Science) and proceed<strong>in</strong>gs of the <strong>in</strong>ternational<br />
conferences on agri-food <strong>LCA</strong>; and a WG1 <strong>in</strong>ternal consultation. Exist<strong>in</strong>g and upcom<strong>in</strong>g life cycle-based<br />
technical standards and guidance documents were then grouped <strong>in</strong> the follow<strong>in</strong>g classes:<br />
General m<strong>et</strong>hodologies (i.e. reference standards and general guidance documents on <strong>LCA</strong>; general<br />
life cycle-based standards and technical agreements on footpr<strong>in</strong>ts and environmental disclosures);<br />
Sectorial m<strong>et</strong>hodologies (i.e. sector-specific guidance documents and technical agreements on environmental<br />
assessment and environmental disclosures);<br />
Sub-sectorial m<strong>et</strong>hodologies (i.e. sub-sector-specific guidance documents and technical agreements<br />
on environmental assessment and footpr<strong>in</strong>t<strong>in</strong>g; and sub-sectorial rules for product environmental<br />
declarations);<br />
Product-specific guidel<strong>in</strong>es (i.e. product category rules (PCR) for environmental declarations for<br />
food and dr<strong>in</strong>k products);<br />
Other m<strong>et</strong>hodological <strong>in</strong>puts (i.e. European Union (EU) laws giv<strong>in</strong>g guidance on certa<strong>in</strong> life cycle<br />
approaches; relevant life cycle-oriented assessments by <strong>in</strong>ternational authoritative bodies; any other<br />
m<strong>et</strong>hodology and guidel<strong>in</strong>e l<strong>in</strong>ked to food and dr<strong>in</strong>k products).<br />
In order to complement the overview <strong>in</strong> tabular form of carbon footpr<strong>in</strong>t m<strong>et</strong>hodologies – study prepared<br />
for the European Commission’s Directorate General (DG) Environment (Ernst&Young and Quantis, 2010) –<br />
a new m<strong>et</strong>hodology overview was outl<strong>in</strong>ed by WG1 draft<strong>in</strong>g group (De Camillis <strong>et</strong> al., 2011a) scann<strong>in</strong>g a<br />
38
KEYNOTE SESSION 8 th Int. Conference on <strong>LCA</strong> <strong>in</strong> the<br />
Agri-<strong>Food</strong> Sector, 1-4 Oct <strong>2012</strong><br />
large number of the m<strong>et</strong>hodologies and guidel<strong>in</strong>es found <strong>in</strong> the literature aga<strong>in</strong>st the applicable characterisation<br />
criteria from the aforementioned review for DG Environment.<br />
In parallel to the d<strong>et</strong>ailed analysis of m<strong>et</strong>hodologies and guidel<strong>in</strong>es, a data gap analysis was also carried<br />
out because data availability and data quality were d<strong>et</strong>ected by WG1 as corner stones of any robust assessment.<br />
Based on the <strong>in</strong>sights from the data mapp<strong>in</strong>g for the French environmental footpr<strong>in</strong>t<strong>in</strong>g <strong>in</strong>itiative, data<br />
issues were identified and a technical report (De Camillis, 2011) was released accord<strong>in</strong>gly to support development<br />
of the ENVIFOOD Protocol and possible future WG1 activities.<br />
To facilitate the process of deriv<strong>in</strong>g m<strong>et</strong>hodological recommendations from the m<strong>et</strong>hodology overviews<br />
<strong>in</strong> tabular form (Ernst&Young and Quantis, 2010; De Camillis <strong>et</strong> al., 2011), the WG1 draft<strong>in</strong>g group came<br />
up with a s<strong>et</strong> of key m<strong>et</strong>hodological issues on which the ENVIFOOD Protocol is expected to give guidance<br />
(Schenker <strong>et</strong> al., 2011). These m<strong>et</strong>hodological issues were identified by: analys<strong>in</strong>g the m<strong>et</strong>hodology overviews<br />
<strong>in</strong> tabular form; scann<strong>in</strong>g the key f<strong>in</strong>d<strong>in</strong>gs from the critical reviews of environmental assessment case<br />
studies <strong>in</strong> the agri-food sector; and tak<strong>in</strong>g <strong>in</strong>to account <strong>in</strong>puts from the technical report on data gaps.<br />
M<strong>et</strong>hodologies and guidel<strong>in</strong>es from the m<strong>et</strong>hodology overviews <strong>in</strong> tabular form (Ernst&Young and Quantis,<br />
2010; De Camillis <strong>et</strong> al., 2011) were then scanned aga<strong>in</strong>st the m<strong>et</strong>hodological issues identified by WG1<br />
draft<strong>in</strong>g group (Schenker <strong>et</strong> al., 2011). The purpose of this further analysis (De Camillis <strong>et</strong> al., 2011b) was to<br />
identify which recommendations/rules diverge across the reference documents analysed and, thus, signal<br />
where guidance must be harmonised <strong>in</strong> the ENVIFOOD Protocol. Particular emphasis was given to those<br />
m<strong>et</strong>hodologies and guidel<strong>in</strong>es that have somehow <strong>in</strong>volved stakeholders <strong>in</strong> their own development process.<br />
A lack of consensus on several m<strong>et</strong>hodological aspects was found across the m<strong>et</strong>hodologies reviewed (De<br />
Camillis <strong>et</strong> al., 2011b). In order to analyse those aspects where consensus does not exist at present and to<br />
identify specific m<strong>et</strong>hodological approaches to be <strong>in</strong>corporated <strong>in</strong> the ENVIFOOD Protocol, the JRC IES<br />
hosted another workshop <strong>in</strong> 2011. The workshop was relatively successful because several approaches for<br />
assessment were agreed by Round Table members (De Camillis <strong>et</strong> al., <strong>2012</strong>a, <strong>2012</strong>b).<br />
Nevertheless, some issues rema<strong>in</strong>ed and they were discussed with<strong>in</strong> WG1 before com<strong>in</strong>g out with a draft<br />
ENVIFOOD Protocol.<br />
The ENVIFOOD Protocol is not a self-support<strong>in</strong>g guide. Rather, it provides additional guidance to ISO<br />
14044, specific to food and dr<strong>in</strong>k products. Moreover, there is the <strong>in</strong>tention of alignment with the European<br />
Commission’s m<strong>et</strong>hodologies on Environmental Footpr<strong>in</strong>t.<br />
The Protocol gives recommendations and guidance on functional unit, system boundaries, data requirements<br />
and how to deal with data gaps. In addition, it also provides guidance on how to handle multifunctional<br />
processes and how to identify relevant environmental impact categories.<br />
Given that the ENVIFOOD Protocol is <strong>in</strong>tended to be applicable to the entire agri-food sector and hence<br />
impact on multiple stakeholders, it is important that the <strong>in</strong>put of scientific and food sector experts guide ref<strong>in</strong><strong>in</strong>g<br />
the current draft version of the Protocol. Towards this end, a public consultation will be launched <strong>in</strong><br />
the last quarter of <strong>2012</strong>. In parallel, the Protocol will be tested with the support of bus<strong>in</strong>ess associations or<br />
<strong>in</strong>dividual companies. Accord<strong>in</strong>g to the feedback collected from both the public consultation and pilot tests,<br />
the ENVIFOOD Protocol will be revised <strong>in</strong> 2013.<br />
In the com<strong>in</strong>g years, the Round Table members may play a central role <strong>in</strong> the development/adoption of<br />
PCRs address<strong>in</strong>g food and dr<strong>in</strong>k products. As specific issues at product level cannot be directly addressed by<br />
the Protocol, Product Category Rules (PCRs) may complement the Protocol by provid<strong>in</strong>g further d<strong>et</strong>ailed<br />
guidance where necessary. This might <strong>in</strong>clude, for example, rules for solv<strong>in</strong>g multifunctionality problems<br />
(allocation). Such d<strong>et</strong>ailed guidance should contribute to the establishment and diffusion of a s<strong>in</strong>gle coherent<br />
m<strong>et</strong>hodology for environmental assessment of specific food and dr<strong>in</strong>k products. Future mandates on the development/adoption<br />
of PCRs are to be further discussed and agreed by Round Table members.<br />
3. Conclusions<br />
The European <strong>Food</strong> Susta<strong>in</strong>able Consumption and Production Round Table works for the harmonisation<br />
of the assessment m<strong>et</strong>hodologies for the agri-food sector. This paper describes the process implemented so<br />
far to develop the ENVIFOOD Protocol. In addition, this paper represents an evidence of the collaboration<br />
established b<strong>et</strong>ween the Round Table and the wider scientific community. We take <strong>in</strong> fact this opportunity to<br />
<strong>in</strong>vite the scientific community, food sector experts and other stakeholders to jo<strong>in</strong> the public consultation<br />
process of the Protocol that is tak<strong>in</strong>g place <strong>in</strong> the last quarter of <strong>2012</strong>.<br />
Inputs from the wider scientific community are also welcome when support<strong>in</strong>g companies <strong>in</strong> the test<strong>in</strong>g<br />
phase due to be launched <strong>in</strong> early 2013. More <strong>in</strong>formation on the public consultation and test<strong>in</strong>g phase of the<br />
Protocol is available on www.food-scp.eu<br />
39
KEYNOTE SESSION 8 th Int. Conference on <strong>LCA</strong> <strong>in</strong> the<br />
Agri-<strong>Food</strong> Sector, 1-4 Oct <strong>2012</strong><br />
At present, Round Table members are discuss<strong>in</strong>g how to obta<strong>in</strong> adequate data for assessment and streaml<strong>in</strong>ed<br />
tools. The establishment of the ENVIFOOD Protocol and PCRs will allow the development of userfriendly<br />
and affordable tools for assessment and communication of environmental impacts, thus reduc<strong>in</strong>g the<br />
burdens of assessments, particularly for SMEs.<br />
Future further <strong>in</strong>teractions with the Round Table will be possible if PCRs and other deliverables are<br />
drafted and made available for consultation.<br />
4. References<br />
Peacock, N., De Camillis, C., Penn<strong>in</strong>gton, D., Aich<strong>in</strong>ger, H., Parenti, A., Rennaud, J.-P., Raggi, A., Brentrup, F., Sára, B., Schenker,<br />
U., Unger, N. and Ziegler, F., 2011. Towards a harmonised framework m<strong>et</strong>hodology for the environmental assessment of food<br />
and dr<strong>in</strong>k products. Int. J. Life Cycle Ass. 16(3):189-97.<br />
<strong>Food</strong> RT, 2010. Guid<strong>in</strong>g Pr<strong>in</strong>ciples. Voluntary environmental assessment and communication of environmental <strong>in</strong>formation along<br />
the food cha<strong>in</strong>, <strong>in</strong>clud<strong>in</strong>g to consumers.The European <strong>Food</strong> Susta<strong>in</strong>able Consumption and Production Round Table, Brussels,<br />
Belgium.<br />
Ernst&Young and Quantis, 2010. Product carbon footpr<strong>in</strong>t<strong>in</strong>g – a study on m<strong>et</strong>hodologies and <strong>in</strong>itiatives. F<strong>in</strong>al report for DG Environment,<br />
European Commission.<br />
De Camillis, C., Unger, N., Schenker, U., Blok, M.C., Blomsma, C., Vessia, O., Blonk, H., 2011a. D<strong>et</strong>ailed analysis of environmental<br />
assessment m<strong>et</strong>hodologies and guidel<strong>in</strong>es. Technical report. Deliverable (No.) 1.6 Part 1: M<strong>et</strong>hodology overview. The<br />
European <strong>Food</strong> Susta<strong>in</strong>able Consumption and Production Round Table, Work<strong>in</strong>g Group 1, Brussels, Belgium.<br />
De Camillis, C., Schenker, U., Unger, N., Blomsma, C., Blonk, H., Bligny, J.-C., 2011b. D<strong>et</strong>ailed analysis of environmental assessment<br />
m<strong>et</strong>hodologies and guidel<strong>in</strong>es. Technical report. Deliverable (No.) 1.6 Part 3: Analysis of m<strong>et</strong>hodological convergences.<br />
The European <strong>Food</strong> Susta<strong>in</strong>able Consumption and Production Round Table, Work<strong>in</strong>g Group 1, Brussels, Belgium.<br />
De Camillis, C., 2011. Data gap analysis. Technical report. Deliverable (No.) 1.5. The European <strong>Food</strong> Susta<strong>in</strong>able Consumption and<br />
Production Round Table, Work<strong>in</strong>g Group 1, Brussels, Belgium.<br />
Schenker, U., Bauer, C., Unger, N., Bligny, J.-C., De Camillis, C., 2011. D<strong>et</strong>ailed analysis of environmental assessment m<strong>et</strong>hodologies<br />
and guidel<strong>in</strong>es. Technical report. Deliverable (No.) 1.6 Part 2: key m<strong>et</strong>hodological issues. The European <strong>Food</strong> Susta<strong>in</strong>able<br />
Consumption and Production Round Table, Work<strong>in</strong>g Group 1, Brussels, Belgium.<br />
De Camillis, C., Bligny, J.-C., Penn<strong>in</strong>gton, D., Bauer, C., Ponsioen, T., Schenker, U., Sueys, R., Unger, N., Lundquist, L., Brandão,<br />
M., Hamill, S., Peacock, N., Pell<strong>et</strong>ier, N., <strong>2012</strong>a. Towards the ENVIFOOD Protocol: deriv<strong>in</strong>g scientifically-sound rules from exist<strong>in</strong>g<br />
m<strong>et</strong>hodological alternatives. Summary report of the second scientific workshop of the European <strong>Food</strong> Susta<strong>in</strong>able Consumption<br />
and Production Round Table Work<strong>in</strong>g Group 1. Publications Office of the European Union, Luxemburg.<br />
De Camillis, C., Bligny, J.-C., Penn<strong>in</strong>gton, D., Pályi, B., <strong>2012</strong>b. Outcomes of the second workshop of the <strong>Food</strong> Susta<strong>in</strong>able Consumption<br />
and Production Round Table Work<strong>in</strong>g Group 1: deriv<strong>in</strong>g scientifically sound rules for a sector-specific environmental<br />
assessment m<strong>et</strong>hodology. Int. J. Life Cycle Ass. 17(4):511-5.<br />
40
PARALLEL SESSION 1A: WATER FOOTPRINT 8 th Int. Conference on <strong>LCA</strong> <strong>in</strong> the<br />
Parallel session 1a: Water Footpr<strong>in</strong>t<br />
Agri-<strong>Food</strong> Sector, 1-4 Oct <strong>2012</strong><br />
Water footpr<strong>in</strong>t of pastoral farm<strong>in</strong>g systems <strong>in</strong> New Zealand<br />
Marlies A. Zonderland-Thomassen 1* , Stewart F. Ledgard 1 , Mark Lieffer<strong>in</strong>g 2<br />
1 AgResearch Ltd, Private Bag 3123, Hamilton 3240, New Zealand<br />
2 AgResearch Ltd, Palmerston North, New Zealand<br />
Correspond<strong>in</strong>g author. E-mail: marlies.zonderland-thomassen@agresearch.co.nz<br />
ABSTRACT<br />
Global livestock production has a major challenge ahead <strong>in</strong> me<strong>et</strong><strong>in</strong>g <strong>in</strong>creased food requirements without <strong>in</strong>creas<strong>in</strong>g the environmental<br />
burden. A need exists to assess the impacts of water consumption associated with New Zealand (NZ) livestock products. A<br />
water footpr<strong>in</strong>t (WF) approach compliant with Life Cycle Assessment (<strong>LCA</strong>) pr<strong>in</strong>ciples was used to assess the stress-weighted WF<br />
us<strong>in</strong>g a water stress <strong>in</strong>dex. The stress-weighted WF was 0.01 and 7.1 L H2O-eq/kg fat-and-prote<strong>in</strong>-corrected milk (FPCM) for dairy<br />
farm<strong>in</strong>g <strong>in</strong> the Waikato and Canterbury regions respectively. The stress-weighted WF of NZ beef was 0.2 L H2O-eq/kg live weight<br />
(LW), whereas for sheep meat it was 0.1 L H2O-eq/kg LW. Water consumption associated with irrigation dom<strong>in</strong>ated the WF of dairy<br />
farm<strong>in</strong>g <strong>in</strong> the Canterbury region, as well as the WF of beef and sheep meat, which highlights the importance of targ<strong>et</strong><strong>in</strong>g water use<br />
efficient practices <strong>in</strong> irrigated regions.<br />
Keywords: water footpr<strong>in</strong>t, water stress <strong>in</strong>dex, eutrophication potential, pastoral farm<strong>in</strong>g<br />
1. Introduction<br />
Global livestock production has a major challenge ahead <strong>in</strong> secur<strong>in</strong>g food production without <strong>in</strong>creas<strong>in</strong>g<br />
the environmental burden. Water consumption and pollution are associated with a range of activities, and at a<br />
global scale, most of the water use occurs <strong>in</strong> agricultural production (Mekonnen and Hoekstra, <strong>2012</strong>). Agriculture<br />
is a water-<strong>in</strong>tensive human activity and water availability can be limited <strong>in</strong> certa<strong>in</strong> areas and seasons.<br />
Globally, a key agricultural system is dairy<strong>in</strong>g and New Zealand (NZ) is the world’s largest dairy export<strong>in</strong>g<br />
country trad<strong>in</strong>g at least 95% of the 16,500 million litres of milk that was processed <strong>in</strong> NZ <strong>in</strong> 2010, equal to<br />
26% of NZ’s total export revenue. Milk production is <strong>in</strong>evitably l<strong>in</strong>ked with water consumption for animal<br />
feed production (Neal <strong>et</strong> al., 2011) and can be a significant contributor to water pollution (Monaghan <strong>et</strong> al.,<br />
2007; Ledgard <strong>et</strong> al., 2009). Sheep and beef farm<strong>in</strong>g is also dom<strong>in</strong>ant <strong>in</strong> NZ agriculture. Red meat and related<br />
products contributed NZ$6.5 billion or 15% of NZ’s total export revenues <strong>in</strong> 2009. It is important that<br />
NZ milk and red meat suppliers are prepared with <strong>in</strong>formation on the water footpr<strong>in</strong>t (WF) of their products.<br />
This will enable them to understand the potential for reduc<strong>in</strong>g their WF and achiev<strong>in</strong>g a comparative advantage<br />
relative to products from other countries.<br />
2. M<strong>et</strong>hods<br />
A literature review showed various WF approaches exist or are under development (e.g., Bayart <strong>et</strong> al.,<br />
2010; Berger and F<strong>in</strong>kbe<strong>in</strong>er, 2010). For the red meat and dairy supply cha<strong>in</strong>s, both water quality and water<br />
quantity are relevant. A WF approach compliant with Life Cycle Assessment (<strong>LCA</strong>) pr<strong>in</strong>ciples was used to<br />
assess the stress-weighted WF follow<strong>in</strong>g Ridoutt <strong>et</strong> al., (2010). The eutrophication potential (EP) of NZ<br />
dairy, beef and sheep farm<strong>in</strong>g systems (Gu<strong>in</strong>ée <strong>et</strong> al., 2002) was also assessed.<br />
New Zealand red meat is derived from sheep and cattle that are raised under a vari<strong>et</strong>y of mixed production<br />
systems across a range of climatic conditions. To deal with variation <strong>in</strong> production systems, survey data<br />
from seven representative sheep and beef farm systems from throughout NZ were used ( B+L NZ statistics<br />
2009/2010). These data were used to calculate a weighted average sheep and beef farm representative of beef<br />
and sheep meat production for NZ. Across the seven farm classes, the average total effective land area<br />
ranged from 245 to 8,872 ha for class 7 (South Island <strong>in</strong>tensive f<strong>in</strong>ish<strong>in</strong>g) to class 1 (South Island high country),<br />
respectively (Table 1). The average rate <strong>in</strong> stock units for beef cattle and sheep per effective hectare<br />
ranged from 1.1 (class 1) to 10.6 (class 7). The predom<strong>in</strong>ant source of feed for sheep and beef animals was<br />
grazed pasture. Low levels of feed supplements made on-farm (rang<strong>in</strong>g b<strong>et</strong>ween 0.4 kg DM/ha <strong>in</strong> farm<br />
class 1 and 292 kg DM/ha <strong>in</strong> farm class 7) were fed to the animals to overcome pasture shortages <strong>in</strong> summer<br />
or w<strong>in</strong>ter and to optimise production.<br />
For dairy farm systems, data from the two contrast<strong>in</strong>g regions of Waikato (North Island, non-irrigated,<br />
moderate ra<strong>in</strong>fall) and Canterbury (South Island, irrigated, lower ra<strong>in</strong>fall) were used (Zonderland-Thomassen<br />
and Ledgard, <strong>2012</strong>). The annual ra<strong>in</strong>fall was 677 mm <strong>in</strong> Canterbury compared to 1264 mm <strong>in</strong> the Waikato<br />
region (Table 1). Most Canterbury farms, therefore, apply irrigation b<strong>et</strong>ween spr<strong>in</strong>g and autumn (on average<br />
565 mm/ha/year).<br />
Table 1. Farm characteristics of the dairy farm, and beef and sheep systems<br />
41
PARALLEL SESSION 1A: WATER FOOTPRINT 8 th Int. Conference on <strong>LCA</strong> <strong>in</strong> the<br />
Agri-<strong>Food</strong> Sector, 1-4 Oct <strong>2012</strong><br />
42<br />
Param<strong>et</strong>ers Unit Dairy Waikato Dairy Canterbury Beef and sheep NZ<br />
Grassland area ha 94.6 200.2 245 - 8,872<br />
Stock<strong>in</strong>g rate SU 1 /ha 2.96 3.11 1.1 – 10.6<br />
Feed supplements kg DM 2 /ha 798 1,892 0.4 - 291.5<br />
Irrigated area % of total ha 0 71 0 – 0.5<br />
Ra<strong>in</strong>fall mm/yr 1264 677 688 - 1500<br />
1 Stock units <strong>in</strong> dairy cows or sheep and beef cattle equivalants e.g., based on 550 kg DM <strong>in</strong>take for a mature sheep<br />
2 Dry Matter<br />
Although annual dry matter <strong>in</strong>take from pasture by animals on farm was similar for the two systems<br />
(11,670 kg DM/ha for the Waikato system and 11,260 kg DM/ha for the Canterbury region), the Canterbury<br />
dairy system used more brought-<strong>in</strong> supplementary feed (1,892 kg DM/ha vs. 798 kg DM/ha) and relied on<br />
cows graz<strong>in</strong>g off-farm over w<strong>in</strong>ter, which resulted <strong>in</strong> a higher annual milk production (13,183 L milk/ha vs.<br />
10,514 L milk/ha).<br />
Water losses associated with evapotranspiration from irrigated pasture, as well as nitrate leach<strong>in</strong>g and<br />
phosphate runoff (from all soluble and soil-adsorbed sources) were computed us<strong>in</strong>g the hydrological sub<br />
model <strong>in</strong> the OVERSEER ® nutrient budg<strong>et</strong> model (Wheeler <strong>et</strong> al., 2003).<br />
We used nitrate and phosphate loss when comput<strong>in</strong>g the water quality <strong>in</strong>dicator “eutrophication potential”<br />
(EP), while exclud<strong>in</strong>g gaseous emissions, as prelim<strong>in</strong>ary results showed that ammonia and nitrous oxide<br />
emissions dom<strong>in</strong>ated the EP which is questionable for NZ conditions. Data are expressed <strong>in</strong> phosphate<br />
equivalents (PO4 3- -eq).<br />
The cradle-to-farm-gate life cycle required for the production of milk, beef, and sheep meat were analysed:<br />
for the production of <strong>in</strong>puts to products leav<strong>in</strong>g the farm-gate, i.e. exclud<strong>in</strong>g transport or process<strong>in</strong>g of<br />
raw milk or animals. Water abstraction and consumption associated with the production of mach<strong>in</strong>ery, build<strong>in</strong>gs,<br />
and medic<strong>in</strong>es were excluded. Economic allocation was applied when divid<strong>in</strong>g the WF b<strong>et</strong>ween milk<br />
and meat. Biophysical allocation based on feed <strong>in</strong>take was used when divid<strong>in</strong>g the WF b<strong>et</strong>ween beef cattle<br />
and sheep, while economic allocation was used when divid<strong>in</strong>g the WF for sheep b<strong>et</strong>ween meat and wool.<br />
In the impact assessment, the water stress <strong>in</strong>dex (WSI) follow<strong>in</strong>g Pfister <strong>et</strong> al., (2009) was applied to g<strong>et</strong> a<br />
stress-weighted WF. Data were normalised aga<strong>in</strong>st the global WSI and expressed <strong>in</strong> H2O-equivalents (Ridoutt<br />
and Pfister, <strong>in</strong> press).<br />
3. Results<br />
The stress-weighted WF of NZ beef (exclud<strong>in</strong>g beef from culled dairy cows) was 0.2 L H2O-eq/kg live<br />
weight (LW) (Table 2). Blue water losses from the grazed system were low and consequently the ma<strong>in</strong><br />
losses were associated with bull calf rear<strong>in</strong>g (57%) and blue water losses associated with evapotranspiration<br />
from irrigated pasture (36%). The stress-weighted WF of NZ sheep meat was 0.1 L H2O-eq/kg LW. Table 2<br />
shows that the stress-weighted WF was 0.01 and 7.1 L H2O-eq/kg fat-and-prote<strong>in</strong>-corrected milk (FPCM) for<br />
the Waikato and Canterbury farm systems respectively. Water consumption associated with irrigation dom<strong>in</strong>ated<br />
the WF of the Canterbury dairy system, whereas water consumption associated with hydro-electricity<br />
supply was a hotspot <strong>in</strong> the WF of the Waikato dairy system.<br />
Table 2. The stress-weighted water footpr<strong>in</strong>t (WF) of beef and sheep meat (based on a NZ weighted average),<br />
and milk produced <strong>in</strong> the Waikato and Canterbury regions respectively.<br />
L H2O-eq/kg unit Unit WF<br />
Beef (NZ weighted average) LW 1 0.2<br />
Sheep meat (NZ weighted average) LW 0.1<br />
Milk <strong>in</strong> Waikato region FPCM 2 0.01<br />
Milk <strong>in</strong> Canterbury region FPCM 7.1<br />
1 Live Weight sold<br />
2 Fat-and-Prote<strong>in</strong> Corrected Milk<br />
The EP of NZ beef (exclud<strong>in</strong>g beef from culled dairy cows) was 12.2 g PO4 3- -eq/kg LW (Table 3). The<br />
EP of NZ sheep meat was 4.9 g PO4 3- -eq/kg LW. Nitrate and phosphate loss at the farm (71% and 75% respectively)<br />
and the eutrophy<strong>in</strong>g pollutants to waterways associated with the production of artificial fertilisers<br />
(20% and 22% respectively) dom<strong>in</strong>ated the EP. Table 3 shows that the EP was 1.94 g PO4 3- -eq/kg FPCM and<br />
1.49 g PO4 3- -eq/kg FPCM for the average Waikato and Canterbury dairy farm systems respectively. Nitrate<br />
and phosphate loss with<strong>in</strong> the dairy farm (94-98%) dom<strong>in</strong>ated the EP of milk <strong>in</strong> these two regions.
PARALLEL SESSION 1A: WATER FOOTPRINT 8 th Int. Conference on <strong>LCA</strong> <strong>in</strong> the<br />
Agri-<strong>Food</strong> Sector, 1-4 Oct <strong>2012</strong><br />
Table 3. The eutrophication potential exclud<strong>in</strong>g gaseous emissions (EP) of beef and sheep meat (based on a<br />
NZ weighted average), and milk produced <strong>in</strong> the Waikato and Canterbury regions respectively.<br />
g PO4 3- -eq/kg unit Unit EP<br />
Beef (NZ weighted average) LW 1 12.2<br />
Sheep meat (NZ weighted average) LW 4.9<br />
Milk <strong>in</strong> Waikato region FPCM 2 1.94<br />
Milk <strong>in</strong> Canterbury region FPCM 1.49<br />
1 Live Weight sold<br />
2 Fat-and-Prote<strong>in</strong> Corrected Milk<br />
4. Discussion<br />
A stress-weighted water footpr<strong>in</strong>t accounts for differences <strong>in</strong> water scarcity b<strong>et</strong>ween the regions. The<br />
stress-weighted WF of Australian beef produced <strong>in</strong> six different geographically def<strong>in</strong>ed production systems<br />
varied b<strong>et</strong>ween 3.3 and 221 litres per kg live-weight (Ridoutt <strong>et</strong> al., <strong>2012</strong>), which was higher than the stressweighted<br />
WF of NZ beef (0.2 L H2O-eq/kg LW). When convert<strong>in</strong>g live-weight <strong>in</strong>to meat, us<strong>in</strong>g the factor<br />
that animals conta<strong>in</strong> approximately 40% of meat, this stress-weighted WF of NZ beef (0.51 L H2O-eq/kg<br />
meat) was lower than the stress-weighted WF of beef produced <strong>in</strong> England (which was <strong>in</strong> the range of 15.1 -<br />
20.0 L H2O-eq/kg meat, dependant on production system) (EBLEX, 2010). The stress-weighted WF of NZ<br />
sheep meat (0.25 L H2O-eq/kg meat) was also lower than the stress-weighted WF of sheep meat produced <strong>in</strong><br />
the UK (which was <strong>in</strong> the range of 8.4 -23.1 L H2O-eq/kg meat, dependant on production system) (EBLEX,<br />
2010). The WSI of NZ regions where livestock was produced varied b<strong>et</strong>ween 0.01 and 0.013, whereas the<br />
spatially averaged WSI for England was 0.27. However, the distribution of the livestock was not uniform,<br />
and the weighted WSI for beef cattle was estimated at 0.19 (T. Hess, personal communication). The low<br />
stress-weighted WF illustrates the benefits of NZ beef and sheep meat produced <strong>in</strong> regions with low water<br />
stress levels from a possible mark<strong>et</strong><strong>in</strong>g perspective.<br />
The EP of the average Waikato and Canterbury dairy farm systems (1.9 g PO4 3- -eq/kg FPCM and 1.5 g<br />
PO4 3- -eq/kg FPCM respectively) were much lower compared to the EP of organic (670 g PO4 3- -eq/kg FPCM)<br />
and conventional milk (1080 g PO4 3- -eq/kg FPCM ) produced <strong>in</strong> the N<strong>et</strong>herlands (Thomassen <strong>et</strong> al., 2008).<br />
This is ma<strong>in</strong>ly due to a difference <strong>in</strong> m<strong>et</strong>hodology, as the Dutch study <strong>in</strong>cluded gaseous emissions.<br />
Choice of allocation had little effect on the water footpr<strong>in</strong>t results. Economic allocation was applied when<br />
divid<strong>in</strong>g the water footpr<strong>in</strong>t b<strong>et</strong>ween milk and meat. If biophysical allocation had been used it would have<br />
decreased the stress-weighted WF by 7% and 11% for dairy farm<strong>in</strong>g <strong>in</strong> the Waikato and Canterbury respectively.<br />
The stress-weighted WF of 0.14 L H2O-eq/kg milk solids for Waikato dairy farm<strong>in</strong>g was nearly one thousand<br />
of the 94 L H2O-eq/kg milk solids for Canterbury dairy farm<strong>in</strong>g. The Waikato dairy WF was 10-fold<br />
lower while the Canterbury dairy WF was 6.5-fold higher than the 14.4 L H2O-eq/ kg total milk solids reported<br />
for non-irrigated South Gippsland, Australia (Ridoutt <strong>et</strong> al., 2010). This highlights the benefits, from a<br />
water consumption perspective, of milk production <strong>in</strong> non-irrigated regions and of targ<strong>et</strong><strong>in</strong>g water use efficiency<br />
practices to dairy farm<strong>in</strong>g <strong>in</strong> irrigated regions.<br />
5. Conclusion<br />
We can conclude that the stress-weighted WF is a useful <strong>in</strong>dicator to assess the impact of pastoral farm<strong>in</strong>g<br />
systems on freshwater availability and EP is a feasible <strong>in</strong>dicator to assess water degradation impacts of pastoral<br />
farm<strong>in</strong>g systems, ma<strong>in</strong>ly result<strong>in</strong>g from leach<strong>in</strong>g or runoff of eutrophy<strong>in</strong>g pollutants to waterways when<br />
the gaseous emissions (such as ammonia, nitrous oxide and nitrogen oxides) are excluded. New Zealand has<br />
large regions with low water stress, although seasonal droughts can occur <strong>in</strong> many areas. From an <strong>in</strong>ternational<br />
mark<strong>et</strong><strong>in</strong>g perspective, beef and sheep meat produced <strong>in</strong> NZ, as well as milk produced <strong>in</strong> the ra<strong>in</strong>-fed<br />
region Waikato have a possible advantage for water consumption compared to overseas pastoral farm<strong>in</strong>g<br />
systems.<br />
The impact of NZ pastoral farm<strong>in</strong>g on freshwater availability can be reduced by practices that decrease<br />
water use, <strong>in</strong>crease feed conversion efficiencies, <strong>in</strong>crease the use of non-irrigated feed supplements, and reduce<br />
irrigation needs. The impact of NZ pastoral farm<strong>in</strong>g on water quality can also be reduced by efficient<br />
nutrient management. Other water quality impacts of pastoral farm<strong>in</strong>g are relevant to consider <strong>in</strong> future studies,<br />
e.g., the impact of microbial pollution on waterways.<br />
References<br />
Bayart, J-P., Bulle, C., Deschênes, L., Margni, M., Pfister, S., V<strong>in</strong>ce, F., Koehler, A., 2010. A framework for<br />
assess<strong>in</strong>g off-stream freshwater use <strong>in</strong> <strong>LCA</strong>. International Journal of <strong>LCA</strong>. 15, 439-453<br />
43
PARALLEL SESSION 1A: WATER FOOTPRINT 8 th Int. Conference on <strong>LCA</strong> <strong>in</strong> the<br />
Agri-<strong>Food</strong> Sector, 1-4 Oct <strong>2012</strong><br />
Berger, M., F<strong>in</strong>kbe<strong>in</strong>er, M., 2010. Water Footpr<strong>in</strong>t<strong>in</strong>g: How to address water use <strong>in</strong> Life Cycle Assessment? Susta<strong>in</strong>ability 2, 919-<br />
944<br />
B+L NZ Statistics 2009/2010. Survey data of farm classes throughout NZ provided by Beef + Lamb NZ to AgResearch <strong>in</strong><br />
2011/<strong>2012</strong>.<br />
EBLEX, 2010. Test<strong>in</strong>g the water. The English beef and sheep production environmental roadmap, phase 2.www.eblex.org.uk<br />
Gu<strong>in</strong>ée, J. B., Gorrée, M., Heijungs, R., Huppes, G., Kleijn, R., de Kon<strong>in</strong>g, A., van Oers, L., Wegener Sleeswijk, A., Suh, S., Udo de<br />
Haes, H. A., de Bruijn, H., van Du<strong>in</strong>, R., Huijbregts, M. A. J., L<strong>in</strong>deijer, E., Roorda, A. A. H., van der Ven, B. L., Weidema, B<br />
.P., 2002. Handbook on Life Cycle Assessment; Operational Guide to the ISO Standards. Centre of Environmental Science –<br />
Leiden University (CML); Kluwer Academic Publishers., Leiden, the N<strong>et</strong>herlands<br />
Ledgard, S.F., Schils, R., Eriksen, J., Luo, J., 2009. Environmental impacts of grazed clover/grass pastures. Irish Journal of Agricultural<br />
Research 48, 209-226<br />
Mekonnen, M.M., Hoekstra, A.Y., <strong>2012</strong>. A global assessment of the water footpr<strong>in</strong>t of farm animal products, Ecosystems, 15(3),<br />
401–415<br />
Monaghan, R.M., Wilcock, R.J., Smith, L.C., Tikkis<strong>et</strong>ty, B., Thorrold, B.S., Costall, D., 2007. L<strong>in</strong>kages b<strong>et</strong>ween land management<br />
activities and water quality <strong>in</strong> an <strong>in</strong>tensively farmed catchment <strong>in</strong> southern New Zealand. Agriculture, Ecosystems and Environment<br />
118, 211-222<br />
Neal, J.S., Fulkerson, W.J., Hacker, R.B., 2011. Differences <strong>in</strong> water use efficiency among annual forages used by the dairy <strong>in</strong>dustry<br />
under optimum and deficit irrigation. Agricultural Water Management 98 (5), 759-774<br />
Pfister, S., Koehler, A., Hellweg, S. 2009. Assess<strong>in</strong>g the environmental impacts of freshwater consumption <strong>in</strong> <strong>LCA</strong>. Environmental<br />
Science & Technology 43, 4098-4104<br />
Ridoutt, B.G., Williams, S.R.O., Baud, S., Fraval, S., Marks, N. 2010. Short communication: the water footpr<strong>in</strong>t of dairy products:<br />
Case study <strong>in</strong>volv<strong>in</strong>g skim milk powder. Journal of Dairy Science 93, 5114-5117<br />
Ridoutt, B.G., Sanguansri, P., Freer, M., Harper, G.S., <strong>2012</strong>. Water footpr<strong>in</strong>t of livestock: comparison of six geographically def<strong>in</strong>ed<br />
beef production systems. International Journal of <strong>LCA</strong> 17, 165-175<br />
Ridoutt, B.G., Pfister, S. In Press. A new water footpr<strong>in</strong>t calculation m<strong>et</strong>hod <strong>in</strong>tegrat<strong>in</strong>g consumptive and degradative water use <strong>in</strong>to<br />
a s<strong>in</strong>gle stand-alone weighted <strong>in</strong>dicator. International Journal of <strong>LCA</strong>.<br />
DOI 10.1007/s11367-012-0458-z<br />
Thomassen, M.A., van Calker, K.J., Smits, M.C.J., Iepema, G.J., de Boer, I.J.M. 2008. <strong>LCA</strong> of conventional and organic milk production<br />
<strong>in</strong> the N<strong>et</strong>herlands. Agricultural Systems 96, 95-107<br />
Wheeler, D.M., Ledgard, S.F., De Kle<strong>in</strong>, C.A.M., Monaghan, R.M., Carey, P.L., McDowell, R.W., Johns, K.L., 2003. OVERSEER®<br />
nutrients budg<strong>et</strong>s- mov<strong>in</strong>g towards on-farm resource account<strong>in</strong>g. Proceed<strong>in</strong>gs New Zealand Grassland Association 65, 191-194<br />
Zonderland-Thomassen, M.A., Ledgard, S.F., <strong>2012</strong>. Water footpr<strong>in</strong>t<strong>in</strong>g – a comparison of m<strong>et</strong>hods us<strong>in</strong>g New Zealand dairy farm<strong>in</strong>g<br />
as a case study. Agricultural Systems 110, 30-40.<br />
44
PARALLEL SESSION 1A: WATER FOOTPRINT 8 th Int. Conference on <strong>LCA</strong> <strong>in</strong> the<br />
Agri-<strong>Food</strong> Sector, 1-4 Oct <strong>2012</strong><br />
Water footpr<strong>in</strong>t account<strong>in</strong>g of organic and non-organic strawberries<br />
<strong>in</strong>clud<strong>in</strong>g ancillary materials: a case study<br />
Manzardo Alessandro * , Anna Mazzi, Monia Niero, Sara Toniolo, Antonio Scipioni<br />
CESQA (Quality and Environmental Research Centre), University of Padova, Department of Industrial Eng<strong>in</strong>eer<strong>in</strong>g, Via Marzolo 9,<br />
35131 Padova, Italy<br />
Correspond<strong>in</strong>g author. E-mail: alessandro.manzardo@unipd.it<br />
ABSTRACT<br />
Fresh water scarcity has become a ma<strong>in</strong> issue debated at <strong>in</strong>ternational level. In order to support a b<strong>et</strong>ter management and use of water,<br />
the m<strong>et</strong>hodology of Water Footpr<strong>in</strong>t has been developed. In this paper the Water Footpr<strong>in</strong>t of a 330g Strawberry Jam produced<br />
with<strong>in</strong> Europe and sold <strong>in</strong> Italy is presented. The objectives of the research were: 1) to compare the Water Footpr<strong>in</strong>t account<strong>in</strong>g of<br />
two different strawberries farm<strong>in</strong>g (organic and non-organic); 2) to d<strong>et</strong>erm<strong>in</strong>e wh<strong>et</strong>her the contribution of the ancillary materials and<br />
processes to the overall product water footpr<strong>in</strong>t was significant. The water footpr<strong>in</strong>t account<strong>in</strong>g of organic farm<strong>in</strong>g resulted to be<br />
bigger than the non-organic one. Moreover ancillary materials and processes resulted responsible for over the 10% of the overall<br />
product water footpr<strong>in</strong>t. Therefore, to support the choices and decisions <strong>in</strong> the field of water resources management, it is important to<br />
consider also ancillary materials and processes.<br />
Keywords: Water Footpr<strong>in</strong>t account<strong>in</strong>g, Organic <strong>Food</strong>, Strawberry<br />
1. Introduction<br />
Climate Changes, world population growth and economic development heavily affected accessibility to<br />
freshwater resources <strong>in</strong> the last decades (UNESCO, 2006; Rockström, 2009). The public <strong>in</strong>terest and concerns<br />
on this issue has constantly grown <strong>in</strong> the recent year so that freshwater scarcity has been debated at<br />
local, national and <strong>in</strong>ternational level (Bates <strong>et</strong> al., 2008; UNEP, 2011): United Nations <strong>in</strong>cluded water availability<br />
and water access <strong>in</strong> the “The Millennium Development Goals” (UN, 2010) the European Union is<br />
work<strong>in</strong>g on a new water policy that will be published with<strong>in</strong> <strong>2012</strong> named “Bluepr<strong>in</strong>t to Safeguard Europe's<br />
Water Resources” (EU, <strong>2012</strong>); moreover a grow<strong>in</strong>g number of companies want to be aware of the environmental<br />
impacts of their choices, <strong>in</strong>clud<strong>in</strong>g water use (Erc<strong>in</strong> <strong>et</strong> al., <strong>2012</strong>; Chapaga<strong>in</strong> and Orr, 2010).<br />
To support the def<strong>in</strong>ition of strategies to b<strong>et</strong>ter manage these resources, the concept and assessment<br />
m<strong>et</strong>hodology of Water Footpr<strong>in</strong>t account<strong>in</strong>g has been <strong>in</strong>troduced as an <strong>in</strong>dicator of freshwater use (Hoekstra,<br />
2003; Hoekstra <strong>et</strong> al., 2011).<br />
Latest developments of this m<strong>et</strong>hodology are focused on water use impact assessment of products and organisations<br />
with<strong>in</strong> the framework of a more comprehensive Life Cycle Assessment (<strong>LCA</strong>) (ISO 2006, ISO<br />
2011).<br />
Many studies on food and agricultural products have been published account<strong>in</strong>g water footpr<strong>in</strong>t <strong>in</strong>dicator<br />
but only a few <strong>in</strong>clude ancillary materials and processes (overheads), such as packag<strong>in</strong>g, transports, energy<br />
<strong>et</strong>c. although these are usually considered <strong>in</strong> <strong>LCA</strong> studies (Ridoutt <strong>et</strong> al., 2009, Mila I canals <strong>et</strong> al., 2010;<br />
Erc<strong>in</strong> <strong>et</strong> al., <strong>2012</strong>; Chapaga<strong>in</strong> and Orr, 2010). These materials and processes have usually non-relevant contribution<br />
to the overall Water Footpr<strong>in</strong>t account<strong>in</strong>g of a product (Erc<strong>in</strong> <strong>et</strong> al., <strong>2012</strong>; Ridoutt <strong>et</strong> al., 2009, Mila<br />
I canals <strong>et</strong> al., 2010; Erc<strong>in</strong> <strong>et</strong> al., <strong>2012</strong>; Chapaga<strong>in</strong> and Orr, 2010).<br />
In this study, conducted <strong>in</strong> 2011, a water footpr<strong>in</strong>t of a jar of 330g organic Strawberry Jam produced<br />
with<strong>in</strong> Europe and sold <strong>in</strong> Italy by a food Italian company is presented. The objectives of the research were:<br />
1) to compare the water footpr<strong>in</strong>t account<strong>in</strong>g of organic and non-organic strawberry farm<strong>in</strong>g;<br />
2) to d<strong>et</strong>erm<strong>in</strong>e if the contribution of the ancillary materials and processes (overheads) to the overall<br />
product water footpr<strong>in</strong>t can be significant.<br />
2. M<strong>et</strong>hods<br />
To achieve the objectives of the research the m<strong>et</strong>hodology presented by the Water Footpr<strong>in</strong>t N<strong>et</strong>work has<br />
been used (Hoekstra <strong>et</strong> al., 2011) adopt<strong>in</strong>g a life cycle approach.<br />
This study is structured <strong>in</strong> the follow<strong>in</strong>g steps: 1) goals and scope of the study; 2) water footpr<strong>in</strong>t account<strong>in</strong>g<br />
of the organic and traditional strawberry farm<strong>in</strong>g; 3) water footpr<strong>in</strong>t of the 330g organic Strawberry Jam.<br />
The blue, green and grey water footpr<strong>in</strong>t of the processes and product under study were assessed. The water<br />
footpr<strong>in</strong>t account<strong>in</strong>g of the organic farm<strong>in</strong>g was used as basic build<strong>in</strong>g block to d<strong>et</strong>erm<strong>in</strong>e the f<strong>in</strong>al product<br />
water footpr<strong>in</strong>t.<br />
A life cycle approach was adopted to d<strong>et</strong>erm<strong>in</strong>e the boundaries of the study <strong>in</strong> order to <strong>in</strong>clude the ancillary<br />
materials and processes. Results at product level have also been characterised us<strong>in</strong>g Water Stress Index<br />
45
PARALLEL SESSION 1A: WATER FOOTPRINT 8 th Int. Conference on <strong>LCA</strong> <strong>in</strong> the<br />
Agri-<strong>Food</strong> Sector, 1-4 Oct <strong>2012</strong><br />
(WSI) (Pfister at al., 2009). Most of the <strong>in</strong>put data were primary data, obta<strong>in</strong>ed from the Italian company<br />
records.<br />
3. Results<br />
3.1. Goals and scope of study<br />
The goals of this water footpr<strong>in</strong>t study were to quantify:<br />
1. the water footpr<strong>in</strong>t account<strong>in</strong>g of two alternative strawberry farm<strong>in</strong>g (non-organic and organic).<br />
The strawberries are produced <strong>in</strong> one site <strong>in</strong> Bulgaria owned by the Italian company that produces<br />
the jam. Primary data of the plant<strong>in</strong>g and harvest<strong>in</strong>g period were collected.<br />
2. the direct and <strong>in</strong>direct water footpr<strong>in</strong>t of a 330g organic strawberry Jam produced by the Italian<br />
company. A cradle to gate perspective was adopted, consider<strong>in</strong>g all the processes and materials<br />
that contribute to the production of the product. Secondary distribution, use and end of life were<br />
excluded.<br />
The water footpr<strong>in</strong>t account<strong>in</strong>g of the alternative farm<strong>in</strong>g is expressed <strong>in</strong> l/kg of strawberries.<br />
The functional unit used to represent the product water footpr<strong>in</strong>t is 330g of organic strawberry jam sold <strong>in</strong><br />
Italy. Data used <strong>in</strong> the study refers to a 15 months period b<strong>et</strong>ween 2009 and 2010: from strawberry plantation<br />
to f<strong>in</strong>al product primary distribution. The Italian company owns and manages the farm<strong>in</strong>g site <strong>in</strong> Bulgaria<br />
and the production and distribution sites <strong>in</strong> Italy. Table 1 reports the ma<strong>in</strong> <strong>in</strong>gredients conta<strong>in</strong>ed <strong>in</strong> 1 kg of<br />
organic strawberry jam.<br />
Table 1. Ma<strong>in</strong> <strong>in</strong>gredients of the product under study<br />
Ingredient Quantity (grams)<br />
Organic Strawberries 600<br />
Organic Apple pulp 380<br />
Pect<strong>in</strong> 20<br />
Figure 1 represents the boundary of the production system of the 330g Organic Strawberry jam under<br />
study. The diagram shows only the major production steps <strong>in</strong>cluded <strong>in</strong> the study.<br />
46<br />
Figure 1. Boundary of the production system under study
PARALLEL SESSION 1A: WATER FOOTPRINT 8 th Int. Conference on <strong>LCA</strong> <strong>in</strong> the<br />
Agri-<strong>Food</strong> Sector, 1-4 Oct <strong>2012</strong><br />
3.2. Water Footpr<strong>in</strong>t account<strong>in</strong>g of organic vs. non-organic strawberry farm<strong>in</strong>g<br />
Non-organic and organic strawberry farm<strong>in</strong>g were analysed <strong>in</strong> this study. The production site is located <strong>in</strong><br />
Bulgaria. Its extension is 47 ha; 34 ha are dedicated to the production of organic strawberries that are used to<br />
produce the organic strawberry jam; 13 ha are dedicated to the production of non-organic strawberries used<br />
for other products. Both of the productions are irrigated (drip irrigation) and open air. The two farm<strong>in</strong>g<br />
m<strong>et</strong>hods differ only on fertilisers and pesticides. Table 2 reports the ma<strong>in</strong> characteristics of the farm<strong>in</strong>g.<br />
Table 2. Ma<strong>in</strong> characteristics of the product under study<br />
Fruit Plant<strong>in</strong>g Harvest<strong>in</strong>g Yield (ton/ha)<br />
Organic strawberries July year 1 June year 2 20<br />
Non-organic strawberries July year 1 June year 2 26<br />
The green and blue water footpr<strong>in</strong>t of the crops are obta<strong>in</strong>ed us<strong>in</strong>g CROPWAT model (Allen <strong>et</strong> al., 1998;<br />
FAO, 2009). Climate data are obta<strong>in</strong>ed from a climate station located <strong>in</strong> the field. Crop param<strong>et</strong>ers were obta<strong>in</strong>ed<br />
from Allen <strong>et</strong> al., (Allen <strong>et</strong> al., 1998). Yield data were obta<strong>in</strong>ed from site records. All data were used<br />
<strong>in</strong> CROPWAT to obta<strong>in</strong> the crop water use of organic and non-organic strawberries. Accord<strong>in</strong>g to the model<br />
presented by Mila I canals and Ridoutt (Mila I canals <strong>et</strong> al., 2009; Ridoutt <strong>et</strong> al., 2009), primary data of irrigation<br />
water volume were used.<br />
The grey water footpr<strong>in</strong>t of non-organic farm<strong>in</strong>g took <strong>in</strong>to consideration the impact of the use of chemical<br />
(such as fertilisers and pesticides). In the case of organic farm<strong>in</strong>g accord<strong>in</strong>g to EU regulation (EC, 2007)<br />
only natural fertiliser are used (compost). Data on the quantity and quality of fertilisers were given directly<br />
by the Italian company. The leach<strong>in</strong>g rate is taken from literature and assumed to be 10% with a N limit of<br />
10 mg/l (Erc<strong>in</strong> <strong>et</strong> al., <strong>2012</strong>). In the case of organic farm<strong>in</strong>g, nitrogen from compost contributed to grey water<br />
footpr<strong>in</strong>t, phosphorus resulted negligible. Table 3 reports the blue, green and grey water footpr<strong>in</strong>t of the two<br />
farm<strong>in</strong>g.<br />
Table 3. Water Footpr<strong>in</strong>t account<strong>in</strong>g of organic and non-organic farm<strong>in</strong>g<br />
Non-organic farm<strong>in</strong>g Organic farm<strong>in</strong>g<br />
Green water (l/kg) 90.7 117.9<br />
Blue water (l/kg) 98.1 127.5<br />
Grey water (l/kg) 40 2.5<br />
Total (l/kg) 228.8 247.9<br />
3.3. Water Footpr<strong>in</strong>t of the 330g organic Strawberry Jam<br />
The product water footpr<strong>in</strong>t account<strong>in</strong>g of a 330g organic strawberry jam was then quantified by summ<strong>in</strong>g<br />
the water used for all the raw materials, ancillary materials and processes <strong>in</strong>cluded <strong>in</strong> the study. The<br />
blue, green and grey water of these processes were also quantified: wash<strong>in</strong>g, sort<strong>in</strong>g and freez<strong>in</strong>g of the<br />
strawberries <strong>in</strong> Bulgaria; transportation of the strawberries to Site 1 <strong>in</strong> Italy were the jam production processes<br />
take place; farm<strong>in</strong>g of organic apples and pulp<strong>in</strong>g processes; production of pect<strong>in</strong>; transportation of<br />
apple and pect<strong>in</strong> to Site 1; production of primary and secondary packag<strong>in</strong>g and their transport to Site 1 and<br />
Site 2; fill<strong>in</strong>g and packag<strong>in</strong>g processes; transportation of end-product to the Site 2 for distribution. The water<br />
footpr<strong>in</strong>t account<strong>in</strong>g of energy mix used <strong>in</strong> the processes is also quantified us<strong>in</strong>g the m<strong>et</strong>hod developed by<br />
Mila I Canals (Mila I Canals <strong>et</strong> al., 2009). The water footpr<strong>in</strong>t account<strong>in</strong>g relevant to the processes of production<br />
site waste management, secondary distribution, product use and end of life are not <strong>in</strong>cluded.<br />
All data on the materials and processes considered <strong>in</strong> the study are obta<strong>in</strong>ed directly from the food company<br />
and its suppliers. All the factories have waste-treatment plants that discharge water with effluent characteristics<br />
below the legal limits. Therefore it is assumed that grey water footpr<strong>in</strong>t is equal to zero. The green<br />
water of wood and paper based products used as primary (labell<strong>in</strong>g) and secondary packag<strong>in</strong>g material was<br />
assessed.<br />
Water account<strong>in</strong>g <strong>in</strong>dicator result were characterised us<strong>in</strong>g WSI. Therefore the Product Water Footpr<strong>in</strong>t<br />
resulted to be 88.4 l. Table 4 shows the water footpr<strong>in</strong>t of the 330g organic Strawberry jam<br />
47
PARALLEL SESSION 1A: WATER FOOTPRINT 8 th Int. Conference on <strong>LCA</strong> <strong>in</strong> the<br />
Agri-<strong>Food</strong> Sector, 1-4 Oct <strong>2012</strong><br />
Table 4. Water Footpr<strong>in</strong>t of the 330g organic Strawberry jam<br />
Water Footpr<strong>in</strong>t account<strong>in</strong>g (l/functional unit) Water Footpr<strong>in</strong>t (l/functional unit)<br />
Primary Packag<strong>in</strong>g 7.0 1.1<br />
Transport and Secondary packag<strong>in</strong>g 20.8 6.3<br />
Production 9.0 3.0<br />
Farm<strong>in</strong>g 200.5 78.0<br />
Total 237.3 88.4<br />
4. Discussion<br />
The water footpr<strong>in</strong>t account<strong>in</strong>g was conducted to d<strong>et</strong>erm<strong>in</strong>e the quantity of water used to grow organic<br />
and non-organic strawberries <strong>in</strong> a site <strong>in</strong> Bulgaria. In this study the organic farm<strong>in</strong>g m<strong>et</strong>hod resulted to be<br />
more water <strong>in</strong>tensive then the non-organic one. This result strongly depends on the different yield of the two<br />
farm<strong>in</strong>g m<strong>et</strong>hod <strong>in</strong> this specific production site (Table 2). Other studies confirm the importance of this value<br />
when d<strong>et</strong>erm<strong>in</strong><strong>in</strong>g the environmental performances of agricultural products (Erc<strong>in</strong> <strong>et</strong> al., <strong>2012</strong>; Bleng<strong>in</strong>i and<br />
Busto, 2009). The values of the blue and green water footpr<strong>in</strong>t of the two farm<strong>in</strong>g m<strong>et</strong>hods resulted to be<br />
very similar. These results depend on the quantity of water used for irrigation and the effective precipitation.<br />
Grey water of non-organic farm<strong>in</strong>g is higher because chemicals fertilisers and pesticides (+93.75%) are used.<br />
This value do not consider environmental impacts but it is d<strong>et</strong>erm<strong>in</strong>ed through a water dilution approach<br />
(Jeswani and Azapagic, 2011)<br />
The product water footpr<strong>in</strong>t of a 330g strawberry jam was then quantified. Fig.2 represents the contribution<br />
of macro-processes to the overall Water Footpr<strong>in</strong>t. The farm<strong>in</strong>g processes resulted to be responsible for<br />
the majority of the product water footpr<strong>in</strong>t (84.49%) then follows transport and secondary packag<strong>in</strong>g, production<br />
and primary packag<strong>in</strong>g. The value of the transport and secondary packag<strong>in</strong>g depends on the use of<br />
cardboard and wood to pack the f<strong>in</strong>al product. Figure 3 represent the contribution of different processes after<br />
characterisation us<strong>in</strong>g WSI (Pfister <strong>et</strong> al., 2009). Changes <strong>in</strong> contribution depend on the% of blue water of<br />
the different materials/processes considered. Even <strong>in</strong> this case farm<strong>in</strong>g is still responsible for the majority of<br />
the water used. Other processes account for over the 11% of the product overall water footpr<strong>in</strong>t.<br />
48<br />
Figure 2. Contribution of processes to the product Water Footpr<strong>in</strong>t account<strong>in</strong>g<br />
Figure 3. Contribution of processes to the product Water Footpr<strong>in</strong>t after characterisation with WSI
PARALLEL SESSION 1A: WATER FOOTPRINT 8 th Int. Conference on <strong>LCA</strong> <strong>in</strong> the<br />
Agri-<strong>Food</strong> Sector, 1-4 Oct <strong>2012</strong><br />
5. Conclusion<br />
Fresh water scarcity is a central issue debated at <strong>in</strong>ternational levels. It affects a grow<strong>in</strong>g number of people<br />
and companies worldwide. To support the def<strong>in</strong>ition of strategies to b<strong>et</strong>ter manage water resources the<br />
concept and the m<strong>et</strong>hodology of Water Footpr<strong>in</strong>t has been <strong>in</strong>troduced.<br />
<strong>Food</strong> and agriculture are recognized to be water <strong>in</strong>tensive sectors. Therefore many studies have been published<br />
to d<strong>et</strong>erm<strong>in</strong>e the water footpr<strong>in</strong>t of many food products. Most of these studies adopt life cycle perspective<br />
<strong>in</strong> the def<strong>in</strong>ition of processes to be considered <strong>in</strong> the water footpr<strong>in</strong>t quantification, but consider ancillary<br />
materials and processes (such as energy use or transportation) to be non-significant.<br />
In this study, conducted <strong>in</strong> 2011, a water footpr<strong>in</strong>t of a 330g organic strawberry jam is conducted. The<br />
m<strong>et</strong>hod used is the one presented by the Water Footpr<strong>in</strong>t N<strong>et</strong>work. The objectives of the study were:<br />
to compare the water footpr<strong>in</strong>t account<strong>in</strong>g of organic and non-organic strawberry farm<strong>in</strong>g <strong>in</strong> cultivated<br />
a site <strong>in</strong> Bulgaria;<br />
to assess the product water footpr<strong>in</strong>t of the 330g strawberry jam and to d<strong>et</strong>erm<strong>in</strong>e the contribution<br />
of ancillary materials and processes (overheads). Primary data were collected from the Italian<br />
<strong>Food</strong> company and its suppliers.<br />
Characterisation was performed us<strong>in</strong>g WSI.<br />
In this case study, results showed that organic strawberry farm<strong>in</strong>g has higher water use than non-organic<br />
strawberry farm<strong>in</strong>g. The ma<strong>in</strong> reason is the different yield of the two farm<strong>in</strong>g m<strong>et</strong>hod.<br />
The water footpr<strong>in</strong>t of the 330g organic strawberry jam resulted to be 88.4 l. Other studies confirm that<br />
farm<strong>in</strong>g is the process with higher water footpr<strong>in</strong>t. Overheads water footpr<strong>in</strong>t contribution resulted to be over<br />
10%. The Italian <strong>Food</strong> company should work ma<strong>in</strong>ly on paper based packag<strong>in</strong>g to reduce the water footpr<strong>in</strong>t<br />
of overheads. These results suggest that even ancillary materials and processes should be considered when<br />
look<strong>in</strong>g at strategies to reduce a product water footpr<strong>in</strong>t.<br />
6. References<br />
Allen R.G., Pereira L.S., Raes D., Smith M., 1998. Crop Evapotranspiration – Guidel<strong>in</strong>es for Comput<strong>in</strong>g Crop Water Requirements<br />
FAO Irrigation and Dra<strong>in</strong>age Paper 56. <strong>Food</strong> and Agriculture Organization, Rome.<br />
Bates, B.C., Kundzewicz Z.W., Wu S., Palutikof J.P., , 2008. Climate Change and Water. Technical Paper of the Intergovernmental<br />
Panel on Climate Change. IPCC Secr<strong>et</strong>ariat, Geneva.<br />
Bleng<strong>in</strong>i G.A., Busto M., 2009. The life cycle of rice: <strong>LCA</strong> of alternative agri-food cha<strong>in</strong> management systems <strong>in</strong> Vercelli (Italy).<br />
Journ. Env. Man. 90, 1512-1522.<br />
Chapaga<strong>in</strong> A.K., Orr S., 2010. Water Footpr<strong>in</strong>t of Nestlè’s Bitesize Shredded Wheat. A pilot study to account and analyse the water<br />
footpr<strong>in</strong>ts of Bitesize Shredded Wheat <strong>in</strong> the context of water availability along its supply cha<strong>in</strong>.<br />
EC (European Council), 2007. Council Regulation (EC) No 834/2007 of 28 June 2007 on organic production and labell<strong>in</strong>g of organic<br />
products and repeal<strong>in</strong>g Regulation (EEC) No 2092/91.<br />
Erc<strong>in</strong> A., Aldaya M.M., Hoekstra A.Y., 2011. Corporate Water Footpr<strong>in</strong>t Account<strong>in</strong>g and Impact Assessment: The Case of the Water<br />
Footpr<strong>in</strong>t of a Sugar-Conta<strong>in</strong><strong>in</strong>g Carbonated Beverage. Wat. Res. Man. 25 (2), 721-741.<br />
Erc<strong>in</strong> A., Aldaya M.M., Hoekstra A.Y., <strong>2012</strong>. The water footpr<strong>in</strong>t of soy milk and soy burger and equivalent animal products. Ecol.<br />
Ind. 18, 392-402.<br />
FAO, 2009. CROPWAT 8.0 Model. <strong>Food</strong> and Agriculture Organization, Rome.<br />
Hoekstra A.Y., 2003. Virtual water trade. Proceed<strong>in</strong>gs of the International Expert Me<strong>et</strong><strong>in</strong>g on Virtual Water Trade. Value of Water<br />
Research Report Series No. 12. UNESCO-IHE, Delft, the N<strong>et</strong>herlands.<br />
Rockström, R., Steffen, W., Noone, K., Persson, A., Chap<strong>in</strong>, F.S., Lamb<strong>in</strong>, E.F., Lenton, T.M., Scheffer, M., Folke, C., Schellnhuber,<br />
H.J., Nykvist, B., de Wit, C.A., Hughes, T., van der Leeuw, S., Rodhe, H., Sörl<strong>in</strong>, S., Snyder, P.K., Costanza, R., Sved<strong>in</strong>, U.,<br />
Falkenmark, M., Karlberg, L., Corell, R.W., Fabry, V.J., Hansen, J., Walker, B., Liverman, D., Richardson, K., Crutzen, P.,<br />
Foley, J.A., 2009. A safe operat<strong>in</strong>g space for humanity. Nature 461, 472–475.<br />
Hoekstra A. Y., Chapaga<strong>in</strong> A.K., Aldaya M.M , Hoekstra M.M.M., 2011. The water footpr<strong>in</strong>t assessment manual: S<strong>et</strong>t<strong>in</strong>g the global<br />
standard. Earthscan.<br />
ISO (International Organization for Standardization), 2006. ISO 14040: Environmental management - Life cycle assessment - Pr<strong>in</strong>ciples<br />
and framework. Switzerland, Geneva.<br />
ISO (International Organization for Standardization), 2011. ISO/WD2 14046: Water Footpr<strong>in</strong>t requirements and guidel<strong>in</strong>es. Switzerland,<br />
Geneva.<br />
Jesvani H.K., Azapagic A., 2011. Water footpr<strong>in</strong>t: m<strong>et</strong>hodologies and a case study for assess<strong>in</strong>g the impacts of water use. J. of Clean.<br />
Prod. 17 (13), 1228-1235.<br />
Ridoutt B.G., Eady S.J., Sellahewa J., Simons L., Bektash R., 2009. Water footpr<strong>in</strong>t<strong>in</strong>g at the product brand level: case study and<br />
future challenges. J. of Clean. Prod. 19, 1288-1299.<br />
Milà I Canals L., Chenow<strong>et</strong>h J., Chapaga<strong>in</strong> A., Orr S., Antón A., Clift R., 2009. Assess<strong>in</strong>g freshwater use impacts <strong>in</strong> <strong>LCA</strong>: Part I—<br />
<strong>in</strong>ventory modell<strong>in</strong>g and characterisation factors for the ma<strong>in</strong> impact pathways. Int J Life Cycle Ass. 14 (1), 28-42.<br />
Milà I Canals L., Chenow<strong>et</strong>h J., Chapaga<strong>in</strong> A., Orr S., Antón A., Clift R., 2010. Assess<strong>in</strong>g freshwater use impacts <strong>in</strong> <strong>LCA</strong>, part 2:<br />
case study of broccoli production <strong>in</strong> the UK and Spa<strong>in</strong>. Int J Life Cycle Ass. 15 (6), 598-607.<br />
Pfister S., Koehler A., Hellweg S., 2009. Assess<strong>in</strong>g the environmental impacts of freshwater consumption <strong>in</strong> <strong>LCA</strong>. Environ. Sci.<br />
Tech. 43 (11), 4098-4104.<br />
UN (United Nations), 2010. The Millennium Development Goals Report. New York.<br />
49
PARALLEL SESSION 1A: WATER FOOTPRINT 8 th Int. Conference on <strong>LCA</strong> <strong>in</strong> the<br />
Agri-<strong>Food</strong> Sector, 1-4 Oct <strong>2012</strong><br />
UNEP (United Nations Environment Programme), 2011. Towards a Green Economy: Pathways to Susta<strong>in</strong>able Development and<br />
Poverty Eradication.<br />
UNESCO-WWAP (United Nations Educational Scientific and Cultural Organization-World Water Assessment Programme), 2006.<br />
Water: A Shared Responsibility: The United Nations World Water Development Report 2<br />
EU (European Union), <strong>2012</strong>. Bluepr<strong>in</strong>t to Safeguard Europe's Water Resources.<br />
50
PARALLEL SESSION 1A: WATER FOOTPRINT 8 th Int. Conference on <strong>LCA</strong> <strong>in</strong> the<br />
Agri-<strong>Food</strong> Sector, 1-4 Oct <strong>2012</strong><br />
Water footpr<strong>in</strong>t of cradle to farm gate milk production <strong>in</strong> the U.S.<br />
L<strong>in</strong>dsay Lessard 1,* , Samuel Vionn<strong>et</strong> 1 , Jon D<strong>et</strong>tl<strong>in</strong>g 1 , Sebastien Humbert 1 , Andrew Henderson 2 , Olivier<br />
Jolli<strong>et</strong> 2 , Y<strong>in</strong>g Wang 3<br />
1 Quantis, Parc scientifique de l’EPFL, Bât. D, 1015 Lausanne Switzerland<br />
2 Dept. of Environmental Health Sciences, School of Public Health, University of Michigan, 109 South Observatory, Ann Arbor MI<br />
48109-2029, USA<br />
3 Innovation Center for U.S. Dairy, 10255 W. Higg<strong>in</strong>s Road, Ste 900, Rosemont, IL 60018, USA<br />
Correspond<strong>in</strong>g author: E-mail: l<strong>in</strong>dsay.lessard@quantis-<strong>in</strong>tl.com<br />
ABSTRACT<br />
Dairy and agriculture are water <strong>in</strong>tensive activities and water use impacts can vary widely depend<strong>in</strong>g on region, crop irrigation and<br />
type of crop. As good quality freshwater is a scarce resource, the objective of this project is to assess the water footpr<strong>in</strong>t associated<br />
with U.S. dairy production <strong>in</strong> order to identify potential ways to reduce water related issues associated with U.S. dairy production.<br />
Consider<strong>in</strong>g the <strong>in</strong>creas<strong>in</strong>g comp<strong>et</strong>ition for water resources from other sectors, there is a demand for agriculture and dairy <strong>in</strong>dustries<br />
to improve efficiency of water use, especially irrigation which can account for up to 90% of water withdrawal from available resources.<br />
Keywords: water footpr<strong>in</strong>t, water use <strong>in</strong> <strong>LCA</strong>, milk, dairy, regionalisation<br />
1. Introduction<br />
The scarcity of freshwater is becom<strong>in</strong>g problematic <strong>in</strong> certa<strong>in</strong> regions of the world (Pacific Institute,<br />
<strong>2012</strong>) and this issue is l<strong>in</strong>ked to significant problems related to human health, social/political stability and<br />
ecosystems (Ceres, CEO water Mandate (UN Global Compact, <strong>2012</strong>)). Dairy and agriculture are water <strong>in</strong>tensive<br />
activities and water use impacts can vary widely depend<strong>in</strong>g on region, climate, crop irrigation and type<br />
of crop. Irrigation can account for up to 90% (Save Water, <strong>2012</strong>) of water withdrawal from available<br />
sources. Of these irrigation withdrawals, approximately 15% to 35% worldwide are estimated to be unsusta<strong>in</strong>able<br />
(WBCSD, <strong>2012</strong>; Siebert <strong>et</strong> al., 2010a; Wada <strong>et</strong> al., 2010). As comp<strong>et</strong>ition for water resources cont<strong>in</strong>ues<br />
to <strong>in</strong>crease, there is a demand for agriculture and dairy <strong>in</strong>dustries to improve efficiency of water use<br />
(FAO, <strong>2012</strong>) and especially irrigation.<br />
The objective of this project was to evaluate the water related issues associated with U.S. dairy production.<br />
This <strong>in</strong>formation is an important stepp<strong>in</strong>g stone to identify potential ways to address and reduce water<br />
use and waste <strong>in</strong> the dairy production sector. This work was commissioned by the Innovation Center for U.S.<br />
Dairy and compl<strong>et</strong>ed by a consortium of <strong>in</strong>stitutions with expertise <strong>in</strong> dairy and water topics (Quantis, University<br />
of Michigan, CIRAIG, University of Arkansas).<br />
So far most studies assume that all animal feed is produced locally. In practice, feed production and dairy<br />
farm<strong>in</strong>g take place <strong>in</strong> different areas. Therefore, there is a need for these two processes to be related <strong>in</strong> a consistent<br />
way <strong>in</strong> order to b<strong>et</strong>ter understand water use and impacts. The ma<strong>in</strong> research challenges for the water<br />
footpr<strong>in</strong>t can be summarized by the follow<strong>in</strong>g questions:<br />
- What are the key steps that dom<strong>in</strong>ate the milk life cycle impact on water?<br />
- How do water impacts of feed irrigation vary spatially?<br />
- How can we relate spatial feed impacts to water impacts of milk production <strong>in</strong> different areas?<br />
- What is the magnitude of impact per kg milk at state and national levels?<br />
To address these needs, this study aims at d<strong>et</strong>erm<strong>in</strong><strong>in</strong>g the U.S. water footpr<strong>in</strong>t of milk with the follow<strong>in</strong>g<br />
specific objectives:<br />
(1) Identify the key factors <strong>in</strong>fluenc<strong>in</strong>g the water impacts of cradle to farm gate milk production.<br />
(2) Investigate <strong>in</strong> d<strong>et</strong>ail the regional impacts associated with feed crop irrigation and their variation nationwide.<br />
(3) Relate feed and milk production locations and d<strong>et</strong>erm<strong>in</strong>e state and national impacts of milk production.<br />
2. M<strong>et</strong>hods<br />
2.1. Description of m<strong>et</strong>hodology and framework<br />
Build<strong>in</strong>g upon work <strong>in</strong> progress with<strong>in</strong> the UNEP-SETAC Life Cycle Initiative on water footpr<strong>in</strong>t<strong>in</strong>g 2 , a<br />
framework has been developed which <strong>in</strong>tegrates a comprehensive state-of-the-science compilation of m<strong>et</strong>h-<br />
2 Water footpr<strong>in</strong>t refers to the impact assessment of water use and not the water footpr<strong>in</strong>t def<strong>in</strong>ition of the Water Footpr<strong>in</strong>t N<strong>et</strong>work.<br />
51
PARALLEL SESSION 1A: WATER FOOTPRINT 8 th Int. Conference on <strong>LCA</strong> <strong>in</strong> the<br />
Agri-<strong>Food</strong> Sector, 1-4 Oct <strong>2012</strong><br />
ods, address<strong>in</strong>g major issues related to water use <strong>in</strong> Life Cycle Assessment (<strong>LCA</strong>). An up-to-date and exhaustive<br />
scheme can be sent upon request, <strong>in</strong>clud<strong>in</strong>g all <strong>in</strong>ventories flows, characterisation factor m<strong>et</strong>hods,<br />
<strong>et</strong>c.<br />
Water is withdrawn, either <strong>in</strong> the form of surface water or renewable groundwater, and used for various<br />
purposes such as crop irrigation. In this study, this is represented as water “<strong>in</strong>put”. On the other hand, “outputs”<br />
may be represented as surface and/or renewable groundwater that are released unaffected or as water<br />
consumed (or dissipated) by evaporation or <strong>in</strong>corporation <strong>in</strong>to the product or another watershed. Depend<strong>in</strong>g<br />
on the type of water, different impact m<strong>et</strong>hods are applied <strong>in</strong> order to evaluate the stress on human health,<br />
ecosystem quality, and resources for future generations (see Figure 1). In addition, a simplified water stress<br />
assessment is performed by weight<strong>in</strong>g the water <strong>in</strong>ventory by a water stress <strong>in</strong>dex, represented <strong>in</strong> m3 equivalent,<br />
which is used for assess<strong>in</strong>g the comp<strong>et</strong>ition for water.<br />
Figure 1. General framework for water use impact assessment for feed production and on farm water use<br />
(grey water is not <strong>in</strong>cluded <strong>in</strong> the water use part of the study).<br />
The simplified water stress assessment applies Pfister’s water stress <strong>in</strong>dex (Pfister <strong>et</strong> al., 2009) which is<br />
used to assess the comp<strong>et</strong>ition for water as a function of withdrawal to availability. The Water Stress Index<br />
(WSI) <strong>in</strong>dicates the portion of water consumed by different users (i.e. <strong>in</strong>dustry, agriculture and households)<br />
that deprives others of freshwater. In this study, the level of resolution used is at state level. Therefore, water<br />
consumed is multiplied by a water stress <strong>in</strong>dex and the result is expressed as litres of water “<strong>in</strong> comp<strong>et</strong>ition”<br />
or “deprived”, as shown <strong>in</strong> the Equation 1:<br />
52<br />
Water <strong>in</strong> comp<strong>et</strong>ition= 0 . 05WSI<br />
LCI WSI<br />
Eq. 1<br />
LCI withdrawal blue,<br />
consumed<br />
The WSI varies widely across the United States and is related to precipitation, as well as water use and<br />
availability. State level data were provided by Pfister (Pfister <strong>et</strong> al., 2009) and were calculated by weight<strong>in</strong>g<br />
the values at the watershed level by the area and water withdrawal of each state.<br />
2.2. Description of the life cycle data<br />
For a water use impact assessment of milk production <strong>in</strong> the U.S. it is important to take <strong>in</strong>to account the location<br />
of the feed production as water use impact can vary significantly across the country. The crop type, the<br />
irrigation requirements and the type of water used (e.g. groundwater withdrawal vs. surface water withdrawal)<br />
are all important factors to consider when evaluat<strong>in</strong>g water impacts. In order to model the crops, the<br />
average rations <strong>in</strong> terms of amount of crops consumed per cow are used. Crops are all assumed to be obta<strong>in</strong>ed<br />
from with<strong>in</strong> the United States and are separated <strong>in</strong>to four different types:<br />
Commodity crops (e.g. corn gra<strong>in</strong> and soybean): assumed to come from anywhere <strong>in</strong> the country,<br />
custom model<strong>in</strong>g based on literature data (Fru<strong>in</strong> <strong>et</strong> al., 1989; Larson <strong>et</strong> al., 1990)
PARALLEL SESSION 1A: WATER FOOTPRINT 8 th Int. Conference on <strong>LCA</strong> <strong>in</strong> the<br />
Agri-<strong>Food</strong> Sector, 1-4 Oct <strong>2012</strong><br />
Domestic crops - light forage (e.g. alfalfa/grass hay): assumed to come from with<strong>in</strong> the region (of the<br />
five def<strong>in</strong>ed regions) that the farm is located.<br />
Domestic crops - heavy forage (e.g. corn/alfalfa/grass silage): assumed to come from with<strong>in</strong> the state<br />
that the farm is located.<br />
Local crops (e.g. pasture): grown on farm<br />
Commodity crops such as corn gra<strong>in</strong> are assumed to be produced nationwide at a rate equivalent to the<br />
production with respect to total U.S. production. This provides a “supply mix” that is considered equivalent<br />
for all dairy cow rations. National statistics available from the USDA are used for 2007 and 2008 (USDA<br />
NASS 2010a).<br />
The irrigation data for all crops modeled <strong>in</strong> this study were obta<strong>in</strong>ed from the United States Department<br />
of Agriculture (USDA), National Agricultural Statistics Survey website. However, this data does not <strong>in</strong>clude<br />
<strong>in</strong>formation on the fraction of irrigation water that is evaporated, or recuperated from dra<strong>in</strong>age/run-off. The<br />
2008 Farm and Ranch Irrigation Survey (USDA NASS 2010b) was used <strong>in</strong> order to d<strong>et</strong>erm<strong>in</strong>e the irrigation<br />
rate for each crop at the state level. Data for areas harvested and areas irrigated were used from the 2007<br />
USDA Census of Agriculture to calculate average irrigation rates per crop per state. This represents the water<br />
withdrawal per crop. If data regard<strong>in</strong>g average irrigation rate was not available but irrigation was used, the<br />
average irrigation rate of the region was used as a proxy for the state <strong>in</strong> question. Green water (or precipitation)<br />
<strong>in</strong>ventory was not assessed <strong>in</strong> this study.<br />
For the water used outside of feed and dairy farms, the water footpr<strong>in</strong>t is evaluated based on a nonspatialised<br />
assessment. The model was built upon the Extended <strong>LCA</strong> SimaPro model developed by Thoma<br />
(Thoma <strong>et</strong> al., 2010). Non-spatialised contributions <strong>in</strong>clude lesser feed components, ancillary and upstream<br />
processes, as well as post-farm-gate life cycle contributions (milk process<strong>in</strong>g, distribution, r<strong>et</strong>ail, and consumption).<br />
3. Results<br />
3.1. Spatialised national impact assessment for feed: cradle to feed producer gate<br />
There is a strong correlation b<strong>et</strong>ween irrigation requirements and Pfister’s water stress <strong>in</strong>dex as states that<br />
do not receive a high amount of precipitation are more likely to have higher irrigation needs. However, the<br />
water stress <strong>in</strong>dex for the State of Oregon may not accurately represent the actual average water stress of the<br />
state. In the west, the state receives a lot of ra<strong>in</strong>fall but <strong>in</strong> the east of the state, it is quite dry, with high irrigation<br />
requirements. This reflects the limitation of apply<strong>in</strong>g a state level regionalisation for the water stress<br />
<strong>in</strong>dices.<br />
Moreover, the water stress assessment per kg of crop <strong>in</strong> each state needs to be weighted by the production<br />
<strong>in</strong> order to understand the contribution to the national impact.<br />
Water Stress Impact<br />
L_eq deprived / kg<br />
state corn gra<strong>in</strong><br />
Contribution<br />
to national<br />
corn gra<strong>in</strong><br />
impact<br />
Weight by US corn gra<strong>in</strong><br />
production:<br />
ma<strong>in</strong>ly <strong>in</strong> the corn<br />
belt!<br />
Figure 2. Water stress assessment of corn gra<strong>in</strong> production <strong>in</strong> the U.S., comb<strong>in</strong>ed to give national corn gra<strong>in</strong><br />
impact.<br />
The states that have a high water stress are primarily <strong>in</strong> the west of the country while the majority of the<br />
corn production is <strong>in</strong> the north east of the country (the Corn Belt). As a result, only states with both high corn<br />
gra<strong>in</strong> production and high water stress <strong>in</strong>dex are considered to be problematic, <strong>in</strong> terms of corn gra<strong>in</strong>. Such<br />
53
PARALLEL SESSION 1A: WATER FOOTPRINT 8 th Int. Conference on <strong>LCA</strong> <strong>in</strong> the<br />
Agri-<strong>Food</strong> Sector, 1-4 Oct <strong>2012</strong><br />
states are located more towards the centre of the country, such as Nebraska, Kansas and Colorado, highlighted<br />
<strong>in</strong> the bottom map of Figure 2. Texas and California are also shown to have a high contribution to the<br />
national impact of corn gra<strong>in</strong> water impact. The national average of corn gra<strong>in</strong> irrigation water requirements<br />
is 53 litres of water consumed per kg corn. Tak<strong>in</strong>g <strong>in</strong>to account Pfister’s water stress <strong>in</strong>dex the value is 37<br />
Litres equivalent <strong>in</strong> comp<strong>et</strong>ition per kg corn gra<strong>in</strong>.<br />
3.2. Spatialised national impact assessment for milk: cradle to farm gate<br />
To obta<strong>in</strong> the contribution to the impact of milk at the national level, the impact per kg milk <strong>in</strong> each state<br />
needs to be weighted by the milk production.<br />
Figure 3. Water stress assessment of corn gra<strong>in</strong> and milk production <strong>in</strong> the U.S., comb<strong>in</strong>ed to give contribution<br />
to impact of milk at the national level<br />
The national average of the water footpr<strong>in</strong>t due to crop production is 152 litres of water per kg milk. The<br />
simplified water stress assessment is 109 Litres equivalent <strong>in</strong> comp<strong>et</strong>ition per kg milk.<br />
It is necessary to mention that the overall rest of the life cycle is very small, close to 0.5 Litres equivalent<br />
deprived per kg milk <strong>in</strong> a non spatialised result po<strong>in</strong>t of view. The major contributors are the lesser feeds that<br />
did not g<strong>et</strong> spatialised (e.g., wheat) and electricity production throughout the life cycle.<br />
4. Conclusion<br />
The present analysis has shown that feed dom<strong>in</strong>ates the water stress assessment for milk production to<br />
farm gate and irrigation requirements varies widely across the U.S. In the spatialised assessment po<strong>in</strong>t of<br />
view, regionalisation is therefore an important factor when evaluat<strong>in</strong>g water stress assessment. The national<br />
water stress assessment of feed due to milk production is dom<strong>in</strong>ated by a few states with a comb<strong>in</strong>ation of<br />
high water stress (high irrigation requirements) and high crop production. By look<strong>in</strong>g at it closely, the ma<strong>in</strong><br />
crops to focus on are alfalfa hay and silage, grass hay and silage as they are produced locally <strong>in</strong> water<br />
stressed states.<br />
The results of the current water impact assessment of milk production <strong>in</strong> the U.S. reveal certa<strong>in</strong> possible<br />
solutions to reduce the water footpr<strong>in</strong>t of this activity. Indeed, new locations for dairy farm have to be close<br />
to feed production <strong>in</strong> regions with high water availability. Moreover, the improvements of irrigation techniques<br />
efficiency and reuse and recycl<strong>in</strong>g water techniques can contribute to reduce the water footpr<strong>in</strong>t of<br />
dairy production.<br />
F<strong>in</strong>ally, future work and improvements to the current modell<strong>in</strong>g of the system <strong>in</strong>clude the follow<strong>in</strong>g:<br />
- Include evaporation and run off as currently 100% of irrigation water is assumed to be evaporated (thus<br />
water consumed).<br />
54<br />
Water Stress<br />
Impact per kg<br />
state milk<br />
L_eq / kg state<br />
milk<br />
Contribution to<br />
national milk<br />
impact<br />
Milk production<br />
kg milk/state
PARALLEL SESSION 1A: WATER FOOTPRINT 8 th Int. Conference on <strong>LCA</strong> <strong>in</strong> the<br />
Agri-<strong>Food</strong> Sector, 1-4 Oct <strong>2012</strong><br />
- Ref<strong>in</strong>e the resolution at the <strong>in</strong>ventory level (i.e. irrigation data per county or per watershed <strong>in</strong>stead of per<br />
state).<br />
- Ref<strong>in</strong>e the resolution of the water stress <strong>in</strong>dices (i.e. for a higher resolution water stress assessment).<br />
- Include a higher resolution of characterisation factors (some are global averages).<br />
- Include more characterisation factors which cover more cause-effect cha<strong>in</strong>s.<br />
5. References<br />
FAO, http://www.fao.org/ag/magaz<strong>in</strong>e/0511sp2.htm. Consulted April 11, <strong>2012</strong><br />
Pacific Institute, http://www.pac<strong>in</strong>st.org/topics/water_and_susta<strong>in</strong>ability/<strong>in</strong>dex.php, consulted April 19th, <strong>2012</strong><br />
Pfister, Stephan, Ann<strong>et</strong>te Koehler, and Stefanie Hellweg. 2009. “Assess<strong>in</strong>g the Environmental Impacts of Freshwater Consumption <strong>in</strong><br />
<strong>LCA</strong>.” Environmental Science & Technology 43 (11) (June): 4098-4104. doi:10.1021/es802423e.<br />
Save Water, http://www.savewater.com.au/<strong>in</strong>dex.php?sectionid=99&l<strong>in</strong>kid=99, Consulted April 11, <strong>2012</strong>.<br />
Siebert, S., Döll, P., 2010. Quantify<strong>in</strong>g blue and green virtual water contents <strong>in</strong> global crop production as well as potential production<br />
losses without irrigation, Journal of Hydrology 384 (3-4): 198–217.<br />
Thoma G., Popp J., Nutter D., Shonnard D., Ulrich R., Matlock M., Kim D., Neiderman Z., Kemper N., East C., Adom F., 2010.<br />
Regional Analysis of Greenhouse Gas Emissions from Milk Production Practices <strong>in</strong> the United States.<br />
http://www.usdairy.com/Susta<strong>in</strong>ability/Science/GreenhouseGas/Pages/FluidMilk.aspx, 6p.<br />
UN Global Compact, http://www.unglobalcompact.org/issues/Environment/CEO_Water_Mandate/, accessed on April, <strong>2012</strong><br />
USDA NASS. 2010a. Farm and Ranch Irrigation Survey: Volume 3 • Special Studies • Part 1. 2007 Census of Agriculture. Wash<strong>in</strong>gton,<br />
DC, USA: United States Department of Agriculture.<br />
USDA NASS. 2010b. USDA/NASS - Data and Statistics - QuickStats 2.0. http://quickstats.nass.usda.gov/.<br />
van Zelm, Rosalie, Aafke M. Schipper, Michiel Rombouts, Judith Snepvangers, and Mark A. J. Huijbregts. 2011. “Implement<strong>in</strong>g<br />
Groundwater Extraction <strong>in</strong> Life Cycle Impact Assessment: Characterization Factors Based on Plant Species Richness for the<br />
N<strong>et</strong>herlands.” Environmental Science & Technology 45 (2) (January 15): 629-635. doi:10.1021/es102383v.<br />
Verones, <strong>France</strong>sca, Marlia Mohd Hanafiah, Stephan Pfister, Mark A. J. Huijbregts, Gregory J. Pell<strong>et</strong>ier, and Ann<strong>et</strong>te Koehler. 2010.<br />
“Characterization Factors for Thermal Pollution <strong>in</strong> Freshwater Aquatic Environments.” Environmental Science & Technology 44<br />
(24) (December 15): 9364-9369.<br />
Wada, Y., van Beek, L.P.H., van Kempen, C.M., Reckman, J.W.T.M., Vasak, S., Bierkens, M.F.P., 2010. Global depl<strong>et</strong>ion of<br />
groundwater resources, Geophysical Research L<strong>et</strong>ters 37 (L20402). doi:10.1029/2010GL044571.<br />
WBCSD, http://www.wbcsd.org/DocRoot/lD1tMGiLZ7NL9mBOL2aQ/WaterFactsAndTrends-Update.pdf . World Bus<strong>in</strong>ess Council<br />
for Susta<strong>in</strong>able Development: Water Facts and Trends Update. Consulted July 11, 2011.<br />
55
PARALLEL SESSION 1A: WATER FOOTPRINT 8 th Int. Conference on <strong>LCA</strong> <strong>in</strong> the<br />
Agri-<strong>Food</strong> Sector, 1-4 Oct <strong>2012</strong><br />
56<br />
Monthly characterisation factors for water consumption and<br />
application to temporally explicit cereals <strong>in</strong>ventory<br />
Stephan Pfister * , Julia Baumann<br />
Ecological Systems Design, Institute of Environmental Eng<strong>in</strong>eer<strong>in</strong>g (IfU), ETH Zurich, 8093 Zürich, Switzerland<br />
Correspond<strong>in</strong>g author. E-mail: pfister@ifu.baug.<strong>et</strong>hz.ch<br />
ABSTRACT<br />
We calculated monthly water stress <strong>in</strong>dices for >11000 watersheds with global coverage. In comparison with annual assessments<br />
these <strong>in</strong>dices show large differences <strong>in</strong> many loctions although the general spatial distribution of water scarcity rema<strong>in</strong>s quite stable.<br />
Analys<strong>in</strong>g wheat and rice with monthly and annual <strong>in</strong>dicators shows that the crop grow<strong>in</strong>g period has a considerable <strong>in</strong>fluence and<br />
shift<strong>in</strong>g crop plant<strong>in</strong>g dates (or crops with different calendars) can help to relieve water stress. The ma<strong>in</strong> limitation of the improved<br />
temporal resolution is the lack of d<strong>et</strong>ail <strong>in</strong> quantify<strong>in</strong>g <strong>in</strong>ter-monthly natural and man-made storage effects. The produced maps and<br />
data allow b<strong>et</strong>ter captur<strong>in</strong>g of water scarcity with temporal resolution, but many issues are raised and further research is required.<br />
Keywords: temporal resolution, rice, wheat, water footpr<strong>in</strong>t, regionalisation<br />
1. Introduction<br />
Water scarcity is affect<strong>in</strong>g a large part of the population and will <strong>in</strong>crease <strong>in</strong> future due to population<br />
growth, requir<strong>in</strong>g a shift <strong>in</strong> spatial distribution of water consumption (Ridoutt and Pfister 2010a). Therefore<br />
water footpr<strong>in</strong>t and impact assessment of water <strong>in</strong> <strong>LCA</strong> has ga<strong>in</strong>ed wide <strong>in</strong>terest and is heavily discussed<br />
(Berger and F<strong>in</strong>kbe<strong>in</strong>er 2010), and different m<strong>et</strong>hods to quantify the impacts have been created and compared<br />
(Koun<strong>in</strong>a <strong>et</strong> al., <strong>2012</strong>). Relevance of spatial resolution for assess<strong>in</strong>g water consumption and related<br />
impacts of plant has been highlighted <strong>in</strong> previous research (e.g. Pfister <strong>et</strong> al., 2011a). However, the temporal<br />
dimension of crop cultivation and related impacts has been neglected so far, although different crop options<br />
can shift irrigation water consumption with<strong>in</strong> a year and hence lead to higher or lower water stress <strong>in</strong> the<br />
region. Furthermore, <strong>in</strong> some regions the temporal dimension is crucial, especially <strong>in</strong> cases with high variability<br />
of water use and availability. Consequently, annual assessment might be mislead<strong>in</strong>g <strong>in</strong> guid<strong>in</strong>g crop<br />
choices with<strong>in</strong> and among different regions. Temporal resolution is therefore essential for proper <strong>LCA</strong> of<br />
crop production.<br />
The def<strong>in</strong>ition of a water footpr<strong>in</strong>t (WFP) has led to confusion as some consider and report pure aggregation<br />
of water consumption volumes to be proper WFP (e.g. Hoekstra <strong>et</strong> al., <strong>2012</strong>), while we consider a water<br />
footpr<strong>in</strong>t accord<strong>in</strong>g to carbon footpr<strong>in</strong>t and <strong>LCA</strong> <strong>in</strong>clud<strong>in</strong>g impact assessment as the only useful aggregated<br />
number <strong>in</strong>form<strong>in</strong>g about water scarcity issues related to products and services (Pfister and Hellweg 2009,<br />
Ridoutt and Pfister 2010b). This is especially relevant for processes <strong>in</strong> the supply cha<strong>in</strong>, which are often major<br />
contributors to the overall WFP, as shown by Feng <strong>et</strong> al., (2011). A recent report highlighted the similarity<br />
of the approaches and revealed the shortcom<strong>in</strong>gs of the purely volum<strong>et</strong>ric approach (UNEP <strong>2012</strong>).<br />
Several <strong>in</strong>dicators for water scarcity have been developed recently and we focus our development based<br />
on the approach of Pfister <strong>et</strong> al., (2009). For a selection of 405 watersheds Hoekstra <strong>et</strong> al., (<strong>2012</strong>) calculated<br />
monthly water stress <strong>in</strong>dicators follow<strong>in</strong>g a different approach from the one we used.<br />
In this work we developed water stress <strong>in</strong>dex (WSI) on a monthly basis for more than 11000 watersheds with<br />
global coverage. In a second step, WFP are calculated by multiply<strong>in</strong>g monthly WSI (WSImonthly) with<br />
monthly crop water consumption.<br />
2. M<strong>et</strong>hods<br />
The orig<strong>in</strong>al, annual WSI based on the approach of Pfister <strong>et</strong> al., (2009) <strong>in</strong>cludes a term for monthly variability<br />
of water availability <strong>in</strong> order to account for <strong>in</strong>creased pressure <strong>in</strong> watersheds with unstable water supply<br />
over time. This factor has been excluded as it is explicitly covered by apply<strong>in</strong>g monthly WSI. Only the<br />
<strong>in</strong>ter-annual variability is accounted for by the geom<strong>et</strong>ric standard deviation (s*year) of annual precipitation<br />
data dur<strong>in</strong>g the “climate normal period” (1961-1990) with<strong>in</strong> each river bas<strong>in</strong>. Consequently the WSI function<br />
on monthly resolution of each watershed is adjusted to the reduced variability factor s* by <strong>in</strong>creas<strong>in</strong>g the<br />
exponent factor of -6.4 to -9.8:<br />
WSI<br />
1<br />
<br />
1e1 monthly *<br />
9.8 WTA<br />
monthly<br />
1 <br />
0.01<br />
Eq. 1<br />
* *<br />
WTA WTAs Eq. 2<br />
monthly monthly year
PARALLEL SESSION 1A: WATER FOOTPRINT 8 th Int. Conference on <strong>LCA</strong> <strong>in</strong> the<br />
Agri-<strong>Food</strong> Sector, 1-4 Oct <strong>2012</strong><br />
WTAmonthly is the monthly withdrawal to availability ratio. It is d<strong>et</strong>erm<strong>in</strong>ed by aggregat<strong>in</strong>g data from the<br />
0.5 arc-degree model by Fek<strong>et</strong>e <strong>et</strong> al., (2002) to watershed level and deriv<strong>in</strong>g factors of monthly WTA to<br />
annual WTA for each month. In a second step, these monthly factors are applied to the annual data from<br />
“WaterGAP” Alcamo <strong>et</strong> al., (2003) which are used <strong>in</strong> the orig<strong>in</strong>al WSI (Pfister <strong>et</strong> al., 2009) to derive values<br />
for WTAmonthly that are consistent with the annual factors.<br />
The irrigation water consumption of the crops (IWR) is calculated accord<strong>in</strong>g to Pfister <strong>et</strong> al., (2011a) and<br />
related to kg harvested crop through location-specific atta<strong>in</strong>able yields (Fischer <strong>et</strong> al., 2000) <strong>in</strong> order to derive<br />
monthly WFP (WFPmonthly) and compare to the annual assessment (WFPannual).<br />
3. Results<br />
Fig. 1 shows a comparison of monthly and annual WSI, <strong>in</strong>dicat<strong>in</strong>g large differences for some watersheds,<br />
while the general trend of spatial distribution is not changed dramatically (Figure 2). Still the variation is<br />
relevant especially due to the fact that most water is used <strong>in</strong> periods where water stress is rather high. This is<br />
also a logical consequence of the equation.<br />
For the WFP analysis this has some additional implication, as not only the place of water use but also the<br />
tim<strong>in</strong>g is crucial for the assessment. This is shown by the case of wheat (Figure 3): In some areas wheat is<br />
planted as “w<strong>in</strong>ter wheat” and therefore has a grow<strong>in</strong>g phase that is prior to most other crops and consequently<br />
the average water consumption is rather <strong>in</strong> months with less water scarcity. Although the difference<br />
of annual and monthly water WFP is not chang<strong>in</strong>g the pattern of the global maps, it can be seen that <strong>in</strong><br />
Southern Spa<strong>in</strong> the W<strong>in</strong>ter season is limit<strong>in</strong>g the WFPmonthly compared to WFPannual. These effects are b<strong>et</strong>ter<br />
shown <strong>in</strong> Figure 4, where maps of the ratio WFPmonthly and WFPannual shows that for rice and wheat the ratio<br />
can be quite different due to different grow<strong>in</strong>g seasons, po<strong>in</strong>t<strong>in</strong>g out the relevance of temporal resolution.<br />
The scatter plots (Figure 5) <strong>in</strong>dicate the strong correlation but show relatively high variability <strong>in</strong> regions with<br />
average water footpr<strong>in</strong>ts, especially for wheat.<br />
These results and relevant data (<strong>in</strong>cl. Google Earth layers) are made available on a webpage (ESD <strong>2012</strong>).<br />
Figure 1. The graphs show an analysis of annual WSI (WSI_Ann) versus water-use weighted annual average<br />
of WSImonthly (WSI_m_Avg). The scatter plot shows all values for all watersheds and reveals that<br />
WSI_m_Avg is higher for many low WSI_Ann. The rema<strong>in</strong><strong>in</strong>g graphs show the monthly WSI and the annual<br />
values for selected rivers for illustration of the variabilities <strong>in</strong> many watersheds.<br />
WSI<br />
WSI<br />
57
PARALLEL SESSION 1A: WATER FOOTPRINT 8 th Int. Conference on <strong>LCA</strong> <strong>in</strong> the<br />
Agri-<strong>Food</strong> Sector, 1-4 Oct <strong>2012</strong><br />
Figure 2. These maps show the monthly WSI for each watershed. In many areas there is no or only m<strong>in</strong>or<br />
water stress while some areas consistently experience high water stress. However, some regions such as large<br />
parts of Europe have highly variable WSI for different months.<br />
58
PARALLEL SESSION 1A: WATER FOOTPRINT 8 th Int. Conference on <strong>LCA</strong> <strong>in</strong> the<br />
Agri-<strong>Food</strong> Sector, 1-4 Oct <strong>2012</strong><br />
Figure 3. These maps show the water footpr<strong>in</strong>t (WFP) of wheat based on monthly (top) and annual (bottom)<br />
Assessment. In many areas there is no or only m<strong>in</strong>or differences as the general trend is the same. However<br />
some watersheds have significantly different impacts (Fig. 4).<br />
Figure 4. These maps show the ratio monthly to annual water footpr<strong>in</strong>t calculation of wheat top and rice (bottom).<br />
In many watersheds the impacts vary significantly. Note that although there is a similar pattern, rice<br />
and wheat differ regionally due to different grow<strong>in</strong>g seasons.<br />
59
PARALLEL SESSION 1A: WATER FOOTPRINT 8 th Int. Conference on <strong>LCA</strong> <strong>in</strong> the<br />
Agri-<strong>Food</strong> Sector, 1-4 Oct <strong>2012</strong><br />
Figure 5. The scatter plots represent <strong>in</strong>dividual WFP values for wheat and rice production based on annual<br />
(WFPannual) and monthly assessments (WFPmonthly) for each watershed. The l<strong>in</strong>ear regression <strong>in</strong>dicates that<br />
monthly WFP are generally lower than WFPannual for wheat, and quite consistent for rice. The high variability<br />
for the case of wheat (up to 2 orders of magnitude) reveals the importance of temporal explicit WFP.<br />
4. Discussion<br />
The results presented here are provid<strong>in</strong>g additional <strong>in</strong>sights <strong>in</strong> water scarcity assessment and WFP but are<br />
hav<strong>in</strong>g deficits. Uncerta<strong>in</strong>ties have shown to be extremely high <strong>in</strong> some areas (orders of magnitudes confidence<br />
<strong>in</strong>tervals) even on annual WSI (Pfister and Hellweg 2011) and are assumed to be much higher for<br />
monthly factors. Additionally the <strong>in</strong>ter-monthly storage needs to be accounted for and groundwater sources<br />
have to be dist<strong>in</strong>guished from surface water <strong>in</strong> order to capture the relevant hydrological features. Reservoirs<br />
are also not addressed here. They could significantly change the situation of monthly availabilities, but are<br />
caus<strong>in</strong>g losses which can be significant as shown for dams for hydropower (Pfister <strong>et</strong> al., 2011c). All these<br />
features are also lack<strong>in</strong>g <strong>in</strong> the monthly <strong>in</strong>dicators for 405 watersheds by Hoekstra <strong>et</strong> al., (<strong>2012</strong>). However,<br />
those factors are based on water consumption <strong>in</strong>stead of water use and therefore might capture the quantitative<br />
issue b<strong>et</strong>ter. On the other hand also degradative water use contributes to water scarcity and therefore a<br />
mixture of water use and water consumption might be the best basis for a s<strong>in</strong>gle water stress <strong>in</strong>dicator.<br />
The monthly WFP allows assess<strong>in</strong>g more accurately the water consumption impacts and related management<br />
options such as evaluat<strong>in</strong>g different crop rotations as discussed <strong>in</strong> Nunez <strong>et</strong> al., (<strong>2012</strong>). The higher d<strong>et</strong>ail<br />
can also b<strong>et</strong>ter analyse future crop schemes and reveal potentials for feed<strong>in</strong>g the mank<strong>in</strong>d <strong>in</strong> 2050. While<br />
shift<strong>in</strong>g crop locations might considerably reduce water stress (Pfister <strong>et</strong> al., 2011b), shift<strong>in</strong>g crop plant<strong>in</strong>g<br />
dates could mitigate peak water stress periods. This is an important potential as relocation of production sites<br />
might be problematic due to supply cha<strong>in</strong> management of exist<strong>in</strong>g process<strong>in</strong>g facilities as shown <strong>in</strong> Chiu <strong>et</strong><br />
al., (2011) and reluctance of people to move their agricultural activities to compl<strong>et</strong>ely different places. However,<br />
shift<strong>in</strong>g cultivation periods might also reduce yield or <strong>in</strong>crease irrigation water demand and consequently<br />
lead to higher water footpr<strong>in</strong>ts. One limitation of the presented <strong>in</strong>ventory is the exclusion of unproductive<br />
irrigation-water losses, which can lead to significant additional water consumption (Faist <strong>et</strong> al., 2011)<br />
and should be considered <strong>in</strong> future work.<br />
Integration of water quality aspects potentially <strong>in</strong>cluded <strong>in</strong> WFP should also consider watershed characteristics<br />
and temporal variation for impact assessment of emissions <strong>in</strong> <strong>LCA</strong> such as shown for heat emissions<br />
(Verones <strong>et</strong> al., 2011). This is a crucial step for consistently address<strong>in</strong>g the temporal dimension <strong>in</strong> <strong>LCA</strong> and<br />
aggregate monthly water footpr<strong>in</strong>t figures as suggested by Ridoutt and Pfister (<strong>2012</strong>). F<strong>in</strong>ally the same temporal<br />
issues also concern land occupation as discussed and addressed <strong>in</strong> Pfister <strong>et</strong> al., (2010), s<strong>in</strong>ce occupy<strong>in</strong>g<br />
land <strong>in</strong> w<strong>in</strong>ter is different than <strong>in</strong> summer. Beyond this consideration of natural growth seasons, other<br />
param<strong>et</strong>ers for temporally-explicit land quality assessment are needed, especially for evaluat<strong>in</strong>g food products.<br />
5. Conclusion<br />
Analys<strong>in</strong>g wheat and rice with monthly and annual <strong>in</strong>dicators shows that the crop grow<strong>in</strong>g period has a<br />
considerable <strong>in</strong>fluence and shift<strong>in</strong>g crop plant<strong>in</strong>g dates or crops with different calendars can help to relieve<br />
water stress. The ma<strong>in</strong> limitation of the improved temporal resolution is the lack of d<strong>et</strong>ail <strong>in</strong> quantify<strong>in</strong>g <strong>in</strong>-<br />
60
PARALLEL SESSION 1A: WATER FOOTPRINT 8 th Int. Conference on <strong>LCA</strong> <strong>in</strong> the<br />
Agri-<strong>Food</strong> Sector, 1-4 Oct <strong>2012</strong><br />
ter-monthly natural and man-made storage effects. The produced maps and data allow<strong>in</strong>g for b<strong>et</strong>ter captur<strong>in</strong>g<br />
water scarcity with temporal resolution, although further improvement is required.<br />
6. References<br />
Alcamo, J., Doll, P., Henrichs, T., Kaspar, F., Lehner, B., Rosch, T., Siebert, S., 2003. Development and test<strong>in</strong>g of the WaterGAP 2<br />
global model of water use and availability, Hydrolog. Sci. J., 48 (3), 317-337.<br />
Berger M, F<strong>in</strong>kbe<strong>in</strong>er M (2010) Water footpr<strong>in</strong>t<strong>in</strong>g: How to assess water use <strong>in</strong> life cycle assessment? Susta<strong>in</strong>ability 2:919-944<br />
Chiu, Y-W; Suh, S; Pfister, S; Hellweg, S; Köhler, A (2011) Measur<strong>in</strong>g ecological impact of water consumption by bio<strong>et</strong>hanol us<strong>in</strong>g<br />
life cycle impact assessment. Int J <strong>LCA</strong>, DOI 10.1007/s11367-011-0328-0<br />
ESD (<strong>2012</strong>). Water <strong>in</strong>ventory data. http://www.ifu.<strong>et</strong>hz.ch/ESD/downloads/WATER_DATA<br />
Faist Emmenegger, M.; Pfister, S.; Koehler, A.; de Giovan<strong>et</strong>ti, L.; Arena, A.; Zah, R. (2011) Tak<strong>in</strong>g <strong>in</strong>to account water use impacts<br />
<strong>in</strong> the <strong>LCA</strong> of biofuels: an Argent<strong>in</strong>ean case study. The International Journal of Life Cycle Assessment, 16(9), 869-877<br />
Fek<strong>et</strong>e, B.M., Vorosmarty, C.J., Grabs W., 2002. High-resolution fields of global runoff comb<strong>in</strong><strong>in</strong>g observed river discharge and<br />
simulated water balances, Global Biogeochem. Cycles, 16 (3): 15-1 to 15-10.<br />
Feng, K; Chapaga<strong>in</strong>, A; Suh, S; Pfister, S; Hubacek, K; (2011) Comparison of bottom-up and top-down approaches to calculat<strong>in</strong>g the<br />
water footpr<strong>in</strong>ts of nations. Economic Systems Research, 23(4), DOI 10.1080/09535314.2011.638276<br />
Fischer, G., van Velthuizen, H., Nachtergaele, F., Medow, S., 2000. Global agro-ecological zones. FAO and IIASA,<br />
http://www.iiasa.ac.at/Research/LUC/GAEZ/<strong>in</strong>dex.htm, Accessed August 3, 2009.<br />
Hoekstra, A.Y., Mekonnen, M.M., Chapaga<strong>in</strong>, A.K., Mathews, R.E. and Richter, B.D. (<strong>2012</strong>) Global monthly water scarcity: Blue<br />
water footpr<strong>in</strong>ts versus blue water availability, PLoS ONE 7(2): e32688.<br />
Koun<strong>in</strong>a A, Margni M, Bayart JB, Boulay AM, Berger M, Bulle C, Frischknecht R, Koehler A, Mila-i-Canals L, Motoshita M,<br />
Núñez M, P<strong>et</strong>ers G, Pfister S, Ridoutt BG, van Zelm R, Verones F, Humbert S (<strong>2012</strong>) Review of m<strong>et</strong>hods address<strong>in</strong>g freshwater<br />
availability <strong>in</strong> life cycle <strong>in</strong>ventory and impact assessment. Int J Life Cycle Ass (<strong>in</strong> review)<br />
Nunez, M; Pfister, S; Anton, A; Munoz, P; Hellweg, S; Koehler, A; Rieradevall, J. (<strong>2012</strong>) Assess<strong>in</strong>g the environmental impacts of<br />
water consumption by energy crops grown <strong>in</strong> Spa<strong>in</strong>. J Ind Ecol (available onl<strong>in</strong>e)<br />
Pfister, S., Koehler, A., Hellweg, S., 2009. Assess<strong>in</strong>g the environmental impacts of freshwater consumption <strong>in</strong> <strong>LCA</strong>. Environ. Sci.<br />
Technol., 43(11), 4098–4104<br />
Pfister S and Hellweg S (2009) The water "shoesize" vs. footpr<strong>in</strong>t of bioenergy. PNAS 106:E93-E94<br />
Pfister S, S Hellweg. 2011. Surface water use – human health impacts. Report of the LC-IMPACT project (EC: FP7). Available at.<br />
http://www.ifu.<strong>et</strong>hz.ch/ESD/downloads/Uncerta<strong>in</strong>ty_water_LCIA.pdf<br />
Pfister, S.; Curran, M.; Koehler, A.; Hellweg, S. (2010) Trade-offs b<strong>et</strong>ween land and water use: regionalized impacts of energy crops.<br />
Published <strong>in</strong> Proceed<strong>in</strong>gs of the 7th International Conference on <strong>LCA</strong> <strong>in</strong> the Agri-<strong>Food</strong> Sector. 2010, Università degli studi di<br />
Bari, Aldo Moro, Itlay. ISBN 978-88-88793-29-0<br />
Pfister, S., Bayer, P., Koehler, A., Hellweg, S., 2011a. Environmental impacts of water use <strong>in</strong> global crop production: hotspots and<br />
trade-offs with land use. Environ. Sci. Technol., 45(13), 5761–5768<br />
Pfister, S.; Bayer, P.; Koehler, A.; Hellweg, S. 2011b. Projected water consumption and land use <strong>in</strong> future global agriculture: scenarios<br />
and related impacts. Science of the Total Environment, 2011, doi:10.1016/¬j.scitotenv.2011.07.019<br />
Pfister S, Saner D, Koehler A (2011c) The environmental relevance of water consumption <strong>in</strong> global power production. Int J Life<br />
Cycle Ass 16: 580-591<br />
Ridoutt BG, Pfister S (2010a) Reduc<strong>in</strong>g humanity’s water footpr<strong>in</strong>t. Environ Sci Technol 44:6019-6021<br />
Ridoutt BG, Pfister S (2010b). A revised approach to water footpr<strong>in</strong>t<strong>in</strong>g to make transparent the impacts of consumption and production<br />
on global freshwater scarcity. Glob Environ Chang 20:113-120<br />
Ridoutt BG, Pfister S (<strong>2012</strong>). A new water footpr<strong>in</strong>t calculation m<strong>et</strong>hod <strong>in</strong>tegrat<strong>in</strong>g consumptive and degradative water use <strong>in</strong>to a<br />
s<strong>in</strong>gle stand-alone <strong>in</strong>dicator, Int J <strong>LCA</strong>, (accepted for publication).<br />
UNEP (<strong>2012</strong>) Measur<strong>in</strong>g water use <strong>in</strong> a green economy. McGlade, J., Werner, B., Young, M., Matlock, M., Jefferies, D., Sonnemann,<br />
G., Aldaya, M., Pfister, S., Berger, M., Farell, C., Hyde, K., Wackernagel, M., Hoekstra, A., Mathews, R., Liu, J., Erc<strong>in</strong>,<br />
E., Weber, J.L., Alfieri, A., Mart<strong>in</strong>ez-Lagunes, R., Edens, B., Schulte, P., von Wirén-Lehr, S., Gee, D. ISBN: 978-92-807-3220-7<br />
Verones, F.; Hanafiah, MM.; Pfister, S.; Huijbregts, MAJ; Pell<strong>et</strong>ier; GJ; Koehler, A. Characterisation factors for thermal pollution <strong>in</strong><br />
freshwater aquatic environments. Environ. Sci. Technol, 2010, 44(24), 9364-9369<br />
61
PARALLEL SESSION 1B: TOWARDS LIFE CYCLE SUSTAINABILITY ASSESSMENT 8 th Int. Conference on <strong>LCA</strong> <strong>in</strong> the<br />
Parallel session 1b: Towards Life Cycle Susta <strong>in</strong>ability Assessment<br />
62<br />
Agri-<strong>Food</strong> Sector, 1-4 Oct <strong>2012</strong><br />
Holistic susta<strong>in</strong>ability assessment of w<strong>in</strong>ter oilseed rape production<br />
us<strong>in</strong>g the AgBalance TM m<strong>et</strong>hod – an example of ‘susta<strong>in</strong>able<br />
<strong>in</strong>tensification’?<br />
Markus Frank 1 *, Jan Schöneboom 2 , Martijn Gipmans 3 , P<strong>et</strong>er Sal<strong>in</strong>g 2<br />
1 BASF SE,APD/S, Speyrer Strasse 2, 67117 Limburgerhof, Germany<br />
2 BASF SE, Susta<strong>in</strong>ability Center, ZZS/SE – Z7, 67056 Ludwigshafen, Germany<br />
3 BASF Plant Science Company GmbH, c/o m<strong>et</strong>anomics GmbH, Tegeler Weg 33, 10589, Berl<strong>in</strong>, Germany<br />
Correspond<strong>in</strong>g author. E-mail: markus.frank@basf.com<br />
ABSTRACT<br />
AgBalance TM is a holistic m<strong>et</strong>hod to quantify the susta<strong>in</strong>ability performance of agricultural production systems. It comb<strong>in</strong>es <strong>LCA</strong><br />
with environmental, economic and social impact <strong>in</strong>dicators, generalized to vary<strong>in</strong>g spatial scales. AgBalance comprises up to 70<br />
susta<strong>in</strong>ability <strong>in</strong>dicators, based on a significantly larger number of <strong>in</strong>put data and param<strong>et</strong>ers. The <strong>in</strong>dicators are grouped <strong>in</strong>to the<br />
three dimensions environmental, social and economic susta<strong>in</strong>ability impacts. Both d<strong>et</strong>ailed <strong>in</strong>-depth results of <strong>in</strong>dividual impact<br />
<strong>in</strong>dicators, as well as aggregated results are output of AgBalance. We present here<strong>in</strong> results of a case study on oilseed rape production<br />
, compar<strong>in</strong>g the average good agricultural practices of 1998 and 2008 at the state level (State Mecklenburg-West Pomerania,<br />
North-East Germany). For the functional unit of provid<strong>in</strong>g one ton of rapeseed a the field border, the aggregated results <strong>in</strong>dicate<br />
significant improvements <strong>in</strong> the overall susta<strong>in</strong>ability s<strong>in</strong>gle score and particularly <strong>in</strong> the environmental aggregated score, for the2008<br />
production protocol. Us<strong>in</strong>g scenario analysis, the use of fertilisers <strong>in</strong>clud<strong>in</strong>g denitrification-<strong>in</strong>hibitors such as ENTEC ® 26, was <strong>in</strong>vestigated,<br />
which is l<strong>in</strong>ked to potentially significant reductions <strong>in</strong> N2O field emissions.<br />
Keywords: ecoefficiency analysis, Social Life Cycle Assessment, scenario analysis, w<strong>in</strong>ter oilseed rape, denitrification <strong>in</strong>hibitors<br />
1. Introduction and goal<br />
Most of the exist<strong>in</strong>g m<strong>et</strong>hods to assess agricultural susta<strong>in</strong>ability for farm or crop management (e.g. Bockstaller<br />
<strong>et</strong> al., 2008, 2009; Field to Mark<strong>et</strong> 2009; Grenz <strong>et</strong> al., 2009) are not based upon a life cycle approach<br />
or do not address all dimensions of susta<strong>in</strong>ability <strong>in</strong> a holistic manner. In build<strong>in</strong>g on the environmental impacts<br />
and economic costs assessed <strong>in</strong> BASF’s Eco-efficiency Analysis (Sal<strong>in</strong>g <strong>et</strong> al., 2002) and the social<br />
impact <strong>in</strong>dicators <strong>in</strong> SEEBALANCE® (Schmidt <strong>et</strong> al., 2004; Kölsch <strong>et</strong> al., 2008), BASF has designed Ag-<br />
Balance TM as a new m<strong>et</strong>hod to assess the susta<strong>in</strong>ability performance of agricultural production systems. Ag-<br />
Balance <strong>in</strong> addition conta<strong>in</strong>s a range of new agriculture-specific <strong>in</strong>dicators, which were identified and developed<br />
<strong>in</strong> a dialogue with various stakeholders, specifically address<strong>in</strong>g biodiversity and soil quality. This new<br />
m<strong>et</strong>hod is created to assess and manage cont<strong>in</strong>uous improvement <strong>in</strong> susta<strong>in</strong>able agriculture at several levels:<br />
(1) for the farmer, by assess<strong>in</strong>g current practices and develop<strong>in</strong>g scenarios for improved processes, (2) for<br />
the agri-food value cha<strong>in</strong>, by assess<strong>in</strong>g agriculture’s contribution over the compl<strong>et</strong>e product life cycle and<br />
develop<strong>in</strong>g options for improvement, and (3) for policy makers, by assess<strong>in</strong>g the impact of regulations on<br />
products and farm<strong>in</strong>g practices.<br />
Here, we present results of an AgBalance TM case study on w<strong>in</strong>ter oilseed rape production at the geographical<br />
level of Northern German state Mecklenburg-West Pomerania. Recent reports <strong>in</strong>dicate that oilseed rape production<br />
has seen a substantial <strong>in</strong>crease <strong>in</strong> productivity and profitability for the farmers over the last decade<br />
(AgMRC <strong>2012</strong>). Wh<strong>et</strong>her or not this <strong>in</strong>tensification has come at the expense of <strong>in</strong>creased impacts on environment<br />
and soci<strong>et</strong>y, however, rema<strong>in</strong>ed unclear. The goal of the study therefore was to <strong>in</strong>vestigate the susta<strong>in</strong>ability<br />
performance of state-of-the art w<strong>in</strong>ter oilseed-rape production <strong>in</strong> the study region, and compare it<br />
to the period ten years before, by assess<strong>in</strong>g holistically environmental, social and economic susta<strong>in</strong>ability<br />
impacts with a focus on the on-farm activities.<br />
2. M<strong>et</strong>hods and scope of the study<br />
The AgBalance m<strong>et</strong>hodology (Schoeneboom <strong>2012</strong>a, Schoeneboom <strong>2012</strong>b) is based on BASF’s Eco-<br />
Efficiency Analysis and SEEBALANCE® m<strong>et</strong>hods for quantitative susta<strong>in</strong>ability impact assessment (Sal<strong>in</strong>g<br />
<strong>et</strong> al., 2002, Schmidt <strong>et</strong> al., 2005, Kölsch 2008). It <strong>in</strong>cludes an environmental <strong>LCA</strong> for several impact categories,<br />
based on mandatory and optional parts of the ISO 14040 and 14044 standards for life cycle assessment.<br />
Furthermore, recommendations of the UNEP/SETAC work<strong>in</strong>g group for social <strong>LCA</strong> as well as the SA8000<br />
and ISO26000SR standards were followed <strong>in</strong> the development of the m<strong>et</strong>hodology. The results from the<br />
<strong>in</strong>dividual impact categories were weighted and aggregated as outl<strong>in</strong>ed <strong>in</strong> Sal<strong>in</strong>g <strong>et</strong> al., (2002) and Kicherer<br />
<strong>et</strong> al., (2007). The m<strong>et</strong>hod received <strong>in</strong>dependent assurance of functionality and coherence from DNV Bus<strong>in</strong>ess<br />
Assurance, TÜV Süd and the National Sanitation Foundation (BASF 2011).
PARALLEL SESSION 1B: TOWARDS LIFE CYCLE SUSTAINABILITY ASSESSMENT 8 th Int. Conference on <strong>LCA</strong> <strong>in</strong> the<br />
Agri-<strong>Food</strong> Sector, 1-4 Oct <strong>2012</strong><br />
For the present case study on w<strong>in</strong>ter oilseed rape production <strong>in</strong> the Northern German state Mecklenburg-<br />
West Pomerania, the ma<strong>in</strong> data sources were data s<strong>et</strong>s from state office for agricultural research, particularly<br />
the “reference farm monitor<strong>in</strong>g n<strong>et</strong>work”, and the state’s annual Agricultural Report (LFA Mecklenburg-<br />
Vorpommern 2009); moreover <strong>in</strong>terviews conducted on five farms, each with 100 – 500 ha of agricultural<br />
area planted with w<strong>in</strong>ter oilseed rape. The study’s scope was the susta<strong>in</strong>ability performance of w<strong>in</strong>ter oilseed-rape<br />
production <strong>in</strong> the study region <strong>in</strong> comparison to production ten years before. We have collected<br />
data s<strong>et</strong>s for the time period 2008 (five-year averages) and 1998; the two alternative product systems compared<br />
are thus the ‘good agricultural practice 2008’ and ‘good agricultural practice 1998’. All assumptions<br />
were verified with the state office for agricultural research (Gülzow) and selected farmers. The functional<br />
unit was def<strong>in</strong>ed as the ‘production of 1 ton of oilseed rape, cradle to field border, <strong>in</strong> Mecklenburg-<br />
Vorpommern, Germany, product water content below 9%, data from 2008 and 1998’. As no by products<br />
(straw) are usually harvested all impacts were allocated to the rape seed. The system boundaries of both the<br />
alternative production scenarios (2008, 1998) are shown <strong>in</strong> Fig. 1.<br />
Production Seed<br />
Production Pesticides<br />
Production Fertilizers<br />
Production Fuels<br />
Figure 1. System boundaries of the AgBalance case study<br />
Road Transports<br />
Soil Preparation<br />
Farm<strong>in</strong>g Processes<br />
3. Results and discussion<br />
We focus here on the discussion of environmental impacts, as these showed the biggest difference b<strong>et</strong>ween<br />
the two studied systems. The assessment of environmental impacts comprises the global warm<strong>in</strong>g potential,<br />
acidification -, ozone depl<strong>et</strong>ion -, and photochemical ozone creation potential, as well as emissions to water.<br />
Resource efficiency <strong>in</strong>dicators <strong>in</strong>clude pimary energy demand, abiotic resource depl<strong>et</strong>ion, (Sal<strong>in</strong>g 2002) land<br />
use, (Koellner and Scholz 2007), and water consumption (Pfister 2009). Moreover, we assessed the aquatic<br />
ecotoxicity potential result<strong>in</strong>g from emissions of pesticides and fertilisers accord<strong>in</strong>g to Sal<strong>in</strong>g <strong>et</strong> al., (2005);<br />
Summariz<strong>in</strong>g these results, the impacts were significantly lower <strong>in</strong> the 2008 compared to the 1998 production<br />
system. This partly reflects the fact that rapeseed production on the reference monitor<strong>in</strong>g farms has seen<br />
substantial <strong>in</strong>crease <strong>in</strong> yields from 1998 to 2008, on average from 2.7 ton/ha to 4.1 ton/ha. As the functional<br />
unit is def<strong>in</strong>ed as one ton of rapeseed, the emission flows and exchanges <strong>in</strong> relation to the reference flow<br />
were lower <strong>in</strong> the 2008 production system.<br />
AgBalance TM however additionally requires the evaluation of a s<strong>et</strong> of agri-environmental <strong>in</strong>dicators perta<strong>in</strong><strong>in</strong>g<br />
to specific biodiversity impacts <strong>in</strong> agricultural areas. These <strong>in</strong>dicators are quantified per hectare and year,<br />
and have no numerical correlation with the reference flow, <strong>in</strong> order to show <strong>in</strong> a transparent way the management<br />
of the agricultural soil.<br />
Drill<strong>in</strong>g<br />
Application of<br />
Pesticides<br />
Fertilizer<br />
Lime<br />
Harvest<strong>in</strong>g<br />
63
PARALLEL SESSION 1B: TOWARDS LIFE CYCLE SUSTAINABILITY ASSESSMENT 8 th Int. Conference on <strong>LCA</strong> <strong>in</strong> the<br />
Agri-<strong>Food</strong> Sector, 1-4 Oct <strong>2012</strong><br />
Figure 2. Assessment of specific impacts on biodiversity <strong>in</strong> agricultural areas: (a) aggregated result, (b)<br />
evaluation of comb<strong>in</strong>ed pesticide ecotoxicity profile for endpo<strong>in</strong>ts rodent, bee, earthworm, bird, algae, waterflea,<br />
fish, (c) evaluation of nitrogen surplus, (d) evaluation of protected area coverage.<br />
The results of this analysis are summarized <strong>in</strong> Figure 2 (a). The group of sub-<strong>in</strong>dicators comprises: a state<br />
<strong>in</strong>dicator, describ<strong>in</strong>g the vulnerability of the ecosystems <strong>in</strong> the study region, adoption of agri-environmental<br />
schemes, protected area coverage, the pesticide ecotoxicity profile relat<strong>in</strong>g to several endpo<strong>in</strong>ts, the crop<br />
rotation diversity, the <strong>in</strong>termix<strong>in</strong>g potential of crops, farm<strong>in</strong>g <strong>in</strong>tensity, and nitrogen surplus. The ma<strong>in</strong> contribution<br />
to differences b<strong>et</strong>ween the 1998 and 2008 production systems <strong>in</strong> the overall biodiversity <strong>in</strong>dicator<br />
are, <strong>in</strong> the present case, the protected area coverage, the ecotoxicity profile, and the nitrogen surplus. The<br />
protected area coverage evaluates the coverage of Natura2000 and FFH areas <strong>in</strong> the study region (<strong>in</strong> this<br />
case, the state) aga<strong>in</strong>st a given targ<strong>et</strong> value, as well as the fraction of area enrolled <strong>in</strong> agri-environmental<br />
schemes. Improvements have been ma<strong>in</strong>ly attributed to the first category. The ecotoxicity profile is shown <strong>in</strong><br />
Fig. 2 (b). The relative improvement is ma<strong>in</strong>ly due to a more efficient use of state-of-the-art pesticides with a<br />
lower ecotoxicity profile. F<strong>in</strong>ally, nitrogen surplus has decreased <strong>in</strong> the 2008 case, due to improvements <strong>in</strong><br />
the nitrogen saldo; we note, however, that both systems still exhibit large and positive nitrogen balances.<br />
Relative results of all <strong>in</strong>dicators are shown on a normalised scale <strong>in</strong> the environmental f<strong>in</strong>gerpr<strong>in</strong>t diagram, <strong>in</strong><br />
Fig. 3. Relative improvement <strong>in</strong> each impact is represented by smaller values on the respective axes; hence<br />
the smaller the f<strong>in</strong>gerpr<strong>in</strong>t, the b<strong>et</strong>ter the relative performance of the correspond<strong>in</strong>g alternative. As discussed<br />
above, the assessment of specific impacts on biodiversity <strong>in</strong> agricultural areas show an improvement <strong>in</strong> the biodiversity<br />
potential, caused by both an <strong>in</strong>creased assignment of protected areas <strong>in</strong> the region as well as a b<strong>et</strong>ter<br />
ecotoxicity profile of state-of-the-art agrochemical <strong>in</strong>puts (i.e. a shift from organophosphates and carbendazim<br />
to modern <strong>in</strong>secticides and fungicides). Moreover, improvements for most of the other environmental<br />
impact categories were revealed for “2008 Standard”, such as “energy consumption”,”water use” or “resource<br />
depl<strong>et</strong>ion”, to a large extent due to a more efficient land use (Fig. 3a). Although <strong>in</strong>dividual social<br />
susta<strong>in</strong>ability <strong>in</strong>dicators exhibited changes b<strong>et</strong>ween 1998 and 2008, the aggregated social susta<strong>in</strong>ability score<br />
rema<strong>in</strong>ed nearly unchanged, due to compensation of positive and negative impacts. In particular, rationalisation<br />
efforts resulted <strong>in</strong> fewer work<strong>in</strong>g hours <strong>in</strong> agriculture (Fig. 3b).<br />
64
PARALLEL SESSION 1B: TOWARDS LIFE CYCLE SUSTAINABILITY ASSESSMENT 8 th Int. Conference on <strong>LCA</strong> <strong>in</strong> the<br />
Agri-<strong>Food</strong> Sector, 1-4 Oct <strong>2012</strong><br />
Biodiversity<br />
Energy<br />
Consumption<br />
Production<br />
Soil<br />
Emissions<br />
Water<br />
Consumption<br />
Land Use<br />
Ecotoxicity<br />
Potential<br />
Resource<br />
Consumption<br />
International<br />
Community<br />
Future Generations<br />
Farmers/<br />
Employees<br />
Consumers<br />
Local / National<br />
Community<br />
Fixed Costs<br />
(a) Environmental F<strong>in</strong>gerpr<strong>in</strong>t (b) Social F<strong>in</strong>gerpr<strong>in</strong>t (c) Economic F<strong>in</strong>gerpr<strong>in</strong>t<br />
Figure 3. Representation of relative impact category results for alternatives <strong>in</strong> environmental (a), social (b)<br />
and economic (c) f<strong>in</strong>gerpr<strong>in</strong>t diagrams. Relative improvement <strong>in</strong> each impact category is represented by<br />
smaller values on the respective axes; hence the smaller the f<strong>in</strong>gerpr<strong>in</strong>t, the b<strong>et</strong>ter the relative performance of<br />
the correspond<strong>in</strong>g alternative.<br />
On the other hand, rationalisation drove to a large extent the improved performance on the part of “fixed<br />
costs” (Fig. 3c), which also resulted <strong>in</strong> a reduced number of work<strong>in</strong>g hours with<strong>in</strong> the agriculture <strong>in</strong>dustry <strong>in</strong><br />
the state of Mecklenburg-West Pomerania. This reduction <strong>in</strong> hours worked ma<strong>in</strong>ly contributes to the lower<br />
performance <strong>in</strong> the impact category “local/national community” (Fig 3b). On the part of “Economy”, both<br />
higher commodity prices and higher yields contributed to an improved profitability (and overall economic<br />
susta<strong>in</strong>ability; Fig. 3c). The reason for the higher yields is the mark<strong>et</strong> <strong>in</strong>troduction and adoption of openpoll<strong>in</strong>at<strong>in</strong>g<br />
vari<strong>et</strong>ies as well as of hybrid vari<strong>et</strong>ies resulted <strong>in</strong> a more <strong>in</strong>tensive use of fertilisers and plant protection<br />
compounds. Moreover, <strong>in</strong> 2008 a larger portion of farmers adopted conservation tillage practices than<br />
<strong>in</strong> 1998. All these changes caused lower variable and fixed costs per functional unit (Fig 3c).<br />
Scenario analysis was carried out to <strong>in</strong>vestigate potential improvements <strong>in</strong> emission of greenhouse-gases by<br />
chang<strong>in</strong>g to a different nitrogen fertiliser, <strong>in</strong>clud<strong>in</strong>g a de-nitrification <strong>in</strong>hibitor (i.e. ENTEC ® 26).<br />
1998<br />
2008<br />
Energy<br />
Consumption<br />
ENTEC 2008<br />
Production<br />
Soil<br />
Biodiversity<br />
Water<br />
Consumption<br />
Land Use<br />
Emissions<br />
Ecotoxicity<br />
Potential<br />
Resource<br />
Consumption<br />
Economic<br />
Susta<strong>in</strong>ability<br />
Figure. 4. Environmental f<strong>in</strong>gerpr<strong>in</strong>t with scenario ‘ENTEC’, assum<strong>in</strong>g that N-fertilisation is exclusively<br />
done with ENTEC26, conta<strong>in</strong><strong>in</strong>g a denitrification <strong>in</strong>hibitor<br />
The results of the scenario <strong>in</strong>dicate a significant improvement of the 2008 susta<strong>in</strong>ability performance (Fig.<br />
4). This <strong>in</strong>crease was ma<strong>in</strong>ly conferred by improvements <strong>in</strong> the <strong>in</strong>dicators “greenhouse gas emissions”, and<br />
“water emissions” as well as <strong>in</strong> “nutrient balance” of the soil. The dimensions “Economy” and “Soci<strong>et</strong>y”<br />
stayed largely unchanged. This f<strong>in</strong>d<strong>in</strong>g <strong>in</strong>dicates that a switch to denitrification <strong>in</strong>hibitor-based fertilisers<br />
would be a useful measure to improve the susta<strong>in</strong>ability of oilseed rape production, especially aga<strong>in</strong>st the<br />
background of a high nitrogen demand of oilseed rape <strong>in</strong> comparison to other crops (Malagoli <strong>et</strong> al., 2005).<br />
1998<br />
2008<br />
Variable<br />
Costs<br />
65
PARALLEL SESSION 1B: TOWARDS LIFE CYCLE SUSTAINABILITY ASSESSMENT 8 th Int. Conference on <strong>LCA</strong> <strong>in</strong> the<br />
Agri-<strong>Food</strong> Sector, 1-4 Oct <strong>2012</strong><br />
Figure 5. Representation of s<strong>in</strong>gle score results. The alternative with the relative b<strong>et</strong>ter performance is at the<br />
top, the one with the worst performance at the bottom of the graph.<br />
4. Conclusions<br />
As Fig. 5 summarises, this AgBalance case study on w<strong>in</strong>ter oilseed rape production <strong>in</strong> Northern Germany<br />
provides an example for a susta<strong>in</strong>able <strong>in</strong>tensification <strong>in</strong> modern agriculture. The state-of-the-art agricultural<br />
practice from 2008 outperformed the 1998 practice <strong>in</strong> all three dimensions of susta<strong>in</strong>ability. The amount of<br />
d<strong>et</strong>ailed <strong>in</strong>formation on various aspects of the susta<strong>in</strong>ability performance of the production system tog<strong>et</strong>her<br />
with scenario analysis make AgBalance a powerful tool to derive recommendations for optimized crop production<br />
protocols. It needs to be stated, however, that these recommendations require further verification and<br />
substantiation through field test<strong>in</strong>g.<br />
5. References<br />
AgMRC, <strong>2012</strong>. Agricultural Mark<strong>et</strong><strong>in</strong>g Center – Rapeseed. Available onl<strong>in</strong>e at:<br />
http://www.agmrc.org/commodities__products/gra<strong>in</strong>s__oilseeds/rapeseed/. Accessed: 10 May <strong>2012</strong>.<br />
BASF (2011) AgBalance http://www.agro.basf.com/agr/AP-Intern<strong>et</strong>/en/content/news_room/<strong>in</strong>dex . Accessed: 10 May <strong>2012</strong>.<br />
Bockstaller C., Guichard L., Makowski D., Avel<strong>in</strong>e A., Girard<strong>in</strong> P., Plantureux S., 2008. Agri-environmental <strong>in</strong>dicators to assess<br />
cropp<strong>in</strong>g and farm<strong>in</strong>g systems. A review. Agron. Susta<strong>in</strong>. Dev. 28:139-149.<br />
Bockstaller C., Guichard L., Keich<strong>in</strong>ger O., Girard<strong>in</strong> P., Galan M.B., Gaillard G., 2009. Comparison of m<strong>et</strong>hods to assess the susta<strong>in</strong>ability<br />
of agricultural systems. A review. Agron. Susta<strong>in</strong>. Dev. 29:223-235.<br />
AF Bouwman, LJM Boumans, NH Batjes, Global Biochemical Cycles, Vol. 16, No. 4, p. 1080, Table 3.<br />
Döhler <strong>et</strong> al., 2002: 'BMVEL/UBA Ammoniak-Emissions<strong>in</strong>ventar der deutschen Landwirtschaft und M<strong>in</strong>derungsszenarien bis 2010'<br />
Field to Mark<strong>et</strong>, 2009. Environmental Resource Indicators for Measur<strong>in</strong>g Outcomes of On-Farm. Agricultural Production <strong>in</strong> the<br />
United States, First Report, The Keystone Alliance for Susta<strong>in</strong>able Agriculture, Available onl<strong>in</strong>e at http://keystone.org/spp/envsusta<strong>in</strong>_ag.html.<br />
Accessed 10 January <strong>2012</strong>.<br />
Grenz J., Thalmann C., Stämpfli A., Studer C., Häni F., 2009. RISE – a m<strong>et</strong>hod for assess<strong>in</strong>g the susta<strong>in</strong>ability of agricultural production<br />
at farm level. Rural Dev. News 1: 5-9.<br />
IPCC 2006: 2006 IPCC Guidel<strong>in</strong>es for National Greenhouse Inventories, Vol. 4, Agriculture, Forestry, and Other Land Use, S.<br />
Egglestone, L. Buendia, K. Miwa, T. Ngara, K. Tanabe (eds.), IGES, Japan.<br />
Kicherer A., Schaltegger S., Tschochohei H., Ferreira Pozo B., 2007. Comb<strong>in</strong><strong>in</strong>g Life Cycle Assessment and Life Cycle Costs via<br />
Normalization. Int. J. Life Cycle Assess. 12:537-534.<br />
Köllner T, Scholz R (2007) Assessment of Land Use Impacts on the Natural Environment, Part 1: An Analytical Framework for Pure<br />
Land Occupation and Land Use Change. Int. J. Life Cycle Assess. 12:16-23; Köllner T, Scholz R (2008) Assessment of Land<br />
Use Impacts on the Natural Environment, Part 2: Generic Characterization Factors for Local Species Diversity <strong>in</strong> Central Europe.<br />
Int. J. Life Cycle Assess. 13:32-48.<br />
Kölsch D., Sal<strong>in</strong>g P., Kicherer A., Grosse-Sommer A., Schmidt I., 2008. How to measure social impacts? A socioeco-efficiency<br />
analysis by the SEEBALANCE® m<strong>et</strong>hod. Int. J. Susta<strong>in</strong>. Dev. 11:1- 23.<br />
LFA Mecklenburg-Vorpommern, 2009. Available onl<strong>in</strong>e at: http://www.landwirtschaftmv.de/cms2/LFA_prod/LFA/content/de/Fach<strong>in</strong>formationen/B<strong>et</strong>riebswirtschaft/Allgeme<strong>in</strong>/<strong>in</strong>dex.jsp?&artikel=1531.<br />
Accessed:<br />
10 May <strong>2012</strong><br />
Malagoli P., La<strong>in</strong>e P., Rossato L., Ourry A., 2005. Dynamics of Nitrogen Uptake and Mobilization <strong>in</strong> Field-grown W<strong>in</strong>ter Oilseed<br />
Rape (Brassica napus) From Stem Extension to Harvest. II. An 15 N-labell<strong>in</strong>g-based Simulation Model of N Partition<strong>in</strong>g B<strong>et</strong>ween<br />
Veg<strong>et</strong>ative and Reproductive Tissues. Ann Bot., 95 (7), 1187-1198.<br />
Pfister, S, Koehler A, Hellweg S (2009) Assess<strong>in</strong>g the environmental impacts of freshwater consumption <strong>in</strong> <strong>LCA</strong>. Environ. Sci.<br />
Technol. 43: 4098–4104.<br />
Sal<strong>in</strong>g P., Kicherer A., Dittrich-Kraemer B., Wittl<strong>in</strong>ger R., Zombik W., Schmidt I., Schrott W., Schmidt S., 2002. Eco-efficiency<br />
Analysis by BASF: The M<strong>et</strong>hod. Int. J. Life Cyle Assess. 7:203-218.<br />
Sal<strong>in</strong>g P., Maisch R, Silvani M, König N (2005) Assess<strong>in</strong>g the Environmental-Hazard Potential for Life Cycle Assessment, Eco-<br />
Efficiency and SEEbalance® Int. J. Life Cycle Assess., 10:364-371.<br />
66<br />
b<strong>et</strong>ter performance<br />
0.6<br />
1.0<br />
1.4<br />
Total Environment Soci<strong>et</strong>y Economy<br />
Production<br />
0.6<br />
0.6<br />
0.6<br />
1.0<br />
1.4<br />
1.0<br />
1.4<br />
1.0<br />
1.4<br />
1998<br />
2008
PARALLEL SESSION 1B: TOWARDS LIFE CYCLE SUSTAINABILITY ASSESSMENT 8 th Int. Conference on <strong>LCA</strong> <strong>in</strong> the<br />
Agri-<strong>Food</strong> Sector, 1-4 Oct <strong>2012</strong><br />
Schoeneboom <strong>2012</strong>a: Schoeneboom, J.; Sal<strong>in</strong>g, P.; Gipmans, M. <strong>2012</strong>. AgBalanceTM – Technical Background Paper. Available at<br />
http://www.agro.basf.com/agr/AP-<br />
Intern<strong>et</strong>/en/function/conversions:/publish/upload/susta<strong>in</strong>ability/AgBalance/307736_BASF_Tech-E_Paper-AgBalance.pdf<br />
Schoeneboom <strong>2012</strong>b: AgBalance TM - Holistic Assessment of Susta<strong>in</strong>ability <strong>in</strong> Agriculture Part 1: M<strong>et</strong>hod<br />
Framework. Schoeneboom, J.; Sal<strong>in</strong>g P.; van Gelder, R. <strong>2012</strong>. Submitted to Int. J. Life Cycle Assess.<br />
Schmidt I., Meurer M., Sal<strong>in</strong>g P., Reuter W., Kicherer A., Gensch C.O., 2004. SEEBALANCE®: Manag<strong>in</strong>g susta<strong>in</strong>ability of products<br />
and processes with the socio-eco-efficiency analysis by BASF, Greener Management International, 45:79 - 94.<br />
67
PARALLEL SESSION 1B: TOWARDS LIFE CYCLE SUSTAINABILITY ASSESSMENT 8 th Int. Conference on <strong>LCA</strong> <strong>in</strong> the<br />
Agri-<strong>Food</strong> Sector, 1-4 Oct <strong>2012</strong><br />
Assessment of exist<strong>in</strong>g and potential cereal food and non food uses by<br />
comb<strong>in</strong><strong>in</strong>g E-<strong>LCA</strong> and S-<strong>LCA</strong><br />
68<br />
Florence Van Stappen 1 * , Alice Delcour 2,4 , Stéphanie Gheysens 3 , Virg<strong>in</strong>ie Decruyenaere 3 , Didier Stilmant 4 ,<br />
Philippe Burny 2 , Fabienne Rabier 5 , Jean-Pierre Goffart 2<br />
1<br />
Biomass, Bioproducts and Energy Unit, Walloon Agricultural Research Centre (CRA-W), 146 chaussée de Namur, 5030 Gembloux,<br />
Belgium<br />
2<br />
Crops Production Systems Unit, CRA-W, 4 rue du Bordia, 5030 Gembloux, Belgium<br />
3<br />
Animal Breed<strong>in</strong>g, Quality Production and Welfare Unit, CRA-W, 8 rue de Liroux, 5030 Gembloux, Belgium<br />
4<br />
Farm<strong>in</strong>g Systems, Territories and Information Technology Unit, CRA-W, 100 rue du Serpont, 6800 Libramont, Belgium<br />
5<br />
Agricultural Mach<strong>in</strong>es and Facilities Unit, CRA-W, 146 chaussée de Namur, 5030 Gembloux, Belgium<br />
Correspond<strong>in</strong>g author. E-mail: vanstappen@cra.wallonie.be<br />
ABSTRACT<br />
In Wallonia (Belgium), 60% of the arable cropped area is dedicated to cereals. More than a half of the cereal cha<strong>in</strong>s are currently<br />
turned towards animal feed. Direct human food uses barely reach 10% of the gra<strong>in</strong> production. Non food uses are grow<strong>in</strong>g, with 16%<br />
of the Walloon cereal production converted <strong>in</strong>to bio<strong>et</strong>hanol or biogas. Based on a comprehensive description of the Walloon cereal<br />
sector, the project ALT-4-CER considers opportunities for food, feed, fuel and fibre uses of Walloon cereal resources (“4F” scenarios)<br />
through an exhaustive comparison of exist<strong>in</strong>g and potential conversion cha<strong>in</strong>s. Scenarios are evaluated regard<strong>in</strong>g environmental<br />
and socio-economic aspects through Life Cycle Analyses fed by region-specific data. Environmental <strong>LCA</strong> aims at identify<strong>in</strong>g territorial<br />
differences regard<strong>in</strong>g the cultivation step <strong>in</strong> comparison with data from commonly used databases. Beside E-<strong>LCA</strong>, a Social <strong>LCA</strong><br />
m<strong>et</strong>hodology is be<strong>in</strong>g elaborated. Environmental and socio-economic assessment results will then be <strong>in</strong>tegrated thanks to multicriteria<br />
analysis.<br />
Keywords: cereals, life cycle assessment (<strong>LCA</strong>), environmental impact, socio-economic impact, decision mak<strong>in</strong>g<br />
1. Introduction<br />
In the present susta<strong>in</strong>able development framework, agriculture raises major concerns <strong>in</strong> terms of productions<br />
and farmers’ <strong>in</strong>come diversification, comp<strong>et</strong>ition for arable land b<strong>et</strong>ween food and non food uses, employment<br />
preservation or creation <strong>in</strong> rural areas, climate change mitigation and natural resources protection.<br />
Current environmental policies and regulations aim at mov<strong>in</strong>g towards more susta<strong>in</strong>able production and<br />
consumption pathways. This transition requires the improvement of the energy, environmental and social<br />
balances of considered processes and reference systems. This shift also <strong>in</strong>volves the search for new and alternative<br />
uses of agricultural resources, products and co-products.<br />
In Wallonia (Belgium), more than 60% of the arable cropped area is dedicated to cereals (DGSIE 2010).<br />
In the current context of non renewable energy sources depl<strong>et</strong>ion and grow<strong>in</strong>g world population, comp<strong>et</strong>ition<br />
for cereal resources requires the identification of the most susta<strong>in</strong>able scenarios for agricultural products and<br />
co-products use.<br />
Nowadays most Walloon cereal cha<strong>in</strong>s are classically turned towards human food and animal feed. Key<br />
opportunities for non food uses are considered <strong>in</strong> a susta<strong>in</strong>able development perspective. But this can only be<br />
achieved through an exhaustive comparison of environmental and socio-economic impacts of exist<strong>in</strong>g and<br />
potential cereal cha<strong>in</strong>s.<br />
2. Objectives<br />
Compar<strong>in</strong>g current and potential cereal uses <strong>in</strong> Wallonia, the overall goal of the 3-year project “Alternatives<br />
for Cereals – ALT-4-CER”, started <strong>in</strong> March 2011, is to def<strong>in</strong>e and to evaluate alternative scenarios for<br />
food and non food uses of cereal resources <strong>in</strong> Wallonia with the support of <strong>in</strong>volved stakeholders.<br />
In order to depict comprehensively the Walloon cereal landscape the project firstly aimed at elaborat<strong>in</strong>g<br />
scenarios for food, feed, fuel and fibre uses of cereal resources <strong>in</strong> Wallonia (so-called “4F” scenarios). Scenarios<br />
def<strong>in</strong>ition was supported by the consultation of all <strong>in</strong>volved actors (producers, wholesalers, processors,<br />
consumers, and decision-makers) <strong>in</strong> order to ensure a further scientific approach based on realistic exist<strong>in</strong>g<br />
and potential cases. Scenarios take <strong>in</strong>to account <strong>in</strong>teractions b<strong>et</strong>ween cha<strong>in</strong>s and their co-products, as<br />
well as potential impacts on the agricultural landscape and land occupation <strong>in</strong> Wallonia.<br />
On the basis of these scenarios the project is evaluat<strong>in</strong>g their environmental impacts through the development<br />
of Environmental Life Cycle Assessments (E-<strong>LCA</strong>) adapted to the local context, fed with specific<br />
data collected for Wallonia. Furthermore m<strong>et</strong>hodological choices regard<strong>in</strong>g system boundaries, technological<br />
options, data quality, co-product treatment, or result <strong>in</strong>terpr<strong>et</strong>ation must be justified and their sensitivity<br />
tested.
PARALLEL SESSION 1B: TOWARDS LIFE CYCLE SUSTAINABILITY ASSESSMENT 8 th Int. Conference on <strong>LCA</strong> <strong>in</strong> the<br />
Agri-<strong>Food</strong> Sector, 1-4 Oct <strong>2012</strong><br />
Simultaneously, a Social Life Cycle Analysis m<strong>et</strong>hodology (S-<strong>LCA</strong>) is be<strong>in</strong>g developed <strong>in</strong> order to grasp<br />
socio-economic impacts of def<strong>in</strong>ed scenarios. This m<strong>et</strong>hod, complementary to E-<strong>LCA</strong> but not as well developed<br />
y<strong>et</strong>, requires more m<strong>et</strong>hodological adjustments.<br />
F<strong>in</strong>ally the relevance of the selected scenarios will be evaluated through multi-criteria analysis supported<br />
by the sector. Stakeholders will aga<strong>in</strong> be convened <strong>in</strong> order to help weight<strong>in</strong>g susta<strong>in</strong>able <strong>in</strong>dicators identified<br />
<strong>in</strong> the E-<strong>LCA</strong> and S-<strong>LCA</strong> processes.<br />
3. Walloon cereal current and potential uses<br />
3.1. The Walloon agricultural context<br />
Wallonia is divided <strong>in</strong>to 10 agricultural regions, accord<strong>in</strong>g to soil texture and landscape of the country<br />
(Sneppe 2002). The agricultural productions of Wallonia are closely related to the opportunities offered by<br />
the soil properties or the landscape. The Northern part of Wallonia (loam area, sandy-loam area, and clayedloam<br />
area), with its particularly fertile and deep soils, is dedicated to large-scale crops, such as cereals, sugar<br />
be<strong>et</strong> and potato. The central part of Wallonia has poorer and less deep soils and is therefore dom<strong>in</strong>ated by<br />
forage crops (ma<strong>in</strong>ly forage maize). The Southern part, with a lower population density, is mostly covered by<br />
woods and forests, where agricultural lands are devoted to meadows and pastures. The Eastern Belgium area,<br />
with the highest a.s.l. elevations <strong>in</strong> Belgium, is dedicated to pastures and dairy productions; orchards and<br />
bocage are also found <strong>in</strong> this area.<br />
Agricultural statistics show that more than 60% of the Agricultural Area Utilised for Farm<strong>in</strong>g (AAUF) is<br />
dedicated to cereals <strong>in</strong> Wallonia (DGSIE 2010). Ma<strong>in</strong> cereal crops are w<strong>in</strong>ter wheat (36%), forage maize<br />
(16%) and w<strong>in</strong>ter barley (10%). Thanks to its hard<strong>in</strong>ess, spelt is also common <strong>in</strong> the Southern area with its<br />
less fertile soils, more cold and w<strong>et</strong> climate and steeper landscape.<br />
Trends regard<strong>in</strong>g ma<strong>in</strong> crops <strong>in</strong> Wallonia <strong>in</strong>dicate that areas dedicated to wheat have been stable for the<br />
past 15 years, while barley and spelt areas are slowly decreas<strong>in</strong>g. This can be related to climate becom<strong>in</strong>g<br />
milder, allow<strong>in</strong>g more productive wheat to overtake other cereals. With<strong>in</strong> the same period, gra<strong>in</strong> maize areas<br />
have <strong>in</strong>creased due to climate evolution and gen<strong>et</strong>ic selection. Forage and gra<strong>in</strong> maize progressions seem to<br />
be made at the expense of sugar be<strong>et</strong> and temporary meadows.<br />
The ALT-4-CER project team has therefore decided to focus on the follow<strong>in</strong>g prevail<strong>in</strong>g cereal crops <strong>in</strong><br />
Wallonia: wheat (Triticum aestivum L.), barley (Hordeum vulgare L.), forage and gra<strong>in</strong> maize (Zea mays L.),<br />
and spelt (Triticum aestivum subsp. spelta L.).<br />
3.2. Current cereal uses <strong>in</strong> Wallonia<br />
More than a half of the cereal cha<strong>in</strong>s are currently turned towards animal feed. Direct human food uses,<br />
i.e. mill<strong>in</strong>g and brew<strong>in</strong>g, barely reach 10% of the gra<strong>in</strong> production, ma<strong>in</strong>ly because of low prices paid for<br />
food vari<strong>et</strong>ies, less favourable climate conditions and scattered plots of land. Non food uses are grow<strong>in</strong>g too,<br />
with 16% of the Walloon cereal production converted <strong>in</strong>to bio<strong>et</strong>hanol or biogas (Table 1, Figure 1).<br />
Table 1. Production and uses of Walloon cereal resources <strong>in</strong> 2010<br />
Use<br />
Gra<strong>in</strong><br />
1000 T FM<br />
Forage maize Straw TOTAL<br />
a % 1000 T FM a % 1000 T FM a % 1000 T DM b %<br />
<strong>Food</strong> 125 8 0 0 0 0 108 4<br />
Feed 724 46 2601 98 68 11 1544 57<br />
Fuel (<strong>et</strong>hanol and biogas) 501 32 53 2 0 0 449 16<br />
Fibre (animal litter) 0 0 0 0 547 89 465 17<br />
Export 227 14 0 0 0 0 160 6<br />
TOTAL<br />
a<br />
FM = fresh matter<br />
1577 2654 616 2725<br />
b DM = dry matter<br />
69
PARALLEL SESSION 1B: TOWARDS LIFE CYCLE SUSTAINABILITY ASSESSMENT 8 th Int. Conference on <strong>LCA</strong> <strong>in</strong> the<br />
Agri-<strong>Food</strong> Sector, 1-4 Oct <strong>2012</strong><br />
70<br />
Figure 1. Uses of Walloon cereal resources <strong>in</strong> 2010.<br />
3.3. Scenario def<strong>in</strong>ition<br />
The def<strong>in</strong>ition of “4F” scenarios is the basis for the subsequent steps of the project and was thus effectively<br />
supported by <strong>in</strong>volved stakeholders. Cereal flows (production, export, import, stock) have been evaluated<br />
thanks to expert consultation and available relevant data and literature. These flows, <strong>in</strong>tegrat<strong>in</strong>g historic<br />
trends and projections by 2030, helped def<strong>in</strong><strong>in</strong>g the basel<strong>in</strong>e scenario (2010) as well as future potential scenarios<br />
for cereal uses <strong>in</strong> Wallonia (2030).<br />
Scenarios consider <strong>in</strong>teractions b<strong>et</strong>ween cha<strong>in</strong>s and their co-products, as well as potential impacts on the<br />
agricultural landscape and land occupation <strong>in</strong> Wallonia. They have been established with contrast<strong>in</strong>g hypotheses:<br />
(1) “Bus<strong>in</strong>ess-as-usual” scenario: current trends are extrapolated from the past 15 years; (2) “Strategic”<br />
scenario: environmental, economic and social optimisation of current system; (3) “Localisation” scenario:<br />
development of new cereal conversion units <strong>in</strong> Wallonia (added value relocated with<strong>in</strong> the region) and<br />
<strong>in</strong>creased autonomy; and (4) “Globalisation” scenario: world demand drives cereal resources outside Wallonia<br />
(massive export), and Wallonia focuses on high added-value products (bioref<strong>in</strong>ery, bio-based chemistry)<br />
(Figure 2).<br />
1000 T DM<br />
100%<br />
4 500<br />
4 000<br />
3 500<br />
3 000<br />
2 500<br />
2 000<br />
1 500<br />
1 000<br />
500<br />
90%<br />
80%<br />
70%<br />
60%<br />
50%<br />
40%<br />
30%<br />
20%<br />
10%<br />
0<br />
0%<br />
6%<br />
17%<br />
16%<br />
57%<br />
4%<br />
Gra<strong>in</strong>s Forage maize Straw Total<br />
6%<br />
16%<br />
13%<br />
64%<br />
5%<br />
16%<br />
28%<br />
36%<br />
15%<br />
Figure 2. Production and uses of ma<strong>in</strong> Walloon cereal resources (wheat, barley, spelt, gra<strong>in</strong> maize and forage<br />
maize) <strong>in</strong> the 4 scenarios (DM = dry matter).<br />
Export<br />
Fibre (animal litter)<br />
Fuel (<strong>et</strong>hanol & biogas)<br />
Feed<br />
<strong>Food</strong><br />
2010 - basel<strong>in</strong>e 2030 - B-a-U 2030 - strategic 2030 - localisation 2030 -<br />
globalisation<br />
9%<br />
12%<br />
11%<br />
43%<br />
25%<br />
31%<br />
8%<br />
33%<br />
28%<br />
Export<br />
Fibre (litter, <strong>in</strong>sulator)<br />
Fuel/Bioref<strong>in</strong>ery 1G+2G<br />
Feed<br />
<strong>Food</strong>
PARALLEL SESSION 1B: TOWARDS LIFE CYCLE SUSTAINABILITY ASSESSMENT 8 th Int. Conference on <strong>LCA</strong> <strong>in</strong> the<br />
Agri-<strong>Food</strong> Sector, 1-4 Oct <strong>2012</strong><br />
D<strong>et</strong>ails on Walloon cereals flows and scenario def<strong>in</strong>ition will be available <strong>in</strong> an article to be submitted to<br />
Biotechnology, Agronomy, Soci<strong>et</strong>y and Environment (Eds. Presses agronomiques de Gembloux).<br />
4. Scenarios evaluation with <strong>LCA</strong><br />
Scenarios are now be<strong>in</strong>g evaluated regard<strong>in</strong>g environmental and socio-economic aspects through <strong>LCA</strong><br />
fed by region-specific data adapted to the local context.<br />
The bottleneck to estimate production cha<strong>in</strong> susta<strong>in</strong>ability is the lack of knowledge regard<strong>in</strong>g material and<br />
energy flows, and environmental and socio-economic impacts, from raw material extraction to waste disposal.<br />
Among available evaluation tools, <strong>LCA</strong> is nowadays the most commonly used m<strong>et</strong>hod (Moras 2007).<br />
Us<strong>in</strong>g <strong>LCA</strong> can have two complementary goals: either to compare products, processes or services accord<strong>in</strong>g<br />
to their impacts, or to identify, with<strong>in</strong> a production and use cha<strong>in</strong>, key po<strong>in</strong>ts to be improved <strong>in</strong> order to<br />
m<strong>in</strong>imize any given impact. The ISO 14044:2006 standard (ISO 2006) def<strong>in</strong>es three impact category groups<br />
called “Areas of Protection”: (i) natural and abiotic resources use, (ii) human health consequences and (iii)<br />
ecological consequences. Beside E-<strong>LCA</strong>, recent developments <strong>in</strong> <strong>LCA</strong> tend to <strong>in</strong>tegrate socio-economic aspects<br />
<strong>in</strong> S-<strong>LCA</strong>, <strong>in</strong> order to grasp all three pillars of susta<strong>in</strong>able development. With respect to S-<strong>LCA</strong>, a<br />
fourth Area of Protection is usually added: human dignity and well-be<strong>in</strong>g (Jørgensen, Bocq <strong>et</strong> al., 2008).<br />
The use of local and specific data is crucial when conduct<strong>in</strong>g <strong>LCA</strong>. Data uncerta<strong>in</strong>ty is closely related to<br />
data reliability and compl<strong>et</strong>eness, but also to geographical, temporal and technological correlation<br />
(Frischknecht, Jungbluth <strong>et</strong> al., 2007). Supported by long-term expertise and wide-spread contact n<strong>et</strong>work of<br />
the research team, the ALT-4-CER project has committed itself to collect and use specific data, adapted to<br />
the Walloon context.<br />
5. Scope and goal def<strong>in</strong>ition<br />
5.1. Consequential versus attributional <strong>LCA</strong><br />
Two types of <strong>LCA</strong> m<strong>et</strong>hodologies are used accord<strong>in</strong>g to the objective(s) of the study: attributional <strong>LCA</strong><br />
(A-<strong>LCA</strong>) and consequential <strong>LCA</strong> (C-<strong>LCA</strong>). A-<strong>LCA</strong> describes the relevant physical flows enter<strong>in</strong>g and exit<strong>in</strong>g<br />
a product system. C-<strong>LCA</strong> expresses how these flows will evolve <strong>in</strong> response to decisions or changes<br />
(F<strong>in</strong>nveden, Hauschild <strong>et</strong> al., 2009). When C-<strong>LCA</strong> is useful to assess the consequences of <strong>in</strong>dividual decisions,<br />
A-<strong>LCA</strong> enables dist<strong>in</strong>guish<strong>in</strong>g b<strong>et</strong>ween systems hav<strong>in</strong>g important impacts. These complementary objectives<br />
allow both A-<strong>LCA</strong> and C-<strong>LCA</strong> m<strong>et</strong>hodologies to be valid for decision-mak<strong>in</strong>g.<br />
Regard<strong>in</strong>g these def<strong>in</strong>itions, the goal of the ALT-4-CER project can be formulated as follows: to assess<br />
the consequences, <strong>in</strong> terms of environmental and socio-economic impacts, of potential changes <strong>in</strong> Walloon<br />
cereal uses by 2030, <strong>in</strong> comparison with the current situation (2010). Consequential <strong>LCA</strong> is therefore the<br />
appropriate choice with respect to this objective.<br />
5.2. System boundaries and functional unit def<strong>in</strong>ition<br />
The first step of any <strong>LCA</strong> is to def<strong>in</strong>e the goal and scope of the study (ISO 2006). This essential stage<br />
lays the basis of the study by answer<strong>in</strong>g key questions such as “What do we study? In what purpose? Who is<br />
the targ<strong>et</strong>ed audience?”. System boundaries need to be cut b<strong>et</strong>ween impacts considered as relevant and others.<br />
Besides, a functional unit (FU) needs to be chosen. The FU aims at provid<strong>in</strong>g a reference to which all<br />
<strong>in</strong>put and output flows <strong>in</strong> the assessment are normalized (Weidema <strong>et</strong> al., 2004). In a comparative study, the<br />
FU shall be the same for all compared product systems. This is a prerequisite for ensur<strong>in</strong>g equivalence<br />
among the product systems (ISO, 2006).<br />
<strong>Food</strong> and non food uses considered <strong>in</strong> ALT-4-CER are classified <strong>in</strong> “4F” categories:<br />
1. Human (<strong>Food</strong>) uses (i.e. flour mills, beer products, starch products used <strong>in</strong> agro-food <strong>in</strong>dustries,<br />
<strong>et</strong>c.);<br />
2. Animal (Feed) uses (i.e. feed <strong>in</strong>gredients for animal rations, agro-food and biofuel <strong>in</strong>dustry coproducts,<br />
gra<strong>in</strong> and/or straw self-consumption on farm, <strong>et</strong>c.);<br />
3. Energy (Fuel) uses (i.e. <strong>et</strong>hanol production from starch, second generation <strong>et</strong>hanol production from<br />
straw, biogas production from maize, straw direct combustion, <strong>et</strong>c.);<br />
4. Material (Fibre) uses (i.e. straw for animal litter, non food uses of starch, straw use as isolation material,<br />
bioref<strong>in</strong>eries, <strong>et</strong>c.).<br />
Those four categories imply various end-uses and very different functions of the <strong>in</strong>itial cereal resources.<br />
(De Boer 2003) considers that the kilogram is a convenient FU <strong>in</strong> order to take <strong>in</strong>to account both production<br />
efficiency and impacts. Normaliz<strong>in</strong>g impacts accord<strong>in</strong>g to land occupation on the contrary does not ac-<br />
71
PARALLEL SESSION 1B: TOWARDS LIFE CYCLE SUSTAINABILITY ASSESSMENT 8 th Int. Conference on <strong>LCA</strong> <strong>in</strong> the<br />
Agri-<strong>Food</strong> Sector, 1-4 Oct <strong>2012</strong><br />
count for production efficiency. On the other hand, both the mass and surface can be used as FU for assess<strong>in</strong>g<br />
global impacts, wh<strong>et</strong>her the hectare is preferred for regional impact assessment (Bass<strong>et</strong>-Mens 2005).<br />
Consider<strong>in</strong>g the multiple functions of the various systems studied here the proposed FU is “any useful<br />
output per hectare <strong>in</strong> an average year” (R<strong>et</strong>tenmaier, Köppen <strong>et</strong> al., 2010). This option uses a FU which is the<br />
same for all 4F scenarios and illustrates the comp<strong>et</strong>ition for land b<strong>et</strong>ween food and non food. On the other<br />
hand, the function of agriculture is not to occupy land. Nor is this solution convenient to compare different<br />
production systems, such as organic farm<strong>in</strong>g versus conventional farm<strong>in</strong>g, or different land use <strong>in</strong>tensities,<br />
because it does not account for the lesser productivity of organic farm<strong>in</strong>g or less <strong>in</strong>tensive production systems.<br />
A sensitivity analysis will thus test conclusions strength accord<strong>in</strong>g to another FU def<strong>in</strong>ed as “any useful<br />
output per kilogram of a given cereal <strong>in</strong> an average year”. Besides, regard<strong>in</strong>g S-<strong>LCA</strong>, a FU consider<strong>in</strong>g<br />
work<strong>in</strong>g hours can be a useful unit for specific socio-economic concerns.<br />
6. Environmental life cycle assessment<br />
Environmental Life Cycle Analysis (E-<strong>LCA</strong>) aims at identify<strong>in</strong>g territorial differences regard<strong>in</strong>g the cultivation<br />
step <strong>in</strong> comparison with generic data found <strong>in</strong> commonly used databases.<br />
Cultivation pathways and agricultural work processes are modelled on the basis of current research <strong>in</strong> the<br />
Region. New cropp<strong>in</strong>g practices such as no tillage or direct sow<strong>in</strong>g are be<strong>in</strong>g explored. Mach<strong>in</strong>es and tractor<br />
consumptions are adapted accord<strong>in</strong>g to common practices <strong>in</strong> Wallonia. M<strong>et</strong>hods assess<strong>in</strong>g direct field emissions<br />
relat<strong>in</strong>g to agricultural <strong>in</strong>puts application dur<strong>in</strong>g and after plant production are also closely surveyed,<br />
especially s<strong>in</strong>ce local climate, practices and soil characteristics can have a huge impact on environmental<br />
performances. Other aspects such as <strong>in</strong>puts manufacture and management, and animal feed<strong>in</strong>g and husbandry<br />
are scrut<strong>in</strong>ized too. Downstream of the cultivation step, different conversion processes will be studied, with a<br />
focus on exist<strong>in</strong>g facilities.<br />
7. Socio-economic life cycle assessment<br />
Besides E-<strong>LCA</strong>, a Social Life Cycle Analysis (S-<strong>LCA</strong>) m<strong>et</strong>hodology is be<strong>in</strong>g elaborated <strong>in</strong> order to<br />
evaluate socio-economic impacts of scenarios. S-<strong>LCA</strong> studies currently assess social performances and generally<br />
not proper social impacts (Macombe, Fesch<strong>et</strong> <strong>et</strong> al., 2011). Similarly to E-<strong>LCA</strong>, consequential <strong>LCA</strong><br />
will be used <strong>in</strong> order to evaluate specific social impacts due to decision alternatives. In that case S-<strong>LCA</strong> assesses<br />
social impacts caused by choos<strong>in</strong>g decision alternatives (Jorgensen <strong>et</strong> al., 2011).<br />
The ultimate goal of this study is to contribute to the draw<strong>in</strong>g up of a S-<strong>LCA</strong> m<strong>et</strong>hodology for the Walloon<br />
cereal value cha<strong>in</strong>s. This S-<strong>LCA</strong> aims at answer<strong>in</strong>g the question: “What are the similarities, differences<br />
and future trends <strong>in</strong> terms of added value and work<strong>in</strong>g environment for cereal Walloon cha<strong>in</strong>s?” The scope<br />
<strong>in</strong>cludes the agricultural step down to the first conversion <strong>in</strong> <strong>Food</strong>, Feed, Fuel, Fibre sectors us<strong>in</strong>g Walloon<br />
cereals. At the cultivation level geographical differences will consider crop choice l<strong>in</strong>ked to territorial specificities.<br />
S-<strong>LCA</strong> implies the def<strong>in</strong>ition of a range of particular stakeholders (farmers, firms, workers and local<br />
communities) and workable <strong>in</strong>dicators (number of work-related accidents, employment, tra<strong>in</strong><strong>in</strong>g, qualification,<br />
<strong>et</strong>c.) specific to cereal production. Farmers constitute a specific category because they have a particular<br />
status: they are at the same time consumers, sellers, workers and managers. Based on political priorities, a<br />
m<strong>et</strong>hodology evaluat<strong>in</strong>g wellness from both the economic and social dimensions is be<strong>in</strong>g developed, based<br />
respectively on added value and work time distribution.<br />
Two impact categories are developed for this study: (i) distribution of added value along the agricultural<br />
cha<strong>in</strong> and (ii) work<strong>in</strong>g environment. These impact categories aim at be<strong>in</strong>g as quantifiable as possible because<br />
results are focused on stakeholders of Walloon cereal cha<strong>in</strong>s directly concerned by cereal resources. Added<br />
value is evaluated thanks (i) to regional database of agricultural accounts and (ii) balance she<strong>et</strong>s freely available<br />
for the rest of the actors. Work<strong>in</strong>g environment will be evaluated through the “Bilan Travail” m<strong>et</strong>hodology<br />
(INRA, l'Elevage <strong>et</strong> al., 2008) and thanks to several <strong>in</strong>dicators and <strong>in</strong>terviews. “Bilan Travail” is dedicated<br />
to animal breed<strong>in</strong>g and must therefore be adapted for cereal sectors. “Bilan Travail” estimates work<br />
hours through <strong>in</strong>terviews with farmers and other farm workers, dedicated to (i) rep<strong>et</strong>itive and postponed<br />
work, (ii) seasonal work and (iii) mutual aid work. Available time for adm<strong>in</strong>istrative tasks, leisure time and<br />
others are calculated by the difference b<strong>et</strong>ween legal work<strong>in</strong>g days and days occupied by works listed above.<br />
Others <strong>in</strong>dicators such as numbers of work accidents, employment by value cha<strong>in</strong> or distribution of work<br />
contracts are used.<br />
72
PARALLEL SESSION 1B: TOWARDS LIFE CYCLE SUSTAINABILITY ASSESSMENT 8 th Int. Conference on <strong>LCA</strong> <strong>in</strong> the<br />
Agri-<strong>Food</strong> Sector, 1-4 Oct <strong>2012</strong><br />
8. Expected results<br />
Supported by key m<strong>et</strong>hodological tools such as Life Cycle Analysis and Multi-criteria Analysis applied to<br />
alternative scenarios for cereal resources uses fed with local data, the ALT-4-CER project will provide clues<br />
to answer key questions raised today <strong>in</strong> human Soci<strong>et</strong>ies, such as “What type of agriculture do we want for<br />
tomorrow? Is it <strong>et</strong>hically, environmentally and economically susta<strong>in</strong>able to dedicate cereals resources to<br />
other uses than human food?”<br />
In particular, the project will (i) support Walloon cereal cha<strong>in</strong>s by optimiz<strong>in</strong>g their production and use<br />
choices, (ii) help decision-makers by provid<strong>in</strong>g them with scientific support <strong>in</strong> the draw<strong>in</strong>g of new environmental,<br />
agricultural and energy policies, and (iii) assist the consumer <strong>in</strong> his choices to contribute to susta<strong>in</strong>able<br />
development.<br />
9. References<br />
Bass<strong>et</strong>-Mens, C., 2005. Propositions pour une adaptation de l'Analyse de Cycle de Vie aux systèmes de production agricole - Mise en<br />
oeuvre pour l'évaluation environnementale de la production porc<strong>in</strong>e. Thèse de doctorat INRA. Rennes, Agrocampus Rennes:<br />
244p.<br />
De Boer, I. J. M., 2003. Environmental impact assessment of conventional and organic milk production. Livestock Production Science<br />
80, 69-77.<br />
DGSIE, 2010. SPF Economie - Direction générale statistique <strong>et</strong> <strong>in</strong>formation économique - Recensements agricoles de 1995, 2000,<br />
2005, 2007, 2008, 2009, 2010.<br />
F<strong>in</strong>nveden, G., Hauschild, M. Z., <strong>et</strong> al., 2009. Recent developments <strong>in</strong> Life Cycle Assessment. Journal of Environmental Management<br />
91, 1-21.<br />
Frischknecht, R., Jungbluth, N., <strong>et</strong> al., 2007. Overview and M<strong>et</strong>hodology. eco<strong>in</strong>vent report No. 1. Dübendorf, Swiss Centre for Life<br />
Cycle Inventories.<br />
INRA, Institut de l'Elevage, Florac, SupAgro, 2008. L'organisation du travail en élevage - Enseigner la méthode Bilan Travail -<br />
Guide pédagogique. Dijon.<br />
ISO, 2006. NBN EN ISO 14040:2006 – Management environmental - Analyses de Cycle de Vie - Pr<strong>in</strong>cipes <strong>et</strong> cadre. Geneva, Switzerland,<br />
International Organization of Standardization.<br />
ISO, 2006. NBN EN ISO 14044:2006 - Management environnemental - Analyses du cycle de vie - Exigences <strong>et</strong> lignes directrices,<br />
IBN.<br />
Jørgensen, A., Bocq, A., Nazark<strong>in</strong>a, L., Hauschild, M., 2008. M<strong>et</strong>hodologies for social life cycle assessment. The International Journal<br />
of Life Cycle Assessment 13, 96-103.<br />
Jørgensen, A., <strong>et</strong> al., 2011. The effect of three different S<strong>LCA</strong> m<strong>et</strong>hods. International Sem<strong>in</strong>ar on social <strong>LCA</strong>. Montpellier, Section<br />
for Quantitative Susta<strong>in</strong>bility Assessment. Technical University of Denmark.<br />
Macombe, C., Fesch<strong>et</strong>, P., Garrabé, M., Loeill<strong>et</strong>, D., 2011. 2nd International Sem<strong>in</strong>ar <strong>in</strong> Social Life Cycle Assessment - recent devlopements<br />
<strong>in</strong> assess<strong>in</strong>g the social impacts of product life cycles. The International Journal of Life Cycle Assessment 16, 940-943.<br />
Moras, S., 2007. Analyse comparée du cycle de vie des filières de production d'énergie renouvelable issue de la biomasse. Thèse de<br />
doctorat. Gembloux, Faculté universitaire des Sciences agronomiques: 343p.<br />
R<strong>et</strong>tenmaier, N., Köppen, S., Gärtner, S.O., Re<strong>in</strong>hardt, G.A., 2010. Life cycle assessment of selected future energy crops for Europe.<br />
Biofuels, Bioproducts and Bioref<strong>in</strong><strong>in</strong>g 4, 620-636.<br />
Sneppe, C., 2002. La structure de l’<strong>in</strong>dustrie sucrière. R<strong>et</strong>rieved <strong>in</strong> September 2007, from www.subel.be/emc.asp?pageId=17.<br />
Weidema, B. P., Wenzel H., P<strong>et</strong>ersen, C., Hansen, K., 2004. The Product, Functional Unit and Reference Flows <strong>in</strong> <strong>LCA</strong>. Environmental<br />
News No. 70 2004. Danish M<strong>in</strong>istry of the Environmen. Danish Environmental Protection Agency: 46p.<br />
73
PARALLEL SESSION 1B: TOWARDS LIFE CYCLE SUSTAINABILITY ASSESSMENT 8 th Int. Conference on <strong>LCA</strong> <strong>in</strong> the<br />
Agri-<strong>Food</strong> Sector, 1-4 Oct <strong>2012</strong><br />
Life cycle cost<strong>in</strong>g of farm milk production – cost assessment of carbon<br />
footpr<strong>in</strong>t mitigation strategies<br />
Anne C. Assel<strong>in</strong>-Balençon * , Olivier Jolli<strong>et</strong><br />
School of Public Health (SPH), University of Michigan, 6622 SPH Tower, 1415 Wash<strong>in</strong>gton Heights, Ann Arbor, Michigan 48109-<br />
2029, United States<br />
Correspond<strong>in</strong>g author. E-mail: aassel<strong>in</strong>@umich.edu<br />
ABSTRACT<br />
One po<strong>in</strong>t of concern with the present Life Cycle Cost<strong>in</strong>g (LCC) approach is the arbitrary choice of the discount rate, which does not<br />
differentiate b<strong>et</strong>ween economic objectives and effective economic performance. Here, we propose an alternate m<strong>et</strong>hodology and<br />
apply it to two examples. A multi-year m<strong>et</strong>hod is used to simultaneously assess cumulated cost and impact variations. On the cost<br />
aspect, our m<strong>et</strong>hod assesses the n<strong>et</strong> present value (NPV) of the <strong>in</strong>vestment, as well as its <strong>in</strong>ternal rate of r<strong>et</strong>urn (IRR). We graphically<br />
compare those values to the cumulated environmental impact over the same period. The case studies focus on two energy sav<strong>in</strong>g<br />
alternatives on the farm and the <strong>in</strong>stallation of a digester. The <strong>in</strong>ternal rate of r<strong>et</strong>urn is a synth<strong>et</strong>ic m<strong>et</strong>ric of economic performance<br />
that avoids the arbitrary choice of a discount rate; this <strong>in</strong>dicator can be compared to an economic objective for decision mak<strong>in</strong>g purposes.<br />
Keywords: life cycle cost<strong>in</strong>g, discount rate, life cycle assessment<br />
1. Introduction<br />
Agriculture is a significant contributor to environmental impacts. A study by the University of Arkansas<br />
showed that 70% of the carbon footpr<strong>in</strong>t of US milk occurs at or before the farm gate (Thoma <strong>et</strong> al. <strong>2012</strong>).<br />
Milk is also a significant contributor to water use and land use, as shown by an on-go<strong>in</strong>g comprehensive milk<br />
life cycle study (University of Michigan, 2011).<br />
For decision mak<strong>in</strong>g, however, environmental impact assessment should be consistently complemented<br />
by an economic assessment. Environmental Life Cycle Cost<strong>in</strong>g (LCC), as described <strong>in</strong> the <strong>in</strong>troduction of<br />
Ciroth <strong>et</strong> al. (2008), comb<strong>in</strong>es environmental and economic assessments over the life cycle of the product:<br />
“Environmental life cycle cost<strong>in</strong>g summarizes all costs associated with the life cycle of a product that are<br />
directly covered by one or more of the actors <strong>in</strong> that life cycle; these costs must relate to real money flows.<br />
[…] A complementary life cycle assessment (<strong>LCA</strong>), with equivalent system boundaries and functional units,<br />
is also required, Environmental LCC is performed on a basis analogous to that of <strong>LCA</strong> […].” One of the<br />
most useful features of a comb<strong>in</strong>ed <strong>LCA</strong> and LCC approach is <strong>in</strong> the assessment of a mitigation scenario<br />
relative to a reference situation, enabl<strong>in</strong>g comparison of both costs and environmental impact b<strong>et</strong>ween these<br />
scenarios.<br />
For products with a life time longer than a year, a multi-year assessment has to be performed. Regard<strong>in</strong>g<br />
the cost part, “the use of discounted cash flows for money flows occurr<strong>in</strong>g at different times with<strong>in</strong> a product<br />
life cycle is commonly applied” (Huppes <strong>et</strong> al., 2008) .<br />
One po<strong>in</strong>t of concern of that approach is the arbitrary choice of the time value for money, also known as<br />
the discount rate, which does not differentiate b<strong>et</strong>ween economic objectives and effective economic performance.<br />
On the other hand, the environmental performance (e.g. 20% CO2 saved) is clearly estimated and<br />
reported <strong>in</strong>dependently from the environmental objective ( e.g. objective of 10% m<strong>in</strong>imum impact reduction).<br />
Huppes <strong>et</strong> al. (2008) acknowledges this fact and recommends sensitivity analysis and peer review.<br />
In this paper, we propose an alternate m<strong>et</strong>hodology to avoid the use of discount rate, focus<strong>in</strong>g on three<br />
ma<strong>in</strong> objectives:<br />
1. Elaborate a cost m<strong>et</strong>ric that is <strong>in</strong>dependent of any arbitrary discount rate,<br />
2. Compare consistently environmental and cost performance cumulated over the lif<strong>et</strong>ime of the<br />
equipment<br />
3. Apply the approach to two case studies to d<strong>et</strong>erm<strong>in</strong>e the carbon footpr<strong>in</strong>t and cost performances of<br />
energy sav<strong>in</strong>g equipment and of an anaerobic digester.<br />
2. M<strong>et</strong>hods<br />
2.1. LCC Actors and perspectives<br />
Life cycle cost<strong>in</strong>g summarizes all the costs of the product. It can bear different po<strong>in</strong>ts of view. If we consider<br />
milk, consumers will be concerned with the product cost <strong>in</strong> the r<strong>et</strong>ail shop, and with the costs associated with<br />
milk storage and preparation (e.g. refrigeration cost). The dairy farmer, on the other hand, will account for<br />
the price of feed, dairy <strong>in</strong>frastructure, and equipment, try<strong>in</strong>g to lower his milk production costs and maximize<br />
74
PARALLEL SESSION 1B: TOWARDS LIFE CYCLE SUSTAINABILITY ASSESSMENT 8 th Int. Conference on <strong>LCA</strong> <strong>in</strong> the<br />
Agri-<strong>Food</strong> Sector, 1-4 Oct <strong>2012</strong><br />
his marg<strong>in</strong> on milk sales. The feed producer will be concerned with the cost of land, production <strong>in</strong>puts, and<br />
the possible cost of irrigation, with his goal be<strong>in</strong>g to lower his feed production costs.<br />
The scope of this paper focuses on the perspective of the person that implements the mitigation scenario, <strong>in</strong><br />
this case the dairy farmer. We also aim at look<strong>in</strong>g at reduction <strong>in</strong> costs and impacts associated to mitigation<br />
measures, assess<strong>in</strong>g the relative change rather than the absolute values. Apply<strong>in</strong>g and compar<strong>in</strong>g the different<br />
economic assessment m<strong>et</strong>hods and m<strong>et</strong>rics described below, we thus g<strong>et</strong> an <strong>in</strong>itial estimate of the costs or<br />
sav<strong>in</strong>gs that can be expected from the mitigation scenario.<br />
2.2. Cost assessment approaches and m<strong>et</strong>rics<br />
Two cost assessment approaches were used:<br />
a) The “N<strong>et</strong> present value (NPV)” approach: <strong>in</strong> this case, the producer has to <strong>in</strong>itially <strong>in</strong>vest for the<br />
scenario; dur<strong>in</strong>g operations, the producer may g<strong>et</strong> cost reductions or additional revenues. Us<strong>in</strong>g the<br />
m<strong>et</strong>hod of discounted cash flows, we compute the NPV of the alternate scenario’s costs or sav<strong>in</strong>gs<br />
as:<br />
i LT CFi<br />
Cost NPV (r) <br />
i<br />
i0<br />
( 1<br />
r)<br />
where LT = lif<strong>et</strong>ime of <strong>in</strong>vestment<br />
r = discount rate<br />
CFi= total cash flows of year i<br />
Eq.1<br />
b) The “<strong>in</strong>ternal rate of r<strong>et</strong>urn (IRR)” approach: this m<strong>et</strong>hod is complementary to the cost NPV m<strong>et</strong>hod.<br />
The IRR corresponds to the discount rate that makes the NPV equal to zero.<br />
IRR that makes Cost NPV (IRR) 0<br />
where<br />
Cost<br />
NPV (IRR)<br />
<br />
i LT<br />
<br />
i 0<br />
<br />
<br />
CFi<br />
(1<br />
IRR)<br />
i<br />
0<br />
Eq. 2.<br />
The higher the IRR of a scenario, the more profitable it is. The IRR is directly comparable to the m<strong>in</strong>imum<br />
targ<strong>et</strong> rate of profitability for the scenario. If it is higher than the targ<strong>et</strong>, then it will be acceptable accord<strong>in</strong>g<br />
to the standards of the farmer. If it is lower, then it will not be acceptable accord<strong>in</strong>g to the same<br />
standards. The advantage of the IRR is that it is <strong>in</strong>dependent of the chosen discount rate as well as the <strong>in</strong>terest<br />
rate. It can be compared to the <strong>in</strong>terest rate (e.g. 6%) that represents a break-even situation or to a higher<br />
m<strong>in</strong>imum profitability objective (e.g. 10%). A similar approach can be def<strong>in</strong>ed for the environmental assessment,<br />
clearly separat<strong>in</strong>g performance and objectives for the reduction of environmental impacts.<br />
2.3. Cumulated cost and impact assessment approach<br />
The cost assessment approach is compared to the environmental impact assessment, keep<strong>in</strong>g the two m<strong>et</strong>rics<br />
separate and report<strong>in</strong>g a) the change <strong>in</strong> environmental performance from year 0 to the end of life of the<br />
equipment as a function of b) the correspond<strong>in</strong>g cumulated costs, discounted at the <strong>in</strong>terest rate.<br />
a) The total environmental impact is computed differentially over the lif<strong>et</strong>ime b<strong>et</strong>ween the reference<br />
situation and the alternate situation. It is equal to the sum of the yearly impact differential. Environmental<br />
impacts are not discounted; we assume that a change <strong>in</strong> impacts <strong>in</strong> year n has the same<br />
value as a change <strong>in</strong> impact <strong>in</strong> year zero. Only the carbon footpr<strong>in</strong>t impact is studied <strong>in</strong> this paper.<br />
To ensure consistency, externalities due to reduction <strong>in</strong> GHG emissions are not accounted for <strong>in</strong> the<br />
cost computations, as they are computed and reported separately as environmental impact.<br />
b) The total discounted costs are computed over the lif<strong>et</strong>ime of the <strong>in</strong>vestment with the cost NPV formula<br />
(Eq. 1), with a discount rate, r, equal to a representative long-term loan rate that the farmer<br />
could obta<strong>in</strong> on the mark<strong>et</strong>.<br />
The <strong>in</strong>ternal rate of r<strong>et</strong>urn (IRR) computation (Eq.2) is also computed and reported separately on the graph.<br />
75
PARALLEL SESSION 1B: TOWARDS LIFE CYCLE SUSTAINABILITY ASSESSMENT 8 th Int. Conference on <strong>LCA</strong> <strong>in</strong> the<br />
Agri-<strong>Food</strong> Sector, 1-4 Oct <strong>2012</strong><br />
3. Results and discussion: energy sav<strong>in</strong>g case study<br />
3.1. Description<br />
In 2010, <strong>in</strong> collaboration with Dairy Management Inc., Ensave performed an energy audit of a farm located<br />
<strong>in</strong> New York state. The audit encompassed all sources of energy used for dairy activities, such as electricity,<br />
fuel and propane. The recommendations of the audit were twofold:<br />
Replace exist<strong>in</strong>g light<strong>in</strong>g fixtures with High Performance (HP) T8 fluorescent fixtures or T5 High-<br />
Output (HO) fluorescent fixtures, both especially designed for agriculture applications. These fixtures<br />
and bulbs are more energy efficient.<br />
Replace exist<strong>in</strong>g barn ventilation fans with more energy efficient 36” circulation fans.<br />
This case study assesses the differences <strong>in</strong> GHG impact and <strong>in</strong> costs for those <strong>in</strong>stallations compared to the<br />
reference scenario. Table 1 lists the ma<strong>in</strong> data for the <strong>LCA</strong> computations.<br />
Table 1. <strong>LCA</strong> data for the energy efficient equipment case study<br />
Type of data Value Reference<br />
Total herd 1,710 cows Ensave report<br />
Annual milk production 21,233,225 kg/yr Ensave report- assumed FPCM<br />
GHG impact of electricity 0.84 kg CO2e/kWh Assel<strong>in</strong>-Balençon <strong>et</strong> al., <strong>2012</strong><br />
GHG impact of $1 light<strong>in</strong>g equipment 0.93 kg CO2e/$ produced US 1998 Input Output data for “light<strong>in</strong>g fixtures<br />
and equipment” section<br />
GHG impact of $1 ventilation equipment 0.60 kg CO2e/$ produced US 1998 Input Output data for “electrical”<br />
section (SimaPro databases manual)<br />
76<br />
The cost data used are listed <strong>in</strong> .<br />
Table 2. Most of the specific data come from the Ensave report. Expected lif<strong>et</strong>ime of equipment has been<br />
assessed by expert judgement (farmer, Dec 2011). The discount rate has been s<strong>et</strong> at the long-term <strong>in</strong>terest<br />
rate.<br />
Table 2. Cost characteristics for the energy efficient equipment case study<br />
Unit Light<strong>in</strong>g <strong>in</strong>vestment Ventilation <strong>in</strong>vestment<br />
Cost of <strong>in</strong>vestment $ 39,219 21,700<br />
Expected lif<strong>et</strong>ime Year 10 7<br />
Account<strong>in</strong>g lif<strong>et</strong>ime Year 5 5<br />
Estimated annual energy sav<strong>in</strong>g kWh/year 144,768 34,298<br />
Total electricity consumed on farm <strong>in</strong> kWh/year 1,244,440<br />
reference scenario<br />
Initial price of electricity $/kWh $0.073 (Ensave, 2010)<br />
Discount rate= Long term <strong>in</strong>terest rate % 6<br />
Annual <strong>in</strong>flation (2001-2011) % 2.5 (U.S. DoL, <strong>2012</strong>)<br />
Annual variation of electricity price<br />
(2000-2010)<br />
3.2. Cumulated results and N<strong>et</strong> Present Values<br />
% 3.7 (U.S. EIA, <strong>2012</strong>)<br />
The cumulated costs and carbon footpr<strong>in</strong>t differentials are shown <strong>in</strong> Fig. 1. Year 0 represents the year of<br />
<strong>in</strong>vestment. There is a positive carbon footpr<strong>in</strong>t differential due to the manufactur<strong>in</strong>g of the new equipment,<br />
and a positive cost differential due to the cost of the new equipment. Year after year, the new equipment<br />
generates energy sav<strong>in</strong>gs, which translates <strong>in</strong>to both cost and carbon footpr<strong>in</strong>t sav<strong>in</strong>gs; those sav<strong>in</strong>gs are<br />
cumulated. For the year equal to the lif<strong>et</strong>ime of the <strong>in</strong>vestment, the f<strong>in</strong>al datapo<strong>in</strong>t gives the total cumulated<br />
cost and impact for the scenario.
PARALLEL SESSION 1B: TOWARDS LIFE CYCLE SUSTAINABILITY ASSESSMENT 8 th Int. Conference on <strong>LCA</strong> <strong>in</strong> the<br />
Agri-<strong>Food</strong> Sector, 1-4 Oct <strong>2012</strong><br />
Figure 1. Cumulative carbon footpr<strong>in</strong>t as a function of the cumulated discounted costs at the long term <strong>in</strong>terest<br />
rate, differentiated over the expected lif<strong>et</strong>ime of <strong>in</strong>vestment. The correspond<strong>in</strong>g <strong>in</strong>ternal rate of r<strong>et</strong>urn<br />
(IRR) is given below the f<strong>in</strong>al cumulated value at end of life.<br />
Over the lif<strong>et</strong>ime of the <strong>in</strong>vestment, the ventilation equipment presents a discounted cumulated profit of<br />
$9,000, equal to 40% of the <strong>in</strong>itial <strong>in</strong>vestment cost. The IRR of this <strong>in</strong>vestment is equal to 13%. It also generates<br />
a significant reduction <strong>in</strong> GHG of nearly 300 tons CO2e over the lif<strong>et</strong>ime of the equipment.<br />
The light<strong>in</strong>g equipment reaches the economic break-even po<strong>in</strong>t early, at year 3. Over the lif<strong>et</strong>ime of the<br />
equipment, it generates a discounted cumulated profit (NPV) of $ 54,000, equal to 137% of the <strong>in</strong>itial <strong>in</strong>vestment<br />
cost. The IRR of this <strong>in</strong>vestment is very high at 36%. The effect on the reduction of GHG is over<br />
800 tons of CO2e over 7 years. We can graphically see that the light<strong>in</strong>g <strong>in</strong>vestment is economically more<br />
<strong>in</strong>terest<strong>in</strong>g than for the ventilation equipment. This difference is directly reflected <strong>in</strong> the IRR. The ventilation<br />
scenario’s IRR is 13%, whereas the light<strong>in</strong>g IRR is 36%. However, both scenarios generate a profit over<br />
their lif<strong>et</strong>ime, and this can be identified by the fact that their IRR is above the discount rate of 6%. A scenario<br />
with an IRR equal to 6% would generate a cumulated profit equal to zero. A typical m<strong>in</strong>imum expected<br />
rate of r<strong>et</strong>urn is 10%.<br />
The discount rate value selected has an important <strong>in</strong>fluence on the assessment of economic performance; <strong>in</strong><br />
most cases, most of the costs occur <strong>in</strong> the first years, and most of the benefits occur <strong>in</strong> the follow<strong>in</strong>g years.<br />
On the graph, the discount rate is taken equal to the long-term <strong>in</strong>terest rate, so that the yearly evolution represents<br />
the effective ga<strong>in</strong> or loss actualised at year 0. This is equal to a n<strong>et</strong> present value of $ 54,000 for the<br />
light<strong>in</strong>g and $9,000 for the ventilation. A higher discount rate of e.g. 10% can lower the economic benefit of<br />
the use phase and would lead to a lower n<strong>et</strong> present value of $41,000 for the light<strong>in</strong>g and $3,500 for the ventilation.<br />
The advantage of calculat<strong>in</strong>g the <strong>in</strong>ternal rate of r<strong>et</strong>urn is that it is <strong>in</strong>dependent of the arbitrary choice<br />
of a discount rate.<br />
4. Discussion and sensitivity study for the energy sav<strong>in</strong>g case study<br />
Two ma<strong>in</strong> param<strong>et</strong>ers directly <strong>in</strong>fluence the profitability of the scenario: the expected lif<strong>et</strong>ime of the<br />
equipment and the price of electricity. We study the sensitivity of the IRR to different values of these param<strong>et</strong>ers,<br />
vary<strong>in</strong>g them from low to high lif<strong>et</strong>imes, and from low to high electricity price. Table 3 compiles<br />
the result<strong>in</strong>g <strong>in</strong>ternal rates of r<strong>et</strong>urn.<br />
Table 3. IRR of the scenarios with vary<strong>in</strong>g equipment lif<strong>et</strong>ime and electricity price.<br />
Light<strong>in</strong>g Ventilation<br />
Low Base case High Low Base case High<br />
Estimated lif<strong>et</strong>ime 5 years 7 years 10 years 7 years 10 years 12 years<br />
Price of<br />
electricity<br />
$0.07/kWh 13% 22% 27% -3% 6% 9%<br />
$0.10/kWh 29% 36% 40% 6% 13% 16%<br />
$0.12/kWh 39% 45% 48% 12% 18% 20%<br />
For light<strong>in</strong>g, the IRR of 36% is much higher than the long-term <strong>in</strong>terest rate of 6%, and is thus f<strong>in</strong>ancially<br />
very <strong>in</strong>terest<strong>in</strong>g; this scenario rema<strong>in</strong>s of <strong>in</strong>terest for shorter lif<strong>et</strong>imes and/or for lower electricity prices.<br />
The IRR is very sensitive to a lower price of electricity: it drops to 22% if the price of electricity is lower by<br />
77
PARALLEL SESSION 1B: TOWARDS LIFE CYCLE SUSTAINABILITY ASSESSMENT 8 th Int. Conference on <strong>LCA</strong> <strong>in</strong> the<br />
Agri-<strong>Food</strong> Sector, 1-4 Oct <strong>2012</strong><br />
30%, down to $0.07 per kWh, and even to 13% if the life time is equal to 5 years. For ventilation, the IRR is<br />
lower. Three cases have an IRR lower than the long-term <strong>in</strong>terest rate of 6%, and among them, one has a<br />
negative IRR. It is crucial for the farmer to ensure a longer lif<strong>et</strong>ime and a higher price of electricity to avoid<br />
los<strong>in</strong>g money.<br />
The longer the expected lif<strong>et</strong>ime, the higher the IRR. However, this lif<strong>et</strong>ime must be consistent with the<br />
technical characteristics of the project. If one chooses a higher expected lif<strong>et</strong>ime, he has to account for additional<br />
ma<strong>in</strong>tenance or repair costs that will be needed. In order to avoid this distortion, we propose to use the<br />
most likely expected lif<strong>et</strong>ime rather than a conservative lif<strong>et</strong>ime often used <strong>in</strong> f<strong>in</strong>ancial account<strong>in</strong>g m<strong>et</strong>hod.<br />
Sensitivity analysis on this variable can also be carried out.<br />
5. Results and discussion: Digester case study<br />
This section provides a summary of results for a second case study based on a dairy farm of 1100 cows<br />
located <strong>in</strong> upstate New York. In the scenario, the farm changes from slurry manure storage <strong>in</strong> a top-loaded<br />
open tank that would be emptied every 4 to 6 months to a 200 MW anaerobic digester, produc<strong>in</strong>g electricity<br />
and sell<strong>in</strong>g it to the grid.<br />
We study two revenue scenarios: low and high. In the low scenario, the equipment is f<strong>in</strong>anced by the<br />
farmer, and the price of electricity is an average mark<strong>et</strong> price of 0.11 $/kWh. In the high scenario, we added<br />
an up-front grant, and we model a higher price of electricity of 0.17 $/kWh, which could be anticipated <strong>in</strong> the<br />
future. The impact reduction from the electricity generated by the digester was accounted for through a system<br />
expansion and the substitution of an average US electricity mix.<br />
Table 4 presents the ma<strong>in</strong> assumptions and results of this study. The low revenue scenario does not reach<br />
a profit over the lif<strong>et</strong>ime of the equipment: the NPV of the scenario is equal to $-540,000; this is also reflected<br />
<strong>in</strong> its IRR, equal to 2% and hence lower than the discount rate of 6%. Conversely, the high revenue<br />
scenario is profitable, and displays a profitable NPV equal to $1,020,000 ; its IRR is equal to 16%, well<br />
above the discount rate. Both scenarios generate a reduction of GHG of 45 million tons CO2e.<br />
Table 4. Ma<strong>in</strong> assumptions and results <strong>in</strong> the anaerobic digester case study<br />
Scenario Low revenue High revenue Units<br />
Initial <strong>in</strong>vestment 1,467,000 $<br />
Upfront grant 0 35 % of <strong>in</strong>vestment<br />
Estimated lif<strong>et</strong>ime 20 20 year<br />
Discount rate =long term <strong>in</strong>terest rate 6 %<br />
Annual electricity produced 1,090,953 kWh/year<br />
Price of electricity 0.11 0.17 $/kWh<br />
Carbon footpr<strong>in</strong>t of US electricity production 0.73 (Rotz <strong>et</strong> al., 2011) kg CO2e / kWh<br />
N<strong>et</strong> present value (at long term <strong>in</strong>terest rate) of -540,000 + 1,020,000 $<br />
78<br />
total costs and revenues over lif<strong>et</strong>ime<br />
IRR 2 16 %<br />
total carbon footpr<strong>in</strong>t differential over lif<strong>et</strong>ime 45 million tons CO2e<br />
This case study also displays how the economic profitability depends on the background economic condition;<br />
namely the grant amount and the price of electricity. In both cases, the reduction <strong>in</strong> greenhouse gases is<br />
significant.<br />
6. Conclusion<br />
In LCC, the <strong>in</strong>ternal rate of r<strong>et</strong>urn enables a direct and straightforward m<strong>et</strong>ric for the economic performance<br />
of a scenario. Compared to the NPV m<strong>et</strong>hod, it avoids the arbitrary choice of a discount rate. The higher the<br />
IRR, the more profitable the scenario. The IRR can be directly compared to the long-term <strong>in</strong>terest rate as a<br />
break-even po<strong>in</strong>t for profitability. The IRR can also be compared with a higher f<strong>in</strong>ancial objective of, e.g.,<br />
10% to assess the f<strong>in</strong>ancial <strong>in</strong>terest of the <strong>in</strong>vestment over its lif<strong>et</strong>ime; if the IRR is lower, the scenario is<br />
below the objective, and may not be f<strong>in</strong>ancially <strong>in</strong>terest<strong>in</strong>g.<br />
D<strong>et</strong>erm<strong>in</strong>ation of the IRR has to be carefully done: specific care has to be taken <strong>in</strong> def<strong>in</strong><strong>in</strong>g the cost data, and<br />
especially the lif<strong>et</strong>ime of the <strong>in</strong>vestment and the most important revenue sources.<br />
In the LCC context, the IRR m<strong>et</strong>ric can be comb<strong>in</strong>ed with the cumulated impact assessment, provid<strong>in</strong>g decision<br />
makers with a comprehensive performance measurement, both environmental and f<strong>in</strong>ancial.
PARALLEL SESSION 1B: TOWARDS LIFE CYCLE SUSTAINABILITY ASSESSMENT 8 th Int. Conference on <strong>LCA</strong> <strong>in</strong> the<br />
Agri-<strong>Food</strong> Sector, 1-4 Oct <strong>2012</strong><br />
7. Acknowledgements<br />
This work was funded by the Innovation Center for U.S. Dairy. We would like to thank Marty Heller of<br />
University of Michigan for his constructive comments and careful read<strong>in</strong>g.<br />
8. References<br />
Assel<strong>in</strong>-Balençon A. C., Popp J., Henderson A., Heller M., Thoma G., Jolli<strong>et</strong> O., <strong>2012</strong>. Dairy farm greenhouse gas impacts: a parsimonious<br />
model for a farmer’s decision support tool. Int.Dairy J. Submitted.<br />
Ciroth A., Huppes G., Klopffer W., Rudenauer I., Steen B., Swarr T., 2008. Executive Summary <strong>in</strong> : Hunkeler D., Lichtenvort K.,<br />
Rebitzer G. (Eds.), Environmental Life Cycle Cost<strong>in</strong>g. S<strong>et</strong>ac, New York, US. Page xxvii.<br />
Ensave, 2010. Ensave Farm Energy Audit Report (Spruce Haven) September 2010. Audit f<strong>in</strong>anced by Dairy Management Inc.<br />
Huppes G., Ciroth A., Lichtenvort K., Rebitzer G. Schmitdt W., Seur<strong>in</strong>g S. 2008. Modell<strong>in</strong>g for life cycle cost<strong>in</strong>g <strong>in</strong> : Hunkeler D.,<br />
Lichtenvort K., Rebitzer G. (Eds.), Environmental Life Cycle Cost<strong>in</strong>g. S<strong>et</strong>ac, New York, US. Pages 17-34.<br />
Rotz, C. Alan, Michael S. Corson, Dawn S. Chianese, and Col<strong>et</strong>te U. Co<strong>in</strong>er. 2011. The Integrated Farm System Model (IFSM):<br />
Reference Manual Version 3.4. Wash<strong>in</strong>gton, DC, USA: Pasture Systems and Watershed Management Research Unit - Agricultural<br />
Research Service - United States Department of Agriculture. http://www.ars.usda.gov/ma<strong>in</strong>/docs.htm?docid=8519.<br />
Thoma, G., Popp, J., Shonnard, D. R., Nutter, D., Ulrich, R., Matlock, M. M., …Mayes, A., <strong>2012</strong>. Greenhouse Gas Emissions from<br />
Milk Production and Consumption <strong>in</strong> the United States: A cradle to grave life cycle assessment circa 2008. Int.Dairy J. Submitted.<br />
U.S. DoL (Department of Labor), <strong>2012</strong>. Bureau of Labor Statistics. Consumer Price Index, All Urban Consumers - (CPI-U), U.S.<br />
city average, All items. ftp://ftp.bls.gov/pub/special.requests/cpi/cpiai.txt<br />
U.S. EIA (Energy Information Adm<strong>in</strong>istration), <strong>2012</strong>. Electric Power Annual 2010. Table ES1.<br />
http://www.eia.gov/electricity/annual/<br />
79
PARALLEL SESSION 1B: TOWARDS LIFE CYCLE SUSTAINABILITY ASSESSMENT 8 th Int. Conference on <strong>LCA</strong> <strong>in</strong> the<br />
Agri-<strong>Food</strong> Sector, 1-4 Oct <strong>2012</strong><br />
Compar<strong>in</strong>g <strong>in</strong>tegral susta<strong>in</strong>ability performance of conventional farms<br />
with farms focuss<strong>in</strong>g on <strong>in</strong>ternal recycl<strong>in</strong>g of nutrients<br />
80<br />
Mark A. Dolman 1,2,* , Marthijn P.W. Sonneveld 3 , Herman Mollenhorst 2,4 , Imke J.M. de Boer 2<br />
1 Agriculture Economics Research Institute, part of Wagen<strong>in</strong>gen University and Research centre, The Hague, The N<strong>et</strong>herlands<br />
2 Animal Production Systems Group, Wagen<strong>in</strong>gen University, Wagen<strong>in</strong>gen, The N<strong>et</strong>herlands<br />
3 Soil Geography and Landscape Group, Wagen<strong>in</strong>gen University, Wagen<strong>in</strong>gen, The N<strong>et</strong>herlands<br />
4 Bus<strong>in</strong>ess Economics Group, Wagen<strong>in</strong>gen University, Wagen<strong>in</strong>gen, The N<strong>et</strong>herlands<br />
Correspond<strong>in</strong>g author. E-mail: mark.dolman@wur.nl<br />
ABSTRACT<br />
Susta<strong>in</strong>able milk production systems require economically viable, environmentally sound and socially acceptable practices. We<br />
compared susta<strong>in</strong>ability <strong>in</strong>dicators of a group of conventional farms with a group of farms aim<strong>in</strong>g at improved <strong>in</strong>ternal nutrient cycle<br />
(INC) on their farm. Economic performance was based on n<strong>et</strong> farm <strong>in</strong>come (NFI) and labour productivity. Environmental performance<br />
<strong>in</strong>dicators were derived from a cradle-to-farm-gate life cycle assessment, i.e., land occupation (LO), non-renewable energy use<br />
(NREU), global warm<strong>in</strong>g potential (GWP), acidification potential (AP) and eutrophication potential (EP). Moreover, soil- and water<br />
quality were monitored. Soci<strong>et</strong>al performance was quantified with payments for ecosystem services, graz<strong>in</strong>g hours and penalties for<br />
aberrant milk composition. INC farms positively differ from conventional farms <strong>in</strong> a lower non-renewable energy use, higher soil<br />
organic carbon and receiv<strong>in</strong>g higher payments for ecosystem services, without compromis<strong>in</strong>g on economic performance. High standard<br />
deviations for other <strong>in</strong>dicators suggest that differences with<strong>in</strong> both groups are mostly higher than b<strong>et</strong>ween groups.<br />
Keywords: susta<strong>in</strong>ability, FADN, dairy farm<strong>in</strong>g, nutrient cycl<strong>in</strong>g<br />
1. Introduction<br />
A commonly used def<strong>in</strong>ition on susta<strong>in</strong>ability is to me<strong>et</strong> the needs of current generations without<br />
compromis<strong>in</strong>g the ability of future generations to me<strong>et</strong> their needs and aspirations (WCED, 1987).<br />
Susta<strong>in</strong>able milk production systems require economically viable, environmentally sound and socially<br />
acceptable practices (Thomassen <strong>et</strong> al., 2009). Besides deliver<strong>in</strong>g mark<strong>et</strong>able products, the delivery of<br />
products and services related to the quality of the environment, i.e. ecosystem services, is becom<strong>in</strong>g<br />
<strong>in</strong>creas<strong>in</strong>gly important. Such services <strong>in</strong>clude the value of the landscape and the contribution to biodiversity,<br />
water storage and supply of clean groundwater (MEA, 2005). Soil quality is a key aspect with respect to<br />
ecosystem services (Benn<strong>et</strong> <strong>et</strong> al., 2010). Land use by agriculture, however, rapidly <strong>in</strong>tensified, caus<strong>in</strong>g<br />
d<strong>et</strong>erioration of soil structure, impoverishment of the soil and a decl<strong>in</strong>e <strong>in</strong> soil organic matter (EU, 2006).<br />
This d<strong>et</strong>erioration of soil quality threatens the future food production and other important ecosystem<br />
services. The supply of ecosystem services <strong>in</strong> the N<strong>et</strong>herlands is orig<strong>in</strong>at<strong>in</strong>g from specific landscapes, for<br />
example the National Landscape ‘Noordelijke Friese Wouden (NFW)’ <strong>in</strong> the North of the N<strong>et</strong>herlands.<br />
Several farmers <strong>in</strong> this area follow a farm<strong>in</strong>g practice, aim<strong>in</strong>g at an improved <strong>in</strong>ternal nutrient cycle (INC) on<br />
their farm. In order to m<strong>in</strong>imize use of external <strong>in</strong>puts, INC farms focus on optimiz<strong>in</strong>g use of on-farm<br />
available resources, for example, soil organic matter, nutrients from manure and home-grown feed<br />
production (Van Hees <strong>et</strong> al., 2009). INC farms, therefore, can make a significant contribution to preservation<br />
of food produc<strong>in</strong>g capacity, while additionally produc<strong>in</strong>g ecosystem services. An <strong>in</strong>tegral assessment that<br />
quantifies the effect caused by this INC approach, however, is never performed. Several studies have<br />
assessed the environmental performance of INC farms <strong>in</strong> the past (Sonneveld <strong>et</strong> al., 2008). So far, however,<br />
no life cycle assessment (<strong>LCA</strong>) of INC farms has been performed. Moreover, an <strong>in</strong>tegral assessment,<br />
<strong>in</strong>clud<strong>in</strong>g economic, environmental, and soci<strong>et</strong>al <strong>in</strong>dicators has never been performed.<br />
The objective of this study, therefore, is to quantify the economic, environmental and soci<strong>et</strong>al<br />
performance of INC farms <strong>in</strong> the NFW and, secondly, benchmark with a conventional milk production<br />
system comparable <strong>in</strong> terms of farm size, <strong>in</strong>tensity and site-specific circumstances.<br />
2. M<strong>et</strong>hods<br />
2.1. Data<br />
Data needed to quantify economic, environmental and soci<strong>et</strong>al <strong>in</strong>dicators of farms were derived from the<br />
farm accountancy data n<strong>et</strong>work (FADN) and the M<strong>in</strong>erals Policy Monitor<strong>in</strong>g Programme. We quantified a<br />
two-year average susta<strong>in</strong>ability performance of n<strong>in</strong>e INC farms (2008-2009). For every INC farm, a conventional<br />
‘mirror-farm’ was composed from farms <strong>in</strong> FADN, us<strong>in</strong>g statistical match<strong>in</strong>g. Central assumption for<br />
statistical match<strong>in</strong>g is that farms resembl<strong>in</strong>g for the imputation variables, also resemble for the goal variables,<br />
<strong>in</strong> this case susta<strong>in</strong>ability performance <strong>in</strong>dicators (Vrolijk <strong>et</strong> al., 2005). For every INC farm, ten similar
PARALLEL SESSION 1B: TOWARDS LIFE CYCLE SUSTAINABILITY ASSESSMENT 8 th Int. Conference on <strong>LCA</strong> <strong>in</strong> the<br />
Agri-<strong>Food</strong> Sector, 1-4 Oct <strong>2012</strong><br />
conventional farms were selected, i.e., nearest neighbours, based on farm size (fat and prote<strong>in</strong> corrected milk<br />
(FPCM) production), <strong>in</strong>tensity (FPCM production per ha) and site-specific circumstances, i.e., soil nitrogen<br />
supply level, percentage of sandy, peat or clay soil, and percentage of poorly, moderately well or well<br />
dra<strong>in</strong>ed land. The ten farms selected per INC farm, are scaled to one, so they make up one farm match<strong>in</strong>g<br />
one INC farm.<br />
2.2. Economic performance<br />
To quantify economic performance we quantified n<strong>et</strong> farm <strong>in</strong>come (NFI) and labour productivity. NFI is<br />
often used as an <strong>in</strong>dicator for profitability (Dekker <strong>et</strong> al., 2011, Shadbolt <strong>et</strong> al., 2009, Blank <strong>et</strong> al., 2009, Van<br />
Calker <strong>et</strong> al., 2008). We def<strong>in</strong>ed NFI as the remuneration for management, family labour and capital that is<br />
left after all other costs are paid. To correct for differences <strong>in</strong> farm size we expressed NFI per 100 kg FPCM.<br />
NFI, however, does not account for <strong>in</strong>put of family labour. To give <strong>in</strong>sight <strong>in</strong> the labour effort to realise the<br />
NFI, a measure of labour productivity is required. Labour productivity is a ratio of a volume of output per<br />
unit of labour <strong>in</strong>put (OECD, 2001). To enable a comparison of labour productivity <strong>in</strong> hours of labour among<br />
farms differ<strong>in</strong>g <strong>in</strong> scale, we expressed labour productivity <strong>in</strong> m<strong>in</strong>utes of labour also per 100 kg FPCM.<br />
2.3. Environmental performance<br />
The environmental performance of farms was based on <strong>in</strong>dicators derived from a cradle-to-farm-gate<br />
<strong>LCA</strong>, i.e., land occupation (LO), non-renewable energy use (NREU), global warm<strong>in</strong>g potential (GWP),<br />
acidification potential (AP) and eutrophication potential (EP), expressed per unit of FPCM. All farms were<br />
highly specialised dairy farms, without other types of animal production. We performed an attributional<br />
<strong>LCA</strong>. Whenever a multifunctional process occurred, economic allocation was used. For EP and AP we took<br />
characterisation factors from Heijungs <strong>et</strong> al., (1992), for GWP from IPCC (2007).<br />
Production of feed<br />
On average, 71% of all feed was home grown for the farms <strong>in</strong> this study. All home grown feed was sampled.<br />
Furthermore, all non-mon<strong>et</strong>ary <strong>in</strong>put of pesticides, fertilisers, water, and energy was recorded <strong>in</strong><br />
FADN, as well as the application m<strong>et</strong>hod and quantity of the animal manure (at field level). In the N<strong>et</strong>herlands,<br />
farms are obliged to use low-emission techniques to apply animal slurry to the land. In the past, INC<br />
farms have received a temporary exempt from this regulation because of assumed lower ammonia losses<br />
under their specific practices. For each farm, d<strong>et</strong>ailed <strong>in</strong>formation on purchased feed was available, i.e. exact<br />
quantity used per feed product, and dry matter (DM), energy (VEM), nitrogen (N) and phosphorus (P) contents.<br />
The average composition of compound concentrates (i.e. ma<strong>in</strong> feed type) was based on monthly publications<br />
of Nevedi (2008-2009). For each feed <strong>in</strong>gredient used, the environmental impact of crop cultivation,<br />
process<strong>in</strong>g and transport was based on Thomassen <strong>et</strong> al., (2009) and additional empirical data, literature or<br />
expertise from feed process<strong>in</strong>g companies.<br />
Farm specific excr<strong>et</strong>ion and gaseous losses<br />
For each <strong>in</strong>dividual farm, we computed the excr<strong>et</strong>ion of N and P via manure by subtract<strong>in</strong>g N and P fixed<br />
<strong>in</strong> milk and animals from the total uptake of N and P <strong>in</strong> feed. Uptake of non-grass products was known. In<br />
order to quantify the <strong>in</strong>take of grass, the energy requirement of dairy cattle was computed per farm, based on<br />
the level of milk production, breed, pastur<strong>in</strong>g and hous<strong>in</strong>g system and number of animals <strong>in</strong>clud<strong>in</strong>g young<br />
stock. Grass <strong>in</strong>take was computed by subtract<strong>in</strong>g the energy uptake from non-grass feed from total energy<br />
requirement. Subsequently, the energy uptake from grass was converted <strong>in</strong>to N and P uptake, based on the<br />
energy-nutrient ratio. The fixation of N and P <strong>in</strong> milk and animals was subtracted from the total uptake, result<strong>in</strong>g<br />
<strong>in</strong> the gross N and P excr<strong>et</strong>ion (Anonymous, 2010a). Subsequently, for each farm gaseous N losses<br />
were computed based on the total ammoniacal nitrogen (TAN) <strong>in</strong> manure. We assumed a TAN value of 68%<br />
and 77% of the m<strong>in</strong>eral N for dairy slurry <strong>in</strong> respectively the w<strong>in</strong>ter and summer period. (Van Bruggen <strong>et</strong> al.,<br />
2011). Emission of NH3 was assumed to depend on hous<strong>in</strong>g system (Anonymous, 2010b). The NH3-emission<br />
factor varied b<strong>et</strong>ween 10.9 and 15.4% of TAN <strong>in</strong> the w<strong>in</strong>ter period, whereas <strong>in</strong> the summer period it varied<br />
b<strong>et</strong>ween 10.1 and 31.0%. Emissions of NOx and N2O were computed as 0.3% of TAN <strong>in</strong> manure for all<br />
hous<strong>in</strong>g systems (Velthof <strong>et</strong> al., 2010; Oenema <strong>et</strong> al., 2000). Emissions <strong>in</strong> the pasture were computed based<br />
on Velthof <strong>et</strong> al., (2010) and us<strong>in</strong>g the farm specific manure production and an emission factor of 3.5% of<br />
TAN for NH3.<br />
81
PARALLEL SESSION 1B: TOWARDS LIFE CYCLE SUSTAINABILITY ASSESSMENT 8 th Int. Conference on <strong>LCA</strong> <strong>in</strong> the<br />
Agri-<strong>Food</strong> Sector, 1-4 Oct <strong>2012</strong><br />
On-farm soil and water quality <strong>in</strong>dicators<br />
To quantify site-specific impacts, we d<strong>et</strong>erm<strong>in</strong>ed on-farm AP and EP per hectare and measured on-farm<br />
field param<strong>et</strong>ers, i.e., soil organic matter (0-10 cm (%)), soil phosphorus content (P-Al, mg/100 gram soil)<br />
and soil nitrogen supply (kg/ha). Moreover, phosphate and nitrate concentrations <strong>in</strong> the upper groundwater<br />
(mg/l) were monitored. Soil organic matter has a positive effect on water supply, soil structure and nutrient<br />
availability. The P-Al number is a measure of the capacity of the soil to supply phosphorus (P) and gives a<br />
rough <strong>in</strong>dication of the level of P-saturation and thus the amount of P that potentially may be lost to the environment.<br />
The soil nitrogen supply is a measure of the N-supply <strong>in</strong> an unfertilised situation.<br />
2.4. Soci<strong>et</strong>al performance<br />
We quantified soci<strong>et</strong>al performance us<strong>in</strong>g three <strong>in</strong>dicators: payments for ecosystem services (Euro/ha),<br />
graz<strong>in</strong>g (hours/cow) and penalties for aberrant milk composition (%). Data on work<strong>in</strong>g conditions and landscape<br />
quality are not available <strong>in</strong> FADN, and, therefore, not <strong>in</strong>cluded (Van der Veen <strong>et</strong> al., 2006). Payment<br />
for ecosystem services is regarded here as a proxy for the farmers’ <strong>in</strong>vestment (time or money), for nature<br />
conservation or bird protection. The number of penalty cases is provided as a measure of food saf<strong>et</strong>y. Farmers<br />
g<strong>et</strong> a penalty when the milk conta<strong>in</strong>s high somatic cell, or bacterial counts. The number of hours graz<strong>in</strong>g<br />
is <strong>in</strong>cluded as an <strong>in</strong>dicator for welfare and social perception. We acknowledge that pasture hours is a simple<br />
<strong>in</strong>dicator for welfare. Current FADN does not have the potential to assess animal welfare us<strong>in</strong>g preferred<br />
animal-based <strong>in</strong>dicators, such as, the Welfare Quality Protocol (De Vries <strong>et</strong> al., 2011; Welfare quality, 2009).<br />
3. Results<br />
3.1. Descriptive<br />
Both groups of farms were comparable <strong>in</strong> terms of farm size, <strong>in</strong>tensity and milk production (Table 1). The<br />
proportion of grassland for INC farms was significantly higher (P< 0.05) than for conventional farms. The<br />
conventional farms only had sandy and clay soils, INC farms had a small proportion of peat soil as well<br />
(P
PARALLEL SESSION 1B: TOWARDS LIFE CYCLE SUSTAINABILITY ASSESSMENT 8 th Int. Conference on <strong>LCA</strong> <strong>in</strong> the<br />
Agri-<strong>Food</strong> Sector, 1-4 Oct <strong>2012</strong><br />
FPCM for most <strong>LCA</strong> <strong>in</strong>dicators, these differences were not significant. High standard deviations <strong>in</strong>dicate<br />
that differences with<strong>in</strong> groups are higher than b<strong>et</strong>ween groups. For example, the coefficient of variation for<br />
the nitrate and phosphorus concentration, is higher than 100% for both groups. INC farms did perform significantly<br />
b<strong>et</strong>ter than conventional farms regard<strong>in</strong>g soil organic carbon (P
PARALLEL SESSION 1B: TOWARDS LIFE CYCLE SUSTAINABILITY ASSESSMENT 8 th Int. Conference on <strong>LCA</strong> <strong>in</strong> the<br />
Agri-<strong>Food</strong> Sector, 1-4 Oct <strong>2012</strong><br />
lated with economic and environmental performance. Moreover, only n<strong>in</strong>e INC farms were assessed. A<br />
higher number of farms is needed to improve robustness of compar<strong>in</strong>g the INC farm<strong>in</strong>g system, with conventional<br />
practices, especially consider<strong>in</strong>g the fact that variability with<strong>in</strong> the groups was substantial.<br />
For economic performance, no significant differences were seen. However, NFI was 44% higher for INC<br />
farms. High standard deviations <strong>in</strong>dicated that differences with<strong>in</strong> groups were higher than b<strong>et</strong>ween groups. It<br />
is common that economic performance differs highly among farms. There are also large fluctuations b<strong>et</strong>ween<br />
the years, which also affects the outcomes of our analyses. The year 2008 was a relatively prosperous year,<br />
whereas 2009 showed the lowest <strong>in</strong>come over the last decade (De Bont <strong>et</strong> al., 2009). INC farms received a<br />
higher <strong>in</strong>come due to higher payments from bird protection programmes and used a higher amount of own<br />
labour, which was not <strong>in</strong>cluded <strong>in</strong> NFI.<br />
For environmental performance, INC farms outperformed conventional farms on energy use and SOC.<br />
Us<strong>in</strong>g above-ground spread<strong>in</strong>g for slurry expla<strong>in</strong>s a lower on-farm energy use, because of lower diesel consumption<br />
application technique. On-farm acidification potential was expected to be higher due to a higher<br />
emission factor for aboveground spread<strong>in</strong>g. INC farms, however, applied less artificial fertiliser and had a<br />
hous<strong>in</strong>g system with a lower emission factor, compensat<strong>in</strong>g the higher emission of apply<strong>in</strong>g animal manure.<br />
SOC was significantly higher for INC farms, partly because these farms were reluctant <strong>in</strong> apply<strong>in</strong>g regular<br />
grassland renovation. Results from other studies however also show that SOC contents are strongly controlled<br />
by soil type, dra<strong>in</strong>age level and land use history, factors which are site-specific. Thus, the differences<br />
b<strong>et</strong>ween both groups with respect to SOC content cannot purely be related to differences <strong>in</strong> current farm<br />
management.<br />
For soci<strong>et</strong>al performance, current FADN does not have the potential to assess animal welfare us<strong>in</strong>g preferred<br />
animal-based <strong>in</strong>dicators. Pasture hours, therefore, were used as an <strong>in</strong>direct <strong>in</strong>dicator for animal welfare.<br />
This <strong>in</strong>dicator showed no differences b<strong>et</strong>ween both farm types. INC farms significantly differed from<br />
conventional farms for received payments on ecosystem services. These payments, however, did not reflect<br />
the actual ga<strong>in</strong> <strong>in</strong> improved soci<strong>et</strong>al performance. A b<strong>et</strong>ter <strong>in</strong>dicator should be area based, or express<strong>in</strong>g biodiversity,<br />
e.g. number of plant species, or number of birds. The INC farms aims for improved nutrient cycl<strong>in</strong>g,<br />
by mak<strong>in</strong>g use of all available resources on-farm. This approach goes along with social <strong>in</strong>volvement<br />
and entrepreneurial complacency. These values, however, were not <strong>in</strong>cluded <strong>in</strong> this assessment.<br />
5. Conclusion<br />
INC farms positively differ from conventional farms <strong>in</strong> a lower non-renewable energy use, higher soil organic<br />
carbon and receiv<strong>in</strong>g higher payments for ecosystem services, without compromis<strong>in</strong>g on their economic<br />
performance. However, significant differences b<strong>et</strong>ween INC farms were limited, despite INC farm<br />
follow a farm<strong>in</strong>g practice aim<strong>in</strong>g at optimiz<strong>in</strong>g use of on-farm available resources. Overall, most performance<br />
<strong>in</strong>dicators did not show significant differences. High standard deviations <strong>in</strong>dicate that differences with<strong>in</strong><br />
groups are mostly higher than b<strong>et</strong>ween groups.<br />
6. References<br />
Anonymous, 2010a. Handreik<strong>in</strong>g bedrijfsspecifieke excr<strong>et</strong>ie melkvee, versie per 1 januari 2010 van kracht. M<strong>in</strong>istry of Economic<br />
Affairs, Agriculture and Innovation, The Hague.<br />
Anonymous, 2010b. Regel<strong>in</strong>g Ammoniak en Veehouderij (RAV), article 2. M<strong>in</strong>istry of Infrastructure and the Environment, The<br />
Hague.<br />
Blank, S. C., Erickson, K.W., Nehr<strong>in</strong>g, R., Hallahan, C., 2009. Agricultural profits and farm household wealth: a farm-level analysis<br />
us<strong>in</strong>g repeated cross sections. Journal of agricultural and applied economics 1: 207-225.<br />
Benn<strong>et</strong>, L.T., Mele, P.M., Ann<strong>et</strong>t, S., Kasel, S., 2010. Exam<strong>in</strong><strong>in</strong>g l<strong>in</strong>ks b<strong>et</strong>ween soil management, soil health, and public benefits <strong>in</strong><br />
agricultural landscapes: An Australian perspective. Agriculture Ecosystems & Environment 139: 1-12.<br />
De Bont, C.J.A.M, Van Everd<strong>in</strong>gen, W.H., Van der Knijff, A., Van der Meulen, H.A.B., 2009. Actuele ontwikkel<strong>in</strong>g van resultaten<br />
en <strong>in</strong>komens <strong>in</strong> de land- en tu<strong>in</strong>bouw <strong>in</strong> 2009. LEI, part of Wagen<strong>in</strong>gen UR. The Hague.<br />
Dekker, S.E.M., De Boer, I.J.M., Vermeij, I., Aarn<strong>in</strong>k, A.J.A., Groot Koerkamp, P.W.G., 2011. Ecological and economic evaluation<br />
of Dutch egg production systems. Livestock Science 139: 109-121.<br />
De Vries, M., Bokkers, E.A.M., Dijkstra T., Van Schaik, G., De Boer, I.J.M., 2011. Invited review: Associations b<strong>et</strong>ween variables<br />
of rout<strong>in</strong>e herd data and dairy cattle welfare <strong>in</strong>dicators. J. Dairy Science: 94:3213–3228.<br />
EU, 2006. Thematic Strategy for Soil Protection. Commission of the European communities, Brussels.<br />
Heijungs, R., Gu<strong>in</strong>ee, J.,Huppes, G., Lankreijer, R.M., Udo de Haes, H.A., Wagener Sleeswijk, A., Ansems, A.M.M., Eggels, P.G.,<br />
VanDu<strong>in</strong>, R., De Goede, H.P., 1992. Environmental Life Cycle Assessment of Products. Guide and backgrounds. CML, Institute<br />
for Environmental Sciences, Leiden.<br />
IPCC, 2007. In: Pachauri, R.K., Reis<strong>in</strong>ger, A.(Eds.), Core Writ<strong>in</strong>g Team, Intergovernmental Panel on Climate Change. Climate<br />
Change 2007: Synthesis Report. Contribution of Work<strong>in</strong>g Groups I, II and III to the Fourth Assessment Report of the Intergovernmental<br />
Panel on Climate Change. IPCC, Geneva.<br />
Nevedi, 2008-2009. L<strong>in</strong>eaire programmer<strong>in</strong>gen rundvee-, varkens- en pluimveevoeders. Monthly reports on feed composition computed<br />
by Schothorst Feed Research BV. Lelystad.<br />
84
PARALLEL SESSION 1B: TOWARDS LIFE CYCLE SUSTAINABILITY ASSESSMENT 8 th Int. Conference on <strong>LCA</strong> <strong>in</strong> the<br />
Agri-<strong>Food</strong> Sector, 1-4 Oct <strong>2012</strong><br />
MEA, 2005. Millenium Ecosystem Assessment. Ecosystems and Human Well-Be<strong>in</strong>g: Synthesis. Island Press, Wash<strong>in</strong>gton.<br />
OECD, 2001. Measur<strong>in</strong>g productivity – OECD Manuel: measurement of aggregate and <strong>in</strong>dustry-level productivity growth. OECD<br />
Statistics Directorate, Division of structural economic statistics.<br />
Oenema, O., Velthof, G.L., Verdoes, N., Groot Koerkamp, P.W.G., Bann<strong>in</strong>k, A., Monteny, G.J., Van der Meer, H.G., Van der Hoek,<br />
K., 2000. Forfaitaire waarden voor gasvormige stikstofverliezen uit stallen en mestopslagen. Alterra, Wagen<strong>in</strong>gen UR. Wagen<strong>in</strong>gen.<br />
Shadbolt, N., Kelly, T., Horne, D., Harr<strong>in</strong>gton, K., Kemp, P., Palmer, A., Thatcher, A., 2009. Comparisons b<strong>et</strong>ween organic & conventional<br />
pastoral dairy farm<strong>in</strong>g systems: Cost of production and profitability. Journal of Farm Management 10: 31-45.<br />
Sonneveld, M.P.W., Schröder, J.J., De Vos, J.A., Monteny G.J., Mosquera, J., Hol, J.M.G., Lant<strong>in</strong>ga, E.A., Verhoeven, F., Bouma,<br />
J., 2008. A Whole-Farm Strategy to Reduce Environmental Impacts of Nitrogen. J. Environ. Qual. 37(1), p. 186-195.<br />
Thomassen, M.A., Dolman, M.A., Van Calker, K.J., De Boer, I.J.M., 2009. Relat<strong>in</strong>g life cycle assessment <strong>in</strong>dicators to gross value<br />
added for Dutch dairy farms. Ecological Economics 68, 2278–2284.<br />
Van Bruggen, C., Groeneste<strong>in</strong>, C.M., De Haan, B.J., Hoogeveen, M.W., Huijsmans, J.F.M., Van der Sluis, S.M., Velthof, G.L., 2011.<br />
Ammoniakemissie uit dierlijke mest en kunstmest <strong>in</strong> 2009. Bereken<strong>in</strong>gen m<strong>et</strong> h<strong>et</strong> Nationaal Emissiemodel voor Ammoniak<br />
(NEMA). Statutory Research Tasks Unit for Nature and the Environment, Wagen<strong>in</strong>gen.<br />
Van Calker, K.J., Berentsen, P.B.M., Giesen, G.W.J., Huirne, R.B.M., 2008. Maximis<strong>in</strong>g susta<strong>in</strong>ability of Dutch dairy farm<strong>in</strong>g s ystems<br />
for different stakeholders: A modell<strong>in</strong>g approach. Ecological Economics 65: 407-419.<br />
Van der Veen, H., Oltmer, K., Boone, J.A., 2006. H<strong>et</strong> BIN-nenstebuiten: beschikbare gegevens <strong>in</strong> h<strong>et</strong> Bedrijven-Informatien<strong>et</strong> Landen<br />
Tu<strong>in</strong>bouw. LEI, part of Wagen<strong>in</strong>gen UR. The Hague.<br />
Van Hees, E.M., Otto, A.A.C., Van der Schans, F.C., 2009. Van Top-down naar Bodem-up. Review van kr<strong>in</strong>glooplandbouw <strong>in</strong> de<br />
melkveehouderij. Centrum voor Landbouw en Milieu, Culemborg.<br />
Velthof, G.L., Van Bruggen, C., Groeneste<strong>in</strong>, C.M., De Haan, B.J., Hoogeveen, M.W., Huijsmans, J.F.M., 2009. M<strong>et</strong>hodology to<br />
calculate ammonia emissions by Dutch agriculture. Statutory Research Tasks Unit for Nature & the Environment, Wagen<strong>in</strong>gen.<br />
Vrolijk, H.C.J., Dol, W., Kuhlman, T., 2005. Integration of small area estimation and mapp<strong>in</strong>g techniques - Tool for Regional Studies.<br />
LEI, part of Wagen<strong>in</strong>gen UR, Den Haag.<br />
WCED, 1987. World Commission on Environment and Development: Our common future (The Brundtland report). Oxford University<br />
Press, Oxford, United K<strong>in</strong>gdom.<br />
Welfare Quality®. 2009. Welfare Quality® Assessment Protocol for Cattle. Welfare Quality® Consortium, Lelystad, N<strong>et</strong>herlands.<br />
85
PARALLEL SESSION 1C: ECODESIGN AND ENVIRONMENTAL MANAGEMENT 8 th Int. Conference on <strong>LCA</strong> <strong>in</strong> the<br />
Parallel session 1c: Ecodesign and Environmental Management<br />
86<br />
Agri-<strong>Food</strong> Sector, 1-4 Oct <strong>2012</strong><br />
Environmental improvement of a chicken product through life cycle<br />
assessment m<strong>et</strong>hodology<br />
Guillermo Pardo 1,* , Ascensión Ciruelos 2 , Nuria López 3 , Lorenzo González 4 , Saioa Ramos 1 , Jaime Zufía 1<br />
1,* AZTI-Tecnalia<br />
2 CTAEX - Centro Tecnológico Agroalimentario de Extremadura<br />
3 AIMPLAS – Instituto Tecnológico del Plástico<br />
4 IAT – Instituto Andaluz de Tecnología<br />
Correspond<strong>in</strong>g author. E-mail: gpardo@azti.es<br />
ABSTRACT<br />
Life Cycle Assessment m<strong>et</strong>hodology was applied to a chicken product <strong>in</strong> order to identify the more relevant sources contribut<strong>in</strong>g to<br />
environmental impact. Several potential improvements were proposed and developed at different stages of the food cha<strong>in</strong>, based on a<br />
technical and environmental po<strong>in</strong>t of view, with special focus on the application of <strong>in</strong>novative solutions. Improved food cha<strong>in</strong> was<br />
also evaluated through <strong>LCA</strong> <strong>in</strong> order to compare results. Significant impact reductions were achieved <strong>in</strong> the feed production stage by<br />
replac<strong>in</strong>g conventional <strong>in</strong>gredients with tomato by-products <strong>in</strong> the poultry di<strong>et</strong>, (freshwater eutrophication decreased 9% and global<br />
warm<strong>in</strong>g effect 5%). Water consumption and wastewater generation was m<strong>in</strong>imised about 16% <strong>in</strong> the slaughterhouse and meat<br />
process<strong>in</strong>g stage through reutilisation alternatives and pulsed light decontam<strong>in</strong>ation. Conventional plastic tray and film were replaced<br />
with biodegradable materials avoid<strong>in</strong>g up to 20% of greenhouse gases emissions. F<strong>in</strong>ally product distribution was also optimised by<br />
improv<strong>in</strong>g refrigerated storage and logistics achiev<strong>in</strong>g relevant reductions <strong>in</strong> electrical and diesel consumption estimated around 10-<br />
15%.<br />
Keywords: poultry, broiler, Life Cycle Assessment, ecodesign<br />
1. Introduction<br />
Spa<strong>in</strong> is traditionally one of the major producers and consumers of chicken meat <strong>in</strong> the European Union.<br />
In the last years consumers demand has risen to 1.12 million tons account<strong>in</strong>g one of the highest consumption<br />
ratios of chicken meat <strong>in</strong> the UE (around 24 kg per capita), which represents 25% of the meat globally consumed<br />
<strong>in</strong> the Spanish mark<strong>et</strong>. At the same time the concern with environmental issues related to meat production,<br />
with special regard to acceptable levels of nitrogen and phosphorus, or the contribution of the sector<br />
to the emission of greenhouse gases, may lead to a significant <strong>in</strong>crease <strong>in</strong> costs <strong>in</strong> the poultry sector.<br />
From a multidiscipl<strong>in</strong>ary approach the project ECOALIM aimed to perform the eco-design of a meat<br />
product as a way to develop more efficient and susta<strong>in</strong>able food products throughout its whole life cycle.<br />
Four different research centres were <strong>in</strong>volved to <strong>in</strong>vestigate <strong>in</strong>novative technologies and processes <strong>in</strong> their<br />
respective areas of expertise under the common objective of reduc<strong>in</strong>g the environmental impact of a food<br />
product along various stages of the supply cha<strong>in</strong> (Figure 1).<br />
The product chosen for the study was a 600 gr tray of sliced chicken breast fill<strong>et</strong>s packaged <strong>in</strong> modified<br />
atmosphere, which is a commonly commercialised item <strong>in</strong> the Spanish mark<strong>et</strong>. The most significant impact<br />
sources were identified us<strong>in</strong>g life cycle assessment (<strong>LCA</strong>) m<strong>et</strong>hodology and several improvement approaches<br />
were selected at different life cycles stages, accord<strong>in</strong>g to their potential to reduce the environmental<br />
load of the product and their suitability from a technical po<strong>in</strong>t of view. The follow<strong>in</strong>g solutions were proposed:<br />
Process<strong>in</strong>g of food <strong>in</strong>dustry by-products as valuable <strong>in</strong>gredients for animal feed.<br />
Pulsed light technology for water decontam<strong>in</strong>ation and re-use <strong>in</strong> food sector<br />
Development of a biodegradable packag<strong>in</strong>g for meat products<br />
Energy and resources reduction <strong>in</strong> the distribution system by means of improved storage, routes optimisation<br />
and reverse logistics solutions.<br />
Proposed improvements were studied and developed at each research centre <strong>in</strong>volved <strong>in</strong> the project,<br />
accord<strong>in</strong>g to their field of knowledge, and feasibility was evaluated for their implementation to the <strong>in</strong>dustry.<br />
F<strong>in</strong>ally <strong>LCA</strong> m<strong>et</strong>hodology was applied <strong>in</strong> order to estimate the environmental impact of the new food cha<strong>in</strong><br />
and to compare results with the orig<strong>in</strong>al scenario.
PARALLEL SESSION 1C: ECODESIGN AND ENVIRONMENTAL MANAGEMENT 8 th Int. Conference on <strong>LCA</strong> <strong>in</strong> the<br />
Agri-<strong>Food</strong> Sector, 1-4 Oct <strong>2012</strong><br />
Figure 1. Overview of the life cycle of the chicken product and expertise areas of every partner.<br />
2. M<strong>et</strong>hods<br />
Selected functional unit was a 0.6 kg tray of sliced chicken breast packaged <strong>in</strong> modified atmosphere. The<br />
study ranged all the stages of the life cycle of the product from cradle to grave, <strong>in</strong>clud<strong>in</strong>g consumption phase<br />
and packag<strong>in</strong>g disposal. Mass allocation was performed by account<strong>in</strong>g the share <strong>in</strong> quantity of different<br />
chicken meat products from broiler production. Table 1 shows the allocation factors used. As can be<br />
observed, breast had a high allocation factor which po<strong>in</strong>ted out that a relevant amount of the environmental<br />
burden related to the broiler production is ascribed to the analysed product.<br />
Data for <strong>in</strong>ventory were ma<strong>in</strong>ly acquired from contacts <strong>in</strong> <strong>in</strong>dustry and companies participat<strong>in</strong>g <strong>in</strong> the<br />
project, as well as peer-reviewed literature and goverment publications. Data from four farms (three for<br />
broiler production and one for chicks) and two poultry slaughterhouses was collected through questionnaires<br />
with regards to water and energy consumption, packag<strong>in</strong>g, fodder use and related outputs. Maize, soybean,<br />
wheat, sunflower meal and corrector were identified as the ma<strong>in</strong> components <strong>in</strong> the formulation of poultry<br />
fodder. Data for <strong>in</strong>ventory of crop cultivation were based on Nemecek (2007). Direct emissions of ammonia<br />
(NH3), nitrous oxide (N2O) and m<strong>et</strong>hane (CH4) from chicken house and poultry manure application were<br />
estimated accord<strong>in</strong>g to EPER (2007) and EMEP-CORINAIR (2007). For soybean cultivation <strong>in</strong> Brazil the<br />
carbon dioxide (CO2) emissions related to the land transformation from tropical ra<strong>in</strong>forest were estimated<br />
accord<strong>in</strong>g to Jungbluth <strong>et</strong> al., (2007).<br />
Table 1. Chicken co-products and derived mass allocation factors.<br />
Co-Product Weight (g) Allocation factor<br />
Breast 480 0.32<br />
Drumsticks 240 0.16<br />
Thighs 500 0.34<br />
W<strong>in</strong>gs 267 0.18<br />
Total (carcass) 1487 1.00<br />
Average Spanish grid electricity data was modelled adapt<strong>in</strong>g eco<strong>in</strong>vent electricity production mix. Other<br />
data for background systems such as transportation, fertiliser, plastic and fuel production were also derived<br />
from eco<strong>in</strong>vent database. Plastic tray and logistics were modelled accord<strong>in</strong>g to realistic packag<strong>in</strong>g d<strong>et</strong>ails and<br />
delivery routes from a Spanish chicken company. Refrigerant leakages and additional energy required for<br />
refrigeration dur<strong>in</strong>g transport were accounted follow<strong>in</strong>g reviewed literature (Tassou <strong>et</strong> al.,, 2009). Electricity<br />
for cool<strong>in</strong>g at stores was estimated us<strong>in</strong>g refrigeration equipment d<strong>et</strong>ails and product throughputs of ten<br />
supermark<strong>et</strong>s with<strong>in</strong> the distribution area. F<strong>in</strong>ally consumer habits related to purchas<strong>in</strong>g, storage conditions,<br />
cook<strong>in</strong>g, wash<strong>in</strong>g and waste disposal were modelled accord<strong>in</strong>g to results from a specific mark<strong>et</strong> research<br />
survey (Zufía and Pardo, 2011).<br />
Additional energy, water and material requirements for the proposed improvements were estimated<br />
ma<strong>in</strong>ly from prototypes and pilot scale trials carried out along the project and from contacts <strong>in</strong> <strong>in</strong>dustry and<br />
technology suppliers. Tomato by-products (seeds and peels) were proposed to be <strong>in</strong>cluded <strong>in</strong> poultry di<strong>et</strong> as<br />
87
PARALLEL SESSION 1C: ECODESIGN AND ENVIRONMENTAL MANAGEMENT 8 th Int. Conference on <strong>LCA</strong> <strong>in</strong> the<br />
Agri-<strong>Food</strong> Sector, 1-4 Oct <strong>2012</strong><br />
partial substitute of conventional <strong>in</strong>gredients. As shown <strong>in</strong> Figure 1, <strong>in</strong> the alternative feed formulation the<br />
proportion of soybean was reduced and the other components where adjusted to keep nutrient levels.<br />
However tomato by-products <strong>in</strong>clusion was limited to 3% due to high fiber content. Energy for dry<strong>in</strong>g<br />
process was measured on-site at CTAEX facilities.<br />
Polylactide (PLA) based tray and film were studied as alternative packag<strong>in</strong>g materials for chicken meat<br />
products. An additional co-extruded poly-v<strong>in</strong>yl alcohol (PVOH) layer was <strong>in</strong>cluded to provide the gas barrier<br />
propri<strong>et</strong>ies of modified atmosphere packag<strong>in</strong>g. V<strong>in</strong>yl ac<strong>et</strong>ate copolymer data was used as a proxy for PVOH.<br />
Data of the production process for PLA were based on Althaus <strong>et</strong> al., (2007).<br />
Table 2. Standard and alternative broiler di<strong>et</strong> composition (%)<br />
Components Standard (%) Alternative (%)<br />
Corn 40.00 40.00<br />
Wheat 16.38 17.40<br />
Soybean 31.00 28.40<br />
Sunflower seeds 6.00 5.07<br />
Veg<strong>et</strong>able oil blend 3.00 2.53<br />
Mono-calcium phospate 2.00 2.00<br />
Limestone 0.60 0.60<br />
M<strong>in</strong>eral and vitam<strong>in</strong> suplement 0.40 0.40<br />
Salt 0.25 0.25<br />
Lys<strong>in</strong>e 0.18 0.18<br />
M<strong>et</strong>hion<strong>in</strong>e 0.19 0.19<br />
Tomato seeds and peels 0.00 3.00<br />
Environmental impacts associated with chicken life cycle were estimated follow<strong>in</strong>g ReCiPe<br />
characterisation m<strong>et</strong>hod (Goedkoop, 2009). Based on the default list of impact categories elaborated by<br />
Gu<strong>in</strong>ée <strong>et</strong> al., (2001). Four impact categories were selected among the so-called “basel<strong>in</strong>e impact<br />
categories”: Climate Change (CC), Ozone Depl<strong>et</strong>ion (OD), Acidification Potential (AP) and Eutrophication<br />
Potential (EP). Additionally, Water Depl<strong>et</strong>ion (WD) category was also considered, s<strong>in</strong>ce water consumption<br />
has an important relevance <strong>in</strong> Spa<strong>in</strong>, especially <strong>in</strong> Mediterranean areas and Cumulative Energy Demand<br />
(CED) (Jungbluth, <strong>et</strong> al., 2004) was chosen as an energy flow <strong>in</strong>dicator.<br />
3. Results and discussion<br />
3.1. Life cycle impact assessment results<br />
As previous studies on broiler production have po<strong>in</strong>ted out (Le<strong>in</strong>onen <strong>et</strong> al., (<strong>2012</strong>), Pell<strong>et</strong>ier (2007))<br />
<strong>LCA</strong> results (Figure 2) showed that the major impacts to the environment are caused <strong>in</strong> the feed production<br />
stage, ma<strong>in</strong>ly from the crop cultivation phase, followed by on-farm operations such as heat<strong>in</strong>g of broiler<br />
hous<strong>in</strong>g or manure storage and spread<strong>in</strong>g. Fodder production showed crucial impacts <strong>in</strong> most categories but<br />
especially for climate change (CC), ozone depl<strong>et</strong>ion (OZ) and freshwater eutrophication (FE) with a global<br />
contribution among 40-50%. In terms of global warm<strong>in</strong>g, N2O emissions appeared most important (33%),<br />
followed by CO2 emissions from burn<strong>in</strong>g fossil fuels and transport (31%) and CO2 emissions from deforestation<br />
(26%). Soy used <strong>in</strong> the poultry feed has a particular <strong>in</strong>fluence <strong>in</strong> the analysed system s<strong>in</strong>ce it is ma<strong>in</strong>ly<br />
imported from Brazil, which is associated to impacts l<strong>in</strong>ked to long distance transport and deforestation for<br />
gra<strong>in</strong> production.<br />
Environmental burdens related to broiler production were found to be the most relevant for AC (80%) and<br />
also significant for CC (15%) and FE (33%). This impact was l<strong>in</strong>ked to energy consumption, but especially<br />
to NH3, N2O and CH4, emmisions derived from manure handl<strong>in</strong>g.<br />
Slaughter<strong>in</strong>g and meat process<strong>in</strong>g <strong>in</strong>volved low relative contributions around 10% for most of the impact<br />
categories, except for water depl<strong>et</strong>ion (36%) due to the important amount of water required for clean<strong>in</strong>g operations.<br />
Product storage and delivery accounted for 15% of the total impact for OZ, and 7% for CC, derived<br />
from emisions related to energy consumption from refrigeration but also refrigerant leakages dur<strong>in</strong>g refrigerated<br />
transport.<br />
88
PARALLEL SESSION 1C: ECODESIGN AND ENVIRONMENTAL MANAGEMENT 8 th Int. Conference on <strong>LCA</strong> <strong>in</strong> the<br />
Agri-<strong>Food</strong> Sector, 1-4 Oct <strong>2012</strong><br />
Figure 2. Ma<strong>in</strong> contributions from different stages to the environmental impact of the chicken product<br />
In terms of cumulative energy demand, feed production was the dom<strong>in</strong>ant stage (around 50%) followed<br />
by home consumption (11%) and product delivery (10%), but other stages <strong>in</strong>cluded <strong>in</strong> the analysed system<br />
represented significant contributions, such as slaughter<strong>in</strong>g (9%), r<strong>et</strong>ail store (9%) and broiler production<br />
(7%).<br />
Comparability of the results with previous <strong>LCA</strong> studies of poultry meat may be difficult due to<br />
differences <strong>in</strong> the m<strong>et</strong>hodology, especially with regards to the functional unit selected, system boundaries of<br />
the study and the m<strong>et</strong>hod chosen for impact assessment stage. Nevertheless, results expressed per kg of<br />
chicken product were found to be of the same magnitude as several previous studies for CC (4.5 kg CO2eq/kg<br />
prod.) and AC (123.3 kg SO2 eq/kg prod.) (Williams <strong>et</strong> al., 2006) (Le<strong>in</strong>onen <strong>et</strong> al., <strong>2012</strong>) (Katajajuuri<br />
<strong>et</strong> al., 2007) (Segu<strong>in</strong> <strong>et</strong> al., 2011). Estimated values for FE (5,5g kg PO4 3- equiv/kg prod.) were similar to<br />
those observed by Katajajuuri <strong>et</strong> al., (2007) but lower than most of literature reviewed, which can be partly<br />
attributed to differences <strong>in</strong> the m<strong>et</strong>hodology applied for impact assessment. CED results (46.6MJ/kg prod.)<br />
were very similar to shown by Katajajuuri <strong>et</strong> al., 2007 but <strong>in</strong> general higher than other studies. This can be<br />
expla<strong>in</strong>ed attend<strong>in</strong>g to differences <strong>in</strong> the scope and functional unit selected for the analysis which often refers<br />
to poultry meat at farm gate. The current study ranged more stages of the life cycle of the product (from<br />
cradle to grave), which considers some high energy demand<strong>in</strong>g phases, such as home consumption, r<strong>et</strong>ail<br />
storage and product delivery.<br />
3.2. Improvement options identified<br />
In the first place, s<strong>in</strong>ce feed production was identified as one of the major contributors to the environmental<br />
burdens of the chicken item, the option of process<strong>in</strong>g food <strong>in</strong>dustry by-products as valuable <strong>in</strong>gredients<br />
for poultry feed was explored. Tomato peels and seeds were dried and conditioned for its use as feed<br />
components (up to 3%) allow<strong>in</strong>g to reduce the amount of imported soy <strong>in</strong> the formulation.<br />
In relation to water consumption at slaughterhouse two ma<strong>in</strong> optimisation actions were identified. Firstly,<br />
direct reutilisation of water from wash<strong>in</strong>g boxes process to clean <strong>in</strong>stallations and transport lorries was<br />
po<strong>in</strong>ted out. Secondly, <strong>in</strong>ternal water l<strong>in</strong>e from meat process<strong>in</strong>g was selected for its potentially re-use <strong>in</strong><br />
scald<strong>in</strong>g after decontam<strong>in</strong>ation through pulsed light and additional clor<strong>in</strong>ation. Comb<strong>in</strong><strong>in</strong>g both options it<br />
was estimated that 18% of water consumption at this stage may be reduced.<br />
Conventional tray and film were also ecodesigned. Increased use of plastic packag<strong>in</strong>g has led to serious<br />
ecological problems due to their total non-biodegradability (Siracusa <strong>et</strong> al., 2008). Specifically food packag<strong>in</strong>g<br />
materials are often contam<strong>in</strong>ated by foodstuff and organic substances, mak<strong>in</strong>g recycl<strong>in</strong>g impracticable<br />
and economically not convenient most of the times. As a consequence thousands of plastic materials from<br />
food items are either landfilled or <strong>in</strong>c<strong>in</strong>erated every year, <strong>in</strong>creas<strong>in</strong>g the problem of municipal waste collection<br />
and disposal (Kirwan and Strawbrigde, 2003). As a proposal to face this issue, a biodegradable packag<strong>in</strong>g<br />
for the chicken item was studied, based on polylactic acid and <strong>et</strong>hylene v<strong>in</strong>yl alcohol materials.<br />
89
PARALLEL SESSION 1C: ECODESIGN AND ENVIRONMENTAL MANAGEMENT 8 th Int. Conference on <strong>LCA</strong> <strong>in</strong> the<br />
Agri-<strong>Food</strong> Sector, 1-4 Oct <strong>2012</strong><br />
F<strong>in</strong>ally, another major stage <strong>in</strong>vestigated through the project was product delivery phase, lead<strong>in</strong>g to a series<br />
of improvement actions identified. Significant reductions related to electrical and diesel consumption<br />
were estimated around 10-15% at this phase by means of improved refrigerated storage, distribution routes<br />
optimisation and reverse logistics solutions.<br />
3.3. Compared <strong>LCA</strong> results based on potential improvements<br />
Significant impact reductions were achieved through the improvements identified at different stages of<br />
the life cycle, as can be observed <strong>in</strong> Table 1. In the feed production stage, freshwater eutrophication and<br />
global warm<strong>in</strong>g effect decreased 11% and 6% respectively by replac<strong>in</strong>g conventional <strong>in</strong>gredients with tomato<br />
by-products <strong>in</strong> the poultry di<strong>et</strong>, avoid<strong>in</strong>g the import of gra<strong>in</strong> from long distance.<br />
Water consumption and wastewater generation were m<strong>in</strong>imised about 16% <strong>in</strong> the slaughterhouse and<br />
meat process<strong>in</strong>g stage through recycl<strong>in</strong>g and re-use alternatives, by apply<strong>in</strong>g <strong>in</strong>novatives techniques such as<br />
pulsed light decontam<strong>in</strong>ation.<br />
Conventional plastic tray and film were replaced with biodegradable materials avoid<strong>in</strong>g up to 20% of<br />
greenhouse gases emissions associated to life cycle packag<strong>in</strong>g. However biodegradable materials showed an<br />
<strong>in</strong>creased impact <strong>in</strong> freshwater eutrophication l<strong>in</strong>ked to the crop cultivation stage required to obta<strong>in</strong> raw materials<br />
for bioplastic production.<br />
Environmental impacts dur<strong>in</strong>g product delivery stage were also reduced by improv<strong>in</strong>g different aspects<br />
along the supply cha<strong>in</strong>, among others, implement<strong>in</strong>g modularity at refrigerated storage spaces, optimis<strong>in</strong>g<br />
delivery routes and promot<strong>in</strong>g eco-driv<strong>in</strong>g lessons. Estimated sav<strong>in</strong>gs <strong>in</strong> electrical and diesel consumption at<br />
this phase lead to a decrease b<strong>et</strong>ween 13-15% <strong>in</strong> all the impact categories.<br />
In terms of the whole life cycle of the analysed chicken product comb<strong>in</strong>ed improvements have resulted <strong>in</strong><br />
significant reductions ma<strong>in</strong>ly <strong>in</strong> three categories: climate change (-6.7%), freshwater eutrophication (-5.3%)<br />
and water depl<strong>et</strong>ion (-11.9%).<br />
Table 3. Environmental results per FU for the considered improvement options.<br />
Poultry Feed Slaughter<strong>in</strong>g Packag<strong>in</strong>g Product delivery Comb<strong>in</strong>ed<br />
scenario<br />
Value Red.(%) Value Red.(%) Value Red.(%) Value Red.(%) Value Red.(%)<br />
CC 1.53 -4.8% 0.16 -2.5% 0.14 -20.8% 0.17 -13.1% 2.70 -6.7%<br />
OZ 0.12 -2.2% 0.01 -2.3% 0.01 87.8% 0.03 -15.0% 0.19 -1.5%<br />
AC 11.20 -1.3% 0.85 -3.7% 0.34 -31.6% 0.83 -13.0% 74.45 -0.5%<br />
FE 0.46 -9.3% 0.08 -8.4% 0.04 78.9% 5.3E-04 -13.0% 1.09 -5.3%<br />
WD 4.39 -3.3% 5.73 -15.9% 0.75 -54.4% 0.02 -13.1% 17.88 -11.9%<br />
CED 13.61 -1.8% 2.50 -3.1% 1.89 30.1% 2.32 -13.0% 27.99 -1.4%<br />
CC = Climate change; Units: kg CO2 eq., OZ = Ozone depl<strong>et</strong>ion; Units: mg CFC eq., AC = Terrestrial acidification; Units: g SO2 eq.,<br />
FE = Freshwater eutrophication; Units g P eq., WD = Water depl<strong>et</strong>ion; Units: l, CED = Cumulative energy demand; Units: MJ<br />
4. Conclusion<br />
Through the ECOALIM project, <strong>LCA</strong> m<strong>et</strong>hodology has been successfully applied <strong>in</strong> order to identify<br />
critical stages and operations along the life cycle of a food product from an environmental po<strong>in</strong>t of view, but<br />
also for comparative analysis b<strong>et</strong>ween different technologies and potential improvement options. <strong>LCA</strong><br />
proved to be a useful tool directly <strong>in</strong>volved <strong>in</strong> the decision mak<strong>in</strong>g process when m<strong>in</strong>imis<strong>in</strong>g the environmental<br />
impact associated to food cha<strong>in</strong>s, and additionally a considerable option to promote comp<strong>et</strong>itiveness,<br />
<strong>in</strong>novation and susta<strong>in</strong>ability through the eco-design of food products.<br />
Accord<strong>in</strong>g to the results of the present study the strong contribution of the poultry feed production stage<br />
on the environmental impact of a chicken product has been po<strong>in</strong>ted out, as previously highlighted by other<br />
authors (Alvarenga, <strong>2012</strong>) (Le<strong>in</strong>onen <strong>et</strong> al., <strong>2012</strong>) (Katajajuuri, 2009). Nevertheless, the relevance of other<br />
phases of the life cycle should not be underestimated. Environmental improvements at every stage can lead<br />
to significant global reductions due to the high volume of consumption of the analysed product.<br />
Acknowledgements: This work was performed with the f<strong>in</strong>ancial support of the Spanish M<strong>in</strong>istry of Science<br />
and Innovation. We want to thank the partners <strong>in</strong>volved <strong>in</strong> the project ECOALIM for their help with data<br />
collection<br />
5. References<br />
Althaus H.-J., D<strong>in</strong>kel F., St<strong>et</strong>tler C. and F. W. (2007) Life Cycle Inventories of Renewable Materials. F<strong>in</strong>al report eco<strong>in</strong>vent Data<br />
v2.0 No. 21. Swiss Centre for Life Cycle Inventories, Dübendorf, r<strong>et</strong>rieved from: www.eco<strong>in</strong>vent.org.<br />
90
PARALLEL SESSION 1C: ECODESIGN AND ENVIRONMENTAL MANAGEMENT 8 th Int. Conference on <strong>LCA</strong> <strong>in</strong> the<br />
Agri-<strong>Food</strong> Sector, 1-4 Oct <strong>2012</strong><br />
Alvarenga, R. A. F. D., da Silva Júnior, V. P., & Soares, S. R. (<strong>2012</strong>). Comparison of the ecological footpr<strong>in</strong>t and a life cycle impact<br />
assessment m<strong>et</strong>hod for a case study on Brazilian broiler feed production. Journal of Cleaner Production, 28, 25-32. Elsevier Ltd.<br />
de Vries, M., and I. J. M. de Boer. 2010. Compar<strong>in</strong>g environmental impacts for livestock products: A review of life cycle assessments.<br />
Livest. Sci. 28:1–11<br />
EPER (2007). European pollutant emissions registry. Eper-España. http://www.eper-es.com<br />
EMEP-CORINAIR (2007). Emission Inventory Guidebook. European Environment Agency. Copenhagen.<br />
Goedkoop M.J., Heijungs R, Huijbregts M., De Schryver A.;Struijs J.,; Van Zelm R. (2009) ReCiPe 2008, A life cycle impact assessment<br />
m<strong>et</strong>hod which comprises harmonised category <strong>in</strong>dicators at the midpo<strong>in</strong>t and the endpo<strong>in</strong>t level; First edition Report I:<br />
Characterisation;<br />
Gu<strong>in</strong>ée JB, Gorrée M, Heijungs R, Huppes G, Kleijn R, de Kon<strong>in</strong>g A, van Oers L, Wegener A, Suh S, Udo de Haes HA (2001) Life<br />
cycle assessment – An operational guide to the ISO standards. Centre of Environmental Science, Leiden, The N<strong>et</strong>herlands<br />
Jungbluth, N., Chudacoff, M., Dauriat, A., D<strong>in</strong>kel, F., Doka, G., Faist Emmenegger, M., Gnansounou, E., Kljun, N., Schleiss, K.,<br />
Spielmann, M., St<strong>et</strong>tler, C., Sutter, J. 2007: Life Cycle Inventories of Bioenergy. eco<strong>in</strong>vent report No. 17, Swiss Centre for Life<br />
Cycle Inventories, Dübendorf, CH.<br />
Jungbluth, N., Frischknecht, R. (2004) Implementation of Life Cycle Impact Assessment M<strong>et</strong>hods. Eco<strong>in</strong>vent Report No. 3;<br />
Katajajuuri, J.-M., Grönroos, J. & Usva, K. 2009. Environmental impacts and related improvement options of supply cha<strong>in</strong> of<br />
chicken meat. Proceed<strong>in</strong>gs of the 6th International Conference on Life Cycle Assessment <strong>in</strong> the Agri-<strong>Food</strong> Sector. Zurich, Switzerland,<br />
Nemecek, T. & Gaillard, G. (eds.), Agroscope Reckenholz-Tänikon Research Station ART, June 2009. pp. 370-380.<br />
ISBN 978-3-905733-10-5.<br />
Kirwan, M. J., & Strawbridge, J.W. (2003). Plastics <strong>in</strong> food packag<strong>in</strong>g. <strong>Food</strong> Packag<strong>in</strong>g Technology 174e240.<br />
Le<strong>in</strong>onen, I., A. G. Williams, J. Wiseman, J. Guy, and I. Kyriazakis. <strong>2012</strong>. Predict<strong>in</strong>g the environmental impacts of chicken systems<br />
<strong>in</strong> the United K<strong>in</strong>gdom through a life cycle assessment: Broiler production systems. Poult. Sci. 91:8–25.<br />
Nemecek T., Heil A., Huguen<strong>in</strong> O., Meier S., Erz<strong>in</strong>ger S., Blaser S., Dux. D. and Zimmermann A. (2007) Life Cycle Inventories of<br />
Agricultural Production Systems. eco<strong>in</strong>vent report No. 15, v2.0. Agroscope FAL Reckenholz and FAT Taenikon, Swiss Centre<br />
for Life Cycle Inventories, Dübendorf, CH, r<strong>et</strong>rieved from: www.eco<strong>in</strong>vent.org.<br />
Pell<strong>et</strong>ier, N. 2008. Environmental performance <strong>in</strong> the US broiler poultry sector: Life cycle energy use and greenhouse gas, ozone<br />
depl<strong>et</strong><strong>in</strong>g, acidify<strong>in</strong>g and eutrophy<strong>in</strong>g emissions. Agric. Syst. 98:67–73<br />
Siracusa, V., Rocculi, P., Romani, S., & Rosa, M. (2008). Biodegradable polymers for food packag<strong>in</strong>g: a review. Trends <strong>in</strong> <strong>Food</strong><br />
Science & Technology, 19(12), 634-643. Elsevier Ltd.<br />
Tassou, S. a., De-Lille, G., & Ge, Y. T. (2009). <strong>Food</strong> transport refrigeration – Approaches to reduce energy consumption and environmental<br />
impacts of road transport. Applied Thermal Eng<strong>in</strong>eer<strong>in</strong>g, 29(8-9), 1467-1477.<br />
Williams, A. G., E. Audsley, and D. L. Sandars. 2006. D<strong>et</strong>erm<strong>in</strong><strong>in</strong>g the environmental burdens and resource use <strong>in</strong> the production of<br />
agricultural and horticultural commodities. Ma<strong>in</strong> Report. Defra Research Project IS0205. http://www. agrilca.org.<br />
Zufia, J.; Pardo.G. (2011). Mark<strong>et</strong> research to assess environmental impacts of consumer stage <strong>in</strong> food <strong>LCA</strong>. Life Cycle Management<br />
Conference. Berlín.<br />
Segu<strong>in</strong>, F; van der Werf, H; Bouvarel, I.; Pottiez, E (2011). Environmental analysis of organic broiler production <strong>in</strong> <strong>France</strong> and improvement<br />
options. Life Cycle Management Conference. Berl<strong>in</strong>.<br />
91
PARALLEL SESSION 1C: ECODESIGN AND ENVIRONMENTAL MANAGEMENT 8 th Int. Conference on <strong>LCA</strong> <strong>in</strong> the<br />
Agri-<strong>Food</strong> Sector, 1-4 Oct <strong>2012</strong><br />
92<br />
Product-Oriented Environmental Management System (POEMS) <strong>in</strong><br />
the agri-food sector: ma<strong>in</strong> results of the EMAF project<br />
Roberta Salomone 1 , Maria Teresa Clasadonte 2 , Maria Proto 3 , Andrea Raggi 4 , Ioannis Arzoumanidis 4 ,<br />
Giuseppe Ioppolo 1 , Agata Lo Giudice 2 , Ornella Malandr<strong>in</strong>o 3 , Agata Matarazzo 2 , Luigia P<strong>et</strong>ti 4 , Giuseppe<br />
Saija 1 , Stefania Sup<strong>in</strong>o 3 , Alessandra Zamagni 4<br />
1 University of Mess<strong>in</strong>a, Mess<strong>in</strong>a, Italy<br />
2 University of Catania, Catania, Italy<br />
3 University of Salerno, Salerno, Italy<br />
4 University G. d'Annunzio, Pescara, Italy<br />
Correspond<strong>in</strong>g author. E-mail: roberta.salomone@unime.it<br />
ABSTRACT<br />
In this paper the ma<strong>in</strong> results of the Eco-Management for <strong>Food</strong> Project (co-funded by the Italian M<strong>in</strong>istry of Education, University<br />
and Research - PRIN No. 2008TXFBYT) are presented. With<strong>in</strong> the EMAF project, a Product-Oriented Environmental Management<br />
System (POEMS) framework that is specifically tailored for the agri-food <strong>in</strong>dustry, is be<strong>in</strong>g designed and implemented. It has a<br />
modular structure as it is made up of a s<strong>et</strong> of complementary tools: an Integrated Quality and Environmental Management System; a<br />
simplified Life Cycle Assessment m<strong>et</strong>hodology; guidel<strong>in</strong>es for product environmental communication. F<strong>in</strong>ally, this paper describes<br />
the ma<strong>in</strong> results of the POEMS framework implementation to different pilot food companies, <strong>in</strong> order to verify the effective function<strong>in</strong>g<br />
and to highlight the strong and weak po<strong>in</strong>ts of the POEMS model and of its <strong>in</strong>dividual fundamental elements.<br />
Keywords: POEMS, Integrated Management Systems, Simplified <strong>LCA</strong>, Environmental Product Labels, Agri-<strong>Food</strong> Supply Cha<strong>in</strong><br />
1. Introduction<br />
Product-Oriented Environmental Management System (POEMS) is a new framework designed to br<strong>in</strong>g<br />
tog<strong>et</strong>her traditional environmental management systems and tools oriented towards environmental product<br />
performances. It is “a systematic approach to organiz<strong>in</strong>g a firm <strong>in</strong> such a way that improv<strong>in</strong>g the environmental<br />
performance of its products across their product life cycles becomes an <strong>in</strong>tegrated part of operations<br />
and strategy” (de Bakker <strong>et</strong> al., 2002). Despite there still be<strong>in</strong>g no standard reference and few studies available<br />
<strong>in</strong> literature – ma<strong>in</strong>ly <strong>in</strong> manufactur<strong>in</strong>g <strong>in</strong>dustries and only one first attempt (Ardente <strong>et</strong> al., 2006) <strong>in</strong> the<br />
agri-food sector – a grow<strong>in</strong>g number of organisations are experienc<strong>in</strong>g the need to <strong>in</strong>tegrate environmental<br />
management systems standards with those addressed to the environmental evaluation of products, shift<strong>in</strong>g<br />
attention from system/process to product/service.<br />
In this context, the def<strong>in</strong>ition of a POEMS framework specifically tailored for the agri-food <strong>in</strong>dustry is the<br />
core targ<strong>et</strong> of the Eco-Management for <strong>Food</strong> (EMAF) Project (co-funded by the Italian M<strong>in</strong>istry of Education,<br />
University and Research - PRIN 2008TXFBY), that s<strong>et</strong>s out to def<strong>in</strong>e, test and dissem<strong>in</strong>ate <strong>in</strong>novative<br />
environmental management tools <strong>in</strong> order to improve the susta<strong>in</strong>ability and comp<strong>et</strong>itiveness of agri-food<br />
companies. The choice of this particular sector is ma<strong>in</strong>ly due to its economic importance <strong>in</strong> the European<br />
Union, as well as the considerable amount of natural resources used and environmental pollutants released<br />
by this <strong>in</strong>dustry; <strong>in</strong>deed, the Environmental Impact of Products - EIPRO study (Tukker <strong>et</strong> al., 2006), conducted<br />
by the European Commission, showed that among the products consumed <strong>in</strong> Europe, food and beverages<br />
are the ones which are associated with major environmental impacts, <strong>in</strong> a life cycle perspective.<br />
2. M<strong>et</strong>hods<br />
With<strong>in</strong> the EMAF project, the POEMS framework has a modular structure result<strong>in</strong>g from the <strong>in</strong>tegration<br />
of complementary environmental management tools: the underly<strong>in</strong>g basis is an Integrated Quality and Environmental<br />
Management System (ISO 9001 and ISO 14001/EMAS), while the product orientation is provided<br />
by a Simplified Life Cycle Assessment and a suitable environmental product label or declaration chosen<br />
follow<strong>in</strong>g Guidel<strong>in</strong>es for the Environmental Product Communication.<br />
The <strong>in</strong>novative character of the EMAF project has a double dimension connected to the fact that each environmental<br />
management tool <strong>in</strong>cluded <strong>in</strong> this study is developed <strong>in</strong> its m<strong>et</strong>hodological structure and then<br />
applied <strong>in</strong> pilot firms, both with a s<strong>in</strong>gle and an <strong>in</strong>tegrated approach, offer<strong>in</strong>g to agri-food organisations a<br />
“modular” format that refers to each tool separately and to the POEMS <strong>in</strong> general. In this way, whatever the<br />
start<strong>in</strong>g po<strong>in</strong>t of the firms is and whatever their targ<strong>et</strong>s are, they will f<strong>in</strong>d an answer and a strategy via which<br />
they may formulate their own route to eco-compatibility. In the follow<strong>in</strong>g a synthesis of the s<strong>in</strong>gle environmental<br />
management tools of which the POEMS model is made up is presented with a brief description of<br />
their m<strong>et</strong>hodological structure and the ma<strong>in</strong> results of their implementation to different pilot food companies,
PARALLEL SESSION 1C: ECODESIGN AND ENVIRONMENTAL MANAGEMENT 8 th Int. Conference on <strong>LCA</strong> <strong>in</strong> the<br />
Agri-<strong>Food</strong> Sector, 1-4 Oct <strong>2012</strong><br />
<strong>in</strong> order to verify the effective function<strong>in</strong>g and to highlight the strong and weak po<strong>in</strong>ts of the POEMS model<br />
and of its <strong>in</strong>dividual fundamental elements.<br />
3. Results and discussion<br />
3.1. Integrated Quality and Environmental Management System: the structural basis of POEMS<br />
An Integrated Management System (IMS) is based on the comb<strong>in</strong>ation of separate Management Systems<br />
(MSs) <strong>in</strong> order to plan, realise, control, audit and improve systematically a wide array of company performance,<br />
related pr<strong>in</strong>cipally to quality, environment, health and saf<strong>et</strong>y. Dur<strong>in</strong>g the last few decades, researchers<br />
have discussed IMS <strong>in</strong> a multitude of theor<strong>et</strong>ical and empirical studies, focus<strong>in</strong>g on different perspectives<br />
and address<strong>in</strong>g important aspects concern<strong>in</strong>g possible strategies, m<strong>et</strong>hodologies and degree of the <strong>in</strong>tegration<br />
process (Salomone, 2008; Bernardo <strong>et</strong> al., 2009). Strategies refer to the selection and implementation sequence<br />
of sub-systems, while m<strong>et</strong>hodologies cover the implementation phases and steps; the degree concerns<br />
the level of <strong>in</strong>tegration that the organisation <strong>in</strong>tends to achieve (Karap<strong>et</strong>rovic, 2004; Jorgensen <strong>et</strong> al., 2008).<br />
The multitude of theor<strong>et</strong>ical approaches found <strong>in</strong> the exist<strong>in</strong>g literature on the <strong>in</strong>tegration of MSs, lead to<br />
the conclusion that there is not a “one size fits all” m<strong>et</strong>hodology on which to build an <strong>in</strong>tegrated structure.<br />
Every <strong>in</strong>tegration process depends on the specific characteristics of the organisations <strong>in</strong>volved, particularly<br />
<strong>in</strong> reference to dimension, number of pre-existent MSs, and sector features.<br />
With<strong>in</strong> the EMAF project it was of primary importance to design a m<strong>et</strong>hodology for IMS implementation<br />
- which forms the backbone of POEMS -, cover<strong>in</strong>g Quality Management System (QMS) and Environmental<br />
Management System (EMS), focused on the agri-food sector, and test<strong>in</strong>g its application <strong>in</strong> a specific pilot<br />
firm.<br />
The proposed IMS model has to be seen as a flow of activities, schematized for simplicity <strong>in</strong> three progressive<br />
but different steps of <strong>in</strong>tegration, on the basis of the compatibility and complementarity b<strong>et</strong>ween the<br />
requirements of the standards. The IMS model proposed is characterised by an <strong>in</strong>novative operational value<br />
because its approach focuses specifically on the agri-food sector. It has been applied to a pilot company and<br />
permits its cont<strong>in</strong>uous adaptation <strong>in</strong> accordance to the specific needs of SMEs.<br />
The model proposes a multi-step progressive approach related to the follow<strong>in</strong>g phases. The “first level” is<br />
“strategic”, identify<strong>in</strong>g the pr<strong>in</strong>ciples, objectives, policies and values useful to the cont<strong>in</strong>uous improvement<br />
of quality and environmental performance; the “second level” <strong>in</strong>volves aspects l<strong>in</strong>ked to the “systemic implementation”<br />
of the IMS, by a synergic management of resources and a full analysis of the results achieved<br />
<strong>in</strong> each of the areas considered; the “third level”, however, has a “unify<strong>in</strong>g” nature, aim<strong>in</strong>g at the compl<strong>et</strong>e<br />
<strong>in</strong>tegration and synergies among all the organisational managerial and cultural aspects.<br />
Dur<strong>in</strong>g the <strong>in</strong>tegration process <strong>in</strong> the pilot company some strong po<strong>in</strong>ts, cluster<strong>in</strong>g <strong>in</strong> <strong>in</strong>ternal and external,<br />
have emerged (Zeng, <strong>et</strong> al., 2007). The former are: a focus on a holistic approach and underp<strong>in</strong>n<strong>in</strong>g relationships;<br />
the harmonisation of capabilities l<strong>in</strong>ked to the early use of formalised MSs; a reduction <strong>in</strong> unnecessary<br />
documents and bureaucracy; improvements <strong>in</strong> organisational efficiency and effectiveness. The external<br />
strong po<strong>in</strong>ts are pr<strong>in</strong>cipally related to: the worldwide grow<strong>in</strong>g diffusion of multiple MSs <strong>in</strong> the agri-food<br />
sector and the need to enhance their synergies; the <strong>in</strong>creas<strong>in</strong>g use of best bus<strong>in</strong>ess practices due to strong<br />
comp<strong>et</strong>ition on the global mark<strong>et</strong>; widespread adoption of tools for cont<strong>in</strong>uous improvement and benchmark<strong>in</strong>g.<br />
The <strong>in</strong>ternal weak po<strong>in</strong>ts, which arose dur<strong>in</strong>g the implementation process, are: the need for an aptitude<br />
to change among employees and management; the difficulties <strong>in</strong> re-allocation of roles, responsibilities and<br />
skills; f<strong>in</strong>ally, the need of resources for tra<strong>in</strong><strong>in</strong>g, knowledge shar<strong>in</strong>g and dissem<strong>in</strong>ation. The lack of mark<strong>et</strong><br />
<strong>in</strong>formation on IMS approaches pursued <strong>in</strong> managerial and organisational processes and difficulties <strong>in</strong> foster<strong>in</strong>g<br />
IMS adoption as a tool for creat<strong>in</strong>g value on the mark<strong>et</strong> are the most important barriers which emerged <strong>in</strong><br />
the external context.<br />
3.2. Simplified Life Cycle Assessment: the environmental assessment of agri-food products<br />
Life Cycle Assessment (<strong>LCA</strong>) has been <strong>in</strong>creas<strong>in</strong>gly used to identify and assess the environmental impacts<br />
of a vari<strong>et</strong>y of goods and services. In the framework of the EMAF project, exist<strong>in</strong>g <strong>LCA</strong> studies and<br />
review papers on food supply cha<strong>in</strong>s were analysed to report the current state-of-the-art and identify critical<br />
issues. More <strong>in</strong> d<strong>et</strong>ail, the purpose of such a review was to identify: a) the ma<strong>in</strong> m<strong>et</strong>hodological issues <strong>in</strong> the<br />
food sector and how they have been dealt with, b) wh<strong>et</strong>her there could be a tendency for some environmental<br />
impacts to be more affected than others, and c) wh<strong>et</strong>her there were specific stages <strong>in</strong> products’ life cycles<br />
that seem to be more impact<strong>in</strong>g than the others. All the above purposes were related to identify<strong>in</strong>g the <strong>in</strong>formation<br />
necessary for select<strong>in</strong>g a simplified tool that could be suitable to be implemented <strong>in</strong> this field.<br />
93
PARALLEL SESSION 1C: ECODESIGN AND ENVIRONMENTAL MANAGEMENT 8 th Int. Conference on <strong>LCA</strong> <strong>in</strong> the<br />
Agri-<strong>Food</strong> Sector, 1-4 Oct <strong>2012</strong><br />
Subsequently, a literature review of simplified <strong>LCA</strong> approaches followed result<strong>in</strong>g <strong>in</strong> several papers focus<strong>in</strong>g<br />
on a vari<strong>et</strong>y of products/sectors (a few ones related directly or <strong>in</strong>directly to the food sector). Most<br />
papers highlighted that the need to simplify an <strong>LCA</strong> lies with<strong>in</strong> the time and cost param<strong>et</strong>ers (especially for<br />
SMEs) of carry<strong>in</strong>g out a full <strong>LCA</strong>. In addition, simplified m<strong>et</strong>hods were recognised to be useful <strong>in</strong> the early<br />
product design phases, when limited <strong>in</strong>formation is available. F<strong>in</strong>ally, these m<strong>et</strong>hods were recognised to be<br />
helpful <strong>in</strong> green procurement, for example for identify<strong>in</strong>g the m<strong>in</strong>imum techical specifications based on environmental<br />
characteristics. Based on the previous outcomes, a s<strong>et</strong> of criteria were identified for the selection<br />
of the most suitable simplified tool among those reviewed: a) ISO-compliance, b) broad focus (a number of<br />
impact categories to be considered, not just one, like, e.g. <strong>in</strong> Carbon Footpr<strong>in</strong>t), c) user-friendly <strong>in</strong>terface, d)<br />
limited data requirement or adaptability to exist<strong>in</strong>g databases, e) relevance to life cycle steps identified <strong>in</strong> our<br />
food <strong>LCA</strong> review, and f) ease of <strong>in</strong>tegration with EPD, POEMS and other communication tools.<br />
Subsequently, a number of decision-mak<strong>in</strong>g tools for assist<strong>in</strong>g the selection were identified, namely: i)<br />
Delphi M<strong>et</strong>hod, ii) Analytical Hierarchy Process, iii) Multi-Criteria Decision Mak<strong>in</strong>g (MCDM) and iv)<br />
Rough S<strong>et</strong>s Theory. It was f<strong>in</strong>ally decided to use the MCDM m<strong>et</strong>hod, after hav<strong>in</strong>g consulted a number of<br />
experts <strong>in</strong> the doma<strong>in</strong>, accord<strong>in</strong>g to which a s<strong>et</strong> of weights were assigned to the above criteria by a group of<br />
experts. The tools found <strong>in</strong> the literature are be<strong>in</strong>g evaluated by some experts and tool developers themselves<br />
through the application of three of the m<strong>et</strong>hodologies of the Multi-Attribute Utility Theory family, namely<br />
SMART (Barron and Barr<strong>et</strong>t, 1996), Mszros and Rapsk (Meszaros and Rapcsak, 1996) and Entropy Optimisation<br />
(Lofti and Fallahnejad, 2010). The results of the simplified <strong>LCA</strong> will be compared to those of a full<br />
<strong>LCA</strong>. In the meantime, the collection of data (necessary for both types of <strong>LCA</strong>) was performed at two small<br />
w<strong>in</strong>emak<strong>in</strong>g firms <strong>in</strong> the region of Abruzzo, <strong>in</strong> Italy. The data collection and the early steps of the tool application<br />
demonstrated that perform<strong>in</strong>g a simplified <strong>LCA</strong> may require limited time and resources. Furthermore,<br />
simplified tools have clear and easy to understand calculation and visualisation m<strong>et</strong>hods and are considered<br />
to be suitable for effective communication of the environmental performance of products and services. The<br />
user friendl<strong>in</strong>ess along with the Life Cycle Th<strong>in</strong>k<strong>in</strong>g orientation are characteristics that simplified <strong>LCA</strong> tools<br />
normally offer, as well. When it comes to opportunities that can make such tools more easily adopted, those<br />
can <strong>in</strong>clude a proactive approach as regards the strategic management of the environmental variable, a sensitivity<br />
of the management to environmental issues and an <strong>in</strong>terest for eco-labell<strong>in</strong>g <strong>in</strong>itiatives on the side of<br />
the mark<strong>et</strong>.<br />
On the other hand, such tools are characterised by their difficulty <strong>in</strong> <strong>in</strong>corporat<strong>in</strong>g the m<strong>et</strong>hodological differences<br />
across firms and sectors. Moreover, a reduced scope and an <strong>in</strong>creased subjectivity are issues that<br />
can be considered as weaknesses of simplified <strong>LCA</strong> tools. As far as external threats are concerned, they are<br />
mostly connected to a general lack of environmental awareness by the firms comb<strong>in</strong>ed with a central focus<br />
on short-term problems, ma<strong>in</strong>ly due to the pressure by the mark<strong>et</strong>. In addition, the fact that a general rule for<br />
Small and Medium-sized Enterprises (SMEs) be<strong>in</strong>g that environmental management tools are not perceived<br />
as an opportunity has to be taken <strong>in</strong>to consideration. In parallel, a tendency for lack of time and/or will<strong>in</strong>gness<br />
of the technical staff and the management for data collection was identified. F<strong>in</strong>ally, the fact that environmental<br />
issues are often perceived as constra<strong>in</strong>ts and source of additional and often unknown (or hidden)<br />
costs has to be noted, as well (Masoni <strong>et</strong> al., 2004). The next steps of the research group <strong>in</strong>clude the f<strong>in</strong>alisation<br />
of both the full and the simplified <strong>LCA</strong> implementations for various types of w<strong>in</strong>e <strong>in</strong> the two firms <strong>in</strong>volved<br />
and a comparison of their results <strong>in</strong> order to assess the robustness of the selected simplified tool.<br />
3.3. Guidel<strong>in</strong>es for product environmental communication: the mark<strong>et</strong> orientation<br />
The agri-food production based on more susta<strong>in</strong>able processes enhances the importance of the relationship<br />
of trust b<strong>et</strong>ween producers and consumers and requires communication tools by which provides useful<br />
<strong>in</strong>formation, related to the respect of the environmental resources, to consumers. Specific environmental<br />
tools may respond to these needs, tools that can orient agri-food firms toward more susta<strong>in</strong>able production<br />
processes and that can attribute to products an objective, recognizable and mark<strong>et</strong>able environmental value<br />
(Lo Giudice and Clasadonte, 2010).<br />
Due to the great amount of different environmental communication and labell<strong>in</strong>g systems, a framework of<br />
guidel<strong>in</strong>es has been proposed for support<strong>in</strong>g firms <strong>in</strong> the choice of the most appropriate environmental communication<br />
system, with regards to their productive peculiarities, the environmental impacts, the territorial<br />
characteristics and the type of the targ<strong>et</strong> mark<strong>et</strong>.<br />
The ma<strong>in</strong> characteristics of the guidel<strong>in</strong>es can be synthesized as follows: consistency with the provisions<br />
of series ISO 14020 and ISO 14063 standards; general character, i.e. all organisations can apply them regardless<br />
of size, sector, location; transparency and compl<strong>et</strong>eness, to be easily used as a tool for decision mak<strong>in</strong>g.<br />
94
PARALLEL SESSION 1C: ECODESIGN AND ENVIRONMENTAL MANAGEMENT 8 th Int. Conference on <strong>LCA</strong> <strong>in</strong> the<br />
Agri-<strong>Food</strong> Sector, 1-4 Oct <strong>2012</strong><br />
The framework (characterised by a clear, credible and transparent language) has a structure based on iterative<br />
procedural steps suitable for different k<strong>in</strong>ds of stakeholders whose degree of <strong>in</strong>volvement <strong>in</strong> the communication<br />
process is taken <strong>in</strong>to account.<br />
The proposed guidel<strong>in</strong>es provide the follow<strong>in</strong>g <strong>in</strong>dex:<br />
Introduction (state of the art, exist<strong>in</strong>g labels);<br />
Pr<strong>in</strong>ciples of environmental communication (terms and def<strong>in</strong>itions, reference standards);<br />
Goal and scope (voluntary tools of certification, assessment of the bus<strong>in</strong>ess needs, system boundaries,<br />
<strong>in</strong>volved stakeholders, mark<strong>et</strong>s of references);<br />
Environmental communication policy (plann<strong>in</strong>g of the environmental communication activity, identification<br />
of the bus<strong>in</strong>ess tools);<br />
Environmental communication strategy (<strong>in</strong>volved bus<strong>in</strong>ess resources);<br />
Measurement of environmental impacts (questionnaires, <strong>in</strong>put-output flow analysis, flowcharts iterative<br />
models, decision support systems, identification of <strong>in</strong>dicators of organisations performance, best available<br />
techniques, prevention strategies, more appropriate label<strong>in</strong>g identification);<br />
Report<strong>in</strong>g (documentation, logos);<br />
Environmental Communication (revision policies - audit, cost analysis, potential benefits, description of<br />
chosen tool, potential <strong>in</strong>tegration with other enterprise management tools, identification of targ<strong>et</strong>audience,<br />
f<strong>in</strong>al recommendations).<br />
The guidel<strong>in</strong>es have been applied to a pilot company operat<strong>in</strong>g <strong>in</strong> the pasta cha<strong>in</strong> located <strong>in</strong> eastern Sicily<br />
to test their effectiveness and highlight the strong and weak po<strong>in</strong>ts. The flowcharts and iterative steps of the<br />
approach proposed allowed to analyse the firms characteristics and the features of the reference cha<strong>in</strong>, guid<strong>in</strong>g<br />
the management to adopt one of the most popular used tool of environmental communication for products:<br />
the Environmental Product Declaration (EPD). To this scope, start<strong>in</strong>g with the Product Category Rules<br />
(PCR) exist<strong>in</strong>g for the area analysed, the assessment of environmental impacts of the production process of<br />
the pilot company was made us<strong>in</strong>g the m<strong>et</strong>hodology of Life Cycle Assessment (<strong>LCA</strong>), which highlighted the<br />
agricultural phase as the most impactful throughout the production cycle (Lo Giudice <strong>et</strong> al., 2011).<br />
The application of the guidel<strong>in</strong>es, despite the <strong>in</strong>itial lack of knowledge by the company of different communication<br />
tools and the difficult <strong>in</strong>volvement of stakeholders with<strong>in</strong> the sector, led to: identify the most<br />
appropriate tool for environmental assessment; <strong>in</strong>creas<strong>in</strong>g <strong>in</strong>terest <strong>in</strong> environmental communication tools,<br />
such as trademarks and statements; <strong>in</strong>crease the knowledge of suppliers, distributors and consumers about<br />
corporate environmental performance. However, it was found that there are still some open issues of fundamental<br />
importance, such as: the lack of knowledge on distributors/consumers of these tools; the limited f<strong>in</strong>ancial<br />
resources <strong>in</strong> the hands of companies; the limited availability of PCR, <strong>in</strong> the agri-food sector, relat<strong>in</strong>g<br />
to the EPD system; the uncerta<strong>in</strong>ty on the possible application of the Ecolabel <strong>in</strong> food products.<br />
3.4. Product-Oriented Management System: the compl<strong>et</strong>e framework<br />
Pursu<strong>in</strong>g the goals of EMAF project, a literature review of previous m<strong>et</strong>hodological and applicative studies<br />
of POEMS was performed <strong>in</strong> order to identify the most appropriate m<strong>et</strong>hodological solutions for the agrifood<br />
<strong>in</strong>dustry; the <strong>in</strong>formation gathered allowed us to def<strong>in</strong>e key issues that were then translated <strong>in</strong> the follow<strong>in</strong>g<br />
POEMS model requirements: a) fundamental structure composed of a management system conform<strong>in</strong>g<br />
to ISO 14001 or to the EMAS Regulation, <strong>in</strong>tegrated with ISO 9001 and other possible management<br />
systems typical of the agri-food sector; b) m<strong>et</strong>hodology based on the Dem<strong>in</strong>g Cycle, fully exploit<strong>in</strong>g the iterative<br />
character of the cycle <strong>in</strong> order to pursue cont<strong>in</strong>uous improvement of both the m<strong>et</strong>hodological structure<br />
and environmental and product performance; c) product orientation ensured by the <strong>in</strong>tegration of a Simplified<br />
Life Cycle Assessment m<strong>et</strong>hodology suitable for organisations <strong>in</strong> the agri-food production cha<strong>in</strong>,<br />
which can be used to evaluate different cultivation m<strong>et</strong>hods, production technologies and alternative materials;<br />
d) ability to transform the environmental measures taken <strong>in</strong>to commercial advantages <strong>in</strong> the best possible<br />
way for the organisation, thanks to the use of guidel<strong>in</strong>es that can support firms <strong>in</strong> their choice of the most<br />
suitable form of environmental message, closely l<strong>in</strong>ked to the product; e) simplification of certa<strong>in</strong> operational<br />
aspects and reduction of “bureaucracy”; f) general character, mak<strong>in</strong>g it applicable to any type of activity <strong>in</strong><br />
the agri-food sector, whatever the organisation’s size, nature and position <strong>in</strong> the agri-food supply cha<strong>in</strong>; g)<br />
modular structure, as it is composed of a collection of management tools that can be applied, <strong>in</strong>dividually or<br />
as an <strong>in</strong>tegration of two or more elements, on the basis of organisations’ specific requirements and of the<br />
objectives they aim to reach. The POEMS framework is synth<strong>et</strong>ically illustrated <strong>in</strong> Fig. 1.<br />
95
PARALLEL SESSION 1C: ECODESIGN AND ENVIRONMENTAL MANAGEMENT 8 th Int. Conference on <strong>LCA</strong> <strong>in</strong> the<br />
Agri-<strong>Food</strong> Sector, 1-4 Oct <strong>2012</strong><br />
Figure 1. The POEMS framework (EMAF, <strong>2012</strong>)<br />
The model was developed from a traditional EMS (ISO14001 standard), <strong>in</strong>tegrated with a QMS (ISO 9001<br />
and ISO 9004 standards), and is based on the PDCA cycle. It allows the collection of external customers’ and<br />
other stakeholders’ expectations concern<strong>in</strong>g the product requirements (that is a key issue <strong>in</strong> ISO 9001 standard<br />
but not <strong>in</strong> the ISO 14001 one). In the PLAN phase, the product-orientation of IMS is guaranteed by the<br />
<strong>in</strong>clusion of a Simplified-<strong>LCA</strong> (of one or more products), and by the consideration of territorial elements (e.g.<br />
land protection; regulated quality brands; organic production) that allows the collection of data and <strong>in</strong>formation<br />
useful for the evaluation of improvements <strong>in</strong> the environmental performances of products. This <strong>in</strong>formation<br />
flow l<strong>et</strong>s to change the <strong>in</strong>itial environmental review so as to take <strong>in</strong>to account the environmental impacts<br />
of products and the <strong>in</strong>teraction with the other actors of the supply-cha<strong>in</strong>. In the DO phase, the framework is<br />
compl<strong>et</strong>ed with the <strong>in</strong>clusion of a Life Cycle Environmental Management strategy <strong>in</strong> order to improve the<br />
decision-mak<strong>in</strong>g process by deploy<strong>in</strong>g a range of <strong>in</strong>formation useful to the supply-cha<strong>in</strong> susta<strong>in</strong>ability, the<br />
def<strong>in</strong>ition of the appropriate product documentation and the preparation of the chosen environmental product<br />
label or declaration. F<strong>in</strong>ally, the framework cont<strong>in</strong>ues with the phases of CHECK and ACT.<br />
In order to verify the effective function<strong>in</strong>g of the POEMS model, its application <strong>in</strong> pilot companies, operat<strong>in</strong>g<br />
<strong>in</strong> two different agri-food supply cha<strong>in</strong>s, has already been started up. The two supply cha<strong>in</strong>s were chosen<br />
<strong>in</strong> order to <strong>in</strong>volve firms operat<strong>in</strong>g <strong>in</strong> important Italian sectors, from an economic and/or environmental<br />
po<strong>in</strong>t of view, but with very different characteristics and problems: the olive oil and the roasted coffee <strong>in</strong>dustries.<br />
Dur<strong>in</strong>g the POEMS implementation <strong>in</strong> the pilot companies some strong and weak po<strong>in</strong>ts have emerged;<br />
they can all be summarized <strong>in</strong> the follow<strong>in</strong>g ma<strong>in</strong> issues: even if the model demonstrated the robustness of<br />
its general and iterative character and a reduction of “bureaucracy”, the need for a huge quantity of data and<br />
the necessity of def<strong>in</strong><strong>in</strong>g common goals and implement<strong>in</strong>g jo<strong>in</strong>t efforts with the other actors of the supply<br />
cha<strong>in</strong>, <strong>in</strong> the real practice, h<strong>in</strong>der the full implementation of a POEMS. Indeed, firms are reluctant to collect<br />
<strong>in</strong>formation from other actors and <strong>in</strong> the agri-food organisations a limited co-operation across the supply<br />
cha<strong>in</strong> still persists. This resistance to change should be faced up with proper <strong>in</strong>formation and tra<strong>in</strong><strong>in</strong>g activities<br />
<strong>in</strong> order to struggle the lack of a supply cha<strong>in</strong> management perspective.<br />
4. Conclusion<br />
The <strong>in</strong>novative character of the POEMS model is d<strong>et</strong>erm<strong>in</strong>ed by the <strong>in</strong>tegration approach of tools that are<br />
generally analysed as “<strong>in</strong>dependent” tools, while <strong>in</strong> the EMAF project they are closely related to each other.<br />
The adoption of an IMS, made up of a QMS and an EMS, represents a fundamental step <strong>in</strong> the transition<br />
from a conventional to a more susta<strong>in</strong>able bus<strong>in</strong>ess practice <strong>in</strong> agri-food organisations. At the same time, it<br />
96
PARALLEL SESSION 1C: ECODESIGN AND ENVIRONMENTAL MANAGEMENT 8 th Int. Conference on <strong>LCA</strong> <strong>in</strong> the<br />
Agri-<strong>Food</strong> Sector, 1-4 Oct <strong>2012</strong><br />
represents only the start<strong>in</strong>g po<strong>in</strong>t towards the complex pathway for the improvement of the global performance<br />
of agri-food products and processes, <strong>in</strong> accordance to the environmental susta<strong>in</strong>ability perspective. Such<br />
a vision, <strong>in</strong>deed, requires the adoption of an array of tools, aim<strong>in</strong>g at a POEMS as the f<strong>in</strong>al targ<strong>et</strong>. The other<br />
tools to be <strong>in</strong>tegrated are a Simplified <strong>LCA</strong> and a proper product environmental communication tool. Indeed,<br />
the product-orientated approach allowed by a Simplified <strong>LCA</strong> m<strong>et</strong>hodology, specifically suited for agri-food<br />
SMEs, and guidel<strong>in</strong>es for support<strong>in</strong>g firms <strong>in</strong> the choice of the most appropriate environmental communication<br />
system, are deemed as highly necessary for a successful POEMS framework: they may assure the mark<strong>et</strong><br />
orientation essential to counter the erroneous firm’s conviction that environmental management tools are<br />
not a bus<strong>in</strong>ess opportunity. In fact, the applicative phase of EMAF project (that is still <strong>in</strong> progress) has highlighted<br />
that various important factors affect<strong>in</strong>g the application of each environmental management tool are<br />
widespread <strong>in</strong> many organizaton of the agri-food sector; these factors <strong>in</strong>clude the lack of mark<strong>et</strong> <strong>in</strong>formation,<br />
the understand<strong>in</strong>g and awareness of environmental issues, the difficulty to consider these tools as <strong>in</strong>struments<br />
for creat<strong>in</strong>g value <strong>in</strong> the mark<strong>et</strong>, and the limited co-operation across supply cha<strong>in</strong>s. This means that cultural<br />
and structural changes and cont<strong>in</strong>ual improvement are the imperatives that should be properly managed <strong>in</strong><br />
order to directly connect POEMS and its s<strong>in</strong>gle components with the challenges of transform<strong>in</strong>g the susta<strong>in</strong>ed<br />
efforts <strong>in</strong>to effective bus<strong>in</strong>ess opportunities.<br />
5. References<br />
Ardente, F., Beccali, G., Cellura, M., Marvuglia, A., 2006. POEMS: a case study of a w<strong>in</strong>emak<strong>in</strong>g firm <strong>in</strong> the South of Italy. Environ. Manage..<br />
38, 350-364.<br />
Barron, F., & Barr<strong>et</strong>t, B., 1996. The efficacy of SMARTER – Simple Multi-Attribute Rat<strong>in</strong>g Technique Extended to Rank<strong>in</strong>g. Acta Psychologica<br />
93, 23-36.<br />
Bernardo, M., Casadesus, M., Karap<strong>et</strong>rovic, S., Heras, I., 2009. How <strong>in</strong>tegrated are environmental, quality and other standardized management<br />
systems? An empirical study. J. Clean. Prod.17 (8), 742-750.<br />
de Bakker, F.G.A., Fischer, O.A.M., Brack, A.J.P., 2002. Organiz<strong>in</strong>g product-oriented environmental management from a firm’s perspective.<br />
J. Clean. Prod. 10, 455-464.<br />
EMAF, Eco-Management for <strong>Food</strong> Project, <strong>2012</strong>. Available from http://ww2.unime.it/emaf/<br />
Jorgensen, TH, Remmen, A., Mellado, M.D., 2006. Integrated Management Systems – three different levels of <strong>in</strong>tegration. J. Clean. Prod.14<br />
(18), 713-722.<br />
Karap<strong>et</strong>rovic, S., Casadesús, M., 2009. Implement<strong>in</strong>g environmental with other standardized management systems: scope, sequence, time<br />
and <strong>in</strong>tegration. J. Clean. Prod.17 (5), 533-540.<br />
Lo Giudice, A., Clasadonte, M. T, Matarazzo, A, 2011. LCI prelim<strong>in</strong>ary results <strong>in</strong> the Sicilian durum wheat pasta cha<strong>in</strong> production. J. of<br />
Commodity Science. Technology and Quality 50, 65-79.<br />
Lo Giudice, A., Clasadonte, M. T., 2010. The EPD for the agro-food cha<strong>in</strong> products. Calitatea-acces la success: fac<strong>in</strong>g the challenges of the<br />
future – excellence <strong>in</strong> bus<strong>in</strong>ess and commodity sciences 116, 472-480.<br />
Lofti, F., Fallahnejad, R., 2010. Imprecise shannons entropy and multi attribute desicion mak<strong>in</strong>g. Entropy 12(1).<br />
Masoni, P., Sára, B. Scimìa, E. & Raggi, A., 2004. VerdEE – A tool for adoption of Life Cycle Assessment <strong>in</strong> small- and medium-sized<br />
enterprises <strong>in</strong> Italy, Progress <strong>in</strong> Industrial Ecology 1 (1-3), 203-228.<br />
Meszaros, C., Rapcsak, T., 1996. On sensitivity analysis for a class of decision systems. Decis.Support Syst.16, 231-240.<br />
Salomone, R., 2008. Integrated management systems: experiences <strong>in</strong> Italian organisations. J. Clean. Prod. 16 (16), 1786-1806.<br />
Tukker, A., Huppes, G., Gu<strong>in</strong>ée, J., Heijungs, R., de Kon<strong>in</strong>g, A., van Oers, L., Suh, S., Geerken, T., Van Holderbeke, M., Jansen, B., Nielsen,<br />
P., 2006. Environmental Impact of Products (EIPRO). Analysis of the life-cycle environmental impacts related to the f<strong>in</strong>al consumption<br />
of the EU-25. Summary of the f<strong>in</strong>al report. European Commission: DG Environment e DG JRC.<br />
Zeng, S., Shi, J., Lou, G., 2007. A synerg<strong>et</strong>ic model for implement<strong>in</strong>g an <strong>in</strong>tegrated management system: an empirical study <strong>in</strong> Ch<strong>in</strong>a. J.<br />
Clean. Prod.15 (18), 1760-1767.<br />
97
PARALLEL SESSION 1C: ECODESIGN AND ENVIRONMENTAL MANAGEMENT 8 th Int. Conference on <strong>LCA</strong> <strong>in</strong> the<br />
Agri-<strong>Food</strong> Sector, 1-4 Oct <strong>2012</strong><br />
98<br />
An <strong>LCA</strong> support tool for management of protected horticultural<br />
systems<br />
Marta Torrellas 1,* , Assumpció Antón 1 , Marc Ruijs 2 , Nieves García Victoria 2 , Juan Ignacio Montero 1<br />
1 IRTA, Ctra. de Cabrils, km 2. 08348 Cabrils, Barcelona, Spa<strong>in</strong><br />
2 Wagen<strong>in</strong>gen UR Greenhouse Horticulture, PO Box 644, 6700 AP Wagen<strong>in</strong>gen, The N<strong>et</strong>herlands<br />
Correspond<strong>in</strong>g author. E-mail: marta.torrellas@irta.cat<br />
ABSTRACT<br />
Life cycle assessment (<strong>LCA</strong>) is a useful tool for environmental management, but is complex for non-specialists. The objective of this<br />
study was to develop an easy-to-use support tool to help stakeholders <strong>in</strong> horticulture with their decision mak<strong>in</strong>g as a way of mitigat<strong>in</strong>g<br />
the environmental impact of protected crops. Us<strong>in</strong>g a simplified <strong>LCA</strong>, three spreadshe<strong>et</strong>s were provided and, as a result, two<br />
types of crops (tomato and rose) and two types of structures (plastic multi-tunnel and Venlo glass greenhouse) were evaluated. Results<br />
are expressed by functional unit <strong>in</strong> six midpo<strong>in</strong>t impact categories. With the analysis of three case studies, results showed that<br />
this environmental calculator is a useful tool to d<strong>et</strong>erm<strong>in</strong>e major burdens <strong>in</strong> greenhouse production systems and evaluate the efficient<br />
use of <strong>in</strong>puts. Simplification of the tool created some difficulties that may be improved with further research, such as the selection of<br />
appropriate data s<strong>et</strong>s and characterisation models.<br />
Keywords: simplified <strong>LCA</strong>, decision support, environmental impacts, system, greenhouse structure<br />
1. Introduction<br />
Life cycle assessment (<strong>LCA</strong>) is an environmental management tool that can be used for multiple applications,<br />
such as evaluat<strong>in</strong>g the environmental impacts of a product or service, comparison of environmental<br />
performance of different products, ecodesign, ecolabell<strong>in</strong>g and environmental product declarations (EPD).<br />
<strong>LCA</strong> m<strong>et</strong>hodology is improv<strong>in</strong>g cont<strong>in</strong>uously with new characterisation models, databases and guidel<strong>in</strong>es to<br />
<strong>in</strong>crease robustness and areas of use. Thus, <strong>LCA</strong> can be a complex tool for non-specialists and, as a result, its<br />
application is usually restricted to professionals <strong>in</strong> the area such as researchers, consultants and other experts.<br />
However, one of the goals of scientific community is to extend research objectives from pure analysis towards<br />
application <strong>in</strong> decision mak<strong>in</strong>g and the context of policy. With this aim <strong>in</strong> m<strong>in</strong>d, an effort was made to<br />
achieve <strong>in</strong>tegration b<strong>et</strong>ween simulation and decision mak<strong>in</strong>g to provide tools to simplify a complex system.<br />
Over time, soci<strong>et</strong>al concern about environmental problems has <strong>in</strong>creased the demand for reliable <strong>in</strong>formation<br />
and tools to understand and mitigate environmental damage. Lately, environmental management has<br />
changed through <strong>in</strong>creased requirements and decision mak<strong>in</strong>g that simultaneously considers economic and<br />
social systems, as well as ecosystems. One of the answers to satisfy this demand has been the appearance <strong>in</strong><br />
the mark<strong>et</strong> (i.e. websites) of environmental calculators developed as simplified life-cycle management tools<br />
to simulate systems and support decision mak<strong>in</strong>g. Specific calculators are oriented to a vari<strong>et</strong>y of professional<br />
sectors such as ecodesign, the construction <strong>in</strong>dustry, energy activities and waste management. In the<br />
food <strong>in</strong>dustry, calculators can be found for the environmental evaluation of personal consumption habits<br />
(www. uns.<strong>et</strong>hz.ch), susta<strong>in</strong>able shopp<strong>in</strong>g (http://jocapqua.urv.es/en/credits.html) and <strong>in</strong>dustry activities such<br />
as the Carbonostics calculator (http://www.carbonostics.com/). Greenhouse gas emissions that affect global<br />
warm<strong>in</strong>g (carbon footpr<strong>in</strong>t) are usually the only factor taken <strong>in</strong>to account, which gives a reduced view of the<br />
environmental problem (F<strong>in</strong>kbe<strong>in</strong>er, 2009). Recently, simplified contributions for a wide range of users have<br />
been released, such as the Cool Farm Tool, a greenhouse gas calculator for crop and livestock production at<br />
farm level (Hillier, 2011) and Musa software for water assessment of different agricultural production systems<br />
(Amores Barrero <strong>et</strong> al., <strong>2012</strong>). Horticultural environmental calculators focus on open-field systems, but<br />
the authors are not aware of any such calculators for protected crops. The aim of this study was to develop an<br />
easy-to-use environmental tool to calculate the efficiency of <strong>in</strong>puts of protected crops and evaluate options to<br />
reduce them. The calculator is based on a simplified <strong>LCA</strong>, gives results for six environmental impact categories<br />
and is designed to help a mix of users with decision mak<strong>in</strong>g. This paper presents the environmental tool<br />
that was applied to three production systems. The tool was developed <strong>in</strong> the context of the EUPHOROS research<br />
project and free access is available on the project website <strong>in</strong> several languages.<br />
2. M<strong>et</strong>hods<br />
This environmental calculator was based on a simplified <strong>LCA</strong> follow<strong>in</strong>g the pr<strong>in</strong>ciple of “as simple as<br />
possible and as complex as necessary” (Pidd, 1996) and the ISO 14040 standard (ISO-14040, 2006). The tool<br />
<strong>in</strong>cludes three Excel spreadshe<strong>et</strong>s for three greenhouse production systems representative of current agricultural<br />
practices <strong>in</strong> Europe (Montero <strong>et</strong> al., 2011). The follow<strong>in</strong>g scenarios were used as reference situations: a
PARALLEL SESSION 1C: ECODESIGN AND ENVIRONMENTAL MANAGEMENT 8 th Int. Conference on <strong>LCA</strong> <strong>in</strong> the<br />
Agri-<strong>Food</strong> Sector, 1-4 Oct <strong>2012</strong><br />
tomato crop <strong>in</strong> a multi-tunnel greenhouse under Southern European climate conditions, and a tomato crop<br />
and a rose crop <strong>in</strong> Venlo glass greenhouses under Central European climate conditions. Each spreadshe<strong>et</strong> has<br />
four she<strong>et</strong>s disclosed to users: Instructions, Input Data, Total Results and D<strong>et</strong>ailed Results. Users can simulate<br />
their own production system by follow<strong>in</strong>g a few easy steps: selection of one scenario, data entry and<br />
consultation of results.<br />
The Input Data she<strong>et</strong> consists of a questionnaire structured around different topics. A l<strong>in</strong>k to a fertiliser<br />
calculator is available to calculate the amount of total nutrients based on the specific fertiliser doses applied<br />
to the crop. These user data are primary data used to calculate results, along with secondary data from <strong>in</strong>ternational<br />
databases. Datas<strong>et</strong>s from Eco<strong>in</strong>vent database 2.2 (Eco<strong>in</strong>vent, 2010) were used for processes such as<br />
the manufacture of greenhouse components (m<strong>et</strong>al, plastic and glass), substrate, pesticides, means of transport<br />
and disposal. The average European electricity production mix was the process selected to evaluate the<br />
environmental impact of electricity consumption. The <strong>LCA</strong><strong>Food</strong>s database (Nielsen <strong>et</strong> al., 2003) was used<br />
for the manufacture of generic fertilisers N, P2O5 and K2O. The questionnaire provides default data for reference<br />
production systems that can be used if users do not have specific data.<br />
The Total Results and D<strong>et</strong>ailed Results she<strong>et</strong>s display results <strong>in</strong> figures and graphs for the user’s production<br />
system under study and the reference situation by functional unit and impact category. Users can compare<br />
their own results with those of the reference situation. The Total Results she<strong>et</strong> shows the total contribution<br />
of the production. The D<strong>et</strong>ailed Results she<strong>et</strong> presents results broken down by the stage <strong>in</strong> the production<br />
system.<br />
We used an attributional <strong>LCA</strong> and mass functional units were selected: 1 tonne of classic loose tomatoes<br />
for the tomato crops and 1000 stems for the rose crop. The system boundary was from raw material extraction<br />
to farm gate, <strong>in</strong>clud<strong>in</strong>g waste material disposal. The production system was structured <strong>in</strong> stages to facilitate<br />
calculations and the <strong>in</strong>terpr<strong>et</strong>ation of results: greenhouse structure, auxiliary equipment, climate control<br />
system, fertilisers, pesticides and waste management (Figure 1). The processes considered for the environmental<br />
analysis <strong>in</strong>cluded <strong>in</strong>puts and outputs <strong>in</strong> the manufacture of greenhouse components, transport of materials,<br />
material disposal and greenhouse management, i.e. water, fertilisers, pesticides, electricity consumption<br />
and energy consumption <strong>in</strong> the case of heat<strong>in</strong>g (Torrellas <strong>et</strong> al., <strong>2012</strong>). For this simplified <strong>LCA</strong> and follow<strong>in</strong>g<br />
the cut-off criteria of the ILCD Handbook (ILCD, 2010), processes with an environmental impact<br />
below 5% were omitted when they were considered not relevant to an agricultural production system. The<br />
amount of materials <strong>in</strong> the structure was calculated us<strong>in</strong>g formulas developed from a reference production<br />
system <strong>in</strong>ventory.<br />
Figure 1. Production system diagram, <strong>in</strong>clud<strong>in</strong>g stages and processes for a tomato crop <strong>in</strong>: (1a) a multi-tunnel<br />
greenhouse <strong>in</strong> European Southern climate conditions; (1b) a Venlo glasshouse <strong>in</strong> European Central climate<br />
conditions.<br />
99
PARALLEL SESSION 1C: ECODESIGN AND ENVIRONMENTAL MANAGEMENT 8 th Int. Conference on <strong>LCA</strong> <strong>in</strong> the<br />
Agri-<strong>Food</strong> Sector, 1-4 Oct <strong>2012</strong><br />
Table 1. Questionnaire summary of <strong>in</strong>put data she<strong>et</strong>, for reference and case study scenarios.<br />
Tomato crop, multi- Tomato crop, Venlo Rose crop, Venlo<br />
tunnel greenhouse glasshouse<br />
glasshouse<br />
Issue Input Units Case study Refer- Case study Refer- Case Referenceence<br />
study ence<br />
Crop Crop name Tomato Tomato Tomato Tomato Roses Roses<br />
100<br />
Yield produce·m<br />
-2<br />
20.0 kg·m -2* 16.5<br />
kg·m -2<br />
56.5 kg·m -2 56.5<br />
kg·m -2<br />
289<br />
stem·m -2*<br />
Density p·m -2 1.23 1.23 1.25 1.25 8.5 8.5<br />
Stems per plant num- 2 2 2 2<br />
ber·p -1<br />
275<br />
stem·m -<br />
2<br />
Growth period weeks 52 52 52 52 52 52<br />
Substrate Type of substrate name Perlite Perlite Rockwool RockRockRockwoolwoolwool Substrate life span years 3 3 1 1 1 1<br />
Bag volume l 30 30 14 14 6.42 6.42<br />
Plants per bag number 3 3 3 3 3 3<br />
Structure Number of spans number 10<br />
data<br />
*<br />
18 25 25 21 21<br />
Span width m 6 *<br />
8 8 8 9.6 9.6<br />
Span length m 60 * 135 200 200 200 200<br />
Roof vents: total greenhouse<br />
number<br />
number 10 * 36<br />
Gutter height m 4.0 * 4.5 6 6 6 6<br />
Ridge height m 4.5 * 5.8 6.8 6.8 6.76 6.76<br />
Greenhouse walls material LDPE * PC Clear glass Clear Diffuse<br />
glass glass *<br />
Clear<br />
glass<br />
Greenhouse frame life span years 15 15 15 15 15 15<br />
Greenhouse roof cover<strong>in</strong>g life<br />
span<br />
years 3 3 15 15 15 15<br />
Greenhouse walls life span years 3 * 15 15 15 15 15<br />
Energy Total greenhouse electricity kWh·m<br />
consumption<br />
consumption<br />
-2 0.641 0.641 10 10 633 633<br />
Water<strong>in</strong>g Water consumption L·m -2 475 475 795 795 902.5 902.5<br />
Irrigation system open/closed type Open Open Closed Closed Closed Closed<br />
Fertilisers N kg·m -2 0.050 * 0.060 0.1688 0.1688 0.1163 0.1163<br />
P2O5 kg·m -2 0.035 * 0.038 0.04058 0.04058 0.0276 0.0276<br />
K2O kg·m -2 0.135 * 0.117 0.18548 0.18548 0.128 0.128<br />
Pesticides Fungicides kg·m -2 0.00285 0.00285 0.0007 0.0007 0.0036 0.0036<br />
Insecticides kg·m -2 0.00038 0.00038 0.0003 0.0003 0.0006 0.0006<br />
Heat<strong>in</strong>g Heat<strong>in</strong>g type No heat<strong>in</strong>g No heat<strong>in</strong>g<br />
CHP CHP CHP CHP<br />
Fuel none NO NO Natural gas Natural Natural Natural<br />
gas gas gas<br />
Fuel consumption m 3 ·m -2 0.00 0.00 42.1 * 64.7 101.7 101.7<br />
*<br />
Data <strong>in</strong> case study differ<strong>in</strong>g from reference situation<br />
The <strong>in</strong>dicators and impact categories selected for the environmental assessment were: the five midpo<strong>in</strong>t<br />
impact categories def<strong>in</strong>ed by the CML2001 m<strong>et</strong>hod v.2.04 (Gu<strong>in</strong>ée <strong>et</strong> al., 2002), namely, abiotic depl<strong>et</strong>ion<br />
(kg Sb eq), acidification (kg SO2 eq), eutrophication (kg PO4 -3 eq), global warm<strong>in</strong>g (kg CO2 eq) and photochemical<br />
oxidation (kg C2H4 eq); one energy flow <strong>in</strong>dicator (cumulative energy demand, MJ); and one <strong>in</strong>ventory<br />
flow <strong>in</strong>dicator (water use, m 3 ).<br />
In this study, the environmental calculator was used to analyse three case studies. Each case was a type of<br />
production system that was compared with the correspond<strong>in</strong>g reference production system. The ma<strong>in</strong> data for<br />
each situation were <strong>in</strong>cluded <strong>in</strong> Table 1. The first case study was for tomato crop <strong>in</strong> a smaller multi-tunnel<br />
greenhouse with LDPE walls, a higher yield and lower doses of fertilisers. The second case was an energysav<strong>in</strong>g<br />
cultivation m<strong>et</strong>hod for tomato crop <strong>in</strong> a Venlo glass greenhouse with 35% reduced heat demand and<br />
the same yield. F<strong>in</strong>ally, the third case study was rose crop <strong>in</strong> a greenhouse with diffuse glass, an antireflective<br />
coat<strong>in</strong>g and a 5% higher yield.
PARALLEL SESSION 1C: ECODESIGN AND ENVIRONMENTAL MANAGEMENT 8 th Int. Conference on <strong>LCA</strong> <strong>in</strong> the<br />
Agri-<strong>Food</strong> Sector, 1-4 Oct <strong>2012</strong><br />
3. Results<br />
Potential environmental impacts are provided on the Total Results and D<strong>et</strong>ailed Results she<strong>et</strong>s. Results<br />
are expressed by functional unit <strong>in</strong> six impact categories. In this study, results were for the three production<br />
systems, <strong>in</strong>clud<strong>in</strong>g the reference situation from default data and a case study for each production system (Table<br />
2), described as follows:<br />
3.1. Tomato production <strong>in</strong> a multi-tunnel greenhouse<br />
Results for the reference situation showed that the structure, fertilisers and auxiliary equipment were major<br />
contributors to all impact categories. The structure made the greatest contribution to the impact categories<br />
of abiotic depl<strong>et</strong>ion (50%), global warm<strong>in</strong>g (37%), photochemical oxidation (54%) and cumulative energy<br />
demand (50%) due to the high amount of steel and plastic <strong>in</strong> the frame, cover<strong>in</strong>g and floor. Fertilisers were<br />
the ma<strong>in</strong> burden <strong>in</strong> acidification (39%), ma<strong>in</strong>ly because of ammonia emissions <strong>in</strong>to the air dur<strong>in</strong>g their application;<br />
and eutrophication (56%), because of nitrate emissions to water, s<strong>in</strong>ce there was an open-loop irrigation<br />
system. The auxiliary equipment had significant contributions because of substrate and electricity consumption,<br />
b<strong>et</strong>ween 16% and 39%, depend<strong>in</strong>g on the impact category. The climate control system made nil<br />
contributions, as there was no heat<strong>in</strong>g. Pesticides and waste management stages made contributions below<br />
3% <strong>in</strong> the total production system.<br />
The case study for a smaller greenhouse, lower fertiliser doses and higher yield showed contributions below<br />
the reference situation, b<strong>et</strong>ween 13% and 37%, depend<strong>in</strong>g on the impact category. Structure contributions<br />
decreased b<strong>et</strong>ween 2% and 9% as the amount of m<strong>et</strong>al and plastic was reduced. Nevertheless, relative<br />
contributions of structure <strong>in</strong>creased <strong>in</strong> the total production system. Reduction of fertiliser doses directly reduced<br />
the contribution to EUP, as a lower amount of lixiviates reached aquifers. A higher yield made reductions<br />
to all impact categories, as a mass functional unit was used.<br />
3.2. Tomato production <strong>in</strong> a Venlo glass greenhouse<br />
In this production system, a CHP was used for heat<strong>in</strong>g and electricity production. Energy allocation of<br />
natural gas was used to d<strong>et</strong>erm<strong>in</strong>e the impact of us<strong>in</strong>g natural gas to heat the greenhouse (Torrellas <strong>et</strong> al.,<br />
<strong>2012</strong>). The climate control system was the ma<strong>in</strong> contributor to all the impact categories, b<strong>et</strong>ween 81% and<br />
97% of the total <strong>in</strong> the reference situation because of the high natural gas consumption to heat the greenhouse.<br />
The structure was the second burden and made contributions b<strong>et</strong>ween 2.0% and 10% because of m<strong>et</strong>al<br />
and glass contributions. Fertilisers made contributions b<strong>et</strong>ween 0.6% and 8.6% due to emissions dur<strong>in</strong>g the<br />
manufactur<strong>in</strong>g process and ammonia emissions <strong>in</strong>to the air after these fertilisers are applied to the soil. Auxiliary<br />
equipment contributions were lower than 1.9% of the total, and those of pesticides and waste management<br />
were all around 0%.<br />
With a reduction of 35% of natural gas consumption, climate control stage contributions decreased significantly<br />
<strong>in</strong> all impact categories b<strong>et</strong>ween 22% and 33%. Nevertheless, the climate control system was still<br />
the ma<strong>in</strong> burden, with contributions b<strong>et</strong>ween 75% and 95% of the total.<br />
3.3. Rose production <strong>in</strong> a Venlo glass greenhouse<br />
The climate control system was the ma<strong>in</strong> contributor <strong>in</strong> the reference situation and <strong>in</strong> this case study because<br />
of natural gas consumption for heat<strong>in</strong>g and electricity consumption for light<strong>in</strong>g. Contributions were<br />
b<strong>et</strong>ween 98% and 99% <strong>in</strong> the reference situation and the case study. The structure made contributions below<br />
1.1% <strong>in</strong> both production systems. In the case study with diffuse glass, structural contributions <strong>in</strong>creased<br />
compared with the reference situation by b<strong>et</strong>ween 4% to 16%, depend<strong>in</strong>g on the impact category, as extra<br />
electricity was needed <strong>in</strong> the anti-reflective coat<strong>in</strong>g process. In this situation, because of the effect of a higher<br />
yield, contributions to other impact categories decreased by 4% compared with the reference situation.<br />
101
PARALLEL SESSION 1C: ECODESIGN AND ENVIRONMENTAL MANAGEMENT 8 th Int. Conference on <strong>LCA</strong> <strong>in</strong> the<br />
Agri-<strong>Food</strong> Sector, 1-4 Oct <strong>2012</strong><br />
Table 2. Contributions to impact categories for: (2a) tomato crop <strong>in</strong> a multi-tunnel greenhouse, (2b) tomato<br />
crop <strong>in</strong> a Venlo glass greenhouse and (2c) rose crop <strong>in</strong> a Venlo glass greenhouse. Values are impact category<br />
<strong>in</strong>dicators for the reference situation (Ref) and percentage variation versus the reference situation for each<br />
case study (CS). Results are by functional unit, tonne tomato for tomato crops and 1000 stems for rose crop.<br />
2a)<br />
Auxiliary Climate control<br />
Waste<br />
Impact Total Structure equipment system Fertilisers Pesticides management<br />
category<br />
ADP,<br />
Ref C Ref C Ref C Ref Ref C Ref C Ref C<br />
kg Sb eq<br />
AAP,<br />
kg SO2<br />
1.3E+00 -14 6.4E-01 -9 4.7E-01 -19 0.0E+00 1.5E-01 -24 1.8E-02 -18 1.1E-02 3<br />
eq<br />
EUP,<br />
kg PO4<br />
9.4E-01 -18 3.3E-01 -6 2.2E-01 -18 0.0E+00 3.7E-01 -30 1.2E-02 -18 5.5E-03 5<br />
-3<br />
eq<br />
GWP,<br />
kg CO2<br />
5.0E-01 -37 1.3E-01 -2 8.3E-02 -18 0.0E+00 2.8E-01 -59 7.9E-03 -18 1.5E-03 4<br />
eq<br />
POP,<br />
kg C2H4<br />
2.0E+02 -17 7.5E+01 -6 6.2E+01 -18 0.0E+00 6.2E+01 -29 2.3E+00 -18 1.3E+00 0<br />
eq<br />
CED,<br />
3.3E-02 -13 1.7E-02 -7 1.0E-02 -18 0.0E+00 4.1E-03 -27 8.7E-04 -18 2.0E-04 4<br />
MJ 3.1E+03 -14 1.6E+03 -8 1.2E+03 -18 0.0E+00 3.0E+02 -24 4.4E+01 -18 2.5E+01 3<br />
2b) 2c)<br />
102<br />
Total Climate control system<br />
Impact categories Ref C Ref C<br />
ADP, kg Sb eq 1.5E+01 -32 1.4E+01 -33<br />
AAP, kg SO2 eq 3.3E+00 -24 2.6E+00 -29<br />
EUP, kg PO4 -3 eq 8.5E-01 -18 7.0E-01 -22<br />
GWP, kg CO2 eq 1.9E+03 -31 1.8E+03 -33<br />
POP, kg C2H4 eq 2.1E-01 -29 2.0E-01 -32<br />
CED, MJ 3.1E+04 -31 3.0E+04 -33<br />
Total Structure<br />
Impact category Ref C Ref C<br />
ADP, kg Sb eq 1.3E+01 -4 6.0E-02 11<br />
AAP, kg SO2 eq 5.9E+00 -4 5.7E-02 5<br />
EUP, kg PO4 -3 eq 3.4E+00 -4 1.8E-02 16<br />
GWP, kg CO2 eq 1.7E+03 -4 9.6E+00 8<br />
POP, kg C2H4 eq 2.6E-01 -4 2.6E-03 4<br />
CED, MJ 3.4E+04 -4 1.4E+02 14<br />
4. Discussion<br />
In this section we discuss the ma<strong>in</strong> results achieved <strong>in</strong> the study, the m<strong>et</strong>hodology used and the benefits<br />
and drawbacks of the environmental calculator. Additionally, we propose several po<strong>in</strong>ts that could be improved<br />
with future research.<br />
The ma<strong>in</strong> objective of this study was achieved with the development of an easy-to-use environmental<br />
software tool to evaluate the environmental performance of protected horticultural production systems. We<br />
consider this calculator to be a useful contribution for decision mak<strong>in</strong>g for a mix of users <strong>in</strong>volved <strong>in</strong> horticulture.<br />
<strong>LCA</strong> was appropriate to evaluate the potential impacts of protected crops objectively and transparently.<br />
The simplification of <strong>LCA</strong> <strong>in</strong> the design of this tool was done follow<strong>in</strong>g <strong>in</strong>ternational standards and guidel<strong>in</strong>es<br />
(ISO-14040, 2006 and ILCD, 2010) to justify the <strong>in</strong>clusion or exclusion of processes. As a result, the<br />
tool <strong>in</strong>cludes a justified representation of the most significant processes <strong>in</strong> a greenhouse production system.<br />
Users can easily simulate their crops and evaluate the effect on the environment of alternatives by reduc<strong>in</strong>g<br />
<strong>in</strong>puts and improv<strong>in</strong>g waste management practices. The calculator provides approximate but good quality<br />
results to compare different scenarios and follow the evolution of cleaner agricultural practices. Different<br />
damage to the environment can be studied, as six midpo<strong>in</strong>t impact categories were <strong>in</strong>cluded. The analysis of<br />
these very different structures, multi-tunnel and Venlo greenhouses, was adequately resolved by the development<br />
of specific spreadshe<strong>et</strong>s and formulas to calculate their structural materials.<br />
Simplicity is one of the ma<strong>in</strong> advantages of this calculator, but it was also the cause of some limitations.<br />
Many variables that affect agricultural systems could not be implemented <strong>in</strong> the calculator, such as geography,<br />
climate, soil characteristics, water availability and management practices such as conventional and organic<br />
farm<strong>in</strong>g. The regional variation of electricity production was not considered and consequently a more<br />
precise calculation of emissions is not possible (Torrellas, submitted). Many of these issues could be solved<br />
by <strong>in</strong>clud<strong>in</strong>g more spatial datas<strong>et</strong>s or by design<strong>in</strong>g open-source software. Fertiliser and pesticide results<br />
could be more d<strong>et</strong>ailed and pesticide toxicity could be <strong>in</strong>cluded. Therefore, the tool should be able to update<br />
the characterisation models with more recent ones such as USEtox (Rosenbaum <strong>et</strong> al., 2008) and ReCiPe<br />
(Goedkoop <strong>et</strong> al., 2009).
PARALLEL SESSION 1C: ECODESIGN AND ENVIRONMENTAL MANAGEMENT 8 th Int. Conference on <strong>LCA</strong> <strong>in</strong> the<br />
Agri-<strong>Food</strong> Sector, 1-4 Oct <strong>2012</strong><br />
The environmental tool was successfully tested by a group of agriculture support technicians. Nevertheless,<br />
the authors believe that future research <strong>in</strong>to the topics discussed above could improve the tool. Of<br />
course, the op<strong>in</strong>ions of users will be very helpful so the tool can be adapted to their needs.<br />
5. Conclusion<br />
This environmental calculator is a useful tool to evaluate the potential environmental impacts of protected<br />
crops and gives results for several impact categories. The tool is designed for a mix of users to support decision<br />
mak<strong>in</strong>g. A simplified <strong>LCA</strong> was used to design the calculator. Nevertheless, the tool could be improved<br />
by consider<strong>in</strong>g other types of agricultural systems, the regional variability <strong>in</strong> water use assessment and electricity<br />
production, and consistent long-term datas<strong>et</strong>s, and by mak<strong>in</strong>g use of the latest advances <strong>in</strong> modell<strong>in</strong>g<br />
and comput<strong>in</strong>g techniques. Users’ op<strong>in</strong>ions will be valuable so the tool can be adapted to their needs.<br />
6. References<br />
Amores Barrero, M.J., Ferrer, F., Cabot, O., Duaigües, A., Antón, A., Castells, F. Implement<strong>in</strong>g decision mak<strong>in</strong>g <strong>in</strong> water management<br />
<strong>in</strong> agriculture based on environmental <strong>in</strong>dicators. 8th International Conference on <strong>LCA</strong> <strong>in</strong> the Agri-<strong>Food</strong> Sector, Rennes,<br />
<strong>France</strong>, 2-4 October <strong>2012</strong>.<br />
Eco<strong>in</strong>vent, 2010. Eco<strong>in</strong>vent Data v2.2. Swiss Centre for Life Cycle Inventories.<br />
EUPHOROS 2008-<strong>2012</strong>. Efficient use of <strong>in</strong>puts <strong>in</strong> protected horticulture. In:KBBE-2007-12-04 SFPT.<br />
F<strong>in</strong>kbe<strong>in</strong>er, M., 2009. Carbon footpr<strong>in</strong>t<strong>in</strong>g – opportunities and threats. International Journal <strong>LCA</strong> 14:91-94.<br />
Goedkoop, M., Heijungs, R., Huijbregts, J., Schryver, A., Struijs, J., Zelm, R., 2009. ReCiPe 2008, A life cyle impact assessment<br />
m<strong>et</strong>hod which comprises harmonised category <strong>in</strong>dicators at the midpo<strong>in</strong>t and the endpo<strong>in</strong>t level.<br />
Gu<strong>in</strong>ée, J.B., Gorrée, M., Heijungs, R., Huppes, G.R.K., de Kon<strong>in</strong>g, A., <strong>et</strong> al., 2002. Handbook on Life Cycle Assessment. Operational<br />
Guide to the ISO Standards. Kluwer, Dordrecht, The N<strong>et</strong>herlands.<br />
Hillier, J., Water, C., Mal<strong>in</strong>, D., Garcia-Suarez, T., Mila-i-Canals, Ll., Smith, P., 2011, A farm-focused calculator for emissions from<br />
crop and livestock production. Environmental Modell<strong>in</strong>g & Software 26:1070-1078.<br />
ILCD, 2010. International Reference Life Cycle Data System Handbook. European Commission. Jo<strong>in</strong>t Research Centre. Institute for<br />
Environment and Susta<strong>in</strong>ability,<br />
ISO-14040, 2006. Environmental management-Life cycle assessment-Pr<strong>in</strong>ciples and framework. International Organisation for Standardisation<br />
ISO. Geneva.<br />
Montero, J.I., Antón, A., Torrellas, M., Ruijs, M., Vermeulen, P., 2011. Report on environmental and economic profile of present<br />
greenhouse production systems <strong>in</strong> Europe. European Comission. FP7-KBBE-2007-1. EUPHOROS project.<br />
http://www.euphoros.wur.nl/UK<br />
Nielsen, P., Nielsen, A., Weidema, B., Dalgaard, R, Halberg, N., 2003. <strong>LCA</strong> food data base.<br />
Pidd, M., Five simple pr<strong>in</strong>ciples of modell<strong>in</strong>g. The 1996 W<strong>in</strong>ter Simulation Conference, Coronado, California, USA, 8-11 December<br />
1996.<br />
Rosenbaum, R., Bachmann, T., Gold, LS., Huijbregts, M., Jolli<strong>et</strong>, O., Juraske, R., Koehler, A., Larsen, H. MacLeod, M., Margni, M.,<br />
McKone, T., Pay<strong>et</strong>, J., Schuhmacher, M., Meent, D., Hauschild, M. 2008. USEtox- the UNEP-SETAC toxicity model: recommended<br />
characterisation factors for human toxicity and freshwater ecotoxicity <strong>in</strong> life cycle impact assessment. International<br />
Journal <strong>LCA</strong>.<br />
Torrellas, M., Antón, A., Ruijs, M., García, N., Stanghell<strong>in</strong>i, C., Montero, J.I., <strong>2012</strong>. Environmental and economic assessment of<br />
protected crops <strong>in</strong> four European scenarios. Journal of Cleaner Production 28:45-55. doi:10.1016/j.jclepro.2011.11.012.<br />
103
PLENARY SESSION 1: FOOD 8 th Int. Conference on <strong>LCA</strong> <strong>in</strong> the<br />
Plenary session 1: <strong>Food</strong><br />
104<br />
Agri-<strong>Food</strong> Sector, 1-4 Oct <strong>2012</strong><br />
Environmental impacts of food consumption and its reduction<br />
potentials<br />
ESU-services Ltd., CH-8610 Uster, www.esu-services.ch<br />
Correspond<strong>in</strong>g author. E-mail: jungbluth@esu-services.ch<br />
Niels Jungbluth * , René Itten, Salome Schori<br />
ABSTRACT<br />
Nutrition accounts for 30% of environmental impacts caused due to the f<strong>in</strong>al consumption of Swiss households. Therefore, it is necessary<br />
to <strong>in</strong>vestigate possibilities for the reduction of these impacts. We developed a general framework for such an analysis. Based<br />
on a more d<strong>et</strong>ailed analysis of this consumption doma<strong>in</strong>, it is <strong>in</strong>vestigated, for which percentage environmental impacts can be reduced<br />
by a certa<strong>in</strong> change <strong>in</strong> consumer behaviour. F<strong>in</strong>ally, the result<strong>in</strong>g values are used to estimate the potential reduction compared<br />
to the total environmental impacts. With a comb<strong>in</strong>ation of different measures such as less meat and luxury products, no products<br />
grown <strong>in</strong> heated greenhouses and reduction of obesity and wastages, it would be possible to reduce the environmental impacts of<br />
nutrition by two thirds and the total household consumption by more than 10%.The most promis<strong>in</strong>g s<strong>in</strong>gle lifestyle change is a veg<strong>et</strong>arian<br />
di<strong>et</strong>. This general framework has also been used to <strong>in</strong>vestigate reduction potentials <strong>in</strong> the consumption doma<strong>in</strong>s of mobility and<br />
energy use of households.<br />
Keywords: food consumption, reduction potential, environmentally friendly di<strong>et</strong>, susta<strong>in</strong>able life styles<br />
1. Introduction<br />
Nutrition accounts for about 30% of environmental impacts caused due to the f<strong>in</strong>al consumption of Swiss<br />
households (Figure 1, Jungbluth <strong>et</strong> al., 2011). This value does not even <strong>in</strong>clude meals consumed <strong>in</strong> restaurants,<br />
hospitals and r<strong>et</strong>irement homes. It is thus the most important consumption doma<strong>in</strong> from an environmental<br />
po<strong>in</strong>t of view. Therefore, it is necessary to <strong>in</strong>vestigate and understand the environmental impacts of<br />
food consumption and possibilities for the reduction of environmental impacts.<br />
Figure 1. Share of environmental impacts of different household activities evaluated with the ecological<br />
scarcity m<strong>et</strong>hod 2006 (Jungbluth <strong>et</strong> al., 2011).<br />
2. M<strong>et</strong>hods<br />
Several options for reduc<strong>in</strong>g environmental impacts were compared with<strong>in</strong> a general framework. Besides<br />
the consumption of food products also reduction potentials for impacts due to energy use <strong>in</strong> households and<br />
private mobility were <strong>in</strong>vestigated <strong>in</strong> order to assess potential impacts of more susta<strong>in</strong>able lifestyles<br />
(Jungbluth <strong>et</strong> al., <strong>2012</strong>a; Jungbluth & Itten <strong>2012</strong>).<br />
The ecological scarcity m<strong>et</strong>hod was used as a key <strong>in</strong>dicator for the impact assessment (Frischknecht <strong>et</strong> al.,<br />
2009), but the results were also compared with respects to greenhouse gas emissions and energy use. Such a<br />
s<strong>in</strong>gle-po<strong>in</strong>t <strong>in</strong>dicator, summariz<strong>in</strong>g all relevant environmental impacts, is seen as a necessity for the communication<br />
of <strong>LCA</strong> results to the consumers (Jungbluth <strong>et</strong> al., 2011a).<br />
In a first step of analysis the share of the environmental impacts related to food consumption was <strong>in</strong>vestigated<br />
(as shown <strong>in</strong> Figure 1) with a top-down approach us<strong>in</strong>g an environmentally-extend Input-Output-<br />
Analysis (EE-IOA) for Switzerland (Jungbluth <strong>et</strong> al., 2011).
PLENARY SESSION 1: FOOD 8 th Int. Conference on <strong>LCA</strong> <strong>in</strong> the<br />
Agri-<strong>Food</strong> Sector, 1-4 Oct <strong>2012</strong><br />
In a second step the consumption sector of nutrition was split up <strong>in</strong>to different categories of consumed<br />
products. This calculation is based on food consumption statistics (Schweizerischer Bauernverband 2007)<br />
and life cycle assessment (<strong>LCA</strong>) data (Jungbluth <strong>et</strong> al., <strong>2012</strong>b).<br />
The contributions to the total impact of the different food items for the second step (bottom-up approach)<br />
are shown <strong>in</strong> Figure 2. Meat and fish account for about one quarter of the environmental impacts due to food<br />
consumption. Tog<strong>et</strong>her with milk and eggs, animal products account for nearly half of the environmental<br />
impacts. Coffee and alcohol are the most important s<strong>in</strong>gle products with<strong>in</strong> the category of beverages. This is<br />
due to the pesticides and copper applied dur<strong>in</strong>g the grow<strong>in</strong>g of the basic agricultural products. Transports,<br />
packages and process<strong>in</strong>g are of m<strong>in</strong>or importance for the overall environmental impacts.<br />
Figure 2. Importance of different product groups <strong>in</strong> total environmental impacts of nutrition evaluated with<br />
the ecological scarcity m<strong>et</strong>hod 2006 (Jungbluth <strong>et</strong> al., <strong>2012</strong>a; Jungbluth & Itten <strong>2012</strong>)<br />
The results for the top-down (share of nutrition <strong>in</strong> Figure 1) and bottom-up approaches (Figure 2) are<br />
compared <strong>in</strong> Figure 3. The overall differences are small. For some impact categories results differ because of<br />
the more general allocation schemes used <strong>in</strong> the EE-IOA.<br />
Figure 3. Comparison of top-down and bottom-up approaches accord<strong>in</strong>g to s<strong>in</strong>gle impact categories <strong>in</strong> the<br />
ecological scarcity m<strong>et</strong>hodology. Total eco-po<strong>in</strong>ts due to nutrition accord<strong>in</strong>g to the ecological scarcity<br />
m<strong>et</strong>hod 2006 per person and year.<br />
Based on the d<strong>et</strong>ailed analysis of this consumption doma<strong>in</strong>, it was <strong>in</strong>vestigated, by which percentage environmental<br />
impacts can be reduced due to a certa<strong>in</strong> change <strong>in</strong> consumer behaviour. In this paper we highlight<br />
and compare the reduction of total environmental impacts, if all consumers would:<br />
1. Buy locally<br />
2. Buy seasonally<br />
105
PLENARY SESSION 1: FOOD 8 th Int. Conference on <strong>LCA</strong> <strong>in</strong> the<br />
106<br />
3. Eat veg<strong>et</strong>arian<br />
4. Buy organic food<br />
5. Resign on luxury food (coffee, alcohol)<br />
6. Reduce food wastes<br />
7. Reduce obesity to normal weight<br />
8. Comb<strong>in</strong>e different changes <strong>in</strong> a healthy and environmentally friendly di<strong>et</strong><br />
Agri-<strong>Food</strong> Sector, 1-4 Oct <strong>2012</strong><br />
Several assumptions were necessary <strong>in</strong> order to model these scenarios for a potentially susta<strong>in</strong>able di<strong>et</strong>.<br />
Ad 1: Buy<strong>in</strong>g locally should reduce the environmental impacts due to transportation. However, some restrictions<br />
have to be considered. Switzerland is only 50% self-sufficient with respects to food production; the<br />
rest has to be imported as long as consumption patterns do not change. Buy<strong>in</strong>g exclusively locally would<br />
only be an option for all consumers if meat consumption is reduced considerably <strong>in</strong> parallel (Würtenberger<br />
2003; BWL 2011). Thus, here we assume only that air-transported products are avoided. It was not possible<br />
to model the change of environmental impacts due to the variation of production patterns <strong>in</strong> different countries<br />
<strong>in</strong>clud<strong>in</strong>g a potentially <strong>in</strong>creased share of greenhouse products which might be bought as regional products.<br />
Ad 2: The ma<strong>in</strong> aim of buy<strong>in</strong>g seasonal fruits and veg<strong>et</strong>ables is reduc<strong>in</strong>g environmental impacts due to<br />
the production <strong>in</strong> heated greenhouses. In the calculation this was considered by reduc<strong>in</strong>g the amount of fruits<br />
and veg<strong>et</strong>ables produced <strong>in</strong> heated greenhouses by 90%. Not considered is the possible reduction of transport<br />
distances if only seasonal products from the region are bought.<br />
Ad 3: A veg<strong>et</strong>arian di<strong>et</strong> <strong>in</strong>cludes several alimentary changes <strong>in</strong> order to replace meat products with milk<br />
and eggs and other foodstuffs. The assumption that environmental impacts can be reduced by about 30% is<br />
based on a literature review (Faist 2000; Jungbluth 2000; Kramer 2000; Leuenberger & Jungbluth 2009;<br />
Seemüller 2001; Taylor 2000; Uitdenbogerd <strong>et</strong> al., 1998).<br />
Ad 4: In the scenario for organic food it is assumed that all products are produced <strong>in</strong> organic agriculture.<br />
For most of the food products we had organic datas<strong>et</strong>s for the calculation at our disposal (Jungbluth <strong>et</strong> al.,<br />
<strong>2012</strong>b). For some imported food products, e.g. rice, there was no LCI data on organic production available<br />
and thus no change has been considered. Furthermore it is considered <strong>in</strong> the calculation that the Swiss regulations<br />
for most organic labels prohibit the production <strong>in</strong> heated greenhouses and aircraft transport.<br />
Ad 5: Luxury food (som<strong>et</strong>imes also called stimulants) is def<strong>in</strong>ed as food products which are not necessary<br />
from a nutritional po<strong>in</strong>t of view or which might even be unhealthy. Here we assume that Swiss consumers<br />
cease dr<strong>in</strong>k<strong>in</strong>g alcohol and coffee. Further issues would be the reduction of sugar conta<strong>in</strong><strong>in</strong>g products such as<br />
cake and chocolate and the reduction of fatty snacks. This has not y<strong>et</strong> been considered <strong>in</strong> the modell<strong>in</strong>g.<br />
Ad 6: Consumers also throw away food which would have been perfectly fit to eat, e.g. because they buy<br />
or cook too much. About 15% of the food products produced undergo this fate (Gustavsson <strong>et</strong> al., 2011).<br />
Here we assume that the consumers don’t waste any food. However the wastage <strong>in</strong> other parts of the life<br />
cycle was not altered for this calculation.<br />
Ad 7: Obesity is a serious health problem <strong>in</strong> many wealthy countries. In 2007 about 37% of the Swiss<br />
adults had a body mass <strong>in</strong>dex (BMI) higher than 25 3 . Here we assume that food consumption is reduced by<br />
all consumers to a level that they do not reach a BMI of over 25. This would lead to a reduction of the average<br />
body weight of about 3.7 kg (or 10 kg for overweight people). The calculations for the reduction of food<br />
consumed are based on a conference paper (Cordella <strong>et</strong> al., 2009). Due to lack of data, a general reduction of<br />
food consumption has been assumed, not consider<strong>in</strong>g that ma<strong>in</strong>ly soft dr<strong>in</strong>ks, fat and sugar might be responsible<br />
for obesity (Zwick & Müller <strong>2012</strong>).<br />
Ad 8: For the last scenario an environmentally friendly and healthy di<strong>et</strong> is assumed. Here meat consumption<br />
is reduced to about 2 portions a week. This corresponds to the amount recommended by health specialists.<br />
Furthermore different options mentioned before are comb<strong>in</strong>ed <strong>in</strong> order to assess a realistic scenario that<br />
can be followed by all consumers. The assumptions are based on the previous assessments and a review of<br />
relevant literature (Carlsson-Kanyama <strong>et</strong> al., 2003; Fazeni 2011; Grießhammer <strong>et</strong> al., 2010; Jungbluth 2000;<br />
Kramer 2000; Meier & Christen <strong>2012</strong>). This option is also promoted by nutritionists (von Koerber <strong>et</strong> al.,<br />
1999).<br />
A n<strong>in</strong>th <strong>in</strong>terest<strong>in</strong>g option for impact reduction would be a smok<strong>in</strong>g stop. (Tabaco products also fall <strong>in</strong> the<br />
consumption sector nutrition.) Due to lack of data this scenario could only be <strong>in</strong>vestigated qualitatively.<br />
The approach taken <strong>in</strong> order to assess the reduction potentials is expla<strong>in</strong>ed here with an example for option<br />
4, which assumes the purchase of organically produced food items (Figure 4). The latter would reduce<br />
the total impacts of food consumption by about 15%. The d<strong>et</strong>ailed analysis with the ecological scarcity<br />
3 http://www.bag.adm<strong>in</strong>.ch/themen/ernaehrung_bewegung/05207/05218/05232/<strong>in</strong>dex.html?lang=de, 12.9.2011
PLENARY SESSION 1: FOOD 8 th Int. Conference on <strong>LCA</strong> <strong>in</strong> the<br />
Agri-<strong>Food</strong> Sector, 1-4 Oct <strong>2012</strong><br />
m<strong>et</strong>hod shows that impacts of organic products are considerably lower with regard to the use of plant protection<br />
products. On the other side there are higher impacts due to heavy m<strong>et</strong>al emissions to soil <strong>in</strong> organic agriculture<br />
which is ma<strong>in</strong>ly due to the use of copper as a plant protection product. For many other impact categories<br />
the average impacts accord<strong>in</strong>g to the food bask<strong>et</strong> are comparable.<br />
Figure 4. Comparison of the average di<strong>et</strong> with a di<strong>et</strong> based on organically grown products with the ecological<br />
scarcity m<strong>et</strong>hod 2006 (Jungbluth <strong>et</strong> al., <strong>2012</strong>a; Jungbluth & Itten <strong>2012</strong>)<br />
3. Results<br />
The reduction potentials for the different scenarios described before are shown <strong>in</strong> Figure 5. The highest<br />
potential reduction was calculated for a comb<strong>in</strong>ation of different measures. With<strong>in</strong> the healthy and environmentally<br />
friendly di<strong>et</strong>, it is assumed that meat consumption is reduced to two portions of meat a week <strong>in</strong>stead<br />
of six. Furthermore, air-transported products are avoided and only seasonal fruits and veg<strong>et</strong>ables are bought.<br />
These measures lead to a reduction of the environmental impacts of domestic nutrition by two thirds and<br />
total household consumption by more than 10%. The most promis<strong>in</strong>g s<strong>in</strong>gle change <strong>in</strong> lifestyle is a veg<strong>et</strong>arian<br />
di<strong>et</strong>. On the other side a change to merely a regional or seasonal choice of products does not show a high<br />
potential for reduc<strong>in</strong>g the total environmental impacts. The choice for seasonal products is only relevant for<br />
fruits and veg<strong>et</strong>ables, which make up a small share of the total environmental impacts. Buy<strong>in</strong>g locally is a<br />
restricted option <strong>in</strong> Switzerland due to the <strong>in</strong>sufficient production capacities with<strong>in</strong> the country.<br />
Figure 5. Reduction potentials for the total environmental impacts due to behavioural changes <strong>in</strong> food consumption<br />
evaluated with the ecological scarcity m<strong>et</strong>hod 2006<br />
4. Discussion<br />
The approach developed <strong>in</strong> this research project allows a comparison of different options for the reduction<br />
of environmental impacts due to food consumption patterns or with<strong>in</strong> other fields of consumption. The re-<br />
107
PLENARY SESSION 1: FOOD 8 th Int. Conference on <strong>LCA</strong> <strong>in</strong> the<br />
Agri-<strong>Food</strong> Sector, 1-4 Oct <strong>2012</strong><br />
search focuses on the options that can be followed up by private food consumers. An additional reduction of<br />
environmental impacts is possible if further measures are taken with<strong>in</strong> the production cha<strong>in</strong>. Such options<br />
would be for example the reduction of wastes throughout the production cha<strong>in</strong> or the improvement of farm<strong>in</strong>g<br />
practices from an environmental po<strong>in</strong>t of view.<br />
The difficulties aris<strong>in</strong>g for s<strong>in</strong>gle persons from implement<strong>in</strong>g these options for susta<strong>in</strong>able lifestyles have<br />
not been considered for the conclusions <strong>in</strong> this article nor have rebound effects been taken <strong>in</strong>to account. An<br />
evaluation based on carbon footpr<strong>in</strong>t or energy demand alone comes to partly different conclusions because<br />
<strong>in</strong> this case impacts from transport<strong>in</strong>g and energy consumption (e.g. heated greenhouses) become more important<br />
(Jungbluth <strong>et</strong> al., <strong>2012</strong>a; Wiegmann <strong>et</strong> al., 2005).<br />
Furthermore also reduction potentials <strong>in</strong> the consumption doma<strong>in</strong>s of mobility and energy use <strong>in</strong> private<br />
households were evaluated, but are not focussed on <strong>in</strong> this paper.<br />
5. Conclusion<br />
This research project shows that <strong>in</strong> order to reach a healthy and environmentally friendly consumption<br />
pattern several nutritional adjustments should be comb<strong>in</strong>ed. Nevertheless, the reduction of meat and animal<br />
products is the most important issue from an environmental po<strong>in</strong>t of view. The second most promis<strong>in</strong>g approach<br />
is the reduction of luxury food. Considerable reduction of total environmental impacts are possible if<br />
consumers would follow these suggestions.<br />
6. References<br />
BWL (2011) Berechnung theor<strong>et</strong>isches Produktionspotential Fruchtfolgeflächen. Bundesamt für wirtschaftliche Landesversorgung<br />
(BWL), Bern, CH, r<strong>et</strong>rieved from: http://www.bwl.adm<strong>in</strong>.ch/themen/01006/<strong>in</strong>dex.html?lang=de.<br />
Carlsson-Kanyama A., Pipp<strong>in</strong>g Ekström M. and Shanahan H. (2003) <strong>Food</strong> and life cycle energy <strong>in</strong>puts: consequences of di<strong>et</strong> and<br />
ways to <strong>in</strong>crease efficiency. In: Ecological Economics(DOI 10.1016/S0921-8009(02)00261-6).<br />
Cordella M., Tugnoli A. and Santarelli F. (2009) An <strong>LCA</strong> approach to the Environmental Impact of Overweight and Obesity. University<br />
of Bologna.<br />
Faist M. (2000) Ressourceneffizienz <strong>in</strong> der Aktivität Ernähren: Akteurbezogene Stoffflussanalyse. Dissertation Nr. 13884. Eidgenössische<br />
Technische Hochschule Zürich, Zürich, r<strong>et</strong>rieved from: e-collection.<strong>et</strong>hbib.<strong>et</strong>hz.ch/show?type=diss&nr=13884.<br />
Fazeni K. (2011) Energiebilanzen und Treibhausgasemissionen der österreichischen Landwirtschaft unter Berücksichtigung von<br />
Ernährungsgewohnheiten. In proceed<strong>in</strong>gs from: Abschlussveranstaltung Gesunde Ernährung und Nachhaltigkeit, 21.06.2011, r<strong>et</strong>rieved<br />
from: http://iwr.tuwien.ac.at/wasser/projektseiten/gern/kam<strong>in</strong>abende.html.<br />
Frischknecht R., Ste<strong>in</strong>er R. and Jungbluth N. (2009) The Ecological Scarcity M<strong>et</strong>hod - Eco-Factors 2006: A m<strong>et</strong>hod for impact assessment<br />
<strong>in</strong> <strong>LCA</strong>. Federal Office for the Environment FOEN, Zürich und Bern, r<strong>et</strong>rieved from:<br />
www.bafu.adm<strong>in</strong>.ch/publikationen/publikation/01031/<strong>in</strong>dex.html?lang=en.<br />
Grießhammer R., Brommer E., Gattermann M., Gr<strong>et</strong>her S., Krüger M., Teufel J. and Zimmer W. (2010) CO2-E<strong>in</strong>sparpotenziale für<br />
Verbraucher. Öko-Institut, Berl<strong>in</strong>, r<strong>et</strong>rieved from: http://www.verbraucherfuersklima.de/cps/rde/xbcr/projektklima/CO2-<br />
E<strong>in</strong>sparpotentiale-Oeko-Institut.pdf.<br />
Gustavsson J., Cederberg C., Sonesson U., van Otterdijk R. and Meybeck A. (2011) Global food losses and food waste: Extent,causes<br />
and prevention. Swedish Institute for <strong>Food</strong> and Biotechnology (SIK) commissioned by <strong>Food</strong> And Agriculture Organization<br />
Of The United Nations, Gothenburg, Sweden, r<strong>et</strong>rieved from:<br />
http://www.fao.org/fileadm<strong>in</strong>/user_upload/ags/publications/GFL_web.pdf.<br />
Jungbluth N. (2000) Umweltfolgen des Nahrungsmittelkonsums: Beurteilung von Produktmerkmalen auf Grundlage e<strong>in</strong>er modularen<br />
Ökobilanz. Dissertation Nr. 13499. Eidgenössische Technische Hochschule Zürich, Umweltnatur- und Umweltsozialwissenschaften,<br />
dissertation.de, Berl<strong>in</strong>, D, r<strong>et</strong>rieved from: www.esu-services.ch/address/niels/nahrungsmittelkonsum/.<br />
Jungbluth N., Nathani C., Stucki M. and Leuenberger M. (2011) Environmental impacts of Swiss consumption and production: a<br />
comb<strong>in</strong>ation of <strong>in</strong>put-output analysis with life cycle assessment. Environmental studies no. 1111. ESU-services Ltd. & Rütter+Partner,<br />
commissioned by the Swiss Federal Office for the Environment (FOEN), Bern, CH, r<strong>et</strong>rieved from: www.esuservices.ch/projects/ioa/<br />
or www.umwelt-schweiz.ch.<br />
Jungbluth N., Itten R. and Stucki M. (<strong>2012</strong>a) Umweltbelastungen des privaten Konsums und Reduktionspotenziale. ESU-services<br />
Ltd. im Auftrag des BAFU, Uster, CH, r<strong>et</strong>rieved from: http://www.esu-services.ch/projects/lifestyle/.<br />
Jungbluth N. and Itten R. (<strong>2012</strong>) Umweltbelastungen des Konsums <strong>in</strong> der Schweiz und <strong>in</strong> der Stadt Zürich: Grundlagendaten und<br />
Reduktionspotenziale. ESU-services GmbH im Auftrag der Stadt Zürich (unpublished), Zürich.<br />
Jungbluth N., Flury K., Büsser S., Stucki M., Schori S., Itten R. and Frischknecht R. (<strong>2012</strong>b) Life cycle <strong>in</strong>ventory database on demand:<br />
EcoSpold LCI database of ESU-services. ESU-services Ltd., Uster, CH, r<strong>et</strong>rieved from: www.esu-services.ch/data/dataon-demand/.<br />
Kramer K. J. (2000) <strong>Food</strong> matters: On reduc<strong>in</strong>g energy use and greenhouse gas emissions from household food consumption. Ph.d.<br />
Thesis. Center for Energy and Environmental Studies of the University of Gron<strong>in</strong>gen (IVEM RUG), The N<strong>et</strong>herlands, r<strong>et</strong>rieved<br />
from: www.foodmatters.tmfweb.nl.<br />
Leuenberger M. and Jungbluth N. (2009) Ökoprofil von veg<strong>et</strong>arischen und fleischhaltigen Grossküchenmahlzeiten. ESU-services<br />
GmbH im Auftrag des WWF Schweiz, Uster, CH.<br />
Meier T. and Christen O. (<strong>2012</strong>) Factor gender <strong>in</strong> an environmental assessment of the consumption of animal- and plant-based foods<br />
<strong>in</strong> Germany. In: Int J <strong>LCA</strong>, 17(5), pp. 550-564, 10.1007/s11367-012-0387-x r<strong>et</strong>rieved from:<br />
http://www.spr<strong>in</strong>gerl<strong>in</strong>k.com/content/l415530205u58376/.<br />
Schweizerischer Bauernverband (2007) Statistische Erhebungen und Schätzungen - über Landwirtschaft und Ernährung 2006. Abt.<br />
Statistik, Brugg, CH, r<strong>et</strong>rieved from: www.bauernverband.ch.<br />
108
PLENARY SESSION 1: FOOD 8 th Int. Conference on <strong>LCA</strong> <strong>in</strong> the<br />
Agri-<strong>Food</strong> Sector, 1-4 Oct <strong>2012</strong><br />
Seemüller M. (2001) Ökologische bzw. konventionell-<strong>in</strong>tegrierte Landbewirtschaftung: E<strong>in</strong>fluss auf die Ernährungssicherung <strong>in</strong><br />
Deutschland <strong>in</strong> Abhängigkeit vom Konsumanteil tierischer Lebensmittel. In: Zeitschrift für Ernährungsökologie, 2(2), pp. 94-96,<br />
r<strong>et</strong>rieved from: www.scientificjournals.com/erno/welcome.htm.<br />
Taylor C. (2000) Ökologische Bewertung von Ernährungsweisen anhand ausgewählter Indikatoren. Inauguraldissertation. Justus-<br />
Liebig-Universität Gießen, r<strong>et</strong>rieved from: bibd.uni-giessen.de/ghtm/2000/uni/d000074.htm.<br />
Uitdenbogerd D. E., Brouwer N. M. and Groot-Marcus J. P. (1998) Domestic energy sav<strong>in</strong>g potentials for food and textiles - An<br />
empirical study. 2. Wagen<strong>in</strong>gen Agricultural University, Wagen<strong>in</strong>gen.<br />
von Koerber K., Männle T., Leitzmann C., Eis<strong>in</strong>ger M., Watzl B. and Weiss G. (1999) Vollwert-Ernährung: Konzeption e<strong>in</strong>er zeitgemässen<br />
Ernährungsweise. 9 Edition. Haug, ISBN 3-7760-1734-1, Heidelberg.<br />
Wiegmann K., Eberle U., Fritsche U. and Hünecke K. (2005) Umweltauswirkungen von Ernährung - Stoffstromanalysen und<br />
Szenarien. Öko-Institut, Darmstadt.<br />
Würtenberger L. (2003) Import and Export of Agricultural Land Use. Diplomarbeit Nr. 1/03. Eidgenössische Technische<br />
Hochschule, Zürich.<br />
Zwick M. M. and Müller C. (<strong>2012</strong>) Umweltauswirkungen des Ernährungsverhaltens von normalgewichtigen, übergewichtigen und<br />
adipösen Jugendlichen. In: Stuttgarter Beiträge zur Risiko und Nachhaltigkeitsforschung: Juvenile Adipositas aus soziologischer,<br />
psychologischer und sozialökologischer Perspektive, Vol. 24 (ed. Zwick M. M.).<br />
109
PLENARY SESSION 1: FOOD 8 th Int. Conference on <strong>LCA</strong> <strong>in</strong> the<br />
Agri-<strong>Food</strong> Sector, 1-4 Oct <strong>2012</strong><br />
Gender and di<strong>et</strong>ary recommendations <strong>in</strong> an IO-<strong>LCA</strong> of food<br />
consumption <strong>in</strong> Germany<br />
Toni Meier * , Olaf Christen<br />
Institute of Agricultural and Nutritional Sciences, Mart<strong>in</strong>-Luther-University Halle-Wittenberg, B<strong>et</strong>ty-<br />
Heimann-Straße 5, 06120 Halle (Saale), Germany<br />
Correspond<strong>in</strong>g author. E-mail: toni.meier@nutrition-impacts.org<br />
ABSTRACT<br />
Besides technical improvements and a reduction of food losses <strong>in</strong> the food cha<strong>in</strong>, di<strong>et</strong> shifts offer practicable opportunities to reduce<br />
environmental impacts <strong>in</strong> the agri-food sector on a low-cost level. Due to their production <strong>in</strong>tensity, different foods of animal or plant<br />
orig<strong>in</strong> play a crucial role <strong>in</strong> the assessment of the environmental impacts of human nutrition and di<strong>et</strong>ary habits. Based on a representative<br />
nutrition survey <strong>in</strong> Germany from the year 2006, a life cycle assessment was conducted to quantify nutrition-related impacts,<br />
with a special focus on the socio-demographic factor gender <strong>in</strong> comparison with different di<strong>et</strong>ary recommendations, di<strong>et</strong>ary styles<br />
and the average di<strong>et</strong> profile 20 years ago. Regard<strong>in</strong>g the analysed scenarios the highest impact changes would be expected from the<br />
vegan and the ovo-lacto veg<strong>et</strong>arian di<strong>et</strong>. The impact potentials of the recommendations of UGB and D-A-CH range on the 3rd and<br />
4th position, but are still significant. Concern<strong>in</strong>g gender the average female di<strong>et</strong> is already closer to the recommendations. In comparison<br />
to the years 1985-89 all <strong>in</strong>dicators (exception blue water) show lower impacts, ma<strong>in</strong>ly derived by changes <strong>in</strong> the di<strong>et</strong>. In<br />
comparison to that, impact changes due to food losses were lower and ma<strong>in</strong>ly contrarian, which could be expla<strong>in</strong>ed by higher food<br />
losses <strong>in</strong> 2006 compared to 1985-89.<br />
Keywords: Input-output <strong>LCA</strong>, direct land use change & land use (dLUC, LU), di<strong>et</strong> shift, nutrition patterns, di<strong>et</strong>ary recommendations<br />
1. Introduction<br />
Human nutrition has a strong effect on environmental impacts. Tak<strong>in</strong>g political considerations <strong>in</strong>to account<br />
(EC 2011), nutritionally acceptable und environmentally sound measures have to be developed to cope<br />
with current agro-ecological challenges. Various studies with a life cycle perspective have identified food<br />
supply as one of the ma<strong>in</strong> contributors to environmental impacts (Nijdam <strong>et</strong> al., 2005, Tukker <strong>et</strong> al., 2011).<br />
To facilitate political and economic decisions various life cycle assessments (<strong>LCA</strong>) have been elaborated: (i)<br />
either on a product level basis or (ii) on a di<strong>et</strong> basis to identify the most pollut<strong>in</strong>g food items or to compare<br />
di<strong>et</strong>ary choices (Carlsson-Kanyama 1998, Taylor 2000, P<strong>et</strong>ers <strong>et</strong> al., 2007, Muñoz <strong>et</strong> al., 2010, Jungbluth <strong>et</strong><br />
al., 2011, Meier & Christen <strong>2012</strong>).<br />
Besides technical solutions (improvements <strong>in</strong> efficiency dur<strong>in</strong>g production and process<strong>in</strong>g) and a reduction<br />
of food losses, changes <strong>in</strong> di<strong>et</strong>s and nutrition patterns are also discussed with a view to decreas<strong>in</strong>g environmental<br />
impacts of the agri-food sector (Stehfest 2009, Popp <strong>et</strong> al., 2010).<br />
The first part of the study builds ma<strong>in</strong>ly upon Meier & Christen (<strong>2012</strong>), where the <strong>in</strong>fluence of the factor<br />
gender <strong>in</strong> an <strong>LCA</strong> of food consumption was analysed. Here, we exam<strong>in</strong>e these gender-related differences <strong>in</strong><br />
comparison to nutrition recommendations (D-A-CH & UGB), nutrition styles (ovo-lacto veg<strong>et</strong>arian, vegan)<br />
and the average di<strong>et</strong> profile 20 years ago (<strong>in</strong> the years 1985-89).<br />
2. Materials and m<strong>et</strong>hods<br />
For the study, representative data s<strong>et</strong>s concern<strong>in</strong>g German food production and consumption were used<br />
(BMELV 2009, BML 1991). Exact, subgroup-specific <strong>in</strong>take data was provided by the both National Nutrition<br />
Surveys from the years 1985-89 and 2006 (Kübler <strong>et</strong> al., 1995, MRI 2008). The environmental impact<br />
assessment was based ma<strong>in</strong>ly on the <strong>in</strong>put-output tables of SEEA (System of Environmental and Economic<br />
Account<strong>in</strong>g, Schmidt & Osterburg 2011). To consider the impacts of food imports, emissions from direct<br />
land use change and land use (dLUC, LU), food process<strong>in</strong>g, trade/transport and packag<strong>in</strong>g, these were complemented<br />
by several <strong>LCA</strong> data s<strong>et</strong>s - e.g. Leip <strong>et</strong> al., (2010), the Danish <strong>LCA</strong> <strong>Food</strong> database (Nielsen <strong>et</strong> al.,<br />
2003), Institute of Applied Ecology (2010) and Mekonnen & Hoekstra (<strong>2012</strong>) for blue water. Thus, the system<br />
boundaries are s<strong>et</strong> cradle-to-store. The functional unit considered on the product level refers to 1 kg consumed<br />
product. The reference year <strong>in</strong> the study is the year 2006. Accord<strong>in</strong>g to ISO 14040/14044 (2006) the<br />
four dist<strong>in</strong>ct steps of an <strong>LCA</strong> have been compl<strong>et</strong>ed.<br />
As regards environmental impact assessment, global warm<strong>in</strong>g potential (GWP) was assessed, which <strong>in</strong>cluded<br />
emissions from direct land use change and land use (dLUC, LU), along with five <strong>in</strong>ventory <strong>in</strong>dicators<br />
(ammonia emissions, land use, blue water use, phosphorous use and cumulative primary energy demand<br />
(CED)).<br />
The follow<strong>in</strong>g food groups were analysed: milk products (<strong>in</strong>clud<strong>in</strong>g butter, high-fat milk products like<br />
cheese and cream, low-fat milk products like milk and yoghurt), meat products (<strong>in</strong>clud<strong>in</strong>g pork, beef/veal,<br />
110
PLENARY SESSION 1: FOOD 8 th Int. Conference on <strong>LCA</strong> <strong>in</strong> the<br />
Agri-<strong>Food</strong> Sector, 1-4 Oct <strong>2012</strong><br />
poultry, goat/lamb), egg products, fish products, gra<strong>in</strong> products, veg<strong>et</strong>ables, legumes, fruits, nuts & seeds,<br />
potato products, veg<strong>et</strong>al oils & margar<strong>in</strong>e, sugar/swe<strong>et</strong>s.<br />
For the comparison with di<strong>et</strong>ary recommendations and di<strong>et</strong> styles the follow<strong>in</strong>g quantifiable food-related<br />
di<strong>et</strong>ary profiles were exam<strong>in</strong>ed (Table 1). In contrast to nutrient-based di<strong>et</strong>ary recommendations (NBDR)<br />
there exist food-based di<strong>et</strong>ary recommendations (FBDR). These are more consumer-friendly and could be, if<br />
sufficiently d<strong>et</strong>erm<strong>in</strong>ed (ample, consistent and standardised product categories), compared and analysed environmentally.<br />
Table 3. Types of di<strong>et</strong>ary recommendations and di<strong>et</strong> styles analysed<br />
Description Reference<br />
Di<strong>et</strong>ary recommendations D-A-CH (official recommendations for Germany, Austria and Swit-<br />
DGE (2008)<br />
zerland)<br />
UGB (alternative recommendations by the Federation for Independent<br />
Health Consultation with less meat, but more legumes and veg<strong>et</strong>ables)<br />
Di<strong>et</strong>ary styles Ovo-lacto veg<strong>et</strong>arian (plant-based di<strong>et</strong> with egg and milk products,<br />
without meat and fish)<br />
Vegan (totally plant-based di<strong>et</strong>, without meat, milk, fish and egg<br />
products and <strong>in</strong>stead more fortified soy-based milk products, more<br />
legumes, nuts and seeds<br />
UGB (2011)<br />
USDA, USDHHS<br />
(2010)<br />
USDA, USDHHS<br />
(2010)<br />
As entries concern<strong>in</strong>g alcoholic beverages (beer, w<strong>in</strong>e, spirits) as well as coffee, tea and cocoa do not exist <strong>in</strong><br />
most of the recommendations and di<strong>et</strong>s, these product groups were omitted <strong>in</strong> the assessment. Nevertheless,<br />
as all recommendations consider the <strong>in</strong>take of fruits and sugar via soft dr<strong>in</strong>ks and juices, we considered this<br />
<strong>in</strong>take pathway, too. Furthermore, gra<strong>in</strong>s <strong>in</strong> beer were reallocated to the correspond<strong>in</strong>g ma<strong>in</strong> group ´gra<strong>in</strong><br />
products´. Table 2 gives an overview of the <strong>in</strong>take amounts analysed based on 2,000 kcal person -1 day -1 .<br />
Table 4. Intake amounts analysed based on 2,000 kcal person -1 day -1<br />
To allow an environmental assessment the <strong>in</strong>take amounts were converted to consumption amounts. Therefore<br />
statistically derived consumption data for the years considered, 2006 and 1985-89, was divided by the<br />
correspond<strong>in</strong>g <strong>in</strong>take amounts. Thus, the conversion could be embedded consistently <strong>in</strong> official data. The so<br />
elaborated product-specific conversion factors (CF = consumption / <strong>in</strong>take) as well as the environmental<br />
impact factors used <strong>in</strong> the assessment are outl<strong>in</strong>ed <strong>in</strong> Table 3.<br />
Table 5. Conversion and environmental impact factors based on the functional unit<br />
111
PLENARY SESSION 1: FOOD 8 th Int. Conference on <strong>LCA</strong> <strong>in</strong> the<br />
Agri-<strong>Food</strong> Sector, 1-4 Oct <strong>2012</strong><br />
3. Results<br />
For all <strong>in</strong>dicators the results show strong variation b<strong>et</strong>ween the genders. Even if the physiologically different<br />
consumption amounts among men and women are levelled out on the basis of 2,000 kcal person -1 day -<br />
1 , men still show a higher impact <strong>in</strong> terms of GWP (CO2e +8%), ammonia emissions (+14%), land use<br />
(+11%), P use (+10%) and CED (+2%). In contrast, women demonstrate a higher water demand (+18%;<br />
Table 4 and Fig. 1). These differences are primarily caused by a higher share of meat products and butter <strong>in</strong><br />
the usual di<strong>et</strong> of men as well as more fruit, veg<strong>et</strong>ables and nuts & seeds <strong>in</strong> the typical di<strong>et</strong> of women.<br />
112<br />
Low-fat milk products (milk,<br />
yoghurt)<br />
Vegan milk products (<strong>in</strong><br />
whole milk equivalents)<br />
Veg<strong>et</strong>al oils, margar<strong>in</strong>e<br />
High-fat milk products<br />
(cheese, cream)<br />
Potato products<br />
Modelled as<br />
Meat products<br />
Fish products<br />
Nuts & seeds<br />
Egg products<br />
Veg<strong>et</strong>ables<br />
Legumes<br />
Gra<strong>in</strong>s<br />
Butter<br />
Sugar<br />
Fruits<br />
Data concern<strong>in</strong>g food consumption from BML (1991); data concern<strong>in</strong>g food <strong>in</strong>take from Kübler<br />
<strong>et</strong> al. (1995)<br />
0.77 0.89 0.89 0.73 0.48 0.69 0.52 0.89 0.68 0.68 0.48 0.15 0.42 0.57 0.29<br />
Conversion factor<br />
1985-89 = con-<br />
sumption /<br />
<strong>in</strong>take<br />
Data concern<strong>in</strong>g food consumption from BMELV (2009); data concern<strong>in</strong>g food <strong>in</strong>take from<br />
MRI (2008)<br />
0.71 0.73 0.73 0.73 0.46 0.54 0.61 0.96 0.85 0.85 1.04 0.33 0.41 0.28 0.56<br />
Conversion factor<br />
2006<br />
Data concern<strong>in</strong>g domestic agriculture & upstream processes from Schmidt & Osterburg<br />
(2011) and Brentrup & Pallière (2008); data concern<strong>in</strong>g fish from Nielsen <strong>et</strong> al. (2003); data<br />
concer<strong>in</strong>g fruits partly from Sanjuan <strong>et</strong> al. (2005); data concern<strong>in</strong>g dLUC, LU from Leip <strong>et</strong> al.<br />
(2010); data concern<strong>in</strong>g process<strong>in</strong>g from BMELV (2009); data concern<strong>in</strong>g trade/transport from<br />
DIW (2008) and data concern<strong>in</strong>g packag<strong>in</strong>g from Institute of Applied Ecology (2010). If no<br />
data for imported products were available, domestic conditions were assumed.<br />
kg / kg 19.7 10.0 2.7 0.7 9.3 3.1 2.4 1.5 0.8 1.1 0.8 0.8 0.5 3.4 1.9<br />
CO₂ₑ-emissions<br />
Data concern<strong>in</strong>g domestic agriculture from Schmidt & Osterburg (2011); data concern<strong>in</strong>g fish<br />
from Nielsen <strong>et</strong> al. (2003); data concern<strong>in</strong>g process<strong>in</strong>g from BMELV (2009); data concern<strong>in</strong>g<br />
trade/transport from DIW (2008) and data concern<strong>in</strong>g packag<strong>in</strong>g from Institute of Applied<br />
Ecology (2010). If no data for imported products were available, domestic conditions were assumed.<br />
g / kg 82.5 39.4 9.7 0.2 39.6 19.7 0.2 1.9 0.7 0.6 0.6 0.6 0.3 3.3 1.5<br />
NH₃-emissions<br />
Data concern<strong>in</strong>g domestic agriculture from Schmidt & Osterburg (2011); data concern<strong>in</strong>g<br />
packag<strong>in</strong>g from Institute of Applied Ecology (2010). Data for imported products from FAO<br />
Stat. (<strong>2012</strong>).<br />
Land use m² / kg 20.7 9.9 2.4 0.7 11.0 3.8 0.2 1.8 0.5 2.1 0.9 2.9 0.3 4.1 1.2<br />
Data concern<strong>in</strong>g domestic agriculture from Schmidt & Osterburg (2011) and Mekonnen &<br />
Hoekstra (2010); data concern<strong>in</strong>g process<strong>in</strong>g from BLE (2007) and data concern<strong>in</strong>g packag<strong>in</strong>g<br />
from Institute of Applied Ecology (2010). Data for imported products from Mekonnen &<br />
Hoekstra (2010).<br />
l / kg 86.0 44.3 15.6 6.4 36.7 8.8 14.7 5.2 27.4 8.8 87.6 1425.3 5.7 15.7 9.5<br />
Water use (blue)<br />
Data concern<strong>in</strong>g domestic agriculture from Schmidt & Osterburg (2011). P use dur<strong>in</strong>g process<strong>in</strong>g<br />
was not exam<strong>in</strong>ed.<br />
g / kg 70.0 33.5 8.2 1.3 33.0 10.3 4.4 5.3 2.7 3.7 1.4 1.4 0.9 9.7 3.6<br />
Phosphorous<br />
use<br />
Data concern<strong>in</strong>g domestic agriculture & upstream processes from Schmidt & Osterburg<br />
(2011) and Brentrup & Pallière (2008); data concern<strong>in</strong>g fish from Nielsen <strong>et</strong> al. (2003); data<br />
concer<strong>in</strong>g fruits partly from Sanjuan <strong>et</strong> al. (2005); data concern<strong>in</strong>g process<strong>in</strong>g from BMELV<br />
(2009); data concern<strong>in</strong>g trade/transport from DIW (2008) and data concern<strong>in</strong>g packag<strong>in</strong>g from<br />
Institute of Applied Ecology (2010). If no data for imported products were available, domestic<br />
conditions were assumed.<br />
MJ / kg 52.7 33.0 12.5 7.4 44.5 20.2 13.1 11.2 10.2 7.7 11.1 11.1 5.0 19.4 18.0<br />
Cumulative<br />
energy demand<br />
(CED)
PLENARY SESSION 1: FOOD 8 th Int. Conference on <strong>LCA</strong> <strong>in</strong> the<br />
Agri-<strong>Food</strong> Sector, 1-4 Oct <strong>2012</strong><br />
Table 6. Environmental impacts of food consumption <strong>in</strong> the years 1985-89 and 2006 (<strong>in</strong>cl. genders) <strong>in</strong> Germany<br />
as well as of several di<strong>et</strong>ary recommendations & di<strong>et</strong>ary styles based on 2,000 kcal person⁻¹ day⁻¹<br />
CO₂ₑ emissions<br />
NH₃ emissions<br />
t person⁻¹<br />
year⁻¹<br />
kg person⁻¹<br />
year⁻¹<br />
1985-89 mean<br />
2006<br />
mean<br />
2006<br />
men<br />
2006<br />
women<br />
ovo-lacto<br />
D-A-CH UGB vegan<br />
veg<strong>et</strong>arian<br />
2.3 2.0 2.1 1.9 1.8 1.8 1.5 0.9<br />
7.7 6.4 6.8 6.0 5.1 4.6 3.9 0.7<br />
Land use<br />
m² person⁻¹<br />
year⁻¹<br />
2,429 2,059 2,170 1,946 1,749 1,693 1,514 1,019<br />
Water use (blue)<br />
m³ person⁻¹<br />
year⁻¹<br />
26.8 27.1 24.7 29.5 19.6 19.5 51.1 57.0<br />
Phosphorous use<br />
kg person⁻¹<br />
year⁻¹<br />
7.4 6.3 6.7 6.0 5.6 5.4 4.5 2.3<br />
Cumulative energy<br />
demand<br />
MJ person⁻¹<br />
year⁻¹<br />
13.0 11.6 11.7 11.4 10.7 11.1 10.1 8.4<br />
Figure 6 Environmental impacts of food consumption <strong>in</strong> 2006 <strong>in</strong> Germany as basel<strong>in</strong>e scenario <strong>in</strong> comparison<br />
to 1985-89, genders and di<strong>et</strong>ary scenarios based on 2,000 kcal person -1 day -1<br />
In comparison to the di<strong>et</strong>ary recommendations and the di<strong>et</strong>ary styles, which can be ma<strong>in</strong>ly characterised<br />
by an <strong>in</strong>creas<strong>in</strong>g share of legumes, nuts and veg<strong>et</strong>ables <strong>in</strong> the profiles <strong>in</strong>stead of meat, butter, egg and fish<br />
products as well as fruits (D-A-CH > UGB > veg<strong>et</strong>arian > vegan), both genders could reduce the impacts of<br />
their di<strong>et</strong>s if they were to be more <strong>in</strong> l<strong>in</strong>e with the recommendations or di<strong>et</strong> styles. With the exception of blue<br />
water, the reduction potentials for men are twice as high as women’s. In other words, the average female di<strong>et</strong><br />
is already closer to the recommendations. Nevertheless, women’s average di<strong>et</strong> corresponds to higher blue<br />
water use, ma<strong>in</strong>ly caused by higher consumption of fruits as well as of nuts & seeds, which are often produced<br />
<strong>in</strong> water-scarce areas <strong>in</strong> foreign countries. Accord<strong>in</strong>g to FAO trade statistics (FAO 2011), fruits imported<br />
<strong>in</strong> 2006 <strong>in</strong>to Germany were ma<strong>in</strong>ly produced <strong>in</strong> Spa<strong>in</strong> and Italy, whereas nuts & seeds were ma<strong>in</strong>ly<br />
imported from Ch<strong>in</strong>a, USA, Turkey and Iran. Related to the average <strong>in</strong>take <strong>in</strong> 2006 the strongest reduction<br />
potentials were d<strong>et</strong>erm<strong>in</strong>ed for the vegan (-27% CED – -89% NH3) and the ovo-lacto veg<strong>et</strong>arian di<strong>et</strong>s (-13%<br />
CED – -40% NH3), with the exception of blue water (vegan: +110%, veg<strong>et</strong>arian: +89%). Here we have to<br />
bear <strong>in</strong> m<strong>in</strong>d that for the recommendations (D-A-CH, UGB) quantifiable <strong>in</strong>take amounts for nuts & seeds do<br />
not exist, although an <strong>in</strong>creased <strong>in</strong>take <strong>in</strong> these scenarios would be probable.<br />
However, <strong>in</strong> comparison with the environmental impacts caused by average nutrition <strong>in</strong> the years 1985-<br />
89, almost all <strong>in</strong>dicators, with the exception of blue water, show a reduced impact. Due to different di<strong>et</strong>s and<br />
113
PLENARY SESSION 1: FOOD 8 th Int. Conference on <strong>LCA</strong> <strong>in</strong> the<br />
Agri-<strong>Food</strong> Sector, 1-4 Oct <strong>2012</strong><br />
different conversion factors (and therefore food losses) <strong>in</strong> 2006 and 1985-89, the observed differences could<br />
be caused either by variations <strong>in</strong> the average di<strong>et</strong> or vary<strong>in</strong>g food losses (Fig. 1).<br />
For the reductions observed the ma<strong>in</strong> driver has been a shift <strong>in</strong> di<strong>et</strong>s, with the exception of blue water.<br />
Here, ma<strong>in</strong>ly caused by an <strong>in</strong>creased <strong>in</strong>take of fruits, blue water also <strong>in</strong>creased accord<strong>in</strong>gly. But this rise was<br />
almost compensated by less food losses <strong>in</strong> 2006 (for fruits). For the other <strong>in</strong>dicators (GHG, NH3, land use, P<br />
use), which are more driven by animal products, <strong>in</strong>creased food losses partially countervailed ga<strong>in</strong>s achieved<br />
through shift<strong>in</strong>g di<strong>et</strong>s. Beneficial reductions by both means (di<strong>et</strong> shift and less food losses) have been observed<br />
only for the cumulative energy demand (CED).<br />
Concern<strong>in</strong>g sensitivity analysis, a perturbation analysis was performed with a variation of ± 25% of the<br />
<strong>in</strong>put param<strong>et</strong>ers.<br />
4. Discussion<br />
Tak<strong>in</strong>g different reference years, countries and system boundaries <strong>in</strong>to consideration our results are comparable<br />
to other studies (e.g. Taylor 2000, P<strong>et</strong>ers <strong>et</strong> al., 2007, Muñoz <strong>et</strong> al., 2010, Jungbluth <strong>et</strong> al., 2011).<br />
Nevertheless the follow<strong>in</strong>g limitations of our study should be mentioned:<br />
system boundaries cradle-to-store (not cradle-to-grave)<br />
attributional approach, although data for fish was generated by a consequential approach<br />
for the scenario analysis (comparison with recommendations and di<strong>et</strong> styles) a consequential approach<br />
would be more appropriate to also analyse rebound effects (e.g. mark<strong>et</strong> effects)<br />
for GHG emissions, NH3 emissions, P use and CED, if no separate data for imported products was<br />
available then these were modelled as domestically produced<br />
although different <strong>in</strong>take and production data were used, for 1985-89 the same production conditions<br />
(and therefore production efficiencies), import shares and import countries were assumed<br />
nuts & seeds were omitted <strong>in</strong> the scenario analysis of the recommendations (D-A-CH, UGB)<br />
due to the ongo<strong>in</strong>g discussion about water <strong>in</strong> <strong>LCA</strong>s, we only considered blue water<br />
With regard to the di<strong>et</strong> styles analysed it should be noted that a vegan di<strong>et</strong>, and to a lesser extent a veg<strong>et</strong>arian<br />
one, could provide an <strong>in</strong>sufficient supply of essential nutrients.<br />
5. Conclusion<br />
The study shows that with<strong>in</strong> one soci<strong>et</strong>y dist<strong>in</strong>ct di<strong>et</strong> profiles of men and women with markedly different<br />
environmental impacts are already established. Nevertheless, with regard to di<strong>et</strong>ary recommendations and<br />
alternative di<strong>et</strong> styles (veg<strong>et</strong>arian, vegan) men, and to a lesser extent women as well, could achieve significant<br />
environmental benefits (with the exception of blue water use). In comparison to the years 1985-89, all<br />
<strong>in</strong>dicators showed reduced environmental impacts, but with dist<strong>in</strong>ct contributions of the ma<strong>in</strong> drivers (di<strong>et</strong><br />
shifts and food losses). Further research should also consider health impact assessments to ensure that alterations<br />
<strong>in</strong> di<strong>et</strong> profiles due to environmental constra<strong>in</strong>ts do not lead to disadvantageous public health effects.<br />
Particular attention should be paid here to potentially undernourished subgroups (such as toddlers, children,<br />
the elderly, sick people, pregnant women <strong>et</strong>c.).<br />
6. References<br />
BLE 2007. Energie,- und Wasserverbrauch des Ernährungsgewerbes 2006. Meldungen aus der Ernährungswirtschaftmeldeverordnung<br />
(EWMV), unveröffentlicht. Bundesanstalt für Landwirtschaft und Ernährung, Bonn.<br />
BMELV 2009. Statistisches Jahrbuch über Ernährung, Landwirtschaft und Forsten <strong>in</strong> der Bundesrepublik Deutschland. 53. Jahrgang,<br />
Bundesm<strong>in</strong>isterium für Ernährung, Landwirtschaft und Verbraucherschutz, Bonn/Berl<strong>in</strong>.<br />
BML 1991. Statistisches Jahrbuch über Ernährung, Landwirtschaft und Forsten der Bundesrepublik Deutschland 1991. Bundesm<strong>in</strong>ister<br />
für Landwirtschaft, Ernährung und Forsten, Bonn.<br />
Brentrup, F., Pallière, C. 2008. GHG emissions and energy efficiency <strong>in</strong> European nitrogen fertiliser production and use. International<br />
Fertiliser Soci<strong>et</strong>y, York.<br />
DGE 2008. Vollwertig essen und tr<strong>in</strong>ken nach den 10 Regeln der DGE. Deutsche Gesellschaft für<br />
Ernährung e.V., aid Infodienst, Bonn, p. 7-25.<br />
DIW 2008. Verkehr <strong>in</strong> Zahlen. Deutsches Institut für Wirtschaftsforschung. 37. Jg. Dt. Verkehrs-Verlag, Hamburg, p. 247.<br />
EC 2011. A roadmap for mov<strong>in</strong>g to a comp<strong>et</strong>itive low carbon economy <strong>in</strong> 2050. European Commission, Brussels.<br />
FAO Stat 2011. D<strong>et</strong>ailed trade matrix for Germany 2006. <strong>Food</strong> and Agriculture Organization of the UN, Rome. http://faostat.fao.org.<br />
Accessed 25 November 2011.<br />
FAO Stat <strong>2012</strong>. Production, crops and yields. Statistical Division of the <strong>Food</strong> and Agriculture Organization of the UN, Rome.<br />
http://faostat.fao.org. Accessed 21 January <strong>2012</strong>.<br />
Institute of Applied Ecology 2010. GEMIS 4.6 — Global Emissions Model of Integrated Systems. Institut für angewandte Ökologie,<br />
Freiburg.<br />
ISO 2006. Environmental Management — Life Cycle Assessment — Pr<strong>in</strong>ciples and framework. (ISO 14040:2006). International<br />
Organization for Standardization, Paris.<br />
114
PLENARY SESSION 1: FOOD 8 th Int. Conference on <strong>LCA</strong> <strong>in</strong> the<br />
Agri-<strong>Food</strong> Sector, 1-4 Oct <strong>2012</strong><br />
Jungbluth, N., Nathani, C., Stucki, M., Leuenberger, M. 2011. Environmental Impacts of Swiss Consumption and Production. A<br />
comb<strong>in</strong>ation of <strong>in</strong>put-output analysis with life cycle assessment. Federal Office for the Environment, Bern. Environmental studies<br />
no. 1111: pp. 171.<br />
Kübler, W., Anders, H.J., Heeschen, W. 1995. Ergebnisse der Nationalen Verzehrsstudie (1985-1988) über die Lebensmittel- und<br />
Nährstoffaufnahme <strong>in</strong> der Bundesrepublik Deutschland. Band XI, VERA- Schriftenreihe, Gießen.<br />
Leip, A.,Weiss, F.,Wassenaar, T., Perez, I., Fellmann, T., Loudjani, P., Tubiello, F., Grandgirard, D., Monni, S., Biala, K. 2010.<br />
Evaluation of the livestock sector's contribution to the EU greenhouse gas emissions (GGELS) – f<strong>in</strong>al report. European Commission,<br />
Jo<strong>in</strong>t Research Centre.<br />
Meier, T., Christen, O. <strong>2012</strong>. Gender as a factor <strong>in</strong> an environmental assessment of the consumption of animal and plant-based foods<br />
<strong>in</strong> Germany. <strong>in</strong>: Int J Life Cycle Assess 17 (5), p. 550-564.<br />
Mekonnen, M.M., Hoekstra, A.Y. (2010): The green, blue and grey water footpr<strong>in</strong>t of crops and derived crop products, Value of<br />
Water Research Report Series No. 47, UNESCO-IHE, Delft, the N<strong>et</strong>herlands.<br />
MRI 2008. Nationale Verzehrsstudie II — Ergebnisbericht, Teil 2 — Die bundesweite Befragung zur Ernährung von Jugendlichen<br />
und Erwachsenen. Max Rubner Institute, Karlsruhe, pp. 174–234.<br />
Muñoz, I., Milà i Canals, L., Fernández-Alba, A.R. 2010. Life cycle assessment of the average Spanish di<strong>et</strong> <strong>in</strong>clud<strong>in</strong>g human excr<strong>et</strong>ion.<br />
<strong>in</strong>: Int J Life Cycle Assess, p. 794-805.<br />
Nielsen, P.H., Nielsen, A.M., Weidema, B.P., Dalgaard, R., Halberg, N. 2003. <strong>LCA</strong> food data base. www.lcafood.dk. Accessed 9<br />
September 2011.<br />
Nijdam D.S., Wilt<strong>in</strong>g, H.C. Goedkoop, M.J, Madsen, J. 2005. Environmental load from Dutch private consumption—how much<br />
damage takes place abroad? <strong>in</strong>: J Ind Ecol 9 (1–2): p. 147-168.<br />
P<strong>et</strong>ers, C.J., Wilk<strong>in</strong>s, J.L., Fick, G.W. (2007): Test<strong>in</strong>g a compl<strong>et</strong>e-di<strong>et</strong> model for estimat<strong>in</strong>g the land resource requirements of food<br />
consumption and agricultural carry<strong>in</strong>g capacity: The New York State example. In: Renew Agr <strong>Food</strong> Syst 22 (02). p. 145–154.<br />
Popp, A., Lotze-Campen, H., Bodirsky, B. 2010. <strong>Food</strong> consumption, di<strong>et</strong> shifts and associated non-CO2 greenhouse gases from<br />
agricultural production. <strong>in</strong>: Global Environ Chang 20 (3), p. 451-462.<br />
Sanjuan, N., Ubeda, L., Clemente, G. Mul<strong>et</strong>, A., Girona, F. 2005. <strong>LCA</strong> of <strong>in</strong>tegrated orange production <strong>in</strong> the Comunidad Valenciana<br />
(Spa<strong>in</strong>). In: IJARGE 4 (2): p. 163.<br />
Schmidt, T., Osterburg, B. 2011. Berichtsmoduls ‘Landwirtschaft und Umwelt’ <strong>in</strong> den umweltökonomischen Gesamtrechnungen II.<br />
Tabellenband. Von Thünen-Institut (vTI). Braunschweig, p. 29.<br />
Stehfest, E., Bouwman, L., Vuuren, D.P., Elzen, M.G.J., Eickhout, B., Kabat, P. 2009. Climate benefits of chang<strong>in</strong>g di<strong>et</strong>. <strong>in</strong>: Climatic<br />
Change 95 (1-2), p. 83-102.<br />
Taylor C. 2000: Ökologische Bewertung von Ernährungsweisen anhand ausgewählter Indikatoren. Dissertation. Justus-Liebig-<br />
Universität. Gießen, pp. 179.<br />
Tukker, A., Goldbohm, R.A., de Kon<strong>in</strong>g, A., Verheijden, M., Kleijn, R., Wolf, O. 2011. Environmental impacts of changes to healthier<br />
di<strong>et</strong>s <strong>in</strong> Europe. <strong>in</strong>: Ecol Econ 70 (10), p. 1776-1788.<br />
UGB 2011. Recommendations for a whole food nutrition. Verband für Unabhängige Gesundheitsberatung e.V. (UGB) - Federation<br />
for <strong>in</strong>dependent health consultation, W<strong>et</strong>tenberg/Gießen.<br />
USDA, USDHHS 2010. Di<strong>et</strong>ary Guidel<strong>in</strong>es for Americans 2010. 7th Edition. U.S. Department of Agriculture, U.S. Department of<br />
Health and Human Services, Wash<strong>in</strong>gton, DC, p. 81-82<br />
115
PLENARY SESSION 1: FOOD 8 th Int. Conference on <strong>LCA</strong> <strong>in</strong> the<br />
Agri-<strong>Food</strong> Sector, 1-4 Oct <strong>2012</strong><br />
116<br />
Compar<strong>in</strong>g environmental impacts of end-of-life treatments of food<br />
waste<br />
Carbotech AG, environmental consult<strong>in</strong>g, 4002 Basel, Switzerland<br />
Correspond<strong>in</strong>g author. E-mail: m.zschokke@carbotech.ch<br />
Mischa Zschokke * , Thomas Kägi, Fredy D<strong>in</strong>kel<br />
The goal of this study was to compare the environmental burden of landfill<strong>in</strong>g food waste with three alternative biowaste treatments<br />
“compost<strong>in</strong>g”, “anaerobic digestion” and “municipal solid waste <strong>in</strong>c<strong>in</strong>eration”. The life cycle <strong>in</strong>ventories for anaerobic digestion and<br />
compost<strong>in</strong>g <strong>in</strong>cludes a new approach to account for benefits <strong>in</strong> us<strong>in</strong>g biowaste as a fertiliser substitute. Depend<strong>in</strong>g on the impact<br />
assessment m<strong>et</strong>hod used, the rank<strong>in</strong>g of the different treatment m<strong>et</strong>hods tend to vary. But tak<strong>in</strong>g <strong>in</strong>to account the range of uncerta<strong>in</strong>ty<br />
the three exam<strong>in</strong>ed treatment m<strong>et</strong>hods show comparable environmental impacts. Landfill<strong>in</strong>g of food waste <strong>in</strong> contrast results <strong>in</strong> a<br />
much higher environmental impact compared to the other three treatment m<strong>et</strong>hods. As all <strong>in</strong>vestigated treatment m<strong>et</strong>hods show similar<br />
results, the decision on which technique to use can be based on other factors such as economics, available <strong>in</strong>frastructure or even<br />
on the composition and nature of the food waste because different m<strong>et</strong>hods are favourable for treatment.<br />
Keywords: biowaste, benefits of biowaste, <strong>in</strong>c<strong>in</strong>eration, compost<strong>in</strong>g, anaerobic digestion<br />
1. Introduction<br />
Every year huge quantities of edible food end up <strong>in</strong> landfills worldwide (e.g. 7 million tonnes <strong>in</strong> the<br />
United K<strong>in</strong>gdom and 34 million tonnes <strong>in</strong> the United States (Eunomia 2006, WRAP 2007a and 2007b, EPA<br />
2011). Roughly one third orig<strong>in</strong>ates from producers/supply cha<strong>in</strong>, one third from r<strong>et</strong>ail and the f<strong>in</strong>al third<br />
from regular households (Sibrián <strong>et</strong> al., 2006, Parfitt <strong>et</strong> al., 2010,).<br />
In addition to the costs for disposal, these landfills generate large amounts of greenhouse gases. Landfill<br />
gas emissions are one of the largest anthropogenic sources of m<strong>et</strong>hane especially because of food waste<br />
(Adhikari 2006). In the United States food waste now represents the s<strong>in</strong>gle largest component of municipal<br />
solid waste reach<strong>in</strong>g landfills and <strong>in</strong>c<strong>in</strong>erators, and generates more than 16 percent of all m<strong>et</strong>hane emissions<br />
<strong>in</strong> that country (EPA <strong>2012</strong>). Not only could the direct emissions from landfills be decreased by reduc<strong>in</strong>g the<br />
amount of landfilled food waste but the use of alternate m<strong>et</strong>hods for treatment of food waste could further<br />
reduce the environmental impact.<br />
2. M<strong>et</strong>hods<br />
2.1 Goal and Scope<br />
The goal of this study was to compare the environmental burden of landfill<strong>in</strong>g food waste with three alternative<br />
biowaste treatments “compost<strong>in</strong>g”, “anaerobic digestion” and “municipal solid waste <strong>in</strong>c<strong>in</strong>eration”<br />
(MSWI) as described <strong>in</strong> D<strong>in</strong>kel <strong>et</strong> al., (2011).<br />
The functional unit used <strong>in</strong> the presented study is 1 kg of treated food waste. The applied <strong>in</strong>ventory m<strong>et</strong>hodology<br />
is derived from the eco<strong>in</strong>vent version 2.2 guidel<strong>in</strong>es (Frischknecht R. and Jungbluth N., 2007). Data<br />
for the <strong>in</strong>vestigated m<strong>et</strong>hods of treatment are based on exist<strong>in</strong>g eco<strong>in</strong>vent version 2.2 processes and were<br />
extended and updated with new values <strong>in</strong> the follow<strong>in</strong>g fields:<br />
emissions from anaerobic digestion: updated values for N2O, CO2, CH4 and NH3 <strong>in</strong> the digestion<br />
process and from spread<strong>in</strong>g digestate<br />
emissions from compost<strong>in</strong>g: updated values for N2O, CO2, CH4 and NH3<br />
TCDD-2,3,7,8-emissions <strong>in</strong> municipal solid waste <strong>in</strong>c<strong>in</strong>eration were adjusted to account for the current<br />
regulatory values<br />
the heat<strong>in</strong>g value of biowaste was adapted accord<strong>in</strong>g to own calculations to be suitable to model <strong>in</strong>c<strong>in</strong>eration<br />
<strong>in</strong> municipal solid waste <strong>in</strong>c<strong>in</strong>eration plants<br />
2.2 Inventory data<br />
In particular, the emissions for compost<strong>in</strong>g and anaerobic digestion were updated by field measurements<br />
and generally show lower values than previously reported. The m<strong>et</strong>hane emissions <strong>in</strong> the current version of<br />
eco<strong>in</strong>vent are overestimated by about 5 times.<br />
The used values for the biological treatment m<strong>et</strong>hods are summarised <strong>in</strong> the follow<strong>in</strong>g tables:
PLENARY SESSION 1: FOOD 8 th Int. Conference on <strong>LCA</strong> <strong>in</strong> the<br />
Agri-<strong>Food</strong> Sector, 1-4 Oct <strong>2012</strong><br />
Table 7. Compost<strong>in</strong>g – converted to CO2-equivalents per kg food waste<br />
Transport /<br />
Biological<br />
Pre-treatment Average Process Average Total<br />
CH4, biogenic<br />
CO2, biogenic<br />
CO2, fossil<br />
N2O<br />
Total<br />
[g]<br />
0.01-0.1<br />
4 - 13<br />
<strong>in</strong> [g] CO2eq<br />
1.25<br />
10.00<br />
0.00<br />
11<br />
[g]<br />
0.5-1.5<br />
260.00<br />
2 - 10<br />
max 0.05<br />
<strong>in</strong> [g] CO2eq<br />
25.00<br />
7.80<br />
14.90<br />
48<br />
<strong>in</strong> [g] CO2eq<br />
26.25<br />
17.80<br />
14.90<br />
59<br />
Emissions [g] / kg<br />
Table 8. Anaerobic digestion – converted to CO2-equivalents per kg food waste<br />
Emissions [g] / kg<br />
Storage/<br />
Postcomp.<br />
Gas<br />
condition<strong>in</strong>g <br />
PreAver- AD<br />
storageage a<br />
AverAver-<br />
Process ageage<br />
CHP b<br />
AverAverageage<br />
Total<br />
<strong>in</strong> [g]<br />
<strong>in</strong> [g]<br />
<strong>in</strong> [g]<br />
<strong>in</strong> [g]<br />
<strong>in</strong> [g] <strong>in</strong> [g]<br />
CH4, biogenic<br />
[g]<br />
PLENARY SESSION 1: FOOD 8 th Int. Conference on <strong>LCA</strong> <strong>in</strong> the<br />
Agri-<strong>Food</strong> Sector, 1-4 Oct <strong>2012</strong><br />
2.3 Impact assessment<br />
The <strong>LCA</strong> was performed us<strong>in</strong>g the software EMIS 5.7 (Environmental Management and Information System)<br />
developed by Carbotech AG and SimaPro 7.3.3 by PRé Consultants.<br />
To compare the different treatment processes, the systems were expanded us<strong>in</strong>g an avoided burden and<br />
bask<strong>et</strong> of benefits approach (D<strong>in</strong>kel <strong>et</strong> al., 2009). Different environmental impacts were calculated and to<br />
evaluate the impacts the m<strong>et</strong>hods Eco-<strong>in</strong>dicator 99 (Goedkoop and Spriensma, 2001) and ecological scarcity<br />
2006 (Frischknecht, 2009) were used. Several sensitivity analyses were made to d<strong>et</strong>erm<strong>in</strong>e the robustness of<br />
the impact m<strong>et</strong>hods. Specific midpo<strong>in</strong>t <strong>in</strong>dicators such as global warm<strong>in</strong>g potential (IPCC 2007) are shown<br />
separately.<br />
Inclusion of ReCiPe as a substitute m<strong>et</strong>hod for Eco-<strong>in</strong>dicator 99 was evaluated but had to be dismissed<br />
because of irregularities <strong>in</strong> the assessment of phosphorus emissions and the valuation of heavy m<strong>et</strong>als <strong>in</strong> soil.<br />
3. Results<br />
The results presented are shown for Eco-<strong>in</strong>dicator 99 and IPCC 2007, the ecological scarcity m<strong>et</strong>hod<br />
2006 is not displayed, as the outcomes are comparable to Eco-<strong>in</strong>dicator 99.<br />
Depend<strong>in</strong>g on the impact assessment m<strong>et</strong>hod used, the rank<strong>in</strong>g of the different treatment m<strong>et</strong>hods tend to<br />
vary. But tak<strong>in</strong>g <strong>in</strong>to account the range of uncerta<strong>in</strong>ty the three exam<strong>in</strong>ed treatment m<strong>et</strong>hods show comparable<br />
environmental impacts. As shown <strong>in</strong> the follow<strong>in</strong>g figures, the landfill<strong>in</strong>g of food waste <strong>in</strong> contrast results<br />
<strong>in</strong> a much higher environmental impact compared to the other three treatment m<strong>et</strong>hods.<br />
Figure 3. Eco-<strong>in</strong>dicator 99 (H/A) Total (system modelled accord<strong>in</strong>g to bask<strong>et</strong> of benefits approach)<br />
118<br />
[pt]<br />
0.040<br />
0.035<br />
0.030<br />
0.025<br />
0.020<br />
0.015<br />
0.010<br />
0.005<br />
0.000<br />
Compos ng Anaerobic<br />
diges on<br />
Eco-Indicator 99 H/A Europe<br />
MSWI Landfill<strong>in</strong>g
PLENARY SESSION 1: FOOD 8 th Int. Conference on <strong>LCA</strong> <strong>in</strong> the<br />
Agri-<strong>Food</strong> Sector, 1-4 Oct <strong>2012</strong><br />
[pt]<br />
0.00E+00<br />
-5.00E-03<br />
-1.00E-02<br />
Figure 4. Eco-<strong>in</strong>dicator 99 (H/A) Total, d<strong>et</strong>ail (system modelled accord<strong>in</strong>g to avoided burden approach)<br />
kg CO2-eq.<br />
2.50E-02<br />
2.00E-02<br />
1.50E-02<br />
1.00E-02<br />
5.00E-03<br />
1.40<br />
1.20<br />
1.00<br />
0.80<br />
0.60<br />
0.40<br />
0.20<br />
0.00<br />
Eco-<strong>in</strong>dicator 99 (H/A) Total<br />
D<strong>et</strong>ail Total D<strong>et</strong>ail Total D<strong>et</strong>ail Total D<strong>et</strong>ail Total<br />
Compos ng Anaerobic diges on MSWI Landfill<strong>in</strong>g<br />
Compos ng Anaerobic<br />
diges on<br />
IPCC 2007 GWP 100a<br />
Figure 5. IPCC 2007 100a (system modelled accord<strong>in</strong>g to bask<strong>et</strong> of benefits approach)<br />
Total<br />
Benefit MSWI, electricity<br />
Benefit MSWI, heat<br />
Benefit of natural gas<br />
Benefit compos ng, nitrogen fertliser<br />
Benefit compos ng/digestate, fertliser<br />
Benefit compos ng/digestate, ground<br />
Anaerobic diges on burden<br />
MSWI<br />
Digestate solid<br />
Digestate liquid<br />
Anaerobic diges on/Landfill<strong>in</strong>g<br />
Compos ng<br />
MSWI Landfill<strong>in</strong>g<br />
119
PLENARY SESSION 1: FOOD 8 th Int. Conference on <strong>LCA</strong> <strong>in</strong> the<br />
Agri-<strong>Food</strong> Sector, 1-4 Oct <strong>2012</strong><br />
Figure 6. IPCC 2007 100a, d<strong>et</strong>ail (system modelled accord<strong>in</strong>g to avoided burden approach)<br />
Compared to Fig. 4 (Eco-<strong>in</strong>dicator 99), Figs. 5 and 6 clearly show that the ma<strong>in</strong> burden with landfill<strong>in</strong>g<br />
orig<strong>in</strong>ates from greenhouse gas emissions, essentially from m<strong>et</strong>hane.<br />
4. Discussion<br />
Our calculations have confirmed that all three treatment m<strong>et</strong>hods display comparable environmental impacts.<br />
Landfill<strong>in</strong>g always has significantly higher environmental burdens regardless of which impact assessment<br />
m<strong>et</strong>hod is used. In this study we did not <strong>in</strong>clude efforts to capture and use emissions from landfills.<br />
Such programmes (e.g. the U.S. EPA's Landfill M<strong>et</strong>hane Outreach Program (LMOP)) could considerably<br />
reduce the environmental impacts from landfills and help to use landfill gas as energy resource. We estimate<br />
that the possible reductions will non<strong>et</strong>heless not be able to place landfill<strong>in</strong>g ahead of the other three m<strong>et</strong>hods<br />
<strong>in</strong>vestigated.<br />
The sheer amount of food waste still go<strong>in</strong>g to landfills basically makes any treatment m<strong>et</strong>hod favourable<br />
to simple landfill<strong>in</strong>g: <strong>in</strong> the United States 35 Million tonnes of food were sent to landfill <strong>in</strong> 2010, responsible<br />
for the emission of approximately 20 to 40 Tg of CO2eq <strong>in</strong>to the atmosphere.<br />
As all <strong>in</strong>vestigated treatment m<strong>et</strong>hods show similar results, the decision on which technique to use can be<br />
based on other factors such as economics, available <strong>in</strong>frastructure or even on the composition and nature of<br />
the food waste because different m<strong>et</strong>hods are favourable for treatment.<br />
5. Conclusions<br />
This study shows the enormous emission reduction potential if food waste is not landfilled but otherwise<br />
treated. Naturally it would be even b<strong>et</strong>ter to reduce the amount of food go<strong>in</strong>g to waste as all presented m<strong>et</strong>hods<br />
are only end of pipe solutions and the environmental impact of food production itself is normally much<br />
higher (usually by a factor of 2 to 20) than the impact of the landfill or any other treatment m<strong>et</strong>hod. As long<br />
as we still lose about one third of the produced food along the cha<strong>in</strong> (Gustavsson <strong>et</strong> al., 2011), we still have<br />
lots of room for improvement.<br />
6. References<br />
Adhikari B. K., October 2006, Waste Managment Research, vol. 24 no. 5 421-433<br />
D<strong>in</strong>kel <strong>et</strong> al., 2009, O kobilanz zur Gru ngutverwertung <strong>in</strong> Basel, Amt fu r Umwelt und Energie, Basel-Stadt<br />
D<strong>in</strong>kel <strong>et</strong> al., 2011, Ökobilanzen zur Biomasseverwertung, Forschungs- und Entwicklungsprogramm Biomasse und Holzenergie,<br />
Schwerpunkt Biomasse ohne Holzenergie, Bundesamt für Energie BFE<br />
120<br />
kg CO2-eq.<br />
1.20<br />
1.00<br />
0.80<br />
0.60<br />
0.40<br />
0.20<br />
0.00<br />
-0.20<br />
D<strong>et</strong>ail Total D<strong>et</strong>ail Total D<strong>et</strong>ail Total D<strong>et</strong>ail Total<br />
Compos ng Anaerobic<br />
diges on<br />
IPCC 2007 GWP 100a<br />
MSWI Landfill<strong>in</strong>g<br />
Total<br />
Benefit MSWI, electricity<br />
Benefit MSWI, heat<br />
Benefit of natural gas<br />
Benefit compos ng, nitrogen fertliser<br />
Benefit compos ng/digestate, fertliser<br />
Benefit compos ng/digestate, ground<br />
Anaerobic diges on burden<br />
MSWI<br />
Digestate solid<br />
Digestate liquid<br />
Anaerobic diges on/Landfill<strong>in</strong>g<br />
Compos ng
PLENARY SESSION 1: FOOD 8 th Int. Conference on <strong>LCA</strong> <strong>in</strong> the<br />
Agri-<strong>Food</strong> Sector, 1-4 Oct <strong>2012</strong><br />
eco<strong>in</strong>vent, 2010, eco<strong>in</strong>vent 2010, version 2.2, Swiss Center for Life Cycle Inventories, May 2010<br />
EPA 2009, December 2010, Municipal Solid Waste Generation, Recycl<strong>in</strong>g, and Disposal <strong>in</strong> the United States: Facts and Figures for<br />
2009, United States Environmental Protection Agency, Solid Waste and Emergency Response (5306P) Wash<strong>in</strong>gton, DC 20460<br />
EPA 2011, November 2011, Municipal Solid Waste Generation, Recycl<strong>in</strong>g, and Disposal <strong>in</strong> the United States: Facts and Figures for<br />
2010, United States Environmental Protection Agency, Solid Waste and Emergency Response (5306P) Wash<strong>in</strong>gton, DC 20460<br />
EPA <strong>2012</strong>, Inventory of U.S. greenhouse gas emissions and s<strong>in</strong>ks: 1990 – 2010, April 15, <strong>2012</strong>, U.S. Environmental Protection<br />
Agency, 1200 Pennsylvania Ave., N.W. Wash<strong>in</strong>gton, DC 20460 U.S.A.<br />
Eunomia (2006), “A Chang<strong>in</strong>g Climate for Energy from Waste?”, Friends of the Earth, 26-28 Underwood Stre<strong>et</strong>, London<br />
Frischknecht <strong>et</strong> al., (2009) M<strong>et</strong>hode der ökologischen Knappheit Ökofaktoren 2006. Bundesamt für Umwelt (BAFU)/ÖBU.<br />
Frischknecht R. and Jungbluth N., eco<strong>in</strong>vent report No.1, Overview and M<strong>et</strong>hodology, 2007<br />
Fuchs J., Schleiss K., 2008, Ökologische Bewertung der organischen Substanz, Zusatzmodul zu Forschungsprojekt Auswirkungen<br />
von Komposten und von Gärgut auf die Umwelt, Bodenfruchtbarkeit, sowie die Pflanzengesundheit, im Auftrag des BAFU, Bern<br />
Goedkoop and Spriensma, The Eco-<strong>in</strong>dicator 99 – a damage oriented m<strong>et</strong>hod for LCIA, M<strong>et</strong>hodology Report, Third edition, 22 June<br />
2001, PRé Consultants B.V., Amersfoot http://www.pre-susta<strong>in</strong>ability.com/content/reports<br />
Gustavsson <strong>et</strong> al., 2011, Global food losses and food waste, Swedish Institute for <strong>Food</strong> and Biotechnology (SIK) Gothenburg, Sweden<br />
IPCC, 2007. Climate Change 2007: The Scientific Basis. In: Solomon, S. <strong>et</strong> al., (eds.), Fourth Assessment Report of the Intergovernmental<br />
Panel on Climate Change (IPCC). IPCC, Intergovernmental Panel on Climate Change, Cambridge University Press,<br />
The Ed<strong>in</strong>burgh, Build<strong>in</strong>g Shaftesbury Road, Cambridge, UK.<br />
Parfitt <strong>et</strong> al., 2010, <strong>Food</strong> waste with<strong>in</strong> food supply cha<strong>in</strong>s: quantification and potential for change to 2050, Phil. Trans. R. Soc. B<br />
2010 365, 3065-3081<br />
Schleiss K. und Jungbluth N., 2006, Verwertung der biogenen Abfälle <strong>in</strong> der Stadt Zürich, Bericht mit besonderer Berücksichtigung<br />
der biogenen Abfälle aus Haushalten, ERZ Entsorgung + Recycl<strong>in</strong>g Zürich, Hagenholzstrasse 110, Postfach, 8050 Zürich, <strong>LCA</strong><br />
not published<br />
Sibrián <strong>et</strong> al., 2006, Estimat<strong>in</strong>g household and <strong>in</strong>stitutional food wastage and losses <strong>in</strong> the context of measur<strong>in</strong>g food deprivation and<br />
food excess <strong>in</strong> the total population. Statistics Division, Work<strong>in</strong>g Paper Series no: ESS/ESSA/001e, Rome, Italy: FAO.<br />
WRAP, 2007a, “Understand<strong>in</strong>g <strong>Food</strong> Waste”, WRAP The Old Academy, 21 Horse Fair, Banbury OX16 0AH, England<br />
WRAP, 2007b, “New WRAP Research Reveals Extent of <strong>Food</strong> Waste <strong>in</strong> the UK”, WRAP The Old Academy, 21 Horse Fair, Banbury<br />
OX16 0AH, England<br />
121
PLENARY SESSION 1: FOOD 8 th Int. Conference on <strong>LCA</strong> <strong>in</strong> the<br />
Agri-<strong>Food</strong> Sector, 1-4 Oct <strong>2012</strong><br />
122<br />
High nutritional quality is not associated with low greenhouse gas<br />
emissions <strong>in</strong> self-selected di<strong>et</strong>s of French adults<br />
Florent Vieux 1 , Louis-Georges Soler 2 , Djilali Touazi 2 , Nicole Darmon 1,*<br />
1 UMR 1260 INRA, 1062 INSERM, ‘Aix-Marseille Univ Nutrition, Obésité <strong>et</strong> Risque Thrombotique’, 13385 Marseille, <strong>France</strong><br />
2 Institut National de Recherche Agronomique UR 1303 ALISS- 65 Boulevard de Brandebourg - 94205 Ivry sur Se<strong>in</strong>e, <strong>France</strong><br />
* Correspond<strong>in</strong>g author. E-mail: nicole.darmon@univ-amu.fr<br />
ABSTRACT<br />
<strong>Food</strong> consumption contributes approximately 15-30% of the total greenhouse gas emissions (GHGE) <strong>in</strong> the developed countries. The<br />
aim of the present work was to analyse the relationship b<strong>et</strong>ween the nutritional quality of self-selected di<strong>et</strong>s and their associated<br />
greenhouse-gas emissions (GHGE). Each adult of the INCA2 national di<strong>et</strong>ary survey (n=1918) was aggregated <strong>in</strong> one of four <strong>in</strong>creas<strong>in</strong>g<br />
nutritional quality group and GHGE (<strong>in</strong> g CO2e/d) of his/her di<strong>et</strong> was estimated. High-quality di<strong>et</strong>s conta<strong>in</strong>ed more plantbased<br />
foods, notably fruit and veg<strong>et</strong>ables, and less swe<strong>et</strong>s and salted snacks than low-quality di<strong>et</strong>s. Expressed per 100Kcal or 100g<br />
consumed, the highest GHGE was recorded for meat, fish and, eggs food group and the lower for starchy foods. After adjustment for<br />
energy <strong>in</strong>take, high-quality di<strong>et</strong>s had significantly higher GHGE (+4% and +14% <strong>in</strong> men and women respectively) than low quality<br />
di<strong>et</strong>s. This suggests that environmental and nutritional objectives are not necessarily aligned.<br />
Keywords: di<strong>et</strong>, food, nutrient recommendations, energy density<br />
1. Introduction<br />
Chang<strong>in</strong>g food consumption patterns is often considered as an important driver of climate change and a<br />
way of reduc<strong>in</strong>g the environmental impact of the food sector, which contributes approximately 15-30% of<br />
the total greenhouse gas emissions (GHGE) <strong>in</strong> the developed countries (Garn<strong>et</strong>t, 2008;Kim and Neff,<br />
2009;Kl<strong>in</strong>g and Hough, 2010;Tukker <strong>et</strong> al., 2006). In particular, chang<strong>in</strong>g the di<strong>et</strong>s (Carlsson-Kanyama <strong>et</strong> al.,<br />
2003;Coley <strong>et</strong> al., 1998) through a reduction <strong>in</strong> meat consumption <strong>in</strong> high-<strong>in</strong>come countries (associated with<br />
a reasonable <strong>in</strong>crease <strong>in</strong> low-<strong>in</strong>come countries) has been proposed as a good way to reduce the GHGE related<br />
to the food sector, whilst simultaneously improv<strong>in</strong>g the people’s health (McMichael <strong>et</strong> al., 2007). However,<br />
meat, fish and dairy products are unique sources of specific and essential nutrients, and the reduction of their<br />
consumption raises a number of nutritional challenges (Millward and Garn<strong>et</strong>t, 2010).<br />
Susta<strong>in</strong>able di<strong>et</strong>s have been def<strong>in</strong>ed by the <strong>Food</strong> and Agriculture Organization (FAO) as "di<strong>et</strong>s protective<br />
and respectful of biodiversity and ecosystems, culturally acceptable, accessible, economically fair and affordable;<br />
nutritionally adequate, safe and healthy; while optimiz<strong>in</strong>g natural and human resources" (FAO,<br />
2010). Accord<strong>in</strong>gly, the FAO recommends to give due consideration to susta<strong>in</strong>ability when develop<strong>in</strong>g foodbased<br />
di<strong>et</strong>ary guidel<strong>in</strong>es and policies, and acknowledges the need for studies demonstrat<strong>in</strong>g the synergies<br />
b<strong>et</strong>ween the different dimensions of susta<strong>in</strong>ability (FAO, 2010). The aim of the present study was therefore<br />
to analyse <strong>in</strong> d<strong>et</strong>ail the relationship b<strong>et</strong>ween the nutritional quality of self-selected di<strong>et</strong>s and their associated<br />
greenhouse-gas emissions. To account for the actual diversity of food consumption patterns <strong>in</strong> <strong>France</strong>, data<br />
from the latest di<strong>et</strong>ary survey conducted among a representative sample of the French adult population were<br />
used (AFSSA, 2009). Based on the previously published GHGE of a selection of some highly consumed<br />
foods <strong>in</strong> this population (Vieux <strong>et</strong> al., <strong>2012</strong>), the daily GHGE of each di<strong>et</strong> was estimated and correlated with<br />
the consumption of food-groups and with <strong>in</strong>dicators of nutritional quality, such as the Mean Adequacy Ratio<br />
(MAR). Then, to avoid a priori assumptions about the food content of high and low nutritional quality di<strong>et</strong>s,<br />
a way of classify<strong>in</strong>g them that only relied on their energy density and their nutrient contents was specifically<br />
developed for this study, and the daily GHGE of di<strong>et</strong>s of <strong>in</strong>creas<strong>in</strong>g nutritional quality accord<strong>in</strong>g to this classification<br />
were compared.<br />
2. M<strong>et</strong>hods<br />
2.1. Population sample and di<strong>et</strong>ary data<br />
The di<strong>et</strong>ary data used <strong>in</strong> the present study were derived from the 7-d food records of a nationally representative<br />
random sample of adults (n=2624; age > 18 years) participat<strong>in</strong>g <strong>in</strong> the INCA 2 cross-sectional di<strong>et</strong>ary<br />
survey (‘Enquête Individuelle <strong>et</strong> Nationale sur les Consommations Alimentaires’, (‘Individual and National<br />
Survey on <strong>Food</strong> Consumption’) conducted <strong>in</strong> 2006-2007 by ANSES (French agency for food, environmental<br />
and occupational health saf<strong>et</strong>y) (AFSSA, 2009). After the exclusion of under-reporters us<strong>in</strong>g standard<br />
procedures, the present analysis was conducted on a f<strong>in</strong>al sample of 1,918 adults (776 men and 1,142<br />
women). All of the food items declared as consumed by the participants dur<strong>in</strong>g the survey (n=1314 foods
PLENARY SESSION 1: FOOD 8 th Int. Conference on <strong>LCA</strong> <strong>in</strong> the<br />
Agri-<strong>Food</strong> Sector, 1-4 Oct <strong>2012</strong><br />
and beverages, <strong>in</strong>clud<strong>in</strong>g water) were listed <strong>in</strong> a survey-associated food database giv<strong>in</strong>g the nutritional composition<br />
of each food item. Total di<strong>et</strong> weight, total energy <strong>in</strong>takes, <strong>in</strong>take of food groups and nutrient <strong>in</strong>takes<br />
were calculated on a daily basis for each participant, based on the list of foods and beverages he/she recorded,<br />
and the energy and nutrient content of the items consumed.<br />
2.2. Three <strong>in</strong>dicators of nutritional quality<br />
The Mean Adequacy Ratio (MAR), the Mean Excess Ratio (MER) and the di<strong>et</strong>ary Energy Density (ED)<br />
were used as nutritional quality <strong>in</strong>dicators and were estimated without tak<strong>in</strong>g <strong>in</strong>to account the nutrients from<br />
alcoholic beverages.<br />
The MAR was used as an <strong>in</strong>dicator of good nutritional quality, as it has been repeatedly shown to be positively<br />
associated with other <strong>in</strong>dices of di<strong>et</strong>ary quality (Cox <strong>et</strong> al., 1997;Dubois <strong>et</strong> al., 2000;Krebs-Smith <strong>et</strong><br />
al., 1987;Torheim <strong>et</strong> al., 2004) and with health <strong>in</strong>dicators (Ferland and O'Brien, 2003;Keller <strong>et</strong> al., 1997). In<br />
the present study, the MAR was calculated for the di<strong>et</strong> of each <strong>in</strong>dividual, as the mean percentage of French<br />
Recommended Di<strong>et</strong>ary Allowance (Mart<strong>in</strong>, 2001) for 20 key nutrients (namely prote<strong>in</strong>s, fibre, r<strong>et</strong><strong>in</strong>ol-eq,<br />
thiam<strong>in</strong>, riboflav<strong>in</strong>, niac<strong>in</strong>, vitam<strong>in</strong> B6, folates, vitam<strong>in</strong> B12, ascorbic acid, vitam<strong>in</strong> E, vitam<strong>in</strong> D, calcium,<br />
potassium, iron, magnesium, z<strong>in</strong>c, copper, iod<strong>in</strong>e and selenium).<br />
We developed the MER by analogy with the MAR, and used it as an <strong>in</strong>dicator of bad nutritional quality.<br />
The MER was calculated for each di<strong>et</strong> as the mean daily percent of maximal recommended values (MRV)<br />
for three harmful nutrients, namely saturated fatty acids (SFA), sodium and free sugars. The term "free sugars"<br />
refers to added sugars plus sugars naturally present <strong>in</strong> honey, syrups and fruit juices (Jo<strong>in</strong>t WHO/FAO<br />
expert consultation, 2003).<br />
Di<strong>et</strong>ary ED was used as an <strong>in</strong>dicator of bad nutritional quality because di<strong>et</strong>s with a low energy density<br />
have been shown to have a good overall nutritional quality (Ledikwe <strong>et</strong> al., 2006;Schroder <strong>et</strong> al., 2008) and<br />
because decreas<strong>in</strong>g the energy density of the di<strong>et</strong> is recommended by several public health authorities to<br />
prevent obesity and obesity-associated disease conditions (WHO, ;World Cancer Research Fund International/<br />
Association Institute of Cancer Research, 2007). Di<strong>et</strong>ary ED (<strong>in</strong> kcal/100g of di<strong>et</strong>) was calculated by<br />
divid<strong>in</strong>g the energy <strong>in</strong>take by di<strong>et</strong> weight of each <strong>in</strong>dividual. As proposed by Ledikwe <strong>et</strong> al., (Ledikwe <strong>et</strong> al.,<br />
2005), items typically consumed as beverages, such as milk, juices, and soft dr<strong>in</strong>ks, were excluded of the<br />
calculation of energy density.<br />
2.3. Four classes of nutritional quality<br />
A m<strong>et</strong>hod for classify<strong>in</strong>g <strong>in</strong>dividuals based on the nutritional quality of their di<strong>et</strong>s was specifically developed<br />
for this study. The three <strong>in</strong>dicators of nutritional quality described above were calculated for each di<strong>et</strong>.<br />
Individuals were then ranked accord<strong>in</strong>g to the values taken by each <strong>in</strong>dicator compared to its observed median<br />
<strong>in</strong> the populations of men and women separately. A class 1 nutritional quality di<strong>et</strong> was def<strong>in</strong>ed as a di<strong>et</strong><br />
comply<strong>in</strong>g with the three follow<strong>in</strong>g nutritional objectives: hav<strong>in</strong>g a MAR above the median, a MER below<br />
the median and a di<strong>et</strong>ary ED below the median. Di<strong>et</strong>s comply<strong>in</strong>g with only 2, 1 or 0 of these objectives were<br />
allocated to class 2, class 3 and class 4 nutritional quality, respectively.<br />
2.4. Estimation of di<strong>et</strong>-related GHGE<br />
As described elsewhere (Supkova <strong>et</strong> al., 2011;Vieux <strong>et</strong> al., <strong>2012</strong>), the estimation of di<strong>et</strong>-related GHGE<br />
was based on a selection of 73 widely-consumed food items for which a series of assumptions were made.<br />
We assumed that the selected food items were all obta<strong>in</strong>ed through the conventional and most frequent production<br />
and distribution processes <strong>in</strong> <strong>France</strong>. The food-related GHGE values covered the stages of agricultural<br />
production, process<strong>in</strong>g, packag<strong>in</strong>g and transportation to r<strong>et</strong>ail outl<strong>et</strong>s but the stages that occur after purchase<br />
(transportation from store to home, storage, preparation and cook<strong>in</strong>g at home, management of end-oflife<br />
phases) were not recovered due to a lack of data. Data were expressed as g CO2 equivalent per 100g of<br />
edible portion (g CO2e /100g). As previously described (Vieux <strong>et</strong> al., <strong>2012</strong>), a Monte-Carlo simulation was<br />
run <strong>in</strong> order to <strong>in</strong>troduce variability of a GHGE food item and a weight<strong>in</strong>g factor was calculated for each<br />
representative food item selected with<strong>in</strong> each category to allow us to estimate the GHGE associated with the<br />
food category.<br />
123
PLENARY SESSION 1: FOOD 8 th Int. Conference on <strong>LCA</strong> <strong>in</strong> the<br />
Agri-<strong>Food</strong> Sector, 1-4 Oct <strong>2012</strong><br />
2.5. Statistical analysis<br />
The relations b<strong>et</strong>ween di<strong>et</strong>-related GHGE and other di<strong>et</strong>ary variables (energy, weight, MAR, MER, DE,<br />
food group <strong>in</strong>takes) were tested us<strong>in</strong>g both simple and partial (adjustment for age, gender and energy <strong>in</strong>takes)<br />
Pearson’s correlation coefficients. The food group <strong>in</strong>takes and the di<strong>et</strong>-related GHGE were estimated among<br />
the 4 nutritional classes. Then, comparisons of means among the 4 classes and tests for l<strong>in</strong>ear trends were<br />
performed us<strong>in</strong>g regression analysis for sample survey data for men and women separately. In additional<br />
analyses, di<strong>et</strong>-related GHGE were adjusted for energy <strong>in</strong>take. An alpha-level of 0.05 was used to d<strong>et</strong>erm<strong>in</strong>e<br />
statistical significance. Statistical analyses were performed us<strong>in</strong>g SAS software version 9.2 (SAS <strong>in</strong>stitute,<br />
Cary, NC).<br />
3. Results<br />
3.1. Correlation b<strong>et</strong>ween di<strong>et</strong>-related GHGE and nutritional quality <strong>in</strong>dicators<br />
In simple regression analyses, the MAR (R = 0.67, p< 0.0001), the MER (R = 0.80, p< 0.0001), di<strong>et</strong>ary<br />
ED (R = 0.34, p< 0.0001) and di<strong>et</strong>-related GHGE (R = 0.79, p< 0.0001) were each positively and significantly<br />
correlated with energy <strong>in</strong>takes. As expected, after energy adjustment, di<strong>et</strong>ary ED was positively correlated<br />
with MER and negatively with MAR; higher MAR scores were associated with lower MER scores.<br />
After energy-adjustment, di<strong>et</strong>-related GHGE was positively correlated with MAR and negatively with di<strong>et</strong>ary<br />
ED, but no correlation was observed with the MER (data not shown).<br />
3.2. GHGE of food groups and effect of their consumption on total di<strong>et</strong>-related GHGE<br />
Whatever the calculation basis (per 100g or per 100 kcal of food consumed) the highest GHGE was recorded<br />
for the Meat, Fish, poultry and eggs (MFPE) group and the lowest for starchy foods group (Figure 1).<br />
Among the MFPE group, meat had the highest GHGE, which was more than 10 times higher, on a weight<br />
basis, than that of fruit and veg<strong>et</strong>ables (1387g vs. 121g CO2e/100g respectively, data not shown). The second<br />
lowest GHGE value (after that of starchy foods), was observed for fruit and veg<strong>et</strong>ables when calculated on a<br />
weight basis, but for swe<strong>et</strong>s and salted snacks when calculated on a calorie basis. When expressed per 100<br />
kcal, the GHGE of fruit and veg<strong>et</strong>ables was similar to that of dairy products.<br />
Figure 1. Greenhouse gas emissions (GHGE) related to the consumption of each food group, expressed per<br />
100g and per 100kcal of foods as consumed by adults (n=1918) participat<strong>in</strong>g <strong>in</strong> the INCA2 survey. Values<br />
are means. Bars represent the 95% confidence <strong>in</strong>terval.<br />
After adjustment for age, sex and energy <strong>in</strong>take, a higher consumption of swe<strong>et</strong>s and salted snacks, and of<br />
mixed dishes and starchy foods was associated with a lower di<strong>et</strong>-related GHGE (Figure 2). In contrast, <strong>in</strong>creas<strong>in</strong>g<br />
the <strong>in</strong>take of the other food groups, <strong>in</strong>clud<strong>in</strong>g that of fruit and veg<strong>et</strong>ables, <strong>in</strong>creased di<strong>et</strong>-related<br />
GHGE. The strongest positive association was seen for the MFPE group (and with<strong>in</strong> that group, for the meat<br />
category, data not shown).<br />
124<br />
GHGE, g CO 2 eq./d<br />
1000<br />
900<br />
800<br />
700<br />
600<br />
500<br />
400<br />
300<br />
200<br />
100<br />
0<br />
85<br />
46<br />
121<br />
306<br />
Starchy foods Fruit and<br />
veg<strong>et</strong>ables<br />
GHGE/100 g GHGE/100 kcal<br />
202<br />
153<br />
218<br />
95<br />
436<br />
Mixed dishes Swe<strong>et</strong>s and Dairy products Fat Meat, fish,<br />
salted snacks<br />
poultry, eggs<br />
297<br />
859<br />
145<br />
934<br />
505
PLENARY SESSION 1: FOOD 8 th Int. Conference on <strong>LCA</strong> <strong>in</strong> the<br />
Agri-<strong>Food</strong> Sector, 1-4 Oct <strong>2012</strong><br />
Figure 2. Partial (age, sex and energy-adjusted) Pearson correlations b<strong>et</strong>ween di<strong>et</strong>-related greenhouse gas<br />
emissions (GHGE, <strong>in</strong> g CO2e/d) and the consumption (<strong>in</strong> g/d) of each food group by adults (n=1918) participat<strong>in</strong>g<br />
<strong>in</strong> the INCA2 survey. All coefficients are significantly different from 0 (p< 0.001).<br />
3.3. <strong>Food</strong> consumption <strong>in</strong> the four classes of nutritional quality<br />
For both sexes, <strong>in</strong>dividuals with high quality di<strong>et</strong>s had higher food <strong>in</strong>takes and their di<strong>et</strong>s conta<strong>in</strong>ed significantly<br />
more fruit and veg<strong>et</strong>ables and less swe<strong>et</strong>s and salted snacks than low quality di<strong>et</strong>s (data not<br />
shown). For both sexes, high quality di<strong>et</strong>s conta<strong>in</strong>ed significantly more fish and less delicatessen (data not<br />
shown) than low quality di<strong>et</strong>s, but the quantity of meat did not differ b<strong>et</strong>ween nutritional quality classes<br />
(class 1 di<strong>et</strong>s conta<strong>in</strong>ed 69 and 51 g/d of meat, <strong>in</strong> men and women respectively, data not shown). For women,<br />
high quality di<strong>et</strong>s also conta<strong>in</strong>ed more poultry and eggs than low quality di<strong>et</strong>s, so that the total <strong>in</strong>take of the<br />
MFPE group <strong>in</strong>creased with <strong>in</strong>creas<strong>in</strong>g nutritional quality for them.<br />
3.4. Di<strong>et</strong> related GHGE <strong>in</strong> the four classes of nutritional quality<br />
0,7<br />
0,6<br />
0,5<br />
0,4<br />
0,3<br />
0,2<br />
0,1<br />
0<br />
-0,1<br />
-0,2<br />
-0,3<br />
Starchy foods Fruit and Mixed dishes Swe<strong>et</strong>s and<br />
veg<strong>et</strong>ables<br />
salted snacks<br />
The crude and adjusted values of daily di<strong>et</strong>-related GHGE <strong>in</strong> the four classes of nutritional quality are<br />
shown Figure 4. Without adjustment (panel A), GHGE was not significantly different b<strong>et</strong>ween the four<br />
classes for men (p=0.27) and it was greater <strong>in</strong> the highest nutritional quality class for women (p=0.0021).<br />
After adjustment for energy <strong>in</strong>takes (panel B), di<strong>et</strong>s with a high nutritional quality tend to be associated with<br />
higher GHGE values than di<strong>et</strong>s with a lower nutritional quality (p
PLENARY SESSION 1: FOOD 8 th Int. Conference on <strong>LCA</strong> <strong>in</strong> the<br />
Agri-<strong>Food</strong> Sector, 1-4 Oct <strong>2012</strong><br />
on stereotyped meals (Reijnders and Sor<strong>et</strong>, 2003) and di<strong>et</strong>s (Baroni <strong>et</strong> al., 2007;Carlsson-Kanyama <strong>et</strong> al.,<br />
2003;Carlsson-Kanyama and Gonzalez, 2009) or on the comparison b<strong>et</strong>ween average and theor<strong>et</strong>ical di<strong>et</strong>s<br />
(Eshel and Mart<strong>in</strong>, 2006;Macdiarmid <strong>et</strong> al., 2011;Risku-Norja <strong>et</strong> al., 2008;Wallén <strong>et</strong> al., 2004). Only one of<br />
them (Macdiarmid <strong>et</strong> al., 2011) precisely controlled the nutrient content of the theor<strong>et</strong>ical di<strong>et</strong>s designed, and<br />
the conclusion was that "it is possible to create a realistic and affordable di<strong>et</strong> that me<strong>et</strong>s di<strong>et</strong>ary requirements<br />
for health and a 25% reduction <strong>in</strong> GHGE". However the "realism" of such a di<strong>et</strong> was doubtful because it was<br />
based on arbitrary decisions on which changes are culturally and socially acceptable by people, <strong>in</strong> particular<br />
as regards reduc<strong>in</strong>g the consumption of meat and dairy products.<br />
Altog<strong>et</strong>her, our results therefore seem to contradict the widely-accepted view that di<strong>et</strong>s that are good for<br />
health are necessarily good for the plan<strong>et</strong>. This notion has progressively emerged, based on the fact that<br />
plant-based products have lower environmental impact than animal products, and on the belief that veg<strong>et</strong>arian<br />
di<strong>et</strong>s are necessarily healthy. However, the present results showed that plant-based products may have a<br />
similar GHGE than animal products when expressed on a per calorie basis (for <strong>in</strong>stance fruit and veg<strong>et</strong>able<br />
and dairy products <strong>in</strong> the present study, Figure 1).<br />
This study has limitations. First, di<strong>et</strong>-related GHGE was estimated based on a limited number of items.<br />
However those foods were the most frequently consumed <strong>in</strong> the studied population, and our estimate of the<br />
daily GHGE was of similar magnitude to that estimated <strong>in</strong> studies conducted <strong>in</strong> other European populations<br />
(Coley <strong>et</strong> al., 1998;FAO, 2010). Secondly, we used GHGE as the sole environmental criterion. We did not<br />
consider the entire life cycle of the food products (only up to r<strong>et</strong>ail outl<strong>et</strong>s), and we focused only on conventional<br />
production and distribution processes (organic and local production and/or distribution were not considered).<br />
In future studies, other environmental criteria, such as water and land use or biodiversity, must also<br />
be considered, as well as the impact of alternative production and distribution schemes, and of consumer<br />
behaviour (transport, storage, cook<strong>in</strong>g…). Thirdly, the m<strong>et</strong>hod used to classify di<strong>et</strong>s accord<strong>in</strong>g to their nutritional<br />
quality was not previously published. However, our aim was to classify exist<strong>in</strong>g di<strong>et</strong>s based only on<br />
their nutrient contents and, to our knowledge, there is no published approach allow<strong>in</strong>g such classification. It<br />
should be noted that our m<strong>et</strong>hod identified di<strong>et</strong>s rich <strong>in</strong> fruit and veg<strong>et</strong>ables with moderate amounts of a vari<strong>et</strong>y<br />
of animal products and limited amounts of swe<strong>et</strong>s and salted snacks as be<strong>in</strong>g of the highest nutritional<br />
quality, which is <strong>in</strong> accordance with the basic pr<strong>in</strong>ciples of di<strong>et</strong>ary guidel<strong>in</strong>es (USDA, 2011;WHO Regional<br />
Office for Europe, 1998).<br />
5. Conclusion<br />
In the present study, the health<strong>in</strong>ess of di<strong>et</strong>s, wh<strong>et</strong>her estimated by a high <strong>in</strong>take of fruit and veg<strong>et</strong>ables, a<br />
low <strong>in</strong>take of swe<strong>et</strong>s and salted snacks, a high nutrient density, a low energy density, or a more comprehensive<br />
def<strong>in</strong>ition of nutritional quality (e.g. belong<strong>in</strong>g to class1) was associated with a slightly but significantly<br />
higher carbon impact. This suggests that environmental and nutritional objectives are not necessarily aligned.<br />
The compatibility of those two dimensions of susta<strong>in</strong>ability should be further exam<strong>in</strong>ed, us<strong>in</strong>g more comprehensive<br />
and d<strong>et</strong>ailed <strong>in</strong>dicators of the environmental impact of food consumption.<br />
6. References<br />
AFSSA. Summary of the report of the 2006/2007 Individual and National Survey on <strong>Food</strong> Consumption 2 (INCA 2).<br />
http://www.afssa.fr/Documents/PASER-Sy-INCA2EN.pdf.2009.<br />
Baroni L, Cenci L, T<strong>et</strong>tamanti M, Berati M. Evaluat<strong>in</strong>g the environmental impact of various di<strong>et</strong>ary patterns comb<strong>in</strong>ed with different<br />
food production systems. Eur J Cl<strong>in</strong> Nutr. 2007;61(2):279-86.<br />
Carlsson-Kanyama A, Pipp<strong>in</strong>g Ekström M, Shanahan H. <strong>Food</strong> and life cycle energy <strong>in</strong>puts: consequences of di<strong>et</strong> and ways to <strong>in</strong>crease<br />
efficiency. Ecological Economics. 2003;44(2-3):293-307.<br />
Carlsson-Kanyama A, Gonzalez AD. Potential contributions of food consumption patterns to climate change. Am J Cl<strong>in</strong> Nutr.<br />
2009;89(5):1704S-9S.<br />
Coley AD, Goodliffe E, Macdiarmid J. The embodied energy of food: the role of di<strong>et</strong>. Energy Policy. 1998;26(6):455-9.<br />
Cox DR, Sk<strong>in</strong>ner JD, Carruth BR, Moran J, 3rd, Houck KS. A <strong>Food</strong> Vari<strong>et</strong>y Index for Toddlers (VIT): development and application.<br />
J Am Di<strong>et</strong> Assoc. 1997;97(12):1382-6; quiz 7-8.<br />
Dubois L, Girard M, Bergeron N. The choice of a di<strong>et</strong> quality <strong>in</strong>dicator to evaluate the nutritional health of populations. Public<br />
Health Nutr. 2000;3(3):357-65.<br />
Eshel G, Mart<strong>in</strong> P. Di<strong>et</strong>, energy, and golbal warm<strong>in</strong>g. Earth <strong>in</strong>teractions. 2006;10(9).<br />
FAO. Def<strong>in</strong>ition of susta<strong>in</strong>able di<strong>et</strong>s. International scientif symposium "Biodiversity and susta<strong>in</strong>able di<strong>et</strong>s United aga<strong>in</strong>ts hunger".<br />
FAO Headquarters, Rome2010.<br />
Ferland S, O'Brien HT. Maternal di<strong>et</strong>ary <strong>in</strong>take and pregnancy outcome. J Reprod Med. 2003;48(2):86-94.<br />
Garn<strong>et</strong>t T. Cook<strong>in</strong>g up a storm: <strong>Food</strong>, greenhouse gas emissions and our chang<strong>in</strong>g climate. <strong>Food</strong> Climate Research N<strong>et</strong>work, Centre<br />
for Environmental Strategy, University of Surrey. 2008.<br />
Jo<strong>in</strong>t WHO/FAO expert consultation. Di<strong>et</strong>, nutrition and the prevention of chronic diseases. World Health Organ Tech Rep Ser.<br />
2003;916:i-viii, 1-149, backcover.<br />
Keller HH, Ostbye T, Bright-See E. Predictors of di<strong>et</strong>ary <strong>in</strong>take <strong>in</strong> Ontario seniors. Can J Public Health. 1997;88(5):305-9.<br />
126
PLENARY SESSION 1: FOOD 8 th Int. Conference on <strong>LCA</strong> <strong>in</strong> the<br />
Agri-<strong>Food</strong> Sector, 1-4 Oct <strong>2012</strong><br />
Kim B, Neff R. Measurement and communication of greenhouse gas emissions from U.S. food consumption via carbon calculators.<br />
Ecological Economics. 2009;69(1):186-96.<br />
Kl<strong>in</strong>g MM, Hough IJ. The American Carbon Footpr<strong>in</strong>t: Understand<strong>in</strong>g your food's impact on climate change. Brighter Plan<strong>et</strong>, Inc.<br />
2010.<br />
Krebs-Smith SM, Smiciklas-Wright H, Guthrie HA, Krebs-Smith J. The effects of vari<strong>et</strong>y <strong>in</strong> food choices on di<strong>et</strong>ary quality. J Am<br />
Di<strong>et</strong> Assoc. 1987;87(7):897-903.<br />
Ledikwe JH, Blanck HM, Khan LK, Serdula MK, Seymour JD, Tohill BC, <strong>et</strong> al., Di<strong>et</strong>ary energy density d<strong>et</strong>erm<strong>in</strong>ed by eight calculation<br />
m<strong>et</strong>hods <strong>in</strong> a nationally representative United States population. J Nutr. 2005;135(2):273-8.<br />
Ledikwe JH, Blanck HM, Khan LK, Serdula MK, Seymour JD, Tohill BC, <strong>et</strong> al., Low-energy-density di<strong>et</strong>s are associated with high<br />
di<strong>et</strong> quality <strong>in</strong> adults <strong>in</strong> the United States. J Am Di<strong>et</strong> Assoc. 2006;106(8):1172-80.<br />
Macdiarmid J, Kyle J, Horgan G, Loe J, Fyfe C, Johnstone A, <strong>et</strong> al., Livewell: a balance of healthy and susta<strong>in</strong>able food choices.<br />
WWF-UK and the Row<strong>et</strong>t Institute http://ass<strong>et</strong>swwforguk/downloads/livewell_report_correctedpdf2011.<br />
Mart<strong>in</strong> A. The "apports nutritionnels conseilles (ANC)" for the French population. Reprod Nutr Dev. 2001;41(2):119-28.<br />
McMichael AJ, Powles JW, Butler CD, Uauy R. <strong>Food</strong>, livestock production, energy, climate change, and health. Lanc<strong>et</strong>.<br />
2007;370(9594):1253-63.<br />
Millward DJ, Garn<strong>et</strong>t T. Plenary Lecture 3: <strong>Food</strong> and the plan<strong>et</strong>: nutritional dilemmas of greenhouse gas emission reductions through<br />
reduced <strong>in</strong>takes of meat and dairy foods. Proc Nutr Soc. 2010;69(1):103-18.<br />
Reijnders L, Sor<strong>et</strong> S. Quantification of the environmental impact of different di<strong>et</strong>ary prote<strong>in</strong> choices. Am J Cl<strong>in</strong> Nutr. 2003;78(3<br />
Suppl):664S-8S.<br />
Risku-Norja H, Hi<strong>et</strong>ala R, Virtanen H, K<strong>et</strong>omaki H, Helenius J. Localisation of primary food production <strong>in</strong> F<strong>in</strong>land: production<br />
potential and environmental impacts of food consumption patterns. Agric <strong>Food</strong> Sci. 2008;17:127-45.<br />
Schroder H, Vila J, Marrugat J, Covas MI. Low energy density di<strong>et</strong>s are associated with favorable nutrient <strong>in</strong>take profile and adequacy<br />
<strong>in</strong> free-liv<strong>in</strong>g elderly men and women. J Nutr. 2008;138(8):1476-81.<br />
Supkova M, Darmon N, Vieux F, Touazi D, Redl<strong>in</strong>gshoefer B, Russel M. Etude de cas. Impact carbone de régimes alimentaires<br />
différenciés selon leur qualité nutritionnelle: une étude basée sur des données Françaises. French (Carbon impact of food and nutritional<br />
quality of food choices <strong>in</strong> <strong>France</strong>. A case study). INRA ADEME; 2011.<br />
Torheim LE, Ouattara F, Diarra MM, Thiam FD, Barikmo I, Hatloy A, <strong>et</strong> al., Nutrient adequacy and di<strong>et</strong>ary diversity <strong>in</strong> rural Mali:<br />
association and d<strong>et</strong>erm<strong>in</strong>ants. Eur J Cl<strong>in</strong> Nutr. 2004;58(4):594-604.<br />
Tukker A, Huppes G, Gu<strong>in</strong>ee J, Heijungs R, de Kon<strong>in</strong>g A, van Oers L, <strong>et</strong> al., Environmental Impact of Products (EIPRO): Analysis<br />
of the Life Cycle Environmental Impacts Related to the Total F<strong>in</strong>al Consumption of the EU 25. European Commission Technical<br />
Report2006.<br />
USDA (United States Department of Agriculture). http://www.choosemyplate.gov/. 2011.<br />
Vieux F, Darmon N, Touazi D, Soler LG. Greenhouse gas emissions of self-selected <strong>in</strong>dividual di<strong>et</strong>s <strong>in</strong> <strong>France</strong>: chang<strong>in</strong>g the di<strong>et</strong><br />
structure or consum<strong>in</strong>g less? Ecological Economics. <strong>2012</strong>;75:91-101.<br />
Wallén A, Brandt N, Wennersten R. Does the Swedish consumer's choice of food <strong>in</strong>fluence greenhouse gas emissions? Environmental<br />
Science and Policy. 2004;7(6):525-35.<br />
WHO. Di<strong>et</strong>, nutrition and the prevention of excess weight ga<strong>in</strong> and obesity. Report of a jo<strong>in</strong>t WHO/FAO expert consultation WHO,<br />
Geneva 2003; Technical report, series 916.<br />
WHO Regional Office for Europe. CINDI di<strong>et</strong>ary guide.<br />
1998;http://www.euro.who.<strong>in</strong>t/__data/ass<strong>et</strong>s/pdf_file/0010/119926/E70041.pdf.<br />
World Cancer Research Fund International/ Association Institute of Cancer Research. <strong>Food</strong>, Nutrition, Physical Activity, and the<br />
Prevention of Cancer: a Global Perspective. http://wwwwcrforg/. 2007.<br />
127
PARALLEL SESSION 2A: LAND USE 8 th Int. Conference on <strong>LCA</strong> <strong>in</strong> the<br />
Parallel session 2a: Land Use<br />
128<br />
Agri-<strong>Food</strong> Sector, 1-4 Oct <strong>2012</strong><br />
Application of new UNEP/SETAC life cycle <strong>in</strong>itiative m<strong>et</strong>hods for<br />
land use impact assessment. Land use impacts of margar<strong>in</strong>e<br />
Llorenç Milà i Canals * , Giles Rigarlsford, Sarah Sim<br />
Saf<strong>et</strong>y and Environmental Assurance Centre, Unilever R&D, Colworth Science Park, Sharnbrook, Bedfordshire, MK44 1LQ, UK<br />
Correspond<strong>in</strong>g author. E-mail: Llorenc.Mila-i-Canals@Unilever.com<br />
ABSTRACT<br />
New characterisation factors (CF) for land use and land use change (LUC) impacts relat<strong>in</strong>g to biodiversity and ecosystem services<br />
developed recently with<strong>in</strong> the UNEP/SETAC Life Cycle <strong>in</strong>itiative have been applied to a case study of margar<strong>in</strong>e (Milà i Canals <strong>et</strong><br />
al., <strong>2012</strong>). The new land use impact assessment m<strong>et</strong>hods applied help to identify hotspots <strong>in</strong> the life cycle of margar<strong>in</strong>es, with different<br />
proportions and sources of veg<strong>et</strong>able oils. The specific impacts of each veg<strong>et</strong>able oil are d<strong>et</strong>erm<strong>in</strong>ed ma<strong>in</strong>ly by the yield (land<br />
occupation), but also by the type of agriculture (annual vs. permanent crops) and the sourc<strong>in</strong>g location (sensitivity of biomes and<br />
occurrence of land use change). Outstand<strong>in</strong>g key challenges to assess land use impacts <strong>in</strong> <strong>LCA</strong> <strong>in</strong>clude the quantification of LUC and<br />
its allocation to specific crops / products; d<strong>et</strong>erm<strong>in</strong>ation of sourc<strong>in</strong>g regions for globalised supply cha<strong>in</strong>s; and the choice of reference<br />
situation to assess land use impacts.<br />
Keywords: land use impacts, margar<strong>in</strong>e, Life Cycle Impact Assessment, biodiversity, ecosystem services<br />
1. Introduction<br />
New characterisation factors (CF) for the impacts from land use (LU, also called occupation) and land use<br />
change (LUC, also called transformation) on biodiversity and ecosystem services have recently been published<br />
under the UNEP/SETAC Life Cycle <strong>in</strong>itiative (Koellner <strong>et</strong> al., <strong>2012</strong>a); this paper assesses the application<br />
of these new CFs to LU- and LUC-related impact categories <strong>in</strong> a case study of margar<strong>in</strong>e (Milà i Canals<br />
<strong>et</strong> al., <strong>2012</strong>). The specific goals of the case study are to describe and estimate the size of the environmental<br />
impacts associated with the cradle-to-gate production of margar<strong>in</strong>e and to understand the ease of use of the<br />
new CF. This case study uses as its basis a recently published study on margar<strong>in</strong>e (Nilsson <strong>et</strong> al., 2010).<br />
2. M<strong>et</strong>hods<br />
The m<strong>et</strong>hodological approach <strong>in</strong> this case study is a descriptive (attributional) <strong>LCA</strong> (Nilsson <strong>et</strong> al., 2010).<br />
The functional unit of the study is 500g of packaged margar<strong>in</strong>e used as a spread <strong>in</strong> the UK and Germany<br />
represent<strong>in</strong>g a low fat and high fat content margar<strong>in</strong>e product respectively. Further description of how the<br />
occupation flows were quantified is provided <strong>in</strong> Milà i Canals <strong>et</strong> al., (<strong>2012</strong>), as well as the adaptation of land<br />
use flows <strong>in</strong> the background databases. The quantification of land transformation flows <strong>in</strong> the relevant countries<br />
for the ma<strong>in</strong> crops used <strong>in</strong> the margar<strong>in</strong>e recipes is further expla<strong>in</strong>ed <strong>in</strong> section 2.1 below. The land occupation<br />
and transformation flows identified were then characterised with the characterisation factors (CF)<br />
recommended by the Life Cycle Initiative project, as follows:<br />
For the Biodiversity Damage Potential (BDP) the approach and CF offered by de Baan <strong>et</strong> al., (<strong>2012</strong>)<br />
were used. Average world CF were used for those biomes not covered <strong>in</strong> de Baan <strong>et</strong> al., (<strong>2012</strong>).<br />
For Climate Regulation Potential (CRP), the approach suggested by Müller-Wenk and Brandão<br />
(2010) was used.<br />
For Biotic Production Potential (BPP), the approach and CF offered by Brandão and Milà i Canals<br />
(<strong>2012</strong>) were used.<br />
For impacts on Ecosystem Services, other than CRP and BPP, the approach and CF proposed by<br />
Saad <strong>et</strong> al., (<strong>2012</strong>) were used. These <strong>in</strong>clude impacts on: Freshwater Regulation Potential (FWRP);<br />
Erosion Regulation Potential (ERP); and Water Purification Potential (WPP) assessed here by two<br />
<strong>in</strong>dicators related to Physico-Chemical Filtration (WPP-PCF) and Mechanical Filtration (WPP-MF).<br />
The results on FWRP and ERP are not discussed <strong>in</strong> this paper.<br />
Specific assumptions <strong>in</strong> the application of each impact category are discussed <strong>in</strong> Milà i Canals <strong>et</strong> al.,<br />
(<strong>2012</strong>).<br />
2.1. Land transformation l<strong>in</strong>ked to agricultural stages<br />
As shown <strong>in</strong> Figure 1, a three step approach was used to d<strong>et</strong>erm<strong>in</strong>e wh<strong>et</strong>her a crop grown <strong>in</strong> a specific<br />
country was potentially related to any land transformation (LUC) <strong>in</strong> that country, and what transformations<br />
were <strong>in</strong>volved if any. A 20 year time period was considered as this is often recommended for the allocation<br />
of impacts of land use change (see e.g. Koellner <strong>et</strong> al., <strong>2012</strong>a; Flynn <strong>et</strong> al., <strong>2012</strong>). Because <strong>in</strong> this case the
PARALLEL SESSION 2A: LAND USE 8 th Int. Conference on <strong>LCA</strong> <strong>in</strong> the<br />
Agri-<strong>Food</strong> Sector, 1-4 Oct <strong>2012</strong><br />
average LUC <strong>in</strong> the whole country rather than a specific area (e.g. plantation) was assessed, there was no<br />
need for allocat<strong>in</strong>g it to the first 20 years of land use (as suggested <strong>in</strong> BSI, 2008; Koellner <strong>et</strong> al., <strong>2012</strong>a;<br />
Flynn <strong>et</strong> al., <strong>2012</strong>). In order to smooth out short-term fluctuations <strong>in</strong> land use, 5-year averages were used.<br />
FAOSTAT (2011) data were used to perform this analysis.<br />
Figure 1. Decision tree to d<strong>et</strong>erm<strong>in</strong>e the existence and magnitude of land use change for the studied crops <strong>in</strong><br />
the sourc<strong>in</strong>g countries (Milà i Canals <strong>et</strong> al., <strong>2012</strong>).<br />
This approach is consistent with the recommended approach <strong>in</strong> the PAS 2050 (BSI, 2011) where the<br />
country of production is known but the previous land use is not known (section 5.6.2, po<strong>in</strong>t b). BSI (2011)<br />
suggest exclud<strong>in</strong>g <strong>in</strong>direct land use changes (ILUC); however, it must be noted that this approach actually<br />
does <strong>in</strong>clude ILUC occurr<strong>in</strong>g with<strong>in</strong> the produc<strong>in</strong>g country. ILUC caused by displacement of crops to be<br />
grown <strong>in</strong> other countries, on the other hand, is not <strong>in</strong>cluded. This is a limitation of an attributional-focused<br />
approach; see e.g. Kløverpris <strong>et</strong> al., (2007) or Brandão (<strong>2012</strong>) for approaches to deal with ILUC.<br />
3. Results<br />
Figures 2a-g provide the contributions per functional unit of the different <strong>in</strong>gredients and life cycle stages<br />
of the two margar<strong>in</strong>es for the seven land use-related impact categories. For most impact categories (except<br />
FWRP, not shown here) the UK margar<strong>in</strong>e with a 38% fat content shows larger total impacts than the German<br />
margar<strong>in</strong>e with the higher 70% fat content. This is because the UK margar<strong>in</strong>e conta<strong>in</strong>s a higher proportion<br />
of oils from low-yield<strong>in</strong>g crops such as sunflower (yield: 1.5 t/ha). Sunflower grow<strong>in</strong>g dom<strong>in</strong>ates the<br />
impact results for the UK margar<strong>in</strong>e (where it represents about 25% of the <strong>in</strong>gredients) and it also has a significant<br />
contribution towards the impacts of the German margar<strong>in</strong>e <strong>in</strong> which it is only 3.5% of the <strong>in</strong>gredients.<br />
In comparison the impacts for rapeseed are generally lower even though it represents 36% of the German<br />
margar<strong>in</strong>e. This can be expla<strong>in</strong>ed by the higher yield for rapeseed (4.2 t/ha) compared to sunflower.<br />
Palm oil, which makes up ca. 26% of the German recipe, has a relatively low contribution to all the land use<br />
impact categories, even though significant LUC of 435 m 2 / ha*year of tropical ecosystems with high biodiversity<br />
and carbon values was attributed to this crop. This can be expla<strong>in</strong>ed by the lower impacts associated<br />
to permanent agricultural systems such as plantations for most impact categories relative to annual crops.<br />
129
PARALLEL SESSION 2A: LAND USE 8 th Int. Conference on <strong>LCA</strong> <strong>in</strong> the<br />
Agri-<strong>Food</strong> Sector, 1-4 Oct <strong>2012</strong><br />
130<br />
a) BDP<br />
c) WPP-MF<br />
e) BPP<br />
kg C*yr per f.u.<br />
cm/day per f.u.<br />
PDF% per f.u.<br />
5<br />
4<br />
3<br />
2<br />
1<br />
0<br />
1.6<br />
1.4<br />
1.2<br />
1<br />
0.8<br />
0.6<br />
0.4<br />
0.2<br />
7<br />
6<br />
5<br />
4<br />
3<br />
2<br />
1<br />
0<br />
0<br />
DE UK<br />
Country<br />
DE UK<br />
Country<br />
DE UK<br />
Country<br />
b) CRP<br />
d) WPP-PCF<br />
Legend<br />
Figure 2. Contributions of the different <strong>in</strong>gredients and life cycle stages to the land use impact categories:<br />
a) BDP, Biodiversity Damage Potential; b) CRP, Climate Regulation Potential; c) WPP-MF, Water Purification<br />
Potential through Mechanical Filtration; d) WPP-PCF, Water Purification Potential through Physico-<br />
Chemical Filtration; e) BPP, Biotic Production Potential. All impacts expressed per functional unit (f.u.):<br />
500g tub of margar<strong>in</strong>e to be used as spread (Milà i Canals <strong>et</strong> al., <strong>2012</strong>).<br />
In conclusion, the type of oil, not only the total fat content, d<strong>et</strong>erm<strong>in</strong>es the overall impact and this is<br />
ma<strong>in</strong>ly due to the differ<strong>in</strong>g yields of the various oil crops and hence the land occupation level. In addition,<br />
the production system of the various oil crops (annual vs. permanent crops) and the sourc<strong>in</strong>g region (biome)<br />
have a significant effect on the contributions to the impact categories, as expla<strong>in</strong>ed below.<br />
kg C transferred to air per f.u.<br />
cmol/kg soil per f.u.<br />
0.2<br />
0.15<br />
0.1<br />
0.05<br />
0<br />
4<br />
3<br />
2<br />
1<br />
0<br />
DE UK<br />
Country<br />
DE UK<br />
Country
PARALLEL SESSION 2A: LAND USE 8 th Int. Conference on <strong>LCA</strong> <strong>in</strong> the<br />
Agri-<strong>Food</strong> Sector, 1-4 Oct <strong>2012</strong><br />
The impacts on biodiversity (BDP) and climate regulation (CRP) (Figures 2a-b) are the largest for the UK<br />
margar<strong>in</strong>e because of the contribution from low oil-yield<strong>in</strong>g crops (sunflower; l<strong>in</strong>seed). This is <strong>in</strong> spite of the<br />
fact that the total fat amount of these two oils <strong>in</strong> the UK recipe is about half the amount of rapeseed oil and<br />
palm oil <strong>in</strong> the German recipe.<br />
The water purification potential (WPP) impact categories (WPP-MF and WPP-PCF, Figures 2c-d) deserve<br />
some special attention because they <strong>in</strong>dicate a very significant contribution from land transformation<br />
flows l<strong>in</strong>ked to non-agricultural or ‘sealed’ land use (e.g. <strong>in</strong>dustrial build<strong>in</strong>gs; transport <strong>in</strong>frastructure) associated<br />
with the packag<strong>in</strong>g’s life cycle, product manufactur<strong>in</strong>g and road distribution. This is because the CF<br />
for land transformation to sealed land flows are 3-5 orders of magnitude higher than for land transformation<br />
to agricultural land (Saad <strong>et</strong> al., <strong>2012</strong>).<br />
F<strong>in</strong>ally, the impact profile for biotic production (BPP, Figure 2e) follows a very similar pattern to the<br />
WPP impact profile, but with smaller contributions from palm oil due to the same soil organic carbon be<strong>in</strong>g<br />
considered for forests and permanent crops (Brandão and Milà i Canals, <strong>2012</strong>). In BPP there are also relevant<br />
contributions associated with the packag<strong>in</strong>g component of the product due to the occupation of sealed land<br />
rather than transformation flows as <strong>in</strong> the case of the two WPP impacts (see above).<br />
4. Discussion<br />
In terms of the five new impact categories evaluated <strong>in</strong> this paper, the results of the case study suggest<br />
that their impact profiles are largely similar. This is because all of them are actually d<strong>et</strong>erm<strong>in</strong>ed to a large<br />
extent by land occupation. The land use types dist<strong>in</strong>guished so far (ma<strong>in</strong>ly at the first level of classification<br />
as suggested by Koellner <strong>et</strong> al., <strong>2012</strong>b) are useful <strong>in</strong> highlight<strong>in</strong>g the likely hotspots <strong>in</strong> the life cycle. In this<br />
case study based on a food product most impacts were dom<strong>in</strong>ated by the agricultural stages, but the importance<br />
of non-agricultural or ‘sealed’ land uses was shown for some impact categories. A clear need identified<br />
for further ref<strong>in</strong>ement is <strong>in</strong> the description of the types of agricultural production. Perennial crops, such as oil<br />
palm plantations, are likely to have significantly different impacts on several impact categories when compared<br />
to annual arable crops. Therefore, it is not sufficient to provide CF only for “agricultural land” at the<br />
first level of land use classification.<br />
Spatial differentiation at the level of biomes has shown to be relevant <strong>in</strong> this case study. It rema<strong>in</strong>s to be<br />
studied wh<strong>et</strong>her f<strong>in</strong>er levels of bio-geographical differentiation would provide more <strong>in</strong>formational value to<br />
such studies but this would need to be balanced aga<strong>in</strong>st its practical feasibility as discussed below.<br />
Land transformation (land use change, LUC) flows do not have a very significant effect on the impact results,<br />
except for those impact categories where CF for transformation flows are significantly larger than for<br />
the correspond<strong>in</strong>g land occupation flows. This is due to several factors, <strong>in</strong>clud<strong>in</strong>g the allocation of LUC over<br />
20 years follow<strong>in</strong>g the transformation; use of the same reference (potential natural veg<strong>et</strong>ation); and limited<br />
(and uncerta<strong>in</strong>) regeneration times and modell<strong>in</strong>g for LUC impacts. A calculation procedure has been suggested<br />
to estimate direct land use change from FAO statistics, which is consistent and easy to use for any<br />
crop <strong>in</strong> the world. As noted above, though, this approach ignores <strong>in</strong>direct LUC caused by displaced production<br />
of crops outside the country be<strong>in</strong>g studied. The fact that LUC has such a small effect on the f<strong>in</strong>al results<br />
is somehow contrary to current op<strong>in</strong>ion and policy, which places a significant focus on LUC-derived impacts<br />
(e.g. on GHG emissions and biodiversity loss from deforestation). This limitation of the UNEP/SETAC LCI<br />
framework for modell<strong>in</strong>g impacts from land use change is related to the assumption of ma<strong>in</strong>ta<strong>in</strong><strong>in</strong>g the land<br />
quality <strong>in</strong> terms of an idealistic potential quality which may never be reached aga<strong>in</strong> <strong>in</strong> reality. In this sense,<br />
the results of the impact assessment need to be <strong>in</strong>terpr<strong>et</strong>ed as a view of the differences <strong>in</strong> biodiversity or ecosystem<br />
services that are be<strong>in</strong>g ma<strong>in</strong>ta<strong>in</strong>ed with respect to an ideal or theor<strong>et</strong>ical potential rather than a description<br />
of the actual change <strong>in</strong> land quality. In this context the new land use impact categories <strong>in</strong>form of<br />
potential impacts on biodiversity and ecosystem services as well as the “opportunity cost” impacts of not<br />
l<strong>et</strong>t<strong>in</strong>g land regenerate.<br />
The challenges of us<strong>in</strong>g the new CF relate to the exist<strong>in</strong>g <strong>in</strong>formation <strong>in</strong> LCI databases and <strong>in</strong> product<br />
supply cha<strong>in</strong>s. Significant time had to be <strong>in</strong>vested <strong>in</strong> updat<strong>in</strong>g background processes with relevant land use<br />
<strong>in</strong>formation, even though no attempt was made to provide spatial differentiation <strong>in</strong>formation to the background<br />
data because at the level at which such data are aggregated it would have been impossible. This illustrates<br />
the need for greater consistency or standardisation <strong>in</strong> how LU/LUC flows are considered <strong>in</strong> LCI databases.<br />
In the case of <strong>in</strong>formation describ<strong>in</strong>g the product’s supply cha<strong>in</strong>, this is not always available. For margar<strong>in</strong>e,<br />
this is exemplified by the fact that veg<strong>et</strong>able oils are often traded as commodity products. This means<br />
that the orig<strong>in</strong> of the oils may not always be known, particularly at a country level, thus illustrat<strong>in</strong>g a potential<br />
disparity or complexity <strong>in</strong> the level of d<strong>et</strong>ail required for the application of these new CF and the <strong>in</strong>formation<br />
currently available with<strong>in</strong> companies and supply cha<strong>in</strong>s.<br />
131
PARALLEL SESSION 2A: LAND USE 8 th Int. Conference on <strong>LCA</strong> <strong>in</strong> the<br />
Agri-<strong>Food</strong> Sector, 1-4 Oct <strong>2012</strong><br />
5. Conclusion<br />
One key learn<strong>in</strong>g from this study is that occupation seems to be the key driver for land use impacts, more<br />
than transformation. Here, the effects of differ<strong>in</strong>g crop yields are the ma<strong>in</strong> driver for occupation and hence<br />
tend to dom<strong>in</strong>ate the results. Furthermore as crop yield data are associated with large variability, it will also<br />
be a source of variability / uncerta<strong>in</strong>ty for land use impacts. Consider<strong>in</strong>g the driver role of land occupation,<br />
the conclusion of Nilsson <strong>et</strong> al., (2010) that margar<strong>in</strong>e has smaller environmental impacts than butter rema<strong>in</strong>s<br />
valid, s<strong>in</strong>ce butter production required double the land occupation of margar<strong>in</strong>e. However, it would be premature<br />
to suggest that we expect occupation to be always the key driver for impacts, and more case studies<br />
should be carried out <strong>in</strong> order to test this.<br />
The conceptual approach followed to assess land use impacts relates to a theor<strong>et</strong>ical potential reference<br />
(i.e. orig<strong>in</strong>al biome prior to man-made <strong>in</strong>tervention) and therefore it tends to focus the impact assessment<br />
away from the obvious sources of actual impacts such as recent land use change. In some decision contexts it<br />
may be helpful to explore the use of alternative ecological reference po<strong>in</strong>ts such as a current reference state<br />
(option 3 suggested <strong>in</strong> Koellner <strong>et</strong> al., <strong>2012</strong>a) or the alternative most probable land use.<br />
In addition, large uncerta<strong>in</strong>ties rema<strong>in</strong> around the assessment of impacts from land use change (LUC).<br />
These arise already <strong>in</strong> the <strong>in</strong>ventory stage, <strong>in</strong> the allocation of LUC to specific crops (e.g. over a certa<strong>in</strong><br />
“amortisation” period for land) and <strong>in</strong> the <strong>in</strong>clusion or exclusion of <strong>in</strong>direct LUC from the analysis. Also <strong>in</strong><br />
the impact assessment stage there is a large uncerta<strong>in</strong>ty related to the relaxation times considered to quantify<br />
the CF.<br />
More applications are thus needed that test the limits and potential flaws of the m<strong>et</strong>hods and theor<strong>et</strong>ical<br />
approaches used <strong>in</strong> order to ga<strong>in</strong> confidence <strong>in</strong> the helpfulness of the results as support for various types of<br />
decision mak<strong>in</strong>g. Specifically, research is recommended <strong>in</strong>to allocation of LUC, relaxation times for LUC<br />
derived impacts, and effects of different references on the results.<br />
6. References<br />
de Baan, L., Alkemade, R., Koellner, T. <strong>2012</strong>. Land use impacts on biodiversity <strong>in</strong> <strong>LCA</strong>: a global approach. Int. J. Life Cycle Assess.<br />
on-l<strong>in</strong>e first DOI:10.1007/s11367-012-0412-0.<br />
Brandão, M. <strong>2012</strong>. <strong>Food</strong>, feed, fuel, timber or carbon s<strong>in</strong>k? Towards susta<strong>in</strong>able land use - a consequential life-cycle approach. PhD<br />
Thesis, University of Surrey, Guildford, UK.<br />
Brandão, M., Milà i Canals, L. <strong>2012</strong>. Global characterisation factors to assess land use impacts on Biotic Production. Int. J. Life<br />
Cycle Assess. on-l<strong>in</strong>e first DOI:10.1007/s11367-012-0381-3.<br />
BSI. 2011. PAS2050:2011 Specification for the assessment of the life cycle greenhouse gas emissions of goods and services, British<br />
Standards Institution.<br />
FAOSTAT. 2011. Crop production data 1988-2008 from http://faostat.fao.org/site/567/default.aspx#ancor Accessed 18 March 2011.<br />
Flynn, H.C., Milà i Canals, L., Keller, E., K<strong>in</strong>g, H., Sim, S., Hast<strong>in</strong>gs, A., Wang, S., Smith, P. <strong>2012</strong>. Quantify<strong>in</strong>g global greenhouse<br />
gas emissions from land use change for crop production. Global Change Biol. 18 (5) 1622–1635.<br />
Kløverpris, J., Wenzel, H., Nielsen, P.H. 2007. Life cycle <strong>in</strong>ventory modell<strong>in</strong>g of land use <strong>in</strong>duced by crop consumption. Part 1:<br />
Conceptual analysis and m<strong>et</strong>hodological proposal. Int. J. Life Cycle Assess. 13(1) 13-21.<br />
Koellner, T., de Baan, L., Brandão, M., Milà i Canals, L., Civit, B., Margni, M., Saad, R., Maia de Souza, D., Beck, T. Müller-Wenk,<br />
R. <strong>2012</strong>a. UNEP-SETAC Guidel<strong>in</strong>e on Global Land Use Impact Assessment on Biodiversity and Ecosystem Services <strong>in</strong> <strong>LCA</strong>.<br />
Int. J. Life Cycle Assess. On-l<strong>in</strong>e first.<br />
Koellner, T., de Baan, L., Brandão, M., Milà i Canals, L., Civit, B., Goedkoop, M., Margni, M., Weidema, B., Wittstock, B., Beck,<br />
T., Müller-Wenk, R. <strong>2012</strong>b. Pr<strong>in</strong>ciples for Life Cycle Inventories of land use on a global scale. Int. J. Life Cycle Assess. On-l<strong>in</strong>e<br />
first DOI:10.1007/s11367-012-0392-0<br />
Milà i Canals, L., Rigarlsford, G., Sim, S. <strong>2012</strong>. Land use impact assessment of Margar<strong>in</strong>e. Int. J. Life Cycle Assess. On-l<strong>in</strong>e first<br />
DOI:10.1007/s11367-012-0380-4.<br />
Müller-Wenk, R., Brandão, M. 2010. Climatic impact of land use <strong>in</strong> <strong>LCA</strong>—carbon transfers b<strong>et</strong>ween veg<strong>et</strong>ation/soil and air. Int. J.<br />
Life Cycle Assess. 15 172-182.<br />
Nilsson, K., Flysjö, A., Davis, J., Sim, S., Unger, N., Bell, S. 2010. Comparative life cycle assessment of margar<strong>in</strong>e and butter consumed<br />
<strong>in</strong> the UK, Germany and <strong>France</strong>. Int. J. Life Cycle Assess. 15:916-926.<br />
Saad, R., Koellner, T., Margni, M. <strong>2012</strong>. Land use impacts on freshwater regulation, erosion regulation and water purification: a<br />
spatial approach for a global scale. Int. J. Life Cycle Assess. On-l<strong>in</strong>e first.<br />
132
PARALLEL SESSION 2A: LAND USE 8 th Int. Conference on <strong>LCA</strong> <strong>in</strong> the<br />
Agri-<strong>Food</strong> Sector, 1-4 Oct <strong>2012</strong><br />
Development of an <strong>in</strong>tegrated <strong>in</strong>dicator for land use based on the<br />
economic value of ecosystem services<br />
Viêt Cao 1,2,* , Manuele Margni 2 , Basil D. Favis 3 , Louise Deschênes 1<br />
1<br />
CIRAIG, Department of Chemical Eng<strong>in</strong>eer<strong>in</strong>g, Polytechnique Montréal, P.O. Box 6079, Station Centre-ville, Montréal, Québec<br />
H3C 3A7, Canada 1<br />
2<br />
CIRAIG, Department of Mathematical and Industrial Eng<strong>in</strong>eer<strong>in</strong>g, Polytechnique Montréal, P.O. Box 6079, Station Centre-ville,<br />
Montréal, Québec H3C 3A7, Canada<br />
3<br />
CRÉPEC, Department of Chemical Eng<strong>in</strong>eer<strong>in</strong>g, Polytechnique Montréal, P.O. Box 6079, Station Centre-ville, Montréal, Québec<br />
H3C 3A7, Canada<br />
*<br />
Correspond<strong>in</strong>g author. E-mail: vi<strong>et</strong>.cao@polymtl.ca<br />
ABSTRACT<br />
Soils are one of Earth's essential natural resources, support<strong>in</strong>g nearly all terrestrial life. In life cycle impact assessment (LCIA), potential<br />
impacts due to land use are calculated as the product of surface occupied (or transformed), occupation (or transformation) time<br />
and a param<strong>et</strong>er describ<strong>in</strong>g the land quality loss (ΔQ) (Mila iCanals <strong>et</strong> al., 2007). In current LCIA m<strong>et</strong>hodologies, the only operational<br />
endpo<strong>in</strong>t level <strong>in</strong>dicator for the land quality loss is solely related to terrestrial biodiversity (PDF.m 2 .year, PDF be<strong>in</strong>g Potential<br />
Disappeared Fraction of species) and is not representative of all impacts that orig<strong>in</strong>ate from land use as shown by a recent project<br />
named LULCIA (2008-<strong>2012</strong>), conducted under the aegis of the UNEP/SETAC Life Cycle Initiative (Koellner <strong>et</strong> al., <strong>2012</strong>; de Baan <strong>et</strong><br />
al., <strong>2012</strong>; Saad <strong>et</strong> al., 2011; Brandão and Mila iCanals, <strong>2012</strong>; Müller-Wenk and Brandão, 2010).<br />
This project expanded the scope of land use assessment, go<strong>in</strong>g beyond the biodiversity assessment. This m<strong>et</strong>hod relates land use to<br />
six additional <strong>in</strong>dicators: biotic production potential (BPP), erosion regulation potential (ERP), fresh water regulation potential<br />
(FWRP), (mechanical and physico-chemical) water purification potential (WPP) and carbon sequestration potential (CSP), which<br />
represent provision and regulation services from ecosystems, as def<strong>in</strong>ed <strong>in</strong> the Millennium Ecosystem Assessment (MEA) (2005).<br />
Although the LCIA m<strong>et</strong>hodology becomes more comprehensive for relevant pathways l<strong>in</strong>ked to land use, this development potentially<br />
reduces the capacity of <strong>LCA</strong> as a decision support system, provid<strong>in</strong>g seven midpo<strong>in</strong>ts for the land use impact category alone.<br />
This project aims to develop a new m<strong>et</strong>hod to value the reduction of ecosystem services provided to human soci<strong>et</strong>y. The m<strong>et</strong>hod<br />
consists <strong>in</strong> convert<strong>in</strong>g the above mentioned midpo<strong>in</strong>t <strong>in</strong>dicators <strong>in</strong> mon<strong>et</strong>ary terms, us<strong>in</strong>g economic valuation of the reduction of a<br />
given ecosystem service. BPP is estimated with productivity loss while CSP thanks to carbon social cost: less sequestration by soils<br />
is equivalent to emission. The other regulation services are estimated through current compensation costs, as they are considered<br />
essential (conservative approach).<br />
This m<strong>et</strong>hod is applied on a case study, the comparative <strong>LCA</strong> of bio-based polymers. Results show that impact scores are not only<br />
<strong>in</strong>fluenced by the bio-geographical variability of systems under study (e.g. crop yield <strong>in</strong> the <strong>in</strong>ventory flow, the land location for the<br />
impact characterisation), but also by the socio-economical availability and typology of the compensation systems taken <strong>in</strong>to account.<br />
Uncerta<strong>in</strong>ties and economic valuation assumptions are further discussed <strong>in</strong> the paper.<br />
Overall this work shows the feasibility to translate all the midpo<strong>in</strong>ts <strong>in</strong>dicators proposed by the LULCIA land use impact assessment<br />
framework <strong>in</strong>to economic values, br<strong>in</strong>g<strong>in</strong>g a new level of <strong>in</strong>terpr<strong>et</strong>ation for the decision maker. The converted <strong>in</strong>dicators can be<br />
summed <strong>in</strong>to an <strong>in</strong>tegrated <strong>in</strong>dicator express<strong>in</strong>g potential impacts and they must be <strong>in</strong>terpr<strong>et</strong>ed as the loss of natural (capital of) ecosystem<br />
services. It also potentially allows <strong>LCA</strong> to assess other impacts related to land use, such as aesth<strong>et</strong>ics and recreational aspects<br />
(as they are conceptualised as cultural services <strong>in</strong> the MEA framework).<br />
Keywords: land use, <strong>in</strong>tegrated <strong>in</strong>dicator, ecosystem services, economic valuation, impact assessment<br />
1. Introduction<br />
In life cycle impact assessment (LCIA), midpo<strong>in</strong>t potential impacts due to land use are calculated as the<br />
product of surface occupied (or transformed), occupation (or transformation) time and a param<strong>et</strong>er describ<strong>in</strong>g<br />
the land quality loss (ΔQ) (Mila i Canals <strong>et</strong> al., 2007). So far, this latter is solely related to terrestrial<br />
biodiversity (PDF.m 2 .year, PDF be<strong>in</strong>g Potential Disappeared Fraction of species), which is certa<strong>in</strong>ly not<br />
representative of all impacts caused by human <strong>in</strong>terventions, that orig<strong>in</strong>ate from land use as shown by a recent<br />
project named LULCIA (2008-<strong>2012</strong>), conducted under the aegis of the UNEP/SETAC Life Cycle Initiative<br />
(Koellner <strong>et</strong> al., <strong>2012</strong>; de Baan <strong>et</strong> al., <strong>2012</strong>; Saad <strong>et</strong> al., 2011; Brandão and Mila iCanals, <strong>2012</strong>; Müller-<br />
Wenk and Brandão, 2010) and also partly assessed by the European Commission JRC ILCD handbook<br />
(2010).<br />
Soil quality is both an important and difficult ecosystem component to assess, because of the vari<strong>et</strong>y of<br />
both soil quality def<strong>in</strong>itions and approaches possible (Garrigues <strong>et</strong> al., 2011). The “quest” for a synth<strong>et</strong>ic<br />
<strong>in</strong>dicator is even more difficult with both the different <strong>in</strong>tended mean<strong>in</strong>g and public possible.<br />
This m<strong>et</strong>hod relates land use to six new <strong>in</strong>dicators <strong>in</strong> addition to biodiversity: biotic production (BPP),<br />
erosion regulation (ERP), fresh water regulation (FWRP), mechanical and physicochemical water purification<br />
(MWPP and PCWPP) and carbon sequestration (CSP) potentials, which represent provision and regulation<br />
ecosystem services, as def<strong>in</strong>ed <strong>in</strong> the Millennium Ecosystem Assessment (2005). Ecosystem service is a<br />
relative new concept, which makes the l<strong>in</strong>k b<strong>et</strong>ween ecological functions and the service they provide to by<br />
133
PARALLEL SESSION 2A: LAND USE 8 th Int. Conference on <strong>LCA</strong> <strong>in</strong> the<br />
Agri-<strong>Food</strong> Sector, 1-4 Oct <strong>2012</strong><br />
humans. Bridg<strong>in</strong>g environmental, economic sciences and decision-mak<strong>in</strong>g policies, they have become a very<br />
dynamic area of research, particularly <strong>in</strong> ecological economics (National Research Council, 2004).<br />
On one hand, the LCIA m<strong>et</strong>hodology becomes more comprehensive <strong>in</strong> regards to relevant pathways<br />
l<strong>in</strong>ked to land use, but on the other hand, this development can potentially reduce the capacity of <strong>LCA</strong> to be<br />
used as a decision support system, as it can <strong>in</strong>crease up to seven the number of land use <strong>in</strong>dicators required.<br />
This project aims therefore to develop a m<strong>et</strong>hod to convert impact <strong>in</strong>dicators <strong>in</strong> mon<strong>et</strong>ary value us<strong>in</strong>g<br />
economic valuation as a common thread to normalise (and possibly aggregate) the new midpo<strong>in</strong>t <strong>in</strong>dicators<br />
to a s<strong>in</strong>gle area of protection represent<strong>in</strong>g ecosystem services loss.<br />
2. M<strong>et</strong>hods<br />
2.1. Economic valuation: conversion from functional <strong>in</strong>dicators to loss of natural capital of ecosystem<br />
services<br />
134<br />
The m<strong>et</strong>hod consists of convert<strong>in</strong>g each midpo<strong>in</strong>t i from physical to mon<strong>et</strong>ary units:<br />
CF’i = CFi · MF · (1-AC)<br />
with CF’ be<strong>in</strong>g the caracterisation factor express<strong>in</strong>g the loss of natural capital of ecosystem services <strong>in</strong><br />
$/(m 2 .year), CF the regular characterisation factor <strong>in</strong> physical unit/(m 2 .year), MF the mon<strong>et</strong>ary factor <strong>in</strong><br />
$/physical unit and AC the adaptation capacity (dimensionless). The mon<strong>et</strong>ary factor describes the cost of<br />
the compensation technology while (1-AC) describes the fraction of the ecosystem service that cannot be<br />
compensated by humans and thus leads to the exposure to the potential impact. AC is d<strong>et</strong>erm<strong>in</strong>ed by l<strong>in</strong>ear<br />
correlations with the country gross national product (GDP)..If a country has the capacity to adapt, the value<br />
of AC is 1, and there is no impact (Boulay <strong>et</strong> al., 2011).<br />
The mon<strong>et</strong>ary factor values for BPP and CSP are respectively estimated with productivity loss us<strong>in</strong>g FAO<br />
data (FAOSTAT, <strong>2012</strong>) and social cost of carbon (Ackerman and Stanton, 2010). The mon<strong>et</strong>ary factors for<br />
the other regulation services are estimated through current and potential compensation costs, as they are considered<br />
essential and to be replaced <strong>in</strong> the very short term. It is assumed that current productions systems and<br />
their operat<strong>in</strong>g mode (<strong>in</strong>clud<strong>in</strong>g their relationship with ecosystem, ecosystem services and benefits) are<br />
sought to be kept <strong>in</strong> their current state (conservative approach).<br />
Mechanical and physicochemical water purification potentials (WPPs) correspond to the natural equivalent<br />
of primary and secondary & tertiary water treatment, respectively. Current world water qualities from<br />
Boulay <strong>et</strong> al., (2011) are extrapolated without this natural filtration to identify the potential compensation<br />
technology required. The correspond<strong>in</strong>g costs are calculated with the Water Treatment Estimation Rout<strong>in</strong>e<br />
(WaTER) from US-EPA (1999). The economic values for FWRP are estimated us<strong>in</strong>g urban water supply<br />
prices (UNESCO, 2009) and the values for ERP are based on the World Overview of Conservative Approaches<br />
and Technologies database (Centre for Development and Environment <strong>et</strong> al., <strong>2012</strong>).<br />
The values calculated aim to estimate and to represent the natural capital provided by ecosystem services<br />
by assess<strong>in</strong>g the estimated cost if humans had to produce them by themselves. Correspond<strong>in</strong>g to the “use<br />
value” <strong>in</strong> the total economic value theory (Freeman, 2003), it is a low-estimate of the ecosystem services<br />
value.<br />
2.2. Spatial considerations and f<strong>in</strong>al converted characterisation factor (CFs’) calculation<br />
a. S<strong>in</strong>ce <strong>LCA</strong> assesses spatially-global product systems, physical midpo<strong>in</strong>t CFs were developed <strong>in</strong> the<br />
LULCIA project at the world scale. Because land use is by nature a local impact category, spatial variability<br />
prevails and this is why they are also regionalised. Each midpo<strong>in</strong>t has a different spatial variability (or resolution,<br />
see table 1). In the same way, spatial-dependant economic values were used for the mon<strong>et</strong>ary factors<br />
and the local availability of the compensation systems is taken <strong>in</strong>to account when possible.<br />
b. Each of the six midpo<strong>in</strong>ts was developed for different land type uses (or land covers, represent<strong>in</strong>g human<br />
activities): grasslands, forests, permanent crops, farmlands, fallow grounds, artificial, urban areas, water<br />
related areas and “others”. A harmonisation was made to create common land covers and geographic <strong>in</strong>formation<br />
system (GIS) software was used to design common biogeographical areas (see table 1).<br />
c. F<strong>in</strong>ally, all the converted midpo<strong>in</strong>ts <strong>in</strong>dicators (<strong>in</strong> 2.1) of the same land cover were summed <strong>in</strong>to a s<strong>in</strong>gle<br />
<strong>in</strong>dicator stand<strong>in</strong>g for the potential damage costs due to the loss of natural capital of ecosystem services<br />
that orig<strong>in</strong>ates from the considered land use cover.
PARALLEL SESSION 2A: LAND USE 8 th Int. Conference on <strong>LCA</strong> <strong>in</strong> the<br />
Agri-<strong>Food</strong> Sector, 1-4 Oct <strong>2012</strong><br />
Table 1 – Land use midpo<strong>in</strong>ts (UNEP/SETAC Life Cycle Initiative) and spatial d<strong>et</strong>ails.<br />
Midpo<strong>in</strong>t Author Spatial<br />
resolution<br />
Del<strong>in</strong>eation ma<strong>in</strong> drivers Source<br />
ERP<br />
Saad (2010) 36 lifezones<br />
Annual precipitation,<br />
annual biotemperature 1 MWPP<br />
PCWPP<br />
FWRP<br />
,<br />
potential evapotranspiration<br />
Holdridge<br />
lifezones<br />
(Holdridge, 1947)<br />
BPP<br />
Brandão and Mila iCanals<br />
(2011)<br />
13 climate<br />
zones<br />
Mean annual temperature<br />
& precipitation, potential<br />
evapotranspiration,<br />
soil types<br />
IPCC climate<br />
zones<br />
(IPCC, 2009)<br />
CSP<br />
Müller-Wenk and<br />
Brandão (2010)<br />
14 biomes or<br />
867 ecozones<br />
Several, <strong>in</strong>clud<strong>in</strong>g species<br />
endemism & richness,<br />
rarity of habitat type<br />
WWF biomes<br />
(Olson <strong>et</strong> al., 2001)<br />
1 : <strong>in</strong> this classification, an adjusted temperature consider<strong>in</strong>g that temperatures below freez<strong>in</strong>g or above 30°C do not contribute to life proliferation.<br />
2.3. Case study: bio-based polymers<br />
The converted characterisation factors CFs’ were applied on a case study: the comparison of different<br />
production locations of bio-based polymers, namely polylactic acid (PLA), polyhydroxy-alkanoate (PHA),<br />
thermoplastic starch (TPS) and green poly<strong>et</strong>hylene. Scenarii were designed accord<strong>in</strong>g different feedstocks<br />
and production locations. S<strong>in</strong>ce the comparative <strong>LCA</strong> is not the purpose of the present paper, only the CFs’<br />
associated with all those scenarii are presented.<br />
3. Results<br />
3.1. Mon<strong>et</strong>ary and characterisation factors<br />
Mon<strong>et</strong>ary factors (Figure 1 for the BPP) were calculated accord<strong>in</strong>g to economic data, mostly available at<br />
the country level. Economic valuation assumptions will be discussed. The choice of compensation systems<br />
depends <strong>in</strong>deed of the performances required (<strong>in</strong>creas<strong>in</strong>g with the severity of the impacts modelled <strong>in</strong> the<br />
midpo<strong>in</strong>t level) and their real availability (described with the adaptation capacity): a technology may not be<br />
available or affordable <strong>in</strong> a given country.<br />
Figure 1. Map of the mon<strong>et</strong>ary factors for the Biotic Production Potential (BPP) <strong>in</strong>to mon<strong>et</strong>ary units represent<strong>in</strong>g<br />
the loss of natural capital of ecosystem services (FAO data, country level).<br />
Multiplied with the physical midpo<strong>in</strong>ts and the exposure factor (1–AC), they generate the converted characterisation<br />
factors CFs’ for all the n<strong>in</strong>e land covers developed <strong>in</strong> 2.2.b, at a global level. Biogeographic and<br />
economic boundaries were comb<strong>in</strong>ed tog<strong>et</strong>her to draw new frontiers for the ecosystem services (2.2.c). For<br />
<strong>in</strong>stance, a map for an agricultural land use (or cover) is represented <strong>in</strong> Fig. 2.<br />
Figure 2: Map of the Biotic Production Potential (BPP) endpo<strong>in</strong>t <strong>in</strong>dicators for the land cover “permanent<br />
crops” (IPCC climate zones and FAO country frontiers <strong>in</strong>tersected).<br />
135
PARALLEL SESSION 2A: LAND USE 8 th Int. Conference on <strong>LCA</strong> <strong>in</strong> the<br />
Agri-<strong>Food</strong> Sector, 1-4 Oct <strong>2012</strong><br />
3.2. Case study<br />
The converted characterisation factors CFs’ can be used to characterise land use <strong>in</strong>ventory flows <strong>in</strong>to an<br />
<strong>in</strong>tegrated <strong>in</strong>dicator represent<strong>in</strong>g ecosystem services loss <strong>in</strong> mon<strong>et</strong>ary unit ($) (Figure 3). Please note that this<br />
assessment step assumes an equal weight<strong>in</strong>g among the different midpo<strong>in</strong>ts. Results show that potential<br />
impacts are specific to the types of ecosystem service, the location and the type of land cover. This latter<br />
affects <strong>in</strong>deed the physical midpo<strong>in</strong>t (e.g. <strong>in</strong>tensive harvest<strong>in</strong>g degrades more than regular harvest<strong>in</strong>g) and<br />
the type of ecosystem service damaged, while location affects them because of their spatial variability. While<br />
the physical midpo<strong>in</strong>t assesses the potential effects on ecosystem services, the converted midpo<strong>in</strong>t goes a<br />
step further, as it takes <strong>in</strong>to account the local and actual need of the ecosystem services. For example, ecosystem<br />
services related to water filtration prevales <strong>in</strong> Australia, because of both its local scarcity and relative<br />
important need.<br />
Figure 3. Graph of converted and aggregated land use CFs’ for different biopolymer production locations<br />
(mon<strong>et</strong>arisation normalisation, equal weight<strong>in</strong>g) for an agricultural land cover.<br />
4. Discussion<br />
The presented framework consists to estimate the direct benefits (e.g. use value) provided by the ecosystem<br />
services through compensation systems: what would be today’s ecosystem benefit lost by the use and<br />
degradation of the land. It therefore relies on the assumption/virtual situation that the conservative approach<br />
by local compensation is always possible and implemented. This estimated value does not capture more<br />
elaborate alternatives such as importation, substitution (of biotic products for example), migration (abandon<br />
of the ecosystem).<br />
As for us<strong>in</strong>g compensation of ecosystem services, it should be highlighted that only the cost of technological<br />
systems is assessed by this m<strong>et</strong>hodology, this is not consequential life cycle (impact) assessment to<br />
the extent that potential impact related to the compensation systems assessed are not taken <strong>in</strong>to account. The<br />
new area of protection represents <strong>in</strong>deed the ecosystem services loss, which can also be <strong>in</strong>terpr<strong>et</strong>ed as a<br />
(natural) cost to soci<strong>et</strong>y. Consequential <strong>LCA</strong> still depends on the study goal and scope. It rema<strong>in</strong>s the choice<br />
of the practitioner to <strong>in</strong>clude or not the compl<strong>et</strong>e <strong>in</strong>ventory of the compensation systems, so that all the different<br />
impacts on all the categories are assessed.<br />
The developed m<strong>et</strong>hodology uses <strong>in</strong>ternational coherent databases, also recognized to be regularly updated.<br />
This l<strong>et</strong>s some place to evolution and adjustment, as economic valuation of ecosystems is still <strong>in</strong> its<br />
early developments and that cost values change with time. An example is the social cost of carbon, which<br />
value highly depends on the chosen temporal perspective, itself related to the different perspectives def<strong>in</strong>ed<br />
<strong>in</strong> <strong>LCA</strong> (Hofst<strong>et</strong>ter, 1998). Moreover, this m<strong>et</strong>hodology can potentially be applied to future (if developed)<br />
midpo<strong>in</strong>ts <strong>in</strong>side, but also outside the land use impact category.<br />
5. Conclusion<br />
The development of the conversion factors allows to express all the midpo<strong>in</strong>ts proposed by the LULCIA<br />
approach to economic values, br<strong>in</strong>g<strong>in</strong>g a whole new level of <strong>in</strong>terpr<strong>et</strong>ation as natural ecosystem services loss.<br />
Their economic valuation may potentially allow future <strong>LCA</strong>s to assess other impacts related to land use, such<br />
as aesth<strong>et</strong>ics and recreational aspects (not assessed so far, even outside the <strong>LCA</strong>).<br />
136
PARALLEL SESSION 2A: LAND USE 8 th Int. Conference on <strong>LCA</strong> <strong>in</strong> the<br />
Agri-<strong>Food</strong> Sector, 1-4 Oct <strong>2012</strong><br />
Moreover, this work allows the aggregation several midpo<strong>in</strong>t <strong>in</strong>dicators <strong>in</strong>to a s<strong>in</strong>gle <strong>in</strong>dicator related to<br />
the area of protection ecosystem service loss, which facilitates decision-mak<strong>in</strong>g.<br />
6. References<br />
Ackerman, F., Stanton, E. A., 2010. The Social Cost of Carbon - A Report for the Economics for Equity and the Environment N<strong>et</strong>work.<br />
Stockholm Environment Institute, Stockholm.<br />
Brandão, M., Mila iCanals L., <strong>2012</strong>. Global characterisation factors to assess land use impacts on biotic production. The International<br />
Journal of Life Cycle Assessment. 1-10.<br />
Boulay, A.-M., Bouchard, C., Bulle, C., Deschênes, L., Margni, M., 2011. Categoriz<strong>in</strong>g water for <strong>LCA</strong><br />
<strong>in</strong>ventory. The International Journal of Life Cycle Assessment. 16, 639-651.<br />
de Baan, L., Alkemade, R., Koellner, T., <strong>2012</strong>. Land use impacts on biodiversity <strong>in</strong> <strong>LCA</strong>: a global approach. The International Journal<br />
of Life Cycle Assessment. 1-15.<br />
CDE, FAO, ISRIC, GEF, UNCCD, World Bank, 2011. World Overview of Conservation Approaches and Technologies (WOCAT).<br />
http://www.wocat.n<strong>et</strong>/en/knowledge-base.html. Accessed 30 July 2011.<br />
European Commission Jo<strong>in</strong>t Research Centre, 2010. Analysis of exist<strong>in</strong>g Environmental Impact Assessment m<strong>et</strong>hodologies for use <strong>in</strong><br />
<strong>LCA</strong>. Institute for Environment and Susta<strong>in</strong>ability, Luxembourg.<br />
FAO, <strong>2012</strong>. FAOSTAT. Accessed 15 July <strong>2012</strong>.<br />
Freeman, A.M., 2003. The Measurement of Environmental and Resource Values. Theory and M<strong>et</strong>hods, second ed. Resources for the<br />
Future Press, Wash<strong>in</strong>gton.<br />
Hofst<strong>et</strong>ter, P., 1998. Perspectives <strong>in</strong> life cycle impact assessment: a structured approach to comb<strong>in</strong>e models of the technosphere,<br />
ecosphere and valuesphere, ETH Zurich (Swiss Federal Institute of Technology).<br />
Holdridge, L.R., 1947. D<strong>et</strong>erm<strong>in</strong>ation of World Plant Formations From Simple Climatic Data. Science. 105, 367-368.<br />
Garrigues, E., Corson, M.S., Angers, D.A., van der Werf, H.M.G., Walter, C., <strong>2012</strong>. Soil quality <strong>in</strong> Life Cycle Assessment: Towards<br />
development of an <strong>in</strong>dicator. Ecological Indicators. 18, 434-442.<br />
IPCC, 2009. Agriculture, Forestry and Other Land Use. 2006 IPCC Guidel<strong>in</strong>es for National Greenhouse Gas Inventories. National<br />
Greenhouse Gas Inventories Programme & Institute for Global Environmental Strategies, <strong>in</strong>: The Intergovernmental Panel on<br />
Climate Change (IPCC), Hayama (Japan).<br />
Koellner, T., de Baan L., Beck, T., Brandão, M., Civit, B., Goedkoop, M., <strong>et</strong> al., <strong>2012</strong>. Pr<strong>in</strong>ciples for life cycle <strong>in</strong>ventories of land use<br />
on a global scale. The International Journal of Life Cycle Assessment. 1-13. Accessed 30 April <strong>2012</strong>.<br />
LULCIA, 2008-<strong>2012</strong>. Operational Characterization Factors for Land use Impacts on Biodiversity and Ecosystem Services <strong>in</strong> the<br />
Life-Cycle Impact Assessment. http://www.pes.uni-bayreuth.de/en/research/projects/LULCIA/<br />
Mila iCanals L.M., Bauer, C., Depestele, J., Dubreuil, A., Knuchel, R.F., Gaillard, G., <strong>et</strong> al., 2007. Key elements <strong>in</strong> a framework for<br />
land use impact assessment with<strong>in</strong> <strong>LCA</strong>. The International Journal of Life Cycle Assessment. 12, 5-15.<br />
Millennium Ecosystem Assessment, 2005. Our Human Plan<strong>et</strong>, Island Press, Wash<strong>in</strong>gton.<br />
Müller-Wenk R., Brandão M., 2010. Climatic impact of land use <strong>in</strong> <strong>LCA</strong>—carbon transfers b<strong>et</strong>ween veg<strong>et</strong>ation/soil and air. The<br />
International Journal of Life Cycle Assessment. 15, 172-82.<br />
National Research Council, 2004. Valu<strong>in</strong>g Ecosystem Services: Toward B<strong>et</strong>ter Environmental Decision-Mak<strong>in</strong>g, National Academy<br />
Press, Wash<strong>in</strong>gton.<br />
Olson, D. M., D<strong>in</strong>erste<strong>in</strong>, E., Wikramanayake, E.D., Burgess, N.D., Powell, G.V.N., Underwood, E.C., <strong>et</strong> al., 2001. Terrestrial Ecoregions<br />
of the World: A New Map of Life on Earth. BioScience. 51, 933-938.<br />
Saad, R., Margni, M., Koellner, T., Wittstock, B., Deschênes, L., 2011. Assessment of land use impacts on soil ecological functions:<br />
development of spatially differentiated characterization factors with<strong>in</strong> a Canadian context. The International Journal of Life Cycle<br />
Assessment. 16(3), 198-211.<br />
UNESCO, 2009. Water <strong>in</strong> a chang<strong>in</strong>g World. United Nations World Water Development Report, UNESCO, Paris.<br />
US EPA, 1999. Water Treatment Estimation Rout<strong>in</strong>e (WaTER).<br />
www.usbr.gov/pmts/water/media/spreadshe<strong>et</strong>s/WaTER.xls. Accessed 15 August 2011.<br />
137
PARALLEL SESSION 2A: LAND USE 8 th Int. Conference on <strong>LCA</strong> <strong>in</strong> the<br />
Agri-<strong>Food</strong> Sector, 1-4 Oct <strong>2012</strong><br />
138<br />
Land requirements for food <strong>in</strong> the N<strong>et</strong>herlands, a historical analysis<br />
over 200 years<br />
Sander<strong>in</strong>e Nonhebel 1,* , Jan Hessels Miedema 1 , Thomas Kastner 2<br />
1 Centre for Energy and Environmental Sciences, University of Gron<strong>in</strong>gen. Gron<strong>in</strong>gen, The N<strong>et</strong>herlands<br />
2 Institute for Social Ecology, Alpen Adria University, Vienna, Austria.<br />
Correspond<strong>in</strong>g author E-mail: S.Nonhebel@rug.nl<br />
ABSTRACT<br />
The production of food puts a large claim on land. The land required for food depends on the menu and on the agricultural production<br />
(yields per hectare). Both factors change over time. We comb<strong>in</strong>ed data on food consumption over 200 years <strong>in</strong> the N<strong>et</strong>herlands with<br />
data on agricultural yields over the same period and d<strong>et</strong>erm<strong>in</strong>ed a time series on land requirements for food.<br />
Large changes <strong>in</strong> the consumption patterns took place. In 1800 the largest share of the kcal <strong>in</strong> the food (90%) were obta<strong>in</strong>ed from<br />
milk, wheat, rye, buckwheat, barley and potatoes. 200 years later milk, wheat and potatoes only contributed for 40% to the menu, and<br />
pork, sugar and veg<strong>et</strong>able oils accounted for 40%. Crop yields went up with a factor 4-8. Comb<strong>in</strong>ation of both made that <strong>in</strong> 1800 1.4<br />
ha was needed to feed a person, while 200 years later only 0.2 hectare was needed.<br />
Keywords: food consumption patterns, crop yields, land use, time series<br />
1. Introduction<br />
The production of food puts a large claim on land. On a global scale 30% of the land is used for the production<br />
of food. Earlier research showed that large differences <strong>in</strong> land claim existed b<strong>et</strong>ween various food<br />
items and different menus required different land use. Luxurious menus with a lot of meat tend to require 5<br />
times as much land as the menus ma<strong>in</strong>ly based on staple food like rice and potatoes. (Gerbens-Leenes and<br />
Nonhebel, 2002). The change of menu is strongly related to economic development. With <strong>in</strong>creas<strong>in</strong>g welfare<br />
menus change from di<strong>et</strong>s ma<strong>in</strong>ly based on staples to di<strong>et</strong>s <strong>in</strong>clud<strong>in</strong>g animal products, veg<strong>et</strong>able oils, veg<strong>et</strong>ables<br />
and dr<strong>in</strong>ks.<br />
The land requirements for food are <strong>in</strong>versely related to crop yields, when yields double land requirements<br />
for food halve. Crop yields per hectare are affected by changes <strong>in</strong> technology like the use of higher yield<strong>in</strong>g<br />
crop vari<strong>et</strong>ies, application of (m<strong>in</strong>eral) fertilisers, use of biocides aga<strong>in</strong>st pests and diseases <strong>et</strong>c.<br />
Over the last 200 years large changes both <strong>in</strong> menu as <strong>in</strong> agricultural technology have taken place <strong>in</strong> the<br />
N<strong>et</strong>herlands. In this paper we study the overall effect of changes <strong>in</strong> menu and changes <strong>in</strong> production techniques<br />
on the land required for food <strong>in</strong> the N<strong>et</strong>herlands. This historical analysis provides knowledge on how<br />
the need for land can change over time, <strong>in</strong>sights can be of use when study<strong>in</strong>g future global food supply.<br />
2. M<strong>et</strong>hodology<br />
We constructed a historical database of food availability per person over 200 years us<strong>in</strong>g various sources.<br />
Next we collected yield data for most important food crops grown <strong>in</strong> the N<strong>et</strong>herlands. F<strong>in</strong>ally we comb<strong>in</strong>ed<br />
food availability data with the crop yields to d<strong>et</strong>erm<strong>in</strong>e the land required for food us<strong>in</strong>g the m<strong>et</strong>hodology<br />
developed by Kastner and Nonhebel (2010).<br />
2.1 <strong>Food</strong> consumption patterns<br />
Data on food availability were obta<strong>in</strong>ed from different sources, us<strong>in</strong>g different food categories and different<br />
units cover<strong>in</strong>g different timespans. All food units (kg, litres <strong>et</strong>c) were converted <strong>in</strong>to kcal, and food categories<br />
were adjusted (Miedema, 2011). Fig. 1 shows the result. Around the first (1914-1918) and second<br />
(1940-1945) world war a large decl<strong>in</strong>e <strong>in</strong> food availability is shown. It is likely that <strong>in</strong> these years the availability<br />
of food deviated from the non-war years, but dur<strong>in</strong>g wars the collection of statistical data is <strong>in</strong> general<br />
not the first priority of a government, so the quality of the collection of the data can also be a reason for deviation.<br />
The total food availability <strong>in</strong>creased <strong>in</strong> 200 years from 2500 kcal per person per day to over 3200 kcal.<br />
Next to this, changes <strong>in</strong> the pattern are obvious: around 1800 over 40% of the food orig<strong>in</strong>ated from livestock<br />
(with dairy contribut<strong>in</strong>g virtually the whole share), this drops to 20% <strong>in</strong> 1900 and <strong>in</strong>creases aga<strong>in</strong> to 35% <strong>in</strong><br />
2000 (Figure 1). In 1800, rye and barley were the cereals most consumed, while <strong>in</strong> 2000 wheat was the most<br />
important cereal. While the consumption of relevant quantities of sugar only started around 1880, <strong>in</strong> 2000<br />
15% of the calories <strong>in</strong> the menu were obta<strong>in</strong>ed from sugar. Further from 1950 onwards animal fats <strong>in</strong> the<br />
di<strong>et</strong>s were replaced by oils from the oilseeds.
PARALLEL SESSION 2A: LAND USE 8 th Int. Conference on <strong>LCA</strong> <strong>in</strong> the<br />
Agri-<strong>Food</strong> Sector, 1-4 Oct <strong>2012</strong><br />
Figure 1 <strong>Food</strong> availability <strong>in</strong> the N<strong>et</strong>herlands (kcal per person per day) from 1800 onwards (source: Knibbe<br />
2007; Miedema 2011).<br />
2.2 Changes <strong>in</strong> technology (yields)<br />
For the major food crops used <strong>in</strong> The N<strong>et</strong>herlands yield data were available for 1855 to 2010. Fig. 2<br />
shows the results. Large differences <strong>in</strong> yield improvements exist: the yield of rapeseed doubled <strong>in</strong> 150 years,<br />
while the yield of wheat <strong>in</strong>creased 5 times. Buckwheat disappeared from the agricultural system <strong>in</strong> the N<strong>et</strong>herlands,<br />
only up to 1940 yield data were available. B<strong>et</strong>ween 1855 and 1900 not much change <strong>in</strong> yield was<br />
observed. We assumed that <strong>in</strong> the years before (1800-1855) the yields were also constant. The <strong>in</strong>crease <strong>in</strong><br />
yields after the Second World War is due to the <strong>in</strong>creased use of fertilisers <strong>in</strong> The N<strong>et</strong>herlands: this <strong>in</strong>creased<br />
6 times from 100 mln kg to 600 mln kg.<br />
For the production of milk grass is required. Yields for grasslands are very difficult to obta<strong>in</strong>, s<strong>in</strong>ce grass<br />
is not harvested and weighted, but cows consume it directly <strong>in</strong> the fields. Presently yields of grass are <strong>in</strong> the<br />
order of 10 t/ha (Aarts <strong>et</strong> al., 2005). These yields imply fertilised grasslands. We assumed the development <strong>in</strong><br />
yields of grasslands followed the same pattern as wheat. This implies that grassland yields were around 1<br />
t/ha <strong>in</strong> the n<strong>in</strong><strong>et</strong>eenth century Crop yields' and <strong>in</strong>creased development rapidly (1850-2000) after the second world war.<br />
5<br />
3<br />
1<br />
Potatoes<br />
Wheat<br />
Figure 2. Relative developments <strong>in</strong> crop yields <strong>in</strong> the N<strong>et</strong>herlands <strong>in</strong> the last 150 year (sources: Smits and<br />
van der Bie, 2003, Sneller 1943.)<br />
Rye<br />
Sugarbe<strong>et</strong>s<br />
1850 1900 1950 2000<br />
Barley<br />
Rapeseed<br />
139
PARALLEL SESSION 2A: LAND USE 8 th Int. Conference on <strong>LCA</strong> <strong>in</strong> the<br />
Agri-<strong>Food</strong> Sector, 1-4 Oct <strong>2012</strong><br />
2.3 Conversion from kcal <strong>in</strong>to area<br />
To d<strong>et</strong>erm<strong>in</strong>e the land required for food, the food units (kg or litres) have to be converted <strong>in</strong>to area of<br />
land. In pr<strong>in</strong>ciple this is done us<strong>in</strong>g the yields. Higher yields imply lower land requirements. Some of the<br />
food products like sugar and veg<strong>et</strong>able oils <strong>et</strong>c. are processed agricultural crops for these products a conversion<br />
factor is <strong>in</strong>troduced identify<strong>in</strong>g how much sugar be<strong>et</strong> is required for the production of 1 kg of sugar. The<br />
appendix shows the conversion factors used.<br />
In this analysis we assumed that conversion factors rema<strong>in</strong>ed constant over the timespan studied. This is<br />
not the case <strong>in</strong> the actual situation. However, <strong>in</strong> this study we are <strong>in</strong>terested <strong>in</strong> the <strong>in</strong>terplay b<strong>et</strong>ween changes<br />
<strong>in</strong> consumption and changes <strong>in</strong> agricultural production. When we would also <strong>in</strong>troduce changes <strong>in</strong> conversion<br />
techniques the overall picture becomes very complicated and too difficult to analyse. With respect to<br />
animal products we applied the same m<strong>et</strong>hodology. We assumed that an animal product is the result from a<br />
conversion of an agricultural product (wheat <strong>in</strong>to eggs, grass <strong>in</strong>to milk).<br />
3 Results<br />
Fig. 3 shows the land requirements for food per person <strong>in</strong> the N<strong>et</strong>herlands over the last 200 years as calculated<br />
with the m<strong>et</strong>hodology described above. In 1800 about 1.4 hectare per person was needed for the production<br />
of food, two thirds of this was for the production of dairy. In the follow<strong>in</strong>g two centuries, the area<br />
needed decl<strong>in</strong>ed fast to 0.15 ha per person <strong>in</strong> 2000 (Figure 3). From 1800 to 1900 the decl<strong>in</strong>e was caused by<br />
the reduced consumption of animal products, from 1900 onwards the consumption of animal orig<strong>in</strong> products<br />
<strong>in</strong>creased aga<strong>in</strong> but due to use of m<strong>in</strong>eral fertilisers the production per hectare <strong>in</strong>creased, lead<strong>in</strong>g to overall<br />
decl<strong>in</strong>e of the land required for food per person.<br />
Land requirements (ha/cap)<br />
1.6<br />
1.4<br />
1.2<br />
1.0<br />
0.8<br />
0.6<br />
0.4<br />
0.2<br />
0.0<br />
Development of per capita land requirements <strong>in</strong> the N<strong>et</strong>herlands<br />
1800 1810 1820 1830 1840 1850 1860 1870 1880 1890 1900 1910 1920 1930 1940 1950 1960 1970 1980 1990 2000<br />
Time (years)<br />
Meat Other animal products Cereals<br />
Sugar Veg<strong>et</strong>al oils and oilcrops Fruits and veg<strong>et</strong>ables<br />
Potatoes Beverages<br />
Figure 3 Development of the per capita land requirements <strong>in</strong> the N<strong>et</strong>herlands and the distribution over various<br />
consumption categories.<br />
4 Discussion<br />
The analysis <strong>in</strong> this paper uses statistical data over 200 years. The quality of the data used cannot be expected<br />
to be constant. Crop yield data from 200 years ago are collected <strong>in</strong> a different way than present data,<br />
the same holds for the data on food availability. In this analysis we assume that all the food was produced <strong>in</strong><br />
the N<strong>et</strong>herlands, <strong>in</strong> the actual situation a part of the food is imported from somewhere else where other yields<br />
are obta<strong>in</strong>ed. And f<strong>in</strong>ally we assume that the conversion factors rema<strong>in</strong> constant over time, which is actually<br />
not the case s<strong>in</strong>ce technological improvements make that presently more oil/sugar <strong>et</strong>c can be obta<strong>in</strong>ed from a<br />
crop than 200 years ago.<br />
140
PARALLEL SESSION 2A: LAND USE 8 th Int. Conference on <strong>LCA</strong> <strong>in</strong> the<br />
Agri-<strong>Food</strong> Sector, 1-4 Oct <strong>2012</strong><br />
This implies that the results presented should not be <strong>in</strong>terpr<strong>et</strong>ed on face value. We did not calculate the<br />
actual land required for food <strong>in</strong> 1800. For the d<strong>et</strong>erm<strong>in</strong>ation of that value we should have <strong>in</strong>cluded imports,<br />
technological improvements <strong>et</strong>c and we should have had <strong>in</strong>sights <strong>in</strong> the reliability of the data. The value of<br />
the analysis presented here is <strong>in</strong> the developments over time and the <strong>in</strong>terrelation <strong>in</strong> food consumption patterns<br />
and agricultural production.<br />
This analysis provides some <strong>in</strong>terest<strong>in</strong>g <strong>in</strong>sights. In the first place it is strik<strong>in</strong>g that 200 years ago dairy<br />
played such a vital role <strong>in</strong> the Dutch consumption pattern. This is <strong>in</strong> contrast with the patterns observed on a<br />
global scale: namely that the consumption of animal orig<strong>in</strong> products only starts when a certa<strong>in</strong> level of welfare<br />
is reached. The large consumption of milk <strong>in</strong> the early 19th century is also mentioned <strong>in</strong> more qualitative<br />
food consumption studies (Jobse-van Putten, 1995) they mention that Dutch households consumed a milk<br />
based meal (ma<strong>in</strong>ly porridge) 14 times a week (so 2 times a day!).<br />
With respect to the production: the crop yields rema<strong>in</strong>ed more or less constant <strong>in</strong> the 19th century and after<br />
the second world war huge yield improvements were obta<strong>in</strong>ed. Crop yields went up with a factor 4-8. But<br />
differences b<strong>et</strong>ween crops were recognised. Some crops disappeared from the agricultural system like buckwheat<br />
and others became of m<strong>in</strong>or importance (rye).<br />
The consequence of all these changes is a fast decl<strong>in</strong>e of land required for food per person from 1.4 to 0.2<br />
ha per person. This value is <strong>in</strong> accordance with other studies on land requirements for food <strong>in</strong> the N<strong>et</strong>herlands<br />
(Gerbens-Leenes <strong>et</strong> al., 2002; Gerbens-Leenes and Nonhebel, 2002). They d<strong>et</strong>erm<strong>in</strong>ed the land required<br />
for food <strong>in</strong> The N<strong>et</strong>herlands <strong>in</strong> 1990, <strong>in</strong> a far more d<strong>et</strong>ailed way: <strong>in</strong>clud<strong>in</strong>g imports, present day technologies,<br />
far more d<strong>et</strong>ailed <strong>in</strong>formation on the consumption pattern <strong>et</strong>c.<br />
In the studied period land requirements for food per person was reduced by a factor of 8. However, <strong>in</strong> the<br />
same timespan the population <strong>in</strong>creased from 2 to 17 million people, so the total amount of land needed to<br />
feed the Dutch population rema<strong>in</strong>ed actually constant.<br />
In a recent study on global changes <strong>in</strong> land requirements for food <strong>in</strong> the last 50 years, this decl<strong>in</strong>e <strong>in</strong> land<br />
per person is found <strong>in</strong> most regions <strong>in</strong> the world (Kastner <strong>et</strong> al., <strong>2012</strong>). The magnitude of the decl<strong>in</strong>e is<br />
smaller than calculated here. For a part this can be expla<strong>in</strong>ed by the high crop yields that are obta<strong>in</strong>ed <strong>in</strong> the<br />
<strong>in</strong>tensive Dutch agricultural system. The yields <strong>in</strong> the N<strong>et</strong>herlands tend to be the highest <strong>in</strong> the world; with<br />
the same menu the land requirements are smallest. Another important feature is the high animal product<br />
consumption <strong>in</strong> the N<strong>et</strong>herlands 200 years ago. The land requirements for meat are d<strong>et</strong>erm<strong>in</strong>ed by the yields<br />
of the crops used for feed. Roughly 4 kg of feed are required for 1 kg of meat. A menu ma<strong>in</strong>ly based on staple<br />
foods requires less land than a menu with meat. For the Dutch situation we observe a decl<strong>in</strong>e <strong>in</strong> the consumption<br />
of animal products over the time studied, <strong>in</strong> comb<strong>in</strong>ation with the <strong>in</strong>creased yields this leads to the<br />
huge decl<strong>in</strong>e <strong>in</strong> land required for food. This decl<strong>in</strong>e is typical for the Dutch situation and cannot be generalised<br />
to the rest of the world.<br />
5 Conclusions<br />
In 200 years large changes <strong>in</strong> the Dutch consumption patterns can be recognized. The share of dairy, rye<br />
and buckwheat decl<strong>in</strong>ed and the share of wheat, meat, sugar and veg<strong>et</strong>able oils <strong>in</strong>creased. The agricultural<br />
production system also changed a lot: after the Second World War an <strong>in</strong>crease of the productivity with a<br />
factor 4 was obta<strong>in</strong>ed. The comb<strong>in</strong>ation of the change <strong>in</strong> di<strong>et</strong>s and the change <strong>in</strong> agricultural productivity led<br />
to a reduction of the land required to feed a person from 1.4 ha <strong>in</strong> 1800 to 0.2 ha <strong>in</strong> 2000.<br />
6 References<br />
Aarts, H. F. M., Daatselaar, C. H. G., Holshof, G., 2005. Bemest<strong>in</strong>g en opbrengst van productiegrasland <strong>in</strong> Nederland. Plant Research<br />
International B.V. Wagen<strong>in</strong>gen.<br />
Gerbens-Leenes, P.W., Nonhebel, S., 2002. Consumption patterns and their effects on land required for food. Ecological Economics<br />
42, 185–199.<br />
Gerbens-Leenes, P.W., Nonhebel, S., Ivens, W.P.M.F., 2002. A m<strong>et</strong>hod to d<strong>et</strong>erm<strong>in</strong>e land requirements relat<strong>in</strong>g to food consumption<br />
patterns. Agriculture, Ecosystems & Environment 90, 47–58.<br />
Jobse-van Putten, J., 1995. Eenvoudig maar voedzaam: cultuurgeschiedenis van de dagelijkse maaltijd <strong>in</strong> Nederland. Nijmegen:<br />
SUN.<br />
Kastner, T., & Nonhebel, S., 2010. Changes <strong>in</strong> land requirements for food <strong>in</strong> the Philipp<strong>in</strong>es: A historical analysis. Land Use Policy<br />
27, 853-863<br />
Kastner, T., Ibarrola Rivas, M.J., Koch, W., Nonhebel, S., <strong>2012</strong>. Global changes <strong>in</strong> di<strong>et</strong>s and the consequences for land requirements<br />
for food. Proc. Natl. Acad. Sci. USA 109, 6868-6872<br />
Knibbe, M. T., 2007. De hoofdelijke beschikbaarheid van voedsel en de levensstandaard <strong>in</strong> Nederland 1807 – 1913. Tijdschrift voor<br />
sociale en economische geschiedenis, 4, 71-107.<br />
Miedema, H.J., 2011. Developments <strong>in</strong> the Dutch di<strong>et</strong>s: dynamics on two centuries of land requirements for food <strong>in</strong> the N<strong>et</strong>herlands.<br />
Master Thesis, University of Gron<strong>in</strong>gen. EES 2011-125T.<br />
141
PARALLEL SESSION 2A: LAND USE 8 th Int. Conference on <strong>LCA</strong> <strong>in</strong> the<br />
Agri-<strong>Food</strong> Sector, 1-4 Oct <strong>2012</strong><br />
Smits, J. P., & van der Bie R. J., 2003. Tweehonderd jaar statistiek <strong>in</strong> tijdreeksen 1800–1999. Voorburg / Heerlen: Centraal Bureau<br />
voor de Statistiek.<br />
Sneller, Z. W., 1943. Geschiedenis van den Nederlandschen landbouw 1795 – 1940. Gron<strong>in</strong>gen: J.B. Wolters Uitgevers-<br />
Maatschappij N.V.<br />
7 Appendix<br />
Conversion factors used (source: Miedema, 2011)<br />
142<br />
<strong>Food</strong> products and calorific value<br />
Wheat<br />
Rye<br />
Barley<br />
Buckwheat<br />
Potatoes<br />
Rice<br />
Rais<strong>in</strong>s<br />
Fruits and veg<strong>et</strong>ables<br />
Milk<br />
Milk exclud<strong>in</strong>g butter<br />
Butter<br />
Veg<strong>et</strong>able oils<br />
Margar<strong>in</strong>e<br />
Di<strong>et</strong>-margar<strong>in</strong>e<br />
Beef<br />
Pork<br />
Poultry<br />
Eggs<br />
Fish<br />
Sugar<br />
W<strong>in</strong>e<br />
Beer<br />
Distilled<br />
Coffee<br />
Tea<br />
kcal/kg<br />
3340<br />
3190<br />
3320<br />
3300<br />
670<br />
3600<br />
400<br />
200<br />
620<br />
620<br />
7170<br />
8840<br />
7200<br />
3630<br />
2250<br />
2360<br />
1220<br />
1480<br />
1050<br />
4000<br />
750<br />
400<br />
1980<br />
560<br />
400<br />
Primary products and calorific value<br />
Wheat<br />
Rye<br />
Barley<br />
Buckwheat<br />
Potatoes<br />
Rice<br />
Grapes<br />
Fruits and veg<strong>et</strong>ables<br />
Milk<br />
Milk<br />
Milk<br />
Rapeseed<br />
Rapeseed<br />
Rapeseed<br />
Wheat<br />
Wheat<br />
Wheat<br />
Wheat<br />
Wheat<br />
Sugarbe<strong>et</strong>s<br />
Grapes<br />
Barley<br />
Barley<br />
Coffee<br />
Tea<br />
kcal/kg<br />
3340<br />
3190<br />
3320<br />
3300<br />
670<br />
3600<br />
530<br />
200<br />
620<br />
620<br />
620<br />
4940<br />
4940<br />
4940<br />
3340<br />
3340<br />
3340<br />
3340<br />
3340<br />
700<br />
530<br />
3320<br />
3320<br />
560<br />
400<br />
Conversion factor<br />
Calorific value food<br />
product / Calorific<br />
value primary<br />
product<br />
1.00<br />
1.00<br />
1.00<br />
1.00<br />
1.00<br />
1.00<br />
0.75<br />
1.00<br />
1.00<br />
1.00<br />
11.56<br />
1.79<br />
1.46<br />
0.73<br />
4.00<br />
4.00<br />
3.00<br />
1.25<br />
1.00<br />
5.71<br />
1.42<br />
0.12<br />
0.60<br />
1.00<br />
1.00
PARALLEL SESSION 2A: LAND USE 8 th Int. Conference on <strong>LCA</strong> <strong>in</strong> the<br />
Agri-<strong>Food</strong> Sector, 1-4 Oct <strong>2012</strong><br />
Organic farm<strong>in</strong>g without fossil fuels – <strong>LCA</strong> of energy self-sufficiency<br />
Cecilia Sundberg 1,* , Marie Kimm<strong>in</strong>g 1 , Åke Nordberg 1,2 , Andras Baky 2 , Per-Anders Hansson 1<br />
1 Department of Energy and Technology, Swedish University of Agricultural Sciences<br />
2 JTI – Swedish Institute for Agricultural and Environmental Eng<strong>in</strong>eer<strong>in</strong>g<br />
Correspond<strong>in</strong>g author. E-mail: cecilia.sundberg@slu.se<br />
ABSTRACT<br />
One pr<strong>in</strong>ciple of organic farm<strong>in</strong>g is the use of renewable resources, y<strong>et</strong> it depends on fossil energy. Systems for supply<strong>in</strong>g organic<br />
agriculture – one arable farm and a system for milk production - with heat, power and fuel generated from biomass produced on its<br />
own land, and the consequences of such production were <strong>in</strong>vestigated. Biomass energy systems <strong>in</strong>cluded power, heat and <strong>et</strong>hanol<br />
from straw and biogas generat<strong>in</strong>g power, heat and fuel from ley, manure and straw. For the arable farm, straw or ley from the crop<br />
rotation was sufficient for energy supply for farm activities. For milk production, biogas from manure could supply about two thirds<br />
of the energy demand of the farm and there was straw to supply the rema<strong>in</strong>der. GHG emissions were reduced <strong>in</strong> all scenarios compared<br />
to the fossil reference. The GHG results were sensitive to assumptions on soil carbon <strong>in</strong>itial content and turnover.<br />
Keywords: biogas, biomass, CHP, renewable energy, straw<br />
1. Introduction<br />
Even though organic farms aim to lower the environmental impact from food production and rely ma<strong>in</strong>ly<br />
on renewable, locally available resources, they still depend on fossil fuels for energy supply to production<br />
processes. Organic farms could <strong>in</strong>crease their credibility as a susta<strong>in</strong>able alternative if renewable resources<br />
were used for produc<strong>in</strong>g energy for the farm. The agricultural sector is also considered to have the largest<br />
potential to contribute to a higher share of renewable energy <strong>in</strong> the EU (EEA 2006).<br />
The technical development of systems for energy generation based on biomass has progressed rapidly<br />
over the last few years and the number of small-scale applications suitable for farm use has <strong>in</strong>creased. Dairy<br />
farms have access to readily available manure which can be used for biogas production. Biogas can be used<br />
for heat and power production or is upgraded to vehicle fuel. Hydrolysis of cellulosic substrates is the next<br />
generation of <strong>et</strong>hanol production, projected to replace the much debated production of <strong>et</strong>hanol from food<br />
crops such as sugar or starch products.<br />
This paper summarizes the f<strong>in</strong>d<strong>in</strong>gs our research on how to supply organic agriculture with energy produced<br />
on its own land, and the environmental consequences of such production. The purpose of this study<br />
was to assess the self-sufficiency potential, greenhouse gas emissions and energy balance of crop production<br />
(described <strong>in</strong> d<strong>et</strong>ail <strong>in</strong> Kimm<strong>in</strong>g <strong>et</strong> al., 2011) and milk production (Kimm<strong>in</strong>g <strong>et</strong> al., <strong>2012</strong>) <strong>in</strong> a renewable<br />
energy supply systems ma<strong>in</strong>ly based on bioenergy, compared with systems based on fossil fuels.<br />
2. M<strong>et</strong>hod and scenario description<br />
2.1. <strong>LCA</strong> approach and functional unit<br />
S<strong>in</strong>ce the goal was to <strong>in</strong>vestigate the impact of chang<strong>in</strong>g to a new energy supply system, consequential<br />
<strong>LCA</strong> was used for these studies. The substitution m<strong>et</strong>hod was used to avoid allocation.<br />
The functional unit (FU) used was 1 kg ECM (energy-corrected milk) at the farm-gate for the milk study.<br />
For the arable farm, the FU was the total supply of energy (heat, electricity and vehicle fuel for the 200 ha<br />
organic farm for 1 year. The impact categories were energy balance and global warm<strong>in</strong>g potential<br />
(GWP100).<br />
2.2. Agricultural production systems<br />
The milk farm was assumed to have 100 dairy cows, with an average of 84 animals be<strong>in</strong>g milked every<br />
day. Data on milk production are presented <strong>in</strong> Table 1. The farm was assumed self-sufficient <strong>in</strong> organically<br />
produced forage (Table 2).<br />
143
PARALLEL SESSION 2A: LAND USE 8 th Int. Conference on <strong>LCA</strong> <strong>in</strong> the<br />
Agri-<strong>Food</strong> Sector, 1-4 Oct <strong>2012</strong><br />
Table 1. Input data to milk study<br />
Factor Value<br />
Milk production per cow 8000 kg ECM per year<br />
Replacement rateText 25%<br />
Meat produced per kg ECM 0.0057 kg<br />
Rapeseed oil produced per kg ECM 0.028 kg<br />
GHG emissions for substituted meat production 22 kg CO2-eq.<br />
GHG emissions for substituted rapeseed oil production 0.8 kg CO2-eq.<br />
Table 2. Feed production<br />
Product Yield a (kg/ha yr) Area (ha)<br />
Ley 4230 120<br />
Graz<strong>in</strong>g 4000 70<br />
Spr<strong>in</strong>g barley 2440 54<br />
W<strong>in</strong>ter wheat 3228 40<br />
Broad beans 2026 54<br />
Rapeseed cake 1693 40<br />
a a<br />
Yields for barley and wheat are given at 86% dry matter content (DM), rapeseed 91% and broad beans 85% DM. Ley yield is <strong>in</strong><br />
total solids (TS), with losses dur<strong>in</strong>g harvest and ensil<strong>in</strong>g subtracted<br />
The 200 ha arable farm had a 7-year crop rotation (Table 3) that <strong>in</strong>cluded ley twice, to be used as green<br />
manure (field beans, oats, ley, w<strong>in</strong>ter rapeseed, w<strong>in</strong>ter wheat, ley, rye). In the reference scenario, ley and<br />
straw were ploughed back <strong>in</strong>to the soil.<br />
Table 3. Arable crop rotation<br />
Crop Yield a (kg/ha yr)<br />
Field beans 2400<br />
Oats 3200<br />
Ley 6000<br />
W<strong>in</strong>ter rapeseed 2000<br />
W<strong>in</strong>ter wheat 3500<br />
Ley 6000<br />
Rye<br />
a<br />
Crops dried to 86% DM except ley, which is <strong>in</strong> kg DM<br />
3200<br />
2.3 System boundaries<br />
An overview of the production systems with energy self-supply is shown <strong>in</strong> Figure 1. The system boundary<br />
was s<strong>et</strong> at the farm-gate for products produced on the farm (exception: biomass which is transported to<br />
fuel production facilities and back is <strong>in</strong>cluded). Feedstock for energy carrier production is forwarded to conversion<br />
facilities (“Conversion processes”-box <strong>in</strong> Figure 1). Residual products from the conversion processes,<br />
such as ashes and digestion residues, were assumed to be r<strong>et</strong>urned to the fields as fertilisers. Byproducts<br />
from the conversion processes were accounted for (“Substituted production”-box <strong>in</strong> Figure 1). The<br />
system was compared with a reference system, <strong>in</strong> which the milk production process was supplied with energy<br />
produced with fossil fuels. M<strong>in</strong><strong>in</strong>g, extraction, ref<strong>in</strong><strong>in</strong>g, distribution and consumption of the fossil fuels<br />
were <strong>in</strong>cluded.<br />
2.4 Energy demand<br />
The annual energy demand for the milk farm was 300 GJ electricity (0.14 MJ/kg milk), 115 GJ for gra<strong>in</strong><br />
dry<strong>in</strong>g and 95 GJ for hat<strong>in</strong>g of build<strong>in</strong>gs. Annual tractor fuel demand was 460 GJ.<br />
In the arable farm, heat was supplied to the residential build<strong>in</strong>g (dimensioned capacity 7.4 kW) the hot<br />
water system (1.2 kW), the workshop (1.7 kW) and the gra<strong>in</strong> dryer (227 kW). The total annual tractor fuel<br />
demand was 414 GJ, electricity demand was 51 GJ and heat demand 290 GJ.<br />
144
PARALLEL SESSION 2A: LAND USE 8 th Int. Conference on <strong>LCA</strong> <strong>in</strong> the<br />
Agri-<strong>Food</strong> Sector, 1-4 Oct <strong>2012</strong><br />
Milk or<br />
Cash crops<br />
Figure 1. Schematic figure of the energy and material flows on the arable and milk farms respectively. Substituted<br />
production refers to the impact on the external mark<strong>et</strong> of reduced or <strong>in</strong>creased supply of goods from<br />
the farm to the respective mark<strong>et</strong>. LBG = liquid biogas.<br />
2.5 Renewable energy supply systems<br />
Manure/straw/rapeseed/ley<br />
Electricity/LBG/CO 2<br />
In the milk production system biogas from manure was the ma<strong>in</strong> energy supply <strong>in</strong> all scenarios. In Scenario<br />
M1, biogas produced from manure and cut straw was assumed to cover the entire energy demand. A<br />
fraction of the gas was fed to a comb<strong>in</strong>ed heat and power (CHP) system (gas eng<strong>in</strong>e) with electric output 14<br />
kW. The rest was pumped via low pressure pipel<strong>in</strong>es to a cryogenic upgrad<strong>in</strong>g facility for liquid biogas<br />
(LBG) production. LBG was assumed to be delivered <strong>in</strong> trucks to the farm, where it was pumped to the tractors<br />
via a pump<strong>in</strong>g station <strong>in</strong> which the LBG first vaporized.<br />
In Scenario M2a, the manure on the farm was utilised to produce biogas, assumed to be combusted <strong>in</strong> a<br />
CHP system (gas eng<strong>in</strong>e) with electric output 13 kW. The rapeseed oil was assumed to be used to produce<br />
rapeseed m<strong>et</strong>hyl ester (RME) <strong>in</strong> a small-scale production unit at the farm. The tractors ran on RME with<br />
m<strong>in</strong>or modification of the orig<strong>in</strong>al diesel eng<strong>in</strong>es, such as replac<strong>in</strong>g components with others of more resistant<br />
materials (Ahlgren <strong>et</strong> al., 2010).<br />
In Scenario M2b, RME was assumed to be produced <strong>in</strong> the same way as <strong>in</strong> Scenario 2a, but used <strong>in</strong> a<br />
combustion eng<strong>in</strong>e for CHP production, with electric output 13 kW. Tractors are assumed to run on biogas<br />
from manure, from which LBG is produced <strong>in</strong> an external production facility as <strong>in</strong> Scenario 1.<br />
In Scenario M3, it was assumed that a w<strong>in</strong>d turb<strong>in</strong>e, owned by a farm cluster, supplies electricity and heat<br />
to the farm (via heat pumps). Required capacity is 70 kW, embedded <strong>in</strong> a larger w<strong>in</strong>d tower. Tractors run on<br />
LBG produced from manure, upgraded to LBG as <strong>in</strong> Scenario 1 and 2b.<br />
The CHP systems <strong>in</strong> scenario M1, M2a and M2b were dimensioned to work on full load 95% of the time.<br />
The heat produced was used to heat build<strong>in</strong>gs on the farm and for the anaerobic digestion process.<br />
Gra<strong>in</strong> produced on the farm was assumed to be dried <strong>in</strong> a straw-fuelled furnace <strong>in</strong> all M-scenarios (capacity<br />
232 kW). Total energy consumption was 115 GJ which came from approximately 4 ha of wheat straw.<br />
The biogas production took place under anaerobic conditions at mesophilic temperature, <strong>in</strong> a one-stage<br />
anaerobic digester of 250 m<br />
145<br />
3 <strong>in</strong> Scenario M1 and 150 m 3 <strong>in</strong> Scenario M2 and M3. The raw biogas was assumed<br />
to be upgraded to vehicle fuel quality <strong>in</strong> a large-scale cryogenic upgrad<strong>in</strong>g plant separat<strong>in</strong>g off m<strong>et</strong>hane<br />
(CH4), carbon dioxide (CO2), water vapor and impurities at their different condens<strong>in</strong>g temperatures (Johansson<br />
2008). The process requires 1.62 MJ electricity/Nm 3 and the m<strong>et</strong>hane losses <strong>in</strong> exist<strong>in</strong>g facilities are<br />
0.5%. Here, the plant was assumed to be located 50 km from the farm and LBG was delivered back to the<br />
farm <strong>in</strong> vacuum-<strong>in</strong>sulated trucks.<br />
The biogas production <strong>in</strong> each scenario was dimensioned based on the availability of substrate and not on<br />
the demand for energy on the farm, as this was considered the most feasible solution. This might result <strong>in</strong><br />
overproduction of LBG and electricity. Surplus LBG was assumed to be sold and replace use of diesel. Surplus<br />
electricity was assumed to be sold to the mark<strong>et</strong> and electricity produced <strong>in</strong> natural gas-fired condens<strong>in</strong>g<br />
plants.<br />
In the arable system, one scenario (A1) was based on biogas from ley. Assumptions were largely the same<br />
as <strong>in</strong> the milk system. The upgrad<strong>in</strong>g process produces liquid CO2 (LCO2) as a by-product, which can be sold<br />
as a refrigerant. In this case, it was assumed that the LCO2 replaced the HFC type R404a as a refrigerant <strong>in</strong><br />
grocery shops. However, this mark<strong>et</strong> is currently rather undeveloped and therefore only 1% of the LCO2 was
PARALLEL SESSION 2A: LAND USE 8 th Int. Conference on <strong>LCA</strong> <strong>in</strong> the<br />
Agri-<strong>Food</strong> Sector, 1-4 Oct <strong>2012</strong><br />
assumed to be sold and the rest used as coolant <strong>in</strong> the upgrad<strong>in</strong>g process (Johansson, 2008). Biogas was used<br />
also for the gra<strong>in</strong> dryer.<br />
Scenario A2 was based on straw, which was converted to <strong>et</strong>hanol via hydrothermal pr<strong>et</strong>reatment, to enzymatic<br />
hydrolysis and fermentation. The lign<strong>in</strong> is separated out dur<strong>in</strong>g hydrolysis and was assumed to be<br />
used <strong>in</strong> an <strong>in</strong>tegrated CHP plant for production of process steam and electricity, as well as surplus electricity<br />
to cover the power demand of the farm (51 GJ). The plant was assumed to be a s<strong>in</strong>gle pressure comb<strong>in</strong>ed<br />
cycle gas turb<strong>in</strong>e (CCGT) and the flue gases recovered <strong>in</strong> a heat recovery steam generator (HRSG). Straw<br />
furnaces supplied heat for farm build<strong>in</strong>gs and the gra<strong>in</strong> dryer.<br />
2.6. Greenhouse gas emissions<br />
M<strong>et</strong>hane emissions from storage of manure and digestion residues were calculated accord<strong>in</strong>g to the IPCC<br />
Guidel<strong>in</strong>es (IPCC 2006). M<strong>et</strong>hane is formed <strong>in</strong> the digestive system of dairy cows when cellulose is decomposed<br />
via anerobic microbial activity and depends on milk production rate, feed and the cow’s body weight.<br />
For a dairy cow produc<strong>in</strong>g 8000 kg milk/yr, assum<strong>in</strong>g a m<strong>et</strong>abolic weight of 600 kg/cow the emissions are<br />
120 kg CH4 /cow and yr. For heifers, 50 kg CH4 /animal and yr was assumed (Cederberg <strong>et</strong> al., 2007).<br />
Direct emissions of nitrous oxide (N2O) from soil and fertilisers were calculated based on IPCC m<strong>et</strong>hodology<br />
(1% of added nitrogen and 1% of nitrogen content <strong>in</strong> crop residues). Indirect emissions <strong>in</strong> the form of<br />
leached nitrogen (which volatizes downstream) were s<strong>et</strong> to 0.75% of leach<strong>in</strong>g (IPCC 2006) and the amount<br />
leached was assumed to be 11 kg N/ha (Wivstad <strong>et</strong> al., 2009). Emissions of N2O from storage of manure and<br />
digestion residues were s<strong>et</strong> at 0.1% of the nitrogen content available <strong>in</strong> the substrate, based on emission factors<br />
for liquid manure (IPCC 2006).<br />
The soil carbon balances of the cultivation systems studied were simulated with the ICBM (Andrén and<br />
Kätterer 2001). The model assumes two carbon pools (a ‘young’ pool, Y, and an ‘old’ pool, O) of which<br />
carbon enter<strong>in</strong>g the old pool is considered a carbon s<strong>in</strong>k, as the decomposability is 100 times lower than <strong>in</strong><br />
the young pool, where rapid m<strong>in</strong>eralisation of carbon as CO2 takes place. Equations 3a and 3b describe the<br />
dynamics of the carbon balance for the young and old pool, respectively:<br />
146<br />
dY e<br />
dt i kY<br />
r Y<br />
(kg) Eq 1<br />
dt hkY<br />
reY<br />
kOr<br />
O<br />
(kg) Eq. 2<br />
dO e<br />
where i is the <strong>in</strong>put of crop residues or manure, ky and ko are the decomposition rates of Y and O respectively,<br />
re is the external <strong>in</strong>fluence component (<strong>in</strong>clud<strong>in</strong>g for example soil climate, crop type and frequency of<br />
soil tillage, and is lower for ley and graz<strong>in</strong>g fields), and h is the humification coefficient (dimensionless).<br />
The humification rate depends on the composition of the respective material. Values are described further <strong>in</strong><br />
Kimm<strong>in</strong>g <strong>et</strong> al., (<strong>2012</strong>). The annual m<strong>in</strong>eralisation of carbon to carbon dioxide released to the atmosphere is<br />
a mean over 21 years (3 crop rotations).<br />
4. Results<br />
4.1 Self-sufficiency potential and energy balance<br />
The renewable energy supply systems <strong>in</strong> Scenario M1, M2a and M3 can make the farm self-sufficient <strong>in</strong><br />
energy under the given assumptions. In scenario M2b, only two thirds of the electricity requirement on the<br />
farm was covered by the available rapeseed oil, so Scenario 2b was excluded from further calculations of<br />
energy balance and GWP.<br />
On the arable farm, Scenario A1 requires that ley is harvested from 25 ha, which is 13% of the total farm<br />
area. A2 requires 49 ha of straw, i.e., 25% of the total farm area. This biomass is available <strong>in</strong> both scenarios,<br />
s<strong>in</strong>ce ley is planted on 29% of the farm area and cereals on 44% <strong>in</strong> the given crop rotation.<br />
In the self-supply scenarios, 2.63 MJ of fossil energy (primary energy) per kg ECM was saved <strong>in</strong> the milk<br />
production system and 755 for the whole 200 ha farm <strong>in</strong> the arable system<br />
4.2 GWP<br />
The GHG emissions from the milk production reference scenario (962 g CO2/kg ECM) were similar to<br />
those <strong>in</strong> previous studies of organic milk production with conventional energy supply systems (e.g. Ceder-
PARALLEL SESSION 2A: LAND USE 8 th Int. Conference on <strong>LCA</strong> <strong>in</strong> the<br />
Agri-<strong>Food</strong> Sector, 1-4 Oct <strong>2012</strong><br />
berg <strong>et</strong> al., 2007; Thomassen <strong>et</strong> al., 2008). Almost half the total GWP <strong>in</strong> the reference scenario stemmed<br />
from m<strong>et</strong>hane <strong>in</strong> enteric fermentation (43%) and manure storage (10%). Fossil energy use accounted for 22%<br />
of total GWP. Chang<strong>in</strong>g to an energy supply system based on renewable sources resulted <strong>in</strong> reductions of 29-<br />
44% of total GHG emissions from milk production, with Scenario 1 giv<strong>in</strong>g the largest emission reduction,<br />
and Scenario 2 the lowest. Avoided fossil fuel use was the largest contribut<strong>in</strong>g factor to the reduction <strong>in</strong><br />
GHG emissions <strong>in</strong> the renewable energy scenarios. The second most important param<strong>et</strong>er is the reduction <strong>in</strong><br />
m<strong>et</strong>hane emissions when manure was passed through an anaerobic digestion process before storage.<br />
In the arable farm study, The GHG emission sav<strong>in</strong>g was 35% <strong>in</strong> the self-sufficiency scenario based on ley<br />
(A1) and 9% <strong>in</strong> that based on straw (A2). There was less nitrous oxide from the soil <strong>in</strong> both self-sufficiency<br />
scenarios compared with the reference scenario, but the impact on the carbon content of the soil differed<br />
significantly, with a larger reduction <strong>in</strong> soil carbon content when straw was removed from the fields (Figure<br />
2).<br />
Figure 2. Disaggregated relative greenhouse gas emissions <strong>in</strong> the arable farm system. The bars above 0 are<br />
n<strong>et</strong> <strong>in</strong>creases <strong>in</strong> GHG emissions compared with the reference, and the bars below 0 are n<strong>et</strong> decreases.<br />
5. Discussion<br />
In both the milk and the arable system, it was found that the biomass resources available as residues on<br />
the farm were sufficient for supply of energy for the production. There was consequently no need to reduce<br />
the production of food products, or <strong>in</strong>crease the land area needed for the total production system.<br />
For the milk study, the functional unit was 1 l of milk. This seemed reasonable s<strong>in</strong>ce the milk farm has<br />
one major product. For the arable farm, the situation was quite different, with a number of products <strong>in</strong> a crop<br />
rotation. Therefore a functional unit was selected based on the whole farm, and the functional unit was limited<br />
to the energy supply to the system. In both cases GHG emissions are expressed as emission reduction<br />
compared to a reference scenario, whereby the functional unit is less important.<br />
We chose to <strong>in</strong>clude technologies that are technologically available at least at a demonstration level, but<br />
not necessarily commercially available. This seemed most <strong>in</strong>terest<strong>in</strong>g, s<strong>in</strong>ce there is little evidence of any<br />
small scale biomass CHP technology be<strong>in</strong>g commercially available today <strong>in</strong> Sweden. In other European<br />
countries with higher electricity prices and stronger <strong>in</strong>centives for small-scale electricity production however,<br />
the situation is quite different. Similarly, for tractor fuel, the systems evaluated are technically possible,<br />
but <strong>in</strong> most cases not commercially available. Both small-scale and large scale production of biofuels was<br />
<strong>in</strong>vestigated, selected based on technical feasibility.<br />
The self-supply pr<strong>in</strong>ciple was been applied as at a farm level on an annual average basis. The energy systems<br />
have normally not been designed for a self-supply <strong>in</strong>dependent of exist<strong>in</strong>g energy <strong>in</strong>frastructure. In our<br />
part of the world, there is an electricity grid that reaches vertically all citizens and all farms. It has therefore<br />
been most relevant to <strong>in</strong>vestigate systems which are connected to the electricity grid, and where electricity<br />
can be supplied to, and accessed from, the grid. Local electricity production has been designed to cover the<br />
farm´s total electricity demand on an annual basis.<br />
For gas, there is also a grid available <strong>in</strong> large parts of Europe. However, most of Sweden is not covered by<br />
a gas grid. It is possible to use natural gas <strong>in</strong>frastructure also for biogas, but that requires clean<strong>in</strong>g and upgrad<strong>in</strong>g<br />
of the gas, so it is not self-evident that available gas grids can be used for biogas. In most of our<br />
research we have not assumed any exist<strong>in</strong>g gas <strong>in</strong>frastructure available for biogas. When we have <strong>in</strong>cluded<br />
AA1 A1<br />
1<br />
A2<br />
147
PARALLEL SESSION 2A: LAND USE 8 th Int. Conference on <strong>LCA</strong> <strong>in</strong> the<br />
Agri-<strong>Food</strong> Sector, 1-4 Oct <strong>2012</strong><br />
gas grids <strong>in</strong> the system description, <strong>in</strong>vestment costs for build<strong>in</strong>g a local biogas grid were <strong>in</strong>cluded <strong>in</strong> the<br />
analysis.<br />
Production of bioenergy can be <strong>in</strong> conflict with the production of food, s<strong>in</strong>ce land and water resources are<br />
limited. In life cycle assessment, as well <strong>in</strong> the bioenergy debate at large, this has been referred to as “<strong>in</strong>direct<br />
land use change”, an aspect that has traditionally not been <strong>in</strong>cluded <strong>in</strong> <strong>LCA</strong> of agricultural products and<br />
systems, but <strong>in</strong> some recent attempts <strong>in</strong>direct land use change has been <strong>in</strong>cluded. In this work, we have<br />
avoided this issue by only us<strong>in</strong>g agricultural residues as biomass sources for bioenergy, and thus not reduc<strong>in</strong>g<br />
the amount of land available for food production at all. We have not considered any effects on farm<br />
yields by these modifications. For example, it is plausible that yields can be <strong>in</strong>creased by produc<strong>in</strong>g biogas<br />
from ley and optimiz<strong>in</strong>g the application of digestate, as compared to plough<strong>in</strong>g down the yield. Another case<br />
is when straw s removed and soil carbon content is reduced, which could result <strong>in</strong> reduced soil fertility and<br />
lower yields.<br />
6. Conclusions<br />
Swedish milk production can become self-sufficient <strong>in</strong> energy by utiliz<strong>in</strong>g renewable sources available on<br />
the farm, and thereby reduce GHG emission from production of 1 kg of ECM by 29-44% compared with a<br />
conventional farm system. The highest GHG emission reductions were found <strong>in</strong> a system where energy was<br />
supplied only with biogas, while a system with RME was least favourable.<br />
The arable organic farm studied could be self-sufficient <strong>in</strong> energy by us<strong>in</strong>g the residues available <strong>in</strong> the<br />
crop rotation: us<strong>in</strong>g ley for biogas production or straw for <strong>et</strong>hanol, heat and power production. Because of<br />
due to soil carbon losses the greenhouse gas emission sav<strong>in</strong>gs are lower with the straw system (9%) than the<br />
ley system (35%).<br />
7. Acknowledgements<br />
The research was funded by FORMAS, the Swedish Research Council for Environment, Agricultural Sciences<br />
and Spatial Plann<strong>in</strong>g.<br />
8. References<br />
Ahlgren S., Baky A., Bernesson S., Nordberg Å., O. Norén O. Hansson P.A, 2010. Future Vehicle Fuel Supply for Swedish Agriculture.<br />
JTI Report 392. Lantbruk och Industri. Uppsala, JTI - Swedish Institute for Agricultural and Environmental Sciences.<br />
Andrén, O., Kätterer, T., 2001. Basic pr<strong>in</strong>ciples for soil carbon sequestration and calculat<strong>in</strong>g dynamic country-level balances <strong>in</strong>clud<strong>in</strong>g<br />
future scenarios. Assessment M<strong>et</strong>hods for Soil Carbon, 495–511.<br />
Cederberg, C., Flysjö A., Ericson, L., 2007. Livscykelanalys (<strong>LCA</strong>) av norrländsk mjölkproduktion. SIK-rapport 761. Stockholm,<br />
Swedish Institute for <strong>Food</strong> and Biotechnology.<br />
IPCC, 2006. IPCC Guidel<strong>in</strong>es for National Greenhouse Gas Inventory. Volume 4 Agriculture, Forestry and Other Land Use.<br />
Johansson, N., 2008. Production of liquid biogas, LBG, with cryogenic and conventional upgrad<strong>in</strong>g technology. . Department for<br />
Environmental and Energy Systems Studies. Lund, Lund University. Master thesis.<br />
Kimm<strong>in</strong>g M., Sundberg C., Nordberg A., Baky A., Bernesson S., Norén O., Hansson P-A., 2011. Life cycle assessment of energy<br />
self-sufficiency systems based on agricultural residues for organic arable farms. Bioresource Technology. 102, 1425-32.<br />
Kimm<strong>in</strong>g M., Sundberg C., Nordberg A., Baky A., Bernesson S., Norén O., Hansson P-A., <strong>2012</strong>. Life cycle assessment of energy<br />
self-sufficiency systems based on agricultural residues for organic arable farms. Background report. Department of Energy and<br />
Technology, SLU<br />
Kimm<strong>in</strong>g M., Sundberg C., Nordberg A., Baky A., Bernesson S., Hansson P-A., <strong>2012</strong>. Renewable energy supply for organic milk<br />
production: self-sufficiency potential, energy balance and greenhouse gas emission. Submitted manuscript<br />
Thomassen, M. A., van Calker K. J., Smits, M. C. J., Iepema G. L., de Boer I. J. M., 2008. Life cycle assessment of conventional and<br />
organic milk production <strong>in</strong> the N<strong>et</strong>herlands. Agricultural Systems. 96, 95-107.<br />
Wivstad, M., Salomon E., Spångberg J., Jönsson, H., 2009. Organic production - possibilities to reduce eutrophication. Uppsala,<br />
Swedish University of Agriculture, Centre for Susta<strong>in</strong>able Agriculture.<br />
148
PARALLEL SESSION 2A: LAND USE 8 th Int. Conference on <strong>LCA</strong> <strong>in</strong> the<br />
Agri-<strong>Food</strong> Sector, 1-4 Oct <strong>2012</strong><br />
Peri-urban expansion: application of consequential <strong>LCA</strong> to assess land<br />
for food or hous<strong>in</strong>g<br />
Alison Rothwell 1 , Brad Ridoutt 2 , Girija Page 1 , Bill Bellotti 1<br />
1 University of Western Sydney, School of Science and Health, Locked Bag 1797, Penrith, NSW 2751, Australia<br />
2 Commonwealth Scientific and Industrial Research Organisation (CSIRO), Susta<strong>in</strong>able Agriculture National Research Flagship,<br />
Private Bag 10, Clayton South, Victoria 3169, Australia<br />
Correspond<strong>in</strong>g author. E-mail: alison.rothwell@uws.edu.au<br />
ABSTRACT<br />
Comp<strong>et</strong><strong>in</strong>g land uses such as urban expansion are impact<strong>in</strong>g fresh food production <strong>in</strong> peri-urban Sydney. Provid<strong>in</strong>g both hous<strong>in</strong>g and<br />
fresh food at lower relative emissions rates should be a priority <strong>in</strong> policy development. This paper presents a m<strong>et</strong>hod that enables a<br />
comprehensive view of environmental trade-offs at the urban-agricultural <strong>in</strong>tersection. Us<strong>in</strong>g consequential <strong>LCA</strong>, global warm<strong>in</strong>g<br />
potential (GWP) was calculated for two peri-urban land use scenarios <strong>in</strong>volv<strong>in</strong>g two dist<strong>in</strong>ct types of urban hous<strong>in</strong>g systems whilst<br />
account<strong>in</strong>g for agricultural diversity at the farm scale. In Scenario 1 Sydney’s horticultural production was displaced by low density<br />
outer suburban hous<strong>in</strong>g. Scenario 2 <strong>in</strong>volved r<strong>et</strong>ention of Sydney’s horticultural production with an <strong>in</strong>fill hous<strong>in</strong>g model. Results<br />
show that although differences were observed with<strong>in</strong> the agricultural system, it is the urban hous<strong>in</strong>g system dom<strong>in</strong>at<strong>in</strong>g GWP impacts,<br />
with scenario 1 hav<strong>in</strong>g a GWP 74 t ha -1 higher than for scenario 2. Policy focus on urban hous<strong>in</strong>g systems for greenhouse gas<br />
abatement <strong>in</strong> the regional context is recommended.<br />
Keywords: food security, l<strong>et</strong>tuce, greenhouse gas emissions, land use change, urban development.<br />
1. Introduction<br />
This paper describes the use of consequential <strong>LCA</strong> (C<strong>LCA</strong>) to assess land use options at the agricultureurban<br />
<strong>in</strong>terface. Comp<strong>et</strong><strong>in</strong>g land uses such as urban expansion are impact<strong>in</strong>g fresh food production <strong>in</strong> periurban<br />
Sydney (Australia). Research is divided regard<strong>in</strong>g the status of peri-urban horticultural land management<br />
<strong>in</strong> the Sydney bas<strong>in</strong>. Although many qualitative papers on the benefits of peri-urban agricultural land<br />
r<strong>et</strong>ention exist both nationally (Choy <strong>et</strong> al., 2008; Houston, 2005) and <strong>in</strong>ternationally (Condon <strong>et</strong> al., 2010;<br />
van Veenhuizen and Danso, 2007), quantitative, evidence based plann<strong>in</strong>g is predom<strong>in</strong>antly absent. Although<br />
the value of production for veg<strong>et</strong>ables <strong>in</strong> the Sydney bas<strong>in</strong> represents approximately 46% of the NSW state<br />
total, at only 6% of the value of Australian production (ABS, 2010), proponents of urban development argue<br />
that Sydney’s horticultural production is of little consequence. Urban development is politically and economically<br />
well supported. Government policies are trend<strong>in</strong>g <strong>in</strong> favour of development for urbanisation<br />
(NSW Department of Plann<strong>in</strong>g, 2010) with the number of horticultural farms <strong>in</strong> Sydney anticipated to halve<br />
under current plann<strong>in</strong>g policy (ARUP, 2010b). If this trend cont<strong>in</strong>ues, horticulture may cease as a viable<br />
land-use and economic function <strong>in</strong> the Sydney bas<strong>in</strong>. Sydney’s balance of horticultural produce will then be<br />
imported from regional locations. It is not known, however, if the alternative food produc<strong>in</strong>g locations present<br />
a more or less susta<strong>in</strong>able environmental situation for veg<strong>et</strong>ables on the Sydney mark<strong>et</strong> compared with<br />
local production. While there is a need to provide hous<strong>in</strong>g, opportunity exists for a data driven m<strong>et</strong>hodology<br />
to evaluate the environmental consequences of the decision to urbanise, for the purpose of <strong>in</strong>form<strong>in</strong>g policy<br />
and driv<strong>in</strong>g greenhouse gas (GHG) emissions abatement.<br />
Australia currently exhibits the highest GHG emissions of any OECD country per capita, with average<br />
emissions exceed<strong>in</strong>g four times the world average (Garnaut, 2008). Suburban residential development is a<br />
key contributor to these emissions, with differences reported <strong>in</strong> environmental impacts b<strong>et</strong>ween different<br />
urban forms, notably b<strong>et</strong>ween more energy <strong>in</strong>tensive car reliant low-density outer urban greenfield style<br />
hous<strong>in</strong>g development versus lower energy <strong>in</strong>tensive, <strong>in</strong>fill development of <strong>in</strong>ner suburban areas with exist<strong>in</strong>g<br />
public transport <strong>in</strong>frastructure (ARUP, 2010a; Camagni <strong>et</strong> al., 2002; Duffy, 2009; Fuller and Crawford,<br />
2011). Despite this, urban expansion <strong>in</strong>to new greenfield areas is the accepted norm for new hous<strong>in</strong>g development,<br />
with resistance to implement<strong>in</strong>g higher density <strong>in</strong>fill hous<strong>in</strong>g along key transportation corridors <strong>in</strong><br />
established suburbs. Provid<strong>in</strong>g both hous<strong>in</strong>g and fresh food at lower relative GHG emissions rates should be<br />
a priority <strong>in</strong> policy development. The contradictory stance and poor <strong>in</strong>tegration b<strong>et</strong>ween policy direction on<br />
emissions and m<strong>et</strong>ropolitan plann<strong>in</strong>g has been highlighted (ARUP, 2010b). Agricultural emissions are also<br />
known to be high relative to other OECD countries (Garnaut, 2008). Both agriculture and urban systems<br />
have differ<strong>in</strong>g and relatively large environmental impacts. At the peri-urban <strong>in</strong>terface, what do the comb<strong>in</strong>ed<br />
environmental impacts look like under different peri-urban land use scenarios?<br />
Consequential <strong>LCA</strong> (C<strong>LCA</strong>) provides a m<strong>et</strong>hodology that can assess environmental impacts relat<strong>in</strong>g to<br />
us<strong>in</strong>g land for hous<strong>in</strong>g versus land for food, and assist answer<strong>in</strong>g the question “What are the environmental<br />
consequences of urbanis<strong>in</strong>g Sydney’s horticultural lands?” Should peri-urban land be seen as land <strong>in</strong> wait<strong>in</strong>g<br />
149
PARALLEL SESSION 2A: LAND USE 8 th Int. Conference on <strong>LCA</strong> <strong>in</strong> the<br />
Agri-<strong>Food</strong> Sector, 1-4 Oct <strong>2012</strong><br />
for conversion to low density hous<strong>in</strong>g, or do other hous<strong>in</strong>g decisions possess b<strong>et</strong>ter environmental impact<br />
trade-offs? Specifically, <strong>in</strong> this paper, the benefits and challenges of apply<strong>in</strong>g C<strong>LCA</strong> to generate decision<br />
mak<strong>in</strong>g evidence to support peri-urban land-use decisions are evaluated. In agriculture, C<strong>LCA</strong> has been used<br />
to assess land use decisions (Brandao, 2010). <strong>LCA</strong> is also used <strong>in</strong> the built environment, typically as attributional<br />
studies <strong>in</strong>vestigat<strong>in</strong>g different build<strong>in</strong>g forms and build<strong>in</strong>g materials (Rossi <strong>et</strong> al., <strong>2012</strong>). In Australia,<br />
recent studies have compared embodied, operational and transportation energy and greenhouse gas emissions<br />
of alternative hous<strong>in</strong>g types, support<strong>in</strong>g the opportunity for energy consumption and emissions to be significantly<br />
reduced by shift<strong>in</strong>g to <strong>in</strong>ner-suburban apartment type dwell<strong>in</strong>gs over outer suburban d<strong>et</strong>ached homes<br />
(Crawford, 2011). Environmental impacts are typically assessed <strong>in</strong> isolation with<strong>in</strong> each of the two discipl<strong>in</strong>es<br />
of agriculture or urban plann<strong>in</strong>g. Us<strong>in</strong>g C<strong>LCA</strong>, the system boundaries can be def<strong>in</strong>ed to <strong>in</strong>clude the<br />
activities contribut<strong>in</strong>g to the environmental consequence of the change, mean<strong>in</strong>g that impacts associated with<br />
both the urban and agricultural systems affected by this change can be <strong>in</strong>cluded. The benefit of C<strong>LCA</strong> at the<br />
urban-agricultural <strong>in</strong>tersection is to provide a new perspective on peri-urban land-use change. Scenarios for<br />
produc<strong>in</strong>g veg<strong>et</strong>ables versus produc<strong>in</strong>g hous<strong>in</strong>g can be ranked accord<strong>in</strong>g to their environmental impacts and<br />
consequential displacements associated with land use decisions assessed. Environmental impacts were assessed<br />
for both a certa<strong>in</strong> amount of product to be produced for the Sydney mark<strong>et</strong>, and for a certa<strong>in</strong> number<br />
of people to be housed. The m<strong>et</strong>hod implemented <strong>in</strong> this paper permits for environmental impacts to be calculated<br />
for scenarios that <strong>in</strong>clude two dist<strong>in</strong>ct types of urban hous<strong>in</strong>g systems whilst account<strong>in</strong>g for agricultural<br />
diversity at the farm scale.<br />
2. M<strong>et</strong>hods<br />
2.1 Scenarios<br />
In apply<strong>in</strong>g C<strong>LCA</strong> to assess the comb<strong>in</strong>ed environmental impacts <strong>in</strong>volv<strong>in</strong>g both horticulture and urban<br />
land use at the peri-urban <strong>in</strong>tersection, hypoth<strong>et</strong>ical scenarios were established as illustrated <strong>in</strong> Fig. 1. The<br />
use of C<strong>LCA</strong> allowed alternative means of <strong>in</strong>creas<strong>in</strong>g marg<strong>in</strong>al production to be evaluated. Marg<strong>in</strong>al production<br />
refers to the system that would be affected due to changes <strong>in</strong> demand. The system could be a technology<br />
(such as greenhous<strong>in</strong>g versus field production) or a location (one grow<strong>in</strong>g region may expand <strong>in</strong> preference<br />
to another).<br />
Scenario 1. Scenario 2.<br />
Figure 1. Scenarios to be analysed for land-use change from 1 ha of l<strong>et</strong>tuce to greenfield hous<strong>in</strong>g (scenario 1)<br />
or to equivalent <strong>in</strong>fill hous<strong>in</strong>g (scenario 2).<br />
In Fig. 1, scenario 1 illustrates how fresh food production is m<strong>et</strong> via production <strong>in</strong> a marg<strong>in</strong>al region, due<br />
to displacement from the Sydney region by hous<strong>in</strong>g. Scenario 2 illustrates how the hous<strong>in</strong>g burden is fulfilled<br />
by adoption of a predom<strong>in</strong>antly <strong>in</strong>fill hous<strong>in</strong>g system with no displacement of Sydney horticulture. A<br />
third scenario, scenario 3, analyses the trade-offs provided by a high technology greenhouse comb<strong>in</strong>ed with<br />
<strong>in</strong>creased parkland and <strong>in</strong>fill urban hous<strong>in</strong>g compared to the scenarios 1 and 2. Modell<strong>in</strong>g of scenario 3 will<br />
be compl<strong>et</strong>ed <strong>in</strong> the next phase of this project and will not be discussed further <strong>in</strong> this paper.<br />
2.2 Functional units and impact categories<br />
SimaPro 7.3.3 software was used for modell<strong>in</strong>g, select<strong>in</strong>g data from Australian Unit Process LCI or<br />
Eco<strong>in</strong>vent unit processes. Two functional units were used for each scenario: one functional unit to represent<br />
a certa<strong>in</strong> number of people be<strong>in</strong>g housed (<strong>in</strong> units of per hectare); the second functional unit to represent a<br />
certa<strong>in</strong> amount of l<strong>et</strong>tuce be<strong>in</strong>g produced for the Sydney mark<strong>et</strong> (<strong>in</strong> units of per kilogram). Hav<strong>in</strong>g two functional<br />
units facilitates improved understand<strong>in</strong>g of environmental burdens. Environmental impacts were esti-<br />
150
PARALLEL SESSION 2A: LAND USE 8 th Int. Conference on <strong>LCA</strong> <strong>in</strong> the<br />
Agri-<strong>Food</strong> Sector, 1-4 Oct <strong>2012</strong><br />
mated us<strong>in</strong>g the Australian <strong>in</strong>dicator s<strong>et</strong>. The <strong>in</strong>dicators of <strong>in</strong>terest <strong>in</strong>clude GWP, eutrophication, land use,<br />
water use and energy demand. However, only a subs<strong>et</strong> will be presented with<strong>in</strong> this paper, that be<strong>in</strong>g GWP.<br />
2.3 Horticultural systems<br />
With<strong>in</strong> the framework of this project, modell<strong>in</strong>g at farm level was required <strong>in</strong> order to m<strong>in</strong>imise use of<br />
average data to represent farms of differ<strong>in</strong>g sizes and <strong>in</strong> different regions. This is consistent with the purpose<br />
to compare and contrast impacts from farms <strong>in</strong> different geographical locations, with differ<strong>in</strong>g levels of <strong>in</strong>puts<br />
and outputs. A case study approach was taken, with l<strong>et</strong>tuce supplied to the Sydney mark<strong>et</strong> selected as<br />
the commodity of choice. L<strong>et</strong>tuce was selected for the follow<strong>in</strong>g reasons: it is a perishable crop and is ideally<br />
situated close to mark<strong>et</strong>; its relative economic importance with<strong>in</strong> Sydney’s horticultural production; a reasonable<br />
field plant<strong>in</strong>g area is occupied by l<strong>et</strong>tuce <strong>in</strong> Sydney; and l<strong>et</strong>tuce is a di<strong>et</strong>ary staple <strong>in</strong> the Australian<br />
di<strong>et</strong>, unlikely to be displaced from the supply cha<strong>in</strong>. The l<strong>et</strong>tuce mark<strong>et</strong>, be<strong>in</strong>g highly comp<strong>et</strong>itive, price<br />
driven and with an absence of mark<strong>et</strong> policies, is likely to expand us<strong>in</strong>g growers that can <strong>in</strong>crease their production<br />
with the least expense. Regional geographical locations identified based on ability to expand at<br />
m<strong>in</strong>imal cost, recent production growth and seasonality considerations <strong>in</strong>cluded specific regions <strong>in</strong> the states<br />
of Victoria and Queensland. Grow<strong>in</strong>g areas for l<strong>et</strong>tuce <strong>in</strong> Victoria and Queensland are approximately 900km<br />
from the Sydney mark<strong>et</strong> by road.<br />
Data was collected from two field farms <strong>in</strong> Sydney (LF1 and LF2), a hydroponic farm <strong>in</strong> Sydney (LF3)<br />
and a larger field farm <strong>in</strong> Victoria (LF4). Hydroponic grow<strong>in</strong>g (LF3) represented a low technology grow<strong>in</strong>g<br />
system, with no climate control and simple plastic shadecloth structures. Additional data will be collected<br />
from Queensland <strong>in</strong> the near future. Data was collected for iceberg, cos and/or baby cos l<strong>et</strong>tuce. Process <strong>in</strong>puts<br />
captured with<strong>in</strong> the system boundary for each farm, and calculated emissions to the compartments of<br />
air, soil and water <strong>in</strong>cluded those identified <strong>in</strong> Figure 2.<br />
INPUTS:<br />
Seeds/transplants<br />
Fertilisers<br />
Composts<br />
Manures<br />
Pesticides<br />
Herbicides<br />
Fungicides<br />
W<strong>et</strong>t<strong>in</strong>g agents<br />
Irrigation water<br />
Fuel<br />
Electricity<br />
Capital equipment<br />
L<strong>et</strong>tuce at farm<br />
INPUTS:<br />
Packag<strong>in</strong>g<br />
Wash<strong>in</strong>g<br />
Capital equipment<br />
Electricity<br />
Transport<br />
L<strong>et</strong>tuce at Sydney<br />
mark<strong>et</strong><br />
EMISSIONS to AIR:<br />
N2O<br />
CO2<br />
VOC<br />
EMISSIONS TO<br />
SOIL/WATER:<br />
Nitrate<br />
Phosphate<br />
Sulfate<br />
Pesticide<br />
Figure 2. Process <strong>in</strong>puts captured with<strong>in</strong> the system boundary for farms.<br />
2.4 Urban systems<br />
IMPACTS:<br />
Global Warm<strong>in</strong>g<br />
Eutrophication<br />
Land use<br />
Water use<br />
Cumulative energy<br />
demand<br />
Accord<strong>in</strong>g to Sydney’s M<strong>et</strong>ropolitan Plan (NSW Department of Plann<strong>in</strong>g 2010) there are two dom<strong>in</strong>ant<br />
forms of urban hous<strong>in</strong>g: greenfield and <strong>in</strong>fill. Greenfield requires large tracts of peri-urban land to be converted<br />
en masse <strong>in</strong>to d<strong>et</strong>ached low density hous<strong>in</strong>g. Infill development requires the purchase and demolition<br />
of exist<strong>in</strong>g, dated, structures, and the construction of new, mid to high-rise apartment complexes <strong>in</strong> <strong>in</strong>ner<br />
suburban areas. From scenario 1 the model requires the impacts from 1 ha of greenfield development to be<br />
estimated, while scenario 2 requires impacts from 1 ha (equivalent) of <strong>in</strong>fill development (equivalency based<br />
on hous<strong>in</strong>g a certa<strong>in</strong> population). An <strong>in</strong>itial challenge was how to model <strong>in</strong>fill development given that <strong>in</strong>fill<br />
does not directly replace peri-urban horticultural land as greenfield hous<strong>in</strong>g systems do, on a per hectare<br />
basis. By calculat<strong>in</strong>g the number of houses per hectare <strong>in</strong> a greenfield development, and the associated persons<br />
per hectare based on population statistics, the correspond<strong>in</strong>g number of <strong>in</strong>fill style apartments to house<br />
the same population could be d<strong>et</strong>erm<strong>in</strong>ed. For the purposes of this study, the typical greenfield house is a<br />
250m 2 d<strong>et</strong>ached s<strong>in</strong>gle level brick veneer house, with concr<strong>et</strong>e slab and tiled roof on a 550m 2 block of land.<br />
An average of 2.5 persons lives <strong>in</strong> a typical greenfield house <strong>in</strong> Australia (ABS <strong>in</strong> Crawford and Fuller<br />
2011). Us<strong>in</strong>g this <strong>in</strong>formation, and d<strong>et</strong>erm<strong>in</strong><strong>in</strong>g the number of houses (18.18 houses per ha) and population<br />
per hectare (45.45 persons per ha) for a typical greenfield development, the equivalent number of <strong>in</strong>fill<br />
apartments was ascerta<strong>in</strong>ed. The average population of a mid-rise apartment <strong>in</strong> <strong>in</strong>ner suburban Australia is<br />
estimated at 1.6 per apartment (Crawford, 2011). Therefore 28.4 apartments would be needed to house the<br />
same population as 1 ha of greenfield hous<strong>in</strong>g, for those scenarios requir<strong>in</strong>g <strong>in</strong>fill development. It was assumed<br />
that these apartments were housed <strong>in</strong> one mid-rise (four or five storeys) high-density apartment block.<br />
151
PARALLEL SESSION 2A: LAND USE 8 th Int. Conference on <strong>LCA</strong> <strong>in</strong> the<br />
Agri-<strong>Food</strong> Sector, 1-4 Oct <strong>2012</strong><br />
Inventory for greenfield and <strong>in</strong>fill hous<strong>in</strong>g systems was compiled from various local sources to represent<br />
construction, operation and transportation to the extent that they were able to be characterised. Hybrid Input-<br />
Output (I-O) energy data for embodied, operational and transportation energy was adapted from a contemporary<br />
study of alternative hous<strong>in</strong>g types <strong>in</strong> Australia by Crawford and Fuller (2011). As hybrid I-O studies<br />
calculate on an energy basis, to obta<strong>in</strong> a more compl<strong>et</strong>e picture of environmental impacts, the embodied energy<br />
for each of the two hous<strong>in</strong>g styles was broken down <strong>in</strong>to constituent material quantities such that the<br />
total embodied energy reflected the value be<strong>in</strong>g modelled from Crawford and Fuller (2011). Representative<br />
material quantities for greenfield hous<strong>in</strong>g construction were obta<strong>in</strong>ed from a residential case study of similar<br />
hous<strong>in</strong>g <strong>in</strong> Crawford (2011). For <strong>in</strong>fill style hous<strong>in</strong>g material <strong>in</strong>puts were obta<strong>in</strong>ed from a bill of quantities<br />
for a concr<strong>et</strong>e apartment build<strong>in</strong>g (OECD, 1999). Operational energy was represented as the NSW average<br />
energy mix of coal fired electricity 90% and gas 10% (Dart Energy, 2011). Transportation energy was represented<br />
as the proportional mix of tra<strong>in</strong> versus car travel taken by households <strong>in</strong> each urban system, with one<br />
passenger car allocated to each household.<br />
2.5 Comb<strong>in</strong><strong>in</strong>g agricultural and urban impacts<br />
To comb<strong>in</strong>e impacts, reference is made to scenarios 1 and 2 (Figure 2) respectively. For scenario 1, total<br />
environmental impacts <strong>in</strong>cluded the addition of one hectare of greenfield hous<strong>in</strong>g with the amount of land <strong>in</strong><br />
the marg<strong>in</strong>al location associated with the same production yield as displaced Sydney farms. Scenario 1 therefore<br />
comb<strong>in</strong>ed impacts from 1ha of greenfield hous<strong>in</strong>g with impacts from LF4. Total impacts for scenario 2<br />
<strong>in</strong>cluded the addition of 1 ha of a Sydney farm, plus 1 ha-equivalent of <strong>in</strong>fill hous<strong>in</strong>g. For scenario 2, the<br />
environmental impacts from 1 ha equivalent of <strong>in</strong>fill hous<strong>in</strong>g was comb<strong>in</strong>ed with the average impacts from<br />
LF1 and LF2. As these scenarios each require l<strong>et</strong>tuce to be modelled at the Sydney mark<strong>et</strong>, <strong>in</strong>puts <strong>in</strong>cluded,<br />
<strong>in</strong> addition to farm processes, post-harvest operations such as wash<strong>in</strong>g of l<strong>et</strong>tuce, coolroom operation, transportation<br />
and fabrication of capital equipment for transport, sheds and coolrooms.<br />
3. Results<br />
3.1 L<strong>et</strong>tuce at farm and l<strong>et</strong>tuce at Sydney mark<strong>et</strong><br />
Prelim<strong>in</strong>ary data are <strong>in</strong>dicat<strong>in</strong>g that field grown l<strong>et</strong>tuce (LF1, LF2 and LF4) exhibit similar GWPs with<br />
results rang<strong>in</strong>g b<strong>et</strong>ween 1.5 to 1.9x10 4 kg CO2-e/ha (0.25-0.35 kg CO2-eq per kg l<strong>et</strong>tuce). Hydroponic l<strong>et</strong>tuce<br />
(LF3) exhibited significantly larger GWP at 10.9x10 4 kg CO2-e/ha (0.58 kg CO2-eq per kg l<strong>et</strong>tuce), primarily<br />
due to the contribution to farm <strong>in</strong>puts from electricity. LF1, LF2 and LF3 exhibited <strong>in</strong>creases <strong>in</strong> GWP of 6 to<br />
9 percent when factor<strong>in</strong>g <strong>in</strong>puts to deliver the l<strong>et</strong>tuce to the Sydney mark<strong>et</strong>. GWP for <strong>in</strong>terstate farm LF4<br />
<strong>in</strong>creased 40 percent to 2.1x10 4 kg CO2-e/ha.<br />
3.2 Urban hous<strong>in</strong>g style comparison and comb<strong>in</strong>ed impacts<br />
Figure 3 illustrates the GWP for both greenfield and <strong>in</strong>fill urban hous<strong>in</strong>g systems (without any horticultural<br />
implications) and provides comparison to the impacts from each of the farms. Embodied, operational<br />
and transportation energy are <strong>in</strong>cluded <strong>in</strong> the total per hectare results for each of the urban systems. Per hectare<br />
results for greenfield hous<strong>in</strong>g systems exhibited the largest GWP at 44 kg CO2-e/ha, over twenty-fold<br />
Figure 3. GWP for the two hous<strong>in</strong>g systems Figure 4. GWP for Scenarios 1 and 2,<br />
and farms LF1 to LF4, per hectare. per hectare<br />
152<br />
kg CO2-e xE4<br />
50<br />
40<br />
30<br />
20<br />
10<br />
0<br />
Inner Outer<br />
urban urban<br />
mid-rise d<strong>et</strong>ached<br />
apartment house<br />
LF1 LF2 LF3 LF4<br />
kg CO2-e xE4<br />
50<br />
40<br />
30<br />
20<br />
10<br />
0<br />
Scenario 1 Scenario 2
PARALLEL SESSION 2A: LAND USE 8 th Int. Conference on <strong>LCA</strong> <strong>in</strong> the<br />
Agri-<strong>Food</strong> Sector, 1-4 Oct <strong>2012</strong><br />
higher than for field l<strong>et</strong>tuce systems. Figure 4 shows the comb<strong>in</strong>ed impacts for the scenarios 1 and 2, illustrat<strong>in</strong>g<br />
that scenario 1, greenfield hous<strong>in</strong>g with displaced l<strong>et</strong>tuce production, has a GWP approximately 74 t<br />
ha -1 higher than for scenario 2.<br />
4. Discussion<br />
With<strong>in</strong> the agricultural system at both farm and mark<strong>et</strong> levels, comparisons can be made both <strong>in</strong>tra-region<br />
and <strong>in</strong>ter-region. The larger commercial field farm, LF4, although produc<strong>in</strong>g with b<strong>et</strong>ter economies of scale,<br />
exhibited only a marg<strong>in</strong>ally smaller GWP at farm level than local Sydney field farms, highlight<strong>in</strong>g that<br />
smaller farms can compare favourably with respect to environmental impacts (see Figure 3). For l<strong>et</strong>tuce at<br />
the Sydney mark<strong>et</strong>, supply cha<strong>in</strong> activities (<strong>in</strong>clud<strong>in</strong>g road transport) impacted GWP most negatively for the<br />
<strong>in</strong>terstate farm, effectively revers<strong>in</strong>g the order of the GWP impacts for the three field farms, result<strong>in</strong>g <strong>in</strong> LF4<br />
hav<strong>in</strong>g the higher GWP impact for l<strong>et</strong>tuce at the Sydney mark<strong>et</strong>. The benefit of this m<strong>et</strong>hod is that both field<br />
and supply cha<strong>in</strong> impacts have been assessed, with proximity to mark<strong>et</strong> hav<strong>in</strong>g a positive impact on emissions<br />
abatement. Emissions for LF3 were relatively high as a result of <strong>in</strong>frastructure requirements and electricity<br />
demand, which <strong>in</strong> NSW is predom<strong>in</strong>antly coal fired. Farm level data has illustrated that hydroponic<br />
systems are not necessarily more environmentally friendly, however, if an alternate electricity mix were<br />
available for which emissions could be significantly reduced, the hydroponic farm would see the most dramatic<br />
benefits.<br />
Avoid<strong>in</strong>g the use of ‘average’ data obta<strong>in</strong>ed a more realistic analysis of environmental impacts. Prelim<strong>in</strong>ary<br />
results are <strong>in</strong>dicat<strong>in</strong>g dramatic reductions <strong>in</strong> global warm<strong>in</strong>g potential when farm-level data is used<br />
compared to Australian average estimates. For example, results from this project are orders of magnitude less<br />
than average estimates calculated for horticultural sectors, where farm gross marg<strong>in</strong> data was used to make<br />
GWP claims (O'Halloran <strong>et</strong> al., 2008). Confidence <strong>in</strong> the values reported <strong>in</strong> this project was assured by comparison<br />
to contemporary l<strong>et</strong>tuce <strong>LCA</strong>s (Marton <strong>et</strong> al., 2010; Milà i Canals <strong>et</strong> al., 2008). Even with truncation<br />
errors of up to 87% reported as part of process <strong>LCA</strong> (Crawford 2011), the benefits of us<strong>in</strong>g local data over<br />
use of averages are dramatic.<br />
Collect<strong>in</strong>g data for urban systems presented a greater challenge than collection from farms. Build<strong>in</strong>g <strong>LCA</strong><br />
literature was oriented to <strong>in</strong>dividual build<strong>in</strong>gs or build<strong>in</strong>g components, with a lack of literature provid<strong>in</strong>g<br />
d<strong>et</strong>ailed bills of quantities for the hous<strong>in</strong>g styles to be modelled or data on hous<strong>in</strong>g systems. Land preparation,<br />
demolition, waste, <strong>in</strong>frastructure <strong>in</strong>stallation and revised bills of quantities will be <strong>in</strong>cluded <strong>in</strong> a subsequent<br />
phase of the project <strong>in</strong> order to improve authenticity and reduce uncerta<strong>in</strong>ty <strong>in</strong> the greenfield and <strong>in</strong>fill<br />
models. Although <strong>in</strong>ter-farm differences <strong>in</strong> GWP of up to 25 percent were observed for field l<strong>et</strong>tuce, GWP<br />
impacts with<strong>in</strong> the agricultural production systems proved less significant compared to the larger impacts of<br />
the urban systems (Figure 3). With the urban system dom<strong>in</strong>at<strong>in</strong>g impacts, the <strong>in</strong>terstate farm LF4 would need<br />
to demonstrate significant improvements <strong>in</strong> environmental impacts to trade-off aga<strong>in</strong>st greenfield expansion,<br />
which as shown <strong>in</strong> scenario 1, was not observed. This <strong>in</strong>dicates that the region where l<strong>et</strong>tuce is produced is<br />
less relevant to overall GWP impacts than the urban hous<strong>in</strong>g model implemented. The focus becomes less on<br />
how best to produce l<strong>et</strong>tuce and more on how hous<strong>in</strong>g systems can be leveraged to support emissions abatement.<br />
A further challenge with<strong>in</strong> the m<strong>et</strong>hod <strong>in</strong>cluded the need to use European derived Eco<strong>in</strong>vent data <strong>in</strong> SimaPro<br />
due to absence of representative Australian processes. The electricity mix <strong>in</strong> European processes us<strong>in</strong>g<br />
nuclear energy may give more conservative impacts than us<strong>in</strong>g energy from the dom<strong>in</strong>antly coal fired<br />
mix <strong>in</strong> Australia. Future work will <strong>in</strong>clude further data collection from regional locations, improv<strong>in</strong>g the<br />
urban modell<strong>in</strong>g and analys<strong>in</strong>g the consequences of urbanis<strong>in</strong>g Sydney’s horticultural lands <strong>in</strong> a resource<br />
constra<strong>in</strong>ed and climatically uncerta<strong>in</strong> future. Apply<strong>in</strong>g time limits to future scenarios, by which time marg<strong>in</strong>al<br />
suppliers and technologies may have changed, is a further challenge for management.<br />
5. Conclusion<br />
The benefit of C<strong>LCA</strong> at the urban-agricultural <strong>in</strong>tersection has been to provide a new perspective on periurban<br />
land-use change. Scenarios for produc<strong>in</strong>g l<strong>et</strong>tuce versus produc<strong>in</strong>g hous<strong>in</strong>g were evaluated for GWP.<br />
Prelim<strong>in</strong>ary analysis for the two scenarios modelled has illustrated that, although differences were observed<br />
with<strong>in</strong> the agricultural system, it is the urban hous<strong>in</strong>g system dom<strong>in</strong>at<strong>in</strong>g GWP impacts. Policy focus on<br />
urban hous<strong>in</strong>g systems for greenhouse gas abatement <strong>in</strong> the regional context is recommended.<br />
6. References<br />
ABS 2010. Value of Agricultural Commodities Produced, Australia, 2008-09, 'Table 1 VACP - All Commodities - National, Australia',<br />
data cube: excel spreadshe<strong>et</strong>, cat. no. 7503.0, (Data Cube All commodities, by Australia, State and Statistical Division).<br />
153
PARALLEL SESSION 2A: LAND USE 8 th Int. Conference on <strong>LCA</strong> <strong>in</strong> the<br />
Agri-<strong>Food</strong> Sector, 1-4 Oct <strong>2012</strong><br />
Commonwealth of Australia, Canberra. Viewed 5 October 2010 .<br />
ARUP, 2010a. Greenhouse Gas Emissions Snapshot: 2036 M<strong>et</strong>ropolitan Plan Review. NSW Department of Plann<strong>in</strong>g, Sydney.<br />
ARUP, 2010b. World Lead<strong>in</strong>g Practice <strong>in</strong> Emissions Reductions - Spatial Policy. NSW Department of Plann<strong>in</strong>g, Sydney.<br />
Brandao, M. 2010. <strong>Food</strong> or fuel: how to best use land, <strong>in</strong>: Proceed<strong>in</strong>gs of <strong>LCA</strong> food 2010, vol. 1, pp. 59-64.<br />
Camagni, R., Gibelli, M.C., Rigamonti, P. 2002. Urban mobility and urban form: the social and environmental costs of different<br />
patterns of urban expansion. Ecol. Econ. 40, 199-216.<br />
Choy, D.L., Sutherland, C., Gleeson, B., Sipe, N., Dodson, J., 2008. Change and Cont<strong>in</strong>uity <strong>in</strong> Peri-urban Australia: Peri-urban Futures<br />
& Susta<strong>in</strong>able Development. Griffith University, Brisbane.<br />
Condon, P.M., Mull<strong>in</strong>ix, K., Fallick, A., Harcourt, M., 2010. Agriculture on the edge:strategies to abate urban encroachment onto<br />
agricultural lands by promot<strong>in</strong>g viable human-scale agriculture as an <strong>in</strong>tegral element of urbanization. Int. J. Agr. Susta<strong>in</strong>. 8, 104-<br />
15.<br />
Crawford, R., Fuller, R., 2011. Energy and greenhouse gas emissions implications of alternative hous<strong>in</strong>g types for Australia. Paper<br />
presented to State of Australian Cities (SOAC) National Conference, Melbourne, Australia, 29 November - 2 December 2011.<br />
Viewed 28 March <strong>2012</strong> .<br />
Crawford, R.H., 2011. Life cycle assessment <strong>in</strong> the built environment. Spon Press, Oxon, USA.<br />
Dart Energy, 2011. NSW Mark<strong>et</strong> Overview. Dart Energy. Viewed 11 May <strong>2012</strong>,<br />
.<br />
Duffy, A., 2009. Land use plann<strong>in</strong>g <strong>in</strong> Ireland - a life cycle energy analysis of recent residential development <strong>in</strong> the Greater Dubl<strong>in</strong><br />
Area. Int. J. Life Cycle Ass. 14, 268-77.<br />
Fuller, R., Crawford, R., 2011. Impact of past and future residential hous<strong>in</strong>g development patterns on energy demand and related<br />
emissions. J. Hous.and the Built Environ. 26, 165-83.<br />
Garnaut, R., 2008. The Garnaut Climate Change Review. Viewed 9 May <strong>2012</strong>, .<br />
Houston, P., 2005. Re-valu<strong>in</strong>g the fr<strong>in</strong>ge: Some f<strong>in</strong>d<strong>in</strong>gs on the value of agricultural production <strong>in</strong> Australia's peri-urban regions.<br />
Geogr. Res. 43, 209-23.<br />
Marton, S., Kägi, T., W<strong>et</strong>tste<strong>in</strong>, D., 2010. Lower global warm<strong>in</strong>g potential of cucumbers and l<strong>et</strong>tuce from a greenhouse heated by<br />
waste heat, <strong>in</strong>: <strong>LCA</strong> <strong>Food</strong> Conference Proceed<strong>in</strong>gs, Bari, Italy, vol. 1, pp. 531-6.<br />
Milà i Canals, L., Muñoz, I., Hospido, A., Plassman, K., McLaren, S., 2008. Life Cycle Assessment (<strong>LCA</strong>) of domestic vs. imported<br />
veg<strong>et</strong>ables. Centre for Environmental Strategy, University of Surrey, Guildford, UK.<br />
NSW Department of Plann<strong>in</strong>g 2010, M<strong>et</strong>ropolitan Plan for Sydney 2036, NSW Department of Plann<strong>in</strong>g, viewed 19 May 2010,<br />
.<br />
O'Halloran, N., Fisher, P., Rab, A., 2008. Veg<strong>et</strong>able Industry Carbon Footpr<strong>in</strong>t Scop<strong>in</strong>g Study Discussion Paper 4: Prelim<strong>in</strong>ary estimation<br />
of the carbon footpr<strong>in</strong>t of the Australian veg<strong>et</strong>able <strong>in</strong>dustry, VG08107: Viewed 19 April 2011,<br />
.<br />
OECD, 1999. 505.4 Bill of quantities for an apartment: Eurostat-OECD PPP Programme 1999 Comparison of construction prices for<br />
residential build<strong>in</strong>gs, vol. rev. 12-89. Viewed 1 May <strong>2012</strong>,<br />
.<br />
Rossi, B., Marique, A.F., Reiter, S., <strong>2012</strong>. Life-cycle assessment of residential build<strong>in</strong>gs <strong>in</strong> three different European locations, case<br />
study. Build. Environ. 51, 402-7.<br />
van Veenhuizen, R., Danso, G., 2007. Profitability and susta<strong>in</strong>ability of urban and peri-urban agriculture. FAO, Rome.<br />
154
PARALLEL SESSION 2B: EMISSIONS MODELLING 8 th Int. Conference on <strong>LCA</strong> <strong>in</strong> the<br />
Parallel session 2b: Emissions Mode ll<strong>in</strong>g<br />
Agri-<strong>Food</strong> Sector, 1-4 Oct <strong>2012</strong><br />
Soil, climate and cropp<strong>in</strong>g system effects on N2O account<strong>in</strong>g <strong>in</strong> the<br />
<strong>LCA</strong> of faba bean and cereals<br />
Pi<strong>et</strong>ro Goglio 1, 2,* , Carol<strong>in</strong>e Colnenne-David 3,4 , Claudia Di Bene 2 , Simona Bosco 2 , Patricia Laville 1 , Roma<strong>in</strong><br />
Roche 1 , Giorgio Ragagl<strong>in</strong>i 2 , Thierry Doré 4,3 , Marco Mazzonc<strong>in</strong>i 5,6 , Benoit Gabrielle 1 , Enrico Bonari 2<br />
1<br />
UMR INRA-AgroParisTech Environnement <strong>et</strong> Grandes Cultures, 78850 Thiverval-Grignon, <strong>France</strong><br />
2<br />
Landlab, Institute of Life Sciences, Scuola Superiore Sant’Anna, Via Santa Cecilia 3, 56127 Pisa, Italy<br />
3<br />
INRA, UMR 211, BP 01, 78850 Thiverval-Grignon, <strong>France</strong><br />
4<br />
AgroParisTech, UMR 211, BP 01, 78850 Thiverval-Grignon, <strong>France</strong><br />
5<br />
Dipartimento di Agronomia e Gestione dell’Agroecosistema, Faculty of Agriculture, University of Pisa, Via San Michele degli<br />
Scalzi, 2, 56124 Pisa, Italy<br />
6<br />
CIRAA Interdepartimental Centre for Agroenvironmental Research, via Vecchia di Mar<strong>in</strong>a, 6, 56122 San Piero a Grado Pisa, Italy<br />
*<br />
Correspond<strong>in</strong>g author. E-mail: pgoglio@grignon.<strong>in</strong>ra.fr, p.goglio@sssup.it<br />
ABSTRACT<br />
Greenhouse gas (GHG) emissions from soils cause uncerta<strong>in</strong>ties with<strong>in</strong> Agricultural <strong>LCA</strong>. N 2O affects global warm<strong>in</strong>g and is estimated<br />
with IPCC guidel<strong>in</strong>es, agroecosystem models or direct measurements. CERES-EGC model was used to estimate N2O emissions<br />
from faba bean and w<strong>in</strong>ter cereals grown <strong>in</strong> two trials (ICC and CIMAS) with different climates. Model outputs were compared<br />
with IPCC estimates. Simulated N2O emission patterns showed that emissions can be <strong>in</strong>dependent from fertiliser application dates or<br />
rates. This was due to soil moisture, farm<strong>in</strong>g practices such as fertiliser applications and tillage. Results showed the IPCC procedure<br />
estimated higher annual cereals emissions of 740 g N2O-N ha -1 y -1 than simulation results and a lower estimation of 304 g N2O-N ha -1<br />
y -1 for faba bean. Results revealed <strong>in</strong>clusion of climate, soil properties and management resulted <strong>in</strong> major variations of N2O emissions<br />
which CERES-EGC was able to capture. Thus, model estimates may <strong>in</strong>crease accuracy of soil GHG emission <strong>in</strong> Agricultural<br />
<strong>LCA</strong>.<br />
Keywords: agricultural <strong>LCA</strong>, N2O emissions, CERES-EGC model, cereals, faba bean<br />
1. Introduction<br />
Agriculture contributed for 18% to the Greenhouse gases (GHG) emissions of <strong>France</strong> <strong>in</strong> 2010 and 7% for<br />
the Italian emission <strong>in</strong> the same year. Despite this contribution <strong>in</strong> both countries, the agricultural sector was<br />
responsible for 87% of nitrous oxide (N2O) total emissions <strong>in</strong> <strong>France</strong> and 69% <strong>in</strong> Italy (CITEPA, <strong>2012</strong>;<br />
Romano <strong>et</strong> al., <strong>2012</strong>). N2O has a global warm<strong>in</strong>g potential 298 times higher than carbon dioxide (Forster <strong>et</strong><br />
al., 2007).<br />
N2O emissions can be estimated with IPCC emissions factors, agroecosystem models or by direct field<br />
measurements. IPCC m<strong>et</strong>hodology is based on emissions factors and accounts for m<strong>in</strong>eral and organic fertiliser<br />
applications. It also considers crop residues decomposition, organic matter m<strong>in</strong>eralisation and other<br />
sources of organic nitrogen (N) (De Kle<strong>in</strong> <strong>et</strong> al., 2006). N2O emissions from cropp<strong>in</strong>g systems may also be<br />
directly measured <strong>in</strong> field trials us<strong>in</strong>g microm<strong>et</strong>eorological systems or chambers with either automatic or<br />
manual sampl<strong>in</strong>g (Hénault and Germon, 1995, 2000; Laville <strong>et</strong> al., 1999, 2011). N2O field emissions are hard<br />
to d<strong>et</strong>ect due to their low concentration variations; therefore high sensibility and costly <strong>in</strong>struments are<br />
needed. Thus, direct measurements are expensive and time consum<strong>in</strong>g and their use is restricted to a limited<br />
s<strong>et</strong> of experimental fields (Hast<strong>in</strong>gs <strong>et</strong> al., 2010; Laville <strong>et</strong> al., 2009; Roch<strong>et</strong>te and Eriksen-Hamel, 2008).<br />
Agroecosystem models simulate most of the processes govern<strong>in</strong>g N2O emissions and their controls.<br />
They may compare favourably with field observations for assess<strong>in</strong>g GHG emissions, but require d<strong>et</strong>ailed<br />
<strong>in</strong>puts and are complex to run (Del Grosso <strong>et</strong> al., 2008). For N2O emissions, DAYCENT, DNDC, CERES-<br />
EGC models have been extensively used for various types of ecosystems (Chen <strong>et</strong> al., 2008; Del Grosso <strong>et</strong><br />
al., 2008; Gabrielle and Gagnaire, 2008; Lehuger <strong>et</strong> al., 2009; Hast<strong>in</strong>gs <strong>et</strong> al., 2010). CERES-EGC was<br />
adapted from the CERES suite of soil-crop models (Jones and K<strong>in</strong>iry, 1986), with a focus on the simulation<br />
of environmental outputs such as N2O and NO to the atmosphere. It was tested and calibrated for these environmental<br />
impacts mostly with data com<strong>in</strong>g from Europe, with reasonable success due to a Bayesian calibration<br />
procedure that proved effective when test<strong>in</strong>g the model aga<strong>in</strong>st <strong>in</strong>dependent field data (Gabrielle and<br />
Gagnaire, 2008; Lehuger <strong>et</strong> al., 2009, 2011).<br />
N2O emissions, like all the other GHG emissions from soils, are a major source of uncerta<strong>in</strong>ties with<strong>in</strong><br />
Agricultural <strong>LCA</strong>, such as soil erosion, soil organic matter dynamics, biodiversity estimation (Gu<strong>in</strong>ée <strong>et</strong> al.,<br />
2009) and ecotoxicity (Margni <strong>et</strong> al., 2002; van Zelm <strong>et</strong> al., 2009). Indeed, <strong>in</strong> recent years <strong>LCA</strong> has been<br />
used for a wide range of agricultural systems and proved to be an effective assessment to evaluate environmental<br />
impacts (Nemecek <strong>et</strong> al., 2011a, 2011b; Goglio <strong>et</strong> al., <strong>2012</strong>). Notwithstand<strong>in</strong>g <strong>in</strong> most cases soil born<br />
emissions were estimated with the IPCC m<strong>et</strong>hod which often proved to be less accurate than agroecosystem<br />
models (Gabrielle and Gagnaire, 2008).<br />
155
PARALLEL SESSION 2B: EMISSIONS MODELLING 8 th Int. Conference on <strong>LCA</strong> <strong>in</strong> the<br />
Agri-<strong>Food</strong> Sector, 1-4 Oct <strong>2012</strong><br />
Here, the agro-ecosystem model CERES-EGC was used to estimate direct N2O emissions from faba bean,<br />
wheat, durum wheat and barley crops grown <strong>in</strong> two experimental trials with different climates <strong>in</strong> <strong>France</strong> and<br />
Italy, consider<strong>in</strong>g also residues decomposition. Model outputs for direct N2O emissions were then compared<br />
with IPCC estimates <strong>in</strong> order to evaluate possible discrepancies b<strong>et</strong>ween the two m<strong>et</strong>hods (De Kle<strong>in</strong> <strong>et</strong> al.,<br />
2006).<br />
2. M<strong>et</strong>hods<br />
2.1. Field trials<br />
The first agronomical trial is the ICC (Innovative Crops with Constra<strong>in</strong>ts) trial, which started <strong>in</strong> 2008<br />
next to the NitroEurope trial, <strong>in</strong> the Paris area (less than 10 m of distance, geographic coord<strong>in</strong>ates for the ICC<br />
trial N 48.842° E 1.954°, NitroEurope N 48.844° E 1.951°). The soil is a silt loam with 24 g kg -1 soil of soil<br />
organic matter. Each cropp<strong>in</strong>g system, <strong>in</strong> the ICC trial, has three randomly distributed replicates (4000 m² <strong>in</strong><br />
area), bear<strong>in</strong>g each year three different crops <strong>in</strong> rotation. N2O measurements were carried out on two cropp<strong>in</strong>g<br />
systems: (1) the PHEP system, which aims at reach<strong>in</strong>g altog<strong>et</strong>her High Environmental Performances<br />
and Productivity and (2) a cropp<strong>in</strong>g system under a greenhouse gas mitigation constra<strong>in</strong>t (50%-GHG), aim<strong>in</strong>g<br />
at halv<strong>in</strong>g GHG emissions compared to the PHEP system, both by <strong>in</strong>creas<strong>in</strong>g C sequestration <strong>in</strong> the soil<br />
and decreas<strong>in</strong>g N2O emissions. Aside from GHG emissions, this system has to me<strong>et</strong> the same environmental<br />
criteria as the PHEP system. The latter cropp<strong>in</strong>g system was designed on the basis of the follow<strong>in</strong>g agronomical<br />
pr<strong>in</strong>ciples: to reduce N fertiliser <strong>in</strong>puts by <strong>in</strong>clud<strong>in</strong>g legumes <strong>in</strong> the rotation; to use crop vari<strong>et</strong>ies<br />
with high N use efficiency and a high level of resistance to diseases; to lengthen the duration of crop rotations;<br />
to <strong>in</strong>crease crop diversity. Instead <strong>in</strong> the 50%-GHG cropp<strong>in</strong>g system, GHG reduction is further enhanced<br />
with the follow<strong>in</strong>g farm<strong>in</strong>g practices: reduc<strong>in</strong>g systematically m<strong>in</strong>eral nitrogen fertiliser <strong>in</strong>puts with<br />
legumes both as cover crop and cash crop, extensively us<strong>in</strong>g cover crops to decrease the accumulation of soil<br />
nitrate and subsequent emissions of N2O from nitrate denitrification, utilis<strong>in</strong>g no tillage practices to avoid<br />
m<strong>in</strong>eralisation, <strong>in</strong>troduc<strong>in</strong>g rapeseed (Brassica napus L.) to reduce nitrate leach<strong>in</strong>g and the ensu<strong>in</strong>g emissions<br />
of N2O. Both cropp<strong>in</strong>g systems <strong>in</strong>clude as ma<strong>in</strong> crops faba bean (Vicia faba var m<strong>in</strong>or (Harz) Beck),<br />
wheat ((Triticum aestivum L.), however wheat was absent dur<strong>in</strong>g the 2010-2011 season <strong>in</strong> the 50%-GHG<br />
system) and barley (Hordeum vulgare L.).<br />
The second trial is CIMAS (Conventional vs Integrated Management Agricultural System) that was established<br />
near Pisa (N 43.662° E 10.299°). It has been extensively described <strong>in</strong> Nassi o Di Nasso (2011), here<br />
ma<strong>in</strong> aspects are summarised. The soil is a clay loam with 20 g kg -1 of organic matter. The trial is composed<br />
of two cropp<strong>in</strong>g systems (High Input, HI and Low Input, LI) which differ <strong>in</strong> fertiliser application rates and<br />
frequencies, herbicide (frequency and amount of active <strong>in</strong>gredients), pesticide treatment (frequency and<br />
amount) and tillage operations (reduction of deep tillage operations). The rotation <strong>in</strong>cluded faba bean and<br />
durum wheat (Triticum durum L.) (Nassi o Di Nasso <strong>et</strong> al., 2011).<br />
2.2. CERES-EGC model and IPCC m<strong>et</strong>hod account<strong>in</strong>g<br />
(Nassi o Di Nasso <strong>et</strong> al., 2011; Topp <strong>et</strong> al., 2011)<br />
CERES-EGC comprises sub-models for major processes govern<strong>in</strong>g the cycles of water, carbon and nitrogen<br />
<strong>in</strong> soil-crop systems. A physical sub-model simulates the transfer of heat, water and nitrate down the soil<br />
profile, as well as soil evaporation, plant water uptake and transpiration. The soil profile is constituted of<br />
seven soil layers (Gabrielle <strong>et</strong> al., 1995; Lehuger <strong>et</strong> al., 2009). A biological sub-model simulates crop growth<br />
and phenology. Nitrogen uptake is computed through a supply/demand scheme. For N-fix<strong>in</strong>g crops, a specific<br />
module was developed for nitrogen supply through nitrogen fixation. A micro-biological sub-model<br />
simulates turnover of organic matter. Direct field emissions of CO2, N2O, NO and NH3 <strong>in</strong>to the atmosphere<br />
are simulated with different gas modules (Lehuger <strong>et</strong> al., 2009). CERES-EGC runs on a daily time step, and<br />
hence was provided/fed with daily ra<strong>in</strong>fall; mean air temperature and Penman potential evapo-transpiration<br />
data taken from weather stations located less than 10 km away from the field trials under study for both trials.<br />
Residue <strong>in</strong>puts for the model, <strong>in</strong>clud<strong>in</strong>g nitrogen content were accounted accord<strong>in</strong>g to Lehuger<br />
<strong>et</strong> al., (2009).<br />
Simulated N2O emissions were cumulated and attributed follow<strong>in</strong>g two m<strong>et</strong>hods: (i) from harvest of the<br />
previous crop to harvest of the current crop, accord<strong>in</strong>g to Topp <strong>et</strong> al., (2011); (ii) from harvest of the previous<br />
crop to sow<strong>in</strong>g of the follow<strong>in</strong>g crop or the end of the year. The second option should allow for tak<strong>in</strong>g<br />
<strong>in</strong>to account residues decomposition emission. In fact, most of the N2O emissions occur dur<strong>in</strong>g autumn/w<strong>in</strong>ter<br />
when soil moisture tends to be higher due to ra<strong>in</strong>fall events which allow denitrification of nitrate<br />
produced from residues m<strong>in</strong>eralisation (Barton <strong>et</strong> al., 2011; Laville <strong>et</strong> al., 2011).<br />
156
PARALLEL SESSION 2B: EMISSIONS MODELLING 8 th Int. Conference on <strong>LCA</strong> <strong>in</strong> the<br />
Agri-<strong>Food</strong> Sector, 1-4 Oct <strong>2012</strong><br />
The IPCC m<strong>et</strong>hod is based on emission factors which take <strong>in</strong>to account a series of farm<strong>in</strong>g practices and<br />
land uses. It considers both direct and <strong>in</strong>direct emissions from managed soils. The IPCC m<strong>et</strong>hodology estimates<br />
N2O emissions us<strong>in</strong>g human-<strong>in</strong>duced n<strong>et</strong> N additions to soils (e.g. <strong>in</strong> particular N content <strong>in</strong> synth<strong>et</strong>ic<br />
or organic fertilisers, deposited manure, crop residues, sewage sludge) (Table 1), or of m<strong>in</strong>eralisation of N <strong>in</strong><br />
soil organic matter follow<strong>in</strong>g dra<strong>in</strong>age/management of organic soils, or cultivation/land-use change on m<strong>in</strong>eral<br />
soils (e.g. Forest Land/Grassland/S<strong>et</strong>tlements converted to Cropland)(De Kle<strong>in</strong> <strong>et</strong> al., 2006). Residues<br />
amounts were estimated us<strong>in</strong>g the shoot to root ratio and harvest <strong>in</strong>dex from measured yields for both the<br />
ICC and the CIMAS trial (Giard<strong>in</strong>i, 2001). Nitrogen content of residues was accounted us<strong>in</strong>g factors from<br />
literature with measured yields (De Kle<strong>in</strong> <strong>et</strong> al., 2006; Jensen <strong>et</strong> al., 2010).<br />
3. Results<br />
Simulation results (Figure 1 and 2) showed clearly that most of the emissions do occur dur<strong>in</strong>g fall follow<strong>in</strong>g<br />
residues decomposition. The effect of N fertiliser <strong>in</strong>put is very much limited, consider<strong>in</strong>g most of the<br />
emission dur<strong>in</strong>g spr<strong>in</strong>g period laid below 5 g N2O-N ha -1 d -1 . This is the result<strong>in</strong>g effect of very dry spr<strong>in</strong>g<br />
which kept the soil dry (less than 35.2 m 3 m -3 ). Indeed, the peaks follow<strong>in</strong>g fertiliser application (Abdalla <strong>et</strong><br />
al., 2009; Saggar, 2010), which might have been expected dur<strong>in</strong>g this period, did not occur.<br />
durum wheat<br />
Figure 1. Model results of the analysed period for durum wheat <strong>in</strong> CIMAS high <strong>in</strong>put system (from previous<br />
crop harvest to the end of the year); vertical l<strong>in</strong>es: full: date of fertiliser application, dashed: harvest dates<br />
faba bean<br />
Figure 2. Model results of the analysed period for faba bean <strong>in</strong> ICC 50%-GHG system (from previous crop<br />
harvest to sow<strong>in</strong>g of the follow<strong>in</strong>g); dashed vertical l<strong>in</strong>es: harvest dates<br />
Dur<strong>in</strong>g fall, a series of emission peaks occurred which were due to the coupled effect of residues decomposition<br />
and relatively high soil moisture. This is a common pattern for every crop present <strong>in</strong> the two trials,<br />
<strong>in</strong>clud<strong>in</strong>g faba bean plots where no N fertiliser was applied. Dur<strong>in</strong>g fall-w<strong>in</strong>ter, ra<strong>in</strong>fall events are more frequent<br />
and <strong>in</strong>tense caus<strong>in</strong>g soil moisture to rema<strong>in</strong> high (>20 m 3 m -3 for some sampl<strong>in</strong>g dates) allow<strong>in</strong>g denitrification<br />
(Figures 1 and 2).<br />
Results showed that the IPCC procedure estimated higher annual emissions for cereals of 740 g N2O-N<br />
ha -1 y -1 (428 g N2O-N ha -1 y -1 <strong>in</strong>clud<strong>in</strong>g post harvest periods) on average compared to simulation results and<br />
lower estimation of 304 g N2O-N ha -1 y -1 (609 g N2O-N ha -1 y -1 <strong>in</strong>clud<strong>in</strong>g post harvest periods) for faba bean<br />
(Table 1). Disregard<strong>in</strong>g crops, the highest difference b<strong>et</strong>ween CERES-EGC simulations and IPCC estimates<br />
157
PARALLEL SESSION 2B: EMISSIONS MODELLING 8 th Int. Conference on <strong>LCA</strong> <strong>in</strong> the<br />
Agri-<strong>Food</strong> Sector, 1-4 Oct <strong>2012</strong><br />
was due to the ICC trial with 361 g N2O-N ha -1 y -1 , exclud<strong>in</strong>g residues; while more limited discrepancies<br />
resulted from the CIMAS trial (170 g N2O-N ha -1 y -1 as difference of absolute values b<strong>et</strong>ween model and<br />
IPCC figures). Includ<strong>in</strong>g residues with both m<strong>et</strong>hods, the opposite trend occurred with a greater gap for the<br />
CIMAS trial than the ICC but with lower values for both (67 g N2O-N ha -1 y -1 and 159 g N2O-N ha -1 y -1 for<br />
ICC and CIMAS, respectively).<br />
Table 1: Amounts of N fertiliser applied and estimated N2O-N emissions with the two m<strong>et</strong>hods: CERES-<br />
EGC and IPCC (cumulated values over the season were reported over a year period)<br />
Crop Trial<br />
Cropp<strong>in</strong>g<br />
system<br />
N applied<br />
with fertiliser<br />
(kg N ha -1 )<br />
CERES-EGC<br />
N2O-N<br />
emissions (g<br />
ha -1 y -1 )<br />
CERES-EGC N2O-<br />
N emissions (g ha -1<br />
y -1 ) <strong>in</strong>clud<strong>in</strong>g post<br />
harvest period<br />
IPCC N2O-<br />
N emissions<br />
(g ha -1 y -1 )<br />
W<strong>in</strong>ter Wheat ICC PHEP 90a 1791 1976 2380<br />
Barley ICC PHEP 60a 533 723 1542<br />
Barley ICC 50%GHG 80a 312 460 1755<br />
Faba bean ICC PHEP 0 1163 1480 659<br />
Faba bean ICC 50%GHG 0 1246 1871 512<br />
Durum Wheat CIMAS HI 92b +52c 1481 1987 2140<br />
Durum Wheat CIMAS LI 46b +26c 1363 1894 1361<br />
Faba bean CIMAS HI 0 727 876 776<br />
Faba bean CIMAS LI 0 707 836 681<br />
a NH4NO3 N content 33.5%; b Urea N content 46%; c NH4NO3 N content 26%<br />
Cumulated values estimated here showed clearly that the PHEP emissions were on average 1.08-1.32 fold<br />
higher than the 50%-GHG, while HI emissions were 1.06-1.36 fold higher than LI with CERES-EGC, depend<strong>in</strong>g<br />
on the estimation m<strong>et</strong>hod. Higher differences were reported for cereal (on average for all the m<strong>et</strong>hods<br />
24%) than for faba bean (mean value among the three m<strong>et</strong>hods 11%) (Table 1).<br />
4. Discussion<br />
N2O emission patterns obta<strong>in</strong>ed here were <strong>in</strong> agreement with previous works carried out <strong>in</strong> Grignon both<br />
with model and cont<strong>in</strong>uous chamber measurements (Laville <strong>et</strong> al., 2011). The pattern obta<strong>in</strong>ed for the simulation<br />
underl<strong>in</strong>ed the effect of crop residues on the overall N2O emission which is confirmed by other studies<br />
(Barton <strong>et</strong> al., 2011; P<strong>et</strong>ersen <strong>et</strong> al., 2011). The effect of residues is also dependent on the farm<strong>in</strong>g practice of<br />
the follow<strong>in</strong>g crop, therefore farm management effects on N2O emissions can be b<strong>et</strong>ter understood when the<br />
evaluation is carried out at cropp<strong>in</strong>g system scale (Mazzonc<strong>in</strong>i <strong>et</strong> al., 2008; P<strong>et</strong>ersen <strong>et</strong> al., 2011; Goglio <strong>et</strong><br />
al., <strong>2012</strong>).<br />
Regard<strong>in</strong>g fertiliser application, it appears from our elaboration that this farm<strong>in</strong>g practice had little effect<br />
on N2O emissions, probably <strong>in</strong> result of a very dry period. Indeed, for the ICC trial, dur<strong>in</strong>g spr<strong>in</strong>g 2011, the<br />
total precipitations dur<strong>in</strong>g February-May period was 88 mm, when monthly average should be around 50<br />
mm. The same happened for the CIMAS trial, where the total cumulated precipitations <strong>in</strong> March-May period<br />
were 154 mm concentrated <strong>in</strong> March; while commonly they are mostly concentrated <strong>in</strong> April and they are 30<br />
mm greater (Nassi o Di Nasso <strong>et</strong> al., 2011). Under these conditions, N2O peak emissions would not occur<br />
because of reduced bacterial activity (Bateman and Baggs, 2005; Szukics <strong>et</strong> al., 2010). Indeed, N2O is emitted<br />
when the soil is w<strong>et</strong> with WFPS (Water Filled Pore Space) comprised b<strong>et</strong>ween 55%-70%, depend<strong>in</strong>g on<br />
soil type (Bateman and Baggs, 2005; Szukics <strong>et</strong> al., 2010). Due to limited ra<strong>in</strong>fall, these soil moisture conditions<br />
were partially m<strong>et</strong> (
PARALLEL SESSION 2B: EMISSIONS MODELLING 8 th Int. Conference on <strong>LCA</strong> <strong>in</strong> the<br />
Agri-<strong>Food</strong> Sector, 1-4 Oct <strong>2012</strong><br />
tems (Gu<strong>in</strong>ée <strong>et</strong> al., 2009). Nevertheless, <strong>in</strong>put requirements to run the model might be a limitation of its use<br />
for <strong>LCA</strong> of agricultural systems (Del Grosso <strong>et</strong> al., 2008).<br />
5. Conclusion<br />
The present work showed that CERES-EGC simulations both with and without residue decomposition<br />
presented a major difference <strong>in</strong> N2O emissions estimates with the IPCC procedure. These variations were<br />
ma<strong>in</strong>ly due to the <strong>in</strong>teraction of soil and climatic conditions with farm<strong>in</strong>g practice. In particular, the N fertiliser<br />
application resulted <strong>in</strong> a low effect on N2O emissions <strong>in</strong> dry conditions. On the contrary, most of the<br />
emissions were due to residue decomposition.<br />
Despite its limits due to data needed to run the model, CERES-EGC was able to take <strong>in</strong>to account the <strong>in</strong>teraction<br />
b<strong>et</strong>ween farm<strong>in</strong>g practices, climate and soil characteristics. Thus its use will improve precision <strong>in</strong><br />
the estimation of environmental impacts due to the cultivation phase of agricultural <strong>LCA</strong>.<br />
6. References<br />
Abdalla, M., Jones, M., Ambus, P., Williams, M., 2009. Emissions of nitrous oxide from Irish arable soils: effects of tillage and<br />
reduced N <strong>in</strong>put. Nutr. Cycl. Agroecosyst. 86, 53–65.<br />
Barton, L., Butterbach-Bahl, K., Kiese, R., Murphy, D.V., 2011. Nitrous oxide fluxes from a gra<strong>in</strong>-legume crop (narrow-leafed lup<strong>in</strong>)<br />
grown <strong>in</strong> a semiarid climate. Glob. Chang. Biol. 17, 1153–1166.<br />
Bateman, E.J., Baggs, E.M., 2005. Contributions of nitrification and denitrification to N2O emissions from soils at different waterfilled<br />
pore space. Biol. Fertil. Soils 41, 379–388.<br />
Chen, D., Li, Y., Grace, P., Mosier, A.R., 2008. N2O emissions from agricultural lands: a synthesis of simulation approaches. Plant<br />
Soil 309, 169–189.<br />
CITEPA, <strong>2012</strong>. Rapport Nationale d’<strong>in</strong>ventaire pour la <strong>France</strong> au titre de la Convention cadre des Nations Unies sur les Changements<br />
Climatiques <strong>et</strong> du Protocol de Kyoto. CITEPA Centre Interprofessional Technique d’Etudes de la Pollution Atmosphérique,<br />
Paris.<br />
Forster, P., Ramaswamy, V., Artaxo, P., Berntsen, T., B<strong>et</strong>ts, R., Fahey, D.W., Haywood, J., Lean, J., Lowe, D.C., Myhre, G.,<br />
Nganga, J., Pr<strong>in</strong>n, R., Raga, G., Schulz, M., Van Dorland, R., 2007. Changes <strong>in</strong> Atmospheric Constituents and <strong>in</strong> Radiative Forc<strong>in</strong>g,<br />
<strong>in</strong>: Solomon, S., Q<strong>in</strong>, D., Mann<strong>in</strong>g, M., Chen, Z., Marquis, M., Averyt, K.B., Tignor, M., Miller, H.L. (Eds.), Climate<br />
Change 2007: The Physical Science Basis. Contribution of Work<strong>in</strong>g Group I to the Fourth Assessment Report of the Intergovernmental<br />
Panel on Climate Change. Cambridge University Press, Cambridge, and New York, pp. 129–234.<br />
Gabrielle, B., Gagnaire, N., 2008. Life-cycle assessment of straw use <strong>in</strong> bio-<strong>et</strong>hanol production: A case study based on biophysical<br />
modell<strong>in</strong>g. Biomass Bioenerg. 32, 431–441.<br />
Gabrielle, B., Menasseri, S., Houot, S., 1995. Analysis and field-evaluation of the CERES models water-balance component. Soil<br />
Sci. Soc. Am. J. 19, 1403–1412.<br />
Giard<strong>in</strong>i, L., 2001. Agronomia generale, ambientale e aziendale. Pàtron editore, Bologna.<br />
Goglio, P., Bonari, E., Mazzonc<strong>in</strong>i, M., <strong>2012</strong>. <strong>LCA</strong> of cropp<strong>in</strong>g systems with different external <strong>in</strong>put levels for energ<strong>et</strong>ic purposes.<br />
Biomass Bioenerg. 42, 33–42.<br />
Del Grosso, S.J., Halvorson, A.D., Parton, W.J., 2008. Test<strong>in</strong>g DAYCENT Model Simulations of Corn Yields and Nitrous Oxide<br />
Emissions <strong>in</strong> Irrigated Tillage Systems <strong>in</strong> Colorado. J. Environ. Qual. 37, 1383–1389.<br />
Gu<strong>in</strong>ée, J.B., Heijungs, R., Vo<strong>et</strong>, E., 2009. A greenhouse gas <strong>in</strong>dicator for bioenergy: some theor<strong>et</strong>ical issues with practical implications.<br />
Int. J. Life Cycle Assess. 14, 328–339.<br />
Hast<strong>in</strong>gs, A.F., Wattenbach, M., Eugster, W., Li, C., Buchmann, N., Smith, P., 2010. Uncerta<strong>in</strong>ty propagation <strong>in</strong> soil greenhouse gas<br />
emission models: An experiment us<strong>in</strong>g the DNDC model and at the Oens<strong>in</strong>gen cropland site. Agr. Ecosyst. Environ. 136, 97–<br />
110.<br />
Hénault, C., Germon, J., 1995. Quantification de la dénitrification <strong>et</strong> des émissions de protoxyde d’azote (N2O) par les sols.<br />
Agronomie 15, 321–355.<br />
Hénault, C., Germon, J.C., 2000. NEMIS, a predictive model of denitrification on the field scale. Eur. J. Soil Sci. 51, 257–270.<br />
Jensen, E.S., Peoples, M.B., Hauggaard-Nielsen, H., 2010. Faba bean <strong>in</strong> cropp<strong>in</strong>g systems. Field Crop. Res. 115, 203–216.<br />
Jones, C.A., K<strong>in</strong>iry, J.R., 1986. Ceres-N Maize: a simulation model of maize growth and development., A&M University Press,<br />
College Station. ed. Temple, TX: Texas.<br />
De Kle<strong>in</strong>, C., Novoa, R.S.A., Ogle, S., Smith, K.A., Roch<strong>et</strong>te, P., Wirth, T.C., McConkey, B.G., Mosier, A., Rypdal, K., Walsh, M.,<br />
Williams, S.A., 2006. Chapter 11: N2O Emissions from Managed Soils, and CO2 Emissions from Lime and Urea Application, <strong>in</strong>:<br />
Gytarsky, M., Hiraishi, T., Irv<strong>in</strong>g, W., Krug, T., Penman, J. (Eds.), 2006 IPCC Guidel<strong>in</strong>es for National Greenhouse Gas Inventories.<br />
IPCC International Panel on Climate Change, Geneva, pp. 4:11.1–11.54.<br />
Laville, P., Jambert, C., Cellier, P., Delmas, R., 1999. Nitrous oxide fluxes from a fertilised maize crop us<strong>in</strong>g microm<strong>et</strong>eorological<br />
and chamber m<strong>et</strong>hods. Agricultural and Forest M<strong>et</strong>eorology 96, 19–38.<br />
Laville, P., Lehuger, S., Loub<strong>et</strong>, B., Chaumart<strong>in</strong>, F., Cellier, P., 2011. Effect of management, climate and soil conditions on N2O and<br />
NO emissions from an arable crop rotation us<strong>in</strong>g high temporal resolution measurements. Agr. Forest. M<strong>et</strong>eorol. 151, 228–240.<br />
Lehuger, S., Gabrielle, B., Laville, P., Lamboni, M., Loub<strong>et</strong>, B., Cellier, P., 2011. Predict<strong>in</strong>g and mitigat<strong>in</strong>g the n<strong>et</strong> greenhouse gas<br />
emissions of crop rotations <strong>in</strong> Western Europe. Agr. Forest M<strong>et</strong>eorol. 151, 1654–1671.<br />
Lehuger, S., Gabrielle, B., van Oijen, M., Makowski, D., Germon, J.-C., Morvan, T., Hénault, C., 2009. Bayesian calibration of the<br />
nitrous oxide emission module of an agro-ecosystem model. Agr. Ecosys. Environ. 133, 208–222.<br />
Margni, M., Rossier, D., Cr<strong>et</strong>taz, P., Jolli<strong>et</strong>, O., 2002. Life cycle impact assessment of pesticides on human health and ecosystems.<br />
Agr. Ecosyst. Env. 93, 379–392.<br />
Mazzonc<strong>in</strong>i, M., Di Bene, C., Coli, A., Antichi, D., P<strong>et</strong>ri, M., Bonari, E., 2008. Ra<strong>in</strong>fed Wheat and Soybean Productivity <strong>in</strong> a Long-<br />
Term Tillage Experiment <strong>in</strong> Central Italy. Agron. J. 100, 1418–1429.<br />
159
PARALLEL SESSION 2B: EMISSIONS MODELLING 8 th Int. Conference on <strong>LCA</strong> <strong>in</strong> the<br />
Agri-<strong>Food</strong> Sector, 1-4 Oct <strong>2012</strong><br />
Nassi o Di Nasso, N., Bosco, S., Di Bene, C., Coli, A., Mazzonc<strong>in</strong>i, M., Bonari, E., 2011. Energy efficiency <strong>in</strong> long-term Mediterranean<br />
cropp<strong>in</strong>g systems with different management <strong>in</strong>tensities. Energy 36, 1924–1930.<br />
Nemecek, T., Dubois, D., Huguen<strong>in</strong>-Elie, O., Gaillard, G., 2011a. Life cycle assessment of Swiss farm<strong>in</strong>g systems: I. Integrated and<br />
organic farm<strong>in</strong>g. Agr. Syst. 104, 217–232.<br />
Nemecek, T., Huguen<strong>in</strong>-Elie, O., Dubois, D., Gaillard, G., Schaller, B., Cherv<strong>et</strong>, A., 2011b. Life cycle assessment of Swiss farm<strong>in</strong>g<br />
systems: II. Extensive and <strong>in</strong>tensive production. Agr. Syst. 104, 233–245.<br />
P<strong>et</strong>ersen, S.O., Mutegi, J.K., Hansen, E.M., Munkholm, L.J., 2011. Tillage effects on N2O emissions as <strong>in</strong>fluenced by a w<strong>in</strong>ter cover<br />
crop. Soil Biol. Biochem. 43, 1509–1517.<br />
Romano, D., Arcarese C, Bern<strong>et</strong>ti A, Caputo A, Condor D R, Contaldi M, De Laur<strong>et</strong>is R, Di Cristofaro E, Federici S, Gagna A,<br />
Gonella B, Lena, F., Liburdi R, Taur<strong>in</strong>o E, Vitullo M, <strong>2012</strong>. Italian Greenhouse Gas Inventory 1990-<strong>2012</strong> National Inventory<br />
Report <strong>2012</strong>. ISPRA Institute for Environmental Protection and Research, Varese.<br />
Saggar, S., 2010. Estimation of nitrous oxide emission from ecosystems and its mitigation technologies. Agr. Ecosyst. Environ. 136,<br />
189–191.<br />
Szukics, U., Abell, G.C.J., Hödl, V., Mitter, B., Sessitsch, A., Hackl, E., Zechmeister-Boltenstern, S., 2010. Nitrifiers and denitrifiers<br />
respond rapidly to changed moisture and <strong>in</strong>creas<strong>in</strong>g temperature <strong>in</strong> a prist<strong>in</strong>e forest soil. FEMS Microb. Ecol. 72, 395–406.<br />
Topp, C.F.E., Tolkamp, B.J., Houdijk, J.G.M., Stephen, K.L., Kyriazakis, I., 2011. Environmental analysis of pig production systems:<br />
the production of home-grown prote<strong>in</strong>s. Presented at the Nitroeurope 2011 conference, Edimbourgh.<br />
van Zelm, R., Huijbregts, M., Posthuma, L., W<strong>in</strong>tersen, A., van de Meent, D., 2009. Pesticide ecotoxicological effect factors and<br />
their uncerta<strong>in</strong>ties for freshwater ecosystems. Int. J. Life Cycle Assess. 14, 43–51.<br />
160
PARALLEL SESSION 2B: EMISSIONS MODELLING 8 th Int. Conference on <strong>LCA</strong> <strong>in</strong> the<br />
Agri-<strong>Food</strong> Sector, 1-4 Oct <strong>2012</strong><br />
Us<strong>in</strong>g a model-based <strong>LCA</strong> to explore options for reduc<strong>in</strong>g national<br />
greenhouse gas emissions from crop and livestock production systems<br />
Eric Audsley 1,* , Mike Wilk<strong>in</strong>son 2<br />
1 Centre for Environmental Risks and Futures, School of Applied Sciences, Cranfield University, Bedford, MK43 0AL, UK.<br />
2 School of Biosciences, University of Nott<strong>in</strong>gham, Sutton Bon<strong>in</strong>gton Campus, Loughborough, Leicestershire, LE12 5RD, UK..<br />
Correspond<strong>in</strong>g author. E-mail: e.audsley@cranfield.ac.uk<br />
ABSTRACT<br />
Agriculture has a devolved commitment to reduce national greenhouse gas emissions (GHGE). Us<strong>in</strong>g a model-based <strong>LCA</strong> we<br />
explored GHGE-reduc<strong>in</strong>g options <strong>in</strong> systems used to produce twelve crop and seven livestock commodities. With a functional unit<br />
of kg of product, GHGE differences b<strong>et</strong>ween crops reflect differences <strong>in</strong> yield. M<strong>et</strong>abolisable energy (ME) or crude prote<strong>in</strong> (CP)<br />
could be used, but deriv<strong>in</strong>g an economic value of £8.6/GJ ME and £0.62/kg CP, leads to a relatively consistent 2.6 kg CO2e/£ nutrient<br />
value. Potential GHGE reductions ranged from 2% (sugar be<strong>et</strong>) to 15% (cereals) with husbandry changes, and 4 to 12% with<br />
<strong>in</strong>creased crop yields. The best alternative livestock systems reduced GHGE rang<strong>in</strong>g b<strong>et</strong>ween 7% (beef from the dairy herd) and<br />
21% (extensive sheep meat). Half of the options reduce national production hence <strong>in</strong>crease imports. No-till <strong>in</strong>creases pesticide use.<br />
Overall, improvements <strong>in</strong> productivity and efficiency of resource use are the best options for reduc<strong>in</strong>g GHGE.<br />
Keywords: policy, global warm<strong>in</strong>g potential, crops, livestock<br />
1. Introduction<br />
Governments have made <strong>in</strong>ternational commitments to reduce greenhouse gas emissions (GHGE) and the<br />
United K<strong>in</strong>gdom government has s<strong>et</strong> a targ<strong>et</strong> of an 80% reduction <strong>in</strong> emissions of GHGE by the year 2050<br />
compared to the basel<strong>in</strong>e of 1990 (Office of Public Sector Information, 2011). These have been devolved to<br />
equivalent commitments <strong>in</strong> each sector of the economy <strong>in</strong>clud<strong>in</strong>g agriculture. This paper exam<strong>in</strong>es the effects<br />
on GHGE of implement<strong>in</strong>g theor<strong>et</strong>ically a range of agronomic and livestock husbandry options <strong>in</strong> conventional<br />
systems of food production operated on farms <strong>in</strong> the UK with the sub-objective of not reduc<strong>in</strong>g the<br />
food produced with<strong>in</strong> the UK.<br />
2. M<strong>et</strong>hods<br />
A range of UK crop and livestock production systems was studied us<strong>in</strong>g the Cranfield system model<br />
based agricultural life-cycle analysis (<strong>LCA</strong>) (Williams <strong>et</strong> al., 2006). Burdens are expressed <strong>in</strong> terms of the<br />
functional unit, <strong>in</strong> this case per kg of product fresh weight, per MJ of edible energy or per kg edible prote<strong>in</strong><br />
at the farm gate. The GHGE from post farm gate process<strong>in</strong>g of crops and livestock products are not <strong>in</strong>cluded<br />
<strong>in</strong> this analysis. This model-based <strong>LCA</strong> approach <strong>in</strong>cludes the impact of changes with<strong>in</strong> the farm system, for<br />
example a decrease <strong>in</strong> fertiliser <strong>in</strong>put reduces crop yield per hectare and long-term soil nitrogen. Equally, an<br />
<strong>in</strong>crease <strong>in</strong> the crop yield from plant breed<strong>in</strong>g requires additional fertiliser <strong>in</strong>put. A change <strong>in</strong> GHGE therefore<br />
represents the total effect of a change on the farm<strong>in</strong>g system. The m<strong>et</strong>hods and data <strong>in</strong>puts to the <strong>LCA</strong><br />
model have been described <strong>in</strong> d<strong>et</strong>ail for the production of bread wheat, oilseed rape and potatoes <strong>in</strong> England<br />
and Wales by Williams <strong>et</strong> al., (2010).<br />
Ten UK cropp<strong>in</strong>g systems were <strong>in</strong>cluded <strong>in</strong> the present study to cover the range of major agricultural food<br />
crops, the range <strong>in</strong> soil types, and a range of contrast<strong>in</strong>g agronomic practices. Typical cropp<strong>in</strong>g systems<br />
were def<strong>in</strong>ed <strong>in</strong> relation to soil texture, soil cultivation technique, straw <strong>in</strong>corporation, irrigation and the average<br />
total <strong>in</strong>put of nitrogen (N) per hectare (Table 1). The analysis also <strong>in</strong>cludes two non-UK feed crops –<br />
soya beans and maize gra<strong>in</strong>. The typical systems and their emissions were considered as basel<strong>in</strong>e (2005)<br />
values for agricultural GHGE. GHGE are expressed as a global warm<strong>in</strong>g potential (GWP100) <strong>in</strong> tonnes CO2<br />
equivalent (CO2e) per unit of product, us<strong>in</strong>g a 100 year time frame and the GWP values for gases from the<br />
Intergovernmental Panel on Climate Change (IPCC, 2006). For each system, emissions of nitrous oxide<br />
(N2O) were calculated us<strong>in</strong>g the IPCC Tier 1 m<strong>et</strong>hodology (IPCC, 2006). Other emissions such as carbon<br />
dioxide (CO2) and m<strong>et</strong>hane (CH4) were calculated systematically by consider<strong>in</strong>g each aspect of the system <strong>in</strong><br />
turn. Emissions associated with the production of imported fertilisers were calculated and <strong>in</strong>cluded <strong>in</strong> the<br />
analysis. The systems models d<strong>et</strong>erm<strong>in</strong>ed the new long-term steady state for the soil, but as the soil was <strong>in</strong><br />
steady state, no contribution was assumed for changes <strong>in</strong> the concentration of soil carbon. The proportion of<br />
soil types nationally (Table 1) rema<strong>in</strong>ed as a fixed constra<strong>in</strong>t. The typical composition of each crop product<br />
<strong>in</strong> terms of concentration of dry matter, energy and crude prote<strong>in</strong> is shown <strong>in</strong> Table 3.<br />
Table 1. Typical values for soil, cultivation and nitrogen <strong>in</strong>put for crop systems, Williams <strong>et</strong> al., 2006.<br />
161
PARALLEL SESSION 2B: EMISSIONS MODELLING 8 th Int. Conference on <strong>LCA</strong> <strong>in</strong> the<br />
Agri-<strong>Food</strong> Sector, 1-4 Oct <strong>2012</strong><br />
162<br />
Crop Soil type (%) Cultivations (%) Straw Irrig’n Total N Type of N fertiliser<br />
(%) (%) (kg/ha) (% of total )<br />
Clay Loam Sand Plough Red’d No-till Ammonium Urea<br />
tillage<br />
nitrate<br />
W<strong>in</strong>ter bread wheat 34 48 18 57 41 2 25 0 219 80 20<br />
W<strong>in</strong>ter feed wheat 34 48 18 57 41 2 25 0 204 82 18<br />
W<strong>in</strong>ter barley 22 54 24 57 41 2 85 0 163 82 18<br />
Spr<strong>in</strong>g barley 9 75 16 57 41 2 100 0 123 82 18<br />
W<strong>in</strong>ter oilseed rape 43 29 28 50 45 5 0 0 204 69 31<br />
Sugar be<strong>et</strong> 7 82 12 100 0 0 - 0 122 96 4<br />
Ma<strong>in</strong>-crop potatoes 7 82 12 100 0 0 - 56 191 96 4<br />
Second-early potatoes 7 82 12 100 0 0 - 48 171 96 4<br />
Field beans 39 33 28 57 43 0 0 0 0 - -<br />
Soya beans 30 28 42 27 53 20 - 0 0 - -<br />
Maize gra<strong>in</strong> 30 28 42 30 58 12 0 0 134 90 10<br />
Forage maize 55 16 29 57 41 2 - 0 212 90 10<br />
Table 2. Examples of the livestock systems modelled for each commodity (from Williams <strong>et</strong> al., 2006)<br />
Sector Milk<br />
18 to 20<br />
month<br />
beef<br />
Cereal<br />
beef<br />
Upland<br />
suckler<br />
beef<br />
Lowland<br />
suckler<br />
beef<br />
Upland<br />
sheep<br />
Lowland<br />
sheep<br />
Pig<br />
meat<br />
Poultry<br />
meat Eggs<br />
Spr<strong>in</strong>g Autumn<br />
Spr<strong>in</strong>g- Dairy calv<strong>in</strong>g, calv<strong>in</strong>g, Cross- Cross-bred Indoor<br />
Autumn born,dairy- cross-bred grass f<strong>in</strong>- w<strong>in</strong>ter bred hill from up- heavy Housed<br />
System<br />
calv<strong>in</strong>g bred bulls ish<strong>in</strong>g f<strong>in</strong>ish<strong>in</strong>g ewes land bacon Housed layers<br />
Days housed 190 180 399 182 182 0 30 126 42 385<br />
Concentrates (kg DM) 2047 960 2398 579 792 76 4<br />
80 4<br />
366 4.9 52<br />
Forage 1 (kg DM) 6792 2281 120 4982 4840 1018 902 - - -<br />
Live weight ga<strong>in</strong> (kg/day) - 0.90 1.23 0.88 1.03 0.17 0.19 0.56 0.06 -<br />
Output (kg/year) 7850 285 276 232 3<br />
225 3<br />
60 5<br />
63 5<br />
- - 14.8<br />
Slaughter Liveweight (kg) - 565 535 565 595 41 44 109 2.4 -<br />
Age at slaughter (months) - 19 13 20 18 7 to10 6 to 9 6.3 1.5 -<br />
Feed conversion ratio, 2<br />
kg DM/kg milk or ga<strong>in</strong><br />
1.13 6.23 5.14 10.7 10.2 18.2 15.6 2.89 1.76 3.06<br />
Longevity of breed<strong>in</strong>g<br />
females (years)<br />
3.2 - - 7 6.5 4.2 4.5 2.5 - 1.1<br />
Lambs f<strong>in</strong>ished off grass 0.35 0.58<br />
Manure as slurry (%) 88 18 18 0 0 0 0 35 0 25 6<br />
1 2 3<br />
Graz<strong>in</strong>g and conserved forage. kg total feed DM/kg milk, weight ga<strong>in</strong>, or output. Live weight of calf at<br />
wean<strong>in</strong>g. 4 Includes concentrates for f<strong>in</strong>ish<strong>in</strong>g store lambs. 5 Per ewe. 6 Proportion with belt-cleaned cages,<br />
rema<strong>in</strong>der on deep cages.<br />
Livestock systems were modelled as a series of component systems with<strong>in</strong> each commodity. There is a<br />
wide range <strong>in</strong> the total period of time the animals are housed. Similarly there is a wide range b<strong>et</strong>ween systems<br />
<strong>in</strong> terms of the <strong>in</strong>tensity of feed <strong>in</strong>puts, <strong>in</strong> output of animal products and <strong>in</strong> feed conversion ratios. Thus<br />
the range of modelled milk production systems <strong>in</strong>cluded autumn and spr<strong>in</strong>g calv<strong>in</strong>g with different <strong>in</strong>tensities<br />
of concentrate feed<strong>in</strong>g. Sheep systems <strong>in</strong>cluded hill, upland and lowland, pure and cross-bred flocks, with<br />
transfers of ewes and lambs b<strong>et</strong>ween the systems and the option of early lamb<strong>in</strong>g. Beef production <strong>in</strong>cluded<br />
suckler and dairy-sourced calves with different levels of f<strong>in</strong>ish<strong>in</strong>g based on their levels of grass and concentrates.<br />
The ma<strong>in</strong> components are shown <strong>in</strong> Table 2 for a range of systems. Inputs of concentrate and forage<br />
DM refer to the compl<strong>et</strong>e system and <strong>in</strong>clude both the dam and her offspr<strong>in</strong>g.<br />
3. Results and discussion<br />
3.1. Crops<br />
Typical GHGE are shown <strong>in</strong> Table 3. The range <strong>in</strong> GHGE b<strong>et</strong>ween crops is considerable, with oilseed<br />
rape and sugar be<strong>et</strong> hav<strong>in</strong>g the highest and lowest emissions per tonne of crop fresh weight, respectively.<br />
With a functional unit of kg of product, differences b<strong>et</strong>ween crops <strong>in</strong> GHGE per kg product reflected differences<br />
<strong>in</strong> yield per hectare. Standardis<strong>in</strong>g potato and sugar be<strong>et</strong> yields to 860 g DM/kg fresh weight to make<br />
them comparable with the cereal crops produces values of 0.59, 0.44 and 0.20 kg CO2e kg -1 for ma<strong>in</strong>-crop<br />
potatoes, second early potatoes and sugar be<strong>et</strong>, respectively. Forage maize had the lowest GHGE per kg of<br />
the cereal crops because, be<strong>in</strong>g harvested <strong>in</strong> its entir<strong>et</strong>y, it had a substantially higher yield per hectare than<br />
the other crops, though of lower quality. Options to unify crops are to use m<strong>et</strong>abolisable energy (ME) or
PARALLEL SESSION 2B: EMISSIONS MODELLING 8 th Int. Conference on <strong>LCA</strong> <strong>in</strong> the<br />
Agri-<strong>Food</strong> Sector, 1-4 Oct <strong>2012</strong><br />
crude prote<strong>in</strong> (CP) as the functional unit. This provides apparently more consistent GHGE per unit, but crops<br />
that produce ma<strong>in</strong>ly ME (sugar and potatoes) have a very low GHGE per unit ME, whereas crops which<br />
produce a high concentration of prote<strong>in</strong> have high GHGE per unit ME. GHGE per kg CP were higher than<br />
average for potatoes and sugar be<strong>et</strong> and lower than average for field and soya beans and forage maize. From<br />
the mark<strong>et</strong> price of all the crops (exclud<strong>in</strong>g potatoes), it can be estimated by regression that the economic<br />
value of a unit of ME is £8.6/GJ and CP is £0.62/kg, lead<strong>in</strong>g to a relatively consistent 2.6 kg CO2e/£ nutrient<br />
value with a smaller range. Nitrogen fix<strong>in</strong>g crops are slightly b<strong>et</strong>ter and high nitrogen crops slightly worse.<br />
Table 3. Greenhouse Gas Emissions (GHGE) of different crops and the effect of different functional units<br />
Crop Yield DM ME CP GHGE, kg CO2e per<br />
t/ha g/kg MJ/kg DM g/kg DM kg GJ ME kg CP £ value<br />
W<strong>in</strong>ter bread wheat 7.7 860 13.6 130 0.51 0.044 4.56 3.00<br />
W<strong>in</strong>ter feed wheat 8.1 860 13.6 116 0.46 0.039 4.61 2.83<br />
W<strong>in</strong>ter barley 6.5 860 13.2 123 0.42 0.037 3.97 2.57<br />
Spr<strong>in</strong>g barley 5.7 860 13.2 116 0.38 0.033 3.81 2.38<br />
W<strong>in</strong>ter oilseed rape 3.2 930 23.1 212 1.05 0.049 5.33 3.42<br />
Sugar be<strong>et</strong> 63 220 13.2 68 0.04 0.015 2.87 1.25<br />
Ma<strong>in</strong>-crop potatoes 52 200 13.3 93 0.14 0.053 7.53 2.57<br />
Second-early potatoes 48 200 13.3 93 0.10 0.038 5.38 2.90<br />
Field beans 3.4 860 13.3 298 0.51 0.045 1.99 1.98<br />
Soya beans 2.4 860 14.5 415 0.70 0.056 1.96 2.13<br />
Maize gra<strong>in</strong> 7.2 860 13.8 102 0.38 0.032 4.33 2.43<br />
Forage maize (DM) 11.2 280 11.0 101 0.30 0.027 2.97 1.91<br />
DM=dry matter, ME=m<strong>et</strong>abolisable energy, CP=crude prote<strong>in</strong>. Concentrations of DM, ME, CP from Thomas, 2004<br />
Table 4. Predicted yields and greenhouse gas emissions (GHGE) for typical crop systems and for agronomic<br />
options to reduce greenhouse gas emissions.<br />
Typical<br />
yield<br />
Crop<br />
1<br />
Yield with<br />
agronomic<br />
options 2 No-till + no 20% <strong>in</strong>-<br />
to Reduction Typical No-till + no straw <strong>in</strong>corporacrease <strong>in</strong><br />
reduce <strong>in</strong> yield system No-till straw <strong>in</strong>cortion + 20% crop yield<br />
GHGE (%)<br />
poration reduced N per hectare<br />
(tonnes fresh weight ha -1 ) GHGE (kg CO2e kg -1 W<strong>in</strong>ter bread wheat 7.7 7.0 9 0.51<br />
product fresh weight)<br />
0.50 0.46 0.42 0.48<br />
W<strong>in</strong>ter feed wheat 8.1 7.2 11 0.46 0.45 0.41 0.38 0.43<br />
W<strong>in</strong>ter barley 6.5 5.9 9 0.42 0.40 0.39 0.36 0.39<br />
Spr<strong>in</strong>g barley 5.7 5.2 9 0.38 0.35 - 0.32 0.36<br />
W<strong>in</strong>ter oilseed rape 3.2 2.9 9 1.05 - 1.03 0.97 0.95<br />
Sugar be<strong>et</strong> 63.0 58.1 8 0.043 - - 0.04 0.04<br />
Ma<strong>in</strong>-crop potatoes 4<br />
52.0 49.6 5 0.14 - - 0.13 0.13<br />
Second-early potatoes 5<br />
48.0 46.1 4 0.10 - - 0.10 0.09<br />
Field beans 3.4 3.3 4 0.51 0.46 - 0.46 0.46<br />
Soya beans 2.4 2.3 2 0.70 0.64 - 0.64 0.61<br />
Maize gra<strong>in</strong> 7.2 6.7 7 0.38 0.37 - 0.33 0.36<br />
Forage maize 11.2 3<br />
10.8 3<br />
4 0.30 0.29 - 0.26 0.29<br />
1 2 3 -1 4 5<br />
Systems as described <strong>in</strong> Table 1. See text. t DM ha . Cool-stored until May: weighted cool<strong>in</strong>g energy applied. No storage.<br />
Four crop husbandry options to reduce GHGE were considered: i) 20% decrease <strong>in</strong> applied N; ii) no-till<br />
(cereals and legumes only); iii) no straw <strong>in</strong>corporation and iv) irrigate all potatoes. Fresh weight yields for<br />
the typical cropp<strong>in</strong>g systems and for the options to reduce GHGE are shown <strong>in</strong> Table 4. These options to<br />
reduce GHGE also reduce crop yields but to a relatively small extent rang<strong>in</strong>g from 5% or less for potatoes,<br />
field beans, soya beans and forage maize to b<strong>et</strong>ween 7 and 11% for the other crops. Irrigation of ma<strong>in</strong>-crop<br />
potatoes was associated with a progressive reduction <strong>in</strong> GHGE, from 0.14 kg CO2e kg -1 without irrigation to<br />
0.13 kg CO2e kg -1 with 100% irrigation – a 6% decrease. However as the majority of potato crops are either<br />
irrigated or do not need irrigation, the overall potential reduction <strong>in</strong> GHGE is probably only about 1%.<br />
Although no-till is associated with reduced crop yield compared with plough<strong>in</strong>g, there is a reduction <strong>in</strong><br />
GHGE, ma<strong>in</strong>ly as a result of lower primary energy use. An exception is oilseed rape where the change to<br />
100% no-till is associated with an <strong>in</strong>crease <strong>in</strong> GHGE of 0.04 kg CO2e kg -1 because the relatively high yield<br />
penalty (13%) outweighs the sav<strong>in</strong>g on primary energy. The restrictions of apply<strong>in</strong>g the IPCC Tier 1 emission<br />
factors mean that the model assumes there were no changes <strong>in</strong> soil N2O emissions for different cultiva-<br />
163
PARALLEL SESSION 2B: EMISSIONS MODELLING 8 th Int. Conference on <strong>LCA</strong> <strong>in</strong> the<br />
Agri-<strong>Food</strong> Sector, 1-4 Oct <strong>2012</strong><br />
tion techniques. However there may be an <strong>in</strong>crease <strong>in</strong> N2O compared to the typical system because of <strong>in</strong>creased<br />
soil anaerobic conditions (Robertson <strong>et</strong> al., 2000).<br />
The ma<strong>in</strong> source of GHGE due to <strong>in</strong>corporat<strong>in</strong>g straw <strong>in</strong>to soil is N2O emission from soil dur<strong>in</strong>g the w<strong>in</strong>ter.<br />
The model d<strong>et</strong>erm<strong>in</strong>es the long-term steady state system for all processes. This <strong>in</strong>cludes nitrogen from<br />
the rotation, nitrate leach<strong>in</strong>g and soil organic matter. Hence <strong>in</strong>corporat<strong>in</strong>g (or not <strong>in</strong>corporat<strong>in</strong>g) straw cont<strong>in</strong>ues<br />
<strong>in</strong>def<strong>in</strong>itely, so the soil is <strong>in</strong> steady state and there is no contribution from the change <strong>in</strong> the soil organic<br />
matter. In the transition period, soil organic matter would be reduced giv<strong>in</strong>g a release of CO2 which<br />
the benefit of reduced N2O would take some years to counteract, and vice-versa. The magnitude of the effect<br />
of a change away from straw <strong>in</strong>corporation depends on the proportion of straw <strong>in</strong>corporated for each crop.<br />
A reduction <strong>in</strong> the total quantity of N <strong>in</strong>put is associated with decreased primary energy use and reduced<br />
emissions of N2O s<strong>in</strong>ce under the Tier 1 IPCC m<strong>et</strong>hodology the emission factor for N2O is a fixed percentage<br />
(1%) of total N applied (IPCC, 2006). An effect of reduc<strong>in</strong>g total N <strong>in</strong>put is that the concentration of N <strong>in</strong><br />
the crop is also reduced. This reduces the likelihood of bread wheat gra<strong>in</strong> be<strong>in</strong>g of a suitable quality for<br />
bread-mak<strong>in</strong>g. A switch to a vari<strong>et</strong>y with a higher <strong>in</strong>herent prote<strong>in</strong> content might be feasible, but these vari<strong>et</strong>ies<br />
are also lower-yield<strong>in</strong>g (HGCA, 2011). Reduced N content is unlikely to be consequential <strong>in</strong> the case of<br />
potatoes and sugar be<strong>et</strong> as it is not a quality criterion for these crops. Reductions <strong>in</strong> total N <strong>in</strong>put were analysed<br />
to d<strong>et</strong>erm<strong>in</strong>e an appropriate level which might reduce GHGE by more than crop yields to give a n<strong>et</strong><br />
environmental benefit per unit of crop produced. An average reduction of 20% <strong>in</strong> total N <strong>in</strong>put produced a<br />
n<strong>et</strong> GHGE benefit for all crops and was therefore considered to be the most appropriate option. Progressive<br />
decreases <strong>in</strong> total N not only reduce crop yields and soil nitrate concentrations but also reduce emissions of<br />
ammonia.<br />
Where all three agronomic options were appropriate to the crop, reduced N had the greatest effect on<br />
GHGE. The comb<strong>in</strong>ed effect of the options on the percentage reduction <strong>in</strong> GHGE was lowest for sugar be<strong>et</strong><br />
(2%) and highest for the cereal crops (average 15% reduction). The percentage reduction <strong>in</strong> GHGE was<br />
similar for the two potato crops (3%), and was also similar for the two gra<strong>in</strong> legumes (9%).<br />
The output of the major gra<strong>in</strong> crops has <strong>in</strong>creased steadily over the years and there is undoubtedly scope<br />
for them to be <strong>in</strong>creased further - for example through improved plant breed<strong>in</strong>g and crop health (see review<br />
by Godfray <strong>et</strong> al., 2010). Table 4 shows GHGE per kg product were significantly reduced by a theor<strong>et</strong>ical<br />
<strong>in</strong>crease <strong>in</strong> yield of 20%. The system models <strong>in</strong>crease the fertiliser N <strong>in</strong>put to the crops to balance the <strong>in</strong>creased<br />
N off-take. For crops other than cereals and forage maize the effect on GHGE of a 20% <strong>in</strong>crease <strong>in</strong><br />
yield alone was greater than the comb<strong>in</strong>ed effects of the agronomic options, rang<strong>in</strong>g from a 5% reduction for<br />
ma<strong>in</strong>-crop potatoes to a 14% reduction <strong>in</strong> GHGE for soya beans.<br />
3.2 Livestock<br />
Differences b<strong>et</strong>ween semi-<strong>in</strong>tensive (18 to 20 month) and <strong>in</strong>tensive (cereal) dairy beef, b<strong>et</strong>ween upland<br />
and lowland suckler beef, and b<strong>et</strong>ween upland and lowland sheep were small <strong>in</strong> terms of GHGE/kg of product<br />
at the farm gate, <strong>in</strong> agreement with farm-based studies <strong>in</strong> the UK (EBLEX, 2010; QMS, 2011). GHGE<br />
from livestock systems are average values for each sector - milk, dairy beef, suckler beef, sheep meat, pig<br />
meat, poultry meat and eggs (Table 5). Milk production has apparently lower GHGE per kg product, but this<br />
is due to the fact that milk is largely water. On a dry matter basis primary energy use for milk production is<br />
similar to that of poultry production, reflect<strong>in</strong>g the energ<strong>et</strong>ic efficiency of convert<strong>in</strong>g feed <strong>in</strong>to milk rather<br />
than live weight. However GHGE is always higher for rum<strong>in</strong>ants due to the m<strong>et</strong>hane emitted dur<strong>in</strong>g rum<strong>in</strong>ation.<br />
GHGE per kg product are higher for suckled beef and sheep meat production than for beef produced<br />
from calves born <strong>in</strong> the dairy herd (dairy beef) and non-rum<strong>in</strong>ant systems, reflect<strong>in</strong>g the relatively high overhead<br />
feed cost of the breed<strong>in</strong>g female (Table 3). Differences <strong>in</strong> GHGE b<strong>et</strong>ween the meat production systems<br />
per unit of edible energy and edible prote<strong>in</strong> are similar to those per kg fresh product, with suckler beef hav<strong>in</strong>g<br />
the highest, and poultry meat the lowest GHGE per MJ of edible energy and per kg edible prote<strong>in</strong>.<br />
The best alternative system <strong>in</strong> terms of reduced GHGE compared to the comb<strong>in</strong>ed typical systems was<br />
identified for each livestock sector us<strong>in</strong>g the Cranfield model (Table 5). Alternative systems were def<strong>in</strong>ed<br />
us<strong>in</strong>g the model with the most extreme feasible improvement <strong>in</strong> each factor <strong>in</strong> order to estimate the maximum<br />
potential for reduc<strong>in</strong>g GHGE. By <strong>in</strong>creas<strong>in</strong>g fertility (number of successful conceptions per female<br />
<strong>in</strong>sem<strong>in</strong>ated), fecundity (number of offspr<strong>in</strong>g per breed<strong>in</strong>g female <strong>in</strong> sheep) and longevity (number of years<br />
<strong>in</strong> production), the overhead costs of rear<strong>in</strong>g herd and flock replacements are reduced.<br />
Us<strong>in</strong>g the system model identified a problem with the statements “<strong>in</strong>crease annual milk yield” and “<strong>in</strong>crease<br />
daily growth rate”. Both can be achieved by hav<strong>in</strong>g a larger animal. Thus a cow which is 10% larger<br />
will be expected to require 10% more food for ma<strong>in</strong>tenance, give 10% more milk and require 10% more food<br />
164
PARALLEL SESSION 2B: EMISSIONS MODELLING 8 th Int. Conference on <strong>LCA</strong> <strong>in</strong> the<br />
Agri-<strong>Food</strong> Sector, 1-4 Oct <strong>2012</strong><br />
because of that milk and will have the same GHGE per kg milk. There are three options: 1) larger animal 2)<br />
same size of animal giv<strong>in</strong>g more milk but eat<strong>in</strong>g more food for that milk 3) same size of animal giv<strong>in</strong>g more<br />
milk and eat<strong>in</strong>g no more food. Increased annual milk output should also not be confused with yield per lactation,<br />
which can be <strong>in</strong>creased by hav<strong>in</strong>g a longer calv<strong>in</strong>g <strong>in</strong>terval. Similarly improv<strong>in</strong>g feed conversion<br />
ratio (FCR) – def<strong>in</strong>ed as kg feed (at constant dry matter) per kg weight ga<strong>in</strong>, milk or eggs (at constant dry<br />
matter) – makes more efficient use of resources. Increased daily live weight ga<strong>in</strong> and lower age at slaughter<br />
may save resources but an animal that is simply larger may achieve a greater daily live weight ga<strong>in</strong> but consume<br />
pro-rata more feed with no improvement <strong>in</strong> its feed conversion ratio. The analysis presented here does<br />
not dist<strong>in</strong>guish b<strong>et</strong>ween m<strong>et</strong>hods to improve FCR. In some cases, di<strong>et</strong> re-formulations may improve FCR but<br />
<strong>in</strong>crease the environmental burdens of feed production and not reduce GHGE.<br />
Table 5. Estimated GHGE for typical and alternative livestock systems<br />
Sector Typical system<br />
GHGE from alternative<br />
system<br />
kg CO2e per<br />
kg<br />
product<br />
kg CO2e per<br />
1<br />
MJ edible kg edible<br />
energy prote<strong>in</strong><br />
Best alternative system kg product 1 % Redn<br />
Milk 1.0 0.4 30.6 Autumn-calv<strong>in</strong>g cows, housed 190 days/year. 8000 litres per<br />
year, 7 lactations per cow. 15% crude prote<strong>in</strong> housed di<strong>et</strong> based<br />
on maize silage.<br />
0.89 12<br />
Dairy 8.5 1.0 49.5 Lower prote<strong>in</strong> and lower forage di<strong>et</strong>, housed throughout life- 7.95 7<br />
beef<br />
time.<br />
Suckler 15.9 1.9 90.0 Extended graz<strong>in</strong>g. Spr<strong>in</strong>g calv<strong>in</strong>g. High gen<strong>et</strong>ic merit cow for 14.1 12<br />
beef<br />
fertility and calf growth.<br />
Sheep 14.6 1.6 69.3 Extensive. Ewes of high gen<strong>et</strong>ic merit for fecundity and longev- 11.5 21<br />
meat<br />
ity. No hous<strong>in</strong>g.<br />
Pig meat 4.0 0.7 19.7 High fertility and pigl<strong>et</strong> growth. Sows and weaners outdoors.<br />
F<strong>in</strong>ish<strong>in</strong>g <strong>in</strong>doors on slurry system, applied slurry immediately<br />
<strong>in</strong>corporated <strong>in</strong>to land.<br />
3.49 14<br />
Poultry 2.7 0.3 14.2 Housed. Immediate <strong>in</strong>corporation of applied manure <strong>in</strong>to land. 2.54 7<br />
meat<br />
FCR as for top 10% of sector.<br />
Eggs 3.0 0.5 23.2 Housed, slurry, under-floor dry<strong>in</strong>g of manure, cover<strong>in</strong>g of manure<br />
store, Immediate <strong>in</strong>corporation of applied manure <strong>in</strong>to land.<br />
FCR as for top 10% of sector.<br />
2.57 13<br />
1<br />
Whole milk and eggs, bone-<strong>in</strong> carcase weight<br />
The potential reductions <strong>in</strong> GHGE range from 7% for dairy beef and poultry meat to 21% for sheep meat.<br />
The major factors affect<strong>in</strong>g GHGE per unit of milk are annual yield per cow, longevity and reduced prote<strong>in</strong><br />
di<strong>et</strong>s. The best alternative milk production system is longevity at 7 lactations per cow rather the current average<br />
of 3.2 lactations per cow. The best alternative beef production system uses calves from the dairy herd.<br />
The use of sexed semen <strong>in</strong> dairy herds was exam<strong>in</strong>ed as a possible option. There was little effect on the total<br />
number of male and female dairy-bred calves available for beef. The scope for reduc<strong>in</strong>g GHGE from suckler<br />
beef systems is limited by the relatively low output of beef per breed<strong>in</strong>g female per year. However, suckler<br />
beef herds make use of grassland that is not good enough for milk production or arable cropp<strong>in</strong>g (Wilk<strong>in</strong>son,<br />
2011). Overall feed conversion ratio is substantially poorer than that of the monogastric livestock systems.<br />
The best alternative suckler system comprises spr<strong>in</strong>g-calv<strong>in</strong>g suckler cows with extended graz<strong>in</strong>g (i.e. m<strong>in</strong>imal<br />
hous<strong>in</strong>g) to m<strong>in</strong>imise N2O emissions from farmyard manure. The best alternative pig production system<br />
comprised sows of high gen<strong>et</strong>ic merit for fertility and pigl<strong>et</strong> growth, sows and weaners kept outdoors and<br />
<strong>in</strong>door f<strong>in</strong>ish<strong>in</strong>g system with manure as slurry. Greater emissions of N2O from the outdoor system are more<br />
than offs<strong>et</strong> by the reduction <strong>in</strong> m<strong>et</strong>hane which would otherwise be produced from stored manure or slurry.<br />
There is, however, an <strong>in</strong>creased risk of nitrate leach<strong>in</strong>g from the outdoor system compared to fully-housed<br />
systems. Poultry production is relatively efficient compared to other livestock sectors, and there was relatively<br />
little scope for reductions <strong>in</strong> GHGE. The best alternative system of poultry meat production is <strong>in</strong>doorhoused<br />
as is the case with egg production, which conflicts with modern welfare preferences.<br />
Criteria other than GHGE need to be taken <strong>in</strong>to account <strong>in</strong> d<strong>et</strong>erm<strong>in</strong><strong>in</strong>g the best options. Half of the cropp<strong>in</strong>g<br />
options reduce national production of the commodities, which conflicts with the requirement not to<br />
<strong>in</strong>crease imports. Apart from the country’s food security, <strong>in</strong>creased imports affect global agriculture and<br />
carry the risk of <strong>in</strong>creased deforestation with consequent severe <strong>in</strong>creases <strong>in</strong> GHG emissions. No-till <strong>in</strong>creases<br />
pesticide use. Whilst decreas<strong>in</strong>g nitrogen fertiliser reduces nitrate leach<strong>in</strong>g, <strong>in</strong>creased yields from<br />
crop breed<strong>in</strong>g had negligible effect on nitrate leach<strong>in</strong>g even though the model requires that nitrogen <strong>in</strong>put is<br />
165
PARALLEL SESSION 2B: EMISSIONS MODELLING 8 th Int. Conference on <strong>LCA</strong> <strong>in</strong> the<br />
Agri-<strong>Food</strong> Sector, 1-4 Oct <strong>2012</strong><br />
<strong>in</strong>creased pro-rata with yield. Overall the results <strong>in</strong>dicate that improvements <strong>in</strong> productivity and efficiency<br />
of resource use are the best options for reduc<strong>in</strong>g GHGE per unit of product, without other del<strong>et</strong>erious effects.<br />
4. Conclusions<br />
Of the options found to reduce crop GHGE, reduced fertiliser N and <strong>in</strong>creased yield per hectare were the<br />
most significant, giv<strong>in</strong>g reductions <strong>in</strong> GHGE of b<strong>et</strong>ween 5% and 15% compared to typical systems. Options<br />
found to reduce GHGE <strong>in</strong> livestock production were <strong>in</strong>creased fertility, fecundity and longevity of breed<strong>in</strong>g<br />
females, <strong>in</strong>creased annual milk yield per dairy cow, improved FCR <strong>in</strong> meat animals and immediate <strong>in</strong>corporation<br />
of slurry follow<strong>in</strong>g its application to land giv<strong>in</strong>g reductions of b<strong>et</strong>ween 7 and 21%. However the best<br />
that is likely to be achieved overall is around a 10% improvement, <strong>in</strong> agreement with the aspiration of the<br />
UK Greenhouse Gas Action Plan (Agricultural Climate Change Task Force, 2010). There is scope to reduce<br />
GHGE <strong>in</strong> all sectors by apply<strong>in</strong>g exist<strong>in</strong>g knowledge.<br />
5. Acknowledgement<br />
The research on which this paper is based was funded by the Department for Environment, <strong>Food</strong> and Rural<br />
Affairs (DEFRA, projects IS0205, AC0208 and IS0222), whose support is gratefully acknowledged.<br />
6. References<br />
Agricultural Climate Change Task Force, 2010. Agriculture Industry GHG Action Plan: Framework for Action.<br />
www.nfuonl<strong>in</strong>e.com/Our-work/Environment/.../GHGAP-10Feb2010/ Accessed 17 Feb <strong>2012</strong>.<br />
English Beef and Lamb Executive (EBLEX), 2010. Test<strong>in</strong>g the Water. The English Beef and Sheep Production Environmental<br />
Roadmap – Phase 2. EBLEX, Kenilworth, UK 47 p.<br />
Godfray, H.C.J., Bedd<strong>in</strong>gton, J.R., Crute, I.R., Haddad, L., Lawrence, D., Muir, J.F., Pr<strong>et</strong>ty, J., Rob<strong>in</strong>son, S., Thomas, S and Toulm<strong>in</strong>,<br />
C. 2010. <strong>Food</strong> security: The challenge of feed<strong>in</strong>g 9 billion people. Science 327: 812-818.<br />
Home-Grown Cereals Authority (HGCA), 2011. HGCA Recommended List W<strong>in</strong>ter Wheat <strong>2012</strong>/13.<br />
HGCA, Kenilworth, UK.<br />
Intergovernmental Panel on Climate Change (IPCC), 2006. IPCC Guidel<strong>in</strong>es for National Greenhouse Gas Inventories. Volume 4.<br />
Agriculture, Forestry and Other Land Use. Task Force on National Greenhouse Gas Inventories.<br />
Office of Public Sector Information, 2011. Climate Change Act 2008.<br />
http://www.legislation.gov.uk/ukpga/2008/27/contents Accessed 4 January <strong>2012</strong>.<br />
Quality Meat Scotland (QMS), 2011 Estimat<strong>in</strong>g Greenhouse Gas Emissions from Scottish Livestock Enterprises. QMS, Ingelston,<br />
Scotland. 17 p.<br />
Robertson, G.P., Paul, E.A., Harwood, R.R., 2000. Greenhouse Gases <strong>in</strong> Intensive Agriculture: Contributions of Individual Gases to<br />
the Radiative Forc<strong>in</strong>g of the Atmosphere. Science 289, 1922-1925<br />
Thomas, C. (Ed.) 2004. Feed <strong>in</strong>to Milk. A New Applied Feed<strong>in</strong>g System for Dairy Cows. Feed Database. Nott<strong>in</strong>gham University<br />
Press, Nott<strong>in</strong>gham, UK. 68 p.<br />
Wilk<strong>in</strong>son, J.M., 2011. Redef<strong>in</strong><strong>in</strong>g efficiency of feed use by livestock. Animal 5: 1014-1022.<br />
Williams, A.G., Audsley, E. and Sandars, D.L., 2006. D<strong>et</strong>erm<strong>in</strong><strong>in</strong>g the environmental burdens and resource use <strong>in</strong> the production of<br />
agricultural and horticultural commodities. Ma<strong>in</strong> Report. Defra Research Project IS0205. Cranfield University, Bedford, UK.<br />
97p. http://randd.defra.gov.uk/<br />
Williams, A.G., Audsley, E. and Sandars, D.L., 2010. Environmental burdens of produc<strong>in</strong>g bread wheat, oilseed rape and potatoes <strong>in</strong><br />
England and Wales us<strong>in</strong>g simulation and system modell<strong>in</strong>g. International Journal of Life Cycle Assessment 15: 855-868.<br />
166
PARALLEL SESSION 2B: EMISSIONS MODELLING 8 th Int. Conference on <strong>LCA</strong> <strong>in</strong> the<br />
Agri-<strong>Food</strong> Sector, 1-4 Oct <strong>2012</strong><br />
Improv<strong>in</strong>g estimates of life cycle nitrous oxide emissions from cropbased<br />
food products<br />
Jeremy Wiltshire 1,* , Sarah Wynn 1 , Roger Sylvester-Bradley 1 , Daniel K<strong>in</strong>dred 1 , Nigel Mortimer 2 ,<br />
Anna Evans 2 , Charlotte Hatto 2 , Onesmus Mwabonje 2<br />
1 ADAS UK Ltd, Battlegate Road, Boxworth, Cambridge, CB23 4NN, UK<br />
2 North Energy Associates Ltd, Watsons Chambers, 5–15 Mark<strong>et</strong> Place, Castle Square, Sheffield, S1 2GH, UK<br />
Correspond<strong>in</strong>g author. E-mail: jeremy.wiltshire@adas.co.uk<br />
ABSTRACT<br />
A research project called “M<strong>in</strong>imis<strong>in</strong>g nitrous oxide <strong>in</strong>tensities of arable crop products” (MIN-NO) is address<strong>in</strong>g the scientific and<br />
practical challenges of m<strong>in</strong>imis<strong>in</strong>g nitrous oxide emissions from UK arable cropp<strong>in</strong>g, and is explor<strong>in</strong>g improved N2O emissions<br />
factors. The average emission of greenhouse gases (GHGs) for 220 UK wheat crops was 405 kg CO2e t -1 based on the Intergovernmental<br />
Panel on Climate Change (IPCC) Tier 1 m<strong>et</strong>hod (IPCC, 2006). The N2O contribution to GHG emissions per tonne of wheat<br />
gra<strong>in</strong> was approximately 72%, and the coefficient of variation for fertiliser-related N2O emissions per tonne of wheat gra<strong>in</strong> was large,<br />
at 31.9%. Results suggest that soil organic matter status had a large effect on N2O emissions.<br />
The uncerta<strong>in</strong>ty ranges <strong>in</strong> the IPCC N2O emissions factors gave a range of GHG emissions per tonne of gra<strong>in</strong> that is more than double<br />
the value for the GHG emissions assessed us<strong>in</strong>g IPCC default emissions factors.<br />
Keywords: food product, nitrous oxide, N2O, greenhouse gas, crop<br />
1. Introduction<br />
Most non-legum<strong>in</strong>ous arable crops <strong>in</strong> Northern Europe respond positively to applications of nitrogen (N)<br />
fertilisers. The Intergovernmental Panel on Climate Change (IPCC) provides a m<strong>et</strong>hod for assess<strong>in</strong>g emissions<br />
of the greenhouse gas (GHG) nitrous oxide (N2O) that occur as a consequence of apply<strong>in</strong>g N fertiliser:<br />
at the national scale the default value for applied N lost directly as N2O is 1% (range: 0.3–3%), for all crops<br />
regardless of management practices.<br />
Us<strong>in</strong>g this m<strong>et</strong>hod with<strong>in</strong> the UK, N2O emissions have been estimated to contribute 6.1% (111,640 t N2O)<br />
to the total of GHG emissions, with 78% of all N2O emissions orig<strong>in</strong>at<strong>in</strong>g from agricultural practices (Mac-<br />
Carthy <strong>et</strong> al., 2011). In the absence of more specific <strong>in</strong>formation IPCC m<strong>et</strong>hods and their associated emissions<br />
factors have been adopted for lifecycle analysis at a product scale (BSI, 2011) and, us<strong>in</strong>g this approach,<br />
the contribution of primary food production to lifecycle GHG emissions of food products has typically been<br />
estimated at around 50%, som<strong>et</strong>imes more (Wiltshire <strong>et</strong> al., 2008). Thus, N2O makes an important contribution<br />
to the lifecycle GHG emissions of food products.<br />
A study <strong>in</strong> the UK is address<strong>in</strong>g the scientific and practical challenges of m<strong>in</strong>imis<strong>in</strong>g N2O emissions from<br />
UK arable cropp<strong>in</strong>g. The project is called “M<strong>in</strong>imis<strong>in</strong>g nitrous oxide <strong>in</strong>tensities of arable crop products<br />
(MIN-NO)” and objectives <strong>in</strong>clude the follow<strong>in</strong>g:<br />
1. To gauge the importance of and variability <strong>in</strong> N2O emissions associated with crop products;<br />
2. To d<strong>et</strong>erm<strong>in</strong>e a more robust relationship b<strong>et</strong>ween N2O emission and the rate of m<strong>in</strong>eral N fertilisers<br />
applied, both dur<strong>in</strong>g crop growth and from crop residues;<br />
3. Through expert estimation and debate, to identify practices which could lower the greenhouse gas<br />
emissions footpr<strong>in</strong>t of arable products such as bread, sugar, oils, peas, chicken, whisky and biofuels;<br />
4. To assess how emissions might be estimated more accurately at farm and at national level.<br />
A key hypothesis be<strong>in</strong>g tested <strong>in</strong> the MIN-NO project is that, because some N2O emissions occur after<br />
crop N uptake, emissions relate to the balance b<strong>et</strong>ween N supply and N uptake. This hypothesis is supported<br />
by evidence for a non-l<strong>in</strong>ear N2O response to applied nitrogen fertiliser <strong>in</strong> corn crops (Hoben <strong>et</strong> al., 2011).<br />
Contrary to this, most current GHG account<strong>in</strong>g m<strong>et</strong>hods assume a direct proportionality b<strong>et</strong>ween N fertiliser<br />
use and N2O emissions from land, as agreed <strong>in</strong>ternationally by IPCC (2006). This assumption implies that<br />
large reductions <strong>in</strong> N fertiliser use and crop productivity are required to m<strong>in</strong>imise the N2O contribution to life<br />
cycle GHG emissions of crop products. However, if N2O emissions were N-balance related, N amounts that<br />
m<strong>in</strong>imise N2O <strong>in</strong>tensities would be similar to current use, and GHG mitigation would be compatible with<br />
susta<strong>in</strong>ed crop productivity (Figure 1).<br />
The project objective to gauge the importance of and variability <strong>in</strong> N2O emissions associated with crop<br />
products, requires collection of multiple field-by-field GHG emissions data to d<strong>et</strong>erm<strong>in</strong>e variability <strong>in</strong> onfarm<br />
N2O emissions, and their contributions of to the GHG <strong>in</strong>tensities of arable crop products. In this paper<br />
we present GHG emission assessments for wheat gra<strong>in</strong> from multiple fields, us<strong>in</strong>g lifecycle assessment<br />
(<strong>LCA</strong>) m<strong>et</strong>hods, and show the extent of variability <strong>in</strong> emissions (especially N2O) for the wheat gra<strong>in</strong> product<br />
to help me<strong>et</strong> objective 1 of the project.<br />
167
PARALLEL SESSION 2B: EMISSIONS MODELLING 8 th Int. Conference on <strong>LCA</strong> <strong>in</strong> the<br />
Agri-<strong>Food</strong> Sector, 1-4 Oct <strong>2012</strong><br />
(a) (b)<br />
-200 -100 0 100 200<br />
Figure 1. (a) Effects of N supply on crop production (th<strong>in</strong> grey l<strong>in</strong>e), and on N2O emissions if related directly<br />
to N supply (bold cont<strong>in</strong>uous l<strong>in</strong>e; as estimated by the IPCC Tier 1 approach) or to the balance b<strong>et</strong>ween N<br />
supply and crop N uptake (bold dashed l<strong>in</strong>e; as hypothesised here). (b) Consequent contrast<strong>in</strong>g effects of N<br />
supply on N2O emission-<strong>in</strong>tensities of crop products for the IPCC (bold cont<strong>in</strong>uous l<strong>in</strong>e) and our hypothesised<br />
(bold dashed l<strong>in</strong>e) scenarios.<br />
2. M<strong>et</strong>hods<br />
Emissions of GHGs have been assessed at an <strong>in</strong>dividual field scale for 220 wheat crops, of which 97<br />
crops were grown for the animal feed or distill<strong>in</strong>g mark<strong>et</strong>s (feed wheat) and 123 crops were grown for bread<br />
mak<strong>in</strong>g (mill<strong>in</strong>g wheat). The crops were widely distributed across the wheat-grow<strong>in</strong>g regions of England and<br />
Scotland, and were grown <strong>in</strong> the years 2005 to 2011, with more than half of the crops grown <strong>in</strong> 2010 or<br />
2011.<br />
Data were provided by commercial partners <strong>in</strong> the MIN-NO project (see Acknowledgements), work<strong>in</strong>g<br />
with farmers. To provide the data, the farmers compl<strong>et</strong>ed a questionnaire, and most received a visit to help<br />
them supply the data from their farm records. Important variables <strong>in</strong>cluded: crop location, wheat vari<strong>et</strong>y,<br />
position <strong>in</strong> the farm crop rotation, soil type, type of cultivations or tillage, <strong>in</strong>puts of seed and crop protection<br />
chemicals, fertiliser applications, gra<strong>in</strong> yield, fate of straw, and gra<strong>in</strong> dry<strong>in</strong>g.<br />
The GHG emissions were assessed us<strong>in</strong>g an <strong>LCA</strong> approach as given <strong>in</strong> PAS 2050:2011 (BSI, 2011). The<br />
system boundary was from ‘cradle to gate’, and <strong>in</strong>cluded production and transport of raw materials (e.g.<br />
seed, chemicals, fertilisers), direct and <strong>in</strong>direct GHG emissions follow<strong>in</strong>g application of fertilisers (<strong>in</strong>clud<strong>in</strong>g<br />
CO2 fixed <strong>in</strong> the <strong>in</strong>dustrial production of urea, and <strong>in</strong>direct emissions related to NH3 and NOX), and GHG<br />
emissions from mach<strong>in</strong>e use and crop dry<strong>in</strong>g. The system boundary did not <strong>in</strong>clude GHG emissions from the<br />
production of capital goods (e.g. tractors and build<strong>in</strong>gs). The PAS 2050 rules require that agricultural N2O<br />
and CH4 emissions should be calculated with the highest tier approach s<strong>et</strong> out <strong>in</strong> the 2006 IPCC Guidel<strong>in</strong>es<br />
for National Greenhouse Gas Inventories (IPCC, 2006), or the highest tier approach employed by the country<br />
<strong>in</strong> which the emissions were produced. The m<strong>et</strong>hod may be one of three: Tier 1, Tier 2 or Tier 3, which <strong>in</strong>crease<br />
<strong>in</strong> their complexity and accuracy. We followed the Tier 1 approach (IPCC, 2006), as used to calculate<br />
the latest published UK agricultural greenhouse gas <strong>in</strong>ventory, although this <strong>in</strong>ventory was calculated us<strong>in</strong>g<br />
the revised 1996 IPCC guidel<strong>in</strong>es and not the 2006 IPCC guidel<strong>in</strong>es.<br />
The IPCC Tier 1 m<strong>et</strong>hodology is simple and generalised, due to its <strong>in</strong>tended <strong>in</strong>itial wide scope of application.<br />
For example, the default emissions factor for direct soil emissions is 1.0% of total N applied lost as<br />
N2O-N; and that for <strong>in</strong>direct N2O losses follow<strong>in</strong>g nitrate leach<strong>in</strong>g is 0.75% of leached N lost as N2O-N.<br />
These emissions factors have large uncerta<strong>in</strong>ty ranges: for direct soil emissions the range is 0.3 to 3.0%; and<br />
168<br />
Crop production,<br />
t ha -1<br />
N-supply-related<br />
emissions, ha -1<br />
N-balance-related<br />
emissions, ha-1<br />
Difference b<strong>et</strong>ween soil-available N<br />
and the economic optimum N supply, kg ha -1<br />
Emission <strong>in</strong>tensity,<br />
tonne -1 product<br />
-200 -100 0 100 200<br />
Difference b<strong>et</strong>ween soil-available N<br />
and the economic optimum N supply, kg ha -1
PARALLEL SESSION 2B: EMISSIONS MODELLING 8 th Int. Conference on <strong>LCA</strong> <strong>in</strong> the<br />
Agri-<strong>Food</strong> Sector, 1-4 Oct <strong>2012</strong><br />
for <strong>in</strong>direct soil emissions follow<strong>in</strong>g nitrate leach<strong>in</strong>g the range is 0.05 to 2.5%. We have used these ranges<br />
from the IPCC (2006) guidel<strong>in</strong>es to show the uncerta<strong>in</strong>ty <strong>in</strong> the emissions of N2O per tonne of wheat.<br />
The GHG emission assessments for multiple fields of wheat were disaggregated by the three ma<strong>in</strong> agricultural<br />
GHGs (CO2, CH4 and N2O) and analysed us<strong>in</strong>g descriptive statistics to show the variability at the<br />
farm level.<br />
3. Results<br />
The mean of GHG emissions from 220 wheat fields was 405 kg CO2e t -1 , with a range of 777 kg CO2e t -1 .<br />
This range is large relative to the mean for both feed wheat and mill<strong>in</strong>g wheat (Figure 2).<br />
Emissions per tonne wheat (kg CO 2e t -1 ) x<br />
1000<br />
900<br />
800<br />
700<br />
600<br />
500<br />
400<br />
300<br />
200<br />
100<br />
Nitrous oxide (N fertiliser)<br />
Nitrous oxide (other)<br />
M<strong>et</strong>hane<br />
Carbon Dioxide<br />
Figure 2. Greenhouse gas emissions (kg CO2e t -1 0<br />
Feed Wheat Mill<strong>in</strong>g Wheat<br />
) for <strong>in</strong>dividual fields of wheat, disaggregated to nitrous<br />
oxide from N fertiliser (manufacture and soil emissions), nitrous oxide from other sources (<strong>in</strong>clud<strong>in</strong>g from<br />
soil follow<strong>in</strong>g <strong>in</strong>corporation of crop residues), m<strong>et</strong>hane and carbon dioxide. Data are divided <strong>in</strong>to feed wheat<br />
(for animal feed) and mill<strong>in</strong>g wheat (for bread), and each of these groups is ranked by total GHG emissions<br />
per tonne of wheat gra<strong>in</strong>.<br />
Analysis of the datas<strong>et</strong> <strong>in</strong>dicates that the variation <strong>in</strong> GHG emissions was <strong>in</strong>fluenced by many factors.<br />
There was a weak relationship b<strong>et</strong>ween yield and GHG emissions (R 2 = 0.28), but the two fields with greatest<br />
GHG emissions also had the lowest two yields and accounted for more than one quarter of the range <strong>in</strong><br />
total GHG emissions. Other factors affect<strong>in</strong>g total GHG emissions <strong>in</strong>cluded total N applied (R 2 = 0.21), and<br />
deisel use (R 2 = 0.28).<br />
On average, the GHG emissions per tonne of wheat gra<strong>in</strong> were dom<strong>in</strong>ated by N2O (approximately 72% of<br />
total global warm<strong>in</strong>g potential (GWP) expressed as kg CO2e), with important emissions of CO2 (approximately<br />
27%), and less than 1% of the GWP attributable to CH4. The total of N2O emissions from N fertiliser<br />
manufacture and from soil as a consequence of apply<strong>in</strong>g N fertiliser made up approximately 54% of the total<br />
CO2e value. Other N2O emissions were from soil follow<strong>in</strong>g organic N applications (animal manures), crop<br />
residue <strong>in</strong>corporation, and release of N by organic soils. Table 1 shows the mean and variability for N2O and<br />
CO2 emissions expressed as kg CO2e t -1 .<br />
It can be seen from Figure 2 that fields with exceptionally large N2O (other) emissions (i.e. exclud<strong>in</strong>g<br />
N2O from N fertiliser manufacture and N-fertiliser-related soil emissions) are <strong>in</strong> the upper quartile of the<br />
total emissions. These fields had organic soils, lead<strong>in</strong>g to N2O emissions from N <strong>in</strong> m<strong>in</strong>eralised soil organic<br />
matter. The coefficients of variation (CVs) shown <strong>in</strong> Table 1 are greatest for N2O (other) emissions (i.e. exclud<strong>in</strong>g<br />
N2O from N fertiliser manufacture and N-fertiliser-related soil emissions), and the CV was 75.4%<br />
for all wheat crops, compared with 31.9% for fertiliser-related N2O. This reflects the presence of outly<strong>in</strong>g<br />
values <strong>in</strong> the N2O (other) category due to the fields with organic soils.<br />
169
PARALLEL SESSION 2B: EMISSIONS MODELLING 8 th Int. Conference on <strong>LCA</strong> <strong>in</strong> the<br />
Agri-<strong>Food</strong> Sector, 1-4 Oct <strong>2012</strong><br />
Table 1. Means and coefficients of variation, for gra<strong>in</strong> yield (t ha -1 ) and GHG emissions (kg CO2e t -1 ; total,<br />
and CO2 and N2O components), and for all wheat crops, and subs<strong>et</strong>s of feed wheat and mill<strong>in</strong>g wheat.<br />
Statistic Variable All wheat Feed wheat Mill<strong>in</strong>g wheat<br />
Mean Yield (t ha -1 ) 8.7 8.9 8.6<br />
GHG emissions (kg CO2e t -1 ) 405 378 427<br />
CO2 (kg CO2e t -1 ) 109 98 119<br />
Fertiliser-related N2O (kg CO2e t -1 ) 218 197 235<br />
170<br />
Coefficient of<br />
variation (%)<br />
Other N2O (kg CO2e t -1 ) 74 80 69<br />
Yield (t ha -1 ) 15.5 15.8 15.1<br />
GHG emissions (kg CO2e t -1 ) 25.5 30.3 20.7<br />
CO2 (kg CO2e t -1 ) 32.3 33.5 29.3<br />
Fertiliser-related N2O (kg CO2e t -1 ) 31.9 35.0 28.0<br />
Other N2O (kg CO2e t -1 ) 75.4 80.7 68.6<br />
A source of uncerta<strong>in</strong>ty <strong>in</strong> estimat<strong>in</strong>g GHG emissions of farm products is the choice of emission factors<br />
for N2O emissions. Figure 3 uses an example of GHG emission assessment for one UK wheat crop to compare<br />
use of the default IPCC emissions factor for N2O emissions with the upper and lower limits of the uncerta<strong>in</strong>ty<br />
ranges for N2O emissions factors given by IPCC (IPCC, 2006). The range b<strong>et</strong>ween the total emissions<br />
us<strong>in</strong>g either the upper or the lower limits was 959 kg CO2e t -1 , more than twice the total GHG emissions<br />
us<strong>in</strong>g the IPCC default emissions factors.<br />
Emissions per tonne wheat (kg CO2e t -1 ) x<br />
1,400<br />
1,200<br />
1,000<br />
800<br />
600<br />
400<br />
200<br />
-<br />
IPCC 2006 - default<br />
EF<br />
Nitrous oxide (N fertiliser)<br />
Nitrous oxide (other)<br />
M<strong>et</strong>hane<br />
Carbon dioxide<br />
IPCC 2006 -<br />
m<strong>in</strong>imum EF<br />
IPCC 2006 -<br />
maximum EF<br />
Figure 3. Greenhouse gas emissions (kg CO2e t -1 ) for one tonne of wheat at the farm gate, assessed us<strong>in</strong>g<br />
alternative emissions factors (EFs) from IPCC (2006). The emissions are disaggregated to show CO2e values<br />
for nitrous oxide from N fertiliser (manufacture and soil emissions), nitrous oxide from other sources (<strong>in</strong>clud<strong>in</strong>g<br />
from soil follow<strong>in</strong>g <strong>in</strong>corporation of crop residues), m<strong>et</strong>hane and carbon dioxide.<br />
4. Discussion<br />
Estimates of wheat GHG emissions <strong>in</strong>dicate that N2O is the dom<strong>in</strong>ant GHG, account<strong>in</strong>g for 72% of CO2e<br />
per tonne of gra<strong>in</strong>. This supports IPCC conclusions (De Kle<strong>in</strong> <strong>et</strong> al., 2007) that GHG emissions associated<br />
with most crop products are dom<strong>in</strong>ated by N2O. Because of this, variability and uncerta<strong>in</strong>ty <strong>in</strong> N2O emissions<br />
have a large <strong>in</strong>fluence on variability and uncerta<strong>in</strong>ty <strong>in</strong> the total emissions for crop products at the farm gate,<br />
and for r<strong>et</strong>ailed products made from crops, such as bread.<br />
Understand<strong>in</strong>g the sources of variation <strong>in</strong> GHG emissions is useful to guide strategies for mitigation of<br />
emissions, by adoption of on-go<strong>in</strong>g improvements <strong>in</strong> efficiency of energy and resource use. Collection of<br />
more data and further data analysis <strong>in</strong> this project will provide more d<strong>et</strong>ail of the activities that lead to GHG<br />
emissions on farms. The analysis to date <strong>in</strong>dicates that there are multiple sources of variation b<strong>et</strong>ween crops,<br />
<strong>in</strong>clud<strong>in</strong>g yield, quantity of applied N fertiliser, soil type, and energy use. A small m<strong>in</strong>ority of fields had<br />
organic soils with high soil organic matter content, where m<strong>in</strong>eralisation of organic matter led to release of<br />
plant-available N, and emission of N2O, contribut<strong>in</strong>g to emissions variation b<strong>et</strong>ween fields. The marked ef-
PARALLEL SESSION 2B: EMISSIONS MODELLING 8 th Int. Conference on <strong>LCA</strong> <strong>in</strong> the<br />
Agri-<strong>Food</strong> Sector, 1-4 Oct <strong>2012</strong><br />
fect on GHG <strong>in</strong>tensity of describ<strong>in</strong>g a soil as ‘organic’ implies that more f<strong>in</strong>esse may be required at the field<br />
scale than at national scale <strong>in</strong> def<strong>in</strong><strong>in</strong>g a soil’s organic matter status; some low emission <strong>in</strong>tensities were<br />
associated with low fertiliser N use on fields which might almost have been deemed ‘organic’. However, it<br />
is <strong>in</strong>terest<strong>in</strong>g to note that the fields with largest emissions per tonne of gra<strong>in</strong>, for feed wheat and mill<strong>in</strong>g<br />
wheat, did not have organic soils. The fields with highest emissions per tonne of gra<strong>in</strong> tended to have low<br />
yields and/or high applications of N fertiliser.<br />
Fig. 2 shows that the range of GHG emissions values was greater for feed wheat (486 kg CO2e t -1 ) than<br />
for mill<strong>in</strong>g wheat (777 kg CO2e t -1 ). Reasons for this are not clear, but we speculate that mill<strong>in</strong>g wheat crops<br />
are managed to me<strong>et</strong> a tighter product specification (especially for gra<strong>in</strong> prote<strong>in</strong> content), lead<strong>in</strong>g to less<br />
variation <strong>in</strong> agronomic practices.<br />
Because it is technically difficult to measure emissions of N2O from soil over the life-span of a crop, it is<br />
not practical to measure N2O emission directly at an <strong>in</strong>dividual field scale, for multiple fields. Thus, an estimation<br />
m<strong>et</strong>hod is necessary for field scale GHG account<strong>in</strong>g of crop products. The <strong>in</strong>ternationally accepted<br />
IPCC tier 1 m<strong>et</strong>hod has a large uncerta<strong>in</strong>ty range (the default value for applied N lost directly as N2O is 1%<br />
with an uncerta<strong>in</strong>ty range of 0.3–3%). This reflects uncerta<strong>in</strong>ty <strong>in</strong> the relationship b<strong>et</strong>ween applied N and<br />
N2O emission from soil, which is mediated by microbial processes that are <strong>in</strong>fluenced by soil conditions,<br />
especially temperature, moisture, organic carbon and available N. These soil factors are very variable, and<br />
their effects <strong>in</strong>teract strongly (Brown <strong>et</strong> al., 2000) caus<strong>in</strong>g emissions to be spatially and temporally episodic<br />
(Dobbie and Smith 2001). Other work <strong>in</strong> the MIN-NO project is explor<strong>in</strong>g improved N2O emission factors<br />
for use <strong>in</strong> GHG account<strong>in</strong>g for crop products.<br />
The GHG emissions for mill<strong>in</strong>g wheat gra<strong>in</strong> represent a large component of the GHG emissions of a loaf<br />
of bread at the r<strong>et</strong>ail stage. Other work has shown that a standard 800 g white loaf (typical for UK consumption)<br />
has GHG emissions of 0.6 kg CO2e, of which 0.2 kg CO2e was for process<strong>in</strong>g, packag<strong>in</strong>g (Wiltshire <strong>et</strong><br />
al., 2009). In that study, also us<strong>in</strong>g PAS 2050 as the <strong>LCA</strong> m<strong>et</strong>hod, an emissions total for wheat of 640 kg<br />
CO2e t -1 was assumed. This <strong>in</strong>dicates that, correct<strong>in</strong>g for a lower emissions total for mill<strong>in</strong>g wheat as assessed<br />
<strong>in</strong> this work (427 kg CO2e t -1 ) more than half of the GHG emissions for a loaf of white bread are from<br />
on-farm wheat production. Therefore, the emissions dur<strong>in</strong>g crop production, and the variability <strong>in</strong> these<br />
emissions, strongly <strong>in</strong>fluence the emissions of a r<strong>et</strong>ailed loaf of bread.<br />
5. Conclusion<br />
Emissions of N2O dur<strong>in</strong>g wheat crop production are important, <strong>in</strong> both scale and variability, for the GHG<br />
emissions associated with r<strong>et</strong>ailed bread. There is an urgent need for (a) b<strong>et</strong>ter precision and certa<strong>in</strong>ty <strong>in</strong> estimation<br />
of N2O emissions, and (b) mitigation of GHG emissions on farms.<br />
6. Acknowledgements<br />
We acknowledge the UK Department for Environment, <strong>Food</strong> and Rural Affairs and the Scottish Government<br />
<strong>in</strong> sponsor<strong>in</strong>g Susta<strong>in</strong>able Arable LINK Project LK09128, and the contributions of ADAS, Agricultural<br />
Industries Confederation, Bayer CropScience, British Sugar, Country Land and Bus<strong>in</strong>ess Association, The<br />
Co-operative, Frontier, GrowHow, HGCA – the cereals and oilseeds division of the Agriculture and Horticulture<br />
Development Board (AHDB), Hill Court Farm Research, National Farmers Union (NFU), North<br />
Energy Associates, Rothamsted Research-North Wyke, The Processors and Growers Research Organisation<br />
(PGRO), Renewable Energy Association, Scottish Agricultural College (SAC), Scotch Whisky Research<br />
Institute, Soil Essentials, Vivergo fuels, Warburtons and Yara.<br />
7. References<br />
Brown, L., Armstrong Brown, S., Jarvis, S.C., Syed, B., Gould<strong>in</strong>g, K.W.T., Phillips, V.R., Sneath, R.W., Pa<strong>in</strong>, B. 2000. An <strong>in</strong>ventory<br />
of nitrous oxide emissions from agriculture <strong>in</strong> the UK us<strong>in</strong>g the IPCC m<strong>et</strong>hodology: emission estimate, uncerta<strong>in</strong>ty and sensitivity<br />
analysis. Atmospheric Environment 35, 1439-1449.<br />
BSI, 2011. PAS 2050:2011, Specification for the assessment of the life cycle greenhouse gas emissions of goods and services. Published:<br />
BSI, UK.<br />
De Kle<strong>in</strong>, C., Novoa, R.S.A., Ogle, S., Smith, K.A., Roch<strong>et</strong>te, P., Wirth T.C., McConkey, B.G., Mosier, A., Rypdal, K. 2007. N2O<br />
emissions from managed soils, and CO2 emissions from lime and urea application. Chapter 11 <strong>in</strong> 2006 IPCC Guidel<strong>in</strong>es for National<br />
Greenhouse Gas Inventories Volume 4: Agriculture, Forestry and Other Land Use. 54 pp.<br />
Dobbie, K.E., Smith, K.A. 2001. The effects of temperature, water-filled pore space and land use on N2O emissions from an imperfectly<br />
dra<strong>in</strong>ed gleysol. European Journal of Soil Science 52, 667-673.<br />
Hoben J.P., Gehl R.J., Millar N., Grace P. R., Robertson G. P., 2011. Nonl<strong>in</strong>ear nitrous oxide (N2O) response to nitrogen fertilizer <strong>in</strong><br />
on-farm corn crops of the US Midwest. Global Change Biology 17, 1140-1152.<br />
IPCC, 2006. 2006 IPCC Guidel<strong>in</strong>es for National Greenhouse Gas Inventories, Prepared by the National Greenhouse Gas Inventories<br />
Programme, Eggleston H.S., Buendia L., Miwa K., Ngara T. and Tanabe K. (eds). Published: IGES, Japan.<br />
171
PARALLEL SESSION 2B: EMISSIONS MODELLING 8 th Int. Conference on <strong>LCA</strong> <strong>in</strong> the<br />
Agri-<strong>Food</strong> Sector, 1-4 Oct <strong>2012</strong><br />
MacCarthy J., Brown K., Webb N., Passant N., Thistl<strong>et</strong>hwaite G., Murrells T., Watterson J., Cardenas L., Thomson A., and Pang Y.,<br />
2011. UK Greenhouse Gas Inventory, 1990 to 2009: Annual Report for Submission under the Framework Convention on Climate<br />
Change. Didcot UK, AEA Technology plc.<br />
Wiltshire J.J.J., Fendler A., Tucker G.S., Wynn S., 2008. The contribution of primary food production to lifecycle greenhouse gas<br />
emissions of food products. Aspects of Applied Biology 87, 73-76.<br />
Wiltshire J., Wynn S., Clarke J., Chambers B., Cottrill B., Drakes D., Gitt<strong>in</strong>s J., Nicholson C., Phillips K., Thorman R., Tiff<strong>in</strong> D.,<br />
Walker O., Tucker G., Thorn R., Green A., Fendler A., Williams A., Bellamy P., Audsley E., Chatterton J., Chadwick D., Foster<br />
C., 2009. Scenario build<strong>in</strong>g to test and <strong>in</strong>form the development of a BSI m<strong>et</strong>hod for assess<strong>in</strong>g greenhouse gas emissions from<br />
food, technical annex to the f<strong>in</strong>al report. Report to Defra, UK. Project Reference Number: FO0404.<br />
172
PARALLEL SESSION 2B: EMISSIONS MODELLING 8 th Int. Conference on <strong>LCA</strong> <strong>in</strong> the<br />
Agri-<strong>Food</strong> Sector, 1-4 Oct <strong>2012</strong><br />
Introduction of a national m<strong>et</strong>hod to estimate direct nitrous oxide<br />
emissions from m<strong>in</strong>eral soils for F<strong>in</strong>nish product carbon footpr<strong>in</strong>t<strong>in</strong>g<br />
Hannele Pulkk<strong>in</strong>en 1, *, Kristi<strong>in</strong>a Reg<strong>in</strong>a 2 , Juha-Matti Katajajuuri 1<br />
1 MTT Agrifood Research F<strong>in</strong>land, Biotechnology and <strong>Food</strong> Research, FI-00790 Hels<strong>in</strong>ki, F<strong>in</strong>land<br />
2 MTT Agrifood Research F<strong>in</strong>land, Plant Production Research, FI-31600 Jokio<strong>in</strong>en, F<strong>in</strong>land<br />
Correspond<strong>in</strong>g author. E-mail: hannele.pulkk<strong>in</strong>en@mtt.fi<br />
ABSTRACT<br />
Direct nitrous oxide emissions from managed soils play a very significant role <strong>in</strong> climate impacts of food products. However, an<br />
IPCC default emission factor is applied almost without exception to estimate emissions <strong>in</strong> climate impact studies of food products. A<br />
more d<strong>et</strong>ailed m<strong>et</strong>hod was developed for estimat<strong>in</strong>g direct nitrous oxide emissions <strong>in</strong> F<strong>in</strong>land for <strong>in</strong>creased accuracy. Research on<br />
nitrous oxide fluxes under F<strong>in</strong>nish conditions was conducted and a new m<strong>et</strong>hod for estimat<strong>in</strong>g fluxes from m<strong>in</strong>eral soils was developed<br />
for F<strong>in</strong>land. The m<strong>et</strong>hod results <strong>in</strong> markedly larger emissions to annual spr<strong>in</strong>g crops and smaller emissions to perennial crops<br />
compared with the IPCC default. The new m<strong>et</strong>hod also significantly <strong>in</strong>creases emissions at the national level. Acknowledg<strong>in</strong>g the<br />
substantial variation <strong>in</strong> nitrous oxide emissions, more accurate estimation m<strong>et</strong>hods need to be developed to understand the impacts of<br />
food produced <strong>in</strong> different climatic and geographic circumstances.<br />
Keywords: climate impact, food, nitrous oxide emissions, carbon footpr<strong>in</strong>t, potato<br />
1. Introduction<br />
Direct nitrous oxide emissions from managed soils play a very significant role <strong>in</strong> climate impacts of food<br />
products. Accord<strong>in</strong>g to different studies they often contribute 20-30% to total climate impact of different<br />
food products and even more to emissions from cultivation. However, IPCC default emission factors (IPCC<br />
1996, 2006) are used to estimate direct nitrous oxide emissions from applied N from managed soils almost<br />
without exception <strong>in</strong> carbon footpr<strong>in</strong>t studies of food products (Pulkk<strong>in</strong>en 2010). One exception is an Australian<br />
study of bread (Biswas <strong>et</strong> al., 2008), which employed locally derived emission factors of Barton <strong>et</strong> al.,<br />
(2008). Similar direct nitrous oxide emission factors are used for the Australian National Inventory Report<br />
(Australian National greenhouse accounts <strong>2012</strong>).<br />
In the F<strong>in</strong>nish <strong>Food</strong>pr<strong>in</strong>t-programme, harmonised national guidel<strong>in</strong>es were developed to assess climate<br />
impacts of food products. Calculation guidel<strong>in</strong>es are based on other <strong>in</strong>ternational life cycle assessment standards<br />
and guidel<strong>in</strong>es, and best practices, and give more practical <strong>in</strong>struction to the food <strong>in</strong>dustry than previously<br />
published general standards. In addition to harmonis<strong>in</strong>g carbon footpr<strong>in</strong>t m<strong>et</strong>hodology, a more d<strong>et</strong>ailed<br />
national m<strong>et</strong>hod for estimat<strong>in</strong>g direct nitrous oxide emissions from m<strong>in</strong>eral soils <strong>in</strong> F<strong>in</strong>land was developed to<br />
ga<strong>in</strong> a more accurate understand<strong>in</strong>g of climate impacts of food products.<br />
2. M<strong>et</strong>hods<br />
The uncerta<strong>in</strong>ties of nitrous oxide emissions are very high due to large spatial and temporal variation<br />
(Snyder <strong>et</strong> al., 2009). To reduce the uncerta<strong>in</strong>ty of national estimates, Reg<strong>in</strong>a <strong>et</strong> al., (submitted) conducted<br />
research on nitrous oxide fluxes under F<strong>in</strong>nish conditions from 13 fields for periods of one to three years <strong>in</strong><br />
2000-2009. Their ma<strong>in</strong> f<strong>in</strong>d<strong>in</strong>g was that the annual direct emissions of nitrous oxide were lower from grass<br />
crops than from annual spr<strong>in</strong>g crops. The long period b<strong>et</strong>ween harvest<strong>in</strong>g and sow<strong>in</strong>g under boreal conditions,<br />
when there is no veg<strong>et</strong>ation dur<strong>in</strong>g the long w<strong>in</strong>ter, <strong>in</strong>creases the emissions from annual spr<strong>in</strong>g sown<br />
crops. They were able to provide a m<strong>et</strong>hod for estimat<strong>in</strong>g direct nitrous oxide fluxes from grass and annual<br />
spr<strong>in</strong>g crops from m<strong>in</strong>eral soils <strong>in</strong> F<strong>in</strong>land that reflected national conditions b<strong>et</strong>ter than the IPCC default<br />
m<strong>et</strong>hod.<br />
Statistical mixed models were based on the measured emissions of nitrous oxide and background variables<br />
(Reg<strong>in</strong>a <strong>et</strong> al., submitted). Environmental and management data available for the analysis <strong>in</strong>cluded<br />
crop, fertiliser application rate, fertiliser type, soil characteristics and weather data. The crop type and the<br />
amount of m<strong>in</strong>eral N applied best expla<strong>in</strong>ed the variation <strong>in</strong> nitrous oxide emissions, and the model is consequently<br />
based on these two effects.<br />
To estimate the burden of human activity (cultivation) only, a background emission was deducted from<br />
the derived emission estimates of both crops by deduct<strong>in</strong>g the emissions at zero fertiliser application rate.<br />
The emission estimate at fertiliser level zero of annual spr<strong>in</strong>g crops was 2.013 and of perennial crops 0.529.<br />
Because the number of measurements results at zero fertilisation is limited, a conservative estimate of the<br />
background emission was used and only the smaller value was subtracted (derived from measurements on<br />
173
PARALLEL SESSION 2B: EMISSIONS MODELLING 8 th Int. Conference on <strong>LCA</strong> <strong>in</strong> the<br />
Agri-<strong>Food</strong> Sector, 1-4 Oct <strong>2012</strong><br />
perennial crops) from all calculated emission rates. This value, 0.529 kg N ha -1 yr -1 , is close to the annual<br />
emissions from the native veg<strong>et</strong>ation, i.e. forest (IPCC 2006).<br />
The derived equations for estimat<strong>in</strong>g nitrous oxide (N2O) flux from m<strong>in</strong>eral soils for perennial crops (Eq.<br />
1) and for annual spr<strong>in</strong>g crops (Eq. 2) are therefore:<br />
174<br />
N2O flux (kgN2O-N ha -1 yr -1 ) = 10 (-0.2762 + 0.002848 m<strong>in</strong>N)-0.529 Eq. 1<br />
N2O flux (kgN2O-N ha -1 yr -1 ) = 10 (-0.2762 + 0.002848 m<strong>in</strong>N + 0.58) - 0.529 Eq. 2<br />
These equations can be used to estimate the total emission from the field without divid<strong>in</strong>g it b<strong>et</strong>ween<br />
emissions from applied N, crop residues and N m<strong>in</strong>eralisation. Indirect nitrous oxide emissions were not<br />
<strong>in</strong>cluded <strong>in</strong> the field measurements and therefore need to be calculated separately.<br />
To evaluate the new national m<strong>et</strong>hod and to understand how it changes the results of F<strong>in</strong>nish climate impact<br />
studies, comparisons were made at two levels; a simple case study on a potato product and a national<br />
level estimate. Comparison was made with the IPCC 2006 m<strong>et</strong>hod as it is proposed for use <strong>in</strong> F<strong>in</strong>nish carbon<br />
footpr<strong>in</strong>t<strong>in</strong>g guidel<strong>in</strong>es (developed <strong>in</strong> <strong>Food</strong>pr<strong>in</strong>t-programme). To allow comparisons, all emissions were converted<br />
to CO2 equivalents by us<strong>in</strong>g the 100-year global warm<strong>in</strong>g potentials of 25 and 298 for CH4 and N2O,<br />
respectively (IPCC, 2007).<br />
The climate impact of packaged raw potatoes was first calculated accord<strong>in</strong>g to IPCC 2006 m<strong>et</strong>hod, <strong>in</strong>clud<strong>in</strong>g<br />
lim<strong>in</strong>g, and direct and <strong>in</strong>direct nitrous oxide emissions from m<strong>in</strong>eral and organic soils. Then the calculation<br />
was repeated with the exception of apply<strong>in</strong>g the new national emission factor for nitrous oxide<br />
emissions from applied N and crop residues from m<strong>in</strong>eral soils. The cradle-to-logistic term<strong>in</strong>al study <strong>in</strong>cluded<br />
production of agricultural <strong>in</strong>puts, potato cultivation, process<strong>in</strong>g, packag<strong>in</strong>g, transport and storage. The<br />
activity data were collected from one large F<strong>in</strong>nish potato mark<strong>et</strong>er. The data from the cultivation stage were<br />
collected from 2008-2010 and the sample covered nearly 60% of the producers. It should be noted that the<br />
nitrogen fertiliser levels <strong>in</strong> the study were a little lower than average F<strong>in</strong>nish potato fertiliser levels. This was<br />
likely due to the high level of specialisation of the farmers <strong>in</strong> potato cultivation. Data from process<strong>in</strong>g (wash<strong>in</strong>g,<br />
separation, pack<strong>in</strong>g) and transport to logistic term<strong>in</strong>al from all six producers were collected from 2010.<br />
Neither carbon sequestration nor land use changes were taken <strong>in</strong>to account due to lack of agreed m<strong>et</strong>hodology<br />
and data.<br />
The comparisons of national level direct nitrous oxide emissions were made b<strong>et</strong>ween the new national<br />
m<strong>et</strong>hod and IPCC 2006 m<strong>et</strong>hod. National statistics for cultivated area of different crops were used. Average<br />
m<strong>in</strong>imum and maximum total nitrogen fertiliser levels were def<strong>in</strong>ed to allow understand<strong>in</strong>g of the magnitude<br />
at low and high fertiliser levels. The levels were based on different farm statistics and the limits of the agrienvironmental<br />
scheme. For cultivation area and fertiliser levels used <strong>in</strong> national level calculations, specific<br />
data on the 25 most common crops and aggregated data of other crops were used.<br />
It has to be noted that <strong>in</strong> the national level estimates the crop residues were only <strong>in</strong>cluded regard<strong>in</strong>g emissions<br />
from m<strong>in</strong>eral soils <strong>in</strong> national m<strong>et</strong>hod calculations, as that was done automatically us<strong>in</strong>g new emission<br />
factors, but not for the IPCC m<strong>et</strong>hod calculations. However, the calculations should be comparable as emissions<br />
from crop residues only account for around 5% of direct and <strong>in</strong>direct nitrous oxide emissions from<br />
agricultural soils <strong>in</strong> F<strong>in</strong>land (Statistics F<strong>in</strong>land, <strong>2012</strong>).<br />
3. Results<br />
To demonstrate the impact of the new national m<strong>et</strong>hod for climate impact studies at product level, a case<br />
study on a potato product was performed. The direct nitrous oxide emissions almost doubled with the new<br />
national m<strong>et</strong>hod compared with that of IPCC 2006. This means that the greenhouse gas emissions from cultivation<br />
rose 46% and the total climate impact of packaged potatoes rose 25% (Table 1). Compared to the<br />
IPCC default m<strong>et</strong>hods, the new national m<strong>et</strong>hod <strong>in</strong>dicated almost twice as large N2O emissions for many<br />
common annual crops with relatively high fertiliser levels (such as gra<strong>in</strong> crops). The case study shows that<br />
application of the new national m<strong>et</strong>hod has significant impacts at the product level, especially on low carbon<br />
footpr<strong>in</strong>t products.
PARALLEL SESSION 2B: EMISSIONS MODELLING 8 th Int. Conference on <strong>LCA</strong> <strong>in</strong> the<br />
Agri-<strong>Food</strong> Sector, 1-4 Oct <strong>2012</strong><br />
Table 1. Shares of emission sources <strong>in</strong> potato case when us<strong>in</strong>g IPCC 2006 default emission factor and the<br />
new national m<strong>et</strong>hod.<br />
IPCC 2006 New national m<strong>et</strong>hod<br />
N2O emissions from managed soils 16% 32%<br />
Other GHG-emissions from cultivation 38% 36%<br />
Process<strong>in</strong>g, packag<strong>in</strong>g, transport 46% 36%<br />
Total kgCO2-eq./kg potato product 0.11 0.13<br />
Comparisons b<strong>et</strong>ween the new national m<strong>et</strong>hod and the IPCC 2006 m<strong>et</strong>hod were also made at national level.<br />
Apply<strong>in</strong>g the new national m<strong>et</strong>hod, direct nitrous oxide emissions from applied nitrogen from managed m<strong>in</strong>eral<br />
soils <strong>in</strong>creased approximately by 100% compared with the IPCC 2006 m<strong>et</strong>hod, depend<strong>in</strong>g on the fertiliser<br />
level assumed. The emissions from perennial crops decrease 30-46%, as emissions from annual crops<br />
<strong>in</strong>crease by 232-250% (Table 2). The comparison shows that application of the new national m<strong>et</strong>hod will<br />
<strong>in</strong>crease the estimated national direct nitrous oxide emissions significantly.<br />
Table 2. Estimated change <strong>in</strong> national nitrous oxide emission levels from applied N <strong>in</strong> m<strong>in</strong>eral soils when the<br />
new national m<strong>et</strong>hod is used <strong>in</strong>stead of the IPCC 2006 m<strong>et</strong>hod, with estimated m<strong>in</strong>imum and maximum F<strong>in</strong>nish<br />
fertiliser levels.<br />
M<strong>in</strong>imum fertiliser levels Maximum fertiliser levels<br />
Annual crops +250%<br />
+232%<br />
Perennial crops -46%<br />
-30%<br />
Others +176%<br />
+164%<br />
Total +116%<br />
+99%<br />
4. Discussion<br />
It is known that many factors <strong>in</strong> addition to fertiliser application rate have an effect on nitrous oxide<br />
fluxes. Several of these factors were also studied <strong>in</strong> long-term field measurements <strong>in</strong> F<strong>in</strong>land, such as type of<br />
fertiliser (m<strong>in</strong>eral/organic), percentage of organic carbon, sand and clay <strong>in</strong> the 0-20 cm soil layer, mean temperature<br />
for the w<strong>in</strong>ter months (Jan-Mar) and total precipitation for the summer months (May-Sep). However,<br />
<strong>in</strong>clusion of the other param<strong>et</strong>ers did not improve the performance of the models. This is a clear drawback<br />
as the models cannot take <strong>in</strong>to account diverse cultivation m<strong>et</strong>hods or mitigation options, such as organic<br />
agriculture, autumn sown crops, reduced tillage <strong>et</strong>c.<br />
The results <strong>in</strong>dicate that the most important factor d<strong>et</strong>erm<strong>in</strong><strong>in</strong>g the annual flux of nitrous oxide is the type<br />
of crop, based on the division b<strong>et</strong>ween annual and perennial crops. It seems justified to add this dimension<br />
also to the climate impact calculations for different agricultural products. The division is particularly important<br />
for F<strong>in</strong>nish conditions where spr<strong>in</strong>g-sown crops prevail and where the period when the soils are not covered<br />
by crops can be close to n<strong>in</strong>e months. This <strong>in</strong>creases the <strong>in</strong>cidence of nitrous oxide emissions from these<br />
soils.<br />
5. Conclusion<br />
The new national m<strong>et</strong>hod provides realistic estimates of nitrous oxide fluxes under boreal conditions,<br />
characterised by frozen soils <strong>in</strong> the w<strong>in</strong>ter, frequently renewed grasslands, and spr<strong>in</strong>g-sown annual crops.<br />
The more accurate m<strong>et</strong>hod highlights that under boreal conditions, such as F<strong>in</strong>land, direct nitrous oxide<br />
emissions from annual crops on m<strong>in</strong>eral soils are markedly higher than suggested by the IPCC m<strong>et</strong>hod. It<br />
also demonstrates that total F<strong>in</strong>nish direct nitrous oxide emissions from all managed soils are likewise<br />
higher.<br />
Acknowledg<strong>in</strong>g the substantial variation <strong>in</strong> nitrous oxide emissions, develop<strong>in</strong>g new m<strong>et</strong>hods to estimate<br />
fluxes <strong>in</strong> more d<strong>et</strong>ail should be given much more attention. B<strong>et</strong>ter knowledge of food production <strong>in</strong> different<br />
climates is needed. As <strong>in</strong>terest <strong>in</strong> climate impacts of food grows, the need for more d<strong>et</strong>ailed assessment<br />
m<strong>et</strong>hods is urgent.<br />
6. References<br />
Australian national greenhouse accounts, 2010. National Inventory Report 2010. Vol. 1. The Australian Government Submission to<br />
the United Nations Framework Convention on Climate Change April <strong>2012</strong><br />
Barton, L., Kiese, R., Gatter, D., Butterbach-Bahl, K., Buck, R., H<strong>in</strong>z, C., Murphy, D.V., 2008. Nitrous Oxide Emissions from a<br />
Cropped Soil <strong>in</strong> a Semi-Arid Climate. Glob. Change Biol., 14, 177–192.<br />
175
PARALLEL SESSION 2B: EMISSIONS MODELLING 8 th Int. Conference on <strong>LCA</strong> <strong>in</strong> the<br />
Agri-<strong>Food</strong> Sector, 1-4 Oct <strong>2012</strong><br />
Biswas, W. K., Barton, L., Carter, D., 2008. Global warm<strong>in</strong>g potential of wheat production <strong>in</strong> Western Australia: a <strong>LCA</strong>. Water and<br />
Environment Journal, 22, 3, 206-216.<br />
Statistics F<strong>in</strong>land, 2011. Greenhouse gas emissions <strong>in</strong> F<strong>in</strong>land 1990-2009. National Inventory Report under the UNFCCC and the<br />
Kyoto Protocol. Statistics F<strong>in</strong>land.<br />
IPCC, 1996. Revised 1996 IPCC Guidel<strong>in</strong>es for National Greenhouse Gas Inventories: Workbook. Volume 2. Intergovernmental<br />
Panel on Climate Change.<br />
IPCC, 2006. IPCC Guidel<strong>in</strong>es for National Greenhouse Gas Inventories. Intergovernmental Panel on Climate Change. National<br />
Greenhouse Gas Inventories Programme. Onl<strong>in</strong>e at http://www.ipccnggip.iges.or.jp/public/2006gl/<strong>in</strong>dex.html.<br />
IPCC, 2007. Climate Change 2007: The Physical Science Basis. Contribution of Work<strong>in</strong>g Group I to the Fourth Assessment Report<br />
of the Intergovernmental Panel on Climate Change [Solomon, S., D. Q<strong>in</strong>, M. Mann<strong>in</strong>g, Z. Chen, M. Marquis, K.B. Averyt, M.<br />
Tignor and H.L. Miller (eds.)]. Cambridge University Press, Cambridge, UK and New York, NY, USA, 2007, 996 pp.<br />
Pulkk<strong>in</strong>en, H., Katajajuuri, J.-M., Nousia<strong>in</strong>en, J., Silvenius F., 2010. Challenges <strong>in</strong> the comparability of carbon footpr<strong>in</strong>t studies of<br />
food products. In: Proceed<strong>in</strong>gs of <strong>LCA</strong> food 2010. Vol. 2, 65-70.<br />
Reg<strong>in</strong>a, K., Kaseva, J., Esala, M., <strong>2012</strong>. Emissions of nitrous oxide from boreal agricultural m<strong>in</strong>eral soils – statistical models based<br />
on measurements. Submitted to Agriculture, Ecosystems & Environment.<br />
Snyder, C.S., Bruulsema, T.W., Jensen, T.L., Fixen, P.E., 2009. Review of greenhouse gas emissions from crop production systems<br />
and fertiliser management effects. Agriculture, Ecosyst. Env. 133, 247–266.<br />
Statistics F<strong>in</strong>land, <strong>2012</strong>. Greenhouse gas emissions <strong>in</strong> F<strong>in</strong>land 1990-2010. National Inventory Report under the UNFCCC and the<br />
Kyoto Protocol. April <strong>2012</strong>.<br />
176
PARALLEL SESSION 2B: EMISSIONS MODELLING 8 th Int. Conference on <strong>LCA</strong> <strong>in</strong> the<br />
Agri-<strong>Food</strong> Sector, 1-4 Oct <strong>2012</strong><br />
Modell<strong>in</strong>g N2O emissions from organic fertilisers for <strong>LCA</strong> <strong>in</strong>ventories<br />
Matthias S. Meier * , Christian Schader, Alfred Berner, Andreas Gatt<strong>in</strong>ger<br />
FiBL - Research Institute of Organic Agriculture, Ackerstrasse, CH-5070 Frick, Switzerland<br />
Correspond<strong>in</strong>g author e-mail: matthias.meier@fibl.org<br />
ABSTRACT<br />
Apart from m<strong>in</strong>eral fertilisers, organic fertilisers act ma<strong>in</strong>ly via the soil C-N pool <strong>in</strong> order to provide available nitrogen to plants. This<br />
different mode of action is not reflected so far <strong>in</strong> the current IPCC N2O emission model. Here we propose a simple model to calculate<br />
N2O emissions from organic fertilisers and plant residues. It considers the long-term immobilisation of N with<strong>in</strong> stable organic matter<br />
<strong>in</strong> the soil as well as the m<strong>in</strong>eralisation of additional N from the soil pool. A first test with field data showed reliable simulations of<br />
measured N2O emissions. By compar<strong>in</strong>g values generated by our model with values generated by the IPCC model we show that the<br />
IPCC model may overestimate emissions from organic fertilisers. Therefore, with<strong>in</strong> <strong>LCA</strong> <strong>in</strong>ventories modell<strong>in</strong>g of soil borne N2O<br />
emissions from organic fertilisers and crop residues should consider the different dynamics of N via the C-N pool <strong>in</strong> the soil.<br />
Keywords: soil borne nitrous oxide emissions, agricultural <strong>in</strong>ventory data, organic fertilisers, crop residues<br />
1. Introduction<br />
The IPCC model for d<strong>et</strong>erm<strong>in</strong><strong>in</strong>g nitrous oxide (N2O) emissions from soils (IPCC, 2006) – orig<strong>in</strong>ally developed<br />
for the report<strong>in</strong>g of national GHG <strong>in</strong>ventories – is widely used with<strong>in</strong> life cycle assessment (<strong>LCA</strong>) <strong>in</strong>ventories<br />
to calculate soil N2O emissions from agricultural products and processes. This emission factor<br />
based model considers the total N <strong>in</strong>put by fertilisation and plant residues to estimate cumulative direct and<br />
<strong>in</strong>direct N2O emissions from soils. Regard<strong>in</strong>g direct N2O emissions, the model does not differentiate b<strong>et</strong>ween<br />
different fertiliser types, i.e., nitrogen from m<strong>in</strong>eral vs. organic sources <strong>in</strong>clud<strong>in</strong>g plant residues.<br />
However, there is grow<strong>in</strong>g evidence that N2O emissions from organic fertilisers may be different from<br />
emissions from m<strong>in</strong>eral fertilisers. First, from nitrogen-use efficiency studies it is known that m<strong>in</strong>eral and<br />
organic fertilisers differ <strong>in</strong> their mode of action through the way nutrients are transformed <strong>in</strong> the soil and<br />
utilised by plants (Gutser <strong>et</strong> al., 2005). In organic fertilisers only a fraction of the total N is readily available<br />
for plants (as NH4 + -N and NO3 - -N). This fraction ranges from up to 85% of total N <strong>in</strong> poultry slurry down to<br />
0% <strong>in</strong> compost. The rest of the total N <strong>in</strong> organic fertilisers is organically bound enter<strong>in</strong>g the C-N-pool of the<br />
soil where it is released <strong>in</strong> the mid- and long-term by microbial degradation. By calculat<strong>in</strong>g N2O emissions<br />
based on total N <strong>in</strong> the IPCC model the different mode of action of organic fertilisers is ignored.<br />
Second, 15 N tracer studies with monitor<strong>in</strong>g periods of up to 9 years <strong>in</strong>dicate that N losses from m<strong>in</strong>eral<br />
fertiliser are higher than from (organic) crop residue <strong>in</strong>put (Delgado <strong>et</strong> al., 2010). Aga<strong>in</strong>, the higher immobilisation<br />
of N from crop residues with<strong>in</strong> the C-N-pool is made responsible for the lower N losses dur<strong>in</strong>g the<br />
monitor<strong>in</strong>g period. Us<strong>in</strong>g model simulations Delgado <strong>et</strong> al., (2008) showed that <strong>in</strong> support with 15 N tracer<br />
studies N losses through leach<strong>in</strong>g and N2O emissions from crop residue sources are lower compared to m<strong>in</strong>eral<br />
fertiliser. Based on these simulation results they argue that the IPCC N2O emission model (IPCC, 2006)<br />
overestimates N2O emissions from crop residues.<br />
Third, Alluvione <strong>et</strong> al., (2010) measured significantly lower N2O emissions from compost compared to<br />
urea <strong>in</strong> corn fields. In this study, N2O emissions were only measured dur<strong>in</strong>g the veg<strong>et</strong>ation period of the crop<br />
and therefore, no conclusions can be drawn regard<strong>in</strong>g the long-term emissions result<strong>in</strong>g from the different<br />
fertilisers. Nevertheless, the study by Alluvione <strong>et</strong> al., (2010) showed that there are measurable differences <strong>in</strong><br />
N2O emissions b<strong>et</strong>ween m<strong>in</strong>eral and organic fertilisers as well as with<strong>in</strong> different organic fertilisers.<br />
Due to the different dynamics of N from organic <strong>in</strong>put sources, different N2O emissions from organic fertilisers<br />
and crop residues compared to m<strong>in</strong>eral fertiliser can be expected. Therefore, N2O emissions from<br />
organic fertilisers and plant residues should be modelled differently from m<strong>in</strong>eral fertiliser. This is of special<br />
relevance when the GWP of crops fertilised ma<strong>in</strong>ly or exclusively with organic fertilisers (e.g. from organic<br />
farm<strong>in</strong>g) are to be compared with the GWP of crops fertilised with m<strong>in</strong>eral fertilisers.<br />
We developed a simple model tak<strong>in</strong>g <strong>in</strong>to account the different mode of action of organic fertilisers. The<br />
accuracy of the model was tested us<strong>in</strong>g measured N2O emissions from a 3-year study. A comparison of the<br />
model calculations from the IPCC N2O emission model (IPCC, 2006) was made us<strong>in</strong>g data from a long-term<br />
field trial at the Research Institute of Organic Agriculture (FiBL), Frick, Switzerland.<br />
177
PARALLEL SESSION 2B: EMISSIONS MODELLING 8 th Int. Conference on <strong>LCA</strong> <strong>in</strong> the<br />
Agri-<strong>Food</strong> Sector, 1-4 Oct <strong>2012</strong><br />
2. M<strong>et</strong>hods<br />
2.1. Model description<br />
Our model considers the C and N <strong>in</strong>put through organic fertilisers and plant residues brought onto and <strong>in</strong>to<br />
the soil (Fig. 1). A fraction of the total N <strong>in</strong>put (Ntot) is readily available for plants (Navailable) and the rema<strong>in</strong><strong>in</strong>g<br />
fraction of Ntot is organically bound enter<strong>in</strong>g the C-N pool of the soil (NC-N-pool). In contrast to the IPCC<br />
model (IPCC, 2006) where direct and <strong>in</strong>direct emissions are calculated from total N <strong>in</strong>put our model differentiates<br />
b<strong>et</strong>ween direct and <strong>in</strong>direct N2O emissions from Navailable and from the plant available N aris<strong>in</strong>g from<br />
the C-N pool of the soil (Navailable C-N pool). Total N2O emissions from managed soils are than calculated accord<strong>in</strong>g<br />
to Eq. 1:<br />
178<br />
N2Ototal emission = N2Odirect-Navailable + N2O<strong>in</strong>direct-Navailable<br />
Eq. 1<br />
+<br />
N2Odirect-Navailable C-N pool + N2O<strong>in</strong>direct-Navailable C-N pool<br />
Direct and <strong>in</strong>direct N2O emissions from Navailable (Loss 1 <strong>in</strong> Fig. 1) are calculated us<strong>in</strong>g the IPCC emission<br />
factors (IPCC, 2006) accord<strong>in</strong>g to Eq. 2 and 3:<br />
N2Odirect-Navailable = 0.01 × Navailable<br />
N2O<strong>in</strong>direct-Navailable = 0.01 × (NH3-Navailable + NOx-Navailable) + 0.0075 × NO3 - -Navailable<br />
Direct and <strong>in</strong>direct N2O emissions from Navailable C-N pool (Loss 2 <strong>in</strong> Fig. 1) are calculated us<strong>in</strong>g the IPCC<br />
emission factors (IPCC, 2006) accord<strong>in</strong>g to Eq. 4 and 5:<br />
N2Odirect-Navailable C-N pool = 0.01 × Navailable C-N pool<br />
N2O<strong>in</strong>direct-Navailable C-N pool = 0.0075 × NO3 - -Navailable C-N pool + 0.01 × NOx-Navailable C-N pool<br />
For the fate of NC-N pool, which equals (Ntot – Navailable), two pools are differentiated <strong>in</strong> the model (Fig. 1)<br />
based on a simplified model on sequestration of soil organic carbon (SOC) proposed by Favo<strong>in</strong>o and Hogg<br />
(2008). These two pools differ <strong>in</strong> their stability of the organic matter with fractions of short-term available C<br />
and N (short-term C-N pool) and stable fractions (long-term C-N pool) where C and N is captured for several<br />
100 of up to a 1’000 years (Nimmobilised) (Favo<strong>in</strong>o and Hogg, 2008). From both pools m<strong>in</strong>eralisation takes<br />
place.<br />
In soils with a build-up of SOC, e.g. through high organic matter <strong>in</strong>put by organic fertilisers and/or conservation<br />
tillage, m<strong>in</strong>eralisation from the long-term C-N pool takes place at a much lower rate than at which<br />
readily available organic matter is converted to stable organic matter (Favo<strong>in</strong>o and Hogg, 2008). In this case<br />
the result is a n<strong>et</strong> capture of N <strong>in</strong> stable organic matter (Nimmobilised) and therefore, no N2O emissions will result<br />
from this N <strong>in</strong> the long term. Navailable C-N pool is then calculated by Eq. 6:<br />
Navailable C-N pool = NC-N pool – Nimmobilised<br />
Once the long-term C-N pool is saturated no additional N is captured. Therefore, all N be<strong>in</strong>g processed<br />
via the soil C-N pool (NC-N pool) will be available short-term.<br />
In soils with degradation of SOC due to low organic matter <strong>in</strong>put and/or non-conserv<strong>in</strong>g tillage techniques<br />
m<strong>in</strong>eralisation outweighs immobilisation. Additional N from the C-N pool is m<strong>in</strong>eralised (Nm<strong>in</strong>eralised).<br />
In this case Navailable C-N pool is calculated by Eq. 7:<br />
Navailable C-N pool = NC-N pool + Nm<strong>in</strong>eralised<br />
Due to the coupled biogeochemical cycles of C and N the amounts of Nimmobilised and Nm<strong>in</strong>eralised can be d<strong>et</strong>erm<strong>in</strong>ed<br />
from the C fluxes consist<strong>in</strong>g of an <strong>in</strong>put flux (C<strong>in</strong>put) <strong>in</strong>to the soil, a build-up or degradation of soil<br />
organic carbon (SOC) with<strong>in</strong> the soil and an output flux (Coutput) from the soil. If two of these 3 fluxes are<br />
known the third is d<strong>et</strong>erm<strong>in</strong>ed by Eq 7:<br />
Eq. 2<br />
Eq. 3<br />
Eq. 4<br />
Eq. 5<br />
Eq. 6<br />
Eq. 7<br />
C<strong>in</strong>put – Coutput = SOC Eq. 8
PARALLEL SESSION 2B: EMISSIONS MODELLING 8 th Int. Conference on <strong>LCA</strong> <strong>in</strong> the<br />
Agri-<strong>Food</strong> Sector, 1-4 Oct <strong>2012</strong><br />
C<strong>in</strong>put is calculated by add<strong>in</strong>g the amounts of C <strong>in</strong> the organic fertilisers and the C <strong>in</strong> the crop residues.<br />
Above and below ground crop residues can be d<strong>et</strong>erm<strong>in</strong>ed by us<strong>in</strong>g the default factors for crop residue estimation<br />
with<strong>in</strong> Chapter 11 of Volume 4 of the IPCC guidel<strong>in</strong>es (IPCC, 2006). If measurements of either SOC<br />
or CO2 emissions from the soil are available these can be used with<strong>in</strong> Eq. 8. However, measurements of CO2<br />
emissions <strong>in</strong>clude CO2 form soil microbial activity as well as from root respiration. Therefore, us<strong>in</strong>g CO2<br />
emission measurements with<strong>in</strong> Eq. 8 will result <strong>in</strong> an underestimation of a ga<strong>in</strong> <strong>in</strong> SOC if C<strong>in</strong>put > Coutput and<br />
an overestimation of a loss <strong>in</strong> SOC if C<strong>in</strong>put < Coutput. If no measurements are available the IPCC guidel<strong>in</strong>es<br />
provide <strong>in</strong> Chapter 2 of Volume 4 a simple model to estimate annual changes <strong>in</strong> SOC based on soil type,<br />
climatic conditions and cultivation practices (IPCC, 2006).<br />
The amount of Nimmobilised can be d<strong>et</strong>erm<strong>in</strong>ed by estimat<strong>in</strong>g the amount of stable C with<strong>in</strong> the SOC for example<br />
by us<strong>in</strong>g the simple model described <strong>in</strong> Favo<strong>in</strong>o and Hogg (2008). Us<strong>in</strong>g this model, a percentage<br />
typical of Northern European areas of 35% of SOC transformed <strong>in</strong>to stable organic matter was used <strong>in</strong> our<br />
model calculations. Besides climatic conditions this percentage further depends on the soil texture and on<br />
how much carbon is already stored <strong>in</strong> the soil. For specific cases site-specific values have to be d<strong>et</strong>erm<strong>in</strong>ed.<br />
The amount of Nimmobilised <strong>in</strong> SOC is then d<strong>et</strong>erm<strong>in</strong>ed by Eq. 9:<br />
Nimmobilised = 0.35 × (C<strong>in</strong>put – Coutput) / C:Nsoil where (C<strong>in</strong>put > Coutput) Eq. 9<br />
Nm<strong>in</strong>eralised is d<strong>et</strong>erm<strong>in</strong>ed by Eq. 10:<br />
Nm<strong>in</strong>eralised = (Coutput – C<strong>in</strong>put) / C:Nsoil where (Coutput > C<strong>in</strong>put) Eq. 10<br />
The use of the model is not restricted to organic fertilisers. Of course it can also be used for m<strong>in</strong>eral fertiliser.<br />
In that case Navailable equals the N from the m<strong>in</strong>eral fertiliser and NC-N pool orig<strong>in</strong>ates from plant residues<br />
only.<br />
Figure 1. Soil N2O emission model for organic fertilisers.<br />
2.2. Model test<strong>in</strong>g<br />
The data s<strong>et</strong> from Ellert and Janzen (2008) monitor<strong>in</strong>g year-round N2O, CO2 and CH4 emissions <strong>in</strong> different<br />
crop rotations for 3 years <strong>in</strong> Alberta, Canada was used to test the accuracy of our newly developed model.<br />
S<strong>in</strong>ce <strong>in</strong>direct N2O emissions are not captured by field measurements, only direct emissions were considered<br />
<strong>in</strong> the model calculations for this test.<br />
One crop rotation <strong>in</strong> Ellert and Janzen (2008) was legume based with alfalfa-alfalfa-alfalfa-wheat-barley<br />
and a second crop rotation was a N-demand<strong>in</strong>g sequence with corn-wheat-corn-wheat-barley. Emission<br />
measurements started <strong>in</strong> 2001 when the rotations were <strong>in</strong> the 3 rd phase and lasted until 2003. In each of the<br />
179
PARALLEL SESSION 2B: EMISSIONS MODELLING 8 th Int. Conference on <strong>LCA</strong> <strong>in</strong> the<br />
Agri-<strong>Food</strong> Sector, 1-4 Oct <strong>2012</strong><br />
two crop rotations 4 different fertiliser treatments were applied: zero fertiliser, solid beef cattle manure from<br />
feedlots, ammonium nitrate, and ammonium nitrate comb<strong>in</strong>ed with solid manure. S<strong>in</strong>ce the publication by<br />
Ellert and Janzen (2008) provides no data on the achieved crop yields dur<strong>in</strong>g the years under study and these<br />
are needed <strong>in</strong> the model to calculate the C <strong>in</strong>put flux and the amounts of crop residues, average yield data for<br />
Alberta, Canada was taken from official statistics of the respective years (Alberta Agriculture and <strong>Food</strong>,<br />
2007). Data on N content, yields and amount of residues from alfalfa after consecutive years of cultivation<br />
were taken from Jung (2003). All other crop residues were d<strong>et</strong>erm<strong>in</strong>ed us<strong>in</strong>g the default factors for estimation<br />
of N added to soils from crop residues with<strong>in</strong> the IPCC guidel<strong>in</strong>es (IPCC, 2006). The C:N ratio of the<br />
Chernozem soil on which the study was carried out was taken from FAO (2001). Additional <strong>in</strong>formation on<br />
nutrient composition of solid beef cattle manure from feedlots not provided <strong>in</strong> Ellert and Janzen (2008) were<br />
taken from Kiss<strong>in</strong>ger <strong>et</strong> al., (2007).<br />
2.3. Model comparison<br />
We further calculated N2O emissions with our model us<strong>in</strong>g data from an organic long-term field trial at the<br />
Research Institute of Organic Agriculture (FiBL), Switzerland, which compares effects of reduced versus<br />
conventional tillage on soil quality (Berner <strong>et</strong> al., 2008). From this field trial measured data on soil carbon<br />
stocks, amounts and composition of fertilisers used and crop yields are available. Beef cattle slurry was used<br />
as organic fertiliser. The N2O emissions d<strong>et</strong>erm<strong>in</strong>ed by our model were compared with the emissions’ calculations<br />
from the IPCC model. Regard<strong>in</strong>g <strong>in</strong>direct N2O emissions only emissions through volatilisation of N<br />
as NH3 were considered <strong>in</strong> the comparative calculations us<strong>in</strong>g an emission factor specific to Switzerland.<br />
3. Results<br />
The correlation of simulated direct N2O emissions with the measured values from the study of Ellert and<br />
Janzen (2008) is strong with a correlation coefficient of around 0.84 (Fig. 2). The 4 different fertiliser treatments<br />
were modelled with high reliability.<br />
Figure 2: Simulated versus measured N2O emissions (Ellert and Janzen, 2008) from two different crop rotations<br />
and 4 different fertiliser treatments each used to test the model.<br />
The comparison of calculations from our model with calculations from the IPCC model (IPCC, 2006) us<strong>in</strong>g<br />
data from an organic field trial yielded 9% lower emissions on average over the entire crop rotation for<br />
the conventional tilled plots (Table 1). For the reduced tilled plots our model calculations resulted <strong>in</strong> 23%<br />
lower emissions on average over the entire crop rotation than the emissions calculated with the IPCC model.<br />
180
PARALLEL SESSION 2B: EMISSIONS MODELLING 8 th Int. Conference on <strong>LCA</strong> <strong>in</strong> the<br />
Agri-<strong>Food</strong> Sector, 1-4 Oct <strong>2012</strong><br />
Table 1. Comparison of model calculations.<br />
Conventional tillage Reduced tillage<br />
N2O<br />
sionsemis-<br />
based Difference on<br />
N2O<br />
sionsemis-<br />
based Difference on<br />
N2O emissons<br />
based on new<br />
on<br />
2006<br />
IPCC<br />
model<br />
the basis of<br />
IPCC model<br />
N2O emissons<br />
based on new<br />
on<br />
2006<br />
IPCC<br />
model<br />
the basis of<br />
IPCC model<br />
Crop rotation model [kg/ha] [kg/ha] <strong>in</strong> [%] model [kg/ha] [kg/ha] <strong>in</strong> [%]<br />
W<strong>in</strong>ter wheat 3.52 3.80 -7 2.96 3.69 -20<br />
Sunflower 2.26 2.44 -8 1.96 2.45 -20<br />
Spealt 2.88 3.11 -7 2.89 3.43 -16<br />
Clover grass 3.16 3.48 -9 2.62 3.60 -27<br />
Clover grass 5.66 5.93 -5 5.50 6.32 -13<br />
Silage corn 1.21 1.42 -15 1.88 2.86 -34<br />
W<strong>in</strong>ter wheat 1.93 2.14 -10 1.65 2.28 -28<br />
Average -9 -23<br />
4. Discussion<br />
Our model presented <strong>in</strong> Fig. 1 reflects the nature of organic fertilisers consider<strong>in</strong>g its predom<strong>in</strong>ant mode of<br />
action via the soil C-N pool. By <strong>in</strong>tegrat<strong>in</strong>g the coupled biogeochemical cycles of C and N, nitrogen immobilisation<br />
and m<strong>in</strong>eralisation are <strong>in</strong>cluded <strong>in</strong> the N2O emission calculations. Different organic fertilisers are<br />
differentiated <strong>in</strong> the model by the fraction of available N, organically bound N, and the C content. Other<br />
characteristics of organic fertilisers such as the liquid phase <strong>in</strong> the case of slurry are not considered <strong>in</strong> the<br />
model. Even though due to its liquid phase slurry might enhance denitrification and by that possibly leads to<br />
higher N2O emissions. However, compared to solid organic fertilisers this characteristic of slurry might be of<br />
significant difference <strong>in</strong> the first period after application only. Our model calculates long term N2O emissions<br />
from annual N <strong>in</strong>puts where such short-term effects are <strong>in</strong>terfered with climatic conditions such as temperature<br />
and precipitation. Site specific climatic conditions can be considered <strong>in</strong> the model by us<strong>in</strong>g site specific<br />
emission factors.<br />
A first test with measured N2O emissions shows a high correlation to the N2O emissions calculated by our<br />
model (Fig. 2). Different fertiliser treatments <strong>in</strong>clud<strong>in</strong>g m<strong>in</strong>eral fertiliser and plant residues only were reliably<br />
calculated. The reason for the fact that the model didn’t reproduce the exact measured values is because<br />
we used the default IPCC emission factors (IPCC, 2006). Us<strong>in</strong>g site-specific emission factors the model will<br />
produce the measured values with high accuracy.<br />
In cases where there is a build-up of SOC like under reduced or no-tillage cultivation practices comb<strong>in</strong>ed<br />
with high organic matter <strong>in</strong>put through organic fertilisers and crop residues our model calculates lower N2O<br />
emission due to a higher long-term immobilisation of N (Table 1). There are studies, though, that show<br />
higher denitrification activities under reduced or no tillage cultivation practices than under conventional tillage<br />
result<strong>in</strong>g <strong>in</strong> higher N2O emissions (Palma <strong>et</strong> al., 1997; Ste<strong>in</strong>bach and Alvarez, 2006). However, the<br />
mean<strong>in</strong>g of such studies for long-term emission patterns under reduced or no-tillage management are still<br />
unsure and discussed controversially (Mummey <strong>et</strong> al., 1998; Six <strong>et</strong> al., 2004; Ste<strong>in</strong>bach and Alvarez, 2006).<br />
In a m<strong>et</strong>a-analysis Ste<strong>in</strong>bach and Alvarez (2006) found <strong>in</strong> Pampean agroecosystems <strong>in</strong>creas<strong>in</strong>g N2O emissions<br />
under no-till. The authors conclude that the mitigation potential of no-till due to C sequestration might<br />
be overcome <strong>in</strong> about 35 years. In contrast, Six <strong>et</strong> al., (2004) showed <strong>in</strong> a literature review analys<strong>in</strong>g studies<br />
that compared no- and conventional tillage, N2O emissions seem to <strong>in</strong>crease <strong>in</strong> newly converted no-tillage<br />
systems but over a period of 10 years <strong>in</strong> humid climates and a period of 20 years <strong>in</strong> dry climates N2O emissions<br />
decrease and overall n<strong>et</strong> GWP is reduced under no-tillage cultivation practices. Further, <strong>in</strong> cases where<br />
there is a build-up of SOC our model would also deliver lower N2O emissions for m<strong>in</strong>eral fertiliser applied<br />
under reduced or no-tillage cultivation practices due to immobilisation of N from crop residue decomposition.<br />
5. Conclusion<br />
Our model-simulations support earlier f<strong>in</strong>d<strong>in</strong>gs that the IPCC model overestimates N2O emissions from organic<br />
fertilisers <strong>in</strong> certa<strong>in</strong> cases. However, our model has to be further validated with field measurements of<br />
N2O especially under cultivation practices that result <strong>in</strong> a build-up of SOC.<br />
By <strong>in</strong>clud<strong>in</strong>g N m<strong>in</strong>eralisation and immobilisation <strong>in</strong> N2O emissions’ calculations our model reflects field<br />
situations with higher accuracy than the IPCC 2006 model. It accounts for the different dynamics of N from<br />
organic fertilisers and crop residues. By <strong>in</strong>clud<strong>in</strong>g the C cycle, which is <strong>in</strong>fluenced by climatic conditions,<br />
soil conditions, and management practices, factors beyond the N <strong>in</strong>put <strong>in</strong>fluenc<strong>in</strong>g N2O emissions are also<br />
181
PARALLEL SESSION 2B: EMISSIONS MODELLING 8 th Int. Conference on <strong>LCA</strong> <strong>in</strong> the<br />
Agri-<strong>Food</strong> Sector, 1-4 Oct <strong>2012</strong><br />
considered. The <strong>in</strong>tegration of the coupled biogeochemical cycl<strong>in</strong>g of C and N <strong>in</strong> our model further allows<br />
for <strong>in</strong>clusion of C sequestration.<br />
Based on our results, when modell<strong>in</strong>g soil borne N2O emissions with<strong>in</strong> <strong>LCA</strong> <strong>in</strong>ventories from organic fertilisers<br />
and crop residues we propose to take <strong>in</strong>to account the N pathway via the C-N pool of the soil us<strong>in</strong>g<br />
our model.<br />
6. References<br />
Alberta Agriculture and <strong>Food</strong>, 2007. Alberta agriculture statistics yearbook 2006. Alberta Agriculture and <strong>Food</strong>, Economics and<br />
Comp<strong>et</strong>itiveness Division, Statistics and Data Development Unit, Edmonton, Canada.<br />
Alluvione, F., Bertora, C., Zavattaro, L., Grignani, C., 2010. Nitrous Oxide and Carbon Dioxide Emissions Follow<strong>in</strong>g Green Manure<br />
and Compost Fertilization <strong>in</strong> Corn. Soil. Sci. Soc. Am. J. 74, 384-395.<br />
Berner, A., Hildermann, I., Fließbach, A., Pfiffner, L., Niggli, U., Mäder, P., 2008. Crop yield and soil fertility response to reduced<br />
tillage under organic management. Soil Till. Res. 101, 89-96.<br />
Delgado, J.A., Del Grosso, S.J., Ogle, S.M., 2010. (15)N isotopic crop residue cycl<strong>in</strong>g studies and model<strong>in</strong>g suggest that IPCC m<strong>et</strong>hodologies<br />
to assess residue contributions to N(2)O-N emissions should be reevaluated. Nutr. Cycl. Agroecosys. 86, 383-390.<br />
Ellert, B.H., Janzen, H.H., 2008. Nitrous oxide, carbon dioxide and m<strong>et</strong>hane emissions from irrigated cropp<strong>in</strong>g systems as <strong>in</strong>fluenced<br />
by legumes, manure and fertilizer. Can. J. Soil Sci. 88, 207-217.<br />
FAO, 2001. Lecture notes on the major soils of the world. World soil resources reports, Vol. 94; FAO, Rome.<br />
Favo<strong>in</strong>o, E., Hogg, D., 2008. the potential role of compost <strong>in</strong> reduc<strong>in</strong>g greenhouse gases. Waste Manage. Res. 26, 61-69.<br />
Gutser, R., Ebertseder, T., Weber, A., Schraml, M., Schmidhalter, U., 2005. Short-term and residual abailabiltiy of nitrogen after<br />
long-term application of organic fertilizers on arable land. J. Plant Nutr. Soil Sci. 168, 439-446.<br />
IPCC, 2006. 2006 IPCC Guidel<strong>in</strong>es for national greenhouse gas <strong>in</strong>ventories. Volume 4 Agriculture, forestry and other land use.<br />
Hayama, Japan.<br />
Jung, R., 2003. Stickstoff-Fixierleistung von Luzerne (Medicago sativa L.), Rotklee (Trifolium pratense L.) und Persischme Klee<br />
(Trifolium resup<strong>in</strong>atum L.) <strong>in</strong> Re<strong>in</strong>saat und Gemenge mit Poaceen. Experimentelle Grundlagen und Kalkulationsverfahren zur<br />
Ermittlung der Stickstoff-Flächenbilanz. Fakultät für Agrarwissenschaften. Georg-August-Universität Gött<strong>in</strong>gen, Gött<strong>in</strong>gen, p.<br />
366.<br />
Kiss<strong>in</strong>ger, W.F., Koelsch, R.K., Erickson, G.E., Klopfenste<strong>in</strong>, T.J., 2007. Characteristics of manure harvested from beef cattle feedlots.<br />
Appl. Eng. Agric. 23, 357-365.<br />
Mummey, D.L., smith, J.L., Bluhm, G., 1998. Assessment of alternative soil management practices on N2O emissions from US<br />
agriculture. Agr. Ecosyst. Environ. 70, 79-87.<br />
Palma, R.M., Rímolo, M., Saubid<strong>et</strong>, M.I., Conti, M.E., 1997. Influence of tillage system on denitrification <strong>in</strong> maize-cropped soils.<br />
Biol. Fert. Soils 25, 142-146.<br />
Six, J., Ogle, S.M., Breidt, J.F., Conant, R.T., Mosier, A.R., Paustian, K., 2004. The potential to mitigate global warm<strong>in</strong>g with notillage<br />
management is only realized when practised <strong>in</strong> the long term. Global Change Biol. 10, 155-160.<br />
Ste<strong>in</strong>bach, H.S., Alvarez, R., 2006. Changes <strong>in</strong> soil organic carbon contents and nitrous oxide emissions after <strong>in</strong>troduction of no-till<br />
<strong>in</strong> Pampean agroecosystems. J. Environ. Qual. 35, 3-13.<br />
182
PARALLEL SESSION 2C: QUANTIFICATION AND REDUCTION OF UNCERTAINTY 8 th Int. Conference on <strong>LCA</strong> <strong>in</strong> the<br />
Agri-<strong>Food</strong> Sector, 1-4 Oct <strong>2012</strong><br />
Susta<strong>in</strong>able meat consumption to me<strong>et</strong> climate and health goals -<br />
implications of variations <strong>in</strong> consumption statistics<br />
Parallel session 2c: Quantification and Reduction of Uncerta<strong>in</strong>ty<br />
El<strong>in</strong>or Hallström * , P. Börjesson<br />
Department of Technology and Soci<strong>et</strong>y, Environmental and Energy Systems Studies, Lund University, PO Box 118, SE-221 00<br />
Lund, Sweden.<br />
*Correspond<strong>in</strong>g author. E-mail: el<strong>in</strong>or.hallstrom@miljo.lth.se<br />
ABSTRACT<br />
To develop recommendations for susta<strong>in</strong>able meat consumption, e.g. from climate and health perspectives, there is a need for a correct<br />
understand<strong>in</strong>g of how much meat is produced and actually consumed. The purpose of this paper is to contribute to the understand<strong>in</strong>g<br />
of critical issues regard<strong>in</strong>g meat consumption statistics, its implication on <strong>LCA</strong> and recommendations of susta<strong>in</strong>able meat<br />
consumption levels. Depend<strong>in</strong>g on the way of present<strong>in</strong>g data, meat consumption levels per capita may differ by a factor two. This<br />
illustrates the importance of specify<strong>in</strong>g the functional unit and clearly def<strong>in</strong>e if it refers to meat <strong>in</strong>clud<strong>in</strong>g or exclud<strong>in</strong>g bones, <strong>in</strong>clud<strong>in</strong>g<br />
losses along the food cha<strong>in</strong>, or after weight reduction by cook<strong>in</strong>g, for a correct utilisation and <strong>in</strong>terpr<strong>et</strong>ation of meat consumption<br />
data and <strong>LCA</strong>’s of meat. The need for reductions <strong>in</strong> current meat consumption to me<strong>et</strong> climate and health goals is estimated to 0-75%<br />
and 0-50%, respectively, depend<strong>in</strong>g on the region.<br />
Keywords: meat consumption, statistics, <strong>LCA</strong>, climate, health<br />
1. Introduction<br />
<strong>Food</strong> production has been identified as one of the most important drivers of environmental pressures<br />
(EIPRO, 2006). To me<strong>et</strong> climate goals substantial mitigation efforts <strong>in</strong> the agriculture sector, estimated to<br />
account for about one third of anthropogenic greenhouse gas (GHG) emissions (Garn<strong>et</strong>t, 2011), will be<br />
needed. Results from life cycle assessments (<strong>LCA</strong>) normally show that animal based foods are more climate<br />
<strong>in</strong>tensive compared to plant based foods (FAO, 2006; 2009; Garn<strong>et</strong>t, 2009). Due to population growth and a<br />
transition towards <strong>in</strong>creased consumption of animal based products, global demand for livestock products are<br />
projected to double by 2050 compared to the year 2000 (FAO, 2006). Reduced meat consumption has been<br />
suggested to be a necessary measure for mitigat<strong>in</strong>g food related GHG emissions (Garn<strong>et</strong>t, 2011) and to have<br />
positive effects on public health <strong>in</strong> regions with affluent di<strong>et</strong> (McMichael <strong>et</strong> al., 2007). However, how much<br />
meat consumption needs to be reduced to reach a susta<strong>in</strong>able level, e.g. <strong>in</strong>clud<strong>in</strong>g both environmental and<br />
health aspects, is still uncerta<strong>in</strong>.<br />
To develop recommendations for susta<strong>in</strong>able meat consumption, e.g. based on <strong>LCA</strong> studies, there is a<br />
need for reliable data and a correct understand<strong>in</strong>g of how much meat is available for consumption and how<br />
much meat is actually consumed. Because different m<strong>et</strong>hods are used to produce data on meat consumption<br />
and because there is more than one def<strong>in</strong>ition of meat consumption (Hallström and Börjesson, <strong>2012</strong>), divergent<br />
<strong>in</strong>formation on how much meat is consumed is circulat<strong>in</strong>g <strong>in</strong> the literature and <strong>in</strong> media. For a correct<br />
utilisation and <strong>in</strong>terpr<strong>et</strong>ation of meat consumption statistics, e.g. <strong>in</strong> <strong>LCA</strong>, it is essential to be aware of how<br />
statistical data on meat consumption is developed and presented.<br />
The purpose of this paper is to contribute to the understand<strong>in</strong>g of critical issues regard<strong>in</strong>g meat consumption<br />
statistics, its implication on <strong>LCA</strong> and recommendations of susta<strong>in</strong>able meat consumption levels. The<br />
paper describes factors contribut<strong>in</strong>g to discrepancies <strong>in</strong> meat consumption data and illustrates the importance<br />
of correct def<strong>in</strong>ition of the functional unit, while explor<strong>in</strong>g estimates of susta<strong>in</strong>able meat consumption levels<br />
regard<strong>in</strong>g climate change and di<strong>et</strong>ary recommendations.<br />
2. M<strong>et</strong>hods<br />
Information about factors contribut<strong>in</strong>g to discrepancies <strong>in</strong> meat consumption statistics and their respective<br />
impact on data are based on the f<strong>in</strong>d<strong>in</strong>gs <strong>in</strong> an assessment by Hallström & Börjesson (<strong>2012</strong>). In order to illustrate<br />
how identified factors may contribute to discrepancies <strong>in</strong> data and to make relevant comparisons with<br />
goals for <strong>in</strong>creased susta<strong>in</strong>ability <strong>in</strong> meat consumption, meat consumption statistics provided by the<br />
FAOSTAT (data from 2007) is processed and categorised by us<strong>in</strong>g conversion factors stated <strong>in</strong> the literature.<br />
3. Results<br />
3.1 Factors contribut<strong>in</strong>g to discrepancy <strong>in</strong> meat consumption data<br />
<strong>Food</strong> consumption can be measured top-down, e.g. based on data of the agricultural supply or bottom-up<br />
e.g. based on data from Household Budg<strong>et</strong> Surveys or Individual Di<strong>et</strong>ary Surveys (Naska <strong>et</strong> al., 2009; West-<br />
183
PARALLEL SESSION 2C: QUANTIFICATION AND REDUCTION OF UNCERTAINTY 8 th Int. Conference on <strong>LCA</strong> <strong>in</strong> the<br />
Agri-<strong>Food</strong> Sector, 1-4 Oct <strong>2012</strong><br />
hoek <strong>et</strong> al., 2011). Factors identified to contribute to discrepancies b<strong>et</strong>ween meat consumption data are<br />
wh<strong>et</strong>her the weight of bones is <strong>in</strong>cluded, wh<strong>et</strong>her food waste <strong>in</strong> stages along the food cha<strong>in</strong> is accounted for,<br />
wh<strong>et</strong>her the weight refers to raw or cooked meat and wh<strong>et</strong>her <strong>in</strong>gredients of non-meat orig<strong>in</strong> <strong>in</strong> mixed processed<br />
meat products and ready meals are accounted for (Hallström and Börjesson, <strong>2012</strong>). Depend<strong>in</strong>g on the<br />
m<strong>et</strong>hod used to produce meat consumption statistics the data may refer to the available supply, the purchased<br />
amount or the amount of meat actually consumed. Meat consumption data can further be expressed either <strong>in</strong><br />
carcass weight, as a sum of pure meat and products of higher degree of process<strong>in</strong>g (e.g. mixed charcuteries<br />
and prepared meals) or <strong>in</strong> cooked amounts. M<strong>et</strong>hods to adjust for bones and food losses at different stages of<br />
the food cha<strong>in</strong> also vary among different ways of present<strong>in</strong>g meat consumption statistics.<br />
The quantitative example <strong>in</strong> Table 1 illustrates how meat consumption statistics may vary depend<strong>in</strong>g on<br />
the way of present<strong>in</strong>g data, i.e. if the data refer to the available supply of carcass <strong>in</strong>clud<strong>in</strong>g bones (A), bonefree<br />
meat (B), bone-free meat after adjustment for losses at r<strong>et</strong>ail and consumer level (C) or bone-free meat<br />
after adjustment for losses and weight reductions dur<strong>in</strong>g cook<strong>in</strong>g (D). Data on the available supply of carcass<br />
<strong>in</strong>clud<strong>in</strong>g bones (A) are based on meat consumption statistics from FAOSTAT (data from 2007). Bone-free<br />
meat (B) is assumed to correspond to 70% of the carcass weight. Accord<strong>in</strong>g to previous research bone-free<br />
meat represents on average 70% (Cederberg, 2009), 59% and 77% (Sonesson, 2010) of the carcass weight <strong>in</strong><br />
beef, pork and chicken, respectively. Based on an FAO report (FAO, 2011), a waste percentage of 15% has<br />
been assumed to adjust for losses at r<strong>et</strong>ail and consumer level (C) <strong>in</strong> North America, Oceania and Europe.<br />
Correspond<strong>in</strong>g losses for South America and Asia are assumed to be, on average, 13%, and for Africa, 11%<br />
(where the losses <strong>in</strong> sub-Sahara Africa correspond to around 9%). Weight reduction by cook<strong>in</strong>g (D) is assumed<br />
to correspond to 30% of the raw weight, a mean value of previous estimates vary<strong>in</strong>g b<strong>et</strong>ween 20-50%<br />
depend<strong>in</strong>g on the type of meat, m<strong>et</strong>hod and degree of cook<strong>in</strong>g (World Cancer Research Fund/American Institute<br />
for Cancer Research, 2007; KF & ICA Provkök, 2000). The data presented <strong>in</strong> Table 1 refer to average<br />
meat consumption, i.e. no difference is made regard<strong>in</strong>g variations <strong>in</strong> type of meat and differences <strong>in</strong> <strong>in</strong>take<br />
levels with<strong>in</strong> each region. Thus, to make more reliable estimations on a regional level, specific statistics regard<strong>in</strong>g<br />
the actual mix of meat consumed are needed. Also conversion factors used to quantify the data presented<br />
<strong>in</strong> column B-D are estimated averages. Thus, to improve the reliability <strong>in</strong> these data more extensive<br />
<strong>in</strong>formation of specific conditions is needed.<br />
Table 1. Per capita meat consumption (kg/year) <strong>in</strong> different world regions<br />
Region<br />
A a<br />
Raw meat<br />
<strong>in</strong>cl. bones<br />
B<br />
Raw meat excl.<br />
bones<br />
C<br />
B excl. losses <strong>in</strong> distribution<br />
and at consumer level<br />
D<br />
C after weight reduction by<br />
cook<strong>in</strong>g<br />
North America 120 84 71 50<br />
Oceania 115 81 68 48<br />
Europe 77 54 46 32<br />
South America 70 49 43 29<br />
Asia 28 20 17 12<br />
Africa 16 11 10 7<br />
a Data <strong>in</strong> column A are based on FAO statistics which refer to the average quantity of meat <strong>in</strong>clud<strong>in</strong>g most bones at the slaughter exit.<br />
Available supply is quantified as the sum of nationally produced meat plus meat imports m<strong>in</strong>us exports of meat, divided by the total<br />
population.<br />
3.2 Reductions <strong>in</strong> meat consumption to reach a susta<strong>in</strong>able level – two illustrative examples<br />
3.2.1 Climate perspective<br />
Due to human activities global GHG emissions have <strong>in</strong>creased by 70% dur<strong>in</strong>g the past 40 years (IPCC,<br />
2007). Scientific evidence <strong>in</strong>dicates that a temperature rise greater than 1.5-2°C compared to pre<strong>in</strong>dustrialised<br />
levels, may result <strong>in</strong> adverse effects <strong>in</strong>clud<strong>in</strong>g serious impact on the environment as well as<br />
future availability of food and water (IPCC, 2007; Stern, 2006). To <strong>in</strong>crease the chances of limit<strong>in</strong>g global<br />
warm<strong>in</strong>g to 1.5-2°C degrees, global GHG emissions will have to be halved by 2050 compared to levels <strong>in</strong><br />
1990, and <strong>in</strong> a long term perspective be limited from approximately 6-14 tonnes of CO2e per capita per year<br />
(global average and average <strong>in</strong> developed countries, respectively) to levels of 1 to 2 tonnes of CO2e per capita<br />
per year (European Commission, 2007; UNEP, 2010). <strong>Food</strong> production and consumption account for a<br />
significant proportion of global anthropogenic GHG emissions and overall environmental impact. Estimates<br />
from developed countries <strong>in</strong>dicate that GHG emissions embodied <strong>in</strong> the di<strong>et</strong> are <strong>in</strong> the range of 2-3 tonnes of<br />
CO2e per capita per year (Berners-Lee <strong>et</strong> al., <strong>2012</strong>; Nilsson <strong>et</strong> al., 2011), equivalent to about 15-28% of the<br />
overall national emissions (Garn<strong>et</strong>t, 2011). Meat has been identified as the food group responsible for the<br />
184
PARALLEL SESSION 2C: QUANTIFICATION AND REDUCTION OF UNCERTAINTY 8 th Int. Conference on <strong>LCA</strong> <strong>in</strong> the<br />
Agri-<strong>Food</strong> Sector, 1-4 Oct <strong>2012</strong><br />
majority of GHG emissions attributable to the food sector (Carlsson-Kanyama and Gonzalez, 2009; Garn<strong>et</strong>t,<br />
2011).<br />
From a climate perspective an average global per capita consumption of 25-33 kg of meat per year (68-90<br />
grams per day) has been suggested as a goal to stabilise global livestock related GHG emissions until 2050 at<br />
2000-2005 level (Garn<strong>et</strong>t, 2008; McMichael <strong>et</strong> al., 2007). The suggested levels by Garn<strong>et</strong>t (2008) and<br />
McMichael (2007) are quantified based on FAO data and thus refer to the available supply of raw meat <strong>in</strong>clud<strong>in</strong>g<br />
bones. From an <strong>LCA</strong> perspective, the correspond<strong>in</strong>g functional unit (FU) could be translated as kg<br />
produced raw meat <strong>in</strong>clud<strong>in</strong>g bones per capita per year. The estimated need for reductions <strong>in</strong> current meat<br />
consumption to me<strong>et</strong> climate goals is exemplified <strong>in</strong> Table 2. In this example the level of susta<strong>in</strong>able meat<br />
consumption is assumed to be 29 kg per capita per year, which is an average of the suggested amounts.<br />
3.2.2 Health perspective<br />
From a nutritional po<strong>in</strong>t of view there are no general recommendations of how much meat is considered<br />
to be optimal for health. Exist<strong>in</strong>g di<strong>et</strong>ary guidel<strong>in</strong>es are <strong>in</strong>stead usually based on levels that ensure sufficient<br />
<strong>in</strong>take of critical nutrients without exceed<strong>in</strong>g upper <strong>in</strong>take limits of nutrients associated to negative health<br />
effects. In di<strong>et</strong>ary guidel<strong>in</strong>es, meat is usually categorised with other prote<strong>in</strong> rich foods and suggested portion<br />
sizes and <strong>in</strong>take levels can vary (U.S. Department of Agriculture/U.S. Department of Health and Human<br />
Services, 2010; WHO, 2003). Accord<strong>in</strong>g to di<strong>et</strong>ary guidel<strong>in</strong>es <strong>in</strong> five different countries an <strong>in</strong>take b<strong>et</strong>ween<br />
50 and 100 g of cooked meat per day (18-37 kg per year) is suggested to provide a balanced nutrient <strong>in</strong>take<br />
(Hallström <strong>et</strong> al., 2011). To decrease the risk for cancer the World Cancer Research Fund (WCRF) further<br />
recommends that consumption of cooked red meat (e.g. beef, pork, lamb) should be restricted to maximum<br />
500 g per week (26 kg per year, i.e. 70 g per day) and that processed meat, such as bacon, salami, sausages<br />
<strong>et</strong>c., should be avoided (World Cancer Research Fund/American Institute for Cancer Research, 2007). In<br />
addition di<strong>et</strong>ary recommendations for healthy veg<strong>et</strong>arian di<strong>et</strong>s, without meat, are available (U.S. Department<br />
of Agriculture/U.S. Department of Health and Human Services, 2010). The recommendations of susta<strong>in</strong>able<br />
meat consumption from a health perspective are accord<strong>in</strong>gly based on the consumption of cooked meat. The<br />
correspond<strong>in</strong>g FU <strong>in</strong> an <strong>LCA</strong> could then be translated as kg consumed cooked meat per capita per year. The<br />
estimated need for reduction <strong>in</strong> current meat consumption to me<strong>et</strong> health goals is exemplified <strong>in</strong> Table 2. In<br />
this example the level of healthy meat consumption is s<strong>et</strong> to 26 kg per capita per year, which is <strong>in</strong> l<strong>in</strong>e with<br />
suggested amounts <strong>in</strong> di<strong>et</strong>ary guidel<strong>in</strong>es. The amount <strong>in</strong>cludes red and white meat but complies with the<br />
recommendation by the WCRF which refers to a maximum <strong>in</strong>take of red meat.<br />
Table 2. Estimated need for reductions <strong>in</strong> meat consumption to me<strong>et</strong> climate and health goals a<br />
Region Reduction needed <strong>in</strong>% to me<strong>et</strong> climate goals Reduction needed <strong>in</strong>% to me<strong>et</strong> health goals<br />
North America 76 48<br />
Oceania 75 46<br />
Europe 62 19<br />
South America 59 13<br />
Asia None None<br />
Africa None None<br />
a To quantify the reductions <strong>in</strong> meat consumption needed to me<strong>et</strong> climate goals, data from column A <strong>in</strong> Table 1 has been compared<br />
with a consumption level of 29 kg per capita per year (FU: produced raw meat <strong>in</strong>clud<strong>in</strong>g bones). To quantify reductions needed to<br />
me<strong>et</strong> health goals data <strong>in</strong> Table 1, column D has been compared with a consumption level of 26 kg per capita per year (FU: consumed<br />
cooked meat).<br />
4. Discussion<br />
Statistics on meat supply, based on the production of raw meat <strong>in</strong>clud<strong>in</strong>g bones, are often the basis <strong>in</strong> describ<strong>in</strong>g<br />
the need for reduction <strong>in</strong> meat consumption to me<strong>et</strong> climate goals. In describ<strong>in</strong>g the need for reduction<br />
<strong>in</strong> meat consumption from a health perspective, on the other hand, data on the actual <strong>in</strong>take expressed as<br />
uncooked or cooked meat should preferably be used. From an <strong>LCA</strong> perspective, these two types of statistics<br />
represent two different functional units. There is an obvious risk of mix<strong>in</strong>g those different functional units<br />
when broaden<strong>in</strong>g the perspective <strong>in</strong> <strong>LCA</strong>’s, <strong>in</strong>clud<strong>in</strong>g, for example, a nutrition and health perspective.<br />
Depend<strong>in</strong>g on the type of statistics and way of describ<strong>in</strong>g data, the meat consumption level per capita<br />
may differ by a factor two, or more. If meat consumption statistics are used wrongly it may result <strong>in</strong> an <strong>in</strong>correct<br />
functional unit, which may <strong>in</strong>fluence the results and conclusions substantially. It is therefore crucial<br />
to specify the functional unit <strong>in</strong>, for example, <strong>LCA</strong>’s of meat and di<strong>et</strong>ary recommendations and clearly def<strong>in</strong>e<br />
if it refers to raw meat <strong>in</strong>clud<strong>in</strong>g or exclud<strong>in</strong>g bones, <strong>in</strong>clud<strong>in</strong>g losses <strong>in</strong> distribution and consumer level,<br />
or after weight reduction by cook<strong>in</strong>g.<br />
185
PARALLEL SESSION 2C: QUANTIFICATION AND REDUCTION OF UNCERTAINTY 8 th Int. Conference on <strong>LCA</strong> <strong>in</strong> the<br />
Agri-<strong>Food</strong> Sector, 1-4 Oct <strong>2012</strong><br />
This paper <strong>in</strong>dicates that the reductions needed <strong>in</strong> meat consumption to me<strong>et</strong> climate goals are considerable<br />
<strong>in</strong> all regions except Asia and Africa. In most regions there also seems to be a room for reduced consumption<br />
from a health perspective. The estimated needs for reduced meat consumption to reach a susta<strong>in</strong>able<br />
level are rough estimates which will vary depend<strong>in</strong>g on the consumption levels s<strong>et</strong> as a susta<strong>in</strong>able targ<strong>et</strong>.<br />
In order to development recommendations for susta<strong>in</strong>able food consumption the level of susta<strong>in</strong>able<br />
meat consumption needs to be studied more extensively <strong>in</strong> the future.<br />
5. Conclusion<br />
Depend<strong>in</strong>g on the type of statistics and way of present<strong>in</strong>g data, meat consumption levels per capita<br />
may differ by a factor two, or more.<br />
For a correct utilisation and <strong>in</strong>terpr<strong>et</strong>ation of meat consumption data and <strong>LCA</strong>’s of meat it is crucial<br />
to specify the functional unit, i.e. to clearly def<strong>in</strong>e if it refers to raw meat <strong>in</strong>clud<strong>in</strong>g or exclud<strong>in</strong>g<br />
bones, <strong>in</strong>clud<strong>in</strong>g losses along the food cha<strong>in</strong>, or after weight reduction by cook<strong>in</strong>g.<br />
The need for reductions <strong>in</strong> current meat consumption to me<strong>et</strong> climate and health goals is estimated to<br />
0-75% and 0-50%, respectively, depend<strong>in</strong>g on the region.<br />
The level of susta<strong>in</strong>able meat consumption needs to be studied more extensively <strong>in</strong> the future.<br />
6. References<br />
Berners-Lee, M., Hoolohan, C., Cammack, H., Hewitt, C.N., <strong>2012</strong>. The relative greenhouse gas impacts of realistic di<strong>et</strong>ary choices.<br />
Energy Policy 43, 184-190.<br />
Carlsson-Kanyama, A., Gonzalez, A.D., 2009. Potential contributions of food consumption patterns to climate change. Am J Cl<strong>in</strong><br />
Nutr 89, 1704-1709.<br />
Cederberg, C., Meyer, D., Flysjö, A., 2009. Life cycle <strong>in</strong>ventory of greenhouse gas emissions and use of land and energy <strong>in</strong> Brazilian<br />
beef production. Report No 792. Swedish Institute for <strong>Food</strong> and Biotechnology. Göteborg, Sweden.<br />
EIPRO, 2006. Analysis of the life cycle environmental impacts related to the total f<strong>in</strong>al consumption of the EU25. European Commission<br />
Technical Report. EUR 22284 EN.<br />
European Commission, 2007. Communication from the Commission to the Council, the European Parliament, the European Economic<br />
and Social Committee and the Committee of the Regions – Limit<strong>in</strong>g global climate change to 2 degrees Celsius - The way<br />
ahead for 2020 and beyond. Brussels, Belgium.<br />
FAO, 2006. Livestock's long shadow: environmental issues and options. <strong>Food</strong> and Agriculture Organization of the United Nations.<br />
Rome, Italy.<br />
FAO, 2009. The state of food and agriculture: Livestock <strong>in</strong> balance. <strong>Food</strong> and Agriculture Organization of the United Nation. Rome,<br />
Italy.<br />
FAO, 2011. Global food losses and food waste- extent, causes and prevention. <strong>Food</strong> and Agriculture Organization of the United<br />
Nations. Rome, Italy.<br />
FAOSTAT. <strong>Food</strong> supply quantity of total meat, data for 2007. <strong>Food</strong> and Agriculture Organization. Available at: http://faostat.fao.org<br />
(28.05.<strong>2012</strong>).<br />
Garn<strong>et</strong>t, T., 2008. Cook<strong>in</strong>g up a storm. <strong>Food</strong>, greenhouse gas emissions and our chang<strong>in</strong>g climate. <strong>Food</strong> Climate Research N<strong>et</strong>work.<br />
Surrey, UK.<br />
Garn<strong>et</strong>t, T., 2009. Livestock-related greenhouse gas emissions: impacts and options for policy makers. Environ Sci Policy 12, 491-<br />
503.<br />
Garn<strong>et</strong>t, T., 2011. Where are the best opportunities for reduc<strong>in</strong>g greenhouse gas emissions <strong>in</strong> the food system (<strong>in</strong>clud<strong>in</strong>g the food<br />
cha<strong>in</strong>)? <strong>Food</strong> Policy 36, 23-32.<br />
Hallström E., Ahlgren, S., Börjesson, P., 2011. Challenges and opportunities for future production of food, feed and biofuel- A land<br />
use perspective. Report No 74. Department of Environmental and Energy Systems Studies. Lund University. Lund, Sweden.<br />
Hallström, E., Börjesson, P., <strong>2012</strong> (unpublished results). Meat Consumption Statistics - Reliability and Discrepancy. Susta<strong>in</strong>ability:<br />
Science, Practice, and Policy.<br />
IPCC, 2007. Fourth Assessment Report of the Intergovernmental Panel on Climate Change. Cambridge University Press. Cambridge,<br />
United K<strong>in</strong>gdom and New York, USA.<br />
KF & ICA Provkök, 2000. Mått för mat. Provköken förklarar. ICA bokförlag. Västerås, Sweden.<br />
McMichael, A.J., Powles, J.W., Butler, C.D., Uauy, R., 2007. Energy and health 5 - <strong>Food</strong>, livestock production, energy, climate<br />
change and health. Lanc<strong>et</strong> 370, 1253-1263.<br />
Naska, A., Berg, M.A., Cuadrado, C., Freisl<strong>in</strong>g, H., Gedrich, K., Gregoric, M., Kelleher, C., Leskova E., Nelson, M., Pace, L., Remaut,<br />
A.M., Rodrigues, S., Sekula, W., Sjostrom, M., Trygg, K., Turr<strong>in</strong>i, A., Volatier, J. L., Zajkas, G., Trichopoulou, A., 2009.<br />
<strong>Food</strong> balance she<strong>et</strong> and household budg<strong>et</strong> survey di<strong>et</strong>ary data and mortality patterns <strong>in</strong> Europe. Br J Nutr 102, 166-171.<br />
Nilsson, K., Sund, V., Florén, B., 2011. The environmental impact of the consumption of swe<strong>et</strong>s, crisps and soft dr<strong>in</strong>ks. Nordic<br />
Council of M<strong>in</strong>isters. Tema Nord. Copenhagen, Denmark.<br />
Sonesson, U., Davis, J.,Ziegler, F., 2010. <strong>Food</strong> Production and Emissions of Greenhouse Gases. An overview of the climate impact<br />
of different product groups. Report no 802. Swedish Institute for <strong>Food</strong> and Biotechnology, Göteborg, Sweden.<br />
Stern, N., 2006. The Economics of Climate Change - The Stern Review. Cambridge University Press. Cambridge, UK.<br />
UNEP, 2010. The Emissions Gap Report: Are the Copenhagen Accord Pledges Sufficient to Limit Global Arm<strong>in</strong>g to 2 degrees or<br />
1.5 degrees? A prelim<strong>in</strong>ary assessment.<br />
U.S. Department of Agriculture/U.S. Department of Health and Human Services, 2010. Di<strong>et</strong>ary Guidel<strong>in</strong>es for Americans 2010. 7th<br />
Edition. Wash<strong>in</strong>gton DC, USA.<br />
186
PARALLEL SESSION 2C: QUANTIFICATION AND REDUCTION OF UNCERTAINTY 8 th Int. Conference on <strong>LCA</strong> <strong>in</strong> the<br />
Agri-<strong>Food</strong> Sector, 1-4 Oct <strong>2012</strong><br />
Westhoek, H., Rood, T., van den Berg, M., Janse, J., Nijdam, D., Reud<strong>in</strong>k, M., Stehfest, E., 2011. The prote<strong>in</strong> puzzle. The consumption<br />
and production of meat, dairy and fish <strong>in</strong> the European Union. PBL N<strong>et</strong>herlands Environmental Assessment Agency. Hauge.<br />
N<strong>et</strong>herlands.<br />
WHO, 2003. <strong>Food</strong> based di<strong>et</strong>ary guidel<strong>in</strong>es <strong>in</strong> the WHO European region. Copenhagen. Denmark.<br />
World Cancer Research Fund/American Institute for Cancer Research, 2007. <strong>Food</strong>, Nutrition, Physical Activity, and the Prevention<br />
of Cancer: a Global Perspective. Wash<strong>in</strong>gton DC, USA.<br />
187
PARALLEL SESSION 2C: QUANTIFICATION AND REDUCTION OF UNCERTAINTY 8 th Int. Conference on <strong>LCA</strong> <strong>in</strong> the<br />
Agri-<strong>Food</strong> Sector, 1-4 Oct <strong>2012</strong><br />
188<br />
Assess<strong>in</strong>g the optimum level of d<strong>et</strong>ail for secondary GHG emissions<br />
databases<br />
Ricardo Teixeira *<br />
Bluehorse Associates, 12 rue Soyer, 92200 Neuilly-sur-Se<strong>in</strong>e, <strong>France</strong><br />
E-mail: ricardo.teixeira@bluehorseassociates.com<br />
ABSTRACT<br />
Life Cycle Assessment (<strong>LCA</strong>) is a prohibitive <strong>in</strong>itiative for companies with a high number of products because <strong>LCA</strong> can prove to be<br />
time- and resource-<strong>in</strong>tensive. The <strong>LCA</strong> process can possibly be rendered less overwhelm<strong>in</strong>g for companies by simplify<strong>in</strong>g the datas<strong>et</strong>s<br />
by us<strong>in</strong>g “emission factors” <strong>in</strong>stead of <strong>in</strong>ventories. In this paper, we test if simplified data (emission factors measured <strong>in</strong> kg CO2e<br />
per kg of product) can provide statistically solid results <strong>in</strong> <strong>LCA</strong> studies <strong>in</strong> the agri-food sector. We build a l<strong>in</strong>ear statistical model to<br />
cluster agri-food records with similar average CO2e emissions.<br />
Prelim<strong>in</strong>ary results show that it is possible to obta<strong>in</strong> what we call “magic numbers” - statistically significant average CO2e emission<br />
factors for product clusters for certa<strong>in</strong> classes of products. Data clustered <strong>in</strong> high-level groups (e.g. butter) has high variance; but<br />
lower-level cluster<strong>in</strong>g (e.g. butter with herbs and butter without herbs) results <strong>in</strong> statistically significant “average” emissions.<br />
Keywords: Life Cycle Assessment, database management, simplified <strong>LCA</strong>, agri-food sector, carbon footpr<strong>in</strong>t<br />
1. Introduction<br />
The past years have seen Life Cycle Assessment (<strong>LCA</strong>) mov<strong>in</strong>g away from academic studies and be<strong>in</strong>g<br />
implemented <strong>in</strong>to companies’ daily operations such as research and development. Product labell<strong>in</strong>g us<strong>in</strong>g<br />
<strong>LCA</strong> is be<strong>in</strong>g implemented on a larger scale. Private <strong>in</strong>itiatives by r<strong>et</strong>ailers like Tesco (Clare and Little,<br />
2011) and the French government pilot (ADEME, 2011) are signs of this evolution, which has created the<br />
demand for <strong>LCA</strong> tools capable of provid<strong>in</strong>g results for a large volume of products. Tesco found that complex<br />
m<strong>et</strong>hods, or even traditional <strong>LCA</strong>, may be too time- and resource-<strong>in</strong>tensive, thus the reason they term<strong>in</strong>ated<br />
the <strong>in</strong>itiative to label each product us<strong>in</strong>g traditional <strong>LCA</strong> m<strong>et</strong>hods. To overcome this barrier, a more practical,<br />
bus<strong>in</strong>ess-oriented side to <strong>LCA</strong> is required to simplify without compromis<strong>in</strong>g accuracy. Furthermore, for<br />
objectives such as g<strong>et</strong>t<strong>in</strong>g <strong>in</strong>-depth knowledge on the supply cha<strong>in</strong>, estimates based on full <strong>LCA</strong> m<strong>et</strong>hods<br />
may not provide the appropriate level of d<strong>et</strong>ail. There is a difference b<strong>et</strong>ween accuracy (calculat<strong>in</strong>g the right<br />
number) and precision (many decimal places).<br />
Given the needs of larger scaled agri-food companies this begs the question: How far simplification can<br />
go <strong>in</strong> <strong>LCA</strong> tools? On the tool <strong>in</strong>terface and outputs side, there is virtually no ceil<strong>in</strong>g to how user-friendly<br />
tools that can be built. On the m<strong>et</strong>hodological side, the debate is on-go<strong>in</strong>g. On the database side, however,<br />
there is an understand<strong>in</strong>g that precision is needed - data must be specific and primary. The recurr<strong>in</strong>g fear of<br />
“garbage <strong>in</strong>, garbage out” has overshot the quality standards for primary data. ISO 14040 (ISO 1997) recommends<br />
the use of emissions-base unit processes so that every record <strong>in</strong> the database is a life cycle with<br />
traceable <strong>in</strong>puts and outputs. ISO-compliant tools, commonly known as “full <strong>LCA</strong>” tools, dom<strong>in</strong>ate the mark<strong>et</strong><br />
while us<strong>in</strong>g this pr<strong>in</strong>ciple. A survey done on <strong>LCA</strong> practitioners <strong>in</strong> the agri-food sector last year revealed<br />
that the most commonly used tools are still “full <strong>LCA</strong>” tools such as SimaPro by PRe Consultants and Gabi<br />
by PE International (Cooper and Fava, 2006; Teixeira and Pax, 2011).<br />
Lately, the makers of simplified tools have been try<strong>in</strong>g to educate the mark<strong>et</strong> on another approach. One of<br />
the strategies used is referr<strong>in</strong>g to built-<strong>in</strong> databases with emissions for pre-recorded life cycles (Weitz <strong>et</strong> al.,<br />
1996; Graedel, 1998). Instead of giv<strong>in</strong>g users the possibility of rebuild<strong>in</strong>g a life cycle for a product (e.g, butter<br />
– see below for more on this example), the database comprises pre-established life cycle impact assessment<br />
(LCIA) results. Users choose the most appropriate one for their case (e.g, choose b<strong>et</strong>ween CO2e emissions<br />
for conventionally produced simple butter <strong>in</strong> the N<strong>et</strong>herlands and for organic herb butter <strong>in</strong> Switzerland).<br />
Graedel (1998, cit. <strong>in</strong> Lifs<strong>et</strong>, 2006) argued that simplified <strong>LCA</strong> can provide around 80% of the f<strong>in</strong>d<strong>in</strong>gs<br />
from full <strong>LCA</strong>. To this day, however, a study is needed to justify the impact of simplified procedures <strong>in</strong> f<strong>in</strong>al<br />
<strong>LCA</strong> results and confirm or refute Graedel (1998). A true test cannot consist of runn<strong>in</strong>g an <strong>LCA</strong> for one<br />
product us<strong>in</strong>g both simplified and full <strong>LCA</strong> procedures because this is always case specific and no general<br />
conclusions can be drawn. In particular cases great differences may occur, but what matters is if on average,<br />
for a large number of <strong>LCA</strong>s, the simplified m<strong>et</strong>hodology yields high variability or an <strong>in</strong>herent bias on results;<br />
therefore an alternative m<strong>et</strong>hod must be found.<br />
In this paper we propose an alternative approach to test the hypothesis that simplified data can still provide<br />
accurate, statistically solid results <strong>in</strong> <strong>LCA</strong> studies.
PARALLEL SESSION 2C: QUANTIFICATION AND REDUCTION OF UNCERTAINTY 8 th Int. Conference on <strong>LCA</strong> <strong>in</strong> the<br />
Agri-<strong>Food</strong> Sector, 1-4 Oct <strong>2012</strong><br />
2. M<strong>et</strong>hods<br />
Our approach consists on analys<strong>in</strong>g statistical records on carbon emissions for agri-food products. For<br />
this study to be successful, we needed a large number of secondary data that <strong>in</strong>cluded many different sources<br />
to ensure maximum h<strong>et</strong>erogeneity.<br />
This compilation is found <strong>in</strong> the database for the Carbonostics tool (Carbonostics, 2011), which is the<br />
largest available built-<strong>in</strong> database for agri-food products (Verdantix, 2011). The database compiles more than<br />
1,400 pre-recorded f<strong>in</strong>al LCIA results for CO2e emissions from data providers such as ADEME (2010),<br />
CleanM<strong>et</strong>rics (2010), CLM (2010), the Danish <strong>LCA</strong> <strong>Food</strong> Database (Nielsen <strong>et</strong> al., 2003), DEFRA (<strong>2012</strong>),<br />
eco<strong>in</strong>vent (Frischknecht and Rebitzer, 2005) and ESU (<strong>2012</strong>). This number of data records is much higher<br />
than any number mentioned <strong>in</strong> any of the calculators referred <strong>in</strong> Amani and Schiefer‘s (2011) survey of<br />
tools. Each record <strong>in</strong> the database has been peer-reviewed and validated by the Swiss NGO MyClimate<br />
(<strong>2012</strong>). Many assumptions built <strong>in</strong>to the data records by different providers may be contradictory or <strong>in</strong>consistent<br />
with each other, which serves the purpose of our analysis by <strong>in</strong>troduc<strong>in</strong>g even more variability. For<br />
example, while some records <strong>in</strong>clude transportation steps, others do not. We did not remove these <strong>in</strong>consistencies<br />
s<strong>in</strong>ce the objective is to maximize the variance and replicate the error a user would make when<br />
choos<strong>in</strong>g the wrong record from the database. The choice of food products is particularly suited to our objective,<br />
s<strong>in</strong>ce variability b<strong>et</strong>ween specific products of the same time is reputedly high, e.g the amount of fertilisers<br />
and yields change b<strong>et</strong>ween farmers even <strong>in</strong> the same region and with the same general production<br />
m<strong>et</strong>hod.<br />
The Carbonostics database hierarchizes records by group<strong>in</strong>g them <strong>in</strong> three levels:<br />
1. General category (e.g, dairy, veg<strong>et</strong>ables, oils, meat, crops). This is roughly equivalent to product<br />
type. The number and distribution of these records is shown <strong>in</strong> Figure 1;<br />
2. Product type with<strong>in</strong> category (e.g., butter, buttermilk, milk – all with<strong>in</strong> the category dairy);<br />
3. Product variant with<strong>in</strong> type (e.g, conventional pla<strong>in</strong> butter <strong>in</strong> Europe, organic butter with herbs <strong>in</strong><br />
Europe – all with<strong>in</strong> the type butter).<br />
Figure 1. Number of records per type and CO2e emissions dispersion.<br />
Our statistical m<strong>et</strong>hod consisted on build<strong>in</strong>g one l<strong>in</strong>ear model at each of these three levels. We d<strong>et</strong>erm<strong>in</strong>ed<br />
the <strong>in</strong>tra-level cluster<strong>in</strong>g, i.e, how many sub-divisions <strong>in</strong> sub-groups are needed, by runn<strong>in</strong>g a cluster analysis,<br />
us<strong>in</strong>g the Calínski and Harabasz pseudo-F <strong>in</strong>dex stop rule to d<strong>et</strong>erm<strong>in</strong>e the number of clusters, for each<br />
level. In each model, CO2e emissions are the dependent variable and the <strong>in</strong>dependent variables are a group of<br />
b<strong>in</strong>ary “dummy” variables that represent the category, type or variant. The model thus calculates averages<br />
and standard errors for each group of records, and d<strong>et</strong>erm<strong>in</strong>es their statistical significance.<br />
S<strong>in</strong>ce all variants are def<strong>in</strong>ed by geographical region and m<strong>et</strong>hod of production, we <strong>in</strong>cluded both as control<br />
variables, i.e. we <strong>in</strong>cluded them as b<strong>in</strong>ary variables <strong>in</strong> the model. In the results shown next, we cropped<br />
data to show results only us<strong>in</strong>g agricultural records that were produced conventionally and <strong>in</strong> Europe (N=878<br />
189
PARALLEL SESSION 2C: QUANTIFICATION AND REDUCTION OF UNCERTAINTY 8 th Int. Conference on <strong>LCA</strong> <strong>in</strong> the<br />
Agri-<strong>Food</strong> Sector, 1-4 Oct <strong>2012</strong><br />
records). We show prelim<strong>in</strong>ary results for the level 1 model us<strong>in</strong>g all categories, for level 2 us<strong>in</strong>g only the<br />
dairy type, and for level 3 also on the dairy type but <strong>in</strong>clud<strong>in</strong>g variant-specific variables. We conducted all<br />
the statistical calculations <strong>in</strong> software Stata v10.0 (StataCorp., 2007).<br />
3. Results<br />
We began by group<strong>in</strong>g records at each level. Start<strong>in</strong>g from the group<strong>in</strong>gs <strong>in</strong> Carbonostics, we clustered<br />
groups with similar average emission records, and not enough data to be significantly different, e.g. at level<br />
1: fruits, gra<strong>in</strong>s, legumes, veg<strong>et</strong>ables and processed foods all fall with<strong>in</strong> the same range of emissions. Us<strong>in</strong>g<br />
the same procedure, we also d<strong>et</strong>erm<strong>in</strong>ed which variant-specific characteristics are statistically relevant, i.e.<br />
average CO2e emissions are significantly different b<strong>et</strong>ween sub-groups). For significant variants (e.g., separat<strong>in</strong>g<br />
pla<strong>in</strong> butter from butter with herbs), we <strong>in</strong>cluded new b<strong>in</strong>ary variables at level 3.<br />
Prelim<strong>in</strong>ary results are summed up <strong>in</strong> Figure 2. The model at level 1 (N=878) has a relatively low adjusted<br />
R 2 (0.404), and the standard error of the averages for each category are relatively high. However, the<br />
dairy type specific model at level 2 (N=75) has a much higher R 2 (0.846) and the averages start to clearly<br />
identify product types. We go to level 3 by separat<strong>in</strong>g pla<strong>in</strong> butter (which has a higher average emission factor)<br />
from butter with herbs (which was clustered tog<strong>et</strong>her with buttermilk, yoghurt, ice cream and milk at the<br />
lower end of the spectrum). Then, the R 2 is much higher (0.916), and errors clearly decrease.<br />
We tested <strong>in</strong>clud<strong>in</strong>g more granularity <strong>in</strong> the analysis (e.g., divid<strong>in</strong>g the group “cheese” <strong>in</strong> different types<br />
of cheese, divid<strong>in</strong>g “milk” <strong>in</strong> pla<strong>in</strong> milk and flavor milk). However, this did not <strong>in</strong>crease the statistical fit of<br />
the model.<br />
Figure 2. Results of the statistical analysis per level (bottom is category-level, up is sub-variant level) for<br />
conventional production <strong>in</strong> Europe; the centre of each bubble is the average; size depicts the standard error.<br />
4. Discussion<br />
Prelim<strong>in</strong>ary results (Figure 2) show that models 1 and 2 are not sufficiently reliable to expla<strong>in</strong> most of the<br />
variance with<strong>in</strong> product categories and to capture statistically significant different b<strong>et</strong>ween categories. Modell<strong>in</strong>g<br />
approach 3 provided <strong>in</strong>terest<strong>in</strong>g results, with enough statistical robustness. Us<strong>in</strong>g only four clusters for<br />
the whole category of dairy products, we found statistically significant average CO2e emission factors. Production<br />
m<strong>et</strong>hod was also an important variable to consider. Geographical region (full results not shown here)<br />
was not relevant for most types even though this may be due to the fact that most of the records <strong>in</strong> the database<br />
are for Europe. In this study, 90% of records <strong>in</strong>cluded are European, but a much lower percentage of<br />
worldwide agricultural and food production is European.<br />
It is important to underscore that it could seem like the deeper we go <strong>in</strong>to the levels, the more statistical<br />
reliability is achieved; however, this is not true. There seems to be a “glass ceil<strong>in</strong>g”. From this po<strong>in</strong>t on, more<br />
d<strong>et</strong>ail does not provide a b<strong>et</strong>ter statistical fit. Break<strong>in</strong>g down sub-types would be: (1) unnecessary for categories<br />
with many data records, because the standard error is overall low (20-30% of the mean), which means<br />
we hit a statistical “glass ceil<strong>in</strong>g”, or (2) impossible due to lack of data records for each sub-type. The com-<br />
190
PARALLEL SESSION 2C: QUANTIFICATION AND REDUCTION OF UNCERTAINTY 8 th Int. Conference on <strong>LCA</strong> <strong>in</strong> the<br />
Agri-<strong>Food</strong> Sector, 1-4 Oct <strong>2012</strong><br />
b<strong>in</strong>ation of (1) and (2) shows that the ma<strong>in</strong> barrier to us<strong>in</strong>g secondary emissions records databases for <strong>LCA</strong><br />
identified <strong>in</strong> this paper is lack of data, not h<strong>et</strong>erogeneity. Us<strong>in</strong>g emissions records at a macro scale was not<br />
found to be problematic, . The study revealed that that even compil<strong>in</strong>g most available databases is <strong>in</strong>sufficient<br />
to cluster data <strong>in</strong> most product types. This result is perfectly consistent with the replies to the agri-food<br />
<strong>LCA</strong> practitioners survey that identified lack of data as one of the ma<strong>in</strong> obstacles to <strong>LCA</strong> (Teixeira and Pax,<br />
2011).<br />
After its compl<strong>et</strong>ion, the ma<strong>in</strong> output of this work will be a table that, for each cluster<strong>in</strong>g group of agrifood<br />
products produced with each m<strong>et</strong>hod <strong>in</strong> each region, provides the average CO2e emissions and an error<br />
estimate. The results <strong>in</strong> that table can fit several purposes <strong>in</strong> <strong>LCA</strong>, namely:<br />
As a reference or benchmark <strong>in</strong> future <strong>LCA</strong> studies;<br />
For the environmental assessment of large-scale agricultural policies;<br />
In hybrid <strong>in</strong>put-output analysis (IO-<strong>LCA</strong>), which uses data at this level of d<strong>et</strong>ail;<br />
In simplified <strong>LCA</strong> m<strong>et</strong>hods and tools for screen<strong>in</strong>g calculations, as well as streaml<strong>in</strong>ed simple algorithms.<br />
Although the data <strong>in</strong> this paper can hardly replace <strong>in</strong>dividual data records, it will be very useful<br />
to suppress data gaps or make <strong>in</strong>formed choices b<strong>et</strong>ween available emission records;<br />
To help developers of Product Category Rules s<strong>et</strong> category-specific rules and hierarchies for data<br />
quality.<br />
To help <strong>LCA</strong> practitioners d<strong>et</strong>erm<strong>in</strong>e a product-specific hierarchy for data quality criteria. For example,<br />
if records from a certa<strong>in</strong> category are very sensitive to geographic region, then that attribute must<br />
be privileged when choos<strong>in</strong>g from secondary databases.<br />
It should also be noted that it is not advised to use this type of data when users have objectives such as process<br />
optimisations, labell<strong>in</strong>g/external communication and comparative assertions (except for prelim<strong>in</strong>ary hotspot<br />
analyses); because the data can only be used for generic macro assessment of static situations. Changes<br />
<strong>in</strong> the basel<strong>in</strong>e numbers will change the structure of the data itself and comparisons must be updated.<br />
5. Conclusion<br />
In this study, we tested wh<strong>et</strong>her it is possible to use “magic numbers” <strong>in</strong> secondary databases for <strong>LCA</strong><br />
studies and, if acceptable, we sought to d<strong>et</strong>erm<strong>in</strong>e the optimum level of d<strong>et</strong>ail. These results suggest that,<br />
even though there is a high variability <strong>in</strong> the way agri-food products are produced, there are representative<br />
averages that may be used when <strong>LCA</strong> practitioners, depend<strong>in</strong>g on their objective, provided sufficient statistical<br />
work is done beforehand. Our work also exposes the dramatic lack of <strong>LCA</strong> data today. More than tools,<br />
m<strong>et</strong>hodological developments or standards, practitioners identify lack of the data as the ma<strong>in</strong> problem <strong>in</strong><br />
<strong>LCA</strong>. This work shows analytically why.<br />
6. References<br />
ADEME, 2010. Guide des Facteurs d’Emission, Version 6.1, Chapitre 6 – Prise en compte des autres produits entrants: produits<br />
servant aux activités agricoles, d’élevage, <strong>et</strong> agro-alimentaires (“Emission factor guidel<strong>in</strong>es, Version 6.1, Chapter 6 – Account<strong>in</strong>g<br />
for other products: agriculture, livestock and food", <strong>in</strong> English). ADEME, Paris<br />
ADEME, 2011. Affichage environnemental des produits de grande consummation. [Environmental label<strong>in</strong>g of large consumption<br />
products.] ADEME, Paris. Available from: http://affichage-environnemental.afnor.org/. Accessed December 2011.<br />
Amani P. and G.Schiefer, <strong>2012</strong>. Data Availability for Carbon Calculators <strong>in</strong> Measur<strong>in</strong>g GHG Emissions Produced by the <strong>Food</strong> Sector.<br />
Int. J. <strong>Food</strong> System Dynamics 2, 392-407.<br />
Carbonostics. <strong>2012</strong>. http://www.carbonostics.com/. Accessed March <strong>2012</strong>.<br />
Clare, H. and Little, M.,2011. Break<strong>in</strong>g the l<strong>in</strong>k b<strong>et</strong>ween consumption and emissions: improv<strong>in</strong>g corporate environmental performance<br />
through carbon footpr<strong>in</strong>t<strong>in</strong>g. Proceed<strong>in</strong>gs of the 17th SETAC Europe <strong>LCA</strong> Case Studies Symposium, 28 February – 1<br />
March, Budapest.<br />
Cleanm<strong>et</strong>rics, 2010. http://www.cleanm<strong>et</strong>rics.com/html/lci_m<strong>et</strong>hodology.htm. Accessed January 2010.<br />
CLM, 2010. http://www.clm.nl/<strong>in</strong>dex_eng.php?id=m<strong>et</strong>hodology. Accessed January 2010.<br />
Cooper, J.S. and Fava, J., 2006. Life-Cycle Assessment Practitioner Survey Summary of Results. J. Ind. Ecol. 10, S12-S14.<br />
DEFRA, <strong>2012</strong>. http://www.defra.gov.uk/. Accessed January <strong>2012</strong>.<br />
ESU, <strong>2012</strong>. http://www.esu-services.ch/. Accessed January <strong>2012</strong>.<br />
Frischknecht, R. and Rebitzerb, G., 2005. The eco<strong>in</strong>vent database system: a comprehensive web-based <strong>LCA</strong> database. J. Clean. Prod.<br />
13, 1337–1343.<br />
Graedel, T., 1998. Streaml<strong>in</strong>ed Life-cycle Assessment. Prentice Hall, Upper Saddle River, New Jersey.<br />
ISO, 1997. ISO 14040, Environmental management: Life cycle assessment—Pr<strong>in</strong>ciples and framework. International Organization<br />
for Standardization, Geneva.<br />
Lifs<strong>et</strong>, R.J., 2006. Industrial Ecology and Life Cycle Assessment: What's the Use? Int. J. Life Cycle Ass. 11, 14 – 16.<br />
MyClimate, <strong>2012</strong>. http://www.myclimate.org/. Accessed April <strong>2012</strong>.<br />
Nielsen, P.H., Nielsen, A.M., Weidema, B.P., Dalgaard R. and Halberg, N., 2003. <strong>LCA</strong> data on basic food products produced and<br />
consumed <strong>in</strong> Denmark. Danish Institute of Agriculture Sciences. Available from: http://www.lcafood.dk.<br />
StataCorp, 2007. Stata Statistical Software: Release 10. StataCorp LP, College Station, TX.<br />
191
PARALLEL SESSION 2C: QUANTIFICATION AND REDUCTION OF UNCERTAINTY 8 th Int. Conference on <strong>LCA</strong> <strong>in</strong> the<br />
Agri-<strong>Food</strong> Sector, 1-4 Oct <strong>2012</strong><br />
Teixeira, R. and Pax, S., 2011. A Survey of Life Cycle Assessment Practitioners with a Focus on the Agri-<strong>Food</strong> Sector. J. Ind. Ecol.<br />
15, 817-820.<br />
Verdantix, 2011. Smart Inovators Product <strong>LCA</strong> Software Report. Verdantix Ltd., London.<br />
Weitz, K., Todd, J., Curran, M. and Malk<strong>in</strong>, M., 1996. Streaml<strong>in</strong><strong>in</strong>g Life Cycle Assessment considerations and a report on the state<br />
of practice. Int. J. Life Cycle Ass. 1, 79-85.<br />
192
PARALLEL SESSION 2C: QUANTIFICATION AND REDUCTION OF UNCERTAINTY 8 th Int. Conference on <strong>LCA</strong> <strong>in</strong> the<br />
Agri-<strong>Food</strong> Sector, 1-4 Oct <strong>2012</strong><br />
A protocol for approach<strong>in</strong>g uncerta<strong>in</strong>ties <strong>in</strong> life cycle <strong>in</strong>ventories<br />
P.J.G Henriksson * , J.B. Gu<strong>in</strong>ée, R. Heijungs, A. de Kon<strong>in</strong>g<br />
Institute of Environmental Sciences, Leiden University, the N<strong>et</strong>herlands<br />
Correspond<strong>in</strong>g author. E-mail: Henriksson@cml.leidenuniv.nl<br />
ABSTRACT<br />
Results of life cycle assessments (<strong>LCA</strong>s) of identical food production systems often experience great spread <strong>in</strong> outcomes b<strong>et</strong>ween<br />
studies. Part of this divergence relates to the lack of standardised m<strong>et</strong>hodological choices, <strong>in</strong>clud<strong>in</strong>g different views on system<br />
boundary s<strong>et</strong>t<strong>in</strong>g, allocation, carbon offs<strong>et</strong>t<strong>in</strong>g and storage, data sourc<strong>in</strong>g, end-of-life of products, land use change, characterisation<br />
factors, <strong>et</strong>c. However, studies also experience great divergence as a result of <strong>in</strong>ventory data sourc<strong>in</strong>g. While a common s<strong>et</strong> of<br />
“benchmark<strong>in</strong>g” standards could be agreed upon with respect to adopted m<strong>et</strong>hodology, underly<strong>in</strong>g <strong>in</strong>ventory data will chronically be<br />
subject to a dynamic reality and imperfect measurements.<br />
Uncerta<strong>in</strong>ty and/or variability <strong>in</strong> LCIs derive from primary foreground data (field-data), secondary foreground data (literature data)<br />
and background data (databases). Given the different characteristics of primary and secondary data, a practical approach to unitprocess<br />
data, us<strong>in</strong>g soybeans as an example, is therefore here presented. The example focuses on the selection of secondary foreground<br />
data. An approach for assign<strong>in</strong>g each unit-process flow with a weighted mean, a holistic standard deviation and a distribution<br />
is suggested. These param<strong>et</strong>ers could serve as <strong>in</strong>puts for Monte-Carlo simulations and many other uncerta<strong>in</strong>ty tests.<br />
The importance of def<strong>in</strong><strong>in</strong>g the uncerta<strong>in</strong>ty param<strong>et</strong>ers <strong>in</strong> unit process data for use <strong>in</strong> any uncerta<strong>in</strong>ty test is here discussed as a pivotal<br />
step towards the <strong>in</strong>clusion of quantitative uncerta<strong>in</strong>ty <strong>in</strong> <strong>LCA</strong> results; rather than focus<strong>in</strong>g on a specific test. Uncerta<strong>in</strong>ty ranges<br />
<strong>in</strong> LCIs, to date, have largely been derived from a Numeral Unit Spread Assessment Pedigree (NUSAP) approach. The NUSAP<br />
approach, however, only generates estimates of the representativeness of datas<strong>et</strong>s, exclud<strong>in</strong>g <strong>in</strong>herent uncerta<strong>in</strong>ty or variability.<br />
Therefore, a m<strong>et</strong>hod for weight<strong>in</strong>g <strong>in</strong>ventory flows b<strong>et</strong>ween secondary data sources is presented where representative means can be<br />
produced alongside <strong>in</strong>herent standard deviation param<strong>et</strong>ers. The proposed approach also helps identify cross-references and outdated<br />
values b<strong>et</strong>ween studies. Certa<strong>in</strong> assumptions <strong>in</strong> the eco<strong>in</strong>vent database with <strong>in</strong>fluence on <strong>LCA</strong>s of food production systems are also<br />
highlighted, e.g. the exclusion of variability <strong>in</strong> yields with<strong>in</strong> their pre-def<strong>in</strong>ed standard deviations. Know<strong>in</strong>g the uncerta<strong>in</strong>ty (<strong>in</strong>clud<strong>in</strong>g<br />
variability) of LCI results and related impacts, is crucial for justify<strong>in</strong>g results and derived decision-mak<strong>in</strong>g. Knowledge <strong>in</strong> this<br />
field is still fragmented although grow<strong>in</strong>g. We will here illustrate a new critical approach to secondary foreground data and quantify<br />
the uncerta<strong>in</strong>ty of unit process data.<br />
Keywords: LCI, unit-process, uncerta<strong>in</strong>ty, variability, NUSAP<br />
1. Introduction<br />
Uncerta<strong>in</strong>ty is an <strong>in</strong>tr<strong>in</strong>sic part of the scientific m<strong>et</strong>hod and def<strong>in</strong>es the quality of a prediction (Palmer and<br />
Hardaker, 2011). In the field of life cycle assessment (<strong>LCA</strong>), uncerta<strong>in</strong>ties have largely been addressed qualitatively,<br />
if at all, despite a long-time desire for its quantitative <strong>in</strong>clusion (Ross <strong>et</strong> al., 2002). With many historical<br />
hurdles be<strong>in</strong>g overcome, e.g. lack of data and limited computer power, the <strong>LCA</strong> community now<br />
faces a fundamental challenge, that of mov<strong>in</strong>g beyond po<strong>in</strong>t values towards uncerta<strong>in</strong>ty ranges. With much<br />
emphasis focus<strong>in</strong>g on which m<strong>et</strong>hodology to adopt <strong>in</strong> order to produce uncerta<strong>in</strong>ty ranges (Heijungs 1996;<br />
Huijbregts <strong>et</strong> al., 2001; Lloyd and Ries, 2007), less attention has been given to the orig<strong>in</strong> of unit process uncerta<strong>in</strong>ty<br />
param<strong>et</strong>ers and what these should embed.<br />
The most commonly used database at present, eco<strong>in</strong>vent v2.2, has def<strong>in</strong>ed uncerta<strong>in</strong>ty ranges to its <strong>in</strong>ventory<br />
data. These ranges are the products of the Numeral Unit Spread Assessment Pedigree (NUSAP) approach<br />
derived from Weidema and Wesnaes (1996) who <strong>in</strong>troduced the concept of process data quality <strong>in</strong>dicators.<br />
However, as first presented by Funtowicz and Rav<strong>et</strong>z (1990) the NUSAP approach was orig<strong>in</strong>ally<br />
<strong>in</strong>tended to evaluate the system uncerta<strong>in</strong>ties and decision stakes related to applied sciences and professional<br />
consultancy (Rav<strong>et</strong>z, 1999). The NUSAP outcomes, consequently, only provide an <strong>in</strong>dication of the representativeness<br />
of a datas<strong>et</strong> to its proposed application, and complements, rather than replaces, <strong>in</strong>herent uncerta<strong>in</strong>ty<br />
and variability with<strong>in</strong> datas<strong>et</strong>s.<br />
Inherent variability is especially prom<strong>in</strong>ent <strong>in</strong> the food production sector where production is directly governed<br />
by natural fluctuations and where models often are based upon empirical data (Schau and F<strong>et</strong>, 2008;<br />
Röös <strong>et</strong> al., 2010; Johnson <strong>et</strong> al., 2011). Frischknecht <strong>et</strong> al., (2007) highlight this by acknowledg<strong>in</strong>g that<br />
sample sizes exceed<strong>in</strong>g 100 samples might be needed <strong>in</strong> order to r<strong>et</strong>rieve reliable results for agricultural systems.<br />
Such extensive primary datas<strong>et</strong>s are, however, rarely available <strong>in</strong> LCIs, nor are <strong>in</strong>ventories characteris<strong>in</strong>g<br />
compl<strong>et</strong>e s<strong>et</strong>s of economic and environmental flows.<br />
As part of the on-go<strong>in</strong>g SEAT project (www.seatglobal.eu), primary process data have been collected for<br />
aquaculture farms <strong>in</strong> Bangladesh, Ch<strong>in</strong>a, Thailand and Vi<strong>et</strong>nam. Additional primary data have also been<br />
collected for feed mills, hatcheries, nurseries, process<strong>in</strong>g plants, fishmeal factories and reduction fisheries <strong>in</strong><br />
Asia. As coverage of Asian processes is currently limited <strong>in</strong> exist<strong>in</strong>g background databases, most processes<br />
need to be modelled based upon literature sources (secondary foreground data). In order to generate repre-<br />
193
PARALLEL SESSION 2C: QUANTIFICATION AND REDUCTION OF UNCERTAINTY 8 th Int. Conference on <strong>LCA</strong> <strong>in</strong> the<br />
Agri-<strong>Food</strong> Sector, 1-4 Oct <strong>2012</strong><br />
sentative <strong>in</strong>ventories and <strong>in</strong>herent uncerta<strong>in</strong>ty ranges for secondary foreground data from different sources,<br />
we here present a m<strong>et</strong>hodology for select<strong>in</strong>g and weight<strong>in</strong>g <strong>in</strong>ventory values, and <strong>in</strong> the meantime produce<br />
estimates for <strong>in</strong>herent uncerta<strong>in</strong>ty param<strong>et</strong>ers. The m<strong>et</strong>hodology will be practically exemplified by Brazilian<br />
soybean production, as soybeans often constitute more than 30% of aquaculture feeds.<br />
Materials and m<strong>et</strong>hods<br />
As the example here is assumed to rely upon the eco<strong>in</strong>vent v2.2 database for background data, the aim is to<br />
be consistent with choices made there<strong>in</strong>. Therefore, <strong>in</strong> parallel with eco<strong>in</strong>vent v2.2, the NUSAP approach<br />
described by Weidema and Wesnaes (1996) was adopted, categoris<strong>in</strong>g the orig<strong>in</strong>s of representativeness <strong>in</strong>to<br />
reliability, compl<strong>et</strong>eness, temporal correlation, geographical correlation and further technical correlation.<br />
The additional category of sample size and the assigned uncerta<strong>in</strong>ty factors suggested by Frischknecht <strong>et</strong> al.,<br />
(2007) were also implemented.<br />
As an <strong>in</strong>itial step, a decision tree was developed for foreground data, with a general dist<strong>in</strong>ction b<strong>et</strong>ween primary<br />
and secondary data (Erreur ! Source du renvoi <strong>in</strong>trouvable.1). The decision tree guides the practitioner<br />
towards recommended approaches when sourc<strong>in</strong>g process data, assum<strong>in</strong>g a default log-normal distribution<br />
of datas<strong>et</strong>s. Log-normal distributions are favoured as to avoid negative values, b<strong>et</strong>ter represent large<br />
variances and to be consistent with the eco<strong>in</strong>vent v2.2 database. Primary data are, moreover, prioritised as<br />
they are assumed to be up-to-date, highly relevant, and provide a higher level of d<strong>et</strong>ail. Secondary data are<br />
previously published data describ<strong>in</strong>g the process <strong>in</strong> focus, where the f<strong>in</strong>al selection of values should be <strong>in</strong>l<strong>in</strong>e<br />
with the goal and scope def<strong>in</strong>ition of the specific study at stake. Where relevant multiple secondary data<br />
sources exist, a weighted mean approach is recommended. Each outcome <strong>in</strong> the decision tree def<strong>in</strong>es a recommended<br />
type of mean, standard deviation and distribution, or alternative approaches <strong>in</strong> certa<strong>in</strong> cases.<br />
Figure 1. Decision tree for sourc<strong>in</strong>g unit process data for foreground processes.<br />
Weighted means b<strong>et</strong>ween secondary foreground param<strong>et</strong>ers were calculated us<strong>in</strong>g Weighted means<br />
( ) can be calculated from the aggregated means ( ) of samples (n), with the NUSAP derived geom<strong>et</strong>ric<br />
standard deviation used as the weight<strong>in</strong>g factor ( ). The <strong>in</strong>herent variability can, <strong>in</strong> turn, be calculated<br />
amongst the different param<strong>et</strong>ers where several sources exist. Miss<strong>in</strong>g values are excluded from the calculations<br />
and null values are calculated us<strong>in</strong>g 10% or the smallest value, due to the limitations of the logarithmical<br />
scale. To generate the f<strong>in</strong>al overall uncerta<strong>in</strong>ty param<strong>et</strong>er, the <strong>in</strong>herent geom<strong>et</strong>ric standard deviation<br />
needs to be summed with the most representative NUSAP <strong>in</strong>dicator for each <strong>in</strong>ventory flow (Frischknecht <strong>et</strong><br />
al., 2007).<br />
194
PARALLEL SESSION 2C: QUANTIFICATION AND REDUCTION OF UNCERTAINTY 8 th Int. Conference on <strong>LCA</strong> <strong>in</strong> the<br />
Agri-<strong>Food</strong> Sector, 1-4 Oct <strong>2012</strong><br />
Six <strong>in</strong>ventories for Brazilian soybeans highlighted <strong>in</strong> da Silva <strong>et</strong> al., (2010), with the use of Schmidt<br />
(2007) to represent Dalgaard (2008), and the addition of FAOSTAT data (http://faostat.fao.org) were <strong>in</strong>cluded<br />
<strong>in</strong> this study. Each <strong>in</strong>ventory flow was sourced to its orig<strong>in</strong>s <strong>in</strong> order to avoid double count<strong>in</strong>g of<br />
cross-references and to d<strong>et</strong>erm<strong>in</strong>e the actual representativeness of each <strong>in</strong>ventory flow. The result<strong>in</strong>g<br />
weighted means and <strong>in</strong>herent standard deviations were then calculated amongst the orig<strong>in</strong>al values (exclud<strong>in</strong>g<br />
cross-references and assumptions). Given space limitations, we here only present and discuss the <strong>in</strong>ventories<br />
for fertilisers, fuel and result<strong>in</strong>g yields.<br />
3. Results<br />
The <strong>in</strong>ventories support<strong>in</strong>g the six different soybean <strong>in</strong>ventories and FAO data are reported <strong>in</strong> Table 1.<br />
All studies rely upon a divergent s<strong>et</strong> of <strong>in</strong>ventories describ<strong>in</strong>g an identical process. Many of the values are,<br />
moreover, cross-references of previous publications. The amount of diesel used, for example, stems back to<br />
two s<strong>in</strong>gle primary data po<strong>in</strong>ts, Ostermayer 2002 <strong>in</strong> Jungbluth <strong>et</strong> al., (2007) and Cederberg (1998). Eco<strong>in</strong>vent<br />
adopts the average of these two publications (55.25 kg assum<strong>in</strong>g 0.85 kg litre -1 diesel) and refers to an FNP<br />
Agro report from 2000 for fertiliser use (Jungbluth <strong>et</strong> al., 2007). Schmidt (2007) on the other hand adjusted<br />
Argent<strong>in</strong>ian primary data to a Brazilian scenario. This study was therefore not considered as a primary data<br />
source for Brazilian soybeans. Da Silva <strong>et</strong> al., (2010) unfortunately failed to report on <strong>in</strong>ventory values used<br />
and could therefore not be <strong>in</strong>cluded. Most studies use the average yield over five years reported by FAO <strong>in</strong><br />
order to elim<strong>in</strong>ate any annual fluctuations.<br />
Table 1: Unit process data for six different articles and FAOSTAT data for one hectare of Brazilian soybean<br />
crops<br />
FAOS Cederberg<br />
Lehuger Caval<strong>et</strong>t<br />
Eco<strong>in</strong>vent Cederberg TAT and Fly- Schmidt <strong>et</strong> al., and Or-<br />
2.2 1998 2002 gsjö 2004 2007 2009 tega 2010<br />
unit Database Report FAO Report PhD thesis Article Article<br />
Economic <strong>in</strong>puts<br />
Diesel kg 55.25 51 - 55.25 44.63 - 55.25<br />
Nitrogen, as N kg 3.11 0 3.73 8 0 8 0<br />
Phosphorus, as P kg 26.18 17.46 28.8 31 0 31 33.8<br />
Potassium, as K<br />
Economic outputs<br />
kg 24.9 33.2 51.46 57 20 57 65.4<br />
Soybeans kg 2 544 2 200 2 613 2 500 2 680 2 500 2 830<br />
With all cross-references and non-primary data po<strong>in</strong>ts excluded, diesel was narrowed down to two primary<br />
data sources and fertilisers to five values. The economic <strong>in</strong>put data were then standardised to one tonne<br />
of soybeans accord<strong>in</strong>g to reported yields <strong>in</strong> order to aggregate values <strong>in</strong>to a s<strong>in</strong>gle weighted mean (Table 2).<br />
Table 2: Reported <strong>in</strong>puts of diesel and fertilisers <strong>in</strong> the only studies present<strong>in</strong>g real novel field data, and their<br />
accompany<strong>in</strong>g standard deviations <strong>in</strong> brack<strong>et</strong>s as estimated us<strong>in</strong>g the NUSAP approach. The calculated<br />
weighted geom<strong>et</strong>ric mean and the <strong>in</strong>herent geom<strong>et</strong>ric standard deviation amongst the values are presented <strong>in</strong><br />
Eq. 1<br />
the rightmost columns. All values are normalised to the production of one tonne of soybeans <strong>in</strong> Brazil.<br />
FNP 2000/<br />
Ostermayer<br />
2002<br />
Cederberg<br />
and Flygsjö<br />
2004<br />
Caval<strong>et</strong>t<br />
and Ortega<br />
2010<br />
Cederberg<br />
Wt. Inherent<br />
1998 FAO 2002<br />
mean STDEVg<br />
Diesel (kg) 23.4 (1.34) 23.2 (1.31)<br />
23.3 1.01<br />
Nitrogen (kg)<br />
Phosphorus<br />
1.2 (1.27) 0 (1.24) 1.4 (1.22) 3.2 (1.27) 0 (1.10) 1.4 3.48<br />
(kg) 10.3 (1.27) 7.9 (1.24) 11.0 (1.22) 12.4 (1.27) 11.9 (1.10) 10.6 1.19<br />
Potassium (kg) 9.8 (1.27) 15.1 (1.24) 19.7 (1.22) 22.8 (1.27) 23.1 (1.10) 17.6 1.43<br />
The <strong>in</strong>herent variability for yields was calculated us<strong>in</strong>g the yields reported by FAO b<strong>et</strong>ween 2001 and<br />
2005, the same time range adopted by eco<strong>in</strong>vent. Calculat<strong>in</strong>g the geom<strong>et</strong>ric mean over these five years<br />
yielded an average harvest of 2 537 kg ha -1 and an <strong>in</strong>herent geom<strong>et</strong>ric standard deviation of 1.11.<br />
195
PARALLEL SESSION 2C: QUANTIFICATION AND REDUCTION OF UNCERTAINTY 8 th Int. Conference on <strong>LCA</strong> <strong>in</strong> the<br />
Agri-<strong>Food</strong> Sector, 1-4 Oct <strong>2012</strong><br />
2. Discussion<br />
Limited data availability rema<strong>in</strong>s a generic problem <strong>in</strong> LCIs, ma<strong>in</strong>ly due to the great resources needed to<br />
collect primary data. Where datas<strong>et</strong>s are available, however, they often describe limited geographical areas<br />
where practices <strong>in</strong> e.g. agriculture differ depend<strong>in</strong>g upon micro-climate and soil characteristics. The <strong>in</strong>consistencies<br />
<strong>in</strong> the <strong>in</strong>ventories presented above may therefore be the result of six alternative soybean processes<br />
rather any nationwide averages. In search for such more general processes, the m<strong>et</strong>hodology presented here<br />
enables secondary foreground data to be critically evaluated. When averag<strong>in</strong>g unit process data <strong>in</strong>to, for example,<br />
country-wide averages, different economic and environmental flows may also be used complementary<br />
to produce b<strong>et</strong>ter characterised processes. This may be values for water use reported <strong>in</strong> some studies,<br />
while <strong>in</strong>ventories of pesticide use only are available <strong>in</strong> other studies. Moreover, the proposed approach enables<br />
unit process data to move beyond po<strong>in</strong>t values and m<strong>in</strong>imizes the use of unrepresentative param<strong>et</strong>ers. It<br />
also helps to identify areas of great uncerta<strong>in</strong>ty and <strong>in</strong> the process allows for <strong>in</strong>herent variability to be calculated.<br />
With many <strong>in</strong>centives to <strong>in</strong>clude quantified uncerta<strong>in</strong>ties <strong>in</strong>to <strong>LCA</strong> results, an <strong>in</strong>itial step will be to def<strong>in</strong>e<br />
basic uncerta<strong>in</strong>ty param<strong>et</strong>ers <strong>in</strong> the LCI phase, allow<strong>in</strong>g for different k<strong>in</strong>ds of uncerta<strong>in</strong>ty tests/m<strong>et</strong>hods to be<br />
applied (e.g. not only Monte Carlo analysis). Includ<strong>in</strong>g most sources of uncerta<strong>in</strong>ty <strong>in</strong> these param<strong>et</strong>ers is<br />
crucial, as they will d<strong>et</strong>erm<strong>in</strong>e the application and outcome of any later implemented test/m<strong>et</strong>hodology. With<br />
a wide range of sources and types of uncerta<strong>in</strong>ties, we here<strong>in</strong> highlight the dist<strong>in</strong>ction b<strong>et</strong>ween <strong>in</strong>herent standard<br />
deviations and representativeness. While the latter easily can be estimated, the former are not always<br />
available for unit processes. Even when available, <strong>in</strong>herent uncerta<strong>in</strong>ties are often neglected, as <strong>in</strong> the above<br />
example of soybean yield averages over several years. When calculated us<strong>in</strong>g the approach proposed above,<br />
<strong>in</strong>herent standard deviations often exceed those of representativeness. For example, the geom<strong>et</strong>ric standard<br />
deviation amongst the reported uses of potassium <strong>in</strong> the studies discussed above, amounts to 1.43 compared<br />
to an estimated geom<strong>et</strong>ric standard deviation of 1.1-1.27 for representativeness. The <strong>in</strong>herent geom<strong>et</strong>ric standard<br />
deviations of nitrogen showed even greater divergence, but these are somewhat distorted by the reported<br />
null values. Temporal <strong>in</strong>herent variability is also relevant for food production systems, where the<br />
yield average over five years, reported by FAO, exhibit a geom<strong>et</strong>ric standard deviation of 1.11. This is<br />
largely the result of a close l<strong>in</strong>k b<strong>et</strong>ween food production systems and stochastic natural events. Agriculture<br />
practices also exhibit large model uncerta<strong>in</strong>ties when calculat<strong>in</strong>g field emissions, which add further <strong>in</strong>herent<br />
uncerta<strong>in</strong>ty to this field of <strong>LCA</strong> research.<br />
Interconnected (co-variation) param<strong>et</strong>ers (e.g. the amount of fertiliser used and result<strong>in</strong>g N2O emissions)<br />
were here not accounted for, result<strong>in</strong>g <strong>in</strong> an overestimation of the uncerta<strong>in</strong>ty. In the meantime, <strong>in</strong>herent<br />
uncerta<strong>in</strong>ties are not always considered <strong>in</strong> the background database, thereby underestimat<strong>in</strong>g the degree of<br />
overall uncerta<strong>in</strong>ties. Neither were the temporal correlations embedded <strong>in</strong> the database representative of present<br />
time, as they are benchmarked at the time of release of the database. With some NUSAP categories be<strong>in</strong>g<br />
quantifiable (e.g. less than 3 years), others rema<strong>in</strong> open for <strong>in</strong>terpr<strong>et</strong>ation which may also result <strong>in</strong> <strong>in</strong>terpr<strong>et</strong>ation<br />
errors.<br />
5. Conclusion<br />
Inventory data rema<strong>in</strong>s a major source of uncerta<strong>in</strong>ty for <strong>LCA</strong> results, where LCIs describ<strong>in</strong>g the same<br />
production system often experience large differences at the unit process data level. Many of the values used<br />
are also cross-references which som<strong>et</strong>imes date back over ten years. Scrut<strong>in</strong>y is therefore needed when develop<strong>in</strong>g<br />
process datas<strong>et</strong>s, as is b<strong>et</strong>ter report<strong>in</strong>g of the orig<strong>in</strong>s of data, standard deviations around means and<br />
identification of known sources of uncerta<strong>in</strong>ty. Us<strong>in</strong>g the standardised decision tree for data sourc<strong>in</strong>g and<br />
weight<strong>in</strong>g means amongst studies can therefore result <strong>in</strong> more representative and rigid results.<br />
Quantitative uncerta<strong>in</strong>ties need to be <strong>in</strong>cluded <strong>in</strong> <strong>LCA</strong>s <strong>in</strong> order to statistically validate conclusions and<br />
strengthen the credibility of <strong>LCA</strong> results. The here<strong>in</strong> proposed approach presents one way for entail<strong>in</strong>g uncerta<strong>in</strong>ty<br />
param<strong>et</strong>ers that complement each other (<strong>in</strong>herent and representativeness), rather than replac<strong>in</strong>g each<br />
other. A standardised vocabulary is also needed for further uncerta<strong>in</strong>ty discussions with<strong>in</strong> the field of <strong>LCA</strong>.<br />
Here we have e.g. shown that a notable dist<strong>in</strong>ction is needed b<strong>et</strong>ween <strong>in</strong>herent uncerta<strong>in</strong>ty and variability,<br />
and representativeness. <strong>Food</strong> production systems are especially sensitive to <strong>in</strong>herent deviations, especially as<br />
yields which are subject to annual fluctuations often represent the functional unit.<br />
6. References<br />
Cederberg, C., 1998. Life Cycle Assessment of Milk Production – a Comparison of Conventional and Organic Farm<strong>in</strong>g. SIK Report<br />
643. Gothenburg.<br />
196
PARALLEL SESSION 2C: QUANTIFICATION AND REDUCTION OF UNCERTAINTY 8 th Int. Conference on <strong>LCA</strong> <strong>in</strong> the<br />
Agri-<strong>Food</strong> Sector, 1-4 Oct <strong>2012</strong><br />
Dalgaard, R., Schmidt, J., Halberg N., Christensen P., Thrane M., Pengue W.A., 2008. <strong>LCA</strong> of soybean meal. Int J of Life Cycle<br />
Assess, 13:240-254.<br />
Frischknecht, R., Niels, J., Althaus, H-J., Doka, G., Dones, R., Heck, T., Hellweg, S., Hischier, R., Nemecek, T., Rebitzer, G.,<br />
Spielmann, M. and Wern<strong>et</strong>, G., 2007. Overview and M<strong>et</strong>hodology. Eco<strong>in</strong>vent Report No. 1. Dübendorf.<br />
Funtowicz, S.O., Rav<strong>et</strong>z, J.R., 1990. Uncerta<strong>in</strong>ty and Quality <strong>in</strong> Science for Policy. Kluwer Academic Publishers, Dordrecht.<br />
Heijungs, R., 1996 Identification of key issues for further <strong>in</strong>vestigation <strong>in</strong> improv<strong>in</strong>g the reliability of life-cycle assessments. J Clean<br />
Prod. 4:159-166.<br />
Henriksson, P.J.G., Gu<strong>in</strong>ée, J.B., Rene, K., Snoo, G.D., 2011. Life cycle assessment of aquaculture systems – a review of m<strong>et</strong>hodologies.<br />
Int J Life Cycle Assess. 17(3):304-313<br />
Huijbregts, M.A.J., 1998. Application of Uncerta<strong>in</strong>ty and Variability <strong>in</strong> <strong>LCA</strong> Part I : A General Framework for the Analysis of<br />
Uncerta<strong>in</strong>ty and Variability <strong>in</strong> Life Cycle Assessment. Int J Life Cycle Assess. 3:273-280.<br />
Huijbregts, M.A.J., Norris, G., Br<strong>et</strong>z, R., Ciroth, A., Maurice, B., von Bahr, B., Weidema, B., de Beaufort, A.S.H., 2001. Framework<br />
for Modell<strong>in</strong>g Data Uncerta<strong>in</strong>ty <strong>in</strong> Life Cycle Inventories. Int J Life Cycle Assess. 6:127-132.<br />
Johnson, D.R., Willis, H.H., Curtright, A.E., Samaras, C., Skone, T., 2011. Incorporat<strong>in</strong>g uncerta<strong>in</strong>ty analysis <strong>in</strong>to life cycle estimates<br />
of greenhouse gas emissions from biomass production. Biomass Bioenerg. 35:2619-2626.<br />
Jungbluth, N., Chudacoff, M., Dauriat, A., D<strong>in</strong>kel, F., Doka, G., Faist Emmenegger, M., Gnansounou, E., Kljun, N., Schleiss, K.,<br />
Spielmann, M., St<strong>et</strong>tler, C., Sutter, J., 2007. Life Cycle Inventories of Bioenergy. Eco<strong>in</strong>vent Report No. 17. Dübendorf.<br />
Lloyd, S.M., Ries, R., 2007. Characteriz<strong>in</strong>g, Propagat<strong>in</strong>g, and Analyz<strong>in</strong>g Uncerta<strong>in</strong>ty <strong>in</strong> Life-Cycle Assessment: A Survey of Quantitative<br />
Approaches. J Ind Ecol. 11:161-179.<br />
Palmer, T.N., Hardaker, P.J., 2011. Handl<strong>in</strong>g uncerta<strong>in</strong>ty <strong>in</strong> science. Philos T Roy Soc A. 369:4681-4684.<br />
Rav<strong>et</strong>z, J.R., 1999. What is Post-Normal Science. Science. 31:647-653.<br />
Ross, S., Evans, D., Webber, M., 2002. How <strong>LCA</strong> studies deal with uncerta<strong>in</strong>ty. Int J Life Cycle Assess. 7:47-52.<br />
Röös, E., Sundberg, C., Hansson, P.-A., 2010. Uncerta<strong>in</strong>ties <strong>in</strong> the carbon footpr<strong>in</strong>t of food products: a case study on table potatoes.<br />
Int J Life Cycle Assess. 15:478-488.<br />
Schau, E.M., F<strong>et</strong>, A.M., 2008. <strong>LCA</strong> Studies of <strong>Food</strong> Products as Background for Environmental Product Declarations. Int J Life<br />
Cycle Assess. 13:255-264.<br />
Schmidt, J.H., 2007. Life Cycle Assessment of Rapeseed Oil and Palm Oil. PhD thesis. Aalborg University.<br />
da Silva, V.P., van der Werf, H.M.G., Spies, A., Soares, S.R., 2010. Variability <strong>in</strong> environmental impacts of Brazilian soybean accord<strong>in</strong>g<br />
to crop production and transport scenarios. J Environ Manage. 91:1831-1839.<br />
Weidema, B., Wesnaes, M.S., 1996. Data quality management for life cycle <strong>in</strong>ventories—an example of us<strong>in</strong>g data quality <strong>in</strong>dicators.<br />
J Clean Prod. 4:167-174.<br />
197
PARALLEL SESSION 2C: QUANTIFICATION AND REDUCTION OF UNCERTAINTY 8 th Int. Conference on <strong>LCA</strong> <strong>in</strong> the<br />
Agri-<strong>Food</strong> Sector, 1-4 Oct <strong>2012</strong><br />
198<br />
Quantify<strong>in</strong>g environmental impacts and their uncerta<strong>in</strong>ties for UK<br />
broiler and egg production systems<br />
Ilkka Le<strong>in</strong>onen 1,* , Adrian Williams 2 , Ilias Kyriazakis 1<br />
1 School of Agriculture, <strong>Food</strong> and Rural Development, Newcastle University, Newcastle upon Tyne, NE1 7RU, UK<br />
2 School of Applied Sciences, Cranfield University, Bedford, MK43 0AL, UK<br />
Correspond<strong>in</strong>g author. E-mail: ilkka.le<strong>in</strong>onen@newcastle.ac.uk<br />
ABSTRACT<br />
The environmental burdens of the ma<strong>in</strong> UK broiler and egg production systems were quantified us<strong>in</strong>g a systems modell<strong>in</strong>g approach<br />
with Monte Carlo simulations for statistical analyses. Feed was the ma<strong>in</strong> component of the global warm<strong>in</strong>g potential <strong>in</strong> all broiler and<br />
egg systems. Manure was a major source of acidification and eutrophication potentials. The length of the production cycle was lowest<br />
<strong>in</strong> the standard <strong>in</strong>door broiler system, and therefore the feed consumption and manure production were also lowest. This caused<br />
statistically significant differences <strong>in</strong> most of the impact categories b<strong>et</strong>ween the broiler systems. The number of birds required to<br />
produce equal amount of eggs, and the amount of feed consumed per bird were highest <strong>in</strong> organic and lowest <strong>in</strong> the cage system.<br />
These general differences <strong>in</strong> productivity affected the environmental impacts of the different egg systems, although <strong>in</strong> some impact<br />
categories the differences were not always significant.<br />
Keywords: broiler, egg, uncerta<strong>in</strong>ty analysis, global warm<strong>in</strong>g potential, energy use<br />
1. Introduction<br />
UK poultry production, <strong>in</strong>clud<strong>in</strong>g broilers and eggs, has been identified as be<strong>in</strong>g relatively environmentally-efficient,<br />
per unit weight, compared to the production of other animal commodities (Williams <strong>et</strong> al.,<br />
2006). However, like all agricultural systems, any current poultry system has scope to improve, and thus has<br />
the potential to reduce its environmental impacts. For example, with an annual production of 8862 million<br />
eggs (about 0.4 billion kg) produced <strong>in</strong> the UK (Defra, 2009) and 61 billion kg produced worldwide annually<br />
(FAO, 2011), the egg lay<strong>in</strong>g systems are likely to be significant contributors to both resource use and environmental<br />
burdens, and therefore have also potential for large scale reduction of impacts such as greenhouse<br />
gas emissions.<br />
The aim of the current study was to apply the <strong>LCA</strong> m<strong>et</strong>hod “from cradle to farm gate”, to quantify the environmental<br />
burdens of the ma<strong>in</strong> broiler and egg production systems <strong>in</strong> the UK, and hence to identify the<br />
ma<strong>in</strong> opportunities to reduce these impacts with<strong>in</strong> each system. The broiler systems <strong>in</strong>cluded <strong>in</strong> the study<br />
were 1) standard <strong>in</strong>door, 2) free range and 3) organic production. Accord<strong>in</strong>g to the Defra (2007) statistics,<br />
the total broiler chicken populations <strong>in</strong> these systems <strong>in</strong> the UK were 101, 4.4 and 1.8 million, respectively.<br />
The egg production systems considered <strong>in</strong> this study were 1) conventional cage, 2) barn, 3) free range and 4)<br />
organic lay<strong>in</strong>g. Although the egg production <strong>in</strong> conventional cages has been banned by the EU and is not<br />
used <strong>in</strong> the UK anymore, it is still <strong>in</strong> use <strong>in</strong> some other European countries, and therefore the results for the<br />
cage lay<strong>in</strong>g system are also presented <strong>in</strong> this study. Results for enriched cages now used <strong>in</strong> the UK are expected<br />
to be broadly similar.<br />
2. M<strong>et</strong>hods<br />
2.1. Systems approach and data<br />
The general approach taken <strong>in</strong> the current study was with systems modell<strong>in</strong>g of production. This <strong>in</strong>cluded<br />
structural models of the <strong>in</strong>dustry, process models and simulation models that were unified <strong>in</strong> the systems<br />
approach so that changes <strong>in</strong> one area caused consistent <strong>in</strong>teractions elsewhere. This approach was applied to<br />
both feed crop and animal production. The systems modelled <strong>in</strong> this study <strong>in</strong>cluded crop production, noncrop<br />
nutrient production, feed process<strong>in</strong>g, breed<strong>in</strong>g, broiler production, pull<strong>et</strong> rear<strong>in</strong>g, egg lay<strong>in</strong>g and manure<br />
and general waste management, as described by Williams <strong>et</strong> al., (2006) and Le<strong>in</strong>onen <strong>et</strong> al., (<strong>2012</strong>a;b). All<br />
modelled animal production systems <strong>in</strong>cluded farm energy, feed and water use and gaseous emissions from<br />
hous<strong>in</strong>g.<br />
The production systems <strong>in</strong> this study were considered to represent typical UK egg and broiler production<br />
(Table 1, Table 2) as described by Le<strong>in</strong>onen <strong>et</strong> al., (<strong>2012</strong>a;b). The farm energy consumption for heat<strong>in</strong>g,<br />
light<strong>in</strong>g, ventilation, feed<strong>in</strong>g and <strong>in</strong>c<strong>in</strong>eration of dead birds was based on average data from typical farms as<br />
provided by the <strong>in</strong>dustry. Information about the type and amount of bedd<strong>in</strong>g was also obta<strong>in</strong>ed from the <strong>in</strong>dustry.<br />
Additional data, such as LCI of agricultural build<strong>in</strong>gs and mach<strong>in</strong>ery, came from Williams <strong>et</strong> al.,<br />
(2006).
PARALLEL SESSION 2C: QUANTIFICATION AND REDUCTION OF UNCERTAINTY 8 th Int. Conference on <strong>LCA</strong> <strong>in</strong> the<br />
Agri-<strong>Food</strong> Sector, 1-4 Oct <strong>2012</strong><br />
Table 1. Typical production and feed <strong>in</strong>take figures for the different broiler production systems <strong>in</strong> UK as<br />
provided by the <strong>in</strong>dustry (Le<strong>in</strong>onen <strong>et</strong> al., <strong>2012</strong>a)<br />
Standard Free range Organic<br />
F<strong>in</strong>al age, days 39 58 73<br />
Average f<strong>in</strong>al weight, kg 1.95 a 2.06 2.17<br />
Feed <strong>in</strong>take, kg/bird 3.36 4.50 5.75<br />
Mortality,% 3.5 4.7 4.1<br />
a 25% of birds were removed by th<strong>in</strong>n<strong>in</strong>g at bodyweight 1.8 kg. The f<strong>in</strong>al weight of rema<strong>in</strong><strong>in</strong>g birds was 2.0 kg.<br />
Table 2. Typical production and feed <strong>in</strong>take figures for the different egg production systems <strong>in</strong> UK as provided<br />
by the <strong>in</strong>dustry (Le<strong>in</strong>onen <strong>et</strong> al., <strong>2012</strong>b)<br />
Cage Barn Free range Organic<br />
Eggs collected/hen a 315 300 293 280<br />
Average egg weight, g 62 63.5 63.5 63.5<br />
Feed consumption, g/bird/day 115 125 130 131<br />
Mortality,% 3.5 6 7 8<br />
a based on the <strong>in</strong>itial number of hens<br />
The basel<strong>in</strong>e di<strong>et</strong>s representative of those used <strong>in</strong> the UK were constructed us<strong>in</strong>g <strong>in</strong>formation provided by<br />
the poultry <strong>in</strong>dustry. The broiler di<strong>et</strong>s <strong>in</strong>cluded four and the layer di<strong>et</strong>s five separate phases, accord<strong>in</strong>g to<br />
common practice. Separate di<strong>et</strong>s were applied to 1) Standard broilers, 2) Free range broilers, 3) Organic<br />
broilers, 4) Cage, barn and free range layers, 5) Organic layers and 6) Broiler breeders.<br />
2.2. The models<br />
The structural model for broiler and egg systems calculated all of the <strong>in</strong>puts required to produce the functional<br />
unit (either 1000 kg of expected edible carcass weight <strong>in</strong> broilers or 1000 kg eggs), allow<strong>in</strong>g for breed<strong>in</strong>g<br />
overheads, mortalities and productivity levels. It also calculated the outputs, both useful (broilers, eggs<br />
and spent hens) and unwanted. Changes <strong>in</strong> the proportion of any activity resulted <strong>in</strong> changes to the proportions<br />
of others <strong>in</strong> order to keep produc<strong>in</strong>g the desired amount of output. Establish<strong>in</strong>g how much of each<br />
activity was required was found by solv<strong>in</strong>g l<strong>in</strong>ear equations that described the relationships that l<strong>in</strong>ked the<br />
activities tog<strong>et</strong>her.<br />
A mechanistic animal growth, production and feed <strong>in</strong>take model, based on the pr<strong>in</strong>ciples presented by<br />
Emmans and Kyriazakis (2001) and Wellock <strong>et</strong> al., (2003), was used <strong>in</strong> this study <strong>in</strong> order to calculate the<br />
total consumption of each feed <strong>in</strong>gredient dur<strong>in</strong>g the whole production cycle, and to calculate the amounts of<br />
ma<strong>in</strong> nutrients, nitrogen (N), phosphorus (P) and potassium (K) <strong>in</strong> manure produced by the birds dur<strong>in</strong>g the<br />
production cycle. The model was calibrated to match the real production and feed <strong>in</strong>take data, provided by<br />
the UK poultry <strong>in</strong>dustry for different systems (Le<strong>in</strong>onen <strong>et</strong> al., <strong>2012</strong>a;b), by adjust<strong>in</strong>g the model param<strong>et</strong>ers<br />
for growth rate, energy requirement for ma<strong>in</strong>tenance and egg production.<br />
The model calculated the N, P and K contents of the manure accord<strong>in</strong>g to the mass balance pr<strong>in</strong>ciple, i.e.<br />
the nutrients r<strong>et</strong>a<strong>in</strong>ed both <strong>in</strong> the animal body and eggs were subtracted from the total amount of nutrients<br />
obta<strong>in</strong>ed from the feed (<strong>in</strong>clud<strong>in</strong>g the additional nutrients obta<strong>in</strong>ed from forag<strong>in</strong>g <strong>in</strong> free range and organic<br />
production). In addition to the nutrients excr<strong>et</strong>ed by the birds, nutrients <strong>in</strong> the spilled feed and uncollected<br />
eggs were added to the manure <strong>in</strong> the calculations. For the purpose of the study, it was assumed that all<br />
broiler, pull<strong>et</strong>, layer and breeder manure was transported for soil improvement, exclud<strong>in</strong>g the proportion that<br />
was excr<strong>et</strong>ed outside <strong>in</strong> the non-organic free range production systems.<br />
A separate sub-model for arable production was used to quantify the environmental impacts of the ma<strong>in</strong><br />
feed <strong>in</strong>gredients, with ma<strong>in</strong> features as <strong>in</strong> Williams <strong>et</strong> al., (2010). All major crops used for production of<br />
poultry feed were modelled. For the crops partly or wholly produced overseas (maize, soya, sunflower, palm<br />
oil) the production was modelled as closely as possible us<strong>in</strong>g local techniques, and transport burdens for<br />
import<strong>in</strong>g were also <strong>in</strong>cluded. The greenhouse gas emissions aris<strong>in</strong>g from land use change were taken <strong>in</strong>to<br />
account accord<strong>in</strong>g to the pr<strong>in</strong>ciples of the carbon footpr<strong>in</strong>t<strong>in</strong>g m<strong>et</strong>hod PAS 2050 (BSI, 2011).<br />
A separate sub-model was used also used for manure <strong>in</strong> the nutrient cycle. In the model, the ma<strong>in</strong> nutrients<br />
that were applied to the soil <strong>in</strong> manure were accounted for as either crop products or as losses to the<br />
environment. The benefits of N, P and K rema<strong>in</strong><strong>in</strong>g <strong>in</strong> soil after land application of manure were credited to<br />
poultry by offs<strong>et</strong>t<strong>in</strong>g the need to apply fertilisers to w<strong>in</strong>ter wheat as described by Sandars <strong>et</strong> al., (2003) and<br />
implemented by Williams <strong>et</strong> al., (2006). For organic systems, N was supplied from a dedicated legume used<br />
199
PARALLEL SESSION 2C: QUANTIFICATION AND REDUCTION OF UNCERTAINTY 8 th Int. Conference on <strong>LCA</strong> <strong>in</strong> the<br />
Agri-<strong>Food</strong> Sector, 1-4 Oct <strong>2012</strong><br />
<strong>in</strong>stead of synth<strong>et</strong>ic N fertiliser, with rock P and K used <strong>in</strong>stead of triple superphosphate and potassium chloride.<br />
In all cases, long term emissions and yield ga<strong>in</strong>s were accounted for to ensure a mass balance of N.<br />
2.3. Environmental impacts<br />
Emissions to the environment were aggregated <strong>in</strong>to environmentally functional groups as follows. Global<br />
Warm<strong>in</strong>g Potential (GWP) was calculated us<strong>in</strong>g a timescale of 100 years. The ma<strong>in</strong> sources of GWP <strong>in</strong> poultry<br />
<strong>in</strong>dustry are carbon dioxide (CO2) from fossil fuel, nitrous oxide (N2O) and m<strong>et</strong>hane (CH4). GWP was<br />
quantified as CO2 equivalent: with a 100 year timescale 1 kg CH4 and N2O are equivalent to 25 and 298 kg<br />
CO2 respectively (Foster <strong>et</strong> al., 2007).<br />
Eutrophication Potential (EP) was calculated us<strong>in</strong>g the m<strong>et</strong>hod of the Institute of Environmental Sciences<br />
(CML) at Leiden University (http://www.leidenuniv.nl/<strong>in</strong>terfac/cml/ssp/<strong>in</strong>dex.html). The ma<strong>in</strong> sources are<br />
nitrate (NO3 - ) and phosphate (PO4 3- ) leach<strong>in</strong>g to water and ammonia (NH3) emissions to air. EP was quantified<br />
<strong>in</strong> terms of phosphate equivalents: 1 kg NO3-N and NH3-N are equivalent to 0.44 and 0.43 kg PO4 3- ,<br />
respectively.<br />
Acidification Potential (AP) was also calculated us<strong>in</strong>g the m<strong>et</strong>hod of the Institute of Environmental Sciences<br />
(CML) at Leiden University. The ma<strong>in</strong> source <strong>in</strong> poultry <strong>in</strong>dustry is ammonia emissions, tog<strong>et</strong>her with<br />
sulphur dioxide (SO2) from fossil fuel combustion. Ammonia contributes to AP despite be<strong>in</strong>g alkal<strong>in</strong>e; when<br />
emitted <strong>in</strong>to the atmosphere, it is oxidized to nitric acid. AP was quantified <strong>in</strong> terms of SO2 equivalents: 1 kg<br />
NH3-N is equivalent to 2.3 kg SO2.<br />
Primary Energy Use <strong>in</strong>cluded all the energy needed for extraction and supply of energy carriers.<br />
2.4. Uncerta<strong>in</strong>ty analysis<br />
A Monte Carlo approach was applied to quantify the uncerta<strong>in</strong>ties of the modelled systems (Wiltshire <strong>et</strong><br />
al., 2009, Le<strong>in</strong>onen <strong>et</strong> al., <strong>2012</strong>a;b). The systems model, tog<strong>et</strong>her with the animal production sub-model was<br />
run 5000 times, and dur<strong>in</strong>g each run a value of each <strong>in</strong>put variable was randomly selected from a pred<strong>et</strong>erm<strong>in</strong>ed<br />
distribution for this variable. The outcome of the analysis was the Coefficient of Variation, which was<br />
used to evaluate the statistical significance of the differences b<strong>et</strong>ween the systems at 5% probability level.<br />
The uncerta<strong>in</strong>ties <strong>in</strong> the <strong>in</strong>put variables were divided <strong>in</strong>to two groups, namely “alpha” and “b<strong>et</strong>a” errors.<br />
Alpha errors were considered to vary b<strong>et</strong>ween systems, and therefore were taken <strong>in</strong>to account <strong>in</strong> statistical<br />
analyses of the differences b<strong>et</strong>ween the systems. For example, variation b<strong>et</strong>ween farms <strong>in</strong> production, feed<br />
<strong>in</strong>take and energy use figures were all considered to represent alpha errors. In contrast, b<strong>et</strong>a errors were considered<br />
to be similar b<strong>et</strong>ween the systems, and had no effect <strong>in</strong> the statistical comparison b<strong>et</strong>ween the systems,<br />
e.g. the emission factor for N2O from manure or conversion factor from electricity to primary energy.<br />
The errors <strong>in</strong> the emission factors were associated with errors <strong>in</strong> the models used to generate them, and therefore<br />
considered as b<strong>et</strong>a errors (Wiltshire <strong>et</strong> al., 2009). Also, farms from which activity data were obta<strong>in</strong>ed<br />
were not restricted to particular climatic zones. However, it should be noted that the emissions themselves<br />
were affected for example by variation related to bird performance (e.g. N excr<strong>et</strong>ion), and therefore conta<strong>in</strong>ed<br />
also alpha errors.<br />
The uncerta<strong>in</strong>ties of the <strong>in</strong>put variables were quantified and their distribution functions specified on the<br />
basis of the data from the <strong>in</strong>dustry, and they also <strong>in</strong>cluded potential errors of the mechanistic models. The<br />
error distributions of the emission factors followed the IPCC (2006) guidel<strong>in</strong>es.<br />
3. Results<br />
3.1. Broilers<br />
The number of broiler birds required to produce the expected edible carcass weight of 1000 kg was higher<br />
<strong>in</strong> the standard <strong>in</strong>door system than <strong>in</strong> the free range and organic systems because the f<strong>in</strong>ish<strong>in</strong>g weight was<br />
lowest <strong>in</strong> the standard <strong>in</strong>door system. The length of the production cycle was much higher <strong>in</strong> free range and<br />
organic systems than <strong>in</strong> the standard <strong>in</strong>door system, thus the feed consumption per bird was also higher <strong>in</strong><br />
these systems. This had a major effect on the trends <strong>in</strong> environmental burdens (Table 3).<br />
Table 3. Global Warm<strong>in</strong>g Potential (GWP), Eutrophication Potential (EP), Acidification Potential (AP) and<br />
Primary Energy Use per 1000 kg of expected edible carcass weight <strong>in</strong> the ma<strong>in</strong> broiler production systems <strong>in</strong><br />
the UK. The Coefficient of Variation based on the alpha errors is given <strong>in</strong> the parentheses.<br />
200
PARALLEL SESSION 2C: QUANTIFICATION AND REDUCTION OF UNCERTAINTY 8 th Int. Conference on <strong>LCA</strong> <strong>in</strong> the<br />
Agri-<strong>Food</strong> Sector, 1-4 Oct <strong>2012</strong><br />
Standard Free range Organic<br />
GWP (t CO2e) 4.41 (8%) a 5.13 (8%) ab 5.66 (6%) b<br />
EP (kg PO4 3- e) 20.3 (8%) a 24.3 (7%) a 48.8 (6%) b<br />
AP (kg SO2e) 46.8 (8%) a 59.7 (7%) b 91.6 (6%) c<br />
Primary Energy (GJ) 25.4 (8%) a 25.7 (7%) a 40.3 (6%) b<br />
a,b,c Different superscript <strong>in</strong>dicates statistically significant difference (P < 0.05) b<strong>et</strong>ween the systems.<br />
Feed caused higher overall environmental impacts than any other materials <strong>in</strong>volved <strong>in</strong> broiler production,<br />
for example 71 - 72% of the total GWP and 65 - 81% of the Primary Energy Use of the system. The<br />
GWP was affected by relatively high CO2 emissions from the production and transport of some feed <strong>in</strong>gredients<br />
(e.g. non-organic soya, palm oil, fish meal and pure am<strong>in</strong>o acids) <strong>in</strong> the standard and non-organic free<br />
range broiler di<strong>et</strong>s. On the other hand, organic feed had generally much higher impact than the non-organic<br />
feed <strong>in</strong> other impact categories, especially EP. Although the emissions per land area are som<strong>et</strong>imes lower <strong>in</strong><br />
organic crop production compared to non-organic, the yields are generally much lower as fertility build<strong>in</strong>g<br />
and cover crops are required, and this makes the emissions higher per unit of the product. Leach<strong>in</strong>g after<br />
cultivat<strong>in</strong>g a clover ley was a major contributor to eutrophication potential.<br />
Emissions from manure were the ma<strong>in</strong> component of AP <strong>in</strong> broiler production and had also a relatively<br />
high contribution to EP. This was ma<strong>in</strong>ly a result of ammonia emissions, which contributed to both these<br />
potentials, tog<strong>et</strong>her with nitrate leach<strong>in</strong>g (affect<strong>in</strong>g only EP). The AP from manure was especially high <strong>in</strong> the<br />
organic system.<br />
3.2. Eggs<br />
The production of 1000 kg eggs required 51.2 lay<strong>in</strong>g birds <strong>in</strong> the cage system, 52.6 <strong>in</strong> the barn system,<br />
53.8 <strong>in</strong> the free range system and 56.3 <strong>in</strong> the organic system. This general trend <strong>in</strong> productivity also affected<br />
other aspects of derived activity data, such as feed consumption. Furthermore, the average feed consumption<br />
per bird was also higher <strong>in</strong> the alternative systems than <strong>in</strong> the cage system. Much of the explanation of the<br />
trends <strong>in</strong> environmental burdens that followed resulted from these differences <strong>in</strong> the efficiency of the systems<br />
(Table 4).<br />
As <strong>in</strong> the broiler systems, feed was the biggest component of GWP <strong>in</strong> egg production (contribut<strong>in</strong>g 64 -<br />
72% to the overall GWP and 54 - 75% to the overall Primary Energy Use of the systems). Compared with<br />
broiler production, the farm electricity use had a higher relative contribution to GWP and Primary Energy<br />
Use, especially <strong>in</strong> barn egg production. Aga<strong>in</strong>, manure was a major source of both EP and AP, which were<br />
especially high <strong>in</strong> the organic egg production system.<br />
Table 4. Global Warm<strong>in</strong>g Potential (GWP), Eutrophication Potential (EP), Acidification Potential (AP) and<br />
Primary Energy Use per 1000 kg of eggs <strong>in</strong> the ma<strong>in</strong> egg production systems <strong>in</strong> the UK. The Coefficient of<br />
Variation based on the alpha errors is given <strong>in</strong> the parentheses.<br />
Cage Barn Free range Organic<br />
GWP (t CO2e) 2.92 (5%) a 3.45 (5%) b 3.38 (6%) ab 3.42 (6%) b<br />
EP (kg PO4 3- e) 18.5 (3%) a 20.3 (4%) b 22.0 (5%) b 37.6 (5%) c<br />
AP (kg SO2e) 53.1 (2%) a 59.4 (4%) b 64.1 (5%) b 91.6 (5%) c<br />
Primary Energy (GJ) 16.9 (6%) a 22.2 (5%) b 18.8 (6%) a 26.4 (6%) c<br />
a,b,c Different superscript <strong>in</strong>dicates statistically significant difference (P < 0.05) b<strong>et</strong>ween the systems.<br />
4. Discussion<br />
The results of this study show that the environmental impacts of both broiler and egg production are<br />
largely related to the efficiency of resource use of each system. In broilers, the standard <strong>in</strong>door system had<br />
shorter production cycle compared to the alternative systems, and therefore also lowest feed consumption<br />
and manure production per functional unit. Also <strong>in</strong> egg production, the alternative systems were generally<br />
less efficient than the cage system, and therefore had also higher environmental impacts.<br />
Feed production and process<strong>in</strong>g was the ma<strong>in</strong> component of the global warm<strong>in</strong>g potential both <strong>in</strong> broiler<br />
and egg production systems. This was partly affected by the fact that some <strong>in</strong>gredients, most notably soya<br />
and palm oil, were considered to be partly produced on land that has been only recently converted from natural<br />
veg<strong>et</strong>ation to agricultural use <strong>in</strong> South America and South Asia. When calculat<strong>in</strong>g the land use change<br />
effect on GWP, this study applied the guidel<strong>in</strong>es of the carbon footpr<strong>in</strong>t<strong>in</strong>g m<strong>et</strong>hod PAS2050 (BSI, 2011).<br />
However, there is not a full <strong>in</strong>ternational agreement on the m<strong>et</strong>hod of how to account for land use changes <strong>in</strong><br />
<strong>LCA</strong>, and this has potentially a very big effect on the estimate of the environment impact of broiler and layer<br />
feed and poultry production <strong>in</strong> general.<br />
201
PARALLEL SESSION 2C: QUANTIFICATION AND REDUCTION OF UNCERTAINTY 8 th Int. Conference on <strong>LCA</strong> <strong>in</strong> the<br />
Agri-<strong>Food</strong> Sector, 1-4 Oct <strong>2012</strong><br />
The environmental impacts of broiler and egg systems <strong>in</strong> different countries have been quantified <strong>in</strong> some<br />
earlier studies (e.g. Williams <strong>et</strong> al., 2006; Mollenhorst <strong>et</strong> al., 2006; Pell<strong>et</strong>ier, 2008; Katajajuuri, 2008; Boggia<br />
<strong>et</strong> al., 2010, Dekker <strong>et</strong> al., 2011). However, systematic comparisons b<strong>et</strong>ween different animal production<br />
systems are still quite rare. In general, comparison b<strong>et</strong>ween different studies or different systems <strong>in</strong> a s<strong>in</strong>gle<br />
study is not feasible if the range of uncerta<strong>in</strong>ty <strong>in</strong> the results is not available. Therefore it is quite surpris<strong>in</strong>g<br />
that uncerta<strong>in</strong>ly analysis has not been widely applied when quantify<strong>in</strong>g the environmental impacts of agricultural<br />
products. The m<strong>et</strong>hod applied <strong>in</strong> the present study allows to separate different error categories <strong>in</strong> the<br />
<strong>in</strong>put data, and provides a tool for evaluat<strong>in</strong>g the differences b<strong>et</strong>ween production systems <strong>in</strong> a consistent<br />
way.<br />
In addition to the general comparison b<strong>et</strong>ween different broiler and egg production systems, the modell<strong>in</strong>g<br />
framework applied <strong>in</strong> this study provides an opportunity to carry out d<strong>et</strong>ailed farm level assessments on<br />
how to reduce the environmental impacts of production. S<strong>in</strong>ce the analysis is largely based on functional<br />
relationships built <strong>in</strong> the animal and crop production sub-models, it is possible to exam<strong>in</strong>e holistic effects of<br />
possible changes <strong>in</strong> the system. For example, changes <strong>in</strong> consumption and composition of feed have effects<br />
both on the impacts occurr<strong>in</strong>g dur<strong>in</strong>g the crop production and feed process<strong>in</strong>g, and also on the subsequent<br />
emissions from poultry manure dur<strong>in</strong>g hous<strong>in</strong>g, stor<strong>in</strong>g and field application. Similarly, the differences <strong>in</strong> the<br />
growth rate of broilers affects the amount of feed consumed per functional unit, the amount of manure produced<br />
and the amount of energy and build<strong>in</strong>gs needed, among other th<strong>in</strong>gs.<br />
Future options <strong>in</strong> reduc<strong>in</strong>g the environmental impacts of animal production <strong>in</strong>clude breed<strong>in</strong>g programmes<br />
for b<strong>et</strong>ter environmental performance. The current results <strong>in</strong>dicate that improv<strong>in</strong>g feed efficiency, <strong>in</strong>clud<strong>in</strong>g<br />
not only the quantity but also composition and nutrient content of the consumed feed has potential to reduce<br />
the environmental impacts. The modell<strong>in</strong>g framework with functional relationships applied <strong>in</strong> the present<br />
study will allow d<strong>et</strong>ailed and realistic tools for quantify<strong>in</strong>g the environmental consequences of future gen<strong>et</strong>ic<br />
progress <strong>in</strong> animals. Further options for reduc<strong>in</strong>g the high environmental impacts from animal feed <strong>in</strong>clude<br />
the use of alternative, more environmentally friendly <strong>in</strong>gredients. For example, it can be expected that reduc<strong>in</strong>g<br />
the <strong>in</strong>clusion of imported soya, partly orig<strong>in</strong>ated from recently converted agricultural land, and replac<strong>in</strong>g<br />
it us<strong>in</strong>g locally grown prote<strong>in</strong> sources may reduce the high greenhouse gas emissions related to both land use<br />
changes and long transport distances.<br />
5. Conclusion<br />
There were relatively large differences <strong>in</strong> many categories of the environmental impacts b<strong>et</strong>ween different<br />
UK broiler and egg production systems and generally these reflected the differences <strong>in</strong> the efficiency <strong>in</strong> production,<br />
feed consumption (and related production of manure) and material and energy use.<br />
The m<strong>et</strong>hodology used <strong>in</strong> the current study with functional relationships b<strong>et</strong>ween different activities related<br />
to animal production and mechanistic representation of biological processes provides a realistic tool for<br />
quantification of environmental impacts of various agricultural systems. This <strong>in</strong>cludes the quantifications of<br />
the overall uncerta<strong>in</strong>ties of the model outputs, which allows systematic comparison b<strong>et</strong>ween different production<br />
systems.<br />
6. Acknowledgments<br />
This research was f<strong>in</strong>ancially supported by Aviagen Ltd, DSM Nutritional Products Ltd, Harbro Ltd, Moy<br />
Park Ltd, National Farmers’ Union, Noble <strong>Food</strong>s Ltd, O’Kane Poultry Ltd, The Soil Association Ltd and<br />
Waitrose Ltd with match fund<strong>in</strong>g from Defra, through the Susta<strong>in</strong>able Livestock Production LINK program,<br />
DARDNI and the Scottish Government.<br />
7. References<br />
BSI. 2011. Specification for the assessment of the life cycle greenhouse gas emissions of goods and services. PAS 2050:2011.<br />
http://www.bsigroup.com/Standards-and-Publications/How-we-can-help-you/Professional-Standards-Service/PAS-2050/<br />
Defra. 2007. GB Meat Chicken Population - The National Flock. Version 1. RADAR Team, <strong>Food</strong> and Farm<strong>in</strong>g Group, Department<br />
for the Environment, <strong>Food</strong> and Rural Affairs (Defra).<br />
http://www.defra.gov.uk/foodfarm/farmanimal/diseases/v<strong>et</strong>surveillance/reports/documents/rp6309.pdf<br />
Defra. 2009. Agricultural statistics http://www.defra.gov.uk/statistics/files/defra-stats-foodfarm-crosscutt<strong>in</strong>g-auk-2011-chapter05commodities-livestock-120709.xls<br />
Dekker, S.E.M., de Boer, I.J.M., Vermeij, I., Aarn<strong>in</strong>k, A.J.A., Groot Koerkamp, P.W.G., 2011. Ecological and economic evaluation<br />
of Dutch egg production systems. Livestock Sci. 139, 109–121.<br />
Emmans, G.C., Kyriazakis, I., 2001. Consequences of gen<strong>et</strong>ic change <strong>in</strong> farm animals on food <strong>in</strong>take and feed<strong>in</strong>g behaviour. Proc.<br />
Nutr. Soc. 60, 115-125.<br />
FAO, 2011. <strong>Food</strong> and Agriculture Organization of the United Nations. http://faostat.fao.org<br />
202
PARALLEL SESSION 2C: QUANTIFICATION AND REDUCTION OF UNCERTAINTY 8 th Int. Conference on <strong>LCA</strong> <strong>in</strong> the<br />
Agri-<strong>Food</strong> Sector, 1-4 Oct <strong>2012</strong><br />
Forster, P., Ramaswamy, V., Artaxo, P., Berntsen, T., B<strong>et</strong>ts, R., Fahey, D.W., Haywood, J., Lean, J., Lowe, D.C., Myhre, G.,<br />
Nganga, J., Pr<strong>in</strong>n, R., Raga, G., Schulz, M., Van Dorland, R., 2007. Changes <strong>in</strong> atmospheric constituents and <strong>in</strong> radiative forc<strong>in</strong>g.<br />
In: Solomon, S., Q<strong>in</strong>, D., Mann<strong>in</strong>g, M., Chen, Z., Marquis, M., Averyt, K.B., Tignor, M., Miller, H.L. (Eds.), Climate Change<br />
2007: The Physical Science Basis. Contribution of Work<strong>in</strong>g Group I to the Fourth Assessment Report of the Intergovernmental<br />
Panel on Climate Change. Cambridge University Press, Cambridge, United K<strong>in</strong>gdom and New York, NY, USA.<br />
IPCC, 2006. IPCC Guidel<strong>in</strong>es for National Greenhouse Gas Inventories. (2006 Guidel<strong>in</strong>es) http://www.ipccnggip.iges.or.jp/public/2006gl/<strong>in</strong>dex.html<br />
Katajajuuri, J.M., 2008. Experiences and improvement possibilities — <strong>LCA</strong> case study of broiler chicken production. Proc. 6th Int.<br />
Conf. Life Cycle Assessment <strong>in</strong> the Agri-<strong>Food</strong> Sector. Zurich, Switzerland.<br />
Le<strong>in</strong>onen, I., Williams, A.G., Wiseman, J., Guy, J., Kyriazakis, I., <strong>2012</strong>a. Predict<strong>in</strong>g the environmental impacts of chicken systems <strong>in</strong><br />
the UK through a Life Cycle Assessment: broiler production systems. Poult. Sci. 91, 8-25.<br />
Le<strong>in</strong>onen, I., Williams, A.G., Wiseman, J., Guy, J., Kyriazakis, I., <strong>2012</strong>b. Predict<strong>in</strong>g the environmental impacts of chicken systems <strong>in</strong><br />
the UK through a Life Cycle Assessment: egg production systems. Poult. Sci. 91, 26-40.<br />
Mollenhorst, H., Berentsen, P.B.M., De Boer I.J.M., 2006. On-farm quantification of susta<strong>in</strong>ability <strong>in</strong>dicators: an application to egg<br />
production systems. Br. Poult. Sci. 47, 405-417.<br />
Pell<strong>et</strong>ier, N., 2008. Environmental performance <strong>in</strong> the US broiler poultry sector: Life cycle energy use and greenhouse gas, ozone<br />
depl<strong>et</strong><strong>in</strong>g, acidify<strong>in</strong>g and eutrophy<strong>in</strong>g emissions. Agric. Syst. 98, 67-73.<br />
Sandars, D.L., Audsley, E., Can<strong>et</strong>e, C., Cumby, T.R., Scotford, I.M., Williams, A.G., 2003. Environmental benefits of livestock<br />
manure management practices and technology by Life Cycle Assessment. Biosyst. Eng. 84:267-281.<br />
Wellock, I.J., Emmans, G.C., Kyriazakis, I., 2003. Modell<strong>in</strong>g the effects of thermal environment and di<strong>et</strong>ary composition on pig<br />
performance: model logic and concepts. Anim. Sci. 77, 255-266.<br />
Williams, A.G., Audsley, E., Sandars, D.L., 2006. D<strong>et</strong>erm<strong>in</strong><strong>in</strong>g the environmental burdens and resource use <strong>in</strong> the production of<br />
agricultural and horticultural commodities. Ma<strong>in</strong> Report. Defra Research Project IS0205. http://preview.t<strong>in</strong>yurl.com/Cranfield-<br />
IS0205<br />
Williams, A.G., Audsley, E., Sandars, D.L., 2010. Environmental burdens of produc<strong>in</strong>g bread wheat, oilseed rape and potatoes <strong>in</strong><br />
England and Wales us<strong>in</strong>g simulation and system modell<strong>in</strong>g. The Int. J. Life Cycle Assess. 15, 855-868.<br />
Wiltshire, J., Tucker, G., Williams, A.G., Foster, C., Wynn, S., Thorn, R., Chadwick, D., 2009. Supplementary Technical Report to<br />
“Scenario build<strong>in</strong>g to test and <strong>in</strong>form the development of a BSI m<strong>et</strong>hod for assess<strong>in</strong>g GHG emissions from food”. F<strong>in</strong>al report to<br />
Defra on research project FO0404, London, UK. Accessed Oct. 18, 2011. http://preview.t<strong>in</strong>yurl.com/F<strong>in</strong>-Rpt-FO0404<br />
203
PARALLEL SESSION 2C: QUANTIFICATION AND REDUCTION OF UNCERTAINTY 8 th Int. Conference on <strong>LCA</strong> <strong>in</strong> the<br />
Agri-<strong>Food</strong> Sector, 1-4 Oct <strong>2012</strong><br />
204<br />
Influence of scenario uncerta<strong>in</strong>ty <strong>in</strong> agricultural <strong>in</strong>puts on <strong>LCA</strong><br />
results for agricultural production systems<br />
Kiyotada Hayashi 1,* , Naoki Mak<strong>in</strong>o 2 , Koichi Shobatake 2 , Sh<strong>in</strong>go Hokazono 1<br />
1 National Agriculture and <strong>Food</strong> Research Organisation<br />
2 TCO2 Co. Ltd.<br />
Correspond<strong>in</strong>g author. E-mail: hayashi@affrc.go.jp<br />
ABSTRACT<br />
Practical applications of life cycle assessment (<strong>LCA</strong>) to agricultural production systems necessitate articulat<strong>in</strong>g uncerta<strong>in</strong>ties caused<br />
by scenario <strong>in</strong>d<strong>et</strong>erm<strong>in</strong>acy, because practitioners do not have sufficient knowledge about agricultural <strong>in</strong>put production processes.<br />
However, current understand<strong>in</strong>g about scenario uncerta<strong>in</strong>ties is still limited on account of <strong>in</strong>sufficient knowledge. Here, we propose a<br />
m<strong>et</strong>hod to quantify scenario uncerta<strong>in</strong>ty <strong>in</strong> agricultural <strong>in</strong>puts and to assess the uncerta<strong>in</strong>ty <strong>in</strong> comparative <strong>LCA</strong> of agricultural production<br />
systems. We formulate mathematical expressions about uncerta<strong>in</strong>ty <strong>in</strong>tervals due to scenario <strong>in</strong>d<strong>et</strong>erm<strong>in</strong>acy and derive uncerta<strong>in</strong>ty<br />
<strong>in</strong>tervals for conventional, environmentally friendly, and organic rice production systems <strong>in</strong> Japan. Scenario uncerta<strong>in</strong>ty <strong>in</strong><br />
chemical fertiliser production is analysed as an example. The results <strong>in</strong>dicate that uncerta<strong>in</strong>ty <strong>in</strong>tervals are useful <strong>in</strong> understand<strong>in</strong>g the<br />
stability of results. The m<strong>et</strong>hodology proposed <strong>in</strong> this study can be further developed as a technique to deal with uncerta<strong>in</strong>ty and<br />
<strong>in</strong>stability <strong>in</strong> <strong>LCA</strong> of agricultural production systems.<br />
Keywords: scenario uncerta<strong>in</strong>ty, agricultural <strong>in</strong>puts, adaptation, comparative <strong>LCA</strong>, <strong>in</strong>ventory analysis<br />
1. Introduction<br />
Uncerta<strong>in</strong>ty analysis us<strong>in</strong>g the pedigree matrix for data quality tog<strong>et</strong>her with Monte Carlo simulations is a<br />
common practice <strong>in</strong> life cycle assessment (<strong>LCA</strong>), and several <strong>LCA</strong> software products provide simulation<br />
functions. Because of certa<strong>in</strong> special characteristics of agriculture, uncerta<strong>in</strong>ties <strong>in</strong> param<strong>et</strong>ers such as crop<br />
yield and direct field emissions are <strong>in</strong>tegrated <strong>in</strong>to the <strong>LCA</strong> for agriculture (Bass<strong>et</strong>-Mens <strong>et</strong> al., 2006). In<br />
addition, uncerta<strong>in</strong>ties attributed to a wide vari<strong>et</strong>y of management practices and uncerta<strong>in</strong>ties <strong>in</strong> the relationship<br />
b<strong>et</strong>ween management practices and environmental impacts have been estimated us<strong>in</strong>g statistical resampl<strong>in</strong>g<br />
(nonparam<strong>et</strong>ric bootstrapp<strong>in</strong>g) (Hayashi, 2011).<br />
Although these studies ma<strong>in</strong>ly clarified uncerta<strong>in</strong>ties <strong>in</strong> models and param<strong>et</strong>ers used to conduct <strong>LCA</strong>,<br />
practical applications of <strong>LCA</strong> to agricultural production systems necessitate articulat<strong>in</strong>g uncerta<strong>in</strong>ties caused<br />
by scenario <strong>in</strong>d<strong>et</strong>erm<strong>in</strong>acy, because practitioners do not have sufficient knowledge of the d<strong>et</strong>ails <strong>in</strong> agricultural<br />
<strong>in</strong>put production processes (background processes of agricultural production). For example, farmers <strong>in</strong><br />
general do not know what k<strong>in</strong>d of technologies are used for mak<strong>in</strong>g chemical fertilisers and where fertiliser<br />
factories are located. In other words, decision makers or analysts face decision problems under <strong>in</strong>sufficient<br />
knowledge.<br />
However, current understand<strong>in</strong>g about scenario uncerta<strong>in</strong>ties is still limited <strong>in</strong> <strong>LCA</strong> of agricultural production<br />
systems as a result of <strong>in</strong>sufficient knowledge. Therefore, this study establishes a m<strong>et</strong>hod to quantify<br />
scenario uncerta<strong>in</strong>ty <strong>in</strong> agricultural <strong>in</strong>puts and assesses the <strong>in</strong>fluence of this uncerta<strong>in</strong>ty on a comparative<br />
<strong>LCA</strong> of agricultural production systems.<br />
2. M<strong>et</strong>hods<br />
2.1. Classification of uncerta<strong>in</strong>ties<br />
We classify uncerta<strong>in</strong>ty us<strong>in</strong>g a tri-partition for the uncerta<strong>in</strong>ty typology, namely param<strong>et</strong>er, model, and<br />
scenario uncerta<strong>in</strong>ty. Param<strong>et</strong>er uncerta<strong>in</strong>ty reflects our <strong>in</strong>compl<strong>et</strong>e knowledge about the true value of a param<strong>et</strong>er<br />
(Huijbregts <strong>et</strong> al., 2003) and is related to <strong>in</strong>ventory data and characterisation and weight<strong>in</strong>g factors.<br />
Common sources of param<strong>et</strong>er uncerta<strong>in</strong>ty are imprecise measurements, <strong>in</strong>compl<strong>et</strong>e or outdated measurements,<br />
and no measurements (lack of data) (Huijbregts, 1998). Model uncerta<strong>in</strong>ty concerns assumptions and<br />
simplifications that lead to uncerta<strong>in</strong>ty about the validity of the model’s predictions for a real world situation<br />
(Huijbregts <strong>et</strong> al., 2003). An important example of model uncerta<strong>in</strong>ty is the loss of spatial and temporal characteristics<br />
<strong>in</strong> <strong>in</strong>ventory analysis. Scenario uncerta<strong>in</strong>ty was orig<strong>in</strong>ally termed ‘uncerta<strong>in</strong>ty due to choices’<br />
(Huijbregts, 1998) and ‘decision rule uncerta<strong>in</strong>ty’ (Hertwich <strong>et</strong> al., 2000), because it refers to uncerta<strong>in</strong>ty<br />
caused by normative choices on functional units and system boundaries <strong>in</strong> goal and scope def<strong>in</strong>ition, allocation<br />
<strong>in</strong> <strong>in</strong>ventory analysis, and the number of impact categories and def<strong>in</strong>itions <strong>in</strong> impact assessment<br />
(Huijbregts <strong>et</strong> al., 2003). We extend the scope of scenario construction to scenario <strong>in</strong>d<strong>et</strong>erm<strong>in</strong>acy, which we<br />
encounter <strong>in</strong> practical situations.
PARALLEL SESSION 2C: QUANTIFICATION AND REDUCTION OF UNCERTAINTY 8 th Int. Conference on <strong>LCA</strong> <strong>in</strong> the<br />
Agri-<strong>Food</strong> Sector, 1-4 Oct <strong>2012</strong><br />
2.2. Uncerta<strong>in</strong>ty <strong>in</strong>tervals due to scenario <strong>in</strong>d<strong>et</strong>erm<strong>in</strong>acy<br />
An <strong>in</strong>terval for an environmental impact of an agricultural production system, p, which expresses uncer-<br />
L R<br />
ta<strong>in</strong>ty due to scenario <strong>in</strong>d<strong>et</strong>erm<strong>in</strong>acy of an <strong>in</strong>put, f, is written as[ e ( p), e ( p )] . Here, the lower bound (de-<br />
f f<br />
noted by superscript L) and the upper bound (denoted by superscript R) are def<strong>in</strong>ed as follows:<br />
L L<br />
ef ( p) f ( p) o( p) d( p)<br />
, Eq. 1<br />
R R<br />
e ( p) f ( p) o( p) d( p)<br />
, Eq. 2<br />
f<br />
LR LR where e ( p)<br />
is the lower or upper bound of an environmental impact of p with respect to f, f ( p)<br />
is<br />
f<br />
the lower and upper bounds of an environmental impact of p caused by the focused <strong>in</strong>put f (e.g. fertilisers),<br />
o(p) is an environmental impact of p caused by the other <strong>in</strong>puts and d(p) is an environmental impact of p<br />
caused by direct emissions.<br />
Although equations 1 and 2 express an <strong>in</strong>terval with respect to an attribute of an <strong>in</strong>put, we will cope with<br />
multiple attributes of an <strong>in</strong>put as illustrated <strong>in</strong> Table 1, which illustrates an example with three attributes. It is<br />
supposed that there are t alternative scenarios <strong>in</strong> production technology, l alternative scenarios <strong>in</strong> production<br />
location, and d alternative scenarios <strong>in</strong> description types. The lower and upper bounds for production technology,<br />
for example, are d<strong>et</strong>erm<strong>in</strong>ed with respect to i on the condition that j and k are s<strong>et</strong> to the average (default)<br />
scenarios ( j and k ).<br />
Table 1. Derivation of uncerta<strong>in</strong>ty <strong>in</strong>terval due to scenario <strong>in</strong>d<strong>et</strong>erm<strong>in</strong>acy: an example<br />
Attribute Production technology Production location Description type a<br />
Alternative scenario i T {1,2, , t}<br />
j L {1,2, , l}<br />
k D {1,2, , d}<br />
L<br />
f ( p )<br />
m<strong>in</strong> fi<br />
j k<br />
m<strong>in</strong> i jk<br />
m<strong>in</strong> fijk<br />
iT R<br />
f ( p )<br />
max fi<br />
j k<br />
iT j L f<br />
<br />
max f j<br />
a Information used to connect the foreground system and the background system<br />
2.3. Scenario <strong>in</strong>d<strong>et</strong>erm<strong>in</strong>acy <strong>in</strong> practical situations<br />
jL i k<br />
kD max f k<br />
We analyse the follow<strong>in</strong>g three situations <strong>in</strong> which compl<strong>et</strong>e scenarios are difficult to construct. In the<br />
first situation, the <strong>in</strong>formation on production technology is unavailable. For example, the technical d<strong>et</strong>ails<br />
about the production processes for fertilisers and pesticides are not publicised because they are the key to<br />
successful bus<strong>in</strong>ess management. Although the full description of the production processes is difficult to<br />
obta<strong>in</strong>, uncerta<strong>in</strong>ty due to unavailability of technological d<strong>et</strong>ails is partly assessed by compar<strong>in</strong>g the cases<br />
with and without adaptation <strong>in</strong> life cycle <strong>in</strong>ventory (LCI) data for agricultural <strong>in</strong>puts (Ossés de Eicker <strong>et</strong> al.,<br />
2010).<br />
The second situation concerns uncerta<strong>in</strong>ty due to the lack of knowledge of the production location of agricultural<br />
<strong>in</strong>puts. A typical example is the <strong>in</strong>formation on the transportation of domestic and imported agricultural<br />
<strong>in</strong>puts, such as fertilisers and pesticides. Uncerta<strong>in</strong>ty <strong>in</strong>tervals are calculated by compar<strong>in</strong>g different<br />
scenarios, such as cases <strong>in</strong> which all chemical fertilisers are imported (import scenario), and those <strong>in</strong> which<br />
all are made <strong>in</strong> Japan (domestic scenario). The average scenario was also estimated us<strong>in</strong>g national fertiliser<br />
statistics.<br />
The third situation we analyse is the lack of specifications for agricultural <strong>in</strong>puts. In this situation, the follow<strong>in</strong>g<br />
verbal expressions (description types) are used for the assessment: ‘40,000 JPY fertilisers were applied<br />
per ha per year’ and ‘54 N-kg nitrogen fertilisers were applied per ha per year’. Uncerta<strong>in</strong>ty <strong>in</strong>tervals<br />
are obta<strong>in</strong>ed by compar<strong>in</strong>g the scenario <strong>in</strong> which only the total sum of chemical fertiliser costs is known and<br />
the scenario <strong>in</strong> which d<strong>et</strong>ailed <strong>in</strong>formation about the quantities of each chemical fertiliser is available.<br />
2.4. Comparison at the level of agricultural production systems<br />
The quantification of uncerta<strong>in</strong>ty is conducted at the level of agricultural production systems. Conventional,<br />
environmentally friendly, and organic rice cultivation <strong>in</strong> the central part of Japan are compared; that<br />
kD i j<br />
205
PARALLEL SESSION 2C: QUANTIFICATION AND REDUCTION OF UNCERTAINTY 8 th Int. Conference on <strong>LCA</strong> <strong>in</strong> the<br />
206<br />
Agri-<strong>Food</strong> Sector, 1-4 Oct <strong>2012</strong><br />
L R<br />
L R<br />
L R<br />
is, [ e ( p ), e ( p )] , [ e ( p ), e ( p )] , and [ e ( p ), e ( p )] are compared to each other, where PC is the<br />
f C f C f E f E<br />
f O f O<br />
conventional production system, PE is the environmentally friendly production system, and PO is the organic<br />
production system.<br />
2.5. System description and impact assessment<br />
An outl<strong>in</strong>e of each production system is illustrated <strong>in</strong> Table 2. The conventional and environmentally<br />
friendly production systems are based on the bus<strong>in</strong>ess activities of an agricultural production cooperation <strong>in</strong><br />
2007 and 2008. D<strong>et</strong>ails of the agricultural practices <strong>in</strong> the latter system are def<strong>in</strong>ed by the prefectural government.<br />
The organic production system is based on a field trial conducted by the prefectural extension service<br />
staff on the cooperation’s fields <strong>in</strong> 2007 and 2008. Although there are several k<strong>in</strong>ds of organic rice production<br />
systems <strong>in</strong> Japan, the organic production system <strong>in</strong> this study uses rice bran and weed<strong>in</strong>g mach<strong>in</strong>ery<br />
as weed control practices.<br />
Table 2. Outl<strong>in</strong>e of conventional, environmentally friendly, and organic rice production systems<br />
Conventional a Environmentally Friendly a Organic b<br />
Seed dis<strong>in</strong>fection m<strong>et</strong>hod Fungicide application Hot-water treatment Hot-water treatment<br />
Density of transplant<strong>in</strong>g (Number<br />
of plates for seedl<strong>in</strong>g rais<strong>in</strong>g)<br />
28 20 20<br />
Weed<strong>in</strong>g m<strong>et</strong>hod Herbicide application Herbicide application<br />
Disease and <strong>in</strong>sect damage control<br />
m<strong>et</strong>hod<br />
Fungicide application<br />
Insecticide application<br />
Application of rice bran<br />
Use of weed<strong>in</strong>g mach<strong>in</strong>ery<br />
Type of fertilisers Chemical fertilisers<br />
Chemical fertilisers<br />
Organic fertilisers<br />
Yield (t/ha) 5.96 5.58 4.97<br />
a<br />
Based on activities of an agricultural production cooperation (‘H Farm’).<br />
b<br />
Based on a field trial conducted by the prefectural extension service staff on the cooperation’s fields<br />
Organic fertilisers<br />
The farm gate (cradle to gate) forms the system boundary and 1 kg of brown rice was used as the functional<br />
unit. Global warm<strong>in</strong>g potential over 100 years is tentatively applied to the comparisons. This paper<br />
analyses the <strong>in</strong>fluence of scenario uncerta<strong>in</strong>ty, ma<strong>in</strong>ly <strong>in</strong> fertilisers, on <strong>LCA</strong> results as a first step to the overall<br />
assessment.<br />
2.6. Life cycle <strong>in</strong>ventory<br />
JA<strong>LCA</strong> (Japan Agricultural Life Cycle Assessment) Database (Hayashi <strong>et</strong> al., <strong>2012</strong>), which is the updated<br />
version of the NARO (National Agriculture and <strong>Food</strong> Research Organisation) LCI database (Hayashi <strong>et</strong> al.,<br />
2010), was used to construct the LCI data for the production systems. SimaPro 7.3 was used for data management<br />
and calculation. The d<strong>et</strong>ails are as follows:<br />
(1) Agricultural <strong>in</strong>put production processes <strong>in</strong> eco<strong>in</strong>vent 2.2 were adapted to Japan us<strong>in</strong>g the J<strong>LCA</strong>-<strong>LCA</strong><br />
database.<br />
(2) Six-step transportation processes were constructed to generate transportation scenarios for chemical<br />
fertiliser production, as illustrated <strong>in</strong> Fig. 1. Three scenarios for chemical fertilisers (the domestic<br />
production scenario, the import scenario, and the national average scenario, which is the weighted<br />
average based on statistics) were constructed.<br />
(3) Emission factors based on Input-Output (IO) tables (Nansai <strong>et</strong> al., 2002) were <strong>in</strong>troduced to use the<br />
mon<strong>et</strong>ary verbal expressions.
PARALLEL SESSION 2C: QUANTIFICATION AND REDUCTION OF UNCERTAINTY 8 th Int. Conference on <strong>LCA</strong> <strong>in</strong> the<br />
Agri-<strong>Food</strong> Sector, 1-4 Oct <strong>2012</strong><br />
I-1<br />
Foreign material<br />
factory<br />
Figure 1. Generation of transportation scenarios <strong>in</strong> the case of chemical fertiliser production. T: transport<br />
stage, I: <strong>in</strong>put, and O: output.<br />
3. Results<br />
3.1. Production technology<br />
There were no significant differences b<strong>et</strong>ween the case with the adapted LCI data for chemical fertilisers<br />
and that with the orig<strong>in</strong>al fertiliser data from eco<strong>in</strong>vent. Similar results were obta<strong>in</strong>ed <strong>in</strong> the case of pesticides.<br />
3.2. Production location<br />
T-1<br />
Foreign fertiliser<br />
factory<br />
Lack of <strong>in</strong>formation on transportation scenarios caused uncerta<strong>in</strong>ty (Fig. 2). However, the relative superiority<br />
among conventional, environmentally friendly, and organic rice cultivation rema<strong>in</strong>ed unchanged.<br />
Figure 2. Greenhouse gas (GHG) emissions of the three production systems with uncerta<strong>in</strong>ty due to <strong>in</strong>d<strong>et</strong>erm<strong>in</strong>acy<br />
of transportation scenarios <strong>in</strong> the case of chemical fertiliser production (kg CO2 eq./kg). From the left<br />
(<strong>in</strong> the boxes): the domestic production scenario, the national average scenario, and the import scenario.<br />
3.3. Verbal expressions as scenarios<br />
O-1<br />
Foreign material<br />
factory<br />
T-2 T-2<br />
Foreign port Foreign port<br />
T-3 T-3<br />
Domestic port Domestic port<br />
Eco<strong>in</strong>vent process<br />
Japan specific process<br />
Domestic material<br />
factory<br />
T-4 T-5<br />
I-2 Domestic fertiliser factory<br />
O-2<br />
T-4 T-6<br />
Import scenario<br />
Organic<br />
Environmentally friendly<br />
Conventional<br />
Regional storehouse<br />
0.5 0.6 0.7 0.8 0.9 1.0<br />
Domestic production scenario<br />
Uncerta<strong>in</strong>ty due to the lack of the specifications was larger than that due to the scenario <strong>in</strong>d<strong>et</strong>erm<strong>in</strong>acy<br />
described above (see Fig. 3). The relative superiority b<strong>et</strong>ween environmentally friendly and organic cultivation<br />
was <strong>in</strong>d<strong>et</strong>erm<strong>in</strong>able.<br />
207
PARALLEL SESSION 2C: QUANTIFICATION AND REDUCTION OF UNCERTAINTY 8 th Int. Conference on <strong>LCA</strong> <strong>in</strong> the<br />
Agri-<strong>Food</strong> Sector, 1-4 Oct <strong>2012</strong><br />
Figure 3. Greenhouse gas (GHG) emissions of the three production systems with uncerta<strong>in</strong>ty due to the lack<br />
of specifications <strong>in</strong> the case of chemical fertiliser production (kg CO2 eq./kg). In the boxes, the upper bounds<br />
are GHG emissions based on <strong>in</strong>put-output tables, and the lower bounds correspond to the national average<br />
scenario. It is assumed that values us<strong>in</strong>g emission factors based on <strong>in</strong>put-output tables tend to be overestimated.<br />
4. Discussion<br />
Assess<strong>in</strong>g the <strong>in</strong>fluence of scenario uncerta<strong>in</strong>ty <strong>in</strong> all agricultural <strong>in</strong>puts is important, although we paid<br />
special attention to chemical fertilisers. In other words, it is necessary to conduct uncerta<strong>in</strong>ty analysis for<br />
organic fertilisers, pesticides, mach<strong>in</strong>ery, and build<strong>in</strong>g. If we assess the <strong>in</strong>fluence of organic fertilisers, for<br />
example, uncerta<strong>in</strong>ty <strong>in</strong>tervals for the organic and environmentally friendly production systems may become<br />
longer. S<strong>in</strong>ce direct GHG emissions from organic fertiliser production processes are estimated to be a significant<br />
proportion of the total GHG emissions, uncerta<strong>in</strong>ty analysis of the compost<strong>in</strong>g process is important<br />
when mak<strong>in</strong>g decisions.<br />
Although we restricted our attention to global warm<strong>in</strong>g <strong>in</strong> this study, a vari<strong>et</strong>y of impact categories should<br />
be used for analys<strong>in</strong>g the <strong>in</strong>fluence of scenario uncerta<strong>in</strong>ty <strong>in</strong> various agricultural <strong>in</strong>puts. Ammonia emissions<br />
from compost<strong>in</strong>g processes are, for example, not negligible, and thus eutrophication and acidification<br />
are important.<br />
With regard to the techniques for uncerta<strong>in</strong>ty analysis, we discuss three issues. First, we have to cope with<br />
unavailability of data on d<strong>et</strong>ailed production processes. Although we <strong>in</strong>troduced the m<strong>et</strong>hod of adaptation,<br />
which is equivalent to generat<strong>in</strong>g a child from parents <strong>in</strong> structured computer languages, further formalised<br />
techniques would be necessary for modell<strong>in</strong>g production technologies. Second, problems with unavailability<br />
of d<strong>et</strong>ailed <strong>in</strong>formation are also applicable to transportation. In addition to the use of statistics, the <strong>in</strong>troduction<br />
of case-based reason<strong>in</strong>g would be important. Third, we have to pay attention to the difference <strong>in</strong> the<br />
foreground-background connection b<strong>et</strong>ween an amount and a mass. That is, the third result illustrates the<br />
reliability of simple estimation us<strong>in</strong>g emission coefficients based on IO tables. In addition, further development<br />
of scenario uncerta<strong>in</strong>ty analysis by establish<strong>in</strong>g a m<strong>et</strong>hod to convert verbal expressions to numerical<br />
<strong>in</strong>formation is necessary.<br />
5. Conclusion<br />
The primary purpose of quantify<strong>in</strong>g scenario uncerta<strong>in</strong>ty is to understand the stability of the results <strong>in</strong><br />
comparative <strong>LCA</strong>. The <strong>in</strong>terval <strong>in</strong>formation is useful <strong>in</strong> <strong>in</strong>tuitively understand<strong>in</strong>g the degree of uncerta<strong>in</strong>ty.<br />
Furthermore, the results of simple comparisons b<strong>et</strong>ween alternative productions systems may be revised by<br />
us<strong>in</strong>g <strong>in</strong>terval comparisons. Thus, <strong>in</strong>terval judgments will be a key to mak<strong>in</strong>g results more robust. The m<strong>et</strong>hodology<br />
proposed <strong>in</strong> this study can be further developed as a technique to deal with uncerta<strong>in</strong>ty and <strong>in</strong>stability<br />
<strong>in</strong> <strong>LCA</strong> of agricultural production systems.<br />
6. References<br />
Bass<strong>et</strong>-Mens, C., van der Werf, H.M.G., Durand, P., L<strong>et</strong>erme, P., 2006. Implications of uncerta<strong>in</strong>ty and variability <strong>in</strong> the life cycle<br />
assessment of pig production systems. The International Journal of Life Cycle Assessment 11(5), 298-304.<br />
Hayashi, K., Uchida, S., Hokazono, S., Sato, M., 2010. Modell<strong>in</strong>g life cycle <strong>in</strong>ventories for crop production <strong>in</strong> Japan: development of<br />
the NARO LCI database. In: Natarnicola, B., S<strong>et</strong>tanni, E., Tassielli, G., Giungato, P. (Eds.), <strong>LCA</strong>FOOD 2010: VII International<br />
Conference on Life Cycle Assessment <strong>in</strong> the Agri-food Sector, pp. 455-460.<br />
Hayashi, K., 2011. Assess<strong>in</strong>g management <strong>in</strong>fluence on environmental impacts under uncerta<strong>in</strong>ty: a case study of paddy rice production<br />
<strong>in</strong> Japan. <strong>in</strong>: F<strong>in</strong>kbe<strong>in</strong>er, M., (Ed.), Towards Life Cycle Susta<strong>in</strong>ability Management. Spr<strong>in</strong>ger, pp. 331-340.<br />
208<br />
Organic<br />
Environmentally friendly<br />
Conventional<br />
0.5 0.6 0.7 0.8 0.9 1.0
PARALLEL SESSION 2C: QUANTIFICATION AND REDUCTION OF UNCERTAINTY 8 th Int. Conference on <strong>LCA</strong> <strong>in</strong> the<br />
Agri-<strong>Food</strong> Sector, 1-4 Oct <strong>2012</strong><br />
Hayashi, K., Shobatake, K., Mak<strong>in</strong>o, N., Hokazono, S., <strong>2012</strong>. Development of a life cycle <strong>in</strong>ventory database for agricultural production<br />
systems <strong>in</strong> Japan: the JA<strong>LCA</strong> Database. The 10th International Conference on EcoBalance, Yokohama.<br />
Hertwich, E.G., McKone, T.E., Pease, W.S., 2000. A systematic uncerta<strong>in</strong>ty analysis of an evaluative fate and exposure model. Risk<br />
Analysis 20(4), 439-454.<br />
Huijbregts, M., 1998. Application of uncerta<strong>in</strong>ty and variability <strong>in</strong> <strong>LCA</strong>. Part I: A general framework for the analysis of uncerta<strong>in</strong>ty<br />
and variability <strong>in</strong> life cycle assessment. The International Journal of Life Cycle Assessment 3(5), 273-280.<br />
Huijbregts, M.A.J., Gilijamse, W., Ragas, A.M.J., Reijnders, L., 2003. Evaluat<strong>in</strong>g uncerta<strong>in</strong>ty <strong>in</strong> environmental life-cycle assessment:<br />
a case study compar<strong>in</strong>g two <strong>in</strong>sulation options for a Dutch one-family dwell<strong>in</strong>g. Environmental Science & Technology<br />
37(11), 2600-2608.<br />
Nansai, K., Moriguchi, Y., Tohno, S., 2002. Embodied Energy and Emission Intensity Data for Japan Us<strong>in</strong>g Input-Output Tables<br />
(3EID). National Institute for Environmental Studies (NIES), Tsukuba.<br />
Ossés de Eicker, M., Hischier, R., Kulay, L.A., Lehmann, M., Zah, R., Hurni, H., 2010. The applicability of non-local LCI data for<br />
<strong>LCA</strong>. Environmental Impact Assessment Review 30(3), 192-199.<br />
209
PLENARY SESSION 2: METHODOLOGICAL CHALLENGES FOR ANIMAL PRODUCTION SYSTEMS8 th Int. Conference on <strong>LCA</strong> <strong>in</strong> the<br />
210<br />
Agri-<strong>Food</strong> Sector, 1-4 Oct <strong>2012</strong><br />
Wednesday, 3 October<br />
Plenary session 2: M<strong>et</strong>hodological Challenges for Animal Production Systems<br />
Us<strong>in</strong>g systems-based <strong>LCA</strong> to <strong>in</strong>vestigate the environmental and<br />
economic impacts and benefits of the livestock sector <strong>in</strong> the UK<br />
Julia Chatterton * , Eric Audsley, Anil Graves, Joe Morris, Adrian Williams<br />
Centre for Environmental Risks and Futures, School of Applied Sciences, Cranfield University, Bedford, MK43 0AL, UK.<br />
Correspond<strong>in</strong>g author. E-mail: j.chatterton@cranfield.ac.uk<br />
ABSTRACT<br />
The livestock <strong>in</strong>dustry is a significant component of the agricultural and rural sectors <strong>in</strong> the UK. Grassland for livestock accounts for<br />
almost half of the terrestrial surface of the UK and almost two-thirds of its managed agricultural land. It therefore accounts for a<br />
major proportion of rural employment and <strong>in</strong>come and provides many landscape and biodiversity benefits. Tak<strong>in</strong>g an ecosystemsservices-framework<br />
approach, an <strong>in</strong>tegrated livestock-ecosystems l<strong>in</strong>ear programm<strong>in</strong>g model was developed to assess economic and<br />
environmental impacts of the livestock sector. This comb<strong>in</strong>ed life cycle assessment systems analysis with economic and valuation<br />
data and enabled plausible future scenarios to be assessed <strong>in</strong> terms of provision<strong>in</strong>g, regulat<strong>in</strong>g and cultural services. Analysis showed<br />
the ma<strong>in</strong> benefit com<strong>in</strong>g from provision<strong>in</strong>g services and also the significant role the sector plays <strong>in</strong> provid<strong>in</strong>g cultural services and<br />
the trade-offs b<strong>et</strong>ween these and the cost of regulat<strong>in</strong>g services with respect to emissions to air and water.<br />
Keywords: livestock, ecosystem services, economics, landscape value, trade-offs<br />
1. Introduction<br />
The livestock <strong>in</strong>dustry is a significant component of the agricultural and rural sectors <strong>in</strong> the UK. Grassland<br />
for livestock accounts for almost half of the terrestrial surface of the UK and almost two thirds of its<br />
managed agricultural land. It therefore accounts for a major proportion of rural employment and <strong>in</strong>come, and<br />
provides many landscape and biodiversity benefits. In 2009, the value of livestock production <strong>in</strong> the UK was<br />
estimated to be £10,833 million (Defra, 2009), equivalent to 56% of total agricultural value. However, the<br />
livestock sector is also associated with large proportions of the environmental burdens from agriculture, for<br />
example, about 8% of UK greenhouse gas (GHG) emissions and 68% of the UK agricultural ammonia emissions.<br />
Although livestock is a key component of the rural landscape and economy <strong>in</strong> the UK, particularly <strong>in</strong><br />
northern and western regions that have comparative advantage <strong>in</strong> grassland farm<strong>in</strong>g, there is considerable<br />
debate about the comb<strong>in</strong>ed economic, social and environmental impact of livestock production <strong>in</strong> the UK.<br />
The debate is further complicated by changes <strong>in</strong> mark<strong>et</strong> demand, wh<strong>et</strong>her associated with reduction <strong>in</strong> the<br />
demand for red meat, as part of healthier di<strong>et</strong>s, or a strengthen<strong>in</strong>g of global demand for dairy and meat products<br />
as <strong>in</strong>comes rise <strong>in</strong> develop<strong>in</strong>g economies.<br />
Many highly valued and historic features of the rural landscape <strong>in</strong> the UK are a result of livestock farm<strong>in</strong>g,<br />
notably the patchwork of fields bounded by hedgerows and stone walls that are part of dist<strong>in</strong>ctive landscape<br />
characteristics. Simultaneously, many grassland systems, especially those follow<strong>in</strong>g traditional m<strong>et</strong>hods,<br />
are associated with high levels of biodiversity, which become more valuable with reductions <strong>in</strong> biodiversity<br />
<strong>in</strong> more <strong>in</strong>tensively farmed areas. Furthermore, livestock and grassland areas <strong>in</strong> both lowlands and<br />
uplands are closely <strong>in</strong>tegrated with rural tourism and recreation, where enjoyment of the countryside provides<br />
a range of social and economic benefits, reliev<strong>in</strong>g pressures associated with <strong>in</strong>creas<strong>in</strong>gly urban lifestyles.<br />
In this context, the aim of the project was to d<strong>et</strong>erm<strong>in</strong>e the economic, social and environmental performance<br />
of livestock production <strong>in</strong> the UK and also to explore the implications of alternative future scenarios<br />
associated with possible changes <strong>in</strong> the demand for livestock products or the consequences for the livestock<br />
sector of giv<strong>in</strong>g different priorities to economic, social or environmental objectives. It also sought to identify<br />
likely challenges to achiev<strong>in</strong>g a profitable and environmentally susta<strong>in</strong>able livestock <strong>in</strong>dustry and the new<br />
knowledge and skills that might be required.<br />
In the last decade, the ecosystems framework has emerged as a means of explicitly l<strong>in</strong>k<strong>in</strong>g natural capital<br />
with social welfare. In this, natural capital supports a number of <strong>in</strong>terrelated ecosystem services (provision<strong>in</strong>g,<br />
regulat<strong>in</strong>g, cultural and support<strong>in</strong>g services) which produce a vari<strong>et</strong>y of goods or benefits that have<br />
value for humans (MEA, 2005, Defra, 2007 and UNEP-UKNEA, 2010). The positive impacts of the livestock<br />
sector are ma<strong>in</strong>ly l<strong>in</strong>ked to the “provision<strong>in</strong>g” of food (and the broader benefits associated with employment<br />
and l<strong>in</strong>kages to related <strong>in</strong>dustries) and “cultural” benefits <strong>in</strong> terms of the aesth<strong>et</strong>ic pleasure obta<strong>in</strong>ed<br />
from grazed landscapes, features such as hedgerows and stone walls, and biodiversity. Negative impacts<br />
are largely associated with the loss of “regulat<strong>in</strong>g” services, <strong>in</strong>clud<strong>in</strong>g emissions of greenhouse gases to<br />
the atmosphere and emissions of contam<strong>in</strong>ants to water, <strong>in</strong>clud<strong>in</strong>g sediment and transport of bound pollutants
PLENARY SESSION 2: METHODOLOGICAL CHALLENGES FOR ANIMAL PRODUCTION SYSTEMS 8 th Int. Conference on<br />
<strong>LCA</strong> <strong>in</strong> the<br />
Agri-<strong>Food</strong> Sector, 1-4 Oct <strong>2012</strong><br />
such as phosphorus, pesticides, heavy m<strong>et</strong>als, and pathogenic microorganisms. This became the framework<br />
of analysis for an <strong>in</strong>tegrated livestock-ecosystems model.<br />
2. M<strong>et</strong>hods<br />
A review of factors driv<strong>in</strong>g change <strong>in</strong> the livestock sector was undertaken, <strong>in</strong>clud<strong>in</strong>g key agricultural and<br />
environmental policies. The op<strong>in</strong>ions of a range of <strong>in</strong>dustry representatives were canvassed regard<strong>in</strong>g views<br />
on the role of livestock <strong>in</strong> the rural economy and its relationship with the environment. The relationship<br />
b<strong>et</strong>ween livestock farm<strong>in</strong>g systems and soci<strong>et</strong>y was then explored us<strong>in</strong>g an ecosystems framework, namely<br />
the affect on provision<strong>in</strong>g (e.g. food production), regulat<strong>in</strong>g (e.g. GHG emissions) and cultural (e.g. landscape)<br />
services. A vari<strong>et</strong>y of scenarios were then developed to reflect actual and potential demands from the<br />
livestock sector, given current and future drivers.<br />
2.1 Scenarios for modell<strong>in</strong>g<br />
Follow<strong>in</strong>g a review of scenarios used <strong>in</strong> previous projects and the understand<strong>in</strong>g developed <strong>in</strong> a review of<br />
science and policy, a s<strong>et</strong> of plausible future scenarios was developed to explore how the UK Government<br />
Department for Environment, <strong>Food</strong> and Rural Affairs (DEFRA) objectives for the livestock sector could be<br />
m<strong>et</strong>, namely a “profitable and comp<strong>et</strong>itive domestic <strong>in</strong>dustry which enhances the biodiversity and rural landscape<br />
of England while m<strong>in</strong>imis<strong>in</strong>g its impact on climate change, soil, water, and air quality”. These were:<br />
1. Bus<strong>in</strong>ess As Usual (BAU): a basel<strong>in</strong>e bus<strong>in</strong>ess as usual scenario, exam<strong>in</strong><strong>in</strong>g the n<strong>et</strong> balance b<strong>et</strong>ween the<br />
Provision<strong>in</strong>g, Regulat<strong>in</strong>g, and Cultural impacts of the livestock sector and d<strong>et</strong>erm<strong>in</strong><strong>in</strong>g how <strong>in</strong>dividual<br />
sub-sectors contribute to this.<br />
And also a series of optimis<strong>in</strong>g scenarios to d<strong>et</strong>erm<strong>in</strong>e the effect of:<br />
2. Maximis<strong>in</strong>g employment generation associated with the livestock sector<br />
3. M<strong>in</strong>imis<strong>in</strong>g production costs from the livestock sector<br />
4. Reduc<strong>in</strong>g GHG emissions by 25%<br />
5. Shift<strong>in</strong>g from red (beef and lamb) to white meat (pork and poultry) - with red meat assumed to be provided<br />
only from dairy beef, as a by-product of milk production<br />
6. Reduc<strong>in</strong>g production of each livestock sector by 25%, balanced as far as possible by plant commodities<br />
2.2 Data <strong>in</strong>puts and model development<br />
Data for the valuation of Provision<strong>in</strong>g, Regulat<strong>in</strong>g and Cultural services were developed from a vari<strong>et</strong>y of<br />
sources and adjusted, where needed, to 2009 values with HM Treasury GDP deflators (2011). Whilst data<br />
on provision<strong>in</strong>g services were relatively easy to f<strong>in</strong>d, data on the impact of livestock systems on the value of<br />
regulat<strong>in</strong>g and cultural services were especially difficult to develop. Valuation data were developed from a<br />
vari<strong>et</strong>y of sources, <strong>in</strong>clud<strong>in</strong>g the Report on the Environmental Accounts for Agriculture (Jacobs, 2008).<br />
2.3 Development of an <strong>in</strong>tegrated livestock-ecosystems model<br />
An <strong>in</strong>tegrated livestock-ecosystems l<strong>in</strong>ear programm<strong>in</strong>g model was developed to assess the economic and<br />
environmental impacts of the livestock sector, us<strong>in</strong>g an ecosystem services framework. For this, the Cranfield<br />
Life Cycle Assessment Model (Williams <strong>et</strong> al., 2006, 2007) was comb<strong>in</strong>ed with a grassland productivity<br />
model and a soil erosion model to assess environmental consequences of the livestock sector. A model<br />
was also developed to calculate soil erosion for each 5x5km grid square <strong>in</strong> England and Wales us<strong>in</strong>g the<br />
Morgan-Morgan-F<strong>in</strong>ney model (Morgan <strong>et</strong> al., 1984). Soil erosion was calculated per unit area for each<br />
slope angle for the different land uses and slope proportions, then allocated b<strong>et</strong>ween the different systems,<br />
after remov<strong>in</strong>g non-productive land. From this, average erosion values (t ha -1 ) were derived for arable, dairy,<br />
beef and sheep, and then split among lowland (
PLENARY SESSION 2: METHODOLOGICAL CHALLENGES FOR ANIMAL PRODUCTION SYSTEMS8 th Int. Conference on <strong>LCA</strong> <strong>in</strong> the<br />
Agri-<strong>Food</strong> Sector, 1-4 Oct <strong>2012</strong><br />
Table 9. Illustrative description of the livestock ecosystem services l<strong>in</strong>ear programm<strong>in</strong>g model. Columns<br />
represent levels of activities and rows represent constra<strong>in</strong>ts on those activities. For illustration these have<br />
been collapsed <strong>in</strong>to a s<strong>in</strong>gle description (e.g., sheep systems are actually 63 columns, with activities such as<br />
hill, upland and lowland ewes, and organic flocks). Similarly rows have been collapsed <strong>in</strong>to ‘Emissions’,<br />
which <strong>in</strong>cludes rows for <strong>in</strong>dividual emissions such as greenhouse gases, nitrate leach<strong>in</strong>g and pesticides.<br />
212<br />
Sheep systems<br />
Pig systems<br />
Beef systems<br />
Chicken<br />
systems<br />
Egg systems<br />
Dairy systemsArablewell-suitedArablemoderateArablemarg<strong>in</strong>al<br />
Objective (services) = P+R+C<br />
Provision<strong>in</strong>g + + + + + + + + + + = P<br />
Regulat<strong>in</strong>g + = R<br />
Cultural + + + + + + + + + + -ve = C<br />
Constra<strong>in</strong>t<br />
Production 1 1 1 1 1 1 = Demand<br />
Arable land + + + + + + 1 = L<br />
Grassland + + + + + + 1 1 1 1 = L<br />
Hill land + + 1 = L<br />
Emissions + + + + + + + + + -1 = 0<br />
Labour + + + + + + + + + -1 = 0<br />
Intra-system + + + + + + = 0<br />
Inter-system 1 -ve = 0<br />
Land types + + + + + + < L<br />
Notes: + denotes positive coefficients, -ve denotes negative coefficients, +/-1 denotes unit coefficients, L denotes limits/constra<strong>in</strong>ts<br />
on land and soil types<br />
The objective function to be maximised is the sum of the various ecosystem services, which have been<br />
converted to a common mon<strong>et</strong>ary (£) valuation system (P+R+C). This comprises positive mon<strong>et</strong>ary values<br />
for livestock production and arable production, negative values for emissions, and positive values for cultural<br />
services and employment generation (columns, Table 1). Cultural services <strong>in</strong>clude landscape, biodiversity<br />
and recreation benefits services considered jo<strong>in</strong>tly <strong>in</strong> terms of a value of will<strong>in</strong>gness to pay that varies by<br />
land use. In the ma<strong>in</strong> analyses, we consider employment as a benefit and value it as the m<strong>in</strong>imum wage. The<br />
relations b<strong>et</strong>ween activities and constra<strong>in</strong>ts (columns and rows, respectively, Table 1) are def<strong>in</strong>ed by an array<br />
of technical coefficients, show<strong>in</strong>g, for example, farm labour requirements of a tonne of beef or nitrate emissions<br />
generated <strong>in</strong> the production of a tonne of meat on a particular type of land.<br />
The systems-based <strong>LCA</strong> approach also enabled the implications of a range of alternative future scenarios<br />
to be explored, <strong>in</strong>clud<strong>in</strong>g a 25% reduction <strong>in</strong> livestock production balanced by plant commodities, a shift<br />
from red to white meat and arable substitution of the livestock sector. The model maximises the weighted n<strong>et</strong><br />
benefit of the ecosystems services generated from each of the livestock sectors.<br />
3. Results<br />
Estimates of the value of ecosystem services, classified <strong>in</strong>to provision<strong>in</strong>g, regulat<strong>in</strong>g and cultural services<br />
were first obta<strong>in</strong>ed for the BAU scenario. This <strong>in</strong>volved an allocation of land, both grassland and the arable<br />
area required to provide non-grass feeds, to me<strong>et</strong> current demand for livestock products. The proportional<br />
distribution of grassland and arable land for each 5x5 km square <strong>in</strong> England and Wales was estimated us<strong>in</strong>g<br />
spatially <strong>in</strong>terpolated 2004 Agricultural Census data (Ed<strong>in</strong>e, 2010). These confirm the greater <strong>in</strong>cidence of<br />
grassland and livestock production <strong>in</strong> the northern and western regions, associated with sheep, dairy, and<br />
beef systems, although it is worth not<strong>in</strong>g the significant production of pigs and poultry <strong>in</strong> the eastern part of<br />
England. Grasslands were divided <strong>in</strong>to lowland (
PLENARY SESSION 2: METHODOLOGICAL CHALLENGES FOR ANIMAL PRODUCTION SYSTEMS 8 th Int. Conference on<br />
<strong>LCA</strong> <strong>in</strong> the<br />
Agri-<strong>Food</strong> Sector, 1-4 Oct <strong>2012</strong><br />
tries (£2931 million), and forward l<strong>in</strong>kages <strong>in</strong> the supply cha<strong>in</strong> <strong>in</strong>to the r<strong>et</strong>ail <strong>in</strong>dustry (£14884 million). It is<br />
worth not<strong>in</strong>g that whilst we have viewed labour as a positive impact of the livestock sector here, because of<br />
its importance for livelihoods, from an <strong>in</strong>dividual farmer’s perspective, this is a cost, <strong>in</strong> which case, the profitability<br />
of the livestock sector is reduced substantially to £2794 million.<br />
Cultural benefits based on current will<strong>in</strong>gness to pay estimates were significant (£748 million), although<br />
substantially lower than provision<strong>in</strong>g benefits, and were associated primarily with beef and sheep systems,<br />
with the majority associated with hill and upland areas.<br />
Major ecosystem costs were associated with impacts on regulat<strong>in</strong>g services, namely GHG (£2063 million)<br />
and ammonia (£379 million) emissions. Emissions to water were of less significance, and ma<strong>in</strong>ly l<strong>in</strong>ked to<br />
the cost associated with nitrate leach<strong>in</strong>g <strong>in</strong> terms of reduced environmental water quality and removal of<br />
nitrates from dr<strong>in</strong>k<strong>in</strong>g water (£113 million) and the cost associated with soil erosion (£84 million) <strong>in</strong> terms of<br />
flood damage and prevention. The majority of these costs are associated with graz<strong>in</strong>g systems <strong>in</strong> western<br />
and northern England and Wales and non-graz<strong>in</strong>g livestock <strong>in</strong> eastern England.<br />
Table 10. Modelled valuation impact of the livestock sector<br />
BAU ‡ Sheep Pigs Suckler<br />
beef<br />
Eggs Chicken Dairy<br />
&<br />
dairy<br />
beef<br />
Arable<br />
subs a<br />
£M £M £M £M £M £M £M £M<br />
A. Ecosystem benefits<br />
Production Total product value 8268 826 843 828 592 1376 3802 3398<br />
Inputs -2931 -161 -407 -373 -325 -596 -1068 -1863<br />
Labour -2543 -526 -420 -294 -84 -331 -888 -371<br />
Production (less <strong>in</strong>puts) 5337 665 436 455 267 780 2734 1535<br />
Production (less <strong>in</strong>puts & labour) 2794 139 16 161 183 449 1846 1163<br />
Regulation Total -2701 -321 -215 -571 -96 -279 -1219 -1811<br />
Soil erosion -84 -51 -3 -14 -2 -5 -10 -511<br />
Pesticide -12 0 -2 -1 -1 -4 -3 -29<br />
Eutrophication -4 0 0 -1 0 0 -1 -2<br />
N leach<strong>in</strong>g -113 -16 -8 -29 -4 -15 -42 -78<br />
Greenhouse gas emissions -2063 -230 -145 -422 -65 -207 -993 -1114<br />
Ammonia -379 -21 -56 -81 -23 -47 -151 -77<br />
Faecal contam<strong>in</strong>ation -10 -1 0 -4 0 0 -5 0<br />
Chryptosporidium -35 -1 0 -20 0 0 -14 0<br />
Cultural Cultural 748 403 9 190 5 13 128 160<br />
B. L<strong>in</strong>ked impacts<br />
System <strong>in</strong>puts 2931 161 407 373 325 596 1068 1863<br />
System labour (as above) 2543 526 420 294 84 331 888 371<br />
L<strong>in</strong>ked labour 1220 252 201 141 41 159 426 178<br />
Downstream impact 14984 733 1265 828 1449 2246 8463 N/A<br />
C. Total areas used<br />
UK arable (Mha) 1.64 0.06 0.29 0.13 0.15 0.44 0.57 1.64<br />
Overseas arable (Mha) 1.10 0.02 0.26 0.04 0.13 0.52 0.14 0.00<br />
Grassland (Mha) 4.23 1.10 0.00 1.27 0.00 0.00 1.86 3.72<br />
Hill (Mha equivalent) 2.68 2.16 0.00 0.52 0.00 0.00 0.00 0.00<br />
Total UK land (Mha) 8.55 3.32 0.29 1.92 0.15 0.44 2.43 5.36<br />
‡ Bus<strong>in</strong>ess As Usual<br />
a “Arable substitution” exam<strong>in</strong>es the potential for arable production to substitute livestock production on current livestock land that is<br />
considered to be at least marg<strong>in</strong>ally suitable for arable production.<br />
The analysis also considered the possible implications of reduc<strong>in</strong>g or entirely withdraw<strong>in</strong>g livestock production<br />
<strong>in</strong> the UK and substitut<strong>in</strong>g it where possible, with arable production. From a spatial analysis of soil<br />
suitability for agriculture, an estimate was derived of the degree to which arable production might replace<br />
particular types of livestock production <strong>in</strong> the UK. The level of substitution from livestock land to arable<br />
land was limited: of the total modelled land area required for livestock production <strong>in</strong> the UK (ca. 6.89 Mha),<br />
about 21% was estimated to be well-suited to arable production, with 48% entirely unsuited, and therefore<br />
likely to be abandoned from agricultural use. This would result <strong>in</strong> the loss of current biodiversity, landscape<br />
features and probably have negative effects on the tourism and recreational opportunities associated with<br />
managed landscapes.<br />
213
PLENARY SESSION 2: METHODOLOGICAL CHALLENGES FOR ANIMAL PRODUCTION SYSTEMS8 th Int. Conference on <strong>LCA</strong> <strong>in</strong> the<br />
Agri-<strong>Food</strong> Sector, 1-4 Oct <strong>2012</strong><br />
A vari<strong>et</strong>y of optimis<strong>in</strong>g scenarios were run to exam<strong>in</strong>e how the livestock sector could be configured to<br />
me<strong>et</strong> Defra’s objectives for the livestock sector (Table 11). With employment viewed as a benefit (Table<br />
11A) and the model constra<strong>in</strong>ed to produc<strong>in</strong>g the same quantity of provision<strong>in</strong>g benefits, optimisation of n<strong>et</strong><br />
ecosystem value (105% of current BAU) was achieved by <strong>in</strong>creas<strong>in</strong>g dairy value and mak<strong>in</strong>g greater use of<br />
free-range egg production, despite its reduced value (94% of current BAU). Some livestock land was also<br />
allocated to arable production. The ma<strong>in</strong> reason for the <strong>in</strong>crease <strong>in</strong> n<strong>et</strong> benefit flow was, however, associated<br />
with the configuration of the different sectors to <strong>in</strong>crease employment generation (107% of current BAU),<br />
for example, through greater use of free-range poultry systems and more labour <strong>in</strong>tensive feed<strong>in</strong>g and waste<br />
management systems.<br />
When s<strong>et</strong> to achieve a 25% reduction of GHG emissions from the livestock sector, the model suggested<br />
that the optimal route to achiev<strong>in</strong>g this would be through reduc<strong>in</strong>g dairy and beef production, with arable<br />
replac<strong>in</strong>g some of the land released through this process and poultry, egg, pigs and sheep rema<strong>in</strong><strong>in</strong>g relatively<br />
unaffected. This was however associated with a 20% loss <strong>in</strong> n<strong>et</strong> ecosystem value, partly because of<br />
lost employment opportunities and reduced cultural value from the livestock sector.<br />
Under the red-to-white meat scenario, <strong>in</strong> which red meat was assumed to be provided only from dairy as a<br />
by-product of milk production, the model suggested that 92% of provision<strong>in</strong>g benefit could be ma<strong>in</strong>ta<strong>in</strong>ed by<br />
<strong>in</strong>creas<strong>in</strong>g pig, poultry, and milk production and <strong>in</strong>troduc<strong>in</strong>g arable production on the land released. However,<br />
there was a 70% loss of cultural value, associated primarily with the loss of sheep and suckler beef<br />
systems, and the overall n<strong>et</strong> flow of ecosystem benefits was reduced to 83% of current BAU.<br />
Where employment was viewed as a cost (Table 11B), n<strong>et</strong> ecosystem value <strong>in</strong> the optimised BAU scenario<br />
was achieved largely through reduc<strong>in</strong>g labour requirements, for example, by greater use of housed<br />
poultry systems and slurry manure management. Where production from the different sectors was allowed<br />
to <strong>in</strong>crease by up to 20% above current BAU production, observ<strong>in</strong>g the constra<strong>in</strong>ts of currently available<br />
land, but def<strong>in</strong><strong>in</strong>g no m<strong>in</strong>imum production level for any of the sectors, optimisation of n<strong>et</strong> ecosystem benefit<br />
was achieved through greater reliance on dairy, egg, and poultry systems.<br />
On the whole, there was a tendency for optimisation to be achieved at the expense of the pig sector which<br />
disappeared altog<strong>et</strong>her, replaced by arable production <strong>in</strong> the BAU+20% scenario, the 25% GHG emission<br />
reduction scenario, and the red-to-white-meat scenario. This was <strong>in</strong> contrast to optimisations <strong>in</strong> which employment<br />
was viewed as a benefit, where pig production was at least equivalent to that <strong>in</strong> the current BAU.<br />
Table 11. Selected optimis<strong>in</strong>g scenarios under hypoth<strong>et</strong>ical future conditions relative to current bus<strong>in</strong>ess-asusual<br />
(BAU) scenario<br />
A. Employment as a benefit B. Employment as a cost<br />
BAU + GHG† Red to<br />
BAU + GHG† Red to<br />
Current Optimised (up to reduced white Current Optimised (up to reduced white<br />
BAU BAU 20% +) by 25% meat BAU BAU 20% +) by 25% meat<br />
£M £M £M £M £M £M £M £M £M £M<br />
Provision<strong>in</strong>g 9100 104% 106% 81% 92% 2793 117% 134% 95% 124%<br />
Arable a<br />
0 21 0 557 533 0 17 268 736 678<br />
Labour 3764 107% 104% 81% 84% -2543 92% 81% 59% 57%<br />
Dairy 2306 104% 118% 58% 107% 2306 107% 128% 66% 107%<br />
Eggs 267 94% 0% 94% 86% 267 103% 124% 103% 103%<br />
Poultry 779 99% 113% 99% 129% 779 104% 125% 104% 135%<br />
Beef 883 102% 105% 28% 49% 883 105% 67% 25% 50%<br />
Pigs 436 102% 123% 102% 133% 436 102% 0% 0% 0%<br />
Sheep 664 101% 101% 101% 0% 664 101% 101% 90% 0%<br />
Regulation -2700 100% 101% 81% 101% -2700 98% 97% 79% 97%<br />
Cultural 748 99% 100% 76% 30% 748 100% 92% 73% 35%<br />
N<strong>et</strong> value 7148 105% 107% 80% 83% 840 162% 214% 126% 131%<br />
a<br />
actual values given for arable, as the arable BAU is 0, and relative values cannot be calculated<br />
† Greenhouse gases<br />
4. Discussion<br />
It is clear that livestock production <strong>in</strong> the UK makes a n<strong>et</strong> positive contribution to ecosystem services,<br />
particularly when employment generation is viewed as a benefit of the provision<strong>in</strong>g service. When it is<br />
viewed as a cost, n<strong>et</strong> ecosystem benefits are negative for pigs, suckler beef and also the hypoth<strong>et</strong>ical arable<br />
uptake on livestock land. The cost of regulat<strong>in</strong>g services accounts for about 30% of the value of the provision<strong>in</strong>g<br />
benefit, but about 90% if the provision<strong>in</strong>g benefit is viewed n<strong>et</strong> of labour and <strong>in</strong>put costs. The cost<br />
associated with the loss of regulat<strong>in</strong>g services is more than three times the estimated benefits of cultural services.<br />
Cultural services add a further 9% to the value of livestock production (27% if the product value is n<strong>et</strong><br />
214
PLENARY SESSION 2: METHODOLOGICAL CHALLENGES FOR ANIMAL PRODUCTION SYSTEMS 8 th Int. Conference on<br />
<strong>LCA</strong> <strong>in</strong> the<br />
Agri-<strong>Food</strong> Sector, 1-4 Oct <strong>2012</strong><br />
of labour and <strong>in</strong>put costs), while remov<strong>in</strong>g livestock production compl<strong>et</strong>ely and substitut<strong>in</strong>g with arable<br />
where possible would lead to more than a 90% reduction <strong>in</strong> the value of ecosystems services from current<br />
livestock land if labour is viewed as a benefit and about 60% when labour is viewed as a cost.<br />
The analysis clearly shows the significant trade-offs b<strong>et</strong>ween provision<strong>in</strong>g of livestock products and regulat<strong>in</strong>g<br />
services, especially regard<strong>in</strong>g impacts on air and water. These impacts, which constitute real costs<br />
borne by others without compensation, reduce the overall economic efficiency of the sector. They reflect a<br />
failure of mark<strong>et</strong>s and governance to adequately pass environmental costs to polluters. This is a generic failure,<br />
and the livestock <strong>in</strong>dustry should not be picked out a special case.<br />
It is important to note that while these scenarios demonstrate how the model can be used to optimise the<br />
n<strong>et</strong> flow of ecosystem benefit from the livestock sector, they have not <strong>in</strong>corporated the social acceptability of<br />
los<strong>in</strong>g whole sectors of the livestock <strong>in</strong>dustry. This can be built <strong>in</strong>to the scenarios as constra<strong>in</strong>ts, so that, for<br />
example, the model would optimise n<strong>et</strong> ecosystem benefits by not reduc<strong>in</strong>g production from any sector by<br />
more than a given level. Furthermore, the systems-based nature of the model means that it also provides<br />
extensive outputs on how management and physical impacts with<strong>in</strong> each of the livestock sectors change.<br />
5. Conclusion<br />
The model enabled trade-offs b<strong>et</strong>ween provision<strong>in</strong>g, cultural and regulat<strong>in</strong>g services to be analysed, confirm<strong>in</strong>g,<br />
for example, the important role of livestock systems <strong>in</strong> provid<strong>in</strong>g cultural services, particularly the<br />
contribution of less <strong>in</strong>tensive systems to landscape and biodiversity, and additionally the significant tradeoffs<br />
b<strong>et</strong>ween provision<strong>in</strong>g and regulat<strong>in</strong>g services, especially regard<strong>in</strong>g impacts on air and water. The results<br />
show the importance of the use of a systems based-<strong>LCA</strong> approach <strong>in</strong> identify<strong>in</strong>g the trade-offs b<strong>et</strong>ween the<br />
cultural benefits of extensive systems and the potential efficiencies of more <strong>in</strong>tensive systems. Tak<strong>in</strong>g an<br />
ecosystem-services viewpo<strong>in</strong>t shows the substantial <strong>in</strong>fluence that livestock systems have on wider ass<strong>et</strong>s<br />
such as cultural services that are not <strong>in</strong>corporated <strong>in</strong>to normal account<strong>in</strong>g processes. Furthermore, attempt<strong>in</strong>g<br />
to assign a landscape value to hill and upland livestock, comb<strong>in</strong>ed with a land suitability analysis, shows the<br />
proportion of land that would become abandoned under a “no livestock” scenario, comb<strong>in</strong>ed with a significant<br />
loss <strong>in</strong> cultural value of the land, and highlights the trade-offs and potential losses aris<strong>in</strong>g from radical<br />
changes to the livestock sector <strong>in</strong> the UK.<br />
6. References<br />
Defra, 2007. An <strong>in</strong>troductory guide to valu<strong>in</strong>g ecosystem services. Report published by the Department for Environment, <strong>Food</strong> and<br />
Rural Affairs. London, UK. 68pp. Available at www.defra.gov.uk<br />
Defra, 2009. Agriculture <strong>in</strong> the United K<strong>in</strong>gdom 2009. 146pp. Available at www.defra.gov.uk<br />
HM Treasury, 2011. GDP deflators. Available from: http://www.hm-treasury.gov.uk/data_gdp_fig.htm<br />
Ed<strong>in</strong>a, 2010. AgCensus data. Available from: http://ed<strong>in</strong>a.ac.uk/agcensus/<br />
Jacobs, 2008. Environmental Accounts for Agriculture. F<strong>in</strong>al report submitted to Defra. 175 pp.<br />
Magic, 2011. Available from: http://magic.defra.gov.uk/<br />
Millennium Ecosystem Assessment, 2005. Available from: http://www.milleniumassessment.org/en/<strong>in</strong>dex.asp<br />
Morgan, RPC, Morgan, DDV, F<strong>in</strong>ney, HJ, 1984. A Predictive Model for the Assessment of Soil-Erosion Risk. Journal of Agricultural<br />
Eng<strong>in</strong>eer<strong>in</strong>g Research, 30 (3), 243-253<br />
UNEP-UK NEA, 2010. UK National Ecosystem Assessment. Available from: http://uknea.unep-wcmc.org<br />
Williams, A.G., Audsley, E. and Sandars, D.L., 2006. D<strong>et</strong>erm<strong>in</strong><strong>in</strong>g the environmental burdens and resource use <strong>in</strong> the production of<br />
agricultural and horticultural commodities. Ma<strong>in</strong> Report. Defra Research Project IS0205. Bedford: Cranfield University and Defra.<br />
Available at www.agrilca.org, and www.defra.gov.uk<br />
Williams, A.G., Audsley, E., Sandars, D.L., 2007. Environmental burdens of livestock production systems derived from life cycle<br />
assessment (<strong>LCA</strong>). In: Garnsworthy, P. (Ed), 41st University of Nott<strong>in</strong>gham Feed Conference, Sutton Bon<strong>in</strong>gton, Nott<strong>in</strong>gham,<br />
Nott<strong>in</strong>gham: Nott<strong>in</strong>gham University, 171-200.<br />
215
PLENARY SESSION 2: METHODOLOGICAL CHALLENGES FOR ANIMAL PRODUCTION SYSTEMS8 th Int. Conference on <strong>LCA</strong> <strong>in</strong> the<br />
Agri-<strong>Food</strong> Sector, 1-4 Oct <strong>2012</strong><br />
Modell<strong>in</strong>g GHG emissions of dairy cow production systems differ<strong>in</strong>g<br />
<strong>in</strong> milk yield and breed – the impact of uncerta<strong>in</strong>ty<br />
216<br />
Monika Zeh<strong>et</strong>meier *1 , Markus Gandorfer 2 , Alois Heißenhuber 1 , Imke J.M. de Boer 3<br />
1 Institute of Agricultural Economics and Farm Management, Technische Universität München, 85350 Freis<strong>in</strong>g, Germany<br />
2 Chair Group Economics of Horticulture and Landscap<strong>in</strong>g, Technische Universtät München, 85350 Freis<strong>in</strong>g, Germany<br />
3 Animal Production Systems Group, Wagen<strong>in</strong>gen University, Wagen<strong>in</strong>gen, The N<strong>et</strong>herlands<br />
Correspond<strong>in</strong>g author. E-mail: monika.zeh<strong>et</strong>meier@tum.de<br />
ABSTRACT<br />
The ma<strong>in</strong> objective of our study was to <strong>in</strong>corporate uncerta<strong>in</strong>ty <strong>in</strong> modell<strong>in</strong>g greenhouse gas (GHG) emissions of dairy cow production<br />
systems differ<strong>in</strong>g <strong>in</strong> milk yield and breed. Stochastic simulation was undertaken to account for uncerta<strong>in</strong>ty of ma<strong>in</strong> model assumptions.<br />
The developed stochastic model accounts for two different m<strong>et</strong>hods for handl<strong>in</strong>g co-products of dairy farm<strong>in</strong>g (beef,<br />
surplus calves): economic allocation and system expansion. Whereas the choice of m<strong>et</strong>hod for co-product handl<strong>in</strong>g depends on the<br />
scope of GHG modell<strong>in</strong>g the stochastic model approach gave an <strong>in</strong>sight <strong>in</strong>to robustness and variation of model outcomes with<strong>in</strong> each<br />
m<strong>et</strong>hod for handl<strong>in</strong>g co-products. The m<strong>et</strong>hod of system expansion is recommended if the consequences of changes or mitigation<br />
options <strong>in</strong> dairy cow production need to be evaluated. In that case stochastic models offer the advantage of predict<strong>in</strong>g not just an<br />
outcome, but also the likelihood of this outcome. This is of special importance identify<strong>in</strong>g cost-effective GHG mitigation options.<br />
Keywords: greenhouse gas emissions, uncerta<strong>in</strong>ty, stochastic modell<strong>in</strong>g, dairy cow production<br />
1. Introduction<br />
Dairy cow production contributes to about 23 to 70% of total agricultural GHG emissions <strong>in</strong> different<br />
countries with<strong>in</strong> the EU-27 (Lesschen <strong>et</strong> al., 2011). Thus a grow<strong>in</strong>g <strong>in</strong>terest can be observed <strong>in</strong> modell<strong>in</strong>g<br />
GHG emissions from dairy cow production systems and identify<strong>in</strong>g cost effective GHG abatement options.<br />
As milk is the ma<strong>in</strong> output of dairy farms most studies express GHG emissions produced per kg milk delivered.<br />
However, beef can be considered as an important co-product of dairy farm<strong>in</strong>g (beef from culled<br />
cows and surplus calves sold to fatten<strong>in</strong>g systems) especially with<strong>in</strong> dual purpose dairy cow production systems.<br />
To account for co-products from dairy farm<strong>in</strong>g different m<strong>et</strong>hods can be observed <strong>in</strong> literature (Flysjö<br />
<strong>et</strong> al., 2011). Two ma<strong>in</strong> approaches can be dist<strong>in</strong>guished: economic allocation and system expansion. In case<br />
of economic allocation GHG emissions are allocated b<strong>et</strong>ween milk and co-products at the dairy farm gate<br />
accord<strong>in</strong>g to their economic value. This approach is ma<strong>in</strong>ly used <strong>in</strong> the calculation of carbon footpr<strong>in</strong>ts. It<br />
identifies GHG emissions at the dairy farm gate caused by milk production and allocates GHG emissions<br />
based on the value of milk and beef to the consumer. In case of system expansion allocation b<strong>et</strong>ween milk<br />
and co-products is avoided by expand<strong>in</strong>g the system and account<strong>in</strong>g for the alternative way of beef production<br />
(i.e. sucker cow production). It is assumed that the beef derived from culled cows and fatten<strong>in</strong>g of surplus<br />
calves replaces beef from suckler cow production. The avoided GHG emissions are credited to the dairy<br />
farm. The m<strong>et</strong>hod of system expansion is recommended by the International Organisation for Standardization<br />
(ISO, 2006). This approach is especially important if the consequences of changes or mitigation options<br />
<strong>in</strong> dairy cow production need to be evaluated (Flysjö <strong>et</strong> al., 2011).<br />
Recent d<strong>et</strong>erm<strong>in</strong>ist studies showed that the choice of m<strong>et</strong>hod for co-product handl<strong>in</strong>g has a major impact<br />
on GHG emissions outcomes of dairy cow production systems (Flysjö <strong>et</strong> al., 2011, Zeh<strong>et</strong>meier <strong>et</strong> al., <strong>2012</strong>).<br />
Despite the impact of choice of m<strong>et</strong>hod for co-product handl<strong>in</strong>g it has to be considered that assumptions and<br />
<strong>in</strong>put data modell<strong>in</strong>g GHG emissions from dairy cow production have known uncerta<strong>in</strong>ties.<br />
Many guidel<strong>in</strong>es and scientific studies po<strong>in</strong>t out the importance of <strong>in</strong>corporat<strong>in</strong>g uncerta<strong>in</strong>ty <strong>in</strong> GHG and<br />
economic modell<strong>in</strong>g (ISO, 2006; IPCC, 2006; Pannell, 1997).<br />
The <strong>in</strong>clusion, the discussion and the report<strong>in</strong>g of model changes due to uncerta<strong>in</strong>ties can be important to<br />
identify robustness and variation of model outcomes and sensitive or important variables (Pannell, 1997). To<br />
show the impact of uncerta<strong>in</strong>ty on GHG emission outcomes a d<strong>et</strong>erm<strong>in</strong>istic model developed to calculate<br />
GHG emissions of conf<strong>in</strong>ement dairy farm systems differ<strong>in</strong>g <strong>in</strong> milk yield and breed (Zeh<strong>et</strong>meier <strong>et</strong> al.,<br />
<strong>2012</strong>) was further developed. A stochastic model was established that accounts for uncerta<strong>in</strong>ty <strong>in</strong> various<br />
components. Compared with d<strong>et</strong>erm<strong>in</strong>istic models, stochastic models offer the advantage of predict<strong>in</strong>g not<br />
just an outcome, but also the likelihood of this outcome. Thus, stochastic modell<strong>in</strong>g was undertaken to answer<br />
the follow<strong>in</strong>g questions:<br />
- Does the <strong>in</strong>clusion of uncerta<strong>in</strong>ty <strong>in</strong>fluence the rank<strong>in</strong>g of modelled dairy cow production systems <strong>in</strong><br />
terms of GHG emissions? (6000, 8000, 10000 kg milk/cow per year)<br />
- which uncerta<strong>in</strong>ties have the highest impact on variation of GHG emission outcomes?
PLENARY SESSION 2: METHODOLOGICAL CHALLENGES FOR ANIMAL PRODUCTION SYSTEMS 8 th Int. Conference on<br />
<strong>LCA</strong> <strong>in</strong> the<br />
Agri-<strong>Food</strong> Sector, 1-4 Oct <strong>2012</strong><br />
To show the impact of uncerta<strong>in</strong>ty with<strong>in</strong> different m<strong>et</strong>hods for handl<strong>in</strong>g co-products uncerta<strong>in</strong>ty modell<strong>in</strong>g<br />
was undertaken for economic allocation and system expansion approach.<br />
2. M<strong>et</strong>hods<br />
A whole system model calculat<strong>in</strong>g GHG emissions of conf<strong>in</strong>ement dairy cow production systems differ<strong>in</strong>g<br />
<strong>in</strong> milk yield and breed has been presented <strong>in</strong> d<strong>et</strong>ail <strong>in</strong> another paper (Zeh<strong>et</strong>meier <strong>et</strong> al., <strong>2012</strong>).<br />
2.1. Description of exist<strong>in</strong>g model<br />
The whole farm model <strong>in</strong>corporated dairy cows from different breeds and milk yield (6000 and 8000 kg<br />
milk/cow per year - dual purpose Fleckvieh (FV) breed; 10000 kg milk/cow per year – Holste<strong>in</strong>-Friesian (H-<br />
F) breed). Represent<strong>in</strong>g a typical dairy farm calves and breed<strong>in</strong>g heifers were comb<strong>in</strong>ed with dairy cow production<br />
(Fig. 1). A typical German conf<strong>in</strong>ement production system with dairy cows, heifers and bulls be<strong>in</strong>g<br />
<strong>in</strong>door all-year-round was assumed. Forage components were maize silage, grass silage and hay. Concentrates<br />
consisted of maize, w<strong>in</strong>ter wheat, barley, soybean meal, and concentrates for calves. Except soybean<br />
meal and concentrates for calves the production of all forage and concentrate components was <strong>in</strong>corporated<br />
<strong>in</strong>to the model (Fig. 1).<br />
Global warm<strong>in</strong>g potential (GWP) <strong>in</strong> the model was calculated consider<strong>in</strong>g all primary (occurr<strong>in</strong>g on farm<br />
e.g. dur<strong>in</strong>g feed production, ma<strong>in</strong>tenance of animals and manure management) and secondary sources (occurr<strong>in</strong>g<br />
off-farm e.g. production of fertiliser, pesticides or diesel) of m<strong>et</strong>hane (CH4), nitrous oxide (N2O) and<br />
carbon dioxide (CO2) emissions. Primary source emissions were ma<strong>in</strong>ly calculated accord<strong>in</strong>g to guidel<strong>in</strong>es<br />
and standard values from IPCC (2006) and Haenel (2010). To estimate CH4 emissions from dairy cows we<br />
followed Kirchgeßner <strong>et</strong> al., (1995). Emission factors for the calculation of secondary GHG emissions were<br />
taken from literature.<br />
Figure 7. Illustration of system boundaries of modelled dairy cow production systems<br />
2.2. Extension of exist<strong>in</strong>g model<br />
Handl<strong>in</strong>g of co-products. One m<strong>et</strong>hod to handle co-products from dairy cow production is to allocate GHG<br />
emissions b<strong>et</strong>ween milk and co-products accord<strong>in</strong>g to their economic value (economic allocation).<br />
One option to avoid allocation b<strong>et</strong>ween milk and co-products is to expand the production system by def<strong>in</strong><strong>in</strong>g<br />
an alternative way to produce the co-products of dairy farm<strong>in</strong>g (ISO, 2006). The m<strong>et</strong>hod named `system<br />
expansion` (Flysjö <strong>et</strong> al., 2011) was <strong>in</strong>corporated <strong>in</strong>to the modell<strong>in</strong>g def<strong>in</strong><strong>in</strong>g suckler cow production as the<br />
alternative way to produce beef. To account for the whole potential of beef production of a dairy cow dairy<br />
units were def<strong>in</strong>ed (Fig. 1). A dairy unit goes beyond the dairy farm gate and considers the fatten<strong>in</strong>g systems<br />
of surplus calves. Thus, amount of beef of a dairy unit was made up by beef from culled cows, bull, heifer<br />
and calf fatten<strong>in</strong>g (only H-F dairy cows) (Figure 1). One dairy unit of a 6000 kg, 8000 kg and 10000 kg<br />
yield<strong>in</strong>g dairy cow resulted <strong>in</strong> 322, 315 and 218 kg beef, respectively. Production system and calculation of<br />
GHG emissions for suckler cow production was taken from Zeh<strong>et</strong>meier <strong>et</strong> al., (<strong>2012</strong>). Suckler cows were<br />
assumed to be on pasture 185 days/year. One suckler unit resulted <strong>in</strong> 318 kg beef.<br />
In the system expansion m<strong>et</strong>hod, GHG emissions from suckler cow production were subtracted from GHG<br />
emissions of dairy cow production based on the potential amount of beef production (equation 1).<br />
217
PLENARY SESSION 2: METHODOLOGICAL CHALLENGES FOR ANIMAL PRODUCTION SYSTEMS8 th Int. Conference on <strong>LCA</strong> <strong>in</strong> the<br />
Agri-<strong>Food</strong> Sector, 1-4 Oct <strong>2012</strong><br />
218<br />
GWPSU<br />
(kg CO 2eq )<br />
GWP DU (kg CO 2eq ) -<br />
* bDU<br />
(kg)<br />
bSU<br />
(kg)<br />
GWP (kg CO /kg milk) =<br />
Eq. 1<br />
SE 2eq<br />
milk delivered (kg)<br />
where GWPSE is GWP of milk production us<strong>in</strong>g the system expansion m<strong>et</strong>hod; GWPDU is GWP of one dairy<br />
unit (Fig. 1); GWPSU is GWP of one suckler unit; bSU is amount of beef derived from one suckler cow unit;<br />
bDU= amount of beef derived from one dairy unit.<br />
Uncerta<strong>in</strong>ty modell<strong>in</strong>g. A d<strong>et</strong>erm<strong>in</strong>istic model designed to simulate different yield<strong>in</strong>g dairy cow and fatten<strong>in</strong>g<br />
production systems (Zeh<strong>et</strong>meier <strong>et</strong> al., <strong>2012</strong>) was further developed to account for uncerta<strong>in</strong>ty. Stochastic<br />
simulation was carried out for ma<strong>in</strong> model <strong>in</strong>puts (GHG modell<strong>in</strong>g, production traits, economic param<strong>et</strong>er)<br />
us<strong>in</strong>g @RISK (Palisade Corporation software, Ithaca NY USA). In the course of applied Monte Carlo Simulations<br />
5000 iterations were performed to estimate probability distribution of output values.<br />
Epistemic uncerta<strong>in</strong>ty (uncerta<strong>in</strong>ty from the modell<strong>in</strong>g process, reveals due to imperfection of our knowledge,<br />
compare Walker <strong>et</strong> al., 2003) <strong>in</strong> CH4 emissions of enteric fermentation from dairy cows was <strong>in</strong>cluded<br />
<strong>in</strong> this model us<strong>in</strong>g different equations from literature (Kirchgeßner <strong>et</strong> al., 1995; Dämmgen <strong>et</strong> al., 2009;<br />
Jentsch <strong>et</strong> al., 2009). Uncerta<strong>in</strong>ty <strong>in</strong> N2O emission factors from nitrogen <strong>in</strong>put <strong>in</strong>to soil were taken from<br />
IPCC (2006) guidel<strong>in</strong>es. Emission factors chosen for soybean meal production <strong>in</strong> our model represent different<br />
assumptions of soybean meal production. M<strong>in</strong>imum value <strong>in</strong>cludes emissions only from soybean meal<br />
production and transport to Europe while no land use change (LUC) was assumed (0.34 kg CO2eq/kg) (Dalgaard<br />
<strong>et</strong> al., 2008). A mixture of previous land use be<strong>in</strong>g converted to produce soybean meal was assumed<br />
for the calculation of most likely value (3.1 kg CO2eq/kg) (Flysjö <strong>et</strong> al., <strong>2012</strong>). Maximum value represents a<br />
worst case, as it is assumed that forest was converted to arable land for the production of soybean meal (10<br />
kg CO2eq/kg) (Flysjö <strong>et</strong> al., <strong>2012</strong>). Triangle distribution function was used to describe probability distribution<br />
of CH4ent and emission factors <strong>in</strong>cluded <strong>in</strong> uncerta<strong>in</strong>ty modell<strong>in</strong>g.<br />
Variability uncerta<strong>in</strong>ty (i.e. <strong>in</strong>tr<strong>in</strong>sic variability stemm<strong>in</strong>g from <strong>in</strong>herent variations <strong>in</strong> the real world, compare<br />
Walker <strong>et</strong> al., 2003) for three different production traits of dairy cow production systems were <strong>in</strong>vestigated:<br />
(1) yearly milk yield per dairy farm (kg milk/cow per year), (2) calv<strong>in</strong>g <strong>in</strong>terval and (3) replacement<br />
rate. Data provided by LKV Bayern (unpublished data) and LKV Weser Ems (unpublished data) for 2004-<br />
2010 (LKV Bayern)/ 2009 (LKV Weser Ems) were used to identify variability uncerta<strong>in</strong>ty with<strong>in</strong> (variability<br />
of average milk yield/cow per farm from one year to another) and b<strong>et</strong>ween (variability of calv<strong>in</strong>g <strong>in</strong>terval<br />
and replacement) dairy farms with equivalent milk yields. Data <strong>in</strong>cluded 19070 dairy farms breed<strong>in</strong>g FV<br />
cows and 3200 dairy farms breed<strong>in</strong>g H-F dairy cows. Weighted (farm size) l<strong>in</strong>ear regression models were<br />
calculated consecutively with d<strong>et</strong>rended milk yield as a dependent variable and standard deviation of yearly<br />
milk output per farm, mean calv<strong>in</strong>g <strong>in</strong>terval and replacement rate per farm as <strong>in</strong>dependent variables. The<br />
m<strong>et</strong>hod of quantile regression was used to calculate the standard deviations of calv<strong>in</strong>g <strong>in</strong>terval and replacement<br />
rate b<strong>et</strong>ween dairy farms as a function of d<strong>et</strong>rended milk yield. Result<strong>in</strong>g production trait values for<br />
different yield<strong>in</strong>g dairy cow production systems are shown <strong>in</strong> Table 1. Normal distribution was assumed for<br />
all considered production traits.<br />
Table 1. Mean and standard deviation (SD) of data <strong>in</strong>put for stochastic modell<strong>in</strong>g of production traits (milk<br />
output, calv<strong>in</strong>g <strong>in</strong>terval and replacement rate) for model systems yield<strong>in</strong>g 6000, 8000, and 10000 kg<br />
milk/cow per year.<br />
System milk<br />
yield<br />
(kg milk/cow/yr)<br />
Milk yield (kg/cow/farm/yr) Calv<strong>in</strong>g <strong>in</strong>terval (days) Replacement rate (%)<br />
Mean SD Mean SD Mean SD<br />
6000 6000 280 405 22 32.6 7.6<br />
8000 8000 342 389 15 36.7 7.6<br />
10000 10000 373 416 17 30.3 6.4<br />
Uncerta<strong>in</strong>ty <strong>in</strong> prices of beef from culled cows and calf prices was <strong>in</strong>corporated <strong>in</strong>to the modell<strong>in</strong>g when<br />
calculat<strong>in</strong>g allocation factor of economic allocation m<strong>et</strong>hod. No param<strong>et</strong>ric distribution for prices was found.<br />
Thus a nonparam<strong>et</strong>ric approach based on the empirical cumulative probability function of costs and prices<br />
over a period of 10 years (2000-2010) was chosen (ZMP, various volumes; AMI, 2011). Greenhouse gas<br />
emission <strong>in</strong>puts param<strong>et</strong>ers were assumed to be <strong>in</strong>dependently distributed. Statistically significant correlations<br />
b<strong>et</strong>ween prices were modelled.
PLENARY SESSION 2: METHODOLOGICAL CHALLENGES FOR ANIMAL PRODUCTION SYSTEMS 8 th Int. Conference on<br />
<strong>LCA</strong> <strong>in</strong> the<br />
Agri-<strong>Food</strong> Sector, 1-4 Oct <strong>2012</strong><br />
Emission factors for GHG emissions from suckler cow beef production were taken from Crosson <strong>et</strong> al.,<br />
(2011). In their study Crosson <strong>et</strong> al., (2011) showed an overview of GHG emissions from beef production<br />
systems of different countries and models. Based on the study of Crosson <strong>et</strong> al., (2011) we <strong>in</strong>cluded 15 values<br />
for GHG emissions of beef from suckler cow production us<strong>in</strong>g cumulative probability function. Emission<br />
factors per kg beef varied from 15.6 to 37.5 kg CO2eq.<br />
3. Results<br />
Probabilistic simulation was undertaken for all considered param<strong>et</strong>ers simultaneously. Fig. 2 shows cumulative<br />
probability of GHG emissions for both scenarios of handl<strong>in</strong>g co-products (economic allocation and<br />
system expansion). In case of economic allocation the 6000 kg yield<strong>in</strong>g dairy cow system showed highest<br />
GHG emissions at each level of probability. Greenhouse gas emissions varied from about 1.1 to 2.4 kg<br />
CO2eq/kg milk (Fig. 2a). Probability that the 10000 kg yield<strong>in</strong>g dairy cow system resulted <strong>in</strong> higher GHG<br />
emissions than the 8000 kg yield<strong>in</strong>g dairy cow systems was 77% (Fig. 2a).<br />
The rank<strong>in</strong>g of cumulative probability graphs changed if system boundary was expanded from the dairy<br />
farm gate to the whole system of milk and beef production (system expansion). Depend<strong>in</strong>g on the amount of<br />
beef as a co-product, modelled dairy cow production systems were credited with a certa<strong>in</strong> amount of GHG<br />
emissions from suckler cow production (the alternative way produc<strong>in</strong>g the same amount of beef). In case of<br />
system expansion modelled production systems <strong>in</strong>clud<strong>in</strong>g 10000 kg yield<strong>in</strong>g dairy cows resulted <strong>in</strong> highest<br />
GHG emissions at each level of probability. Probability that dairy cow production system 6000 had lower<br />
GHG emissions than dairy cow production system 8000 was 60%. Total level of GHG emissions decreased<br />
considerably for all modelled dairy cow production systems. Greenhouse gas emissions ranged from negative<br />
values of m<strong>in</strong>us -0.5 to 1.9 kg CO2eq/kg milk for the 6000 and from 0.2 to 1.7 kg CO2eq/kg milk for the<br />
10000 yield<strong>in</strong>g dairy cow production system.<br />
Cumulative Probability<br />
1<br />
0.9<br />
0.8<br />
0.7<br />
0.6<br />
0.5<br />
0.4<br />
0.3<br />
0.2<br />
0.1<br />
a) Economic allocation<br />
Milk yield<br />
(kg milk/cow<br />
per year) 6000 8000 10000<br />
Mean 1.32 1.23 1.22<br />
SD 0.13 0.14 0.17<br />
0<br />
0.00 0.50 1.00 1.50 2.00<br />
GHG emissions [kg CO 2eq/kg milk]<br />
6000 8000 10000<br />
-0.50<br />
0<br />
0.00 0.50 1.00 1.50 2.00<br />
Figure 8. Cumulative probability of GHG emissions consider<strong>in</strong>g uncerta<strong>in</strong>ty of GHG emission factors, production<br />
traits and prices.<br />
Multivariate l<strong>in</strong>ear regression was undertaken calculat<strong>in</strong>g the impact of each <strong>in</strong>put variable considered <strong>in</strong><br />
the uncerta<strong>in</strong>ty modell<strong>in</strong>g. In the case of uncorrelated <strong>in</strong>put variables squared standardized regression coefficients<br />
sum up to r-squared value of the whole model (Murray and Conner, 2009) giv<strong>in</strong>g <strong>in</strong>sight <strong>in</strong>to the proportion<br />
of total variation of GHG emissions which can be expla<strong>in</strong>ed by the variation of each variable (Bortz<br />
and Weber, 2005). Figure 3 shows the proportion of variance of different <strong>in</strong>put variables for the modelled<br />
dairy cow production systems and the <strong>in</strong>vestigated allocation m<strong>et</strong>hods. In case of economic allocation the<br />
impact of emission factors for soybean meal and direct N2O emissions dom<strong>in</strong>ated total variation account<strong>in</strong>g<br />
from 79% for the 6000 kg yield<strong>in</strong>g dairy cow production system to 92% for the 10000 kg yield<strong>in</strong>g dairy cow<br />
production system. Furthermore, the variation of yearly milk output had an impact on variation of GHG<br />
emissions outcomes especially for the 6000 kg yield<strong>in</strong>g dairy cow production system (13%). The impact of<br />
replacement rate on total variance of GHG emissions ranged b<strong>et</strong>ween 3-2%<br />
In case of system expansion variation of emission factor for beef from suckler cow production had the<br />
highest impact on variation of GHG emission outcomes with<strong>in</strong> dual purpose dairy cow production systems<br />
(54% for the 6000 and 43% for the 8000 yield<strong>in</strong>g dairy cow production system). Impact of replacement rate<br />
could be negated (0.9 - 0.2%). Higher cull<strong>in</strong>g rates resulted <strong>in</strong> higher amount of beef from culled cows per<br />
year which reduced the amount of suckler cows needed for beef production. Thus, the effect of reduced GHG<br />
emissions due to fewer replacement heifers was reversed.<br />
Cumulative Probability<br />
1<br />
0.9<br />
0.8<br />
0.7<br />
0.6<br />
0.5<br />
0.4<br />
0.3<br />
0.2<br />
0.1<br />
b) System expansion<br />
GHG emissions [kg CO 2eq/kg milk]<br />
Milk yield<br />
(kg milk/cow<br />
per year) 6000 8000 10000<br />
Mean 0.73 0.75 0.92<br />
SD 0.35 0.31 0.23<br />
6000 8000 10000<br />
219
PLENARY SESSION 2: METHODOLOGICAL CHALLENGES FOR ANIMAL PRODUCTION SYSTEMS8 th Int. Conference on <strong>LCA</strong> <strong>in</strong> the<br />
Agri-<strong>Food</strong> Sector, 1-4 Oct <strong>2012</strong><br />
Figure 3. Param<strong>et</strong>ers <strong>in</strong>fluenc<strong>in</strong>g variation of GHG emission outcomes. EA = economic allocation,<br />
SE=system expansion, EF=emission factor<br />
4. Discussion and Conclusions<br />
The ma<strong>in</strong> objective of this study was to <strong>in</strong>corporate uncerta<strong>in</strong>ty of ma<strong>in</strong> assumptions and param<strong>et</strong>ers from<br />
a d<strong>et</strong>erm<strong>in</strong>istic model modell<strong>in</strong>g GHG emissions from different dairy cow production systems. Two different<br />
m<strong>et</strong>hods for handl<strong>in</strong>g co-products were used.<br />
In consistence with other studies us<strong>in</strong>g d<strong>et</strong>erm<strong>in</strong>istic model approaches (Flysjö <strong>et</strong> al., 2011; Zeh<strong>et</strong>meier <strong>et</strong><br />
al., <strong>2012</strong>) our study showed that the m<strong>et</strong>hod for handl<strong>in</strong>g co-products had the highest impact on total value of<br />
GHG emissions. Mean values decreased up to 56% when system expansion was applied <strong>in</strong> comparison to<br />
economic allocation. Flysjö <strong>et</strong> al., (2011) discussed different m<strong>et</strong>hods for handl<strong>in</strong>g co-products compar<strong>in</strong>g<br />
New Zealand and Swedish dairy cow production systems. Study results showed that GHG emissions per kg<br />
milk decreased 37% when system expansion was applied compared to allocat<strong>in</strong>g 100% of impacts to milk.<br />
However, <strong>in</strong> their study different allocation m<strong>et</strong>hods did not <strong>in</strong>fluence the rank<strong>in</strong>g of modelled systems.<br />
Due to the high uncerta<strong>in</strong>ty of emission factor for beef from suckler cow production standard deviation of<br />
GHG emissions were higher with<strong>in</strong> system expansion <strong>in</strong> comparison to economic allocation. Consider<strong>in</strong>g<br />
uncerta<strong>in</strong>ty of emission factor for beef from suckler cow production even negative GHG emissions per kg<br />
milk were calculated for the dual purpose dairy cow production systems. This shows that if surplus calves<br />
from dairy cow production systems replace calves from suckler cow production systems the GHG emissions<br />
from the dairy farm could be reversed. The f<strong>in</strong>d<strong>in</strong>g that system expansion could result <strong>in</strong> negative GHG<br />
emissions emphasizes the recommendation that this m<strong>et</strong>hod is not suitable to calculate e.g carbon footpr<strong>in</strong>ts<br />
of dairy farms. However, despite the high degree of uncerta<strong>in</strong>ties the m<strong>et</strong>hod of system expansion gives <strong>in</strong>sight<br />
if changes of GHG emissions at the dairy farm could be reversed by changes <strong>in</strong> other systems affected.<br />
Stochastic models offer the advantage to give <strong>in</strong>sight on the robustness and probability of model outcomes<br />
(Pannell, 1997). This is especially important <strong>in</strong> case of system expansion where changes of production<br />
systems are evaluated. In case of system expansion the stochastic model showed that dairy cow production<br />
system 6000 had lower GHG emissions than dairy cow production system system 8000 <strong>in</strong> only 60% of<br />
model runs. In contrary the <strong>in</strong>crease <strong>in</strong> milk yield ongo<strong>in</strong>g with a change <strong>in</strong> breed resulted <strong>in</strong> higher GHG<br />
emission at each stage of probability.<br />
In case of economic allocation the ma<strong>in</strong> purpose of stochastic modell<strong>in</strong>g was to identify factors which<br />
have an important impact on GHG emissions of milk production at the dairy farm. Stochastic models have<br />
advantage to give <strong>in</strong>sight <strong>in</strong>to the variation of GHG emissions outcomes and can identify most important<br />
factors. Regression analysis showed that uncerta<strong>in</strong>ty of soybean meal emission factor had the largest s<strong>in</strong>gle<br />
impact on variation of total GHG emissions especially with<strong>in</strong> high yield<strong>in</strong>g dairy cow production systems.<br />
This is consistent with the study of Flysjö <strong>et</strong> al., (<strong>2012</strong>), who showed that <strong>in</strong>clusion of LUC <strong>in</strong> the emission<br />
factor of soybean meal resulted <strong>in</strong> an <strong>in</strong>crease of 12 - 82% of total GHG emissions for the dairy cow production<br />
systems <strong>in</strong>vestigated. Thus, the calculation of carbon footpr<strong>in</strong>ts of dairy products is mostly <strong>in</strong>fluenced by<br />
the knowledge of production and orig<strong>in</strong> of soybean meal. While the <strong>in</strong>fluence of direct LUC (e.g. from soybean<br />
meal production) is already <strong>in</strong>cluded <strong>in</strong> guidel<strong>in</strong>es for carbon footpr<strong>in</strong>t calculations of dairy products<br />
(IDF, 2010) the <strong>in</strong>clusion of <strong>in</strong>direct LUC <strong>in</strong> GHG modell<strong>in</strong>g of dairy cow production systems rema<strong>in</strong>s to be<br />
discussed (Flysjö <strong>et</strong> al., <strong>2012</strong>). This should be focused <strong>in</strong> further research studies.<br />
220<br />
Distribution [%]<br />
100% EF beef suckler cow<br />
90%<br />
80%<br />
70%<br />
60%<br />
50%<br />
40%<br />
30%<br />
20%<br />
10%<br />
0%<br />
Price beef dairy cow<br />
Milk output<br />
Replacement rate<br />
Calv<strong>in</strong>g <strong>in</strong>terval<br />
CH4 enteric fermentation<br />
EF N2Odir N<strong>in</strong>put<br />
EF soybean meal
PLENARY SESSION 2: METHODOLOGICAL CHALLENGES FOR ANIMAL PRODUCTION SYSTEMS 8 th Int. Conference on<br />
<strong>LCA</strong> <strong>in</strong> the<br />
Agri-<strong>Food</strong> Sector, 1-4 Oct <strong>2012</strong><br />
Whereas the choice of m<strong>et</strong>hod for co-product handl<strong>in</strong>g depends on the scope of GHG modell<strong>in</strong>g <strong>in</strong> dairy<br />
farm<strong>in</strong>g the stochastic model approach gave an <strong>in</strong>sight <strong>in</strong>to robustness and variation of model outcomes<br />
with<strong>in</strong> each m<strong>et</strong>hod for co-product handl<strong>in</strong>g. This is of special importance identify<strong>in</strong>g cost-effective GHG<br />
abatement options. In the search for cost-effective GHG abatement options further side effects of changes <strong>in</strong><br />
farm<strong>in</strong>g systems as the impact on other environmental and social <strong>in</strong>dicators need to be <strong>in</strong>vestigated.<br />
5. References<br />
AMI (Agrarmarkt Informations-Gesellschaft) (Ed) 2011. Markt Bilanz Milch 2011/G<strong>et</strong>reide Ölsaaten Futtermittel 2011/ Markt Bilanz<br />
Vieh und Fleisch. Bonn.<br />
Bortz, J., Weber, R., 2005. Statistik für Human- und Sozialwissenschaftler. Spr<strong>in</strong>ger Mediz<strong>in</strong>, Heidelberg.<br />
Crosson, P., Shalloo, L., O'Brien, D., Lanigan, G.J., Foley, P.A., Boland, T.M., Kenny, D.A., 2011. A review of whole farm systems<br />
models of greenhouse gas emissions from beef and dairy cattle production systems. Animal Feed Science and Technology 166-<br />
67 (SI), 29–45.<br />
Dalgaard, R., Schmidt, J., Halberg, N., Christensen, P., Thrane, M., Pengue, W.A., 2008. <strong>LCA</strong> of soybean meal. Int J Life Cycle<br />
Assess 13, 240-254.<br />
Dämmgen, U., Haenel, H.-D., Rösemann, C., Hutch<strong>in</strong>gs, J., Brade, W., Lebzien, P., 2009. Improved national calculation procedures<br />
to assess requirements, nitrogen and VS excr<strong>et</strong>ions of dairy cows <strong>in</strong> the German emission model GAS-EM. Landbauforschung<br />
59, 233-252.<br />
Flysjö, A., Cederberg, C., Henriksson, M., Ledgard, S., 2011. How does co-product handl<strong>in</strong>g affect the carbon footpr<strong>in</strong>t of milk?<br />
Case study of milk production <strong>in</strong> New Zealand and Sweden. Int J Life Cycle Assess 16, 420-430.<br />
Flysjö, A., Cederberg, C., Henriksson, M., Ledgard, S., <strong>2012</strong>. The <strong>in</strong>teraction b<strong>et</strong>ween milk and beef production and emissions from<br />
land use change - critical consideration <strong>in</strong> life cycle assessment and carbon footpr<strong>in</strong>t studies of milk. Journal of Cleaner Production<br />
28, 134-142.<br />
Haenel, H. 2010. Calculations of Emissions from German Agriculture – National Emission Inventory Report (NIR) 2010 for<br />
2008,Sonderheft 334. vTI, Braunschweig.<br />
IDF, 2010. A common carbon footpr<strong>in</strong>t approach for dairy. The IDF guide to standard lifecycle assessment m<strong>et</strong>hodology for the<br />
dairy sector. Bull<strong>et</strong><strong>in</strong> of the International Dairy Federation 445:41.<br />
IPCC, 2006. 2006 IPCC Guidel<strong>in</strong>es for National Greenhouse Gas Inventories: Volume 4: Agriculture, Forestry and other Land Use.<br />
Intergovernmental Panel on Climate Change. Paris, <strong>France</strong>.<br />
ISO, 2006. Environmental management – life cycle assessment – requirements and guidel<strong>in</strong>es. ISO14044:2006(E). ISO, Geneva.<br />
Jentsch, W., Piatkowski, B., Schweigel, M., Derno, M., 2009. Quantitative results for m<strong>et</strong>hane production of cattle <strong>in</strong> Germany.<br />
Archiv für Tirzucht – Archives of Animal Breed<strong>in</strong>g 52, 587-592.<br />
Kirchgeßner, M., W<strong>in</strong>disch, W., Müller, H.L., 1995. Nutritional Factors for the Quantification of M<strong>et</strong>hane Production, <strong>in</strong>: Engelhardt,<br />
W., Leonhard-Marek, S., Giesecke, D. (Eds.), Rum<strong>in</strong>ant Physiology: Digestion, M<strong>et</strong>abolism, Growth and Reproduction.<br />
Proceed<strong>in</strong>gs of the Eighth International Symposium on Rum<strong>in</strong>ant Physiology. Ferd<strong>in</strong>and Enke Verlag, Berl<strong>in</strong>.<br />
Lesschen, J.P., van den Berg, M., Westhoek, H.J., Witzke, H.P., Oenema, O., 2011. Greenhouse gas emission profiles of European<br />
livestock sectors. Animal Feed Science and Technology 166-67 (SI), 16–28.<br />
Murray, K., Conner, M.M., 2009. M<strong>et</strong>hods to quantify variable importance: implications for the analysis of noisy ecological data.<br />
Ecology 90 (5), 1425-1425<br />
Pannell, D.J., 1997. Sensitivity analysis of normative economic models: theor<strong>et</strong>ical framework and practical strategies. Agricultural<br />
Economics 16 (2). 139–152.<br />
Walker, W., Harremoes, P., Rotmans, J., van der Sluijs J.P., van Asselt M.B.A., Janssen, P., Krayer Krauss, M. von, 2003. Def<strong>in</strong><strong>in</strong>g<br />
Uncerta<strong>in</strong>ty: A Conceptual Basis for Uncerta<strong>in</strong>ty Management <strong>in</strong> Model-Based Decision Support. Integrated Assessment 4 (1),<br />
5–17.<br />
Zeh<strong>et</strong>meier, M., Baudracco, J., Hoffmann, H., Heißenhuber, A., <strong>2012</strong>. Does <strong>in</strong>creas<strong>in</strong>g milk yield reduce greenhouse gas emissions?<br />
A system approach. Animal 6, 154-166.<br />
ZMP, various volumes. ZMP G<strong>et</strong>reide Ölsaaten Futtermittel/ Marktbilanz Milch / Vieh und Fleisch - Deutschland, Europäische<br />
Union, Weltmarkt. Bonn.<br />
221
PLENARY SESSION 2: METHODOLOGICAL CHALLENGES FOR ANIMAL PRODUCTION SYSTEMS8 th Int. Conference on <strong>LCA</strong> <strong>in</strong> the<br />
Agri-<strong>Food</strong> Sector, 1-4 Oct <strong>2012</strong><br />
222<br />
Towards a susta<strong>in</strong>able animal production sector: potential and<br />
problems of <strong>LCA</strong><br />
Imke J.M. de Boer * , Cor<strong>in</strong>a E. van Middelaar<br />
Animal Production Systems Group, Wagen<strong>in</strong>gen University, The N<strong>et</strong>herlands<br />
Correspond<strong>in</strong>g author. E-mail: Imke.deBoer@wur.nl<br />
ABSTRACT<br />
A transition to a susta<strong>in</strong>able animal production sector requires an <strong>in</strong>tegrated life cycle assessment of potential <strong>in</strong>novations. At this<br />
moment, however, this transition process is h<strong>in</strong>dered by the complexity and the uncerta<strong>in</strong>ty of the comb<strong>in</strong>ed effect of an <strong>in</strong>novation<br />
on the diverse issues of susta<strong>in</strong>ability. There is an urgent need to develop science-based tools that <strong>in</strong>tegrate socio-economic and an<br />
environmental impact along the cha<strong>in</strong> to ga<strong>in</strong> <strong>in</strong>sight <strong>in</strong>to the multidimensional and som<strong>et</strong>imes conflict<strong>in</strong>g consequences of GHG<br />
mitigation options.<br />
Keywords: animal production, uncerta<strong>in</strong>ty, life cycle susta<strong>in</strong>ability assessment, stakeholder participation<br />
1. Introduction<br />
Animal production is surrounded by concerns around its environmental impact, the health and welfare of<br />
animals, the saf<strong>et</strong>y of animal products, and its impact on human health. Acknowledg<strong>in</strong>g these concerns,<br />
Dutch stakeholders along the animal production cha<strong>in</strong> agreed to jo<strong>in</strong> forces <strong>in</strong> the transition towards a comp<strong>et</strong>itive<br />
sector that produces with respect for animals, humans, and the environment. A lot of research has<br />
been directed at feed<strong>in</strong>g, breed<strong>in</strong>g, technological or management <strong>in</strong>novations to improve susta<strong>in</strong>ability performance<br />
of the animal production sector. Moreover, <strong>in</strong>dustry partners and other stakeholders start to <strong>in</strong>vest<br />
<strong>in</strong> development of science-based tools to improve and monitor their susta<strong>in</strong>ability performance<br />
(www.susta<strong>in</strong>abilityconsortium.org).<br />
The aim of this paper is to review potentials and problems related to us<strong>in</strong>g life cycle assessment (<strong>LCA</strong>) <strong>in</strong><br />
the transition to a susta<strong>in</strong>able animal production sector. We used GHG mitigation as a case study to illustrate<br />
the potential and problems of us<strong>in</strong>g <strong>LCA</strong> <strong>in</strong> the field of animal production.<br />
2. Mitigat<strong>in</strong>g greenhouse gas emissions <strong>in</strong> livestock production<br />
Livestock production is recognized to contribute significantly to emission of greenhouse gases (GHGs,<br />
Ste<strong>in</strong>feld <strong>et</strong> al., 2006), ma<strong>in</strong>ly through emission of carbon dioxide (CO2), m<strong>et</strong>hane (CH4) and nitrous oxide<br />
(N2O). CO2 is released from combustion of fossil fuels to power mach<strong>in</strong>ery, from burn<strong>in</strong>g of biomass, and<br />
from microbial decay related to, for example, changes <strong>in</strong> land use or <strong>in</strong> crop management (Janzen, 2004).<br />
CO2 can be sequestered also by transform<strong>in</strong>g arable land <strong>in</strong>to permanent grassland. CH4 is produced when<br />
organic matter decomposes <strong>in</strong> oxygen deprived conditions, for example, dur<strong>in</strong>g enteric fermentation (especially<br />
<strong>in</strong> rum<strong>in</strong>ants) and storage of manure (Mosier <strong>et</strong> al., 1998). CH4 is also <strong>in</strong>advertently released dur<strong>in</strong>g<br />
fossil fuel extraction and ref<strong>in</strong><strong>in</strong>g. N2O is released dur<strong>in</strong>g microbial transformation of nitrogen <strong>in</strong> the soil or<br />
<strong>in</strong> manure (i.e. nitrification of NH4 + <strong>in</strong>to NO3 -, and <strong>in</strong>compl<strong>et</strong>e denitrification of NO3 - <strong>in</strong>to N2; (Oenema <strong>et</strong> al.,<br />
2005) as well as dur<strong>in</strong>g nitrate fertiliser production.<br />
We explored studies that addressed options to mitigate GHG emissions <strong>in</strong> the animal production cha<strong>in</strong><br />
(De Boer <strong>et</strong> al., 2011). Mitigation options considered are: reduc<strong>in</strong>g enteric m<strong>et</strong>hane (CH4) emission from<br />
rum<strong>in</strong>ants, anaerobic manure digestion, and <strong>in</strong>creas<strong>in</strong>g annual milk yield per cow.<br />
2.1 Reduc<strong>in</strong>g enteric CH4 emission from rum<strong>in</strong>ants<br />
Several studies explored the CH4 reduction potential of feed<strong>in</strong>g strategies at animal level (Ellis <strong>et</strong> al.,<br />
2008; Gra<strong>in</strong>ger and Beauchem<strong>in</strong>, 2011). A feed<strong>in</strong>g strategy with potential to reduce enteric CH4 emission,<br />
for example, is replac<strong>in</strong>g grass silage by maize silage <strong>in</strong> a cow’s di<strong>et</strong> (Mills <strong>et</strong> al., 2001; Beauchem<strong>in</strong> <strong>et</strong> al.,<br />
2008). Dijkstra <strong>et</strong> al., (2011) showed that replac<strong>in</strong>g 50% of the grass silage for maize silage <strong>in</strong> a di<strong>et</strong> conta<strong>in</strong><strong>in</strong>g<br />
30% concentrates and 70% grass silage reduces enteric CH4 levels with about 5%. Focus<strong>in</strong>g at the animal<br />
level, this is a promis<strong>in</strong>g strategy to reduce GHG emissions. Literature, however, also shows that di<strong>et</strong>ary<br />
manipulation not only changes enteric CH4 emissions, but also manure composition, and hence N2O emissions<br />
from storage and application of manure (Chianese <strong>et</strong> al., 2009; Kebreab <strong>et</strong> al., 2010). Furthermore,<br />
replac<strong>in</strong>g grass silage by maize silage might change the farm plan, i.e., part of the grassland will be ploughed<br />
for maize land. Plough<strong>in</strong>g grassland for maize land results <strong>in</strong> CO2 and N2O emissions, due to a change <strong>in</strong> soil<br />
carbon and nitrogen levels (Vell<strong>in</strong>ga <strong>et</strong> al., 2011; Van Middelaar <strong>et</strong> al., <strong>2012</strong>a). Moreover, cultivat<strong>in</strong>g maize
PLENARY SESSION 2: METHODOLOGICAL CHALLENGES FOR ANIMAL PRODUCTION SYSTEMS 8 th Int. Conference on<br />
<strong>LCA</strong> <strong>in</strong> the<br />
Agri-<strong>Food</strong> Sector, 1-4 Oct <strong>2012</strong><br />
<strong>in</strong>stead of grass requires different fertilisation and land management, chang<strong>in</strong>g N2O emissions from crop<br />
cultivation and emissions related to production of fertilisers (Schils <strong>et</strong> al., 2005; Bass<strong>et</strong>-Mens <strong>et</strong> al., 2009).<br />
To illustrate the importance of life cycle th<strong>in</strong>k<strong>in</strong>g <strong>in</strong> animal production, we assessed the GHG reduction<br />
potential of <strong>in</strong>creas<strong>in</strong>g maize silage at the expense of grass silage <strong>in</strong> a dairy cow’s di<strong>et</strong> at three <strong>in</strong>terdependent,<br />
hierarchical levels, i.e. the animal, farm, and cha<strong>in</strong> level. A mechanistic model to predict enteric CH4<br />
emission at cow level is comb<strong>in</strong>ed with a l<strong>in</strong>ear programm<strong>in</strong>g (LP) model to predict effects of a di<strong>et</strong>ary<br />
change at farm level, and with life cycle assessment (<strong>LCA</strong>) to predict GHG emissions at cha<strong>in</strong> level. The<br />
impact of the level of analysis is demonstrated us<strong>in</strong>g the case of an average Dutch dairy farm (Van Middelaar<br />
<strong>et</strong> al., <strong>2012</strong>b).<br />
Results of this case study showed that per ton of fat-prote<strong>in</strong>-corrected milk (FPCM), with an emission of<br />
955 kg CO2-e, <strong>in</strong>creas<strong>in</strong>g maize silage with one kg DM per cow per day at the expense of grass silage resulted<br />
<strong>in</strong> an annual emission reduction of 11 kg CO2-e at animal level, 16 kg CO2-e at farm level, and 17 kg<br />
CO2-e at cha<strong>in</strong> level. At farm and cha<strong>in</strong> level, however, land use change (e.g. plough<strong>in</strong>g grassland for maize<br />
land) resulted <strong>in</strong> non-recurrent CO2 and N2O emissions of 720 kg CO2-eq per t FPCM. From an animal perspective,<br />
therefore, we would conclude that this feed<strong>in</strong>g strategy offers potential to reduce GHG emissions,<br />
whereas from an <strong>LCA</strong> perspective it takes up to 42 years before annual emission reductions compensate for<br />
emissions related to land use change.<br />
This example demonstrates the potential of us<strong>in</strong>g <strong>LCA</strong> to assess the GHG reduction potential of an <strong>in</strong>novation.<br />
2.2 Anaerobic digestions of manure<br />
An important form of renewable energy is bio-energy produced from biomass. Biomass can be converted<br />
<strong>in</strong>to biogas, composed of CH4, CO2 and some trace gases (e.g., hydrogen gas), by means of anaerobic digestion<br />
(AD) (De Vries <strong>et</strong> al., <strong>2012</strong>a; Hamel<strong>in</strong> <strong>et</strong> al., 2011). This biogas can be used to produce bio-energy <strong>in</strong><br />
the form of electricity, heat, or transport fuel. The rema<strong>in</strong><strong>in</strong>g product after AD, i.e. digestate, can be recycled<br />
as organic fertiliser for crop cultivation to substitute m<strong>in</strong>eral fertiliser (Börjesson and Berglund, 2007). Anaerobic<br />
digestion of pig manure is expected to reduce the environmental impact of manure management by<br />
reduc<strong>in</strong>g storage emissions and substitut<strong>in</strong>g fossil fuel, but current efficiency of bio-gas production from<br />
manure only is low (EU-biogas, 2010). To <strong>in</strong>crease efficiency of bio-gas production, co-substrates, such as<br />
maize silage, glycer<strong>in</strong>e or food waste are generally added. De Vries <strong>et</strong> al., (<strong>2012</strong>b) compared the life cycle<br />
environmental consequences of produc<strong>in</strong>g bio-energy by anaerobic digestion of pig manure only (monodigestion),<br />
and co-digestion with maize silage; maize silage and glycer<strong>in</strong>; be<strong>et</strong> tails; wheat yeast concentrate<br />
(WYC); and roadside grass. They assessed impacts on climate change, terrestrial acidification, mar<strong>in</strong>e and<br />
freshwater eutrophication, particulate matter formation, land use, and fossil fuel depl<strong>et</strong>ion. Results showed<br />
that mono-digestion performed well for most impacts, but represents a limited source for bio-energy. Codigestion<br />
with maize silage, be<strong>et</strong> tails, and WYC (all comp<strong>et</strong><strong>in</strong>g with animal feed), and glycer<strong>in</strong>e <strong>in</strong>creased<br />
bio-energy production, but at the expense of <strong>in</strong>creas<strong>in</strong>g climate change (through land use change), mar<strong>in</strong>e<br />
eutrophication, and land use. Co-digestion with like roadside grass gave the best environmental performance.<br />
Hence, technologies that <strong>in</strong>crease efficiency of bio-gas production from animal manure and from organic<br />
waste with limited value elsewhere, have most potential to mitigate GHG emissions (De Vries <strong>et</strong> al., <strong>2012</strong>b).<br />
This example demonstrates the importance of <strong>in</strong>clud<strong>in</strong>g the environmental impacts related to production of<br />
substitutes to replace <strong>in</strong>itial use of co-substrates <strong>in</strong> the analysis, or <strong>in</strong> other words evaluat<strong>in</strong>g the full consequences<br />
of an <strong>in</strong>novation.<br />
This example demonstrates the potential of <strong>LCA</strong> to evaluate the environmental consequences (i.e. consequential<br />
<strong>LCA</strong>) of an <strong>in</strong>novation.<br />
2.3 Increas<strong>in</strong>g annual milk yield per cow<br />
In 2010, the FAO quantified emission of GHGs along the life cycle of milk <strong>in</strong> many countries across the<br />
world (FAO, 2010). From their study you could conclude that GHG emissions per kg milk reduce as annual<br />
milk production <strong>in</strong>creases. Research <strong>in</strong>deed showed that if one is able to use feed more efficiently (i.e. produce<br />
more milk with the same amount of feed or use less feed to produce the same amount of milk), GHGs<br />
per kg milk produced is reduced (Thomassen <strong>et</strong> al., 2009). Can we directly compare smallholder systems <strong>in</strong><br />
which cows produce 500 kg of milk annually with specialised systems <strong>in</strong> which cows produce 7000 to 8000<br />
kg? Cows <strong>in</strong> many smallholder systems <strong>in</strong> develop<strong>in</strong>g countries generally are not kept to produce milk or<br />
223
PLENARY SESSION 2: METHODOLOGICAL CHALLENGES FOR ANIMAL PRODUCTION SYSTEMS8 th Int. Conference on <strong>LCA</strong> <strong>in</strong> the<br />
Agri-<strong>Food</strong> Sector, 1-4 Oct <strong>2012</strong><br />
meat, but they have important other functions, such as to provide manure and draught power for crop production,<br />
or to function as a capital ass<strong>et</strong>. Bosman <strong>et</strong> al., (1997) quantified the various functions of livestock <strong>in</strong><br />
smallholder systems <strong>in</strong> the develop<strong>in</strong>g world <strong>in</strong> economic terms. If one allocates the total GHG emissions of<br />
a smallholder farm to various functions of the animals, based on their relative economic value, GHG emissions<br />
per kg of milk produced are not that different b<strong>et</strong>ween a specialised, <strong>in</strong>tensive production system and a<br />
smallholder system.<br />
Zeh<strong>et</strong>meier <strong>et</strong> al., (2011) compared the CO2-e per kg of milk for high-produc<strong>in</strong>g Holste<strong>in</strong> Friesians cows<br />
with CO2-e per kg of milk for moderate-produc<strong>in</strong>g Fleckvieh cows. They demonstrated that this comparison<br />
was highly affected by the m<strong>et</strong>hod of co-product handl<strong>in</strong>g used. In case of economic allocation, the CO2-e<br />
per kg milk was lower for high-produc<strong>in</strong>g Holste<strong>in</strong> Friesian cows than for moderate-produc<strong>in</strong>g Fleckvieh<br />
cows, whereas <strong>in</strong> case of system expansion, the CO2-e per kg milk was higher for high-produc<strong>in</strong>g Holste<strong>in</strong><br />
Friesian cows than for moderate-produc<strong>in</strong>g Fleckvieh cows.<br />
Both studies address the importance of handl<strong>in</strong>g multi-functionality while compar<strong>in</strong>g various production<br />
systems. Besides handl<strong>in</strong>g multi-functionality (or co-product handl<strong>in</strong>g), the m<strong>et</strong>hod used to account for land<br />
use change (LUC), such as deforestation for feed production, can have an important impact on comparison of<br />
systems. Flysjö <strong>et</strong> al., (<strong>2012</strong>) demonstrated that depend<strong>in</strong>g on the m<strong>et</strong>hod of allocation applied, organic milk<br />
production <strong>in</strong> Sweden showed about 50% higher or 40% lower CO2-e per kg of milk.<br />
The above described studies demonstrate the complexity of animal production systems (multifunctionality<br />
of systems, impacts from land-use change due to feed cultivation), and the problem that m<strong>et</strong>hodological<br />
choices have a major impact on the evaluation of <strong>in</strong>novations. From a scientific po<strong>in</strong>t of view,<br />
therefore, compl<strong>et</strong>e transparency <strong>in</strong> m<strong>et</strong>hods and data are required to enable correct <strong>in</strong>terpr<strong>et</strong>ation of results<br />
of an <strong>LCA</strong> study.<br />
2.4 Trade-offs with other issues of susta<strong>in</strong>ability<br />
Most studies found <strong>in</strong> literature that addressed mitigation options for GHG emissions did not account for<br />
the complex <strong>in</strong>terrelated effects on all GHGs, or their relation with other aspects of susta<strong>in</strong>ability, such as<br />
eutrophication, animal welfare, land use or food security (De Boer <strong>et</strong> al., 2011). Gen<strong>et</strong>ic selection for <strong>in</strong>creased<br />
annual milk production per cow, for example, might not only affect environmental impacts along the<br />
cha<strong>in</strong>, but might also negatively affect animal health or fertility (De Vries <strong>et</strong> al., 2011; Oltenacu and Broom,<br />
2010) or the social acceptance of animal production. Current decisions on GHG mitigation options <strong>in</strong> animal<br />
production are h<strong>in</strong>dered by the complexity and uncerta<strong>in</strong>ty of the comb<strong>in</strong>ed effect of these options on climate<br />
change and their relation with other aspects of susta<strong>in</strong>ability.<br />
There is an urgent need to <strong>in</strong>tegrate socio-economic impacts along the cha<strong>in</strong> with consequential life cycle<br />
model<strong>in</strong>g to ga<strong>in</strong> <strong>in</strong>sight <strong>in</strong>to the multidimensional and som<strong>et</strong>imes conflict<strong>in</strong>g consequences of, for example,<br />
GHG mitigation options. Assessment of socio-economic impacts along the cha<strong>in</strong>, however, might not necessarily<br />
need to follow the same m<strong>et</strong>hodology as environmental impact assessment along the cha<strong>in</strong>. L<strong>et</strong>’s consider<br />
the example of dairy cattle welfare and the production of 1 kg of milk ready for consumption. Unlike<br />
emission of GHGs, animal welfare is a susta<strong>in</strong>ability concern at the farm, dur<strong>in</strong>g the transport of calves or<br />
cows, and dur<strong>in</strong>g slaughter<strong>in</strong>g of calves or cows, but not, for example, dur<strong>in</strong>g the cultivation of feed <strong>in</strong>gredients<br />
or process<strong>in</strong>g of milk. Moreover, assessment of dairy cattle welfare at dairy farms is already a multidimensional<br />
concept <strong>in</strong> itself: it requires <strong>in</strong>tegration of several types of <strong>in</strong>dicators (De Vries <strong>et</strong> al., 2011), and<br />
def<strong>in</strong><strong>in</strong>g thresholds of what is acceptable and what not seems to be an even greater challenge. Furthermore,<br />
we can wonder if we should aim at summ<strong>in</strong>g up welfare along the cha<strong>in</strong> – welfare at the farm, dur<strong>in</strong>g transport<br />
and slaughter<strong>in</strong>g – or, that we need to focus on separate s<strong>et</strong>s of <strong>in</strong>dicators along the cha<strong>in</strong>? More research<br />
is required to allow a socio-economic impact assessment of food cha<strong>in</strong>s.<br />
3. Science-based harmonised approach<br />
To move towards a susta<strong>in</strong>able livestock sector, we need to <strong>in</strong>form stakeholders along the cha<strong>in</strong> about potential<br />
improvement options. This requires a science-based <strong>in</strong>tegral susta<strong>in</strong>ability assessment along the cha<strong>in</strong><br />
and high-quality data. Stakeholders can contribute to improvement of data quality. Moreover, an active <strong>in</strong>volvement<br />
of stakeholders <strong>in</strong> development <strong>in</strong>, for example, product specific environmental impact guidel<strong>in</strong>es<br />
(e.g. IDF Guidel<strong>in</strong>es) will make them aware of the complexity of environmental impact assessment, and<br />
strengthen the support for actual application of <strong>in</strong>novations. We, however, have to be aware of the fact that<br />
stakeholders are eager to defend their own <strong>in</strong>terests. Experiences with stakeholder participation revealed, for<br />
example, that different stakeholders preferred different allocation m<strong>et</strong>hods because of differences <strong>in</strong> their<br />
<strong>in</strong>terests. For example, beer brewers preferred a physical allocation (result<strong>in</strong>g <strong>in</strong> low emissions per unit of<br />
224
PLENARY SESSION 2: METHODOLOGICAL CHALLENGES FOR ANIMAL PRODUCTION SYSTEMS 8 th Int. Conference on<br />
<strong>LCA</strong> <strong>in</strong> the<br />
Agri-<strong>Food</strong> Sector, 1-4 Oct <strong>2012</strong><br />
beer) for the beer process<strong>in</strong>g stage, whereas feed companies preferred economic allocation (result<strong>in</strong>g <strong>in</strong> low<br />
emissions per unit of brewer’s gra<strong>in</strong>). This stresses the importance of development of science-based harmonisation<br />
of guidel<strong>in</strong>es, which is a challenge is itself.<br />
4. Conclusion<br />
Current decisions on GHG mitigation <strong>in</strong> animal production are h<strong>in</strong>dered by the complexity and uncerta<strong>in</strong>ty<br />
of the comb<strong>in</strong>ed effect of GHG mitigation options on climate change and their relation with other aspects of<br />
susta<strong>in</strong>ability. There is an urgent need to develop science-based tools that <strong>in</strong>tegrate socio-economic and environmental<br />
impacts along the cha<strong>in</strong> to ga<strong>in</strong> <strong>in</strong>sight <strong>in</strong>to the multidimensional and som<strong>et</strong>imes conflict<strong>in</strong>g consequences<br />
of GHG mitigation options.<br />
5. References<br />
Bass<strong>et</strong>-Mens, C., Ledgard, S., Boyes, M., 2009. Eco-efficiency of <strong>in</strong>tensification scenarios for milk production <strong>in</strong> New Zealand.<br />
Ecological Economics 68: 1615-1625.<br />
Beauchem<strong>in</strong>, K.A., Kreuzer, M., O'Mara, F., McAllister, T.A., 2008. Nutritional management for enteric m<strong>et</strong>hane abatement: A<br />
review. Australian Journal of Experimental Agriculture 48: 21-27.<br />
Börjesson, P., Berglund, M. 2007. Environmental systems analysis of biogas systems-Part II: The environmental impact of replac<strong>in</strong>g<br />
various reference systems. Biomass and Bioenergy 31: 326-344.<br />
Bosman, H.G., Moll, H.A.J. and H.M.J. Udo. 1997. Measur<strong>in</strong>g and <strong>in</strong>terpr<strong>et</strong><strong>in</strong>g the benefits of goat keep<strong>in</strong>g <strong>in</strong> tropical farm systems.<br />
Agricultural systems 53: 349-372.<br />
De Boer I.J.M., Cederberg, C., Eady, S., Gollnow, S., Kristensen, T., Macleod, M., Meul, M., Nemecek, T., Phong, L.T., Thoma,<br />
G.,van der Werf, H.M.G., Williams, A.G., Zonderland-Thomassen, M.A., 2011. Greenhouse gas mitigation <strong>in</strong> animal production:<br />
towards an <strong>in</strong>tegrated life cycle susta<strong>in</strong>ability assessment. Current Op<strong>in</strong>ion on Environmental Susta<strong>in</strong>ability 3: 423-431.<br />
De Vries M., Bokkers E.A.M., Dijkstra T., Van Schaik G., De Boer I.J.M., 2011. Associations b<strong>et</strong>ween variables of rout<strong>in</strong>e herd data<br />
and dairy cattle welfare. Journal of Dairy Science 94:3213-3228.<br />
De Vries, J.W., Groeneste<strong>in</strong>, C.M., De Boer, I.J.M., <strong>2012</strong>a. Environmental consequences of process<strong>in</strong>g manure to produce m<strong>in</strong>eral<br />
fertilizer and bio-energy. Journal of Environmental Management 102: 173-183.<br />
De Vries, J.W, V<strong>in</strong>ken T.M.W.J., Hamel<strong>in</strong>, L., De Boer, I.J.M., <strong>2012</strong>b. Compar<strong>in</strong>g environmental consequences of anaerobic monoand<br />
co-digestion of pig manure to produce bio-energy – a life cycle perspective (<strong>in</strong> preparation).<br />
Chianeese, D.S., Rotz, C.A., Richard, T.L., 2009. Simulation of nitrous oxide emissions from dairy farms to assess greenhouse gas<br />
reduction strategies. Transactions of the ASABE, 52: 1325-1335.<br />
Dijkstra, J., Oenema, O., Bann<strong>in</strong>k, A., 2011. Di<strong>et</strong>ary strategies to reduc<strong>in</strong>g N excr<strong>et</strong>ion from cattle: Implications for m<strong>et</strong>hane emissions.<br />
Current Op<strong>in</strong>ion <strong>in</strong> Environmental Susta<strong>in</strong>ability 3: 414-422.<br />
EU-AGRO Biogas. 2010. http://www.eu-agrobiogas.n<strong>et</strong>.<br />
Ellis, J.L., Dijkstra, J., Kebreab, E., Bann<strong>in</strong>k, A., Odongo, N.E., McBride, B.W., <strong>France</strong>, J., 2008. Aspects of rumen microbiology<br />
central to mechanistic modell<strong>in</strong>g of m<strong>et</strong>hane production <strong>in</strong> cattle. Journal of Agricultural Science 146: 213-233.<br />
FAO, 2010. Greenhouse gas emissions from the dairy sector. Animal Production and Health Division, FAO, Rome.<br />
Flysjö, A., Cederberg C, Henriksson M, Ledgard S., <strong>2012</strong>. The <strong>in</strong>teraction b<strong>et</strong>ween milk and beef production and emissions from<br />
land use change - critical considerations <strong>in</strong> life cycle assessment and carbon footpr<strong>in</strong>t studies of milk. Journal of Cleaner Production<br />
28: 134-142.<br />
Gra<strong>in</strong>ger, C., Beauchem<strong>in</strong>, K.A., 2011. Can enteric m<strong>et</strong>hane emissions from rum<strong>in</strong>ants be lowered without lower<strong>in</strong>g their production?<br />
Animal Feed Science and Technology 166–167, 308–320.<br />
Hamel<strong>in</strong>, L., Wesnæs, M., Wenzel, H., P<strong>et</strong>ersen, B.M., 2011. Environmental Consequences of Future Biogas Technologies Based on<br />
Separated Slurry. Environmental Science and Technology 45: 5869-5877<br />
Janzen H.H., 2004. Carbon cycl<strong>in</strong>g <strong>in</strong> earth systems — a soil science perspective. Agriculture Ecosystems and Environment 104:399-<br />
417.<br />
Kebreab, E., Strathe, A., Fadel, J., Moraes, L., <strong>France</strong>, J., 2010. Impact of di<strong>et</strong>ary manipulation on nutrient flows and greenhouse gas<br />
emissions <strong>in</strong> cattle. Revista Brasileira de Zootecnia 39 (SUPPL. 1), pp. 458-464.<br />
Mills, J.A.N., Dijkstra, J., Bann<strong>in</strong>k, A., Cammell, S.B., Kebreab, E., <strong>France</strong>, J., 2001. A mechanistic model of whole-tract digestion<br />
and m<strong>et</strong>hanogenesis <strong>in</strong> the lactat<strong>in</strong>g dairy cow: Model development, evaluation, and application. Journal of Animal Science 79:<br />
1584-1597.<br />
Mosier A.R., Duxberry J.M., Freney J.R., He<strong>in</strong>emeyer O., M<strong>in</strong>ami K., Johnson D.E., 1998. Mitigat<strong>in</strong>g agricultural emissions of<br />
m<strong>et</strong>hane. Climate Change 40:39-80.<br />
Oenema O., Wrage N., Velthof G.L., Van Groen<strong>in</strong>gen J.W., Dolf<strong>in</strong>g J., Kuikman P.J., 2005. Trends <strong>in</strong> global nitrous oxide emission<br />
from animal production systems. Nutrient Cycl<strong>in</strong>g <strong>in</strong> Agroecosystems 72:51-65.<br />
Oltenacu P.A., Broom D.M., 2010. The impact of gen<strong>et</strong>ic selection for <strong>in</strong>creased milk yield on the welfare of dairy cows. Animal<br />
Welfare 19:39-49.<br />
Schils, R.L.M., Velthof, G.L., Fraters, B., Willems, W.J., 2005. Limits to the use of manure and m<strong>in</strong>eral fertilizer <strong>in</strong> grass and silage<br />
maize production <strong>in</strong> the N<strong>et</strong>herlands, with special reference to the EU Nitrates Directive. Plant Research International B.V.,<br />
Wagen<strong>in</strong>gen, The N<strong>et</strong>herlands, pp. 1–48.<br />
Ste<strong>in</strong>feld, H., Gerber, P., Wassenaar, T., Castel, V., Rosales M., De Haan, C., 2006. Livestock's Long Shadow: environmental issues<br />
and options. FAO, Rome, Italy.<br />
Thomassen M.A., Dolman M.A., Van Calker K.J., De Boer I.J.M.., 2009. Relat<strong>in</strong>g life cycle assessment <strong>in</strong>dicators to gross value<br />
added for Dutch dairy farms. Ecological Economics 68:2278-2284.<br />
Van Middelaar, C.E. Cederberg, C., Vell<strong>in</strong>ga, T.V., Van der Werf, H.M.G., De Boer, I.J.M., <strong>2012</strong>a. Explor<strong>in</strong>g variability <strong>in</strong> m<strong>et</strong>hods<br />
and data sensitivity <strong>in</strong> carbon footpr<strong>in</strong>ts of feed <strong>in</strong>gredients. (Submitted).<br />
225
PLENARY SESSION 2: METHODOLOGICAL CHALLENGES FOR ANIMAL PRODUCTION SYSTEMS8 th Int. Conference on <strong>LCA</strong> <strong>in</strong> the<br />
Agri-<strong>Food</strong> Sector, 1-4 Oct <strong>2012</strong><br />
Van Middelaar, C.E., Berentsen, P.B.M., Dijkstra, J., De Boer, I.J.M., <strong>2012</strong>b. Evaluation of a feed<strong>in</strong>g strategy to reduce greenhouse<br />
emissions <strong>in</strong> dairy farm<strong>in</strong>g: the level of analysis matters. (Submitted).<br />
Vell<strong>in</strong>ga, T.V., Hov<strong>in</strong>g, I.E., 2011. Maize silage for dairy cows: Mitigation of m<strong>et</strong>hane emissions can be offs<strong>et</strong> by land use change.<br />
Nutrient Cycl<strong>in</strong>g <strong>in</strong> Agroecosystems 89: 413-426.<br />
Zeh<strong>et</strong>meier, M., Baudracco, J., Hoffmann, H., Heißenhuber, A., <strong>2012</strong>. Does <strong>in</strong>creas<strong>in</strong>g milk yield reduce greenhouse gas emissions?<br />
A system approach. Animal 6 (1), 154–166.<br />
226
PLENARY SESSION 2: METHODOLOGICAL CHALLENGES FOR ANIMAL PRODUCTION SYSTEMS 8 th Int. Conference on<br />
<strong>LCA</strong> <strong>in</strong> the<br />
Agri-<strong>Food</strong> Sector, 1-4 Oct <strong>2012</strong><br />
Lessons learned from <strong>in</strong>tegrated environmental and socioeconomic life<br />
cycle assessments<br />
Jean-Michel Couture 1,* , Julie Parent 2 , Mia Lafonta<strong>in</strong>e 3 , Jean-Pierre Revér<strong>et</strong> 1,2<br />
1 Groupe AGECO, 2014 Cyrille-Duqu<strong>et</strong> suite 307, Quebec, QC, G1N 4N6, Canada<br />
2 International Chair on Life Cycle, Polytechnique/ESG UQAM; Department of Strategy, Social and Environmental Responsibility,<br />
Suite R-3555, École des sciences de la gestion, Montreal, QC, H2X 3X2, Canada<br />
3 Quantis, 395 Laurier Ouest, Montreal, QC, H2V 2K3, Canada<br />
Correspond<strong>in</strong>g author. E-mail: jean-michel.couture@groupeageco.ca<br />
ABSTRACT<br />
An <strong>in</strong>tegrated Social and Environmental <strong>LCA</strong> was conducted to assess the environmental and socioeconomic performance of Canadian<br />
milk production. Dur<strong>in</strong>g the project, a number of issues and challenges arose from the <strong>in</strong>tegration of the two <strong>LCA</strong> techniques.<br />
This presentation focuses on the key f<strong>in</strong>d<strong>in</strong>gs and lessons learned from the study regard<strong>in</strong>g the procedural and m<strong>et</strong>hodological <strong>in</strong>tegration<br />
of E<strong>LCA</strong> and S<strong>LCA</strong>. It takes stock of the difficulties faced by realisation teams at the ma<strong>in</strong> stages of the <strong>LCA</strong> study and the<br />
benefits result<strong>in</strong>g from such an <strong>in</strong>tegrated approach, thus contribut<strong>in</strong>g to the reflexion and works already started towards the development<br />
of Life Cycle Susta<strong>in</strong>ability Assessment m<strong>et</strong>hodology.<br />
Keywords: Life Cycle Susta<strong>in</strong>ability Assessment, social life cycle assessment, environmental life cycle assessment, dairy production,<br />
Canada<br />
1. Introduction<br />
Over the years, the Life Cycle Assessment (<strong>LCA</strong>) approach has become one of the ma<strong>in</strong> tools used to<br />
provide mark<strong>et</strong> actors with the <strong>in</strong>formation needed to turn toward more susta<strong>in</strong>able consumption and production<br />
practices. Initially developed to assess the potential environmental impacts of a product through the<br />
Environmental Life Cycle Assessment (E<strong>LCA</strong>), this approach has s<strong>in</strong>ce evolved to encompass all three pillars<br />
of susta<strong>in</strong>ability by comb<strong>in</strong><strong>in</strong>g E<strong>LCA</strong> with Life Cycle Cost<strong>in</strong>g (LCC) – a technique assess<strong>in</strong>g the cost<br />
implications of a product’s life cycle – and Social Life Cycle Assessment (S<strong>LCA</strong>) – a more recent technique<br />
assess<strong>in</strong>g the social and socioeconomic impacts of a product’s life cycle.<br />
However, despite their common conceptual foundations, these <strong>LCA</strong> tools still lack the <strong>in</strong>tegrated framework<br />
that would guide a comprehensive assessment of a product’s susta<strong>in</strong>ability. Although the<br />
UNEP/SETAC Life Cycle Initiative is currently develop<strong>in</strong>g a Life Cycle Susta<strong>in</strong>ability Assessment (LCSA)<br />
m<strong>et</strong>hodology, further developments are admittedly needed, <strong>in</strong> particular based on f<strong>in</strong>d<strong>in</strong>gs and lessons<br />
learned from cases comb<strong>in</strong><strong>in</strong>g E<strong>LCA</strong>, LCC and S<strong>LCA</strong> (UNEP/SETAC <strong>2012</strong>, 45).<br />
<strong>LCA</strong> and its different forms are part of the environmental assessment toolbox, and the question of <strong>in</strong>tegration<br />
<strong>in</strong> environmental assessment has been debated for some years about other tools such as Environmental<br />
Impact Assessment (EIA) and Strategic Environmental Assessment (SEA) (Revér<strong>et</strong> 2011). There are many<br />
coexist<strong>in</strong>g understand<strong>in</strong>gs of what “Integrated Assessment” is (Hack<strong>in</strong>g and Guthrie, 2007). For <strong>in</strong>stance,<br />
Lee (2006) identifies three dist<strong>in</strong>ct types of <strong>in</strong>tegration: 1) Horizontal: br<strong>in</strong>g<strong>in</strong>g tog<strong>et</strong>her different types or<br />
categories of impacts; 2) Vertical: l<strong>in</strong>k<strong>in</strong>g separate assessments performed at different levels/stages; and 3)<br />
Analytical: <strong>in</strong>tegration of assessments <strong>in</strong>to decision-mak<strong>in</strong>g. Regard<strong>in</strong>g a project’s execution, Eggenberger<br />
and Partidário (2000) identify three different forms of <strong>in</strong>tegration that were also tested and used by Revér<strong>et</strong><br />
<strong>et</strong> al., (2000: 1) Substantive: constant consideration of social, environmental and economic (SEE) dimensions<br />
<strong>in</strong> all aspects of the studies; 2) M<strong>et</strong>hodological: <strong>in</strong>tegration of concepts and applications; and 3) Procedural:<br />
<strong>in</strong>tegration of SEE dimensions <strong>in</strong> the project’s plann<strong>in</strong>g and management. This last category is of<br />
particular <strong>in</strong>terest as it was developed to analyse how <strong>in</strong>tegrated other forms of environmental valuation are,<br />
namely EIA and SEA.<br />
On the basis of the def<strong>in</strong>ition of ‘<strong>in</strong>tegration’ given by Eggenberger and Partidario (2000), this paper discusses<br />
the ‘<strong>in</strong>tegration’ of Social and Environmental <strong>LCA</strong>s of the Canadian dairy sector, a study that we<br />
recently carried out. This presentation takes stock of <strong>in</strong>tegration issues and challenges encountered <strong>in</strong> this<br />
project, consider<strong>in</strong>g both procedural and m<strong>et</strong>hodological perspectives. The economic dimension, which<br />
could have been assessed with a LCC, is not considered here as it was not identified as a priority by the client.<br />
2. Project overview<br />
As part of the Dairy Cluster research program, the Dairy Farmers of Canada (DFC), <strong>in</strong> collaboration with<br />
Quantis Canada, Group AGÉCO and the CIRAIG (The Interuniversity Research Centre for the Life Cycle of<br />
227
PLENARY SESSION 2: METHODOLOGICAL CHALLENGES FOR ANIMAL PRODUCTION SYSTEMS8 th Int. Conference on <strong>LCA</strong> <strong>in</strong> the<br />
Agri-<strong>Food</strong> Sector, 1-4 Oct <strong>2012</strong><br />
Products, Processes and Services), conducted an E<strong>LCA</strong> and S<strong>LCA</strong> of the Canadian dairy sector. The global<br />
objective of this study was to provide a comprehensive assessment of the susta<strong>in</strong>ability of the Canadian milk<br />
production sector. More specifically it aimed to:<br />
• Def<strong>in</strong>e the profile of environmental and socioeconomic impacts of the Canadian dairy sector over the<br />
life cycle of milk production (from cradle to farm gate);<br />
• Identify potential areas for further focus <strong>in</strong> improv<strong>in</strong>g the dairy sector’s overall susta<strong>in</strong>ability;<br />
• Provide an overall framework and build<strong>in</strong>g blocks to support comparison/benchmark with similar<br />
comp<strong>et</strong>itive products.<br />
Launched <strong>in</strong> 2010, the project was compl<strong>et</strong>ed <strong>in</strong> September <strong>2012</strong>. The ma<strong>in</strong> deliverables <strong>in</strong>clude an environmental<br />
profile of the average kilogram of milk produced <strong>in</strong> Canada, as well as an evaluation of the socioeconomic<br />
performance of the Canadian dairy sector. Overall, the <strong>LCA</strong> showed the exist<strong>in</strong>g commitment of<br />
dairy producers towards their supply cha<strong>in</strong>’s susta<strong>in</strong>ability, characterised by an overall good performance –<br />
both at the environmental and socioeconomic levels. At the <strong>in</strong>ternational level, the Canadian milk sector<br />
positions itself very well, with a relatively low carbon footpr<strong>in</strong>t and a water footpr<strong>in</strong>t among the best <strong>in</strong> prov<strong>in</strong>ces<br />
where there is no irrigation. While there is no benchmark available to compare the social engagement<br />
of the sector, the assessment shows that the Canadian dairy farms and their Boards are already socially<br />
committed corporate citizens <strong>in</strong> regards to many social issues.<br />
In addition to the assessment of the dairy sector’s performance, the m<strong>et</strong>hodological advances derived<br />
from this project are also of significant scientific <strong>in</strong>terest, especially <strong>in</strong> regards to the development of LCSA<br />
m<strong>et</strong>hodology. Although the project was not meant to be a LCSA, nor named as such, it contributed de facto<br />
to the development of the LCSA m<strong>et</strong>hodology thanks to the <strong>in</strong>tegration process – both at procedural and<br />
m<strong>et</strong>hodological levels – of E<strong>LCA</strong> and S<strong>LCA</strong> tools.<br />
3. Procedural <strong>in</strong>tegration<br />
An <strong>in</strong>itial dimension of the <strong>in</strong>tegration of E<strong>LCA</strong> and S<strong>LCA</strong> lies <strong>in</strong> the procedural approach. It refers to<br />
how an <strong>LCA</strong> project is conducted and managed when it deals with both environmental and social issues.<br />
Should it be conducted by one <strong>in</strong>tegrated team? In case of more than one team <strong>in</strong>volved, what k<strong>in</strong>d of bond<br />
should exist b<strong>et</strong>ween them? How should the knowledge and expertise be shared b<strong>et</strong>ween the environmental<br />
and social teams, and b<strong>et</strong>ween the teams and the client? These questions have no straightforward answers<br />
given the poor experience of the <strong>LCA</strong> community <strong>in</strong> this type of <strong>in</strong>tegration, but the lessons we have learned<br />
from the Canadian milk sector study provide some answers and highlights useful to other practitioners.<br />
This project was conducted by three teams, two of them part of consult<strong>in</strong>g firms (Groupe AGECO and<br />
Quantis) and the third one associated with a university research centre (CIRAIG). The three teams had already<br />
conducted jo<strong>in</strong>t <strong>LCA</strong> projects <strong>in</strong> the past, but none of this size. This project was hence the occasion to<br />
come tog<strong>et</strong>her and overcome new challenges <strong>in</strong> <strong>in</strong>tegrat<strong>in</strong>g E<strong>LCA</strong> and S<strong>LCA</strong>.<br />
The first challenge was <strong>in</strong>tegrat<strong>in</strong>g the teams’ expertise. While the three teams’ members shared a common<br />
understand<strong>in</strong>g of E<strong>LCA</strong> and S<strong>LCA</strong> approaches, no one mastered both m<strong>et</strong>hodological frameworks. This<br />
was primarily due to the novelty of the S<strong>LCA</strong> m<strong>et</strong>hodology supported by the still recent (<strong>in</strong> 2009)<br />
UNEP/SETAC Guidel<strong>in</strong>es (UNEP/SETAC, 2009). For this reason, one of the project’s underly<strong>in</strong>g objectives<br />
was to develop the S<strong>LCA</strong> m<strong>et</strong>hodology. The second reason follows from the first; while CIRAIG and Quantis<br />
are specialised <strong>in</strong> the conduct of E<strong>LCA</strong>s and hold a vast experience <strong>in</strong> that field, Groupe AGECO has<br />
expertise <strong>in</strong> the field of socioeconomic studies and surveys applied to the agrifood sector and has developed<br />
a grow<strong>in</strong>g expertise <strong>in</strong> S<strong>LCA</strong>. The team members’ profiles were hence different, with the E<strong>LCA</strong> teams composed<br />
mostly of eng<strong>in</strong>eers and the S<strong>LCA</strong> team of agricultural economists.<br />
This situation created a communication challenge, as each team had to become familiar with a new, y<strong>et</strong><br />
common semantic field and m<strong>et</strong>hodology. To overcome this issue, mutual tra<strong>in</strong><strong>in</strong>gs were offered to create a<br />
common understand<strong>in</strong>g of each tool’s concepts and function<strong>in</strong>g. Given that S<strong>LCA</strong> and E<strong>LCA</strong> teams were<br />
located <strong>in</strong> two distant cities, such exchanges, however, were rare. Discussions on a more regular basis would<br />
have benefited both groups.<br />
In contrast, these teams’ differ<strong>in</strong>g profiles were also a source of significant synergy, as their expertise was<br />
complementary <strong>in</strong> many ways. In particular, Groupe AGECO’s knowledge of the agricultural sector <strong>in</strong> general<br />
and of the Canadian dairy sector <strong>in</strong> particular was crucial. From the E<strong>LCA</strong> standpo<strong>in</strong>t, this expertise<br />
allowed adapt<strong>in</strong>g the impact assessment models accord<strong>in</strong>g to the sector’s most specific characteristics. It also<br />
gave access to site-specific data, more easily collected through a farm survey supervised by Groupe AGECO.<br />
This expertise was also crucial for develop<strong>in</strong>g the SCLA framework, given that a good understand<strong>in</strong>g of the<br />
sector’s characteristics and related socioeconomic issues is essential to identify the relevant issues of concern<br />
228
PLENARY SESSION 2: METHODOLOGICAL CHALLENGES FOR ANIMAL PRODUCTION SYSTEMS 8 th Int. Conference on<br />
<strong>LCA</strong> <strong>in</strong> the<br />
Agri-<strong>Food</strong> Sector, 1-4 Oct <strong>2012</strong><br />
to document and develop a comprehensive and relevant s<strong>et</strong> of socioeconomic <strong>in</strong>dicators. The socioeconomic<br />
background of the S<strong>LCA</strong> team also facilitated development of this new m<strong>et</strong>hodology.<br />
The <strong>in</strong>volvement of the research centre was also highly beneficial to the project. The team contributed to<br />
the m<strong>et</strong>hodological and theor<strong>et</strong>ical development of both environmental and socioeconomic frameworks. Its<br />
participation allowed the two consult<strong>in</strong>g groups to focus on calculat<strong>in</strong>g the results, while also be<strong>in</strong>g <strong>in</strong>volved<br />
<strong>in</strong> the m<strong>et</strong>hodological development, especially for the S<strong>LCA</strong> assessment framework. In turn, it benefited<br />
from the work and expertise of the two other teams.<br />
In perform<strong>in</strong>g the assignment, all efforts were made to conduct the socioeconomic and environmental<br />
parts simultaneously. Daily work was carried out separately with<strong>in</strong> each team, but a number of tasks were<br />
done with close collaboration, such as farm data collection, to ensure that the farmers who contributed would<br />
not suffer from “survey fatigue” by receiv<strong>in</strong>g too many requests for data that could be gathered at once.<br />
S<strong>in</strong>ce the E<strong>LCA</strong> and S<strong>LCA</strong> frameworks used <strong>in</strong> this project were mostly <strong>in</strong>dependent from each other (cf.<br />
section 4), it was not possible to prevent the three teams from work<strong>in</strong>g <strong>in</strong> silos, especially dur<strong>in</strong>g the framework<br />
development phase. This situation, however, did not impair the results’ quality or relevance. Rather, it<br />
attests to the limitations encountered dur<strong>in</strong>g the <strong>in</strong>tegration of E<strong>LCA</strong> and S<strong>LCA</strong> m<strong>et</strong>hodologies.<br />
4. M<strong>et</strong>hodological <strong>in</strong>tegration<br />
Although the UNEP/SETAC Guidel<strong>in</strong>es specify that a S<strong>LCA</strong> must follow the ISO 14040 and 14044<br />
norms developed for E<strong>LCA</strong>, it does not mean that a S<strong>LCA</strong> can be readily <strong>in</strong>tegrated or even articulated with<br />
an E<strong>LCA</strong>. Several m<strong>et</strong>hodological issues arose dur<strong>in</strong>g the project implementation. Faced with two doma<strong>in</strong>s<br />
that have evolved separately and are based on very different discipl<strong>in</strong>es, the teams found that some concepts<br />
did not have exactly the same mean<strong>in</strong>g and needed further explanation to avoid misunderstand<strong>in</strong>gs. This<br />
section highlights similarities and differences <strong>in</strong> the s<strong>et</strong>t<strong>in</strong>g of m<strong>et</strong>hodological ass<strong>et</strong>s of both tools. Many are<br />
already identified <strong>in</strong> the UNEP/SETAC Guidel<strong>in</strong>es for S<strong>LCA</strong>. However, as m<strong>et</strong>hodological choices were<br />
made to conduct the project, it is relevant to r<strong>et</strong>urn to this issue <strong>in</strong> a case-study context.<br />
4.1. Goal and scope<br />
Accord<strong>in</strong>g to ISO norm 14044 (2006), “the goal and scope of an <strong>LCA</strong> shall be clearly def<strong>in</strong>ed and shall<br />
be consistent with the <strong>in</strong>tended application”. Therefore, identify<strong>in</strong>g its <strong>in</strong>tended application is the po<strong>in</strong>t of<br />
departure of an <strong>LCA</strong> study. All other m<strong>et</strong>hodological choices – made <strong>in</strong> the context of the “scope” def<strong>in</strong>ition<br />
– hence have to rema<strong>in</strong> consistent with it. This holds true for both the environmental and social dimensions.<br />
One ma<strong>in</strong> objective of the project was to identify potential areas of further focus for improv<strong>in</strong>g the Canadian<br />
dairy sector’s susta<strong>in</strong>ability. In the E<strong>LCA</strong> perspective, this <strong>in</strong>volves identify<strong>in</strong>g hotspots to targ<strong>et</strong> mitigation<br />
measures and reduce the potential environmental and human health impacts of the product – <strong>in</strong> this<br />
case milk – throughout its life cycle. The same is true <strong>in</strong> the S<strong>LCA</strong> perspective. The assessment aims at identify<strong>in</strong>g<br />
potential and real social hotspots to be able to provide recommendations for further improvement of<br />
the system’s overall socioeconomic performance for its stakeholders. While both E<strong>LCA</strong> and S<strong>LCA</strong> are <strong>in</strong>tended<br />
to identify hotspots, the result<strong>in</strong>g actions of this identification differ b<strong>et</strong>ween them. In E<strong>LCA</strong>, identification<br />
of environmental hotspots of milk production is meant to guide changes <strong>in</strong> agroenvironmental practices<br />
and <strong>in</strong>put substitutions, regardless of the suppliers. In S<strong>LCA</strong>, identification of social hotspots aims to<br />
guide improvements <strong>in</strong> farmers’ and suppliers’ behaviours, regardless of the nature of the <strong>in</strong>puts and processes<br />
<strong>in</strong>volved.<br />
These two <strong>in</strong>tended applications, while only slightly different, non<strong>et</strong>heless had a significant impact on<br />
how the two frameworks were developed, start<strong>in</strong>g with their scope. The scope <strong>in</strong>cludes several m<strong>et</strong>hodological<br />
param<strong>et</strong>ers <strong>in</strong>fluenc<strong>in</strong>g the assessment and, consequently, the results. UNEP/SETAC Guidel<strong>in</strong>es do not<br />
mention how the scope of a S<strong>LCA</strong> should fit that of an E<strong>LCA</strong> when both are conducted tog<strong>et</strong>her. It is however<br />
acknowledged that given S<strong>LCA</strong> characteristics, its scope might not necessarily be the same or totally<br />
<strong>in</strong>tegrated with that of E<strong>LCA</strong>.<br />
This was notably the case with the product system, which differed b<strong>et</strong>ween E<strong>LCA</strong> and S<strong>LCA</strong>; while the<br />
former consisted of technical processes, the latter consisted of the bus<strong>in</strong>esses (and their geographic location)<br />
responsible for carry<strong>in</strong>g out those processes. This difference was consistent with the <strong>in</strong>tended application of<br />
the S<strong>LCA</strong> more focused on the behaviour of the enterprises <strong>in</strong>volved <strong>in</strong> the value cha<strong>in</strong>. Indeed, it is broadly<br />
recognised <strong>in</strong> S<strong>LCA</strong> literature that bus<strong>in</strong>esses are the relevant unit process (Dreyer <strong>et</strong> al., 2006; Macombe <strong>et</strong><br />
al., 2010; Parent J. Cucuzzella C. Revér<strong>et</strong> J.P., 2010; Spillemaeckers <strong>et</strong> al., 2004).<br />
229
PLENARY SESSION 2: METHODOLOGICAL CHALLENGES FOR ANIMAL PRODUCTION SYSTEMS8 th Int. Conference on <strong>LCA</strong> <strong>in</strong> the<br />
Agri-<strong>Food</strong> Sector, 1-4 Oct <strong>2012</strong><br />
Another param<strong>et</strong>er to be considered is the choice of the functional unit (FU). As stated <strong>in</strong> the Guidel<strong>in</strong>es,<br />
“specification of the functional unit and the reference flows is essential to build and model the product system”<br />
(UNEP/SETAC 2009; 53). In the study, the S<strong>LCA</strong> referred to the same FU as the E<strong>LCA</strong>; however, the<br />
FU served different purposes <strong>in</strong> each. In the E<strong>LCA</strong>, it allowed quantification of the ma<strong>in</strong> material ass<strong>et</strong>s required<br />
to fulfil the primary function of the system, which allowed quantification of all the material and energy<br />
flows of the system and, hence, the elementary flows. In the S<strong>LCA</strong>, it was <strong>in</strong>stead used to list the ma<strong>in</strong><br />
<strong>in</strong>puts and services <strong>in</strong>volved <strong>in</strong> the milk’s life cycle and to identify the bus<strong>in</strong>esses provid<strong>in</strong>g them. As a consequence,<br />
the socioeconomic performance assessed was not necessarily quantitatively related to the FU, as <strong>in</strong><br />
the E<strong>LCA</strong> (section 4.3).<br />
4.2. Inventory<br />
In E<strong>LCA</strong>, the <strong>in</strong>ventory phase <strong>in</strong>cludes data collection, validation, relat<strong>in</strong>g the <strong>in</strong>ventory to the FU and<br />
aggregation. These phases were not readily repeatable <strong>in</strong> the S<strong>LCA</strong>. First, as mentioned above, bus<strong>in</strong>ess behaviours<br />
were not directly and quantitatively related to the FU. Moreover, aggregation could not take place<br />
before the assessment, s<strong>in</strong>ce the social norms aga<strong>in</strong>st which bus<strong>in</strong>ess behaviours were benchmarked were<br />
site-specific and varied across regions and supply<strong>in</strong>g sectors. Therefore, the S<strong>LCA</strong> <strong>in</strong>ventory phase <strong>in</strong>cluded<br />
only data collection and validation.<br />
In both cases, site-specific data were used to document processes and behaviours occurr<strong>in</strong>g on dairy<br />
farms and generic ones for those occurr<strong>in</strong>g upstream <strong>in</strong> the life cycle. But the type of the data collected differed<br />
significantly, as did the nature of the sources consulted. In E<strong>LCA</strong>, specific data are used to g<strong>et</strong> a b<strong>et</strong>ter<br />
idea of the processes occurr<strong>in</strong>g at each life cycle stage, and generic databases exist to document those processes.<br />
In S<strong>LCA</strong>, both the behaviours of organisations and the benchmarks aga<strong>in</strong>st which they are assessed<br />
need to be documented. As there are few exist<strong>in</strong>g databases cover<strong>in</strong>g socioeconomic issues at a bus<strong>in</strong>ess or<br />
sectorial level, some site-specific data are hence needed to perform a d<strong>et</strong>ailed analysis. Proxies (samples of<br />
bus<strong>in</strong>esses representative of the sector) can also be used to <strong>in</strong>fer how the bus<strong>in</strong>esses actually <strong>in</strong>volved <strong>in</strong> the<br />
life cycle behave. This can be done by us<strong>in</strong>g sectorial or national data about the issues of concern assessed.<br />
In that case, however, potential rather than actual behaviours of bus<strong>in</strong>esses are assessed. Given that sitespecific<br />
data were only collected at the farm level <strong>in</strong> the S<strong>LCA</strong> of Canadian milk, upstream suppliers’ behaviours<br />
were hence documented us<strong>in</strong>g proxies, and this led to the development of two dist<strong>in</strong>ct assessment<br />
frameworks (section 4.3).<br />
4.3. Impact assessment<br />
Whereas an E<strong>LCA</strong> assesses environmental impacts created by quantified stressors generated by a FU, assessment<br />
of bus<strong>in</strong>ess behaviours <strong>in</strong> an S<strong>LCA</strong> refers to “performance reference po<strong>in</strong>ts” (PRP) to benchmark<br />
observed behaviours aga<strong>in</strong>st recognised or expected social norms. Assessment of bus<strong>in</strong>ess behaviours based<br />
on expected behaviours or expected results of behaviours, def<strong>in</strong>ed as PRP <strong>in</strong> the Guidel<strong>in</strong>es (UNEP-SETAC,<br />
2009), is broadly used (Ciroth and Franze, 2011; Foolmaun and Ramjeeawon, <strong>2012</strong>; Ugaya, <strong>2012</strong>).<br />
More specifically, two types of social assessments were conducted depend<strong>in</strong>g on the nature of data collected<br />
(site-specific or generic). In the latter, farm supplier behaviours were assessed aga<strong>in</strong>st <strong>in</strong>ternationally<br />
recognised social norms to identify potential social hotspots (i.e., the possibility of encounter<strong>in</strong>g risky behaviours<br />
which might negatively impact stakeholders). This approach was named potential hotspot analysis. In<br />
the former, an approach named (social) “specific analysis” was conducted <strong>in</strong>stead by assess<strong>in</strong>g the current<br />
behaviour of dairy farmers to evaluate their degree of social responsibility towards their stakeholders. The<br />
use of some comprehensive, high-quality data and relevant PRPs allowed the assessment of not only risky<br />
behaviours, but also socially committed ones, rated with a four-level semi-quantitative scale (i.e., risky,<br />
compliant, proactive, committed behaviour) developed dur<strong>in</strong>g the study. This approach, allow<strong>in</strong>g semiquantitative<br />
evaluation of the socioeconomic performance of behaviours of bus<strong>in</strong>esses <strong>in</strong>volved <strong>in</strong> the Canadian<br />
milk life cycle, differs significantly from that used <strong>in</strong> E<strong>LCA</strong>. As a consequence, it has a significant impact<br />
on <strong>in</strong>tegration and <strong>in</strong>terpr<strong>et</strong>ation of results.<br />
4.4. Interpr<strong>et</strong>ation<br />
Both the E<strong>LCA</strong> and S<strong>LCA</strong> identified hotspots on which the DFC and its members could act. Recommendations<br />
were formulated to foster practices m<strong>in</strong>imis<strong>in</strong>g both the negative environmental and social impacts<br />
and improv<strong>in</strong>g the sector’s overall environmental and socioeconomic performance. But given the nature of<br />
230
PLENARY SESSION 2: METHODOLOGICAL CHALLENGES FOR ANIMAL PRODUCTION SYSTEMS 8 th Int. Conference on<br />
<strong>LCA</strong> <strong>in</strong> the<br />
Agri-<strong>Food</strong> Sector, 1-4 Oct <strong>2012</strong><br />
the two techniques, their results and recommendations could not be fully <strong>in</strong>tegrated. While some <strong>in</strong>ferences<br />
were made, such as that behav<strong>in</strong>g <strong>in</strong> a more socially responsible manner could decrease dairy farm environmental<br />
impacts, no causal effect b<strong>et</strong>ween socioeconomic and environmental performances could be established.<br />
The two frameworks, however, fulfilled their <strong>in</strong>tended application <strong>in</strong> a comprehensive and mean<strong>in</strong>gful<br />
way. Adjust<strong>in</strong>g the S<strong>LCA</strong> framework to obta<strong>in</strong> only results that could be <strong>in</strong>tegrated with the E<strong>LCA</strong>, for<br />
example us<strong>in</strong>g only quantitative data related to the FU, would have significantly reduced the scope and compl<strong>et</strong>eness<br />
of the assessment.<br />
As the Guidel<strong>in</strong>es po<strong>in</strong>t out, “the ultimate objective for conduct<strong>in</strong>g a S<strong>LCA</strong> is to promote improvement of<br />
social conditions and of the overall socioeconomic performance of a product throughout its life cycle for all<br />
of its stakeholders” (UNEP/SETAC 2009; 50). This was also the project’s objective. Based on our experience,<br />
it seems that there are important trade-offs to consider regard<strong>in</strong>g the tools’ <strong>in</strong>tended application to fully<br />
<strong>in</strong>tegrate the E<strong>LCA</strong> and S<strong>LCA</strong> m<strong>et</strong>hodologies.<br />
5. Conclusion<br />
Conduct<strong>in</strong>g a jo<strong>in</strong>t E<strong>LCA</strong> and S<strong>LCA</strong> raises <strong>in</strong>terest<strong>in</strong>g challenges and opportunities, as shown by this<br />
project. On the procedural side, there were many benefits ga<strong>in</strong>ed from conduct<strong>in</strong>g them tog<strong>et</strong>her, especially<br />
the dialogue that took place b<strong>et</strong>ween the E<strong>LCA</strong> and S<strong>LCA</strong> practitioners and researchers. The fact that the<br />
three teams were composed of members of various academic backgrounds hold<strong>in</strong>g complementary expertise<br />
also contributed to develop<strong>in</strong>g a coherent framework adapted to the client’s needs. The biggest procedural<br />
challenges were m<strong>et</strong> at the beg<strong>in</strong>n<strong>in</strong>g of the project and related to mutual misunderstand<strong>in</strong>g of each tool’s<br />
function<strong>in</strong>g. This issue was overcome by the end of the project, each team now hav<strong>in</strong>g a strong and last<strong>in</strong>g<br />
understand<strong>in</strong>g of both approaches. While the physical distance b<strong>et</strong>ween the SCLA and E<strong>LCA</strong> teams was<br />
som<strong>et</strong>imes challeng<strong>in</strong>g and encouraged work<strong>in</strong>g <strong>in</strong> silos, it did not significantly impact the conduct of the<br />
project.<br />
The lessons learned on the m<strong>et</strong>hodological side are also of significant <strong>in</strong>terest. As the project’s objective<br />
was to identify potential areas for further improv<strong>in</strong>g the Canadian dairy sector’s susta<strong>in</strong>ability, conduct<strong>in</strong>g<br />
the S<strong>LCA</strong> and E<strong>LCA</strong> tog<strong>et</strong>her provided the sector with a comprehensive and coherent roadmap to improve<br />
its overall environmental and socioeconomic performance. This project displayed that the <strong>in</strong>tended applications<br />
of E<strong>LCA</strong> and S<strong>LCA</strong> are <strong>in</strong>deed complementary and contribute, when conducted tog<strong>et</strong>her, to progress<br />
towards susta<strong>in</strong>ability. Our experience shows, however, that the m<strong>et</strong>hodological <strong>in</strong>tegration required is not<br />
simple. To fulfill each tool’s purpose, <strong>in</strong>dependent frameworks were needed. Work<strong>in</strong>g differently could have<br />
impaired one or both assessments. This raises questions about the development of LCSA. While a stronger<br />
<strong>in</strong>tegration of <strong>LCA</strong> techniques is needed to progress towards susta<strong>in</strong>ability, such <strong>in</strong>tegration must be done <strong>in</strong><br />
accordance with each technique’s m<strong>et</strong>hodological requirements.<br />
6. References<br />
Ciroth, A. and Franze, J., 2011. Conduct<strong>in</strong>g a Social <strong>LCA</strong>. Workshop on Social Aspects of Products Over the Whole Life Cycle,<br />
Berl<strong>in</strong>.<br />
Dreyer, L., Hauschild, M., Schierbeck, J., 2010. Characterisation of social impacts <strong>in</strong> <strong>LCA</strong> - Part 1: Development of <strong>in</strong>dicators for<br />
labour rights. Inter. J. Life Cycle Ass., 15(3), 247-259.<br />
Foolmaun, R. and Ramjeeawon, T., <strong>2012</strong>. Comparative life cycle assessment and social life cycle assessment of used poly<strong>et</strong>hylene<br />
terephthalate (PET) bottles <strong>in</strong> Mauritius. Int. J. Life Cycle Ass., 1-17.<br />
Hack<strong>in</strong>g, T., Guthrie, P., 2007. A framework for clarify<strong>in</strong>g the mean<strong>in</strong>g of Triple Bottom-L<strong>in</strong>e, Integrated, and Susta<strong>in</strong>abilityAssessment.<br />
J. Env. Imp. Ass. Rev., 28(2-3), 73-89.<br />
Lee, N. 2006. Bridg<strong>in</strong>g the gap b<strong>et</strong>ween theory and practice <strong>in</strong> <strong>in</strong>tegrated assessment. J. Env. Imp. Ass. Rev., 26(1), 57-78.<br />
ISO (International Organization for Standardization), 2006. ISO 14040, Environmental management - Life cycle assessment - Pr<strong>in</strong>ciples<br />
and framework.<br />
ISO (International Organization for Standardization), 2006. ISO 14044, Environmental management - Life cycle assessment - Requirements<br />
and guidel<strong>in</strong>es.<br />
Macombe, C., Fesch<strong>et</strong>, P., Garrabé, M., Loeill<strong>et</strong>, D., 2010. Report<strong>in</strong>g the social <strong>in</strong>dicators to the functional unit for food product.<br />
Theor<strong>et</strong>ical contribution regard<strong>in</strong>g the collection of relevant data. 7th International Conference on Life Cycle Assessment <strong>in</strong> the<br />
Agri-<strong>Food</strong> Sector. Bari: Italy.<br />
Parent J., C Cucuzella, JP Revér<strong>et</strong>, 2010. Impact assessment <strong>in</strong> S<strong>LCA</strong>: sort<strong>in</strong>g the sLCIA m<strong>et</strong>hods accord<strong>in</strong>g to their outcomes <strong>in</strong><br />
International Journal of Life Cycle Assessment, Published onl<strong>in</strong>e 19-01-2010<br />
Parent, J., C. Cucuzzella, J.P. Revér<strong>et</strong>, <strong>2012</strong>. Reflect<strong>in</strong>g on the role and the life cycle perspective <strong>in</strong> <strong>LCA</strong> and S<strong>LCA</strong> used for Susta<strong>in</strong>able<br />
production and consumption. International Journal of Life Cycle Assessment Published onl<strong>in</strong>e 09-08-<strong>2012</strong><br />
Eggenberger, M., Partidário, M.R., 2000. Development of a framework to assist the <strong>in</strong>tegration of environmental, social and economic<br />
issues <strong>in</strong> spatial plann<strong>in</strong>g. Imp. Ass. And Project Appr., September 2000. 201-207.<br />
Revér<strong>et</strong>, J.P., Sambo, C., V<strong>in</strong>cel<strong>et</strong>te, M. Taillon, B., 2000. An <strong>in</strong>tegrated SEIA for a large m<strong>in</strong><strong>in</strong>g project <strong>in</strong> South East Madagascar:<br />
Challenges and approaches. International Association for Impact Assessment Annual Conference, Hong Kong.<br />
231
PLENARY SESSION 2: METHODOLOGICAL CHALLENGES FOR ANIMAL PRODUCTION SYSTEMS8 th Int. Conference on <strong>LCA</strong> <strong>in</strong> the<br />
Agri-<strong>Food</strong> Sector, 1-4 Oct <strong>2012</strong><br />
Revér<strong>et</strong>, J.P., 2011. Développement durable <strong>et</strong> évaluation de la durabilité/soutenabilité, 3ème conférence méthodologique de l'Institut<br />
wallon de l'évaluation, de la prospective <strong>et</strong> de la statistique. December 2011.<br />
Spillemaeckers, S., Vanhoutte, G., 2006. A Product Susta<strong>in</strong>ability Assessment. Management Models for Corporate Social Responsibility,<br />
Spr<strong>in</strong>ger Berl<strong>in</strong> Heidelberg, 257-264.<br />
Ugaya, C., M., L., <strong>2012</strong>. Social Life Cycle Assessment of Natura's cocoa soap. Social <strong>LCA</strong> Workshop <strong>2012</strong>, Berl<strong>in</strong>.<br />
UNEP/SETAC, 2009. Guidel<strong>in</strong>es for Social Life Cycle Assessment of Products. United Nations Environment Programme. Paris.<br />
UNEP/SETAC, <strong>2012</strong>. Toward a Life Cycle Susta<strong>in</strong>ability Assessment: Mak<strong>in</strong>g Informed Choices on Products. Prelim<strong>in</strong>ary Version.<br />
United Nations Environment Programme. Paris.<br />
232
PLENARY SESSION 2: METHODOLOGICAL CHALLENGES FOR ANIMAL PRODUCTION SYSTEMS 8 th Int. Conference on<br />
<strong>LCA</strong> <strong>in</strong> the<br />
Agri-<strong>Food</strong> Sector, 1-4 Oct <strong>2012</strong><br />
Susta<strong>in</strong>ability assessment of U.S. dairy: environmental, economic and<br />
social<br />
G<strong>in</strong>a Vickery-Niederman 4 , Greg Thoma 1* , Jennie Popp 2 , Marty Matlock 2 , Cather<strong>in</strong>e Benoît-Norris 3 , David<br />
Shonnard 5,6 , Felix Adom 5,6 , Eric Cumm<strong>in</strong>gs 2 , Zara Niederman 2<br />
1<br />
Ralph E. Mart<strong>in</strong> Department of Chemical Eng<strong>in</strong>eer<strong>in</strong>g, University of Arkansas, Fay<strong>et</strong>teville, AR, USA<br />
2<br />
Center for Agricultural and Rural Susta<strong>in</strong>ability, Division of Agriculture, University of Arkansas, Fay<strong>et</strong>teville, AR, USA<br />
3<br />
New Earth, York, ME, USA<br />
4<br />
Department of Environmental Dynamics, University of Arkansas, Fay<strong>et</strong>teville, AR, USA<br />
5<br />
Department of Chemical Eng<strong>in</strong>eer<strong>in</strong>g, Michigan Technological University, Houghton, MI, USA<br />
6<br />
Susta<strong>in</strong>able Futures Institute, Michigan Technological University, Houghton, MI, USA<br />
*Correspond<strong>in</strong>g author. E-mail: gthoma@uark.edu<br />
ABSTRACT<br />
This assessment exam<strong>in</strong>es US dairy’s environmental and social impacts <strong>in</strong> light of dairy’s contribution to the US economy. The study<br />
<strong>in</strong>cludes a life cycle assessment (<strong>LCA</strong>) of fluid milk consumed <strong>in</strong> the US, an economic Input-Output (IO) analysis for US dairy, a<br />
social scop<strong>in</strong>g assessment (SSA) of the global dairy supply cha<strong>in</strong> and a literature review of the social impacts of US dairy production.<br />
The <strong>LCA</strong> identifies potential environmental impacts for the farm<strong>in</strong>g stages of the fluid milk life cycle, most notably <strong>in</strong> the categories:<br />
land occupation, terrestrial acidification/nitrification and human toxicity. Post-farm gate activities contribute to terrestrial and aquatic<br />
ecotoxicity, ozone depl<strong>et</strong>ion and m<strong>in</strong>eral extraction. The social analysis identifies areas of social risk related to a consolidat<strong>in</strong>g dairy<br />
<strong>in</strong>dustry. The economic analysis f<strong>in</strong>ds that <strong>in</strong> addition to direct economic contributions, the US dairy <strong>in</strong>dustry contributes greatly to<br />
employment, labour <strong>in</strong>come and value added <strong>in</strong> other agricultural and nonagricultural nodes of the US dairy supply cha<strong>in</strong>.<br />
Historically soci<strong>et</strong>y has placed great emphasis on economic contributions and the personal value of consumption relative to potential<br />
environmental and social impacts. More recently, our relative ability to p<strong>in</strong>po<strong>in</strong>t environmental impacts for complex life cycles may<br />
lead to the over-emphasis of environmental factors relative to socio-economic impacts. Advancements <strong>in</strong> susta<strong>in</strong>ability assessment<br />
would allow us to quantitatively identify relationships b<strong>et</strong>ween environmental, social and economic impacts of a common product<br />
system. Practical tools, such as unit process-level economic and social databases would advance the field of susta<strong>in</strong>ability assessment<br />
<strong>in</strong> this direction.<br />
Keywords: dairy, susta<strong>in</strong>ability, LCSA, Input-Output, Social <strong>LCA</strong><br />
1. Introduction<br />
This paper exam<strong>in</strong>es the environmental, economic and social impacts of US dairy. Explor<strong>in</strong>g these “three<br />
pillars of susta<strong>in</strong>ability” (UN GA, 2005) alongside one another encourages a more comprehensive and balanced<br />
view of product susta<strong>in</strong>ability. The three pillar assessment presented below identifies the potential<br />
environmental and social concerns of US dairy alongside dairy’s contribution to the US economy.<br />
2. M<strong>et</strong>hods<br />
The environmental analysis uses <strong>LCA</strong> to identify environmental impacts for the cradle-to-grave life cycle of<br />
fluid milk. The primary time frame of the assessment was 2007-2008. The <strong>LCA</strong> was structured follow<strong>in</strong>g<br />
ISO 14040(44):2006 standards and modeled us<strong>in</strong>g SimaPro Software (version 7.2) (PRé Consultants, Amersfoot,<br />
N<strong>et</strong>herlands). The functional unit was 1 kg of fluid milk consumed <strong>in</strong> the US, where a national “average”<br />
milk was created as the sales-volume-weighted average of four milk fat content vari<strong>et</strong>ies. Product loss<br />
<strong>in</strong> the supply cha<strong>in</strong>, <strong>in</strong>clud<strong>in</strong>g wasted or spoiled milk by consumers and out-of-date milk at r<strong>et</strong>ail, required a<br />
reference flow of 1.42 kg milk from the farm to achieve the functional unit. Because every farm produces<br />
milk with different fat and prote<strong>in</strong> composition, we normalised on-farm production to a standard milk us<strong>in</strong>g<br />
the National Research Council approach for fat-prote<strong>in</strong> corrected-milk (FPCM).<br />
A significant quantity of the <strong>in</strong>formation for this analysis was generated as part of a GHG emissions study<br />
for US dairy (Thoma <strong>et</strong> al., <strong>2012</strong>) and augmented to enable broader LCIA with published data from peer<br />
reviewed literature and the USDA National Agricultural Statistics Service. Additional <strong>in</strong>formation was obta<strong>in</strong>ed<br />
through discussions with <strong>in</strong>dustry representatives and other experts. The cut-off criterion for the study,<br />
generally applied at the scale of an <strong>in</strong>dividual life cycle stage, was as follows: flows contribut<strong>in</strong>g less than<br />
1% of relevant impacts could be omitted from the model; however, small flows were not omitted if data were<br />
readily available. The EcoInvent life cycle <strong>in</strong>ventory database provided data for background unit processes<br />
(Frischknecht & Rebitzer, 2005). The life cycle impact assessment m<strong>et</strong>hodology, Impact 2002+ (Jolli<strong>et</strong> <strong>et</strong> al.,<br />
2003), was used to assess environmental impacts.<br />
The economic analysis uses Input-Output (IO) Analysis to exam<strong>in</strong>e how dairy production, dairy process<strong>in</strong>g<br />
and dairy-related activities contribute to three areas of the US economy: employment, labour <strong>in</strong>come and<br />
value-added. Employment measures the number of wage-, salary- and self-employed workers <strong>in</strong> the sector,<br />
233
PLENARY SESSION 2: METHODOLOGICAL CHALLENGES FOR ANIMAL PRODUCTION SYSTEMS8 th Int. Conference on <strong>LCA</strong> <strong>in</strong> the<br />
Agri-<strong>Food</strong> Sector, 1-4 Oct <strong>2012</strong><br />
labour <strong>in</strong>come <strong>in</strong>cludes wages (worker salaries, payments and fr<strong>in</strong>ge benefits) and propri<strong>et</strong>ary <strong>in</strong>come (all<br />
<strong>in</strong>come received by self-employed <strong>in</strong>dividuals). Value added to the US economy is a measure of labour <strong>in</strong>come<br />
plus <strong>in</strong>direct taxes (excise, sales and property taxes, as well as, fees, f<strong>in</strong>es, licenses and permits) and<br />
other property-type <strong>in</strong>come (dividends, <strong>in</strong>terest payments, rents and profits). With<strong>in</strong> these three areas, the<br />
economic IO analysis measures the direct and <strong>in</strong>direct economic impacts of the US dairy sector. Direct impacts<br />
stem from dairy production and process<strong>in</strong>g. Indirect economic effects arise from the dairy sector’s purchases<br />
of goods and services from other sectors.<br />
The economic IO analysis was conducted us<strong>in</strong>g the IMPLAN IO software for the year 2008 (MIG, M<strong>in</strong>nesota,<br />
US). The US dairy <strong>in</strong>dustry was comprised of five IMPLAN sectors: Dairy cattle and milk production,<br />
Fluid milk and butter manufactur<strong>in</strong>g, Cheese manufactur<strong>in</strong>g, Dry-condensed and evaporated dairy products<br />
and Ice cream and frozen dessert manufactur<strong>in</strong>g. Dairy’s contribution to both the US economy and to overall<br />
agricultural economic activity was computed us<strong>in</strong>g m<strong>et</strong>hods described by Popp <strong>et</strong> al., (2010).<br />
The social analysis uses SSA to calculate the percentage of worker hours for the supply cha<strong>in</strong> of US dairy<br />
products that are attributable to country-specific sectors. The SSA relies on an extension of the Global Trade<br />
Analysis Project (GTAP) global IO model. This model maps 2008 worker hours for the supply cha<strong>in</strong> of dairy<br />
products accord<strong>in</strong>g to the sectors and countries <strong>in</strong>volved <strong>in</strong> production (Benoît-Norris <strong>et</strong> al., <strong>2012</strong>; Benoît <strong>et</strong><br />
al., 2011). As with the economic IO model, the supply cha<strong>in</strong> analysis is conducted at the sector level. The<br />
sector classification scheme for the SSA differs from the scheme used <strong>in</strong> the economic IO analysis (see Discussion<br />
section). The SSA <strong>in</strong>cludes the GTAP sectors “Raw Milk” and “Dairy Products”. Raw Milk refers to<br />
dairy farm<strong>in</strong>g and Dairy Products is comprised of manufactured dairy products, specifically the follow<strong>in</strong>g<br />
United Nations Central Product Classification categories: Processed liquid milk, Cream, Milk and cream <strong>in</strong><br />
solid forms, Milk and cream concentrated or conta<strong>in</strong><strong>in</strong>g added sugar or other swe<strong>et</strong>en<strong>in</strong>g, Yoghurt and other<br />
fermented or acidified milk and cream, Dairy products n.e.c., Butter and other fats and oils derived from<br />
milk, Cheese and curd, Lactose and lactose syrup, Ice cream and other edible ice, Case<strong>in</strong>. Results of the SSA<br />
identify potential social hotspots throughout the US dairy supply cha<strong>in</strong>. Present<strong>in</strong>g the share of worker hours<br />
accord<strong>in</strong>g to country-specific sectors is particularly relevant because social impacts often manifest through<br />
employment (socialhotspot.org). In addition, a literature review exam<strong>in</strong>es social issues of on-farm dairy production<br />
<strong>in</strong> the US but does not <strong>in</strong>clude other stages of the dairy life cycle. A review of social impacts for<br />
other life cycle stages will be <strong>in</strong>cluded <strong>in</strong> future research.<br />
3. Results<br />
Environmental impacts for the life cycle of fluid milk consumed <strong>in</strong> the US are presented <strong>in</strong> Figure 1 by IM-<br />
PACT 2002+ category and life cycle stage. Farm<strong>in</strong>g stages of the life cycle, <strong>in</strong>clud<strong>in</strong>g feed production and<br />
dairy farm<strong>in</strong>g, contribute significantly (50+%) to several impact categories, <strong>in</strong>clud<strong>in</strong>g land occupation, terrestrial<br />
acidification/nitrification, respiratory organics and respiratory <strong>in</strong>organics. The feed production stage<br />
is responsible for 99% of land use and ecosystem impacts through land occupation for crop production.<br />
Farm<strong>in</strong>g stages are responsible for 95% of terrestrial acidification/nitrification, particularly through on-farm<br />
release of ammonia, which can be oxidized to nitric acid <strong>in</strong> the environment.<br />
Approximately 50% of human health impacts, comprised of respiratory organics, respiratory <strong>in</strong>organics, and<br />
carc<strong>in</strong>ogens, occur by the farm gate. The pr<strong>in</strong>cipal sources of respiratory organics are on-farm releases of<br />
volatile organic compounds, primarily <strong>et</strong>hanol released from the fermentation of silage. Field application of<br />
fertilisers (especially urea), manure management, off-farm energy generation and dust from operations contribute<br />
to respiratory <strong>in</strong>organics. Farm<strong>in</strong>g stage fuel use contributes to carc<strong>in</strong>ogens primarily through release<br />
of aromatic hydrocarbons associated with deep supply cha<strong>in</strong> natural gas extraction and process<strong>in</strong>g.<br />
234
PLENARY SESSION 2: METHODOLOGICAL CHALLENGES FOR ANIMAL PRODUCTION SYSTEMS 8 th Int. Conference on<br />
<strong>LCA</strong> <strong>in</strong> the<br />
Agri-<strong>Food</strong> Sector, 1-4 Oct <strong>2012</strong><br />
Figure 1. Environmental impact contribution analysis by life cycle stage to IMPACT 2002+ categories<br />
Post-farm gate stages of the fluid milk life cycle also contribute significantly to environmental impacts. The<br />
process<strong>in</strong>g stage is the dom<strong>in</strong>ant contributor to both terrestrial ecotoxicity (89%) and aquatic ecotoxicity<br />
(65%). This is a direct result of the on-site waste water treatment model chosen for this analysis; <strong>in</strong> particular,<br />
the use of a unit process from Eco<strong>in</strong>vent that is specific for whey process<strong>in</strong>g, which <strong>in</strong>cludes emissions<br />
of phosphorus due to clean<strong>in</strong>g <strong>in</strong> place technologies and alum<strong>in</strong>um, which <strong>in</strong> the data s<strong>et</strong> apparently arises<br />
from the use of alum as a flocculation aid. These emissions are highly uncerta<strong>in</strong>, and may not represent practices<br />
at specific locations, therefore these impacts should be considered as warn<strong>in</strong>g flags, not assertions of<br />
actual impact. The negative contribution to land occupation from process<strong>in</strong>g is the result of out of date milk<br />
used as pig feed displac<strong>in</strong>g corn and soymeal <strong>in</strong> those animal’s rations.<br />
Normalisation of environmental impacts (Figure 2), based on 56.7 kg per capita annual fluid milk consumption,<br />
with normalisation factors specific to the US (Lautier <strong>et</strong> al., 2010) suggests that aquatic eutrophication,<br />
aquatic ecotoxicity, terrestrial acidification/nitrification, aquatic acidification and carc<strong>in</strong>ogens are important<br />
categories on which to focus environmental improvement efforts. The y-axis <strong>in</strong> the normalisation analysis<br />
represents the fractional contribution of each category to total US impacts per category. Phosphorus runoff<br />
from land applied manure and fertiliser drives the contribution of aquatic eutrophication.<br />
Figure 2. Normalisation results for the US; analysis based on per capita consumption of fluid milk<br />
The economic results, which focus on positive economic contributions, rather than damages, present contributions<br />
of the US dairy supply cha<strong>in</strong> to the US economy <strong>in</strong> terms of 2008 employment, labour <strong>in</strong>come and<br />
value added (Table 1). Dairy contributed 407,071 jobs to the US economy, more than 5% of all direct jobs <strong>in</strong><br />
US agriculture. Dairy Cattle and Milk Production constituted 68% of dairy employment, while the process-<br />
235
PLENARY SESSION 2: METHODOLOGICAL CHALLENGES FOR ANIMAL PRODUCTION SYSTEMS8 th Int. Conference on <strong>LCA</strong> <strong>in</strong> the<br />
Agri-<strong>Food</strong> Sector, 1-4 Oct <strong>2012</strong><br />
<strong>in</strong>g sectors accounted for the rema<strong>in</strong><strong>in</strong>g 32%. Most of dairy’s direct process<strong>in</strong>g employment was <strong>in</strong> Fluid<br />
Milk and Butter Manufactur<strong>in</strong>g (44% of process<strong>in</strong>g) and Cheese Manufactur<strong>in</strong>g (30% of process<strong>in</strong>g). Dairy<br />
also provided $10.1B of direct labour <strong>in</strong>come (nearly 4% of US agricultural labour <strong>in</strong>come) and $26.3B of<br />
direct value added (5.4% of US agricultural value added).<br />
The dairy <strong>in</strong>dustry stimulated activities <strong>in</strong> other sectors. Approximately 38% of dairy’s total employment<br />
impacts (listed <strong>in</strong> Table 1) and almost 61% of dairy’s labour <strong>in</strong>come and 53% of its value added accrued<br />
outside of agricultural sectors, mak<strong>in</strong>g dairy an important contributor to the overall health of the US economy.<br />
Major sectors with significant contributions from US dairy <strong>in</strong>clude (non-agricultural) Manufactur<strong>in</strong>g,<br />
Wholesale Trade, Transportation and Warehous<strong>in</strong>g.<br />
The social, global IO analysis by Benoît <strong>et</strong> al., (<strong>2012</strong>; 2011) found that “Dairy Products, US” was the top<br />
country-specific sector (<strong>in</strong> terms of worker hours) with<strong>in</strong> the global supply cha<strong>in</strong> of US dairy for 2008.<br />
“Dairy Products, US” contributes nearly 20% to total worker hours (skilled and unskilled) for the supply<br />
cha<strong>in</strong>. “Raw Milk, US” contributes an additional 9% to total worker hours, br<strong>in</strong>g<strong>in</strong>g the contribution of US<br />
dairy<br />
Table 1. Contribution of the US dairy <strong>in</strong>dustry to employment, labour <strong>in</strong>come and value added a<br />
Employment (No. of Jobs) Labour Income ($B) Total Value Added ($B)<br />
Dairy<br />
Agriculture<br />
% US<br />
Agriculture<br />
Dair<br />
y<br />
Agriculture<br />
% US<br />
Agriculture<br />
Dair<br />
y<br />
Agriculture<br />
% US<br />
Agriculture<br />
Direct 407,071 7,443,502 5.47 10.1 270.3 3.73 26.3 488.0 5.39<br />
Production 277,117 2,949,324 9.4 1.8 47.6 3.87 13.3 141.5 9.38<br />
Process<strong>in</strong>g 129,954 3,682,967 3.53 8.3 202.0 4.09 13.0 330.1 3.94<br />
Indirect 470,925 4,338,477<br />
Total 877,996 11,781,978<br />
236<br />
25.4 283.5 44.7 485.8<br />
35.5 553.9 70.9 973.8<br />
a Columns may not sum due to round<strong>in</strong>g<br />
production and manufactur<strong>in</strong>g to nearly 30%. Other country-specific sectors that contributed significantly to<br />
total worker hours relate to f<strong>in</strong>ancial operations, <strong>in</strong>clud<strong>in</strong>g “Bus<strong>in</strong>ess Services, US” (9.2%), “R<strong>et</strong>ail and<br />
Wholesale Operations, US” (9.0%) and “F<strong>in</strong>ancial Intermediation, US” (3.4%). The significance of sectors<br />
such as “R<strong>et</strong>ail and Wholesale Operations” is <strong>in</strong> l<strong>in</strong>e with the results of the economic analysis. “Oil Seeds,<br />
India” is the only country-specific sector outside of the US <strong>in</strong> the top ten country-specific sectors that contributes<br />
to worker hours for the US dairy supply cha<strong>in</strong>. Given that the largest percentage of worker hours for<br />
the global supply cha<strong>in</strong> of US dairy products are <strong>in</strong> US dairy on-farm production and manufactur<strong>in</strong>g, a review<br />
of the social impacts of US dairy-related activities is warranted.<br />
The follow<strong>in</strong>g literature review focuses on the social risks of on-farm US dairy production. Review of the<br />
social impacts related to dairy manufactur<strong>in</strong>g and of additional social benefits are areas of future research. As<br />
a backdrop to the social susta<strong>in</strong>ability of dairy production, note there are few published studies on the impacts<br />
of US dairy on local communities, aside from the social benefits of dairy’s economic contributions<br />
(Jesse, 2002). The economic results presented above <strong>in</strong>dicate significant socio-economic benefits <strong>in</strong> the form<br />
of employment creation, labour <strong>in</strong>come and value added. To the extent dairy operations purchase local <strong>in</strong>puts,<br />
socio-economic benefits will multiply with<strong>in</strong> rural communities of operation.<br />
Also as a backdrop to social susta<strong>in</strong>ability, there is a notable trend <strong>in</strong> the US dairy <strong>in</strong>dustry toward fewer but<br />
larger operations (USDA NASS, 2010). Alongside this trend, Lobao and Sofferahn (2008) note an <strong>in</strong>creas<strong>in</strong>g<br />
reliance on hired wage labour, relative to family labour. The <strong>in</strong>creas<strong>in</strong>g demand for wage labour has led to an<br />
<strong>in</strong>creas<strong>in</strong>g reliance on immigrant, particularly Lat<strong>in</strong>o, labour (Salant <strong>et</strong> al., 2009). A recent study of Wiscons<strong>in</strong><br />
dairy operations identified discrepancies b<strong>et</strong>ween immigrant and US–born dairy workers <strong>in</strong> terms of<br />
wage rates and decision-mak<strong>in</strong>g power (Harrison <strong>et</strong> al., 2009). More research is necessary, however, to identify<br />
wh<strong>et</strong>her immigrant and US-born laborers were provided equal opportunities for advancement.<br />
Lobao and Stofferahn (2008) synthesized research on the impacts of <strong>in</strong>dustrialised farm<strong>in</strong>g on socioeconomic<br />
well-be<strong>in</strong>g and local communities. Their review def<strong>in</strong>es <strong>in</strong>dustrialised farms accord<strong>in</strong>g to scale and<br />
operat<strong>in</strong>g attributes (see Lobao and Stofferahn, 2008). Given the trend towards dairy consolidation, impacts<br />
of <strong>in</strong>dustrialised farm<strong>in</strong>g are particularly relevant. Impacts of <strong>in</strong>dustrialised dairy operations <strong>in</strong> this review<br />
<strong>in</strong>clude a modest reduction <strong>in</strong> reliance on local <strong>in</strong>puts (Foltz <strong>et</strong> al., 2002). In addition, operators of <strong>in</strong>dustrialised<br />
dairies tend to know their neighbors less well and are more likely to field neighbor compla<strong>in</strong>ts; however,<br />
these operators tend to participate more <strong>in</strong> community organisations (Jackson-Smith & Gillespie, 2005).<br />
Lobao and Stofferahn po<strong>in</strong>t out that, due to differences <strong>in</strong> study location and m<strong>et</strong>hodologies, f<strong>in</strong>d<strong>in</strong>gs are not
PLENARY SESSION 2: METHODOLOGICAL CHALLENGES FOR ANIMAL PRODUCTION SYSTEMS 8 th Int. Conference on<br />
<strong>LCA</strong> <strong>in</strong> the<br />
Agri-<strong>Food</strong> Sector, 1-4 Oct <strong>2012</strong><br />
always consistent; for example, Foltz and Zueli (2005) d<strong>et</strong>erm<strong>in</strong>ed that large operations do not, <strong>in</strong> general,<br />
reduce reliance on local <strong>in</strong>puts <strong>in</strong> a study that <strong>in</strong>cluded local supply considerations.<br />
4. Discussion<br />
The <strong>LCA</strong> identified d<strong>et</strong>ailed aspects of the fluid milk life cycle as contributors to specific environmental<br />
impacts. The <strong>LCA</strong> also used normalisation analysis to prioritize environmental improvement efforts by identify<strong>in</strong>g<br />
impact categories where improvements would be most mean<strong>in</strong>gful <strong>in</strong> a national context, <strong>in</strong> this case<br />
highlight<strong>in</strong>g the importance of nutrient management <strong>in</strong> the farm stages and understand<strong>in</strong>g the potential emissions<br />
from wastewater treatment at the process<strong>in</strong>g stage. Tog<strong>et</strong>her these tools provide organisations and policymakers<br />
with d<strong>et</strong>ailed <strong>in</strong>formation that can be used to develop management strategies and environmental<br />
policies.<br />
The economic and social analyses presented here do not have the same level of process-related granularity as<br />
<strong>LCA</strong>. These analyses <strong>in</strong>dicate sector-level economic contributions and social areas of risk, respectively. The<br />
sector-level focus of the IO analyses is a function of the data that populate the models. Note also that while<br />
<strong>in</strong>direct economic contributions are <strong>in</strong>cluded, they may overestimate the actual <strong>in</strong>direct contributions of the<br />
dairy supply cha<strong>in</strong>; because of allocation m<strong>et</strong>hods, the <strong>in</strong>direct economic contributions presented here may<br />
only be <strong>in</strong> part attributable to dairy. For example, a worker <strong>in</strong> a feed mill that supplies feed to both dairy<br />
farms and cattle farms will be counted <strong>in</strong> the <strong>in</strong>direct impacts of dairy and cattle. Thus caution must be taken<br />
as <strong>in</strong>direct contributions may overstate contributions from the US dairy sector. Another important difference<br />
b<strong>et</strong>ween the economic and social IO analyses is that the economic IO model study region is the US only and<br />
the social IO model is global.<br />
Economic IO analysis is not meant to <strong>in</strong>form product comparisons or identify opportunities for more susta<strong>in</strong>able<br />
practices; rather, it presents an <strong>in</strong>dication of the economic contributions of the dairy <strong>in</strong>dustry to the<br />
overall US economy. The SSA identifies country-specific sectors along the dairy supply cha<strong>in</strong> with a predom<strong>in</strong>ance<br />
of worker hours <strong>in</strong> order to identify areas of social risk. Not all social impacts, however, are tied<br />
to workers hours. For example, the National Dairy Animal Well-Be<strong>in</strong>g Initiative (2008) acknowledged that<br />
“<strong>et</strong>hical obligations associated with dairy production <strong>in</strong>clude a strong emphasis on animal well-be<strong>in</strong>g.” The<br />
Initiative published management pr<strong>in</strong>ciples and guidel<strong>in</strong>es <strong>in</strong> areas such as nutrition; herd health; hous<strong>in</strong>g<br />
and facilities; and handl<strong>in</strong>g, movement and transportation. F<strong>in</strong>ally, the social literature review identifies potential<br />
social risks <strong>in</strong> the areas of on-farm US dairy production. Note that the studies cited are often limited to<br />
case studies or surveys <strong>in</strong> <strong>in</strong>dividual communities, and while they raise flags, they are not necessarily generalizable.<br />
While tog<strong>et</strong>her these analyses provide valuable <strong>in</strong>formation on the <strong>in</strong>dividual areas of susta<strong>in</strong>ability,<br />
there is limited ability to draw conclusions about the relationship b<strong>et</strong>ween the environmental and social risks<br />
of US dairy and its economic contribution.<br />
5. Conclusion<br />
Overall, the <strong>LCA</strong> identified significant sources of environmental impacts throughout the life cycle of fluid<br />
milk. Farm<strong>in</strong>g stages of the life cycle most significantly affected land occupation, terrestrial acidification/nitrification<br />
and human health impacts. On-farm releases of ammonia drove terrestrial acidification/nitrification.<br />
On-farm releases of volatile organic compounds, manure management and the use of fertilisers<br />
and fuel drove human toxicity. Post-farm gate stages of the fluid milk life cycle also contributed to terrestrial<br />
and aquatic ecotoxicity. The normalisation analysis showed that aquatic eutrophication is by far the<br />
most significant environmental impact <strong>in</strong> terms of the fluid milk life cycle’s relative contributions to environmental<br />
impacts <strong>in</strong> the US.<br />
The economic analysis found that <strong>in</strong> addition to directly provid<strong>in</strong>g jobs, <strong>in</strong>come and added value, the US<br />
dairy <strong>in</strong>dustry contributes greatly to employment, labour <strong>in</strong>come and value added <strong>in</strong> other agricultural and<br />
nonagricultural nodes of the US dairy supply cha<strong>in</strong>. The economic significance of these <strong>in</strong>direct impacts<br />
highlights the importance of dairy to the strength of the greater economy. Describ<strong>in</strong>g relationships b<strong>et</strong>ween<br />
the economic contributions of specific supply cha<strong>in</strong> activities alongside the environmental impacts of these<br />
activities would enhance organisational and policy-based decision-mak<strong>in</strong>g.<br />
Accord<strong>in</strong>g to the SSA a significant share of worker hours for the total US dairy supply cha<strong>in</strong> are found <strong>in</strong><br />
US dairy production and manufactur<strong>in</strong>g. In the social doma<strong>in</strong>, literature on dairy’s impacts is sparse and<br />
limited <strong>in</strong> scope, and the literature review lacks the rigor of a <strong>LCA</strong> framework. Some evidence suggest<strong>in</strong>g<br />
that a consolidat<strong>in</strong>g dairy <strong>in</strong>dustry br<strong>in</strong>gs new challenges to social welfare is a call for more rigorous research.<br />
The use of process-level, life cycle-based tools to identify impacts with<strong>in</strong> each of the three pillars of susta<strong>in</strong>ability<br />
would improve the decision-mak<strong>in</strong>g value of this three part assessment. To encourage life cycle-<br />
237
PLENARY SESSION 2: METHODOLOGICAL CHALLENGES FOR ANIMAL PRODUCTION SYSTEMS8 th Int. Conference on <strong>LCA</strong> <strong>in</strong> the<br />
Agri-<strong>Food</strong> Sector, 1-4 Oct <strong>2012</strong><br />
based assessments of environmental, economic and social impacts, a Task Force of the UNEP-SETAC Life<br />
Cycle Initiative has published a framework for Life Cycle Susta<strong>in</strong>ability Assessment (UNEP-SETAC, 2011).<br />
This is a future area of research with potential to produce consistent and more comprehensive susta<strong>in</strong>ability<br />
assessments. One critical need, noted by the UNEP-SETAC framework y<strong>et</strong> lack<strong>in</strong>g <strong>in</strong> this assessment, is to<br />
def<strong>in</strong>e a common product system for the environmental, economic and social analysis. Use of a common<br />
product system would be more feasible if there were tools to support process-level life cycle assessment <strong>in</strong><br />
the areas of social and environmental susta<strong>in</strong>ability. As noted above, IO analysis operates on a sector-level,<br />
and <strong>in</strong> this case, the IO analyses could not be l<strong>in</strong>ked to the fluid milk life cycle (as a subs<strong>et</strong> of the dairy sector)<br />
exam<strong>in</strong>ed <strong>in</strong> the environmental analysis. Socio-economic databases that provide process-level background<br />
data for an agreed-upon s<strong>et</strong> of socio-economic <strong>in</strong>dicators is a critical research need. Compil<strong>in</strong>g databases<br />
of process-level economic and social background data would be a feasible, practical step <strong>in</strong> this direction.<br />
6. References<br />
Benoît-Norris, C., Aulisio, D., Norris, G. (<strong>2012</strong>) Identify<strong>in</strong>g social impacts <strong>in</strong> product supply cha<strong>in</strong>s: overview and application of the<br />
social hotspot database. Susta<strong>in</strong>ability 4, 1946-1965.<br />
Benoît-Norris, C., Aulisio, D., Hallisey-Kepka, C., Norris, G.A., 2011. TSC – Prototype social scop<strong>in</strong>g report: Product category 7:<br />
Strawberry yogurt. New Earth &The Susta<strong>in</strong>ability Consortium (www.socialhotspot.org).<br />
Broom, D., Dantzer, R., Willeberg, P., Mepham, B., Noordhuizen-Stassen, E., 1999. Report on animal welfare aspects of the use of<br />
bov<strong>in</strong>e somatotroph<strong>in</strong>. The Scientific Committee on Animal Health and Animal Welfare, European Union.<br />
Capper, J.L., Castañeda-Gutiérrez, E., Cady, R.A., Bauman, D.E., 2008. The environmental impact of recomb<strong>in</strong>ant bov<strong>in</strong>e somatotrop<strong>in</strong><br />
(rbST) use <strong>in</strong> dairy production. Proc. Natl. Acad. Sci. 105(28), 9668 -9673.<br />
Capper, J. L., & Cady, R. A. (<strong>2012</strong>). A comparison of the environmental impact of Jersey compared with Holste<strong>in</strong> milk for cheese<br />
production. J. Dairy Sci., 95(1), 165-76. Elsevier. doi:10.3168/jds.2011-4360<br />
Dohoo, I.C., DesCôteaux, L., Leslie, K., Fredeen, A., Shewfelt, W., Preston, A., Dowl<strong>in</strong>g, P., 2003. A m<strong>et</strong>a-analysis review of the<br />
effects of recomb<strong>in</strong>ant bov<strong>in</strong>e somatotrop<strong>in</strong>: 2. Effects on animal health, reproductive performance, and cull<strong>in</strong>g. The Can. J. V<strong>et</strong>.<br />
Res. 67, 252-264.<br />
Foltz, J., Jackson-Smith, D., Chen, L., 2002. Do purchas<strong>in</strong>g patterns differ b<strong>et</strong>ween large and small dairy farms? Economic evidence<br />
from three Wiscons<strong>in</strong> communities. Agric. and Resour. Econ. 31(1), 28-32.<br />
Foltz, J., Zueli, K., 2005. The role of community and farm characteristics <strong>in</strong> farm <strong>in</strong>put purchas<strong>in</strong>g patterns. Rev. Agric. Econ. 27(4),<br />
508-525.<br />
Frischknecht, R., Rebitzer, G., 2005. The eco<strong>in</strong>vent database system: A comprehensive web-based <strong>LCA</strong> database. J. Clean. Prod.<br />
13(13-14), 1337 – 1343.<br />
Harrison, J., Lloyd, S., O’Kane, T., 2009. Dairy workers <strong>in</strong> Wiscons<strong>in</strong>: Tasks, shifts, wages, and benefits (Brief<strong>in</strong>g No. 3). Chang<strong>in</strong>g<br />
hands: Hired labour on Wiscons<strong>in</strong> dairy farms. Madison, WI, Program on Agricultural Studies, University of Wiscons<strong>in</strong>-<br />
Madison.<br />
Heijungs, R., Goedkoop, M.J., Strujis, J., Efft<strong>in</strong>g, S., Sevenster, M. Huppes, G. (2010). Towards a life cycle impact assessment<br />
m<strong>et</strong>hod which comprises category <strong>in</strong>dicators at the midpo<strong>in</strong>t and the endpo<strong>in</strong>t level, Report of the first project phase: Design of<br />
the new m<strong>et</strong>hod. R<strong>et</strong>rieved from www.lcia-recipe.n<strong>et</strong>.<br />
Jackson-Smith, D., Gillespie Jr., G.W., 2005. Impacts of farm structural change on farmers’ social ties. Soc. Nat. Resour., 18(3), 215-<br />
240.<br />
Jesse, E. (2002) R<strong>et</strong>h<strong>in</strong>k<strong>in</strong>g dairyland: Background for decisions about Wiscons<strong>in</strong>’s dairy <strong>in</strong>dustry. Mark<strong>et</strong><strong>in</strong>g and Policy Brief<strong>in</strong>g<br />
Paper No. 78A, May 2002, University of Wiscons<strong>in</strong>.<br />
Jolli<strong>et</strong>, O., Margni, M., Charles, R., Humbert, S., Pay<strong>et</strong>, J., Rebitzer, G., Rosenbaum, R., 2003. IMPACT 2002+: A new life cycle<br />
impact assessment m<strong>et</strong>hodology. Int. J. <strong>LCA</strong>, 8(6), 324-330.<br />
Lautier, A., Rosenbaum, R. K., Margni, M., Bare, J. C., Roy, P.-O., & Deschênes, L. (2010). Development of normalization factors<br />
for Canada and the United States and comparison with European factors. Sci. Tot. Env., 409(1), 33-42. Elsevier B.V.<br />
doi:10.1016/j.scitotenv.2010.09.016<br />
Lobao, L., Stofferahn, C., 2008. The community effects of <strong>in</strong>dustrialized farm<strong>in</strong>g: Social science research and challenges to corporate<br />
farm<strong>in</strong>g laws. Agric. Hum. Val. 25, 219-240.<br />
National Dairy Animal Well-Be<strong>in</strong>g Initiative, 2008. Pr<strong>in</strong>ciples & Guidel<strong>in</strong>es for Dairy Animal Well-Be<strong>in</strong>g. R<strong>et</strong>rieved from<br />
www.dairywellbe<strong>in</strong>g.org/guidel<strong>in</strong>es.php.<br />
Popp, J., Kemper, N., Miller, W., McGraw, K., Karr, K., 2010. The Economic Contribution of the Agricultural Sector to the Arkansas<br />
Economy <strong>in</strong> 2008, Research Report No. 989. Little Rock, AR.<br />
Salant, P.,Wulfhorst, J.D., Kane, S., Dearien, C., 2009. Community level impacts of Idaho’s chang<strong>in</strong>g dairy <strong>in</strong>dustry. Moscow, ID:<br />
University of Idaho, College of Agricultural and Life Sciences.<br />
Thoma, G., Popp, J., Shonnard, D., Nutter, D., Ulrich, R., Matlock, M., Kim, D., Neiderman, Z., East, C., Adom, F., Kemper, N.,<br />
Mayes, A., (<strong>2012</strong>). Greenhouse gas emissions from milk production and consumption <strong>in</strong> the United States: A cradle to grave life<br />
cycle assessment circa 2008. Int. Dairy J, submitted.<br />
UN GA (2005) 2005 World Summit Outcome. Resolution A/60/1, adopted by the United Nations General Assembly on 15 September<br />
2005<br />
UNEP/SETAC, 2011. Towards a life cycle susta<strong>in</strong>ability assessment: Mak<strong>in</strong>g <strong>in</strong>formed choices on products. Paris, <strong>France</strong>:<br />
UNEP/SETAC Life Cycle Initiative.<br />
USDA NASS, 2010. Overview of the United States dairy <strong>in</strong>dustry. R<strong>et</strong>rieved from<br />
http://usda.mannlib.cornell.edu/usda/current/USDairyIndus/USDairyIndus-09-22-2010.pdf<br />
238
PARALLEL SESSION 3A: LAND USE CHANGE 8 th Int. Conference on <strong>LCA</strong> <strong>in</strong> the<br />
Parallel session 3a: Land Use Change<br />
Agri-<strong>Food</strong> Sector, 1-4 Oct <strong>2012</strong><br />
Bioenergy production from perennial energy crops: a consequential<br />
<strong>LCA</strong> of 12 bioenergy cha<strong>in</strong>s <strong>in</strong>clud<strong>in</strong>g land use changes<br />
Lorie Hamel<strong>in</strong> 1* , Davide Ton<strong>in</strong>i 2 , Thomas Astrup 2 , Henrik Wenzel 1<br />
1<br />
Institute of Chemical Eng<strong>in</strong>eer<strong>in</strong>g, Biotechnology and Environmental technology (KBM), University of Southern Denmark, Campusvej<br />
55, 5230 Odense M., Denmark<br />
2<br />
Department of Environmental Eng<strong>in</strong>eer<strong>in</strong>g, Technical University of Denmark, Miljøvej, Build<strong>in</strong>g 113, 2800 Lyngby, Denmark.<br />
Correspond<strong>in</strong>g author. E-mail: loha@kbm.sdu.dk<br />
ABSTRACT<br />
In the endeavour of optimiz<strong>in</strong>g the susta<strong>in</strong>ability of bioenergy production <strong>in</strong> Denmark, this consequential life cycle assessment<br />
(<strong>LCA</strong>) evaluated the environmental impacts associated with the production of heat and electricity from one hectare of Danish arable<br />
land cultivated with three perennial crops: ryegrass, willow and Miscanthus. For each, four conversion pathways were assessed<br />
aga<strong>in</strong>st a fossil fuel reference: I) anaerobic co-digestion with manure, II) gasification, III) combustion <strong>in</strong> small-to-medium scale<br />
biomass comb<strong>in</strong>ed heat and power (CHP) plants and IV) co-fir<strong>in</strong>g <strong>in</strong> large scale coal-fired CHP plants. Soil carbon changes, direct<br />
and <strong>in</strong>direct land use changes as well as uncerta<strong>in</strong>ty analysis (sensitivity, MonteCarlo) were <strong>in</strong>cluded <strong>in</strong> the <strong>LCA</strong>. Results showed<br />
that global warm<strong>in</strong>g was the bottleneck impact, where only two scenarios, namely willow and Miscanthus co-fir<strong>in</strong>g, allowed for an<br />
improvement as compared to the reference (-82 and -45 t CO2-eq. ha -1 , respectively).<br />
Keywords: perennial crops, combustion, land use changes, gasification, anaerobic digestion<br />
1. Introduction<br />
The ambition of the energy policy <strong>in</strong> Denmark is to reach a 100% renewable energy system by 2050<br />
(Lund <strong>et</strong> al., 2011). Several studies have been conducted to design and optimize such a system, and these all<br />
highlight the <strong>in</strong>dispensability of a biomass potential of around 35%–50% of the overall energy consumption<br />
(Lund <strong>et</strong> al., 2011; Energ<strong>in</strong><strong>et</strong>.dk, 2010; Klimakommissionen, 2010). Though biomass is a renewable energy<br />
source, it is not unlimited <strong>in</strong> supply, and does <strong>in</strong>volve considerable environmental costs. One of the most<br />
critical costs of bioenergy relates to its <strong>in</strong>cidence on land use changes (LUC) (Search<strong>in</strong>ger <strong>et</strong> al., 2008; Edwards<br />
<strong>et</strong> al., 2010), i.e. the conversion of land from one use (e.g. forest, grassland or food/feed crop cultivation)<br />
to another use (e.g. energy crop cultivation). One way to m<strong>in</strong>imize these LUC impacts could be through<br />
favour<strong>in</strong>g the cultivation of perennial energy crops (e.g. perennial ryegrass, willow and Miscanthus) <strong>in</strong>stead<br />
of annual crops (e.g. maize, barley, wheat, sugar be<strong>et</strong>). In fact, it is acknowledged that perennial energy<br />
crops nowadays represent the most efficient and susta<strong>in</strong>able feedstock available for bioenergy production <strong>in</strong><br />
temperate regions (Bessou <strong>et</strong> al., 2011).<br />
The goal of this study is to assess the environmental impacts associated with the production of bioenergy<br />
(heat and electricity) from 1 hectare (ha) of Danish arable land cultivated with ryegrass, willow and<br />
Miscanthus, consider<strong>in</strong>g four different biomass-to-energy (BtE) conversion pathways: i) anaerobic codigestion<br />
with manure, ii) gasification, iii) combustion <strong>in</strong> small-to-medium scale biomass comb<strong>in</strong>ed heat and<br />
power (CHP) plants and iv) co-fir<strong>in</strong>g <strong>in</strong> large scale coal-fired CHP plants.<br />
2. M<strong>et</strong>hods<br />
2.1. Life cycle assessment model<br />
The environmental assessment presented <strong>in</strong> this study was performed us<strong>in</strong>g consequential life cycle assessment<br />
(<strong>LCA</strong>). The functional unit upon which all <strong>in</strong>put and output flows were expressed is 1 ha of agricultural<br />
land used to grow the selected energy crops. The geographical scope considered for the <strong>LCA</strong> was<br />
Denmark, i.e. the data <strong>in</strong>ventory for crops cultivation and BtE plants were specific for Danish conditions.<br />
Similarly, the legislative context of Denmark (e.g. fertilisation) was considered. The temporal scope considered<br />
was 20 years, i.e. all assessed systems were operated for a 20 years duration. The life cycle impact assessment<br />
was carried out accord<strong>in</strong>g to the Danish EDIP 2003 m<strong>et</strong>hod (Hauschild and Pott<strong>in</strong>g, 2005), to<br />
which one impact category, “Phosphorous as resource”, was added based on the Impact 2002+ m<strong>et</strong>hod (Jolli<strong>et</strong><br />
<strong>et</strong> al., 2003). Background <strong>LCA</strong> data were based on the Eco<strong>in</strong>vent v.2.2 database, and the assessment was<br />
facilitated with the <strong>LCA</strong> software SimaPro 7.3.3. Foreground <strong>LCA</strong> data essentially <strong>in</strong>cluded Danish-specific<br />
data for agricultural and energy conversion processes, and the impacts associated with capital goods (foreground<br />
data only) as well as those related to transportation of the residues (i.e. ash and digestate) have been<br />
excluded. The systems assessed considered three perennial crops (ryegrass, willow and Miscanthus) and four<br />
BtE conversion technologies (anaerobic co-digestion, gasification, combustion <strong>in</strong> small-to-medium scale<br />
239
PARALLEL SESSION 3A: LAND USE CHANGE 8 th Int. Conference on <strong>LCA</strong> <strong>in</strong> the<br />
Agri-<strong>Food</strong> Sector, 1-4 Oct <strong>2012</strong><br />
biomass CHP plants and co-fir<strong>in</strong>g <strong>in</strong> large scale coal-fired CHP plants). A total of 12 scenarios have therefore<br />
been assessed. The system and boundary conditions are illustrated <strong>in</strong> Figure 1.<br />
Figure 1. Illustration of the system boundary considered for all scenarios. Dotted l<strong>in</strong>es <strong>in</strong>dicate avoided processes,<br />
and full l<strong>in</strong>es <strong>in</strong>dicate processes <strong>in</strong>duced by the scenarios. (*) Not all the converted land is to be cultivated<br />
<strong>in</strong> barley, and not all the Danish barley displaced is replaced, due to various mark<strong>et</strong> mechanisms.<br />
For all BtE technologies, the energy produced was considered to be used for CHP production,<br />
thereby substitut<strong>in</strong>g the production of marg<strong>in</strong>al heat and power. In the present study, the marg<strong>in</strong>al electricity<br />
source was assumed to be from coal-fired power plants, and the marg<strong>in</strong>al heat from natural gas based domestic<br />
boiler. As illustrated <strong>in</strong> Figure 1, the digestate produced from anaerobic digestion was used as a fertiliser<br />
(for N, P and K), which avoided marg<strong>in</strong>al m<strong>in</strong>eral N, P and K fertilisers to be produced and used, based on<br />
the content of N, P and K of the digestate. The marg<strong>in</strong>al N, P and K fertilisers considered were calcium ammonium<br />
nitrate, diammonium phosphate and potassium chloride, respectively, conform<strong>in</strong>gly with Hamel<strong>in</strong> <strong>et</strong><br />
al., (<strong>2012</strong>). Further, based on the model from Hamel<strong>in</strong> <strong>et</strong> al., (2011), it was considered that the manure portion<br />
used for co-digestion would have otherwise been stored and applied on land, without digestion.<br />
The three thermal bioenergy scenarios (i.e. gasification, combustion and co-fir<strong>in</strong>g) implied negligible<br />
residual unconverted carbon that is found <strong>in</strong> the bottom ashes, fly ashes and eventual waste water. The<br />
bottom ashes were assumed to be used for road construction, substitut<strong>in</strong>g for natural aggregates, while the fly<br />
ashes were assumed to be utilised for backfill<strong>in</strong>g of old salt m<strong>in</strong>es with negligible environmental impacts<br />
(not illustrated <strong>in</strong> Figure 1). Treatment of waste water was not <strong>in</strong>cluded.<br />
All bioenergy scenarios <strong>in</strong>volved the use of Danish agricultural land <strong>in</strong> order to grow the energy crops.<br />
Based on Weidema (2003), it is considered that the (Danish) land needed to grow the energy crops will be<br />
taken from land under spr<strong>in</strong>g barley cultivation. Based on the consequential <strong>LCA</strong> logic, as well as on recent<br />
studies (Search<strong>in</strong>ger <strong>et</strong> al., 2008; Kløverpris, 2008), this result<strong>in</strong>g drop <strong>in</strong> supply of Danish spr<strong>in</strong>g barley will<br />
cause a relative <strong>in</strong>crease <strong>in</strong> agricultural prices, which then provide <strong>in</strong>centives to <strong>in</strong>crease the production<br />
elsewhere. Such <strong>in</strong>creased crop production may stem from both <strong>in</strong>creased yield and land conversion to cropland,<br />
the latter be<strong>in</strong>g also referred to as <strong>in</strong>direct land use change (iLUC) (Search<strong>in</strong>ger <strong>et</strong> al., 2008; Kløverpris,<br />
2008). As illustrated <strong>in</strong> Fig. 1, and as <strong>in</strong> recent iLUC studies (e.g. Laborde <strong>et</strong> al., 2011; Tyner <strong>et</strong> al.,<br />
2010), this study <strong>in</strong>cluded the environmental impacts of the latter only.<br />
2.2. Life cycle <strong>in</strong>ventory (LCI) for crops and BtE technologies<br />
The LCI of all crops was based on a recent Danish consequential LCI (Hamel<strong>in</strong> <strong>et</strong> al., <strong>2012</strong>), which comprises<br />
all processes <strong>in</strong>volved dur<strong>in</strong>g the cultivation stage, up to harvest, and <strong>in</strong>clude soil carbon changes. For<br />
all crops, the fertilisation operations were performed <strong>in</strong> conformity with Danish regulations <strong>in</strong>volv<strong>in</strong>g an<br />
upper limit for the amount of N to be applied on the field, both as m<strong>in</strong>eral fertiliser and animal slurry. Based<br />
on Hamel<strong>in</strong> <strong>et</strong> al., (<strong>2012</strong>), the life-cycle considered for perennial ryegrass, willow and Miscanthus planta-<br />
240
PARALLEL SESSION 3A: LAND USE CHANGE 8 th Int. Conference on <strong>LCA</strong> <strong>in</strong> the<br />
Agri-<strong>Food</strong> Sector, 1-4 Oct <strong>2012</strong><br />
tions were respectively 2y, 21y (6 cuts; 3 years harvest cycle; 1 year establishment; 1 year preparation before<br />
plant<strong>in</strong>g) and 20y (18 cuts; 1 year establishment: 1 year preparation before plant<strong>in</strong>g). Further, it was considered<br />
that Miscanthus was harvested dur<strong>in</strong>g the spr<strong>in</strong>g season.<br />
Anaerobic digestion was modelled as mesophilic co-digestion of the respective energy crops with raw pig<br />
manure. The modelled m<strong>et</strong>hane yield for ryegrass, willow, Miscanthus and raw pig manure was, respectively,<br />
358, 243, 253 and 319 Nm 3 t -1 VS. Based on Hamel<strong>in</strong> <strong>et</strong> al., (2011), the mixture of crop and raw pig<br />
manure was calculated <strong>in</strong> order to ensure a biomass mixture <strong>in</strong>put hav<strong>in</strong>g a dry matter (DM) content of 10%<br />
after the first digestion step. The result<strong>in</strong>g ratio manure:crop (fresh weight basis) for co-digestion of ryegrass,<br />
willow and Miscanthus equaled 1.6, 3 and 3.1, yield<strong>in</strong>g respectively 153.3, 162 and 130 MJ CH4 ha -1 . Consumption<br />
of electricity and heat was modelled accord<strong>in</strong>g to Hamel<strong>in</strong> <strong>et</strong> al., (<strong>2012</strong>).<br />
Gasification was modelled as fluidized bed gasification with a cold gas and carbon conversion efficiency<br />
(CGE and CCE) of 70% (±15%) and 95% (±4%), respectively. Consumption of electricity and heat<br />
was based on Jungbluth <strong>et</strong> al., (2007). Both biogas and syngas were assumed utilised <strong>in</strong> a gas eng<strong>in</strong>e with an<br />
average electricity efficiency of 38% (±4%) (of the LHV of the <strong>in</strong>put-gas).<br />
Combustion was modelled as direct biomass combustion <strong>in</strong> small-to-medium scale biomass CHP<br />
plants, consider<strong>in</strong>g electricity and heat efficiencies of 27% (±2%) and 63% (±7%), respectively. For co-fir<strong>in</strong>g<br />
<strong>in</strong> large scale coal-fired CHP plant, electricity and heat efficiencies of 38% (±3%) and 52% (±8%), respectively,<br />
were considered. The air emissions from biogas and syngas combustion <strong>in</strong> gas eng<strong>in</strong>es and from biomass<br />
combustion <strong>in</strong> CHP plants were based on NERI (2010).<br />
Pre-treatments <strong>in</strong>cluded on-field dry<strong>in</strong>g (ryegrass, for all BtE conversion technologies) and natural dry<strong>in</strong>g<br />
(willow, for gasification and co-fir<strong>in</strong>g), size comm<strong>in</strong>ution (all crops, for all BtE conversion technologies<br />
except direct combustion) as well as steam pre-treatment for break<strong>in</strong>g the lignocellulosic structures of Miscanthus<br />
and willow undergo<strong>in</strong>g anaerobic digestion. Additional processes modelled <strong>in</strong> the <strong>LCA</strong> were: crops<br />
and digestate storage, use on land (UOL) of the digestate, treatment of residues from thermal BtE technologies<br />
and transportation.<br />
2.3 Direct and <strong>in</strong>direct land use changes<br />
The <strong>LCA</strong> system established <strong>in</strong> this study considers that the land used for cultivat<strong>in</strong>g the energy crops would<br />
have otherwise been used for cultivat<strong>in</strong>g spr<strong>in</strong>g barley (with straw <strong>in</strong>corporation) for the food/feed mark<strong>et</strong><br />
(Figure 1). The direct land use change (dLUC) consequence of this translates <strong>in</strong>to the environmental impacts<br />
of cultivat<strong>in</strong>g the selected energy crops <strong>in</strong>stead of spr<strong>in</strong>g barley (Figure 1). The environmental impacts from<br />
spr<strong>in</strong>g barley cultivation have been <strong>in</strong>cluded on the basis of the data from Hamel<strong>in</strong> <strong>et</strong> al., (<strong>2012</strong>).<br />
The iLUC consequence corresponds to the environmental impact of convert<strong>in</strong>g land nowadays not used<br />
for crop cultivation to cropland, as a result of the <strong>in</strong>duced demand for the displaced spr<strong>in</strong>g barley. To quantify<br />
this impact, it is necessary to identify i) how much land is converted and where; and ii) which types of<br />
land are converted (biome types). So far, most studies attempt<strong>in</strong>g to quantify the magnitude of iLUC used<br />
economical model<strong>in</strong>g approaches to this end, (e.g. Search<strong>in</strong>ger <strong>et</strong> al., 2008; Edwards <strong>et</strong> al., 2010; Kløverpris,<br />
2008; Tyner <strong>et</strong> al., 2010; Laborde, 2011), but most of them focused on biofuel mandates. In Kløverpris<br />
(2008), however, the iLUC consequences <strong>in</strong> terms of po<strong>in</strong>ts i) and ii) above are identified, for a marg<strong>in</strong>al<br />
<strong>in</strong>crease <strong>in</strong> wheat consumption <strong>in</strong> 4 different countries, <strong>in</strong>clud<strong>in</strong>g Denmark. In the present study, the results<br />
of Kløverpris (2008) for Denmark have been used as a proxy to estimate how much land is converted (due to<br />
the <strong>in</strong>creased spr<strong>in</strong>g barley demand) and where. However, the CO2 impact of land conversion is not estimated<br />
<strong>in</strong> Kløverpris. In order to do so, the soil and veg<strong>et</strong>ation C data from the Woods Hole Research Centre,<br />
as published <strong>in</strong> Search<strong>in</strong>ger <strong>et</strong> al., (2008), have been used, and the CO2 emitted due to land conversion was<br />
calculated based on the m<strong>et</strong>hodology published <strong>in</strong> Müller-Wenk and Brandão (2010). Based on this m<strong>et</strong>hodology,<br />
it was considered that 25% of the C <strong>in</strong> the soil was converted to CO2 for all types of land use conversion,<br />
except when forests were converted to grassland, where 0% was converted. Further, it was considered<br />
that 100% of the C <strong>in</strong> veg<strong>et</strong>ation was converted to CO2 for all forest types as well as for tropical grassland<br />
conversions, while 0% was converted for the rema<strong>in</strong><strong>in</strong>g biome types (e.g. shrub land, non-tropical grassland,<br />
chaparral).<br />
2.4 Sensitivity analyses<br />
A number of sensitivity analyses were performed for the 12 scenarios, with focus on GW. These <strong>in</strong>cluded: a)<br />
variation (m<strong>in</strong>-max) of the iLUC impacts with respect to CO2 emissions (vs. mean value assumed as basel<strong>in</strong>e);<br />
b) w<strong>in</strong>ter wheat as the marg<strong>in</strong>al crop for Denmark (vs. spr<strong>in</strong>g barley as basel<strong>in</strong>e); c) coal-based heat<br />
241
PARALLEL SESSION 3A: LAND USE CHANGE 8 th Int. Conference on <strong>LCA</strong> <strong>in</strong> the<br />
Agri-<strong>Food</strong> Sector, 1-4 Oct <strong>2012</strong><br />
production as the marg<strong>in</strong>al technology for heat generation (vs. natural gas-based as basel<strong>in</strong>e); d) natural gas<br />
power plant as the marg<strong>in</strong>al technology for electricity generation (vs. condens<strong>in</strong>g coal power plant as basel<strong>in</strong>e);<br />
e) mono-digestion of the crops (vs. co-digestion with manure as basel<strong>in</strong>e); f) pre-treatment of pell<strong>et</strong>isation<br />
before co-fir<strong>in</strong>g (vs. ‘no pell<strong>et</strong>isation’ as basel<strong>in</strong>e). Each of these changes was tested <strong>in</strong>dividually to<br />
assess the <strong>in</strong>fluence of the <strong>in</strong>dividual change on the overall <strong>LCA</strong> results.<br />
Furthermore, the <strong>in</strong>fluence of the uncerta<strong>in</strong>ty of the several data collected <strong>in</strong> the <strong>LCA</strong> model on the rank<strong>in</strong>g<br />
provided by the <strong>LCA</strong> results was tested by means of Monte Carlo analysis (number of simulations:<br />
1000).<br />
3. Results and Discussion<br />
Among the selected impact categories, global warm<strong>in</strong>g appears critical as only two scenarios <strong>in</strong>dicate<br />
overall sav<strong>in</strong>gs for this category as compared with the fossil fuel reference (Table 1). Only co-fir<strong>in</strong>g of<br />
willow and Miscanthus <strong>in</strong>dicated n<strong>et</strong> overall sav<strong>in</strong>gs, i.e. these were the only two scenarios for which an<br />
environmental benefit, GHG-wise, was identified <strong>in</strong> relation to us<strong>in</strong>g 1 ha of land for bioenergy. However,<br />
the magnitude of the global warm<strong>in</strong>g impacts found <strong>in</strong> this study (b<strong>et</strong>ween -82 and 268 t CO2-eq ha<br />
242<br />
-1 over 20<br />
years) was much higher than values published <strong>in</strong> literature, where results from -207 t CO2-eq ha -1 over 20y<br />
(Brandão <strong>et</strong> al., 2010) to -700 t CO2-eq ha -1 over 20 y (Styles and Jones, 2007) are reported for different bioenergy<br />
systems based on willow and Miscanthus. The reason for these differences is that this study, as opposed<br />
to the previous, considered iLUC, which has tremendous significance on the overall GHG balance.<br />
The iLUC impacts of the studied bioenergy systems were the same for all scenarios (Table 1), as<br />
they all had the same “po<strong>in</strong>t of orig<strong>in</strong>”: the conversion of 1 ha of Danish land (cultivated with spr<strong>in</strong>g barley)<br />
to energy crops. As shown <strong>in</strong> Table 1, iLUC impacts were estimated to 309 t CO2-eq. ha -1 (± 168 t CO2-eq.<br />
ha -1 ). The impacts were assumed to occur over a period of 20 years <strong>in</strong> accordance with IPCC (IPCC, 2006),<br />
correspond<strong>in</strong>g to about 15.5 t CO2-eq. ha -1 y -1 .<br />
Co-fir<strong>in</strong>g and combustion provided the smallest global warm<strong>in</strong>g impacts for all crops. The environmental<br />
performance of co-fir<strong>in</strong>g was directly related to the higher electricity efficiency of these plants (about<br />
38% of the LHV of the fuel, w<strong>et</strong> basis), and consequently to the larger amount of marg<strong>in</strong>al coal electricity<br />
substituted. Co-fir<strong>in</strong>g of willow provided the largest sav<strong>in</strong>gs, mostly because of the beneficial dLUC, higher<br />
yield and m<strong>in</strong>imal pre-treatment required (Table 1). Similarly, the environmental performance of combustion<br />
was due to the high overall energy recovery as heat and electricity (about 90% of the LHV of the fuel, w<strong>et</strong><br />
basis). As opposed to combustion and co-fir<strong>in</strong>g, anaerobic digestion and gasification <strong>in</strong>volved a conversion<br />
to gas before energy generation, thereby <strong>in</strong>duc<strong>in</strong>g losses. Therefore, less electricity and heat were produced<br />
and substituted, result<strong>in</strong>g <strong>in</strong> larger n<strong>et</strong> GW impact from these technologies. Further, UOL of the digestate<br />
contributed with a GW impact comparable to the one of iLUC, i.e. rang<strong>in</strong>g b<strong>et</strong>ween 248 (ryegrass) and 371<br />
(willow) t CO2-eq. ha -1 , primarily connected to the release of biogenic carbon not enter<strong>in</strong>g the soil C pool.<br />
Co-digestion also resulted <strong>in</strong> GHG sav<strong>in</strong>gs associated with avoid<strong>in</strong>g raw manure management, which would<br />
otherwise be stored and applied on land without digestion. These sav<strong>in</strong>gs depended on the amount of manure<br />
co-digested (per hectare), i.e. the more manure co-digested (to me<strong>et</strong> the 10% DM <strong>in</strong> the <strong>in</strong>put mixture), the<br />
larger the sav<strong>in</strong>gs were. This also applied for aquatic N-eutrophication, where the impacts were much higher<br />
for ryegrass because less raw manure was <strong>in</strong>volved as compared with the other crops.<br />
Table 1 highlights the significance of dLUC for all scenarios and impact categories, where chang<strong>in</strong>g<br />
from spr<strong>in</strong>g barley to perennials generally resulted <strong>in</strong> environmental benefits. For global warm<strong>in</strong>g, this reflects<br />
that less C (wh<strong>et</strong>her soil native C, or C from above/below ground biomass) is lost as CO2 emissions to<br />
the atmosphere dur<strong>in</strong>g the cultivation stage for the perennials, as compared with spr<strong>in</strong>g barley. For the other<br />
impact categories, the dLUC results for ryegrass differed from those of Miscanthus and willow. Table 1 for<br />
example reflects the high load of N fertilisers applied <strong>in</strong> the ryegrass system, which resulted <strong>in</strong> much higher<br />
N leach<strong>in</strong>g than <strong>in</strong> the reference system (barley cultivation), while willow and Miscanthus systems resulted<br />
<strong>in</strong> a dLUC improvement. On the other hand, as half of the N fertilisers used dur<strong>in</strong>g cultivation came from<br />
animal slurries (from the <strong>in</strong>ventory of Hamel<strong>in</strong> <strong>et</strong> al., <strong>2012</strong>), which also conta<strong>in</strong> P, no m<strong>in</strong>eral P fertilisers<br />
needed to be applied for ryegrass, as opposed to all other crop systems, which expla<strong>in</strong>s the greater P sav<strong>in</strong>gs<br />
for this crop <strong>in</strong> connection with dLUC (Table 1). For the P-related categories, the category “others” mostly<br />
reflects the avoided P fertilisers from the digestate use, which are relatively important <strong>in</strong> the anaerobic digestion<br />
scenarios.<br />
The results of the sensitivity analyses highlighted that the variation of the iLUC impacts played the<br />
most important role for GW; with m<strong>in</strong>imum iLUC impacts (7 t CO2-eq. ha -1 y -1 ) all bioenergy scenarios for<br />
willow and Miscanthus as well as co-fir<strong>in</strong>g of ryegrass achieved environmental sav<strong>in</strong>gs on GW. In all other<br />
analyses, the <strong>in</strong>dividual changes <strong>in</strong> assumptions did not alter the conclusions relative to the basel<strong>in</strong>e. How-
PARALLEL SESSION 3A: LAND USE CHANGE 8 th Int. Conference on <strong>LCA</strong> <strong>in</strong> the<br />
Agri-<strong>Food</strong> Sector, 1-4 Oct <strong>2012</strong><br />
ever, the different assumptions made regard<strong>in</strong>g marg<strong>in</strong>al energy and crop decreased or <strong>in</strong>creased the magnitude<br />
of the impacts or sav<strong>in</strong>gs <strong>in</strong> all scenarios. In the case of mono-digestion, GW impacts were significantly<br />
<strong>in</strong>creased as compared to their levels <strong>in</strong> the co-digestion scenarios (<strong>in</strong>crease b<strong>et</strong>ween 112 and 150 t CO2-eq.<br />
ha -1 ), reflect<strong>in</strong>g the tremendous benefits obta<strong>in</strong>ed when avoid<strong>in</strong>g storage and application of raw manure. The<br />
sensitivity analysis also demonstrated that additional pell<strong>et</strong>isation and mill<strong>in</strong>g of the biomass <strong>in</strong> the co-fir<strong>in</strong>g<br />
scenarios would decrease the GW performance of these scenarios to a level very close to direct biomass<br />
combustion. The results of the MonteCarlo simulation for GW supported the rank<strong>in</strong>g of the bioenergy scenarios<br />
found with the basel<strong>in</strong>e scenarios, demonstrat<strong>in</strong>g that despite of the significant uncerta<strong>in</strong>ties, the results<br />
obta<strong>in</strong>ed were robust.<br />
Table 1. Characterised results for the selected environmental impact categories<br />
Crop Ryegrass Willow Miscanthus<br />
BtE technologies a AD GA CO CF AD GA CO CF AD GA CO CF<br />
Global Warm<strong>in</strong>g (kg CO2 eq/ha of perennial crop)<br />
dLUC -167 -167 -167 -167 -249 -249 -249 -249 -211 -211 -211 -211<br />
iLUC 309 309 309 309 309 309 309 309 309 309 309 309<br />
Crop pre-treatment 118 118 118 118 46 28 28 28 42 24 24 27<br />
Energy production 305 343 351 351 316 426 440 440 252 322 336 335<br />
Energy substitution -408 -339 -416 -482 -448 -433 -521 -612 -355 -330 -432 -504<br />
Use on land (digestate) 248 0 0 0 371 0 0 0 278 0 0 0<br />
Raw manure management b<br />
-155 0 0 0 -286 0 0 0 -222 0 0 0<br />
Other 18 2 2 2 32 2 2 2 29 1 2 -1<br />
N<strong>et</strong> c<br />
268 266 197 131 91 83 9 -82 123 115 28 -45<br />
Aquatic Eutrophication (N) (kg N/ha of perennial crop)<br />
dLUC 434 434 434 434 -569 -569 -569 -569 -550 -550 -550 -550<br />
iLUC 0 0 0 0 0 0 0 0 0 0 0 0<br />
Crop pre-treatment 3 0 0 0 2 0,08 0,08 0,08 2 0,06 0,06 0,06<br />
Energy production 59 43 41 41 63 52 34 34 50 41 54 43<br />
Energy substitution -35 -29 -34 -41 -38 -36 -43 -52 -29 -28 -35 -43<br />
Use on land (digestate) 2960 0 0 0 2840 0 0 0 2130 0 0 0<br />
Raw manure management b<br />
-1251 0 0 0 -2300 0 0 0 -1801 0 0 0<br />
Other 40 4 3 4 38 0,9 0,9 1 28 0,9 1 0,5<br />
N<strong>et</strong> c<br />
2210 452 444 438 36,3 -552 -577 -586 -170 -536 -530 -550<br />
Aquatic Eutrophication (P) (kg P/ha of perennial crop)<br />
dLUC -10 -10 -10 -10 -2 -2 -2 -2 -3 -3 -3 -3<br />
iLUC 0 0 0 0 0 0 0 0 0 0 0 0<br />
Crop pre-treatment 0 0 0 0 0 0 0 0 0 0,07 0 0<br />
Energy production 0,01 0,4 0,02 0,03 0,01 0,3 0,03 0,03 0,03 0,3 0,03 0,03<br />
Energy substitution -0,2 -0,2 -0,3 -0,4 -0,2 -0,3 -0,4 -0,4 -0,2 -0,2 -0,3 -0,4<br />
UOL (digestate) 98 0 0 0 99 0 0 0 115 0 0 0<br />
Raw manure management b<br />
11 0 0 0 5 0 0 0 8 0 0 0<br />
Other -17 0,1 0,1 0,2 -17 0,1 0,1 0,1 -17 -4 -3 -3<br />
N<strong>et</strong> c<br />
82 -9 -10 -10 85 -2 -2 -2 103 -6 -7 -7<br />
P as a ressource (kg P/ha of perennial crop)<br />
dLUC -157 -157 -157 -157 48 48 48 48 0 0 0 0<br />
iLUC 0 0 0 0 0 0 0 0 0 0 0 0<br />
Crop pre-treatment 0 0 0 0 0 0 0 0 0 0 0 0<br />
Energy production 0 0 0 0 0 0 0 0 0 0 0 0<br />
Energy substitution 0 0 0 0 0 0 0 0 0 0 0 0<br />
UOL (digestate) 0 0 0 0 0 0 0 0 0 0 0 0<br />
Raw manure management b<br />
560 0 0 0 550 0 0 0 556 0 0 0<br />
Other -515 -1 0 0 -524 -1 -1 -1 -519 0 0 0<br />
N<strong>et</strong> c<br />
-112 -158 -158 -158 74 47 47 47 36 0 0 0<br />
a<br />
AD: Anaerobic digestion; GA: Gasification; CO: Combustion; CF: Co-fir<strong>in</strong>g.<br />
b<br />
Raw manure storage (avoided), application on land (avoided) and fertilisers (<strong>in</strong>duced) because the raw manure is no longer a fertiliser.<br />
c Eventual <strong>in</strong>consistencies due to round<strong>in</strong>g.<br />
4. Conclusion<br />
Overall, co-fir<strong>in</strong>g of Miscanthus and willow were the options present<strong>in</strong>g the best environmental performances.<br />
These performances can probably be <strong>in</strong>creased <strong>in</strong> the future as yields for these crops undergo<br />
further research and development, especially Miscanthus, a C4 crop. It should however be realised that a<br />
ma<strong>in</strong> driver for future utilisation of biomass may be to balance electricity generation from fluctuat<strong>in</strong>g energy<br />
sources, such as w<strong>in</strong>d and solar power. Not all biomass combustion technologies may be suited for this, especially<br />
when co-generation of heat is important, as such plants can have a fixed production ratio b<strong>et</strong>ween<br />
electricity and heat. Anaerobic co-digestion as well as gasification of biomass, on the other hand, may be<br />
operated more flexible without similar constra<strong>in</strong>ts. Additionally, syngas or biogas offers the flexibility of<br />
storage. On this basis, improv<strong>in</strong>g the environmental performance of these BtE conversion technologies<br />
would be desirable. For anaerobic co-digestion, a solution may be to favour manure-based biogas tog<strong>et</strong>her<br />
243
PARALLEL SESSION 3A: LAND USE CHANGE 8 th Int. Conference on <strong>LCA</strong> <strong>in</strong> the<br />
Agri-<strong>Food</strong> Sector, 1-4 Oct <strong>2012</strong><br />
with co-substrates not <strong>in</strong>volv<strong>in</strong>g iLUC (e.g. straw, organic municipal household waste, garden waste) as well<br />
as <strong>in</strong> boost<strong>in</strong>g the digestion process by other means (e.g. digestion <strong>in</strong> series, addition of hydrogen, <strong>et</strong>c.).<br />
6. References<br />
Bessou, C., Ferchaud, F., Gabrielle, B., Mary, B., 2011. Biofuels, greenhouse gases and climate change. A review. Agron. Susta<strong>in</strong>.<br />
Dev. 31, 1-79.<br />
Brandão, M., Milà i Canals, L., Clift, R., 2010. Soil organic carbon changes <strong>in</strong> the cultivation of energy crops: Implications for GHG<br />
balances and soil quality for use <strong>in</strong> <strong>LCA</strong>. Biomass Bioenerg. 35(6), 2323-2336.<br />
Edwards, R., Mulligan, D., Marelli, L., 2010. Indirect land use change from <strong>in</strong>creased biofuels demand. Comparison of models and<br />
results for marg<strong>in</strong>al biofuels production from different feedstocks. European Commission Jo<strong>in</strong>t Research Centre, Luxembourg,<br />
Luxembourg, European Union.<br />
Energ<strong>in</strong><strong>et</strong>.dk, 2010. Energi 2050. Udvikl<strong>in</strong>gsspor for energisystem<strong>et</strong>. Energ<strong>in</strong><strong>et</strong>.dk, Fredericia, Denmark.<br />
Hamel<strong>in</strong>, L., Jørgensen, U., P<strong>et</strong>ersen, B.M., Olesen, J.E., Wenzel, H., <strong>2012</strong>. Modell<strong>in</strong>g the carbon and nitrogen balances of direct<br />
land use changes from energy crops <strong>in</strong> Denmark: a consequential life cycle <strong>in</strong>ventory. GCB Bioenergy, DOI: 10.1111/j.1757-<br />
1707.<strong>2012</strong>.01174.x<br />
Hamel<strong>in</strong>, L., Wesnaes, M., Wenzel, H., P<strong>et</strong>ersen, B.M., 2011. Environmental Consequences of Future Biogas Technologies Based on<br />
Separated Slurry. Environ. Sci. Technol. 45, 5869-5877.<br />
Hauschild M., Pott<strong>in</strong>g, J., 2005. Spatial differentiation <strong>in</strong> life cycle impact assessment – The EDIP 2003 m<strong>et</strong>hodology. Environmental<br />
news no. 80, Danish M<strong>in</strong>istry of the Environment, Environmental Protection Agency, Copenhagen, Denmark.<br />
IPCC, 2006. Chapter 2: generic M<strong>et</strong>hodologies applicable to multiple land-use categories, <strong>in</strong>: Eggleston, H.S., Buendia, L., Miwa,<br />
K., Ngara, T., Tabane, K. (eds), Volume 4: Agriculture, Firestry and Other land use. 2006 IPCC guidel<strong>in</strong>es for national greenhouse<br />
gas <strong>in</strong>ventories, IGES, Japan, pp. 2.1-2.59.<br />
Jolli<strong>et</strong>, O., Margni, M., Charles, R., Humbert, S., Pay<strong>et</strong>, J., Rebitzer, G., Rosenbaum, R., 2003. IMPACT 2002+: A new life cycle<br />
impact assessment m<strong>et</strong>hodology. Int. J. Life Cycle Ass. 8, 324-330.<br />
Jungbluth, N., Chudacoff, M., Dauriat, A., D<strong>in</strong>kel, F., Doka, G., Faist Emmenegger, M., Gnansounou, E., Kljun, N., Schleiss, K.,<br />
Spielmann, M., St<strong>et</strong>tler, C., Sutter, J., 2007. Life cycle <strong>in</strong>ventory of bioenergy, eco<strong>in</strong>vent Report no. 17. Swiss Centre for Life<br />
Cycle Inventories, Dübendorf, Switzerland.<br />
Klimakommissionen, 2010. Danish Commission on Climate Change Policy. Green energy - the road to a Danish energy system<br />
without fossil fuels. Summary of the work, results and recommendations of the Danish Commission on Climate Change Policy,<br />
Copenhagen, Denmark<br />
Kløverpris, J.H., 2008. Consequential life cycle <strong>in</strong>ventory modell<strong>in</strong>g of land use <strong>in</strong>duced by crop consumption. PhD thesis: Department<br />
of Management Eng<strong>in</strong>eer<strong>in</strong>g, Technical University of Denmark (DTU), Lyngby, Denmark, ISBN: 978-87-90855-69-7.<br />
Laborde, D., 2011. Assess<strong>in</strong>g the Land Use Change Consequences of European Biofuel Policies. International <strong>Food</strong> Policy Institute<br />
(IFPRI): Wash<strong>in</strong>gton, DC, USA.<br />
Lund, H., Hvelplund, F., Mathiesen, B.V., Alberg Østergaard, P., Christensen, P., Connolly, D., Schaltz, E., Pillay, J.R., Nielsen,<br />
M.P., Felby, C., Bentsen, N.S., Ton<strong>in</strong>i, D., Astrup, T., Meyer, N.I., Heussen, K., L<strong>in</strong>d, M., Morthorst, P.E., Andersen, F.M.,<br />
Münster, M., Hansen, L-L.P., Wenzel, H., Hamel<strong>in</strong>, L., Munskgaard, J., Karnøe, P., 2011. Coherent energy and environmental<br />
system analysis, a strategic research project f<strong>in</strong>anced by the Danish Council for strategic research, programme commission on<br />
susta<strong>in</strong>able energy and environment. Department of Development and Plann<strong>in</strong>g, Aalborg University, Aalborg, Denmark.<br />
Müller-Wenk, R., Brandão, M., 2010. Climatic impact of land use <strong>in</strong> <strong>LCA</strong> - carbon transfers b<strong>et</strong>ween veg<strong>et</strong>ation/soil and air. Int. J.<br />
Life Cycle Ass. 15, 172-182.<br />
NERI, 2010. Emissions from decentralised CHP plants 2007. Environmental project no. 07/1882. Project report 5–Emission factors<br />
and emission <strong>in</strong>ventory for decentralised CHP production. National Environmental Research Institute: Aarhus University, Aahrus,<br />
Denmark<br />
Search<strong>in</strong>ger T., Heimlich R., Houghton R.A., Dong F., Elobeid A., Fabiosa J., Tokgoz S., Hayes D., Yu T.-H, 2008. Use of U.S.<br />
croplands for biofuels <strong>in</strong>creases greenhouse gases through emissions from land-use change. Science 319, 1238-1240.<br />
Styles, D, Jones, M.B., 2007. Energy crops <strong>in</strong> Ireland: Quantify<strong>in</strong>g the potential life-cycle greenhouse gas reductions of energy-crop<br />
electricity. Biomass Bioenerg. 31, 759-772.<br />
Tyner, W.E., Taheripour, F., Zhuang, Q., Birur, D., Baldos, U., 2010. Land use changes and consequent CO2 emissions due to US<br />
corn <strong>et</strong>hanol production: A comprehensive analysis. Department of Agricultural Economics: Purdue University, Indiana, USA.<br />
Weidema, B., 2003. Mark<strong>et</strong> <strong>in</strong>formation <strong>in</strong> life cycle assessment. Environmental Project no. 863, Danish M<strong>in</strong>istry of the Environment,<br />
Environmental Protection Agency, Copenhagen, Denmark.<br />
244
PARALLEL SESSION 3A: LAND USE CHANGE 8 th Int. Conference on <strong>LCA</strong> <strong>in</strong> the<br />
Agri-<strong>Food</strong> Sector, 1-4 Oct <strong>2012</strong><br />
A model of <strong>in</strong>direct land use change<br />
Jannick H Schmidt 1,* , Jürgen Re<strong>in</strong>hard 2 , Bo P Weidema 3<br />
1 2.-0 <strong>LCA</strong> consultants, Skibbrogade 5, 1, 9000 Aalborg, Denmark<br />
2 EMPA, Technology and Soci<strong>et</strong>y Lab, Überlandstrasse 126, Dübendorf, Switzerland<br />
3 Aalborg University, The Danish Centre for Environmental Assessment, Skibbrogade 5, 1, 9000 Aalborg, Denmark<br />
Correspond<strong>in</strong>g author. E-mail: js@lca-n<strong>et</strong>.com<br />
ABSTRACT<br />
Around 9% of global carbon emissions <strong>in</strong> 2010 orig<strong>in</strong>ated from deforestation. Often, these emissions are not appropriately addressed<br />
<strong>in</strong> life cycle assessment (<strong>LCA</strong>). The l<strong>in</strong>k b<strong>et</strong>ween demand for land <strong>in</strong> one region and deforestation <strong>in</strong> other regions is referred to as<br />
<strong>in</strong>direct land use changes (iLUC). Exist<strong>in</strong>g models for iLUC most often operate with arbitrary amortisation periods to allocate deforestation<br />
emissions over time, and the causal l<strong>in</strong>k b<strong>et</strong>ween land occupation and deforestation is generally weekly established. This<br />
paper presents an iLUC model where amortisation is avoided by use of IPCC’s global warm<strong>in</strong>g potential. The causal l<strong>in</strong>k b<strong>et</strong>ween<br />
demand for land and land use changes is well established through mark<strong>et</strong>s for land. The land use effects <strong>in</strong>clude changes <strong>in</strong> land<br />
cover, i.e. deforestation, as well as <strong>in</strong>tensification of land already <strong>in</strong> use. The presented iLUC model is applicable to all types of land,<br />
all crops and <strong>in</strong> all regions of the world.<br />
Keywords: <strong>in</strong>direct land use changes, iLUC, consequential, attributional, land use change transition matrix<br />
1. Introduction<br />
Accord<strong>in</strong>g to P<strong>et</strong>ers <strong>et</strong> al., (<strong>2012</strong>), around 9% of global carbon emissions <strong>in</strong> 2010 orig<strong>in</strong>ated from deforestation.<br />
Often, these emissions are not addressed <strong>in</strong> life cycle assessment (<strong>LCA</strong>) because the causal l<strong>in</strong>k b<strong>et</strong>ween<br />
the use of land and deforestation is not well described and because there is a miss<strong>in</strong>g consensus on<br />
how to establish this l<strong>in</strong>k. Further, several studies suggest that effects from <strong>in</strong>tensification of cropland may<br />
be caused by changes <strong>in</strong> demand for land. In the follow<strong>in</strong>g a new model and data for establish<strong>in</strong>g the causal<br />
l<strong>in</strong>k b<strong>et</strong>ween the use of land and the effects on land use changes and <strong>in</strong>tensification are presented. Here, this<br />
l<strong>in</strong>k is referred to as <strong>in</strong>direct land use changes (iLUC).<br />
iLUC is def<strong>in</strong>ed as the upstream consequences of the occupation of land, regardless of what you do to it.<br />
Whereas <strong>in</strong>direct land use changes are upstream life cycle impacts of an activity which <strong>in</strong>duces the land use<br />
change, direct land use changes take place only <strong>in</strong> the land transform<strong>in</strong>g activity. It should be noticed that the<br />
upstream effects, i.e. deforestation and <strong>in</strong>tensification, of occupy<strong>in</strong>g land <strong>in</strong> one region of the world are<br />
likely to take place <strong>in</strong> other parts of the world.<br />
The model is based on the assumption that current demand for land causes current land use changes. The<br />
mark<strong>et</strong> for land is def<strong>in</strong>ed as a service that supplies capacity for production of biomass. This mark<strong>et</strong> has <strong>in</strong>puts<br />
from different suppliers, e.g. land already <strong>in</strong> use, expansion of land (which may cause deforestation) and<br />
<strong>in</strong>tensification. The presented model is applicable to all regions <strong>in</strong> the world and to all types of land use. The<br />
standard reference flow for the use of land, ‘land tenure’, is the land’s potential production capacity, measured<br />
as the potential n<strong>et</strong> primary production, NPP0 (<strong>in</strong> unit kg carbon). This can easily be converted to occupation<br />
<strong>in</strong> units of hectare years (ha yr), e.g. by use of data <strong>in</strong> Haberl <strong>et</strong> al., (2007). The concept is illustrated<br />
<strong>in</strong> Figure 2.<br />
The start<strong>in</strong>g po<strong>in</strong>t of the model is an <strong>in</strong>ventory of the total global observed land use changes. The account<strong>in</strong>g<br />
framework for this is a land use change transition matrix, see Table 2. The land use change transition<br />
matrix is ma<strong>in</strong>ly based on FAO’s Global Forest Resources Assessment (FAO 2010). Dist<strong>in</strong>ction is made<br />
b<strong>et</strong>ween different mark<strong>et</strong>s for land; land suitable for arable cropp<strong>in</strong>g, land suitable for forestry, land suitable<br />
for rangeland, and other land (barren, deserts, ice caps <strong>et</strong>c.). The land tenure mark<strong>et</strong> activities have four types<br />
of <strong>in</strong>puts: land already <strong>in</strong> use, expansion, <strong>in</strong>tensification and crop displacement. The emissions related to<br />
deforestation and <strong>in</strong>tensification are based on IPCC (2006) and Schmidt (2008) respectively. The <strong>in</strong>ventory<br />
framework allows for the application of consequential and attributional modell<strong>in</strong>g assumptions. Time related<br />
effects are addressed by use of a fate function of CO2 pulse emissions <strong>in</strong> the atmosphere opposed to the amortisation<br />
approach which is typically used <strong>in</strong> iLUC models.<br />
2. M<strong>et</strong>hods<br />
2.1 Goal and scope<br />
The purpose of the presented iLUC model is to provide a life cycle <strong>in</strong>ventory of the upstream consequences<br />
of land occupation. These consequences <strong>in</strong>clude land transformation as well as <strong>in</strong>tensification. The<br />
245
PARALLEL SESSION 3A: LAND USE CHANGE 8 th Int. Conference on <strong>LCA</strong> <strong>in</strong> the<br />
Agri-<strong>Food</strong> Sector, 1-4 Oct <strong>2012</strong><br />
model is applicable to all types of land <strong>in</strong> all regions of the world for all types of crops regardless of what<br />
they are used for; food, biofuel, fiber or other.<br />
The model is applicable to so-called small scale changes, i.e. changes that do not change overall mark<strong>et</strong><br />
trends (Weidema <strong>et</strong> al., 2009). An example of a large scale change would be if the change under study required<br />
a considerable share of the rema<strong>in</strong><strong>in</strong>g land available for arable cropp<strong>in</strong>g so that the ratio b<strong>et</strong>ween expansion<br />
and <strong>in</strong>tensification would be affected. It should be noted that a large scale change would require<br />
really large changes <strong>in</strong> demand for land; more than most current biofuel policies imply. Large scale changes<br />
needs to be analysed specifically by use of scenario modell<strong>in</strong>g.<br />
The model only <strong>in</strong>cludes long-term changes <strong>in</strong> supply caused by a change <strong>in</strong> demand. Hence, short-term<br />
effects on prices and subsequent price-elasticity effects are not <strong>in</strong>cluded. This implies that reduced food consumption<br />
as a result of <strong>in</strong>creased demand for land is not <strong>in</strong>cluded.<br />
2.2 Functional unit<br />
Activities which <strong>in</strong>clude occupation of land obviously need a specified area <strong>in</strong> a specified period of time.<br />
This can be measured <strong>in</strong> hectare years (ha yr). An <strong>LCA</strong> mark<strong>et</strong> activity is def<strong>in</strong>ed <strong>in</strong> order to model this. This<br />
activity is called ‘Mark<strong>et</strong> for land tenure’. It is the <strong>in</strong>puts and outputs of the mark<strong>et</strong> for land tenure that is the<br />
modell<strong>in</strong>g of iLUC. An obvious option for a reference flow of a land tenure activity would be occupation of<br />
land (ha yr). However, this approach does not take <strong>in</strong>to account that the potential production on 1 ha yr land<br />
<strong>in</strong> e.g. a dry temperate climate is very different from the potential <strong>in</strong> w<strong>et</strong> tropical climate. This could be<br />
overcome by operat<strong>in</strong>g with a k<strong>in</strong>d of productivity weighted occupation of land. Another option would be the<br />
potential n<strong>et</strong> primary production (NPP0), measured <strong>in</strong> unit of kg carbon. S<strong>in</strong>ce the latter provides a simple<br />
way to <strong>in</strong>clude land with different productivities, this option is chosen. Thus, the reference flow of the <strong>LCA</strong><br />
activities that supply land tenure is def<strong>in</strong>ed as the contribution to the production capacity. This can be <strong>in</strong>terpr<strong>et</strong>ed<br />
<strong>in</strong> parallel to a production facility’s capacity to produce a product. It is up to the current production<br />
facility to utilise the capacity, like e.g. a 400 MW power plant has the capacity to produce 400 MW, but most<br />
often the <strong>in</strong>stalled capacity is not fully utilised. In the case of a land-us<strong>in</strong>g activity, it is up to the land-us<strong>in</strong>g<br />
activity to utilise the land’s capacity to produce biomass. Hence, the functional unit (or reference flow) of the<br />
land tenure mark<strong>et</strong> activity is def<strong>in</strong>ed as of Table 1.<br />
It should be noted that the current iLUC model covers all regions <strong>in</strong> the world. Some areas have very low<br />
or even zero potential n<strong>et</strong> primary production. This is valid for barren land, deserts, ice caps, high mounta<strong>in</strong>s<br />
<strong>et</strong>c. S<strong>in</strong>ce the productive function of these lands cannot be production of plant material, NPP0 is not a feasible<br />
reference flow. Instead, the reference flow is measured <strong>in</strong> units of area*time. The environmental impacts<br />
from transform<strong>in</strong>g these lands <strong>in</strong>to e.g. urban area or m<strong>in</strong><strong>in</strong>g sites is not associated with changes on below<br />
and above ground carbon (which causes GHG-emissions) and the effect on biodiversity, measured as the<br />
absolute number of species affected, is very limited.<br />
Table 1. Functional unit of the land tenure mark<strong>et</strong>.<br />
Functional unit<br />
Productive land (plant material):<br />
The functional unit is def<strong>in</strong>ed <strong>in</strong> terms of potential n<strong>et</strong> primary production (NPP0) as 1 kg C. The reference<br />
flow of the land tenure mark<strong>et</strong> activity is ‘biomass production capacity, measured <strong>in</strong> kg NPP0’. Data on<br />
potential n<strong>et</strong> primary production (NPP0) <strong>in</strong> different parts of the world can be obta<strong>in</strong>ed from Haberl <strong>et</strong> al.,<br />
(2007, SI figure 2).<br />
Other land:<br />
Another functional unit has been used for the land tenure mark<strong>et</strong> ‘other land’, which <strong>in</strong>cludes barren land,<br />
deserts, ice caps, high mounta<strong>in</strong>s <strong>et</strong>c. The functional unit is def<strong>in</strong>ed as 1 ha yr, and the reference flow is<br />
measured <strong>in</strong> units of area*time.<br />
2.3 System boundaries, causalities and time perspectives<br />
To understand the concept of iLUC, it must be realised that there are two types of land use change, i.e. direct<br />
land use changes (dLUC) and <strong>in</strong>direct land use changes (iLUC). dLUC is def<strong>in</strong>ed as the consequences of<br />
what you do to the land that you occupy. These effects take place with<strong>in</strong> the same <strong>LCA</strong> activity that uses<br />
(occupy) the land. iLUC is def<strong>in</strong>ed as the upstream consequences of the occupation of land, regardless of<br />
what you do to it. These effects have previously been called the comp<strong>et</strong>ition effect (L<strong>in</strong>deijer <strong>et</strong> al., 2001).<br />
The iLUC and dLUC are illustrated <strong>in</strong> Figure 1. In Figure 1, the area “a” is occupied by the product under<br />
study. Fig. 1 shows two situations; left illustrates the situation when the product under study is not de-<br />
246
PARALLEL SESSION 3A: LAND USE CHANGE 8 th Int. Conference on <strong>LCA</strong> <strong>in</strong> the<br />
Agri-<strong>Food</strong> Sector, 1-4 Oct <strong>2012</strong><br />
manded/produced, and right illustrates the situation where the product is demanded/produced. The situation<br />
<strong>in</strong> the right side obviously requires some land occupation (“a”) <strong>in</strong> the country where the product is produced.<br />
This is illustrated as aafter. The difference b<strong>et</strong>ween abefore and aafter illustrates the direct land use effects. Often<br />
the dLUC only <strong>in</strong>volves replant<strong>in</strong>g of exist<strong>in</strong>g arable land, or other shifts b<strong>et</strong>ween land use types which are<br />
already <strong>in</strong> use. The land use change related emissions of this are most often <strong>in</strong>significant. However, dra<strong>in</strong>age<br />
of organic soils which is <strong>in</strong>cluded <strong>in</strong> dLUC is significant <strong>in</strong> terms of GHG-emissions. This paper does not<br />
focus on dLUC. When abefore is transformed to aafter the n<strong>et</strong> output of the land <strong>in</strong> the affected country is reduced<br />
from 10 t to 9 t (quantities are just for illustration). To compensate for this reduction, new production<br />
capacity is needed. This is illustrated as the transformation from bbefore to bafter. bbefore represents a situation<br />
where the land is not <strong>in</strong> use. The transformation of the area b often <strong>in</strong>volves deforestation, and this is what is<br />
referred to as iLUC. Notice that iLUC is illustrated as transformation of land only; as it is described later <strong>in</strong><br />
this paper, iLUC also <strong>in</strong>clude <strong>in</strong>tensification and crop displacement.<br />
Situation without land use<br />
S = 10 t<br />
10 t<br />
Country X Country X<br />
1 t<br />
bbefore<br />
Country Y<br />
abefore<br />
Country Y<br />
Figure. 1: Illustration of direct and <strong>in</strong>direct land use changes. The land under study is the area “a”. To fully<br />
account for land use changes, the sum of direct and <strong>in</strong>direct land use changes shall be <strong>in</strong>cluded.<br />
The overall concept of the model is that it is assumed that the current use of land reflects the current demand<br />
for land, and that land use changes are caused by changes <strong>in</strong> demand for land. This concept is equivalent<br />
to all other modell<strong>in</strong>g <strong>in</strong> life cycle <strong>in</strong>ventory, i.e. the demand for a product d<strong>et</strong>erm<strong>in</strong>es the production<br />
volume. The mark<strong>et</strong> for land is def<strong>in</strong>ed as a service that supplies capacity for production of biomass. This<br />
capacity can be obta<strong>in</strong>ed from the mark<strong>et</strong>, which has <strong>in</strong>puts from different suppliers, e.g. expansion of land<br />
(such as deforestation) and <strong>in</strong>tensification.<br />
The l<strong>in</strong>k b<strong>et</strong>ween <strong>LCA</strong> activities that occupy land and the land use changes is established via the mark<strong>et</strong>s<br />
for land, and <strong>in</strong>direct land use changes are modelled as upstream <strong>in</strong>puts to the product system. The upstream<br />
effects (<strong>in</strong>direct land use changes) related to the occupation of land are illustrated <strong>in</strong> Figure 2. Notice that all<br />
<strong>in</strong>flows to the land tenure <strong>LCA</strong> activity are measured <strong>in</strong> kg NPP0 (as kg C). This is expla<strong>in</strong>ed further <strong>in</strong> section<br />
2.5.<br />
When the occupation of land causes deforestation, a critical po<strong>in</strong>t is often to decide the period of time, the<br />
deforestation emissions should be 'amortised' over. The current model does not operate with amortisation. If<br />
only expansion is considered, occupation of 1 ha <strong>in</strong> 1 year will cause 1 ha deforestation. After the duration of<br />
1 yr, the land is given over to other crops, which can then be grown without deforestation. Hence, the occupation<br />
of 1 ha yr is modelled as 1 ha deforestation <strong>in</strong> year 0 and -1 ha deforestation <strong>in</strong> year 1. The Bern Cycle,<br />
which represents the fate of a CO2 pulse emission and which is used to calculate the global warm<strong>in</strong>g<br />
potential (GWP100), is used to calculate the GWP100 associated with speed<strong>in</strong>g up deforestation as referred<br />
to above.<br />
The model enables for operat<strong>in</strong>g with consequential and attributional modell<strong>in</strong>g assumptions. The difference<br />
b<strong>et</strong>ween the two approaches is here def<strong>in</strong>ed as; attributional modell<strong>in</strong>g <strong>in</strong>cludes the average of all suppliers<br />
to a mark<strong>et</strong> for land whereas consequential modell<strong>in</strong>g excludes constra<strong>in</strong>ed suppliers. Therefore, the<br />
difference is that the consequential <strong>in</strong>ventory only <strong>in</strong>cludes <strong>in</strong>puts of expansion and <strong>in</strong>tensification (see Figure<br />
2), whereas the attributional <strong>in</strong>ventory also <strong>in</strong>cludes <strong>in</strong>puts from land already <strong>in</strong> use.<br />
2.4 Segmentation of the land tenure mark<strong>et</strong>, five land mark<strong>et</strong>s<br />
Situation with land use<br />
S = 11 t<br />
Product under study: 1 t<br />
10 t – 1 t = 9 t<br />
Direct land use changes<br />
bafter<br />
aafter<br />
abefore<br />
bbefore<br />
aafter<br />
Indirect land use changes<br />
bafter<br />
247
PARALLEL SESSION 3A: LAND USE CHANGE 8 th Int. Conference on <strong>LCA</strong> <strong>in</strong> the<br />
Agri-<strong>Food</strong> Sector, 1-4 Oct <strong>2012</strong><br />
The relevant functions of land to be modelled is the land’s ability to produce products, i.e. crops, grass<br />
and wood, and the function to provide area for human structures, i.e. build<strong>in</strong>gs, <strong>in</strong>frastructure and production<br />
facilities such as m<strong>in</strong>es. When forests and human structures occupy land suitable for agriculture, it will have<br />
similar land use related effects as when crops are grown, because it is related to the acquisition of the same<br />
type of land. The follow<strong>in</strong>g five dist<strong>in</strong>ct mark<strong>et</strong>s for land are considered (All land tenure mark<strong>et</strong>s can be used<br />
for urban, <strong>in</strong>dustrial or <strong>in</strong>frastructure area):<br />
Extensive forest land: not fit for more <strong>in</strong>tensive forestry (e.g. clear cutt<strong>in</strong>g and reforestation), e.g. because<br />
it is too hilly, too remote, or it is grow<strong>in</strong>g on very <strong>in</strong>fertile land mak<strong>in</strong>g <strong>in</strong>tensive forestry uneconomic.<br />
Forests grown on extensive forestland are typically harvest after natural regrowth with<br />
mixed species.<br />
Intensive forest land: fit for <strong>in</strong>tensive forestry (e.g. clear cutt<strong>in</strong>g, reforestation, species control <strong>et</strong>c.),<br />
but not fit for arable cultivation because the soil cannot be treated for arable cultivation, e.g. because<br />
the soil is too rocky. Forests grown on <strong>in</strong>tensive forestland may be managed as <strong>in</strong>tensive or extensive<br />
forestry. Intensive forest land may also be used for other land use, e.g. livestock grass<strong>in</strong>g and extensive<br />
forestry.<br />
Arable land: fit for arable cultivation (annual crops and perennial crops). Arable land may be used<br />
for cultivation of annual or perennial crops, for <strong>in</strong>tensive or extensive forestry, and pasture.<br />
Rangeland: too dry for forestry and arable cultivation. Therefore, when <strong>in</strong> use, rangeland is most often<br />
used for livestock grass<strong>in</strong>g.<br />
other land: not fit for biomass production; barren land, deserts, ice caps, high mounta<strong>in</strong>s <strong>et</strong>c.<br />
It should be noted that the above mentioned land mark<strong>et</strong>s are regarded as separate mark<strong>et</strong>s for land, i.e.<br />
acquisition for a specific type of land is not associated with upstream effects on the other land use types. This<br />
is also the reason that the term ‘not fit for agriculture’ is added to forest land; if forest is grown on agricultural<br />
land then the upstream effects will be caused by the effect on the crop cultivation on this land.<br />
Exist<strong>in</strong>g land<br />
Output Flow Unit Wheat <strong>LCA</strong> activity (1 ha yr)<br />
Land already <strong>in</strong> use a 2 kg NPP 0 Output Flow Unit<br />
Inputs Wheat 7200 kg wheat<br />
None - Inputs from technoesphere<br />
Emissions Land tenure mark<strong>et</strong> <strong>LCA</strong> activity Diesel for traction 4921 MJ<br />
None - Output Flow Unit N-Fertiliser, as N 161 kg<br />
Land tenure, NPP 0 as kg C a 1 kg NPP 0 Land tenure, NPP 0 as kg C 7000 kg<br />
Land use changes Inputs from technosphere Emissions<br />
Output Flow Unit Land already <strong>in</strong> use a 2 kg NPP 0 CO 2 fossil (diesel combustion) 365 kg<br />
Expansion a 3 kg NPP 0 Expansion a 3 kg NPP 0 N 2O 4.3 kg<br />
Ressource <strong>in</strong>puts from nature Intensification a 4 kg NPP 0 Resources<br />
Transformation from… b 1 ha Crop displacement a5 kg NPP 0 CO 2 from air 10300 kg<br />
Transformation to… b 2 ha<br />
Emissions<br />
e.g. CO 2 b 3… kg<br />
Intensification<br />
Output Flow Unit<br />
Intensification a 4 kg NPP 0<br />
Inputs from technosphere<br />
Diesel for traction c 1 MJ<br />
N-Fertiliser, as N c 2 kg<br />
Emissions<br />
e.g. N 2O, CO 2 c 3... kg<br />
Social/hunger effects<br />
Output Flow Unit<br />
Crop displacement a 4 kg NPP 0<br />
Inputs<br />
None -<br />
Emissions<br />
None -<br />
Figure 2. Illustration of the land tenure mark<strong>et</strong> activity and it’s <strong>in</strong>puts and outputs. An agricultural activity,<br />
here wheat, has <strong>in</strong>puts from the land tenure mark<strong>et</strong> activity. The land tenure mark<strong>et</strong> activity has <strong>in</strong>puts from<br />
four different supplies of biomass production capacity. Each of these suppliers is associated with emissions.<br />
The sum of these emissions is referred to as iLUC emissions.<br />
2.5 Life cycle <strong>in</strong>ventory data<br />
248
PARALLEL SESSION 3A: LAND USE CHANGE 8 th Int. Conference on <strong>LCA</strong> <strong>in</strong> the<br />
Agri-<strong>Food</strong> Sector, 1-4 Oct <strong>2012</strong><br />
As illustrated <strong>in</strong> Figure 1, the land tenure mark<strong>et</strong> <strong>LCA</strong> activity has <strong>in</strong>puts of land already <strong>in</strong> use, expansion,<br />
<strong>in</strong>tensification, and crop displacement. The <strong>LCA</strong> activity ‘Land already <strong>in</strong> use’ is not associated with<br />
any <strong>in</strong>puts or emissions because this land’s production capacity is already established, and because ma<strong>in</strong>tenance<br />
of this capacity is <strong>in</strong>ventoried as emissions belong<strong>in</strong>g to the agricultural activity that occupies the land.<br />
The activity ‘Expansion’ has emissions of CO2 and N2O associated with land transformation (most often<br />
deforestation). The emissions are d<strong>et</strong>erm<strong>in</strong>ed based on the land use change transition matrix presented <strong>in</strong><br />
Table 2 comb<strong>in</strong>ed with data on above and below ground carbon stocks <strong>in</strong> IPCC (2006, chapter 4, 5 and 6)<br />
and N2O model <strong>in</strong> IPCC (2006, chapter 11). By-products as timber and emissions related to diesel <strong>et</strong>c. <strong>in</strong> the<br />
deforestation activity are not <strong>in</strong>cluded <strong>in</strong> the current version of the iLUC model. The activity ‘Intensification’<br />
has <strong>in</strong>puts of fertilisers and traction, and emissions associated with the fertiliser. The <strong>in</strong>ventory data of <strong>in</strong>tensification<br />
are described further <strong>in</strong> Schmidt (2008). The activity ‘Crop displacement’ (not <strong>in</strong>cluded <strong>in</strong> the<br />
iLUC model) has no <strong>in</strong>puts or emissions. If the activity was <strong>in</strong>cluded, <strong>in</strong>ventory items related to social impacts<br />
should be considered.<br />
All <strong>in</strong>flows to the land mark<strong>et</strong> tenure activity are measured <strong>in</strong> kg NPP0 (as kg carbon). The NPP0 from<br />
land already <strong>in</strong> use and expansion are d<strong>et</strong>erm<strong>in</strong>ed based on general NPP0 per ha yr figures (Haberl <strong>et</strong> al.,<br />
2007) and figures on total area of land already <strong>in</strong> use and annual deforestation (FAO 2010; FAOSTAT<br />
2011). The NPP0 from <strong>in</strong>tensification is calculated as the carbon <strong>in</strong> crop produced via <strong>in</strong>tensification dur<strong>in</strong>g<br />
one year. The <strong>in</strong>tensification is d<strong>et</strong>erm<strong>in</strong>ed based on crop dose-response figures for fertiliser <strong>in</strong>put (Schmidt<br />
2008) comb<strong>in</strong>ed with <strong>in</strong>formation on which crops and where <strong>in</strong>tensification takes place (data from<br />
FAOSTAT 2011) and current fertiliser levels for these crops (IFA 2011).<br />
Table 2. Land use change matrix, unit: million ha. The global land use transition matrix is established for an<br />
average year <strong>in</strong> 2000-2010. The top column head<strong>in</strong>gs divide the total land <strong>in</strong>to land not <strong>in</strong> use and land <strong>in</strong><br />
use. For the land <strong>in</strong> use there are four land tenure mark<strong>et</strong>s. The growth of these mark<strong>et</strong>s, which <strong>in</strong>volves deforestation<br />
and land degradation, can be seen as <strong>in</strong>puts <strong>in</strong> the rows. (Schmidt <strong>et</strong> al., <strong>2012</strong>)<br />
Transformation to: Non use Mark<strong>et</strong>s<br />
Primary forest<br />
Secondary forest<br />
Other (grassland,<br />
w<strong>et</strong>land and scrubland)<br />
Transformation from:<br />
Primary forest 1,102 0 0 1.09 0.084 3.02 0 1,106<br />
Secondary forest 0.34 1,798 0 0 4.85 9.98 0 1,813<br />
Other (grassland, w<strong>et</strong>land and scrubland) 0 1.30 3,769 0 0 0.60 1.88 3,773<br />
Extensive forest 0 0 0 930 0 0 0 930<br />
Intensive forest 0 0 0 0 196 0 0 196<br />
Arable 0 0 0 0 0 1,624 0 1,624<br />
Range 0 0 0 0 0 0 3,569 3,569<br />
Total land use ref. year + 1 1,102 1,799 3,769 931 201 1,638 3,571 13,012<br />
3. Results<br />
Table 3 summarizes some results calculated with the iLUC model. The first column shows the affected<br />
region/country, the second column converts 1 ha yr to NPP0. The last three columns presents the results divided<br />
<strong>in</strong>to contributions from expansion and <strong>in</strong>tensification.<br />
Extensive forest<br />
land<br />
Intensive forest land<br />
Arable land<br />
Rangeland<br />
Total land use ref.<br />
year<br />
249
PARALLEL SESSION 3A: LAND USE CHANGE 8 th Int. Conference on <strong>LCA</strong> <strong>in</strong> the<br />
Agri-<strong>Food</strong> Sector, 1-4 Oct <strong>2012</strong><br />
Table 3. Results for the occupation of 1 ha yr of different land tenure mark<strong>et</strong>s (for global average). Further,<br />
<strong>in</strong> the lower part of the table example results are shown for arable land and rangeland <strong>in</strong> different countries <strong>in</strong><br />
the world. Results are shown when apply<strong>in</strong>g the consequential modell<strong>in</strong>g assumption.<br />
Affected land mark<strong>et</strong><br />
Global averages for 1 ha yr<br />
NPP0,<br />
kg C ha-1 yr-1 Expansion, kg CO2-eq.<br />
Result, consequential<br />
Intensification, kg CO2-eq. Total, kg CO2-eq.<br />
Arable 6,110 1,010 6,820 7,830<br />
Forest <strong>in</strong>t. 7,220 3,340 - 3,340<br />
Forest ext. 7,220 1,670 - 1,670<br />
Range<br />
Examples of country specific<br />
results for 1 ha yr<br />
4,860 1,160 - 1,160<br />
Arable, Malaysia 12,000 2,000 13,400 15,400<br />
Arable, Denmark 7,000 1,170 7,800 8,970<br />
Arable, Brazil Amazonas 9,000 1,500 10,000 11,500<br />
Range, Brazil Cerrado savannah 5,000 1,190 - 1,190<br />
Table 3 only shows results us<strong>in</strong>g the consequential modell<strong>in</strong>g assumption. If the attributional modell<strong>in</strong>g<br />
assumption is applied, the results for arable land will be around 4% of the results for consequential. Similarly,<br />
the results for forestland and rangeland are significantly lower. The reason for this is that <strong>in</strong> the attributional<br />
modell<strong>in</strong>g a large mark<strong>et</strong> share of the <strong>in</strong>puts to the land tenure mark<strong>et</strong> is comprised by ‘land already <strong>in</strong><br />
use’ which is not associated with any emissions.<br />
4. Discussion and conclusion<br />
This paper presents a model of iLUC. The model has the follow<strong>in</strong>g characteristics; it <strong>in</strong>cludes effects on<br />
deforestation and <strong>in</strong>tensification, allocation of deforestation emissions us<strong>in</strong>g a chosen amortisation period is<br />
avoided, the model is applicable to any land use type <strong>in</strong> any location, and the model can handle both consequential<br />
and attributional modell<strong>in</strong>g assumptions.<br />
The results show significant iLUC effects on global warm<strong>in</strong>g; crops with yields 5-7 t/ha yr grown on average<br />
yield<strong>in</strong>g land will be associated with iLUC effects at 1 to 1.5 kg CO2-eq./kg crop. For many arable<br />
crops this means a factor 2-4 <strong>in</strong>crease <strong>in</strong> GHG-emissions. For arable land the effect from <strong>in</strong>tensification<br />
comprises around 87% of the total iLUC where the rema<strong>in</strong><strong>in</strong>g is related to deforestation. The iLUC from<br />
forestry and rangeland are also significant. Here no <strong>in</strong>tensification is considered. For forestland, the emissions<br />
are caused by transformation of natural forest to cultivated forest, and for rangeland, the emissions<br />
orig<strong>in</strong>ate from transformation of natural savannah/scrub to grassland.<br />
The major uncerta<strong>in</strong>ties <strong>in</strong> the model are a) the mark<strong>et</strong> for land is assumed to be global, b) the d<strong>et</strong>erm<strong>in</strong>ation<br />
of NPP0 as of Haberl <strong>et</strong> al., (2007) is relative coarse gra<strong>in</strong>ed, so 10-15% uncerta<strong>in</strong>ty is associated with<br />
read<strong>in</strong>g maps which only show <strong>in</strong>tervals, c) the d<strong>et</strong>erm<strong>in</strong>ation of the relative distribution of <strong>in</strong>puts of expansion<br />
and <strong>in</strong>tensification to the land tenure mark<strong>et</strong> is associated with uncerta<strong>in</strong>ties s<strong>in</strong>ce it is based on <strong>in</strong>direct<br />
estimation m<strong>et</strong>hods, d) the modell<strong>in</strong>g of <strong>in</strong>tensification as of Schmidt (2008) only considers additional NPK<br />
fertiliser as an affected mean of <strong>in</strong>tensification, and e) also the dose-response effects <strong>in</strong> Schmidt (2008) of<br />
crop-yields relative to additional fertiliser are associated with uncerta<strong>in</strong>ties.<br />
Despite the uncerta<strong>in</strong>ties listed above, the model results are regarded as be<strong>in</strong>g with<strong>in</strong> reasonable uncerta<strong>in</strong>ty<br />
<strong>in</strong>tervals. It should be noticed, that the model concept is open for improved data <strong>in</strong>put at almost any<br />
level. This means that the presented model can be seen as a proposal for solv<strong>in</strong>g the conceptual challenges<br />
with the modell<strong>in</strong>g of iLUC, and that future improvements of the model will focus on improv<strong>in</strong>g <strong>in</strong>put data.<br />
6. References<br />
FAOSTAT, 2011. FAOSTAT, <strong>Food</strong> and agriculture organization of the United Nations. Accessed November 2011:<br />
http://faostat.fao.org/<br />
FAO, 2010. Global Forest Resources Assessment 2010 – ma<strong>in</strong> report. FAO, Rome<br />
Haberl H., He<strong>in</strong>z Erb K., Krausmann F., Gaube V., Bondeau A., Plutzar C., G<strong>in</strong>grich S., Lucht W. and Fischer-Kowalski M., 2007.<br />
Quantify<strong>in</strong>g and mapp<strong>in</strong>g the human appropriation of n<strong>et</strong> primary production <strong>in</strong> earths terrestrial ecosystems. PNAS, vol. 104,<br />
no. 31, pp 12942–12947<br />
IFA, 2011. Production and trade statistics. International Fertilizer Industry Association (IFA). Accessed November 2011:<br />
http://www.fertilizer.org/ifa/Home-Page/STATISTICS<br />
IPCC, 2006. 2006 IPCC Guidel<strong>in</strong>es for national greenhouse gas <strong>in</strong>ventories, Prepared by the National Greenhouse Gas Inventories<br />
Programme, Eggleston H S <strong>et</strong> al., (eds). IGES, Japan.<br />
P<strong>et</strong>ers G. P., Marland G., Le Quéré C., Boden T., Canadell J. G., Raupach M. R. (2011). Rapid growth <strong>in</strong> CO2 emissions after the<br />
2008-2009 global f<strong>in</strong>ancial crisis. Nature Climate Change 2, 2–4<br />
250
PARALLEL SESSION 3A: LAND USE CHANGE 8 th Int. Conference on <strong>LCA</strong> <strong>in</strong> the<br />
Agri-<strong>Food</strong> Sector, 1-4 Oct <strong>2012</strong><br />
L<strong>in</strong>deijer E., Müller-Wenk R., Steen B., with written contributions from, Baitz M., Broers J., F<strong>in</strong>nveden G., ten Houten M., Köllner<br />
T., May J., Mila i Canals L., Renner I. and Weidema B., 2001. Impact Assessment of resources and land use. SETAC WIA-2<br />
taskforce on resources and land<br />
Schmidt J. H., 2008. System delimitation <strong>in</strong> agricultural consequential <strong>LCA</strong>, outl<strong>in</strong>e of m<strong>et</strong>hodology and illustrative case study of<br />
wheat <strong>in</strong> Denmark. Int J Life Cycle Assess 13(4):350–364<br />
Schmidt J. H., Re<strong>in</strong>hard J., and Weidema B. P., <strong>2012</strong>. Modell<strong>in</strong>g of <strong>in</strong>direct land use changes <strong>in</strong> <strong>LCA</strong>, report v3. 2.-0 <strong>LCA</strong> consultants,<br />
Aalborg, http://www.lca-n<strong>et</strong>.com/projects/iLUC_model/<br />
Weidema B. P., Ekvall T., Heijungs R., 2009. Guidel<strong>in</strong>es for applications of deepened and broadened <strong>LCA</strong>. Deliverable D18 of work<br />
package 5 of the CA<strong>LCA</strong>S project.<br />
http://fr1.estis.n<strong>et</strong>/<strong>in</strong>cludes/file.asp?site=calcas&file=7F2938F9-09CD-409F-9D70-767169EC8AA9<br />
Weidema B. P., Bauer C., Hischier R., Mutel C., Nemecek T., Vadenbo C. O., Wern<strong>et</strong> G. (2011). Overview and m<strong>et</strong>hodology. Data<br />
quality guidel<strong>in</strong>e for the eco<strong>in</strong>vent database version 3. Eco<strong>in</strong>vent Report 1(v3). St. Gallen: The eco<strong>in</strong>vent Centre<br />
251
PARALLEL SESSION 3A: LAND USE CHANGE 8 th Int. Conference on <strong>LCA</strong> <strong>in</strong> the<br />
Agri-<strong>Food</strong> Sector, 1-4 Oct <strong>2012</strong><br />
252<br />
Land use change - GHG emissions from food and feedstuffs<br />
Stefan Hörtenhuber 1,2,* , Michaela Theurl 1 , Thomas L<strong>in</strong>denthal 1,3 ,Werner Zollitsch 2<br />
1 Research Institute of Organic Agriculture (FiBL) Austria<br />
2 University of Natural Resources and Life Sciences Vienna, Department of Susta<strong>in</strong>able Agricultural Systems<br />
3 University of Natural Resources and Life Sciences Vienna, Centre for Global Change and Susta<strong>in</strong>ability<br />
Correspond<strong>in</strong>g author. E-mail: stefan.hoertenhuber@fibl.org<br />
ABSTRACT<br />
Land use change (LUC) is assumed to be a major contributor to global CO2 emissions. Despite its great impact on global greenhouse<br />
gas (GHG) emissions, LUC is hardly <strong>in</strong>corporated <strong>in</strong>to GHG estimations for food and feedstuffs for various reasons related to m<strong>et</strong>hodological<br />
limitations. This contribution outl<strong>in</strong>es a m<strong>et</strong>hod which can be used to derive direct and <strong>in</strong>direct emissions from LUC on<br />
the national level for specific crops with<strong>in</strong> a given account<strong>in</strong>g period for allocation. LUC-related emissions are restricted to physically<br />
occurr<strong>in</strong>g fluxes; ten or 20 years are identified as suitable account<strong>in</strong>g periods for overall LUC-related emissions. Primarily, this<br />
contribution compares effects of different m<strong>et</strong>hods on the impact of emissions from LUC on the overall results for products’ GHG<br />
emissions. As a result, we suggest the use of m<strong>et</strong>hods which allow for a direct, product-related allocation as this is probably the only<br />
way to quantify mitigation strategies for LUC-related GHG emissions.<br />
Keywords: land use change, greenhouse gas emission, GHG, food, feedstuffs<br />
1. Introduction<br />
Land use change (LUC) and – to a much lesser extent – land use (LU) are assumed to be one of the major<br />
contributors to global CO2 emissions, contribut<strong>in</strong>g 23% to the <strong>in</strong>crease <strong>in</strong> atmospheric CO2 concentration<br />
dur<strong>in</strong>g the last 250 years (Hörtenhuber <strong>et</strong> al., 2011a). Accord<strong>in</strong>gly, studies which quantify emissions from<br />
the production of food and feedstuffs or bio-energy will underestimate the <strong>in</strong>crease of the CO2 concentration<br />
<strong>in</strong> the atmosphere by more than 20% on average unless they account for relevant emissions occurr<strong>in</strong>g from<br />
LUC and LU (LULUC). Despite the great impact on global greenhouse gas (GHG) emissions and thus on<br />
global warm<strong>in</strong>g, LULUC is hardly <strong>in</strong>corporated <strong>in</strong>to estimations of the global warm<strong>in</strong>g potential (GWP) <strong>in</strong><br />
life cycle assessments and <strong>in</strong>to current carbon footpr<strong>in</strong>ts (CF) <strong>in</strong> previous studies deal<strong>in</strong>g with the production<br />
of food and feedstuffs. Various m<strong>et</strong>hodological problems are among the most important reasons for this.<br />
Literature sources l<strong>in</strong>k m<strong>et</strong>hodological limitations to lack<strong>in</strong>g <strong>in</strong>formation on aspects such as regions of orig<strong>in</strong><br />
for imported food and feedstuffs, the nature of land before conversion, the ons<strong>et</strong> of LUC-related emissions<br />
and their temporal progression as well as debatable account<strong>in</strong>g periods for depreciation of LUC-emissions<br />
(see e.g. Dalgaard <strong>et</strong> al., 2008).<br />
This paper aims at contribut<strong>in</strong>g to clos<strong>in</strong>g m<strong>et</strong>hodological gaps and particularly to deriv<strong>in</strong>g reasonable<br />
account<strong>in</strong>g periods <strong>in</strong> order to enable a strictly product-related <strong>in</strong>clusion of emissions from LULUC<br />
Primarily, results for product-related GHG emissions from LULUC are compared to results derived with<br />
other m<strong>et</strong>hods and to a basic variant, which does not account for LUC-related emissions.<br />
2. M<strong>et</strong>hods<br />
For the estimation of GHG emissions, <strong>in</strong>formation on characteristics of supply cha<strong>in</strong>s and on specified<br />
regions of orig<strong>in</strong> of raw materials is often available on a regional scale. Therefore, a product- and regionrelated<br />
approach should be applicable for emissions occurr<strong>in</strong>g from the supply cha<strong>in</strong>s of most products.<br />
Concern<strong>in</strong>g a m<strong>et</strong>hodology which enables a product-related <strong>in</strong>clusion of emissions from LUC (see<br />
Hörtenhuber <strong>et</strong> al., 2011a), <strong>in</strong>formation was derived from modell<strong>in</strong>g and a literature review. It was concluded<br />
that system boundaries should be def<strong>in</strong>ed broadly <strong>in</strong> the estimation of GHG-emissions from agricultural production.<br />
CO2-neutrality for emissions from LUC exists only theor<strong>et</strong>ically, as the storage of released carbon<br />
occurs over substantial time periods and not necessarily <strong>in</strong> spatial proximity. Hence, besides fossil CO2 emissions,<br />
CO2 from the degradation of above-ground biomass plus soil organic carbon from LUC and LU (<strong>in</strong>clud<strong>in</strong>g<br />
below-ground biomass from cleared veg<strong>et</strong>ation) is assessed here<strong>in</strong>.<br />
Hörtenhuber <strong>et</strong> al., (2011a) suggested that GHG emissions which CF and GWP accounted for should be<br />
restricted to physically occurr<strong>in</strong>g fluxes of GHGs which are related to a specific product. Consequently, we<br />
exclude hypoth<strong>et</strong>ical or prospective fluxes such as a ‘loss of s<strong>in</strong>k function’ (Kool <strong>et</strong> al., 2009), which may be<br />
imposed to quantify a farmlands’ effect of reduced s<strong>in</strong>k capacity as compared to natural veg<strong>et</strong>ation. Likewise,<br />
we do not apply a concept of land use impact to our product-specific calculation of LUC emissions, as<br />
was described <strong>in</strong> Milà i Canals <strong>et</strong> al., (2007) and Müller-Wenk and Brandão (2010). The ma<strong>in</strong> reason for this<br />
is that this concept also uses hypoth<strong>et</strong>ical pathways for emission fluxes from soil organic carbon (SOC). The<br />
m<strong>et</strong>hod applied here<strong>in</strong> and described <strong>in</strong> Hörtenhuber <strong>et</strong> al., (2011a) <strong>in</strong>cludes estimated emissions from LUC
PARALLEL SESSION 3A: LAND USE CHANGE 8 th Int. Conference on <strong>LCA</strong> <strong>in</strong> the<br />
Agri-<strong>Food</strong> Sector, 1-4 Oct <strong>2012</strong><br />
which were directly allocated to a specific crop, based on the area additionally cultivated with the respective<br />
crop relative to the overall expansion of agricultural land. It also <strong>in</strong>cludes estimated <strong>in</strong>direct LUC effects for<br />
the replaced crops with an allocation based on expansion rates of replaced crops relative to the respective<br />
national agricultural area (see also Ponsioen and Blonk, <strong>2012</strong>).<br />
Account<strong>in</strong>g (depreciation) periods for LUC can be either derived from isolated areas with LUC-emission<br />
or from a global carbon view. For derivation of account<strong>in</strong>g periods, <strong>in</strong>formation on soil carbon cycl<strong>in</strong>g was<br />
collected dur<strong>in</strong>g a literature review; <strong>in</strong> order to obta<strong>in</strong> sound account<strong>in</strong>g periods which reflect the dynamics<br />
<strong>in</strong> atmospheric carbon cycles, Hörtenhuber <strong>et</strong> al., (2011a) simulated the development of CO2 concentration<br />
by us<strong>in</strong>g elements of an established m<strong>et</strong>hod (Bern Carbon cycle model, Bern2.5CC; Joos <strong>et</strong> al., 2001).<br />
Hörtenhuber <strong>et</strong> al., (2011a) suggested that 10 or 20 years may be used as suitable default values for account<strong>in</strong>g<br />
periods for overall LUC-related emissions. The 10 year period <strong>in</strong>cludes the majority of LUC-related<br />
emissions released from biomass and soils as well as of emissions rema<strong>in</strong><strong>in</strong>g <strong>in</strong> the atmosphere, especially<br />
for tropical regions with quicker processes. Twenty years are more feasible for temperate conditions with<br />
their lower rates of CO2-release (Hörtenhuber <strong>et</strong> al., 2011a).<br />
The productive period of farmland which orig<strong>in</strong>ated from LUC is usually greater than one year, probably<br />
at least with<strong>in</strong> the magnitude of the duration which is needed to f<strong>in</strong>d a new equilibrium state of soil organic<br />
carbon. Consequently and for the sake of simplification, we allocate CO2 which is rapidly released from<br />
cleared biomass not only to the crops of the first year follow<strong>in</strong>g LUC, but to the same time period accounted<br />
for CO2 emissions from soil after LUC (see Hörtenhuber <strong>et</strong> al., 2011a). This constitutes an exemption to our<br />
def<strong>in</strong>ition of restrict<strong>in</strong>g GHG account<strong>in</strong>g to physical fluxes. This is nevertheless justifiable, as it does not<br />
create a new account<strong>in</strong>g period and is also <strong>in</strong> l<strong>in</strong>e with most CF standards (e.g. BSI, 2011). Thereby, punctually<br />
emitted fluxes from above-ground biomass are distributed over a representative period of land use by<br />
allocat<strong>in</strong>g the sum of emissions from cleared above- and below-ground biomass tog<strong>et</strong>her with SOC losses to<br />
the overall emitt<strong>in</strong>g period.<br />
For exemplary model calculations follow<strong>in</strong>g different approaches concern<strong>in</strong>g LUC (see Fig. 1), a 20 years<br />
period was used. GHG emission factors for the applied 20 years account<strong>in</strong>g period are derived from Hörtenhuber<br />
<strong>et</strong> al., (2011b; Table 1). Emission from LU are estimated accord<strong>in</strong>g to Hörtenhuber <strong>et</strong> al., (2010) for<br />
Austrian average barley and based on Hörtenhuber <strong>et</strong> al., (2011a) for an average of Brazilian soybeans (no<br />
specifical value for certified soybeans; for certification criteria see ProForest, 2004).<br />
For classification and comparison of our product-specific LUC results, we use average global LUC emissions<br />
accord<strong>in</strong>g to Vell<strong>in</strong>ga <strong>et</strong> al., (2011) and values for LUC (land transformation) and LU (land occupation)<br />
derived from the land use impact m<strong>et</strong>hod by Müller-Wenk and Brandão (2010), both presented <strong>in</strong> Table<br />
1.<br />
Vell<strong>in</strong>ga <strong>et</strong> al., (2011) calculated global CO2-eq emission from LUC (5.8 Gt per year) per total agricultural<br />
land used (4.9 * 10 9 hectare). This translates <strong>in</strong>to 1,180 kg CO2-eq per ha and per year or 1.18 kg CO2eq<br />
per kg crop if yield is 1,000 kg per ha.<br />
For comparison of the m<strong>et</strong>hod presented here<strong>in</strong> with the m<strong>et</strong>hod of Müller-Wenk and Brandão (2010), we<br />
<strong>in</strong>troduced a few assumptions to the latter, which are based on Hörtenhuber <strong>et</strong> al., (2011b): emissions from<br />
land transformation (LUC) are evaluated only for areas converted with<strong>in</strong> the last 20 years with 39% and 10%<br />
from tropical forest, 9% and 2% from savannah for average conventional and for certified Brazilian soybeans,<br />
respectively (Hörtenhuber <strong>et</strong> al., 2011b). For Austrian barley this land transformation can be neglected<br />
(Hörtenhuber <strong>et</strong> al., 2010, 2011b). Emissions from land occupation (def<strong>in</strong>ed as land use, which prevents<br />
atmospheric CO2 to be sequestrated aga<strong>in</strong>) are fully counted as described <strong>in</strong> Müller-Wenk and Brandão<br />
(2010). The land occupation results follow<strong>in</strong>g Müller-Wenk and Brandão (2010) <strong>in</strong> Table 1 take <strong>in</strong>to account<br />
that soybean production is partially tak<strong>in</strong>g place on previous tropical forest land and partially <strong>in</strong> previous<br />
grassland areas (we assumed three quarters of overall farmland for soybeans com<strong>in</strong>g from savannahs/grasslands,<br />
one quarter from tropical forests, but no difference b<strong>et</strong>ween average Brazilian and certified<br />
soybeans). For the case of previous (Brazilian) tropical forest areas converted to cropland, Müller-Wenk and<br />
Brandão (2010) calculated 46.2 tons of C emitted from land transformation (LUC) over the whole time series,<br />
result<strong>in</strong>g <strong>in</strong> 0.961 kg C per kg dry matter (DM) soybeans (with the assumption of a 20 years allocation<br />
period). Analogous, for (Brazilian) crop land converted from tropical savannahs, they reported 18.0 tons of C<br />
from LUC (0.374 kg C per kg DM soybean, assum<strong>in</strong>g a 20 years period). Additionally, Müller-Wenk and<br />
Brandão (2010) reported 1.48 and 0.37 tons C for land occupation (LU) per ha and year from previous tropical<br />
forest and grassland, respectively.<br />
253
PARALLEL SESSION 3A: LAND USE CHANGE 8 th Int. Conference on <strong>LCA</strong> <strong>in</strong> the<br />
Agri-<strong>Food</strong> Sector, 1-4 Oct <strong>2012</strong><br />
Table 1. GHG emissions from LUC and LU assum<strong>in</strong>g either (i) average global emissions (Vell<strong>in</strong>ga <strong>et</strong> al.,<br />
2011), (ii) specific conditions for specific products and regions (based on Hörtenhuber <strong>et</strong> al., 2010, 2011b) or<br />
as (iii) emissions from a land use impact m<strong>et</strong>hod derived from Müller-Wenk and Brandão (2010).<br />
kg CO2-eq per kg DM feedstuff Austrian barley Certified Brazilian<br />
solvent-extracted<br />
soybean meal<br />
(i) global average LU/LUC emissions<br />
related to gra<strong>in</strong> yields<br />
(ii) regionally and product specified GHG<br />
emissions from LUC<br />
(ii) regionally and product specified GHG<br />
emissions from LU<br />
(iii) land use impact emissions related to<br />
land transformation (LUC)<br />
(iii) land use impact emissions related to<br />
land occupation (LU)<br />
0.246 0.389 0.389<br />
0 1.245 4.150<br />
0.030 0.119 0.119<br />
0 0.380 1.498<br />
0.378 0.988 0.988<br />
Average Braziliansolventextractedsoybean<br />
meal<br />
3. Results<br />
To quantify the impact of LUC-related emissions on overall global warm<strong>in</strong>g potential for food and feedstuffs,<br />
emissions from LUC were <strong>in</strong>cluded <strong>in</strong>to emissions for other categories, such as use of fuels, <strong>in</strong>dustrial<br />
process<strong>in</strong>g, production of m<strong>in</strong>eral fertilisers and pesticides as well as direct and <strong>in</strong>direct N2O emissions from<br />
soil (Hörtenhuber <strong>et</strong> al., 2011b). This has been done for three different cases, for which results are presented<br />
<strong>in</strong> Figure 1. Austrian barley, certified Brazilian extracted soybean meal (SBME) and an Austrian national<br />
average of SBME imported ma<strong>in</strong>ly from Brazil. Based on that, GHG emissions from land use change are<br />
partially <strong>in</strong>cluded: (a) does not <strong>in</strong>clude any LULUC-related GHG emissions; (b) accounts for LULUCemissions<br />
as derived from average global emissions (Vell<strong>in</strong>ga <strong>et</strong> al., 2011; see (i) <strong>in</strong> Table 1); (c) accounts<br />
for product-related LULUC emissions (see (ii) <strong>in</strong> Table 1); (d) represents emissions from a land use impact<br />
m<strong>et</strong>hod (Müller-Wenk and Brandão, 2010; see (iii) <strong>in</strong> Table 1).<br />
Figure 1. Overall GHG emissions for feed <strong>in</strong>gredients: (a) without any LULUC-related GHG emissions; (b)<br />
LULUC-emissions derived from average global emissions; (c) product-related LULUC emissions: (d) emissions<br />
follow<strong>in</strong>g a land use impact m<strong>et</strong>hod.<br />
4. Discussion<br />
In reality, physically occurr<strong>in</strong>g carbon fluxes follow a logarithmic function with high <strong>in</strong>itial rates of losses<br />
which are levell<strong>in</strong>g off after a certa<strong>in</strong> number of years after LUC. Although <strong>in</strong> Figure 1 the case of certified<br />
254
PARALLEL SESSION 3A: LAND USE CHANGE 8 th Int. Conference on <strong>LCA</strong> <strong>in</strong> the<br />
Agri-<strong>Food</strong> Sector, 1-4 Oct <strong>2012</strong><br />
SBME shows similar results for the variants (c) ‘product-related LUC emissions’ and (d) ‘emissions from a<br />
land use impact m<strong>et</strong>hod’, the results show great differences, when differentiated for LU and LUC. The reason<br />
for the differences is that <strong>in</strong> variant (d) accord<strong>in</strong>g to Müller-Wenk and Brandão (2010) low LUC-related<br />
emissions go along with high rates of carbon losses from LU. From our po<strong>in</strong>t of view, this constitutes an<br />
underestimation of emissions from land transformation (LUC), while overestimat<strong>in</strong>g the emission effect of<br />
occupied land by assum<strong>in</strong>g that agricultural land use prevents atmospheric carbon from be<strong>in</strong>g sequestrated <strong>in</strong><br />
terrestrial s<strong>in</strong>ks aga<strong>in</strong>. In fact, a notable part of the huge amount of CO2 emitted after a LUC is sequestrated<br />
<strong>in</strong> natural (‘residual’) terrestrial s<strong>in</strong>ks, such as natural tropical forests (Denman <strong>et</strong> al., 2007) and does not stay<br />
<strong>in</strong> the atmosphere until the occupation of the land is abandoned.<br />
Accord<strong>in</strong>g to Vell<strong>in</strong>ga <strong>et</strong> al., (2011), emissions from LUC should be derived from average global emissions.<br />
The authors describe LUC emissions from s<strong>in</strong>gle crops as useless and that direct and <strong>in</strong>direct LUC<br />
cannot be separated, as total human consumption of all commodities is the driver for LUC. Contrarily, our<br />
approach differentiates direct and <strong>in</strong>direct emissions, as direct and national <strong>in</strong>direct LUC emissions should be<br />
applied to specific crops, which expanded <strong>in</strong> specific regions. A comparison of our product-related LUC<br />
emissions to global average LUC emissions (Vell<strong>in</strong>ga <strong>et</strong> al., 2011) shows a difference <strong>in</strong> the same order of<br />
magnitude as are described for other GHG emissions (from soil, fuels, <strong>et</strong>c.). On the one hand, for the case of<br />
European gra<strong>in</strong>s (e.g. barley <strong>in</strong> Fig. 1) the <strong>in</strong>clusion of globally derived LUC values leads to an overestimation<br />
of GHG emissions from LUC on average and especially <strong>in</strong> areas, where LUC-related CO2-fluxes had<br />
occurred long ago. For this case, on-go<strong>in</strong>g changes <strong>in</strong> SOC, i.e. emission or sequestration due to LU, should<br />
be reported, but <strong>in</strong> reality hardly any great losses of SOC can be reported as they usually occur only after<br />
LUC. On the other hand, the global average LUC emissions could underestimate LUC-related CO2 emissions<br />
if huge amounts of CO2 are emitted after a LUC and before a new equilibrium <strong>in</strong> SOC has been established.<br />
Furthermore, Vell<strong>in</strong>ga <strong>et</strong> al., (2011) characterise the land use per unit of crop harvested as a key item and<br />
promote their m<strong>et</strong>hod as be<strong>in</strong>g simple and robust while avoid<strong>in</strong>g problems of double count<strong>in</strong>g and displacement.<br />
They refer to an adequate description of their m<strong>et</strong>hod’s results concern<strong>in</strong>g efficiency (i.e. low yields or<br />
bad feed conversion show high LUC emission). From a global po<strong>in</strong>t of view, efficiency of land use (described<br />
by yield per ha) is certa<strong>in</strong>ly partially <strong>in</strong>directly related to LUC, but on the other side the land demand<br />
of a specific product from a specific region occupy<strong>in</strong>g an above-average area of land per product unit is not<br />
automatically related to LUC with<strong>in</strong> a relevant period. In contrast to Vell<strong>in</strong>ga <strong>et</strong> al., (2011), we assume that<br />
<strong>in</strong>direct LUC is not only connected to a low productivity per unit of land used, but also to mark<strong>et</strong> dynamics<br />
which <strong>in</strong>fluence land demand, as do changes <strong>in</strong> consumption habits and the grow<strong>in</strong>g demand for bioenergy<br />
and additional drivers.<br />
The most debated concern about the use of direct LUC emission m<strong>et</strong>hods (e.g. applied <strong>in</strong> BSI, 20011 is<br />
the derivation of a suitable account<strong>in</strong>g period (also termed depreciation or amortisation period; see Ponsioen<br />
and Blonk, <strong>2012</strong>). Here<strong>in</strong>, we describe an answer to this controversial issue, which is based on soil-related<br />
and atmospheric carbon cycles. Hörtenhuber <strong>et</strong> al., (2011a) suggested two default periods for LUC-related<br />
account<strong>in</strong>g: 10 and 20 years. For the Brazilian soybeans used as feedstuff, LULUC-related emissions will<br />
decrease by about 23% if 10 <strong>in</strong>stead of 20 years are implemented, ma<strong>in</strong>ly due to a reduced prevalence of<br />
soybean production on newly deforested land. Short account<strong>in</strong>g periods would lead to the phenomenon that<br />
converted areas are relieved from LUC-related emissions after a short time period. This would lead to <strong>in</strong>dicat<strong>in</strong>g<br />
a ‘cleaner’ production after LUC-related emissions had peaked markedly, although the majority of the<br />
released CO2 still rema<strong>in</strong>ed <strong>in</strong> the atmosphere. The estimation of product-specific emissions from LULUC<br />
which <strong>in</strong>cludes substantially longer account<strong>in</strong>g periods than used here<strong>in</strong>, would result <strong>in</strong> lower LUC-related<br />
emission loads for e.g. feedstuffs imported from Lat<strong>in</strong>-America or from other regions with a high share of<br />
land recently converted.<br />
Due to its high global relevance, emissions from LUC need to be <strong>in</strong>cluded <strong>in</strong> the estimation of CF and<br />
GWP, whenever great quantities of (LU)LUC-burdened <strong>in</strong>puts, such as extracted soybean meal, are used.<br />
This can be illustrated for European meat production systems, which rely on high quantities of imported<br />
LULUC-burdened <strong>in</strong>puts; for example, the substitution of feedstuffs loaded with LUC-related emissions<br />
(particularly extracted soybean meal) would lead to an estimated 50% less CO2-eq per kg of broiler carcass<br />
(Hörtenhuber <strong>et</strong> al., 2011a).<br />
5. Conclusion<br />
We suggest us<strong>in</strong>g m<strong>et</strong>hods for the estimation of LUC-related emissions which allow for a direct, productrelated<br />
allocation. This is probably the only way to quantify mitigation strategies for LUC-related GHG<br />
emissions, even if they do not <strong>in</strong>tegrate <strong>in</strong>direct transnational LUC-effects. To our op<strong>in</strong>ion m<strong>et</strong>hods for calculat<strong>in</strong>g<br />
LUC emissions should be based on physically occurr<strong>in</strong>g fluxes. Despite our approach of estimat<strong>in</strong>g<br />
255
PARALLEL SESSION 3A: LAND USE CHANGE 8 th Int. Conference on <strong>LCA</strong> <strong>in</strong> the<br />
Agri-<strong>Food</strong> Sector, 1-4 Oct <strong>2012</strong><br />
LULUC-related GHG emissions only if they can be allocated directly to a product and thereby neglect<strong>in</strong>g<br />
<strong>in</strong>direct LUC, the difficult task of <strong>in</strong>clud<strong>in</strong>g transnational iLUC should be addressed <strong>in</strong> future studies.<br />
6. References<br />
BSI, 2011. PAS 2050:2011. Specification for the assessment of the life cycle greenhouse gas emissions of goods and services. British<br />
Standard Institute, London, UK..<br />
Dalgaard, R., Schmidt, J., Halberg, N., Christensen, P., Thrane, M., Pengue W.A, 2008. <strong>LCA</strong> of Soybean Meal. International Journal<br />
of <strong>LCA</strong> 13 (3):240-254.<br />
Denman, K.L., Brasseur, G., Chidhaisong, A., Ciais, P., Cox, P.M., Dick<strong>in</strong>son, R.E., Hauglusta<strong>in</strong>e, D., He<strong>in</strong>ze, C., Holland, E.,<br />
Jacob, D., Lohmann, U., Ramachandran, S., da Silva Dias, P.L., Wofsy, S.C., Zhang, X., 2007. Coupl<strong>in</strong>gs B<strong>et</strong>ween Changes <strong>in</strong><br />
the Climate System and Biogeochemistry. In: Solomon, S., Q<strong>in</strong>, D., Mann<strong>in</strong>g, M., Chen, Z., Marquis, M., Averyt, K.B., Tignor,<br />
M. and Miller, H.L., (ed.), Climate Change 2007: The Physical Science Basis, Contribution of the Work<strong>in</strong>g Group I to the Fourth<br />
Assessment Report of the Intergovernmental Panel on Climate Change. Cambridge University Press, Cambridge, UK and New<br />
York, USA.<br />
Hörtenhuber, S., L<strong>in</strong>denthal, T., Amon, B., Markut, T., Kirner, L., Zollitsch, W., 2010. Greenhouse gas emissions from selected<br />
Austrian dairy production systems: model calculations consider<strong>in</strong>g the effects of land use change. Renewable Agriculture and<br />
<strong>Food</strong> Systems 25 (4), 316-329.<br />
Hörtenhuber S., 2011: Greenhouse gas emissions from dairy production – assessment and effects of important drivers. Dissertation<br />
thesis. University of Natural Resources and Life Sciences, Vienna, Austria.<br />
Hörtenhuber, S., L<strong>in</strong>denthal, T., Zollitsch, W., 2011b. Reduction of greenhouse gas emissions from feed supply cha<strong>in</strong>s by utiliz<strong>in</strong>g<br />
regionally produced prote<strong>in</strong> sources - the case of Austrian dairy production. Journal of the Science of <strong>Food</strong> and Agriculture 91,<br />
1118-1127.<br />
Joos, F., Prentice, C., Sitch, S., Meyer, R., Hooss, G., Plattner, G.-K., Gerber, S., Hasselmann, K., 2001. Global warm<strong>in</strong>g feedbacks<br />
on terrestrial carbon uptake under the Intergovernmental Panel on Climate Change (IPCC) emission scenarios. Global Biogeochemical<br />
Cycles 15 (4), 891-907.<br />
Kool, A., Blonk, H., Ponsioen, T., Sukkel, W., Vermeer, H., de Vries, J., Hoste, R., 2009. Carbon Footpr<strong>in</strong>ts of conventional and<br />
organic pork: Assessment of typical production systems <strong>in</strong> the N<strong>et</strong>herlands, Denmark, England and Germany. Blonk Milieu Advies<br />
BV, Gouda, The N<strong>et</strong>herlands.<br />
Milà i Canals, L., Bauer, C., Depestele, J., Dubreuil, A., Freiermuth-Knuchel, R., Gaillard, G., Michelsen, O., Müller-Wenk, R.,<br />
Rydgren, B., 2007. Key elements <strong>in</strong> a framework for land use impact assessment <strong>in</strong> <strong>LCA</strong>. International Journal of <strong>LCA</strong> 12 (1), 5-<br />
15.<br />
Müller-Wenk, R., Brandão M., 2010. Climatic impact of land use <strong>in</strong> <strong>LCA</strong> – carbon transfers b<strong>et</strong>ween veg<strong>et</strong>ation/soil and air. International<br />
Journal of <strong>LCA</strong> 15 (2), 172-182.<br />
Ponsioen, T.C., Blonk, T.J., <strong>2012</strong>. Calculat<strong>in</strong>g land use change <strong>in</strong> carbon footpr<strong>in</strong>ts of agricultural products as an impact of current<br />
land use. Journal of Cleaner Production 28, 120-126.<br />
ProForest, 2004. The Basel Criteria for Responsible Soy Production. Available at<br />
http://www.proforest.n<strong>et</strong>/objects/publications/basel-criteria-august-04.pdf, <strong>2012</strong>-05-25.<br />
Vell<strong>in</strong>ga, T., Blonk, H., 2011. Feed database for livestock systems - An improvement of CFP calculations for livestock systems.<br />
[http://ebookbrowse.com/theun-vell<strong>in</strong>ga-fao-pdf-d92065125, <strong>2012</strong>-02-08]<br />
256
PARALLEL SESSION 3A: LAND USE CHANGE 8 th Int. Conference on <strong>LCA</strong> <strong>in</strong> the<br />
Agri-<strong>Food</strong> Sector, 1-4 Oct <strong>2012</strong><br />
<strong>LCA</strong> of sunflower oil address<strong>in</strong>g alternative land use change scenarios<br />
and practices<br />
Filipa Figueiredo, Érica Geraldes Castanheira, Fausto Freire *<br />
ADAI-LAETA, Department of Mechanical Eng<strong>in</strong>eer<strong>in</strong>g, University of Coimbra, Pólo II Campus, Rua Luís Reis Santos, 3030-788<br />
Coimbra, Portugal<br />
Correspond<strong>in</strong>g author. E-mail: fausto.freire@dem.uc.pt<br />
ABSTRACT<br />
Sunflower oil is one of the lead<strong>in</strong>g food oils, recently also used for biodiesel production, ma<strong>in</strong>ly <strong>in</strong> southern European countries. This<br />
paper presents a Life-Cycle Assessment of sunflower oil produced <strong>in</strong> Portugal. Two alternative agriculture practices (irrigated and<br />
non-irrigated cultivation) were assessed. Twenty-eight alternative land use change (LUC) scenarios were studied (comb<strong>in</strong><strong>in</strong>g four<br />
actual land use types and seven scenarios for the reference land use). Life-cycle Impact Assessment results were calculated (ReCiPe<br />
m<strong>et</strong>hod) for six impact categories. Sunflower cultivated on non-irrigated land had higher environmental impacts <strong>in</strong> 4 categories<br />
because of the low productivity, while sunflower cultivated <strong>in</strong> irrigated land had higher impacts <strong>in</strong> only 2 categories (due to the use<br />
of fertilisers). Cultivation is the ma<strong>in</strong> contributor to the life-cycle impacts <strong>in</strong> all categories. A huge variation <strong>in</strong> greenhouse gas <strong>in</strong>tensity<br />
for sunflower oil was calculated (0.3-20.9 kg CO2eq/kgoil). The results show the importance of LUC and cultivation practices <strong>in</strong><br />
the environmental performance of sunflower oil.<br />
Keywords: agriculture practices, greenhouse gas, irrigation, land use change (LUC), sunflower oil<br />
1. Introduction<br />
Sunflower is one of the lead<strong>in</strong>g oilseed crops used for the production of oil for human consumption. It has<br />
also been considered an important crop for biodiesel production <strong>in</strong> southern European countries (Kallivrossis,<br />
2002). Life-cycle Assessment (<strong>LCA</strong>) was employed to assess sunflower oil; most of the studies were<br />
<strong>in</strong> the scope of biodiesel production (JEC, 2008, Kallivrossis, 2002, Requena <strong>et</strong> al., 2010, Tsoutsos <strong>et</strong> al.,<br />
2010). Other <strong>LCA</strong> studies focused on sunflower cultivation (Cotana <strong>et</strong> al., 2010) and the use of sunflower oil<br />
<strong>in</strong> agricultural tractors on Greek farms (Balafoutis <strong>et</strong> al., 2010). However, only one of these <strong>LCA</strong> studies<br />
(Iriarte <strong>et</strong> al., 2010) addressed land use change (LUC).<br />
LUC is an emergent topic with important implications <strong>in</strong> terms of the greenhouse gas (GHG) balance of<br />
food and bioenergy crops, as demonstrated by several <strong>LCA</strong> studies for veg<strong>et</strong>able oils and oil-based biodiesel<br />
systems, which have concluded that the GHG <strong>in</strong>tensity is sensitive to the type of LUC. For example, Castanheira<br />
and Freire (2011a;b) evaluated LUC for soybean produced <strong>in</strong> Lat<strong>in</strong> America and palm oil produced <strong>in</strong><br />
Colombia, calculat<strong>in</strong>g a large variation <strong>in</strong> GHG <strong>in</strong>tensity b<strong>et</strong>ween different LUC scenarios. Lechon <strong>et</strong> al.,<br />
(2011) studied alternative biofuel feedstocks (soybean, palm, rapeseed, sunflower oil), conclud<strong>in</strong>g that when<br />
LUC impacts are considered the benefits of biofuels are significantly reduced and can even be negative.<br />
Malça and Freire (2011) assessed the implications of LUC for bio<strong>et</strong>hanol produced from wheat, and Malça<br />
and Freire (2010) assessed rapeseed oil, both produced <strong>in</strong> Europe, conclud<strong>in</strong>g that GHG emissions due to<br />
LUC dom<strong>in</strong>ate results and have high uncerta<strong>in</strong>ty.<br />
Increas<strong>in</strong>g prices of food products tog<strong>et</strong>her with the expansion of biodiesel produced from veg<strong>et</strong>able oils<br />
<strong>in</strong> Europe may lead to an <strong>in</strong>crease <strong>in</strong> the production of sunflower <strong>in</strong> Portugal, which can be achieved by the<br />
expansion of sunflower plantation area (extensification) or by an <strong>in</strong>crease <strong>in</strong> the productivity (<strong>in</strong>tensification).<br />
This motivates assess<strong>in</strong>g the environmental impacts of sunflower oil produced <strong>in</strong> Portugal, <strong>in</strong>clud<strong>in</strong>g<br />
the carbon-stock changes caused by alternative LUC scenarios. The ma<strong>in</strong> objective of this paper is to present<br />
an <strong>LCA</strong> of sunflower oil produced <strong>in</strong> Portugal.<br />
2. Life-Cycle Model and Inventory<br />
A life-cycle model and <strong>in</strong>ventory for sunflower oil produced <strong>in</strong> Portugal were developed and implemented.<br />
The life-cycle model <strong>in</strong>cludes the land use conversion necessary to establish sunflower cultivation,<br />
cultivation, transportation, oil extraction and treatment (Fig. 1). For sunflower cultivation, two systems were<br />
considered: irrigated and non-irrigated. The <strong>in</strong>frastructure for facilities, mach<strong>in</strong>es and vehicles was <strong>in</strong>cluded<br />
(even that not presented <strong>in</strong> Fig. 1). The functional unit chosen was 1 kg of oil. The oil cha<strong>in</strong> is multifunctional,<br />
with one co-product (sunflower meal). Accord<strong>in</strong>g to ISO 14044 (2006), whenever several allocation<br />
approaches seem applicable, a sensitivity analysis shall be conducted to illustrate how different m<strong>et</strong>hods<br />
change the results. In this study, three allocation m<strong>et</strong>hods were analysed: mass, energy and economic.<br />
257
PARALLEL SESSION 3A: LAND USE CHANGE 8 th Int. Conference on <strong>LCA</strong> <strong>in</strong> the<br />
Agri-<strong>Food</strong> Sector, 1-4 Oct <strong>2012</strong><br />
Figure 1. Sunflower oil cha<strong>in</strong>: ma<strong>in</strong> processes and system boundaries.<br />
Table 1 shows the ma<strong>in</strong> <strong>in</strong>ventory data (average) for sunflower cultivation (a); oil extraction and treatment<br />
(b). Two alternative agriculture practices (irrigated and non-irrigated cultivation) were modelled. The<br />
ma<strong>in</strong> difference b<strong>et</strong>ween these practices is that irrigated cultivation requires 3000-6000 m 3 /ha/year of water<br />
(Toureiro <strong>et</strong> al., 2005) and fertilisers (Table 1), while non-irrigated cultivation does not use either. The average<br />
productivity of irrigated cultivation is 3000 kg/ha/year, while non-irrigated cultivation is 650 kg/ha/year<br />
(Gírio <strong>et</strong> al., 2010). Data for the oil extraction process, us<strong>in</strong>g hexane as a solvent, was based on Jungbluth <strong>et</strong><br />
al., (2007). After extraction, the oil was separated from the solvent by a distillation process.<br />
Table 1. Ma<strong>in</strong> <strong>in</strong>ventory data: a) sunflower cultivation (1 kg sunflower); b) extraction and treatment of sunflower<br />
oil (1 kg, no allocation).<br />
a) b)<br />
Ma<strong>in</strong> Inputs Irrigated Non-Irrigated Unit<br />
Fertilisers N 0.007 - kg<br />
K2O 0.021 - kg<br />
P2O5 0.021 - kg<br />
Pesticide (atraz<strong>in</strong>e) 0.001 0.0023 kg<br />
Seeds for plant<strong>in</strong>g 0.0023 0.0046 kg<br />
Diesel 0.0523 0.1539 L<br />
Water 1.5 _- m 3<br />
Product Irrigated Non-Irrigated Unit<br />
Sunflower seeds 1 1 kg<br />
Ma<strong>in</strong> Inputs Value Unit<br />
Sunflower seeds 2.29 kg<br />
Natural Gas 1.63 MJ<br />
Bentonite 5.38x10 -3 kg<br />
Hexane 2.53x10 -3 kg<br />
Phosphoric acid 8.16x10 -4 kg<br />
Electricity 9.66x10 -2 kWh<br />
Co-products Value Unit<br />
Sunflower oil 1 kg<br />
Sunflower meal 1.29 kg<br />
3. Land use change scenarios and carbon calculations<br />
Twenty-eight LUC scenarios were assessed based on a comb<strong>in</strong>ation of seven reference land use types (grassland<br />
(R1-R3) and perennial crops (R4-R7)) and four actual land uses (irrigated sunflower (I) (A1 and A2)<br />
and non-irrigated sunflower (NI) (A3 and A4)) (Table 2). The emissions from carbon-stock changes caused<br />
by LUC (e1, kg CO2eq/kgoil) were calculated us<strong>in</strong>g IPCC Tier 1, (IPCC, 2006) and adapt<strong>in</strong>g the follow<strong>in</strong>g<br />
equation from the Renewable Energy Directive (RED, EC, 2009):<br />
e1 = (CSR-CSA) x 3.664 x 1/20 x 1/P Eq. 1<br />
<strong>in</strong> which:<br />
CSR is the carbon stock associated with the each reference LU (kg CO2eq/ha);<br />
CSA is the carbon stock associated with the actual LU (sunflower oil plantation) (kg CO2eq/ha);<br />
P is the sunflower oil productivity (kg oil/ha)<br />
Based on the Portuguese climate region (warm temperate dry) and soil type (high activity clay soils), a standard<br />
value of 38 t C/ha was obta<strong>in</strong>ed from EC (2010) for soil organic carbon (SOCST). To calculate the reference<br />
and actual land use soil organic carbon (SOCR and SOCA), appropriate values for the factors reflect<strong>in</strong>g<br />
the difference <strong>in</strong> SOC associated with type of land use (FLU), management practice (FMG) and different levels<br />
258
PARALLEL SESSION 3A: LAND USE CHANGE 8 th Int. Conference on <strong>LCA</strong> <strong>in</strong> the<br />
Agri-<strong>Food</strong> Sector, 1-4 Oct <strong>2012</strong><br />
of carbon <strong>in</strong>put to soil (FI) compared to the SOCST were selected from EC (2010) (Table 2). Above and below-ground<br />
veg<strong>et</strong>ation carbon stock (CVEG) also came from EC (2010) (Table 2).<br />
Table 2. Calculated soil organic carbon (SOC), above and below-ground veg<strong>et</strong>ation carbon stock <strong>in</strong> liv<strong>in</strong>g<br />
biomass (CVEG), and total values (CS) for reference (R subscript) and actual (A subscript) land use.<br />
Actual Land Use<br />
SOCi =(SOCST*FLU*FMG*FI)<br />
SOCi<br />
(t C/ha)<br />
CVEGi<br />
(t C/ha)<br />
CSi = SOCi + CVEGi<br />
(t C/ha)<br />
SOCST<br />
(t C/ha)<br />
FLU FMG FI<br />
Sunflower cultivation (irrigated, RT, medium <strong>in</strong>put) A1 38 0.8 1.02 1.00 31.01 0 31.01<br />
Sunflower cultivation (irrigated, NT, medium <strong>in</strong>put) A2 38 0.8 1.10 1.00 33.44 0 33.44<br />
Sunflower cultivation (non-irrigated, RT, low <strong>in</strong>put) A3 38 0.8 1.02 0.95 29.46 0 29.46<br />
Sunflower cultivation (non-irrigated, NT, low <strong>in</strong>put)<br />
Reference Land Use<br />
A4 38 0.8 1.10 0.95 31.77 0 31.77<br />
Grassland (improved, medium <strong>in</strong>put) R1 38 1.0 1.14 1.00 43.32 3.1 46.42<br />
Grassland (improved, high <strong>in</strong>put) R2 38 1.0 1.14 1.11 48.09 3.1 51.19<br />
Grassland (severely degraded, medium <strong>in</strong>put) R3 38 1.0 0.70 1.00 26.60 3.1 29.70<br />
Perennial crop (RT, high <strong>in</strong>put, with manure) R4 38 1.0 1.02 1.37 53.10 43.2 96.30<br />
Perennial crop (RT, high <strong>in</strong>put, without manure) R5 38 1.0 1.02 1.04 40.31 43.2 83.50<br />
Perennial crop (NT, high <strong>in</strong>put, with manure) R6 38 1.0 1.10 1.37 57.27 43.2 100.40<br />
Perennial crop (NT, high <strong>in</strong>put, without manure) R7 38 1.0 1.10 1.04 43.47 43.2<br />
NT: no tillage; RT: reduced tillage; FLU: type of land use; FMG: management practice; FI: different levels of carbon <strong>in</strong>put to soil.<br />
86.67<br />
4. Results and Discussion<br />
Life-cycle Impact Assessment (LCIA) results were calculated us<strong>in</strong>g the ReCiPe m<strong>et</strong>hod (midpo<strong>in</strong>t level<br />
and hierarchical perspective; Goedkoop <strong>et</strong> al., 2010). We selected the follow<strong>in</strong>g six impact categories: climate<br />
change (CC), ozone depl<strong>et</strong>ion (OD), terrestrial acidification (TA), freshwater eutrophication (FWE),<br />
mar<strong>in</strong>e eutrophication (ME) and fossil depl<strong>et</strong>ion (FD). The allocation m<strong>et</strong>hod had an important <strong>in</strong>fluence <strong>in</strong><br />
the results. In this study, three allocation m<strong>et</strong>hods were analysed: mass (43% oil, 57% meal), energy (65%<br />
oil, 35% meal) and economic (77% oil, 23% meal). The highest impacts occurred for economic allocation.<br />
Below we present only results for mass-based allocation.<br />
4.1. LCIA results exclud<strong>in</strong>g LUC<br />
Sunflower cultivated on non-irrigated land had higher environmental impacts <strong>in</strong> the categories of CC,<br />
ME, FD and OD because of the low productivity per ha (650 kg/ha/year) (Table 3). On the other hand, sunflower<br />
cultivated on irrigated land (3000 kg/ha/year) had higher impacts for TA and FWE, due to the use of<br />
fertilisers. The life-cycle phase of sunflower oil with the highest environmental impacts was cultivation for<br />
all categories (70%-99%). The ma<strong>in</strong> contributors for the impacts <strong>in</strong> sunflower cultivated on irrigated land<br />
were fertilisers (10%-99%, for all impact categories) and diesel for agricultural processes (30%-45%, for all<br />
categories except FWE). The ma<strong>in</strong> contributor <strong>in</strong> non-irrigated cultivation was diesel (64%-84%, for all<br />
categories).<br />
Table 3. LCIA results (1 kg sunflower oil, mass allocation, no land use change).<br />
CC (kg CO2 eq)<br />
x10 -1<br />
OD (kg CFC -11 )<br />
x10 -7<br />
TA (kg SO2 eq)<br />
x10 -3<br />
FWE (kgP eq)<br />
x10 -4<br />
ME (kg N eq)<br />
x10 -3<br />
FD (kg oil eq)<br />
x10 -1<br />
I NI I NI I NI I NI I NI I NI<br />
Cultivation 6.08 8.22 0.72 1.05 4.34 3.94 3.56 0.085 1.42 2.12 1.87 2.53<br />
Oil Extraction 0.81 0.10 0.28 0.025 0.047 0.32<br />
Total 6.89 9.03 0.82 1.15 4.62 4.22 3.59 0.11 1.47 2.17 2.19 2.85<br />
I – Irrigated; NI – Non-Irrigated; CC – Climate change; OD – Ozone layer depl<strong>et</strong>ion; TA – Terrestrial acidification;<br />
FWE – Freshwater eutrophication; ME – Mar<strong>in</strong>e eutrophication; FD – Fossil depl<strong>et</strong>ion.<br />
Normalised results (us<strong>in</strong>g global values for the Europe Union (EU25+3) year 2000, as reference) were calculated.<br />
Normalisation is an optional step <strong>in</strong> <strong>LCA</strong> and relates the magnitude of the impacts to reference values<br />
(Clift <strong>et</strong> al., 2000). It places LCIA <strong>in</strong>dicator results <strong>in</strong>to a broader context and adjust the results to have<br />
common dimensions. Fig. 2 shows that normalised results had similar magnitude for all categories (0.6 x10 -4<br />
- 1.7 x10 -4 ), except for FWE and OD. FWE had the highest normalised impacts for irrigated cultivation due<br />
to the use of P2O5 fertiliser (Fig. 2). These impacts are about 30 times higher than those for non-irrigated<br />
cultivation (<strong>in</strong> which there was no fertiliser <strong>in</strong>put), mean<strong>in</strong>g that the use of fertiliser dom<strong>in</strong>ates the impacts <strong>in</strong><br />
FWE.<br />
259
PARALLEL SESSION 3A: LAND USE CHANGE 8 th Int. Conference on <strong>LCA</strong> <strong>in</strong> the<br />
Agri-<strong>Food</strong> Sector, 1-4 Oct <strong>2012</strong><br />
Figure 2. Normalised LCIA results (1 kg sunflower oil, mass allocation, no land use change).<br />
4.2. Climate change impact: LUC scenario analysis<br />
Sunflower oil GHG <strong>in</strong>tensity greatly depends on the LUC scenario and varies greatly (0.3-20.9 kg<br />
CO2eq/kgoil) (Fig. 3). The lowest values were obta<strong>in</strong>ed when sunflower was cultivated on severely degraded<br />
grassland (R3), for which there was an <strong>in</strong>crease <strong>in</strong> SOC (negative GHG emission <strong>in</strong> Fig.3). Highest values<br />
occurred when perennial crops (R4 to R7) were converted <strong>in</strong>to sunflower cultivation, due to an important<br />
loss of above and below-ground veg<strong>et</strong>ation carbon stock (CVEG) from the previous perennial crop land.<br />
Figure 3. Greenhouse gas <strong>in</strong>tensity of sunflower oil: land use change (LUC) and agriculture-practice scenarios<br />
(mass allocation).<br />
5. Conclusion<br />
Sunflower cultivated on non-irrigated land had higher environmental impacts <strong>in</strong> 4 categories (CC, ME,<br />
FD and OD) because of the low productivity per ha (650 kg/ha/year), while sunflower cultivated <strong>in</strong> irrigated<br />
land (3000 kg/ha/year)) had higher impacts <strong>in</strong> only 2 categories (TA and FWE) due to the use of fertilisers.<br />
The FWE impacts were about 30 times higher for irrigated cultivation relatively to non-irrigated cultivation<br />
(<strong>in</strong> which there was no fertiliser <strong>in</strong>put). Cultivation contributed 70%-99% to the life-cycle impacts <strong>in</strong> all<br />
260
PARALLEL SESSION 3A: LAND USE CHANGE 8 th Int. Conference on <strong>LCA</strong> <strong>in</strong> the<br />
Agri-<strong>Food</strong> Sector, 1-4 Oct <strong>2012</strong><br />
categories, ma<strong>in</strong>ly due to fertilisers and diesel (agricultural processes <strong>in</strong> irrigated cultivation). Normalised<br />
results had similar magnitude for all categories, except for FWE and OD.<br />
A huge variation <strong>in</strong> GHG <strong>in</strong>tensity for sunflower oil <strong>in</strong> Portugal was calculated (0.3-20.9 kg CO2eq/kgoil,<br />
mass allocation), demonstrat<strong>in</strong>g that agricultural practices and LUC scenarios have an important <strong>in</strong>fluence on<br />
GHG <strong>in</strong>tensity. To assure low GHG <strong>in</strong>tensity, sunflower should preferably be cultivated <strong>in</strong> severely degraded<br />
grassland. Cultivation on previous perennial crop land should not be used.<br />
6. Acknowledgment<br />
The authors gratefully acknowledge the project ECODEEP (Eco-efficiency and Eco-management <strong>in</strong> the<br />
Agro Industrial sector, nº FCOMP – 05 – 0128 – FEDER – 018643) and the Portuguese Science and Technology<br />
Foundation (FCT) projects: PTDC/SEN-TRA/117251/2010 (Extended “Well-to-Wheels” Assessment<br />
of Biodiesel for Heavy Transport Vehicles) and MIT/SET/0014/2009 (Captur<strong>in</strong>g Uncerta<strong>in</strong>ty <strong>in</strong> Biofuels for<br />
Transportation. Resolv<strong>in</strong>g Environmental Performance and Enabl<strong>in</strong>g Improved Use).<br />
7. References<br />
Balafoutis, A., Freire, F., Papadakis, G. (2010). Life-cycle Assessment of Sunflower oil produced <strong>in</strong> Greece and used as fuel <strong>in</strong> tractor<br />
diesel eng<strong>in</strong>es. Proceed<strong>in</strong>gs of the International Conference of Agricultural Eng<strong>in</strong>eer<strong>in</strong>g (AgEng2010). 1-9.<br />
Castanheira É.G.,Freire F. (2011a). “Environmental performance of palm oil biodiesel <strong>in</strong> a life-cycle perspective". IEEE International<br />
Symposium on Susta<strong>in</strong>able Systems and Technology. Chicago.<br />
Castanheira É.G., Freire F. (2011b). “LC GHG Assessment of soybeans.". LCM 2011 - Towards Life-cycle Susta<strong>in</strong>ability Management.<br />
Berl<strong>in</strong>.<br />
Clift, R., Doig, A., F<strong>in</strong>nveden, G. (2000). The application of life-cycle assessment to <strong>in</strong>tegrated solid waste management. Part 1 –<br />
M<strong>et</strong>hodology. Institution of Chemical Eng<strong>in</strong>eers. Trans IChemE, Vol 78, part B.<br />
Cotana, F., Barbarena, M., Fantozzi, F., Ciriaf, C. N. (2010). Life cycle assessment of sunflower and rapeseed. 10° Congresso Nazionale<br />
CIRIAF – Atti (Perugia 9/10 April 2010). Sviluppo Sostenibile, Tutela dell’Ambiente e della Salute Umana.<br />
EC, (2010). Directive 2009/28/EC of the European Parliament and of the council of 23 April 2009 on the promotion of the use of<br />
energy from renewable sources and amend<strong>in</strong>g and subsequently repeal<strong>in</strong>g Directives 2001/77/EC and 2003/30/EC. European<br />
Commission, Official Journal of the European Union, L140/16 of 5.6.2009.<br />
EC, (2011). Commission Decision of 10 June 2010 on guidel<strong>in</strong>es for the calculation of land carbon stocks for the purpose of Annex<br />
V to Directive 2009/28/EC. European Commission. Official Journal of the European Union, L151/19 of 17.6.2010.<br />
Gírio, F.M., Matos, C.T., Oliveira, C.A., Silva, L., Bogel-Lukasik, R., Aguiar, R. (2010). Typical greenhouse gas emissions <strong>in</strong> the<br />
cultivation phase of raw materials for the production of biofuels. Report from Portugal. Agriculture.<br />
http://ec.europa.eu/energy/renewables/transparency_platform/emissions_en.htm<br />
Goedkoop, M.J., Heijungs, R., Huijbregts, M., De Schryver, A., Struijs, J., Van Zelm R. (2008). A life cycle impact assessment<br />
m<strong>et</strong>hod which comprises harmonised category <strong>in</strong>dicators at the midpo<strong>in</strong>t and the endpo<strong>in</strong>t level; First edition Report I.<br />
IPCC (2006). Guidel<strong>in</strong>es for national greenhouse gas <strong>in</strong>ventories. In: Intergovernmental Panel on Climate Change, Agriculture,<br />
Forestry and other Land Use, vol. 4. Iriarte, A., Rieradevall, J., Gabarrell, X. (2010). Life cycle assessment of sunflower and<br />
rapeseed as energy crops under Chilean conditions. Journal of Cleaner Production, 18(4), 336-345. Elsevier Ltd.<br />
ISO 14044, (2006): Environmental management—life cycle assessment—requirements and guidel<strong>in</strong>es; Genève, Switzerland.<br />
Kallivroussis, L. (2002). Rural Development The Energy Balance of Sunflower Production for Biodiesel <strong>in</strong> Greece. Biosystems<br />
Eng<strong>in</strong>eer<strong>in</strong>g, 81(3), 347-354.<br />
JEC, (2008). Concawe JRC EUCAR Description and d<strong>et</strong>ailed energy and GHG balance of <strong>in</strong>dividual pathways, Well-to-Wheels<br />
analysis of future automotive fuels and powertra<strong>in</strong>s <strong>in</strong> the European context WELL-TO-TANK Report Version 3.0 November<br />
2008 WTT.<br />
Jungbluth N., Chudacoff M., Dauriat A., D<strong>in</strong>kel F., Doka G., Faist Emmenegger M., Gnansounou E., Kljun N., Spielmann M., St<strong>et</strong>tler<br />
C., Sutter J. (2007). Life Cycle Inventories of Bioenergy. F<strong>in</strong>al report eco<strong>in</strong>vent data v2.0. Volume: 17. Swiss Centre for LCI,<br />
ESU. Duebendorf and Uster, CH.<br />
Lechon, Y., Cabal, H., Sáez, R. (2011). Life cycle greenhouse gas emissions impacts of the adoption of the EU Directive on biofuels<br />
<strong>in</strong> Spa<strong>in</strong>. Effect of the import of raw materials and land use changes. Biomass and Bioenergy, 35(6), 2374-2384.<br />
Malça, J., Freire, F. (2010). Uncerta<strong>in</strong>ty Analysis <strong>in</strong> Biofuel Systems: An Application to the Life Cycle of Rapeseed Oil. J Ind Ecol,<br />
vol. 14, pp. 322-334, 2010.<br />
Malça, J., Freire, F. (2011). Life-cycle studies of biodiesel <strong>in</strong> Europe: A review address<strong>in</strong>g the variability of results and model<strong>in</strong>g<br />
issues. Renewable and Susta<strong>in</strong>able Energy Reviews, 15(1), 338-351.<br />
Requena, J. F.S., Guimaraes, a C., Quirós Alpera, S., Relea Gangas, E., Hernandez-Navarro, S., Navas Gracia, L. M. (2010). Life<br />
Cycle Assessment (<strong>LCA</strong>) of the biofuel production process from sunflower oil, rapeseed oil and soybean oil. Fuel Process<strong>in</strong>g<br />
Technology, 92(2), 190-199<br />
Toureiro, C. M., Serralheiro, R. P., Oliveira, M. R. (2005). Resposta das culturas do girassol e do milho a diferentes cenários de rega<br />
deficitária. Revista de ciências agrárias, 35-47.<br />
Tsoutsos, T., Kouloumpis, V., Zafiris, T., Fote<strong>in</strong>is, S. (2010). Life Cycle Assessment for biodiesel production under Greek climate<br />
conditions. Journal of Cleaner Production, 18(4), 328-335.<br />
261
PARALLEL SESSION 3A: LAND USE CHANGE 8 th Int. Conference on <strong>LCA</strong> <strong>in</strong> the<br />
Agri-<strong>Food</strong> Sector, 1-4 Oct <strong>2012</strong><br />
System expansion and allocation <strong>in</strong> the life-cycle GHG assessment of<br />
soybean oil<br />
262<br />
Érica Geraldes Castanheira * , Fausto Freire<br />
ADAI-LAETA, Department of Mechanical Eng<strong>in</strong>eer<strong>in</strong>g, University of Coimbra, Pólo II Campus, Rua Luís Reis Santos, 3030-788<br />
Coimbra, Portugal<br />
Correspond<strong>in</strong>g author. E-mail: erica@dem.uc.pt<br />
ABSTRACT<br />
This paper presents a life-cycle (LC) greenhouse gas (GHG) assessment of soybean oil address<strong>in</strong>g critical issues <strong>in</strong> the modell<strong>in</strong>g and<br />
results. Different m<strong>et</strong>hods for handl<strong>in</strong>g co-production <strong>in</strong> the oil extraction process are compared based on a sensitivity analysis to<br />
illustrate the <strong>in</strong>fluence on the results of us<strong>in</strong>g different allocation approaches and scenarios for system expansion. The implications of<br />
alternative land use change (LUC) scenarios associated with the expansion of different soybean cultivation systems have also been<br />
evaluated. The LC GHG emissions of soybean oil vary widely for the alternative m<strong>et</strong>hods for handl<strong>in</strong>g co-products adopted demonstrat<strong>in</strong>g,<br />
based on the soybean oil case, the importance of assess<strong>in</strong>g different approaches to deal with multifunctionality <strong>in</strong> agri-food<br />
cha<strong>in</strong>s. Concern<strong>in</strong>g the LUC scenarios, the results show that LUC dom<strong>in</strong>ates soybean oil LC GHG emissions, but significant GHG<br />
variation was observed b<strong>et</strong>ween the alternative scenarios.<br />
Keywords: life-cycle GHG assessment, multifunctionality, soybean meal, soybean oil, substitution<br />
1. Introduction<br />
Despite the significant growth <strong>in</strong> the number of published studies address<strong>in</strong>g the life-cycle (LC)<br />
greenhouse gas (GHG) <strong>in</strong>tensity of soybean oil for food and biodiesel production purposes (Buratti <strong>et</strong> al.,<br />
2010; Castanheira and Freire, <strong>2012</strong>; Hou <strong>et</strong> al., 2011, 2009; Kim and Dale, 2009; Panicheli <strong>et</strong> al., 2009;<br />
Re<strong>in</strong>hard and Zah, 2009), disagreement and controversies exist regard<strong>in</strong>g the modell<strong>in</strong>g assumptions or<br />
choices of these studies. The approach selected to attribute the emissions among the co-products <strong>in</strong> the<br />
soybean oil cha<strong>in</strong> has been one of this most critical issues, s<strong>in</strong>ce it may significantly <strong>in</strong>fluence or even<br />
d<strong>et</strong>erm<strong>in</strong>e the result of the assessment (Weidema, 2003). In some of the soybean oil LC GHG assessment<br />
studies, only one type of multifunctionality approach is applied (Buratti <strong>et</strong> al., 2010) and even for the same<br />
approach the results vary widely (Castanheira and Freire, <strong>2012</strong>; Huo <strong>et</strong> al., 2009). S<strong>in</strong>ce multifunctionality is<br />
a critical <strong>in</strong> the soybean oil cha<strong>in</strong>, a sensitivity analysis shall be conducted to illustrate how different m<strong>et</strong>hods<br />
change the results (ISO, 2006).<br />
Another important aspect that has not captured sufficient attention y<strong>et</strong> is the GHG emissions due to the<br />
carbon stock changes from land use change (LUC) related with different soybean cultivation systems<br />
expansion. The ma<strong>in</strong> goal of this paper is to assess and discuss the implications of adopt<strong>in</strong>g different<br />
allocation m<strong>et</strong>hods (mass, energy and marked price based allocation) and different scenarios of system<br />
expansion on the LC GHG emissions of soybean oil. The implications of alternative LUC scenarios were<br />
also evaluated.<br />
2. LC model<strong>in</strong>g and <strong>in</strong>ventory<br />
A LC model and <strong>in</strong>ventory for the various stages of the soybean oil cha<strong>in</strong> was developed and implemented.<br />
The model <strong>in</strong>cludes land use change (LUC), soybean cultivation <strong>in</strong> Brazil and soybean transport to<br />
Portugal, where soybean oil extraction, tog<strong>et</strong>her with soybean meal production, takes place. A comprehensive<br />
evaluation of 20 scenarios, result<strong>in</strong>g from a comb<strong>in</strong>ation of alternative LUC scenarios (conversion of<br />
managed forest plantation, perennial crop plantation, savannah and grassland) and different cultivation systems<br />
(tillage and no-tillage) was performed to analyse the effect on soybean oil GHG <strong>in</strong>tensity. Table 1<br />
shows the ma<strong>in</strong> <strong>in</strong>puts for 2 <strong>in</strong>ventories of alternative soybean cultivation that were selected from transparent<br />
studies: no-tillage system (Caval<strong>et</strong>t and Ortega, 2009, 2010) and tillage system (Jungbluth <strong>et</strong> al., 2007). It<br />
should be noted that these studies are <strong>in</strong>dependent and use different data sources for the 2 <strong>in</strong>ventories presented<br />
<strong>in</strong> Table 1. Thus, the differences b<strong>et</strong>ween them are not necessarily caused by the tillage system. In<br />
fact, it can be seen that no-tillage requires more fertiliser than tillage and that both systems use the same<br />
amount of diesel. This does not seem very logical s<strong>in</strong>ce no-tillage requires less mach<strong>in</strong>ery (diesel) work and<br />
fertilisers. GHG emissions arise from fertiliser application and biological nitrogen fixation (N2O), diesel<br />
combustion from agricultural operations and from the production of <strong>in</strong>puts (Frischknecht <strong>et</strong> al., 2007; IPCC,<br />
2006; Jungbluth, 2007; Kellenberger <strong>et</strong> al., 2007; Nemecek <strong>et</strong> al., 2007; Patyk <strong>et</strong> al., 1997).
PARALLEL SESSION 3A: LAND USE CHANGE 8 th Int. Conference on <strong>LCA</strong> <strong>in</strong> the<br />
Agri-<strong>Food</strong> Sector, 1-4 Oct <strong>2012</strong><br />
Table 1. Soybean cultivation systems: ma<strong>in</strong> <strong>in</strong>puts and yields (values per ha and year).<br />
No-tillage (Caval<strong>et</strong>t and Ortega, 2009, 2010) Tillage (Jungbluth <strong>et</strong> al., 2007)<br />
Pesticides 8.0 kg 1.47 kg a<br />
Limestone 375 kg -<br />
Fertilisers 33.8 kg P and 65.4 kg K 30 kg P2O5 b and 30 kg K2O<br />
Diesel 65 L 65 L<br />
Electricity 122 MJ -<br />
Soybean production (yield) 2830 kg 2544 kg<br />
a 2,4-D (51%), glyphosate (37%), monocrotofos(8%) and endosulfan (4%).<br />
b Diammonium phosphate (45%), s<strong>in</strong>gle super phosphate (29%), triple super phosphate (16%), phosphate rock (5%) and ammonium<br />
nitrate phosphate (5%).<br />
Two climate regions (tropical moist and warm temperate moist) and a low activity clay soil were considered<br />
for LUC emissions calculations. GHG emissions from carbon stock changes caused by LUC were calculated<br />
based on the carbon stock associated with each Reference land use, CSR (previous land use types)<br />
and the carbon stock associated with the soybean production systems considered, CSA (Actual land use),<br />
follow<strong>in</strong>g IPCC Tier 1 and European Union Directive on Renewable Energy (EC, 2009, 2010; IPCC, 2006).<br />
Soil organic carbon (SOC) calculated and the above and below ground veg<strong>et</strong>ation carbon stock <strong>in</strong> liv<strong>in</strong>g<br />
biomass and <strong>in</strong> dead organic matter (CVEG) adopted from EC (2010) are presented <strong>in</strong> Fig. 1 for the various<br />
reference land use (SOCR and CVEGR) and for the soybean plantations (SOCA and CVEGA).<br />
Carbon stock (t C/ha)<br />
120<br />
100<br />
80<br />
60<br />
40<br />
20<br />
0<br />
Managed<br />
forest<br />
Improved<br />
management<br />
Moderatly<br />
degraded<br />
Severely<br />
degraded<br />
Tillage No-tillage Improved<br />
management<br />
Savannah Soybean plantation Managed<br />
forest<br />
Perennial crop<br />
(reduced<br />
tillage)<br />
Moderatly<br />
degraded<br />
Figure 1. Carbon stocks of previous land use (SOCR and CVEGR) and of soybean plantation (SOCA and CVEGA)<br />
for 2 climate regions <strong>in</strong> Brazil.<br />
Soybean produced <strong>in</strong> Brazil is transported from plantation to the Paranaguá port by road (897 km) and by<br />
transoceanic freight ship over 8393 km to Lisbon port (near the oil extraction plant). GHG emissions related<br />
with the soybean transportation were calculated based on these average distances and the factors given by<br />
Spielmann <strong>et</strong> al., (2007). Regard<strong>in</strong>g the soybean oil extraction process (co-produced with soybean meal), a<br />
LC <strong>in</strong>ventory and modell<strong>in</strong>g was implemented based on average data collected from Portuguese <strong>in</strong>dustry.<br />
Electricity and heat requirements are 0.16 MWh/t oil and 3292 MJ/t oil, respectively. Natural gas and heavy<br />
fuel oil are used to produce heat. Electricity is obta<strong>in</strong>ed from the grid and produced onsite from a natural gas<br />
comb<strong>in</strong>ed heat and power (cogeneration) plant. GHG emissions from electricity and heat production were<br />
calculated based on EC (2009), Faist Emmenegger <strong>et</strong> al., (2007), Frischknecht <strong>et</strong> al., (2007) and Jungbluth <strong>et</strong><br />
al., (2007). The GHG emissions from hexane production have also been considered based on the quantity<br />
consumed (7.9 kg/t oil) and the GHG emission factor (Jungbluth <strong>et</strong> al., 2007). S<strong>in</strong>ce a valuable co-product is<br />
obta<strong>in</strong>ed from the soybean oil extraction system, the soybean meal, there is a multifunctional issue that<br />
should be solved. Several scenarios based on alternative allocation and substitution approach were used for<br />
deal<strong>in</strong>g with this co-production, as d<strong>et</strong>ailed <strong>in</strong> the next sub-section.<br />
2.1. Multifunctionality <strong>in</strong> the soybean oil process: allocation and substitution scenarios<br />
Severely<br />
degraded<br />
Tillage No-tillage<br />
Grassland Soybean plantation<br />
CSR CSA CSR CSA<br />
Tropical, moist (Brazil, Central -West) Warm temperate, moist (Brazil, South)<br />
The ISO standards provide a hierarchical approach for handl<strong>in</strong>g co-products (ISO, 2006): avoid<strong>in</strong>g allocation<br />
(by divid<strong>in</strong>g the unit process to be allocated <strong>in</strong>to sub-processes or expand<strong>in</strong>g the product system to <strong>in</strong>-<br />
CVEG<br />
SOC<br />
CS R: Carbon stock associated with the reference land use<br />
CS A: Carbon stock associated with the actual land use<br />
263
PARALLEL SESSION 3A: LAND USE CHANGE 8 th Int. Conference on <strong>LCA</strong> <strong>in</strong> the<br />
Agri-<strong>Food</strong> Sector, 1-4 Oct <strong>2012</strong><br />
clude the additional functions related to the co-products) and allocation based on physical (e.g. mass, energy)<br />
or other (mark<strong>et</strong> price) relationships b<strong>et</strong>ween the co-products.<br />
In the substitution m<strong>et</strong>hod, the system is expanded with “avoided” processes to remove additional functions<br />
related to the soybean meal (Gu<strong>in</strong>ee <strong>et</strong> al., 2009). Two alternative scenarios for the substitution of soybean<br />
meal were implemented. Soybean meal is ma<strong>in</strong>ly used as animal feed and these scenarios took <strong>in</strong>to<br />
account two product systems that are currently displaced by soybean meal co-produced with soybean oil <strong>in</strong><br />
Portugal accord<strong>in</strong>g to experts from the soybean oil <strong>in</strong>dustry.<br />
Substitution scenario “Imported Soybean meal” (ISM) describes the case <strong>in</strong> which soybean meal<br />
co-produced with soybean oil <strong>in</strong> Portugal displaces direct soybean meal imports from Argent<strong>in</strong>a<br />
for animal feed purposes. Substitution credits for GHG emissions were quantified based on the<br />
GHG <strong>in</strong>tensity of soybean meal produced <strong>in</strong> Argent<strong>in</strong>a given by Dalgaard <strong>et</strong> al., (2008): 721 g<br />
CO2eq/kg meal (no LUC).<br />
Substitution scenario “Imported Soybean” (IS) describes the case <strong>in</strong> which soybean meal coproduced<br />
with soybean oil <strong>in</strong> Portugal displaces direct soybean imports from Brazil (also used as<br />
animal feed <strong>in</strong> Portugal). The substitution credits for GHG emissions were quantified based on the<br />
GHG <strong>in</strong>tensity of soybean produced <strong>in</strong> Brazil (calculated <strong>in</strong> this paper: 432 g CO2eq/kg soybean,<br />
no LUC and no-tillage) and assum<strong>in</strong>g a displacement ratio of 0.85 kg soybean meal per kg of soybean,<br />
based on an equivalent prote<strong>in</strong> content.<br />
In allocation, the multifunctional process is split up <strong>in</strong>to two s<strong>in</strong>gle functional processes (oil + meal)<br />
based on specific relationships. In this paper, a sensitivity analysis of allocation based on mass, energy<br />
(lower heat<strong>in</strong>g value, LHV) and mark<strong>et</strong> prices was performed. Table 2 shows the mass, energy and economic<br />
data (based <strong>in</strong> 2010 monthly mark<strong>et</strong> prices from IMF, 2011) used to calculate the allocation factors for soybean<br />
oil and meal. Three alternative economic allocation factors were calculated based on: the average annual<br />
prices for oil and meal (“Av”); the monthly prices for which the price ratio b<strong>et</strong>ween oil and meal is the<br />
lowest (“M<strong>in</strong>”) and it is the highest (“Max”). It should be noted that soybean oil and meal have different<br />
characteristics, be<strong>in</strong>g used for compl<strong>et</strong>ely different purposes (e.g. energy purposes, food and feed production),<br />
which complicates the selection of a particular allocation m<strong>et</strong>hod.<br />
Table 2. Soybean oil and meal mass ratios, LHV, mark<strong>et</strong> prices and correspond<strong>in</strong>g allocation factors.<br />
Mass Energy Mark<strong>et</strong> price<br />
Mass ratio<br />
(t/t oil)<br />
Allocation<br />
factor<br />
LHV<br />
(MJ/kg)<br />
Allocation<br />
factor<br />
Prices a (US$/t)<br />
M<strong>in</strong> Max Av<br />
Allocation factor<br />
M<strong>in</strong> Max Av<br />
Oil 1.0 20% 36.6 36% 837 1208 925 38% 43% 41%<br />
Meal<br />
a<br />
IMF (2011)<br />
4.1 80% 16.3 64% 335 388 331 62% 57% 59%<br />
3. Results and discussion<br />
Fig. 2 presents the results of a sensitivity analysis conducted to illustrate the implications of different<br />
multifunctionality approaches on the GHG balance of soybean oil (exclud<strong>in</strong>g LUC). It can be observed that<br />
the results obta<strong>in</strong>ed for different approaches present significant variation: b<strong>et</strong>ween -0.36 and 1.12 kg<br />
CO2eq/kg. The lowest value was obta<strong>in</strong>ed when the substitution scenario “Imported Soybean meal” (ISM) is<br />
adopted. In contrast, soybean oil had higher emissions for mark<strong>et</strong>-price-based allocation. This large variation<br />
<strong>in</strong> results demonstrates the critical <strong>in</strong>fluence on the results of the m<strong>et</strong>hod selected for handl<strong>in</strong>g co-production.<br />
This also justifies the need to perform a sensitivity analysis, as recommended by ISO 14044:2006 (ISO,<br />
2006).<br />
Regard<strong>in</strong>g allocation approaches, the GHG emissions calculated based on energy or mark<strong>et</strong> price allocations<br />
are almost double compared results obta<strong>in</strong>ed us<strong>in</strong>g mass allocation. The results do not significantly<br />
vary <strong>in</strong> consequence of annual mark<strong>et</strong> price variations, s<strong>in</strong>ce soybean meal has a relatively high mass share<br />
of the extraction process, and its price (mostly driven by the livestock feed <strong>in</strong>dustry) does not vary as much<br />
as the oil price (Fig. 2). Furthermore, it can be said that it is soybean meal demand that d<strong>et</strong>erm<strong>in</strong>es the production<br />
volume of the soybean oil extraction process.<br />
264
PARALLEL SESSION 3A: LAND USE CHANGE 8 th Int. Conference on <strong>LCA</strong> <strong>in</strong> the<br />
Agri-<strong>Food</strong> Sector, 1-4 Oct <strong>2012</strong><br />
LC GHG balance<br />
(kg CO 2eq/kg soybean oil)<br />
1,2<br />
1,0<br />
0,8<br />
0,6<br />
0,4<br />
0,2<br />
0,0<br />
-0,2<br />
-0,4<br />
-0,6<br />
0,51<br />
0,91<br />
0,98<br />
Figure 2. LC GHG emissions of soybean oil (no LUC, no-tillage): different m<strong>et</strong>hods for handl<strong>in</strong>g coproducts.<br />
Fig. 3 presents soybean oil life-cycle GHG emissions (energy allocation) from soybean produced <strong>in</strong> 2<br />
climate regions <strong>in</strong> Brazil. The results for the alternative LUC scenarios are comparatively assessed. The contribution<br />
of each LC phase (LUC, cultivation, transport and oil extraction) is also shown. The results show a<br />
huge variation <strong>in</strong> GHG emissions: b<strong>et</strong>ween 0.9 kg CO2eq/kg (no LUC) and 12.9 kg CO2eq/kg (previous improved<br />
management savannah, tropical moist region). LUC dom<strong>in</strong>ates the results. GHG emissions due to<br />
LUC represent more than 69% <strong>in</strong> all scenarios, except for the scenarios where soybean is cultivated <strong>in</strong> previous<br />
severely degraded grassland <strong>in</strong> warm temperate region. The GHG emissions of soybean oil associated<br />
with cultivation, transport and oil extraction are also compared <strong>in</strong> Fig. 3. Concern<strong>in</strong>g the scenarios with no<br />
LUC, process contributions to the GHG balance are as follows: cultivation (3-44%), transport (3-44%) and<br />
oil extraction (1-14%).<br />
Figure 3. LC GHG emissions of soybean oil (energy allocation): LUC scenarios and phase contribution.<br />
4. Conclusions<br />
The ma<strong>in</strong> goal of this paper is to assess and discuss the implications of adopt<strong>in</strong>g different allocation<br />
m<strong>et</strong>hods (mass, energy and marked price based allocation) and different scenarios of system expansion on<br />
the LC GHG emissions of soybean oil. The sensitivity analysis conducted to illustrate the consequences of<br />
different multifunctionality approaches shows that results are very sensitive to the approach adopted. The<br />
1,12<br />
Mass Energy Economic<br />
1,05<br />
ISM: Imported soybean meal<br />
IS: Imported soybean<br />
-0,36<br />
M<strong>in</strong> Max Av ISM IS<br />
Allocation Substitution m<strong>et</strong>hod<br />
LC GHG balance<br />
(kg CO 2eq/kg soybean oil) Transport<br />
14<br />
12<br />
10<br />
8<br />
6<br />
4<br />
2<br />
0<br />
NT T NT T NT T NT T NT T NT T NT T NT T NT T NT T<br />
Managed forest Improved Moderatly degraded<br />
management savannah savannah<br />
Severely degraded<br />
savannah<br />
Managed forest Perennial crop<br />
(reduced-tillage)<br />
Improved Moderatly degraded<br />
management grassland grassland<br />
No LUC Tropical, moist (Brazil, Central-West) Warm temperate, moist (Brazil, South)<br />
0,51<br />
Oil extraction<br />
Cultivation<br />
LUC<br />
NT: No-tillage<br />
T: Tillage<br />
Severely degraded<br />
grassland<br />
265
PARALLEL SESSION 3A: LAND USE CHANGE 8 th Int. Conference on <strong>LCA</strong> <strong>in</strong> the<br />
Agri-<strong>Food</strong> Sector, 1-4 Oct <strong>2012</strong><br />
lowest GHG emissions were obta<strong>in</strong>ed when substitution scenario “Imported Soybean meal” (ISM) is adopted<br />
and the highest emissions when mark<strong>et</strong> price based allocation is applied. The implications of alternative<br />
LUC scenarios were also evaluated, show<strong>in</strong>g that the orig<strong>in</strong>al land choice is a critical issue. It was not possible<br />
to compare results from alternative cultivation systems (tillage and non-tillage) due to limitations of <strong>in</strong>ventory<br />
data. The results presented here suggest future work develop<strong>in</strong>g specific LC <strong>in</strong>ventory and model<strong>in</strong>g<br />
for tillage and no-tillage soybean plantation to allow a comparison b<strong>et</strong>ween cultivation systems.<br />
To assure the lowest LC GHG balance of soybean oil, severely degraded grassland should be preferably<br />
used for soybean cultivation. The results demonstrate the importance of LUC on soybean oil GHG emissions;<br />
however, large variations on the GHG balance were calculated b<strong>et</strong>ween the various LUC scenarios.<br />
5. Acknowledgments<br />
The research presented <strong>in</strong> this paper was supported by ECODEEP project (Eco-efficiency and Ecomanagement<br />
<strong>in</strong> Agro Industrial sector, nº FCOMP – 05 – 0128 – FEDER – 018643) and the Portuguese Science<br />
and Technology Foundation (FCT) projects: PTDC/SEN-TRA/117251/2010 (Extended “well-towheels”<br />
assessment of biodiesel for heavy transport vehicles) and MIT/SET/0014/2009 (Captur<strong>in</strong>g Uncerta<strong>in</strong>ty<br />
<strong>in</strong> Biofuels for Transportation. Resolv<strong>in</strong>g Environmental Performance and Enabl<strong>in</strong>g Improved Use).<br />
Furthermore, Érica Geraldes Castanheira gratefully acknowledges support from FCT, through grant<br />
SFRH/BD/60328/2009 and the Energy for Susta<strong>in</strong>ability Initiative at the University of Coimbra<br />
(www.uc.pt/efs).<br />
6. References<br />
Buratti, C., Mor<strong>et</strong>ti, E., Fantozzi, F., 2010. Assess<strong>in</strong>g the GHG emissions of rapeseed and soybean biodiesel <strong>in</strong> compliance to the EU<br />
Renewable Energy Directive m<strong>et</strong>hodology for biofuels. 18th European Biomass Conference and Exhibition, 3-7 May 2010,<br />
Lyon, <strong>France</strong>.<br />
Castanheira, É., Freire, F., <strong>2012</strong>. Life-cycle GHG assessment of soybean biodiesel. Proceed<strong>in</strong>gs of the International Symposium on<br />
Susta<strong>in</strong>able Systems and Technology (IEEE ISSST). 5 pages. Boston, MA, USA.<br />
Caval<strong>et</strong>t, O., Ortega, E., 2010. Integrated environmental assessment of biodiesel production from soybean <strong>in</strong> Brazil. Journal of<br />
Cleaner Production 18, 55-70.<br />
Caval<strong>et</strong>t, O., Ortega, E., 2009. Emergy, nutrients balance, and economic assessment of soybean production and <strong>in</strong>dustrialization <strong>in</strong><br />
Brazil. Journal of Cleaner Production 17, 762-771.<br />
Dalgaard, R., Schmidt, J., Halberg, N., Christensen, P., Thrane, M., Pengue, W. A., 2008. <strong>LCA</strong> of Soybean Meal. Int. J. Life Cycle<br />
Assess. 3, 240-254.<br />
European Commission, 2010. Commission Decision of 10 June 2010 on guidel<strong>in</strong>es for the calculation of land carbon stocks for the<br />
purpose of Annex V to Directive 2009/28/EC. Official Journal of the European Union, L151/19 of 17.6.2010.<br />
European Commission, 2009. Directive 2009/28/EC of the European Parliament and of the council of 23 April 2009 on the promotion<br />
of the use of energy from renewable sources and amend<strong>in</strong>g and subsequently repeal<strong>in</strong>g Directives 2001/77/EC and<br />
2003/30/EC. Official Journal of the European Union, L140/16 of 5.6.2009.<br />
Faist Emmenegger, M., Heck, T., Jungbluth, N., 2007. Erdgas. Sachbilanzen von Energiesystemen. F<strong>in</strong>al report No. 6 eco<strong>in</strong>vent data<br />
v2.0. Editors: Dones R.. Volume: 6. Swiss Centre for LCI, PSI. Dübendorf and Villigen, CH.<br />
Frischknecht, R., Tuchschmid, M., Faist Emmenegger, M., Bauer, C., Dones, R., 2007. Strommix und Stromn<strong>et</strong>z. Sachbilanzen von<br />
Energiesystemen. F<strong>in</strong>al report No. 6 eco<strong>in</strong>vent data v2.0. Editors: Dones R. Volume: 6. Swiss Centre for LCI, PSI. Dübendorf<br />
and Villigen, CH.<br />
Gu<strong>in</strong>ée, J.B., Heijungs, R., van der Vo<strong>et</strong>, E., 2009. A greenhouse gas <strong>in</strong>dicator for bioenergy: some theor<strong>et</strong>ical issues with practical<br />
implications. Int J <strong>LCA</strong> 14(4), 328-339.<br />
Hou, J., Zhang, P., Yuan, X., Zheng, Y., 2011. Life cycle assessment of biodiesel from soybean, jatropha and microalgae <strong>in</strong> Ch<strong>in</strong>a<br />
conditions. Renewable and Susta<strong>in</strong>able Energy Reviews 15, 5081–5091.<br />
Huo, H., Wang, M., Bloyd, C., Putsche, V., 2009. Life-Cycle Assessment of Energy Use and Greenhouse Gas Emissions of Soybean-<br />
Derived Biodiesel and Renewable Fuels. Environ. Sci. Technol. 43, 750-756.<br />
IMF, 2011. Historical commodity prices - International Mon<strong>et</strong>ary Fund. Available at IndexMundi website<br />
(http://www.<strong>in</strong>dexmundi.com/commodities/), 11.07.2011.<br />
IPCC, 2006. IPCC guidel<strong>in</strong>es for national greenhouse gas <strong>in</strong>ventories. Prepared by the National Greenhouse Gas Inventories Programme,<br />
Eggleston, H.S., Buendia, L., Miwa, K., Ngara, T., Tanabe, K. (Eds.). Hayama, Japan: Institute for Global Environmental<br />
Strategies.<br />
ISO, 2006. ISO 14044: environmental management. Life cycle assessment e requirements and guidel<strong>in</strong>es. ISO-International Organization<br />
for Standardization, Genève, Switzerland.<br />
Jungbluth, N., Chudacoff, M., Dauriat, A., D<strong>in</strong>kel, F., Doka, G., Faist Emmenegger, M., Gnansounou, E., Kljun, N., Spielmann, M.,<br />
St<strong>et</strong>tler, C., Sutter, J., 2007. Life Cycle Inventories of Bioenergy. F<strong>in</strong>al report eco<strong>in</strong>vent data v2.0. Volume: 17. Swiss Centre for<br />
LCI, ESU. Duebendorf and Uster, CH.<br />
Jungbluth, N., 2007. Erdöl. Sachbilanzen von Energiesystemen. F<strong>in</strong>al report No. 6 eco<strong>in</strong>vent data v2.0. Editors: Dones R. Volume: 6.<br />
Swiss Centre for LCI, PSI. Dübendorf and Villigen, CH.<br />
Kellenberger, D., Althaus, H.-J., Jungbluth, N., Künniger, T., 2007. Life Cycle Inventories of Build<strong>in</strong>g Products. F<strong>in</strong>al report eco<strong>in</strong>vent<br />
data v2.0, Vol. 7, Swiss Centre for LCI, Empa – TSL, Dübendorf.<br />
Kim, S., Dale, B. E., 2009. Regional variations <strong>in</strong> greenhouse gas emissions of biobased products <strong>in</strong> the United States—corn-based<br />
<strong>et</strong>hanol and soybean oil. Int J Life Cycle Assess,14, 540–546.<br />
266
PARALLEL SESSION 3A: LAND USE CHANGE 8 th Int. Conference on <strong>LCA</strong> <strong>in</strong> the<br />
Agri-<strong>Food</strong> Sector, 1-4 Oct <strong>2012</strong><br />
Nemecek, T., Kägi, T., Blaser, S., 2007. Life Cycle Inventories of Agricultural Production Systems, Eco<strong>in</strong>vent report version 2.0,<br />
Vol. 15, Swiss Centre for LCI, ART, Duebendorf and Zurich.<br />
Patyk, A., Re<strong>in</strong>hardt, G., 1997. Düngemittel - Energie- und Stoffstromsbilanzen. Vieweg. Umweltvissenschaften. Friedr. Vieweg &<br />
Sohn Verlagsgesellschaft mbH, Braunschweig/Wiesbaden, Germany.<br />
Panichelli, L., Dauriat, A., Gnansounou, E., 2009. Life cycle assessment of soybean-based biodiesel <strong>in</strong> Argent<strong>in</strong>a for export. Int. J.<br />
Life Cycle Assess. 14, 144-159.<br />
Re<strong>in</strong>hard, J., Zah, R., 2009. Global environmental consequences of <strong>in</strong>creased biodiesel consumption <strong>in</strong> Switzerland: consequential<br />
life cycle assessment. Journal of Cleaner Production 17, S46–S56.<br />
Spielmann, M., Dones, R., Bauer, C., 2007. Life Cycle Inventories of Transport Services. F<strong>in</strong>al report eco<strong>in</strong>vent Data v2.0, Vol.: 14,<br />
Issue: 0, Swiss Centre for LCI, PSI, Dübendorf and Villigen.<br />
Weidema, B., 2003. Mark<strong>et</strong> <strong>in</strong>formation <strong>in</strong> life cycle assessment, Environmental Project No. 863. Available at: http://www.norlca.org<br />
267
PARALLEL SESSION 3A: LAND USE CHANGE 8 th Int. Conference on <strong>LCA</strong> <strong>in</strong> the<br />
Agri-<strong>Food</strong> Sector, 1-4 Oct <strong>2012</strong><br />
Consider<strong>in</strong>g land use change and soil carbon dynamics <strong>in</strong> an <strong>LCA</strong> of<br />
French agricultural products<br />
Thibault Salou 1,2,* , Etienne Mathias 3 , Aurélie Tailleur 4 , Anne Paillier 5 , Hayo M.G. van der Werf 1,2<br />
1 INRA, UMR1069 Sol, Agro and hydroSystem, 35000 Rennes, <strong>France</strong><br />
2 Agrocampus Ouest, 35000 Rennes, <strong>France</strong><br />
3 CITEPA, 7 Cité Paradis – 75010 Paris, <strong>France</strong><br />
4 ARVALIS – Institut du Végétal, 75016 Paris, <strong>France</strong><br />
5 ADEME, 20 Avenue du Grésillé - 49 000 Angers, <strong>France</strong><br />
* Correspond<strong>in</strong>g author. E-mail: thibault.salou@rennes.<strong>in</strong>ra.fr<br />
ABSTRACT<br />
Agri-BALYSE is a programme to provide LCIs of agricultural products at the farm gate, to br<strong>in</strong>g reliable<br />
and compl<strong>et</strong>e environmental <strong>in</strong>formation on “product plus packag<strong>in</strong>g” to consumers. The choice of appropriate<br />
m<strong>et</strong>hods for the estimation of resource use and emissions of pollutants is a major challenge for Agri-<br />
BALYSE.<br />
Two m<strong>et</strong>hods to estimate soil C dynamics from direct Land Use Change (LUC) <strong>in</strong> ma<strong>in</strong>land <strong>France</strong> were<br />
developed. These m<strong>et</strong>hods are based on IPCC (2003) recommendations. Data from the French Soil Survey<br />
N<strong>et</strong>work (Mart<strong>in</strong> <strong>et</strong> al., 2011) and the French United Nations Framework Convention on Climate Change<br />
National Inventory Report (UNFCCC NIR) (CITEPA, <strong>2012</strong>) allowed us to d<strong>et</strong>erm<strong>in</strong>e: i) soil C stocks, ii)<br />
areas <strong>in</strong>volved <strong>in</strong> LUC for both grasslands and annual crops, for each year of our reference period (2005-<br />
2009). Emission factors were d<strong>et</strong>erm<strong>in</strong>ed for permanent grassland and annual crops <strong>in</strong> the simplified m<strong>et</strong>hod;<br />
for permanent grassland and for each annual crop <strong>in</strong>dividually, tak<strong>in</strong>g <strong>in</strong> consideration spatial repartition, <strong>in</strong><br />
the more accurate m<strong>et</strong>hod.<br />
Keywords: soil carbon sequestration, land-use change, direct field emission, grassland<br />
1. Introduction<br />
In 2009 two French laws, Grenelle 1 and 2, on the provision of reliable and compl<strong>et</strong>e environmental <strong>in</strong>formation<br />
on “product plus packag<strong>in</strong>g” to consumers were passed. The Life Cycle Assessment (<strong>LCA</strong>)<br />
m<strong>et</strong>hod was chosen to assess environmental impacts of products. ADEME, the French Environment and<br />
Energy Management Agency, was mandated to s<strong>et</strong> up a Life Cycle Inventory (LCI) database to support this<br />
policy. In early 2010 ADEME commissioned the Agri-BALYSE programme <strong>in</strong>volv<strong>in</strong>g: i) ART (Switzerland)<br />
and INRA as project co-leaders; ii) CIRAD, ACTA and 10 technical agricultural <strong>in</strong>stitutes for data<br />
collection, elaboration of m<strong>et</strong>hods and implementation <strong>in</strong> practice. The aims of Agri-BALYSE are: i) to provide<br />
LCIs of agricultural products at the farm gate; ii) to establish a common m<strong>et</strong>hodological framework to<br />
create LCIs of agricultural goods.<br />
The choice of appropriate m<strong>et</strong>hods for the estimation of resource use and emissions of pollutants associated<br />
with agricultural products is a major challenge for Agri-BALYSE. In this respect the impact of land-use<br />
change (LUC) on GreenHouse Gas (GHG) emissions is an important issue. Several studies propose m<strong>et</strong>hodologies<br />
to consider this issue: IPCC (2003) applied to <strong>France</strong> <strong>in</strong> the French United Nations Framework Convention<br />
on Climate Change National Inventory Report (UNFCCC NIR) (CITEPA, <strong>2012</strong>), Milà i Canals <strong>et</strong><br />
al., (<strong>2012</strong>).<br />
The aim of Agri-BALYSE is to provide LCIs of French agricultural products at the farm gate. To ensure<br />
consistency b<strong>et</strong>ween the various products of the data base, a general m<strong>et</strong>hodological framework for the programme<br />
was def<strong>in</strong>ed. It was decided that the m<strong>et</strong>hodologies used and the deliverables must be consistent<br />
with ILCD recommendations (JRC and EIS, 2010). This guide recommends “for CO2 release caused by land<br />
use and land transformation, the use of the most recent IPCC CO2 emission factor [...], unless more accurate,<br />
specific data is available”. With<strong>in</strong> the Agri-BALYSE programme we decided to focus on LUC b<strong>et</strong>ween permanent<br />
grasslands and annual crops <strong>in</strong> ma<strong>in</strong>land <strong>France</strong>. We considered that <strong>in</strong> this context we could ignore<br />
changes <strong>in</strong> above- and below-ground biomass and consider that Soil Organic Carbon (SOC) was the ma<strong>in</strong><br />
source of GHG emissions. Accord<strong>in</strong>g to IPCC 2003 two reasons can lead to a C soil stock change: i) modification<br />
of management practices (ex: fertilisation, veg<strong>et</strong>ation cover); ii) LUC (ex: conversion from permanent<br />
grassland to annual crop).<br />
In <strong>LCA</strong> studies carried out <strong>in</strong> <strong>France</strong> soil C dynamics are rarely considered, except when permanent<br />
grassland is concerned (Doreau and Dollé, 2011, Doreau <strong>et</strong> al., 2011, Nguyen <strong>et</strong> al., <strong>2012</strong>). These studies<br />
<strong>in</strong>volv<strong>in</strong>g permanent grassland use a m<strong>et</strong>hod proposed by Doreau and Dollé (2011). Based on experimental<br />
268
PARALLEL SESSION 3A: LAND USE CHANGE 8 th Int. Conference on <strong>LCA</strong> <strong>in</strong> the<br />
Agri-<strong>Food</strong> Sector, 1-4 Oct <strong>2012</strong><br />
results published by Arrouays <strong>et</strong> al., (2002), this m<strong>et</strong>hod proposes emission factors: -500 kg C/ha/yr for permanent<br />
grassland up to 30 years old; -200 kg C/ha/yr for permanent grassland more than 30 years old. For<br />
temporary grassland, the calculation considers a cycle of 5 years of grassland that emits -500 kg C/ha/yr,<br />
followed by two years of annual crops that emit 1000 kg C/ha/yr. In this m<strong>et</strong>hod emissions for annual crops<br />
are 0 kg C/ha/yr. This m<strong>et</strong>hod could not be implemented <strong>in</strong> Agri-BALYSE because it is <strong>in</strong> conflict with<br />
IPCC recommendations, as it considers that permanent grassland (i.e. not result<strong>in</strong>g from LUC) sequesters C<br />
under constant management.<br />
Measured emission factors for permanent grassland and annual crops are also available <strong>in</strong> the literature<br />
(Schulze <strong>et</strong> al., 2009; Soussana <strong>et</strong> al., 2009). We chose not to use them for two reasons: i) differences <strong>in</strong> the<br />
m<strong>et</strong>hodologies used to d<strong>et</strong>erm<strong>in</strong>e them, which is contrary to the desired consistency for the Agri-BALYSE<br />
LCI database; ii) difficulties to accurately identify the cause of this CO2 emission (LUC, management<br />
change, <strong>in</strong>creased atmospheric CO2 content,...).<br />
In this paper, we focus on soil carbon dynamics result<strong>in</strong>g from direct LUC <strong>in</strong> ma<strong>in</strong>land <strong>France</strong>. In Agri-<br />
BALYSE, soil carbon dynamics for areas without LUC, i.e. result<strong>in</strong>g from changes <strong>in</strong> management practices,<br />
could not be taken <strong>in</strong>to account, as <strong>in</strong>sufficient data on management of crops and grassland were available.<br />
2. M<strong>et</strong>hods<br />
In collaboration with CITEPA, the French Interprofessional Technical Centre for Studies on Air Pollution<br />
which is <strong>in</strong> charge of report<strong>in</strong>g French national greenhouse gas emissions, and ARVALIS, a technical <strong>in</strong>stitute<br />
<strong>in</strong>volved <strong>in</strong> Agri-BALYSE, two m<strong>et</strong>hods for estimat<strong>in</strong>g soil C dynamics from direct LUC were developed.<br />
Both are based on the mass balance m<strong>et</strong>hod described <strong>in</strong> IPCC 2003. The basics of these m<strong>et</strong>hods are<br />
to compare soil C stocks at two dates (correspond<strong>in</strong>g to two land use types) and allocate the carbon emissions<br />
/ absorptions over the period b<strong>et</strong>ween the two dates. IPCC gives a transition period of 20 years as a<br />
standard. C flows can be estimated from LUC area and estimations of soil C stocks for the <strong>in</strong>itial and f<strong>in</strong>al<br />
land-use. Soil C dynamics are considered to be l<strong>in</strong>ear over the transition period. One important hypothesis of<br />
the m<strong>et</strong>hod is that temporary grassland is considered as an annual crop.<br />
2.1. Construction of matrices<br />
The first step of the calculation is the construction of matrices for LUC b<strong>et</strong>ween permanent grassland and<br />
annual crops.<br />
In <strong>France</strong>, the M<strong>in</strong>istry of Agriculture implements a very large annual survey to monitor land use changes<br />
over time. This program, named TerUti and TerUti-Lucas s<strong>in</strong>ce 2005, provides the land cover and the land<br />
use of more than 300,000 fields sampled across ma<strong>in</strong>land <strong>France</strong>. The survey conta<strong>in</strong>s a d<strong>et</strong>ailed nomenclature<br />
to characterise the land use of each field (Table 1), this nomenclature is based on two param<strong>et</strong>ers: the<br />
land cover which is strictly the physical occupation (grass, trees, <strong>et</strong>c.), and the land-use which describes human<br />
activities. These def<strong>in</strong>itions can differ from common understand<strong>in</strong>g of grassland and cropland.<br />
Table 1. Nomenclature for permanent grasslands and annual crops for the survey TerUti-Lucas.<br />
Land cover codes Land-use codes<br />
Annual crops<br />
2110 (wheat) to 2530 (annual hay)<br />
All<br />
2730 (crop nursery) to 2742 (other crops)<br />
All<br />
6030 (bare soil)<br />
111 to 114 (agriculture)<br />
9999 (unknown)<br />
111 to 112 (cultivation)<br />
Permanent grass- 4020 (lands with bush and trees
PARALLEL SESSION 3A: LAND USE CHANGE 8 th Int. Conference on <strong>LCA</strong> <strong>in</strong> the<br />
Agri-<strong>Food</strong> Sector, 1-4 Oct <strong>2012</strong><br />
changes for each time series (Figure 1). F<strong>in</strong>al estimations of land use changes areas, used for the m<strong>et</strong>hodology<br />
Agri-BALYSE are provided <strong>in</strong> Table 2.<br />
15<br />
9<br />
1980 1990 2000 2010<br />
1980 1990 2000 2010<br />
Figure 1. Cropland and grassland areas from 1981 – 2010, before and after correction.<br />
Table 2. Twenty-year matrix of land use changes areas b<strong>et</strong>ween permanent grasslands and annual crops for<br />
ma<strong>in</strong>land <strong>France</strong> dur<strong>in</strong>g the period 1990-2010, based on UNFCCC (CITEPA, <strong>2012</strong>).<br />
Land-use changes Area (ha/year)<br />
Annual crops becom<strong>in</strong>g permanent grassland 118,158<br />
Permanent grassland becom<strong>in</strong>g annual crops 159,732<br />
2.2. Simplified m<strong>et</strong>hod to estimate soil C dynamics from LUC<br />
We first calculate soil C stocks for permanent grasslands and annual crops. The data from the French Soil<br />
Survey N<strong>et</strong>work (Mart<strong>in</strong> <strong>et</strong> al., 2011), allowed the calculation of an average soil C stock for both types of<br />
land use. This was done at national scale (Table 3), these averages obviously <strong>in</strong>tegrate a significant variability.<br />
Table 3. National average soil C stocks for permanent grassland and annual crops based on the French Soil<br />
Survey N<strong>et</strong>work.<br />
Land-Use Average Soil C Stock (tC/ha)<br />
Permanent grassland 72.7<br />
Annual crops 53.3<br />
∆ Grassland, Annual crop 19.4<br />
Then, the land use data from the French UNFCCC NIR (CITEPA, <strong>2012</strong>) allowed us to d<strong>et</strong>erm<strong>in</strong>e areas<br />
hav<strong>in</strong>g undergone LUC less than 20 years ago for each year of the Agri-BALYSE reference period: 2005-<br />
2009.<br />
The next step of the m<strong>et</strong>hod is to d<strong>et</strong>erm<strong>in</strong>e, for each year of the reference period, annual soil C storage/emissions<br />
for areas hav<strong>in</strong>g undergone LUC. The calculations have been done for each year of the reference<br />
period. This results <strong>in</strong> an emission factor for CO2 from LUC expressed per ha of permanent grassland<br />
hav<strong>in</strong>g undergone LUC (EFGrass_LUC -3.16 t CO2/ha) and a similar factor expressed per ha of annual crop (EF-<br />
Crop_LUC 3.40 t CO2/ha), for each year of the 2005-2009 period.<br />
An emission factor for permanent grasslands and annual crops, consider<strong>in</strong>g all areas of both land uses, <strong>in</strong>clud<strong>in</strong>g<br />
those that did not undergo LUC, is then calculated through Equations 1 and 2 from 2005 to 2009:<br />
Grassland/annual crop area <strong>in</strong> ha<br />
EFGrass_Tot: Emission factor for CO2 from LUC expressed per total area of permanent grassland (tC/ha)<br />
EFGrass_LUC: Emission factor for CO2 from LUC expressed per area of permanent grassland hav<strong>in</strong>g undergone LUC (tC/ha)<br />
EFCrop_Tot: Emission factor for CO2 from LUC expressed per total area of annual crop (tC/ha)<br />
EFCrop_LUC: Emission factor for CO2 from LUC expressed per area of annual crop hav<strong>in</strong>g undergone LUC (tC/ha)<br />
270<br />
Million ha<br />
22<br />
21<br />
20<br />
19<br />
18<br />
17<br />
16<br />
Croplands<br />
Raw data<br />
Corrected data<br />
Million ha<br />
13<br />
12<br />
11<br />
10<br />
Grasslands<br />
Raw data<br />
Corrected data<br />
Eq. 1<br />
Eq. 2
PARALLEL SESSION 3A: LAND USE CHANGE 8 th Int. Conference on <strong>LCA</strong> <strong>in</strong> the<br />
Agri-<strong>Food</strong> Sector, 1-4 Oct <strong>2012</strong><br />
The average soil C emission factor over the Agri-BALYSE reference period is then calculated for grasslands<br />
and annual crops. It will be applied to each ha concerned.<br />
2.3. M<strong>et</strong>hod to estimate crop-specific soil C dynamics from LUC<br />
In order to take <strong>in</strong>to account the regional specialisation of agriculture observed <strong>in</strong> <strong>France</strong>, we have tried to<br />
develop a more accurate m<strong>et</strong>hod. This m<strong>et</strong>hod should allow attribut<strong>in</strong>g LUC more to the crops which are<br />
most <strong>in</strong>volved <strong>in</strong> LUC to and from permanent grassland.<br />
The first steps are as for the simplified m<strong>et</strong>hod. The data from Teruti-Lucas n<strong>et</strong>work and French Soil Survey<br />
N<strong>et</strong>work are used to d<strong>et</strong>erm<strong>in</strong>e: i) permanent grassland and annual crop areas hav<strong>in</strong>g undergone LUC<br />
less than 20 years ago for each year of the Agri-BALYSE reference period: 2005-2009.and ii) average soil C<br />
stock for both land uses.<br />
Unlike the previous m<strong>et</strong>hod, which is implemented at the scale of ma<strong>in</strong>land <strong>France</strong>, this m<strong>et</strong>hod is implemented<br />
at the scale of ma<strong>in</strong>land <strong>France</strong>’s 22 adm<strong>in</strong>istrative regions to calculate emissions of soil C at the<br />
regional scale. Negative emissions (i.e. C sequestration) are attributed to the areas <strong>in</strong> permanent grassland,<br />
while positive emissions are attributed to areas <strong>in</strong> annual crops, yield<strong>in</strong>g regional emissions for permanent<br />
grassland and annual crops. The next step is to distribute emissions among crops with<strong>in</strong> each region accord<strong>in</strong>g<br />
to the relative area of each crop <strong>in</strong> the adm<strong>in</strong>istrative region over the 2005-2009 period, us<strong>in</strong>g the statistic<br />
data base of the Office of Statistics and Studies (SSP) of the French M<strong>in</strong>istry for <strong>Food</strong>, Agriculture and Fisheries<br />
(AGRESTE, <strong>2012</strong>). F<strong>in</strong>ally a crop-specific emission factor for ma<strong>in</strong>land <strong>France</strong> was calculated from<br />
regional crop emission factors as a weighted average.<br />
3. Results and discussion<br />
In a first approach, the simplified m<strong>et</strong>hod was implemented and emission factors for permanent grassland<br />
and annual crops were calculated (Table 4).<br />
Table 4. Total estimated areas of LUC from grassland to annual crops and from annual crops to grassland<br />
and CO2 emissions per year per ha of annual crop and grassland <strong>in</strong> ma<strong>in</strong>land <strong>France</strong>. Average total areas of<br />
annual crops and grassland and average CO2 emissions from LUC expressed per ha of the total area of annual<br />
crop and grassland.<br />
Land-Use Change Area (ha) Emission factor (t CO2/ha)<br />
Grassland to annual crops,<br />
2005-2009<br />
3 222 728 3.40<br />
Annual crops to grassland, 2 764 221 - 3.16<br />
2005-2009<br />
Total annual crops, 2005-2009 16 686 248 0.66<br />
Total grassland, 2005-2009 11 139 626 - 0.78<br />
This was the first step to take <strong>in</strong> consideration carbon soil dynamics <strong>in</strong> Agri-BALYSE. However, even if:<br />
i) it is <strong>in</strong> accordance with one of the aims of Agri-BALYSE, i. e. the identification of a s<strong>et</strong> of consistent and<br />
consensual m<strong>et</strong>hods for <strong>LCA</strong>s of agricultural products; ii) it is consistent with ILCD recommendations; iii)<br />
this m<strong>et</strong>hodology, based on IPCC 2003, has been used for several <strong>in</strong>ternational studies/recommendations<br />
(BSI, 2011; Gerber <strong>et</strong> al., 2010; IDF, 2010; Leip <strong>et</strong> al., 2010; Commission Européenne, 2010); this m<strong>et</strong>hod<br />
lacks sophistication, as it yields a s<strong>in</strong>gle emission factor for all annual crops. S<strong>in</strong>ce the 70’s, a strong trend of<br />
regional specialisation of agricultural production systems has been observed <strong>in</strong> <strong>France</strong> (Dussol <strong>et</strong> al., 2003).<br />
Three ma<strong>in</strong> specialised regions can be dist<strong>in</strong>guished: annual crops (Paris Bas<strong>in</strong> and North); livestock production,<br />
<strong>in</strong>volv<strong>in</strong>g grassland and annual crops (East, West, Massif Central and north of Alps); perennial crops<br />
and veg<strong>et</strong>ables (South-West and South East). The proportion of permanent grassland <strong>in</strong> the agricultural area<br />
varies greatly b<strong>et</strong>ween these regions. Therefore attribut<strong>in</strong>g the same emission factor to all annual crops is a<br />
major simplification of reality. For this reason we propose a more accurate m<strong>et</strong>hod which takes <strong>in</strong> consideration<br />
spatial distribution of grasslands and annual crops across ma<strong>in</strong>land <strong>France</strong> (Table 5). These emission<br />
factors take <strong>in</strong>to account that some annual crops, ma<strong>in</strong>ly produced <strong>in</strong> regions where permanent grassland is<br />
rare, are less <strong>in</strong>volved <strong>in</strong> LUC.<br />
271
PARALLEL SESSION 3A: LAND USE CHANGE 8 th Int. Conference on <strong>LCA</strong> <strong>in</strong> the<br />
Agri-<strong>Food</strong> Sector, 1-4 Oct <strong>2012</strong><br />
Table 5. Crop specific CO2 emissions per year per ha of annual crops <strong>in</strong> ma<strong>in</strong>land <strong>France</strong>, 2005 - 2009. Average<br />
CO2 emissions, weighted by production area <strong>in</strong> each French region, from LUC expressed per ha of the<br />
total area of annual crop.<br />
Annual crop Emission factor (t CO2/ha)<br />
Sugar be<strong>et</strong> 0.30<br />
Durum wheat 0.72<br />
Wheat 0.58<br />
Rapeseed 0.56<br />
Faba bean 0.38<br />
Silage maize 0.79<br />
Maize 0.68<br />
Barley 0.57<br />
Pea 0.50<br />
272<br />
Potato 0.36<br />
Temporary grassland<br />
0.89<br />
Sunflower 0.73<br />
Triticale 0.92<br />
In the m<strong>et</strong>hods proposed here, as soon as a variation of area for a type of land use was observed over the<br />
last 20 years, we considered that a LUC occurred, unlike for <strong>in</strong>stance Milà i Canals <strong>et</strong> al., (<strong>2012</strong>), who propose<br />
a decision tree <strong>in</strong> two steps to d<strong>et</strong>erm<strong>in</strong>e if a LUC occurred over the last 20 years. The first step d<strong>et</strong>erm<strong>in</strong>es<br />
if the area of a crop <strong>in</strong>creased <strong>in</strong> the country. If it <strong>in</strong>creased, the second step d<strong>et</strong>erm<strong>in</strong>es if the total<br />
land type area for the considered crop also <strong>in</strong>creased. If the answer to both is positive, a LUC is considered<br />
to have taken place. Furthermore, short-term fluctuations are smoothed out by the use of 5 years’ average<br />
areas. It could be <strong>in</strong>terest<strong>in</strong>g to implement this last po<strong>in</strong>t <strong>in</strong> the m<strong>et</strong>hod proposed here. Effectively, <strong>in</strong> the<br />
studied systems, temporary grasslands are frequent and can lead to mistakes <strong>in</strong> the count<strong>in</strong>g of each land type<br />
area.<br />
The m<strong>et</strong>hods proposed here aim to assess soil C dynamics associated with LUC <strong>in</strong> ma<strong>in</strong>land <strong>France</strong>.<br />
However, the goal of Agri-BALYSE is to provide a m<strong>et</strong>hodology for harmonized LCIs of agricultural products,<br />
wh<strong>et</strong>her produced <strong>in</strong> ma<strong>in</strong>land <strong>France</strong> or abroad. To achieve this goal at short term, and consider<strong>in</strong>g the<br />
current m<strong>et</strong>hodological developments, the m<strong>et</strong>hod proposed by Milà i Canals <strong>et</strong> al., (<strong>2012</strong>) seems to be the<br />
most compl<strong>et</strong>e and operational, <strong>in</strong> particular when data availability and quality are <strong>in</strong>sufficient to implement<br />
the m<strong>et</strong>hods proposed <strong>in</strong> this paper.<br />
With<strong>in</strong> the Agri-BALYSE programme a considerable amount of effort has been <strong>in</strong>vested <strong>in</strong> the development<br />
of the two m<strong>et</strong>hods described here, even though the development of m<strong>et</strong>hods is not part of the programme’s<br />
mandate. After a major <strong>in</strong>ternal debate no consensus was found for the implementation of either<br />
m<strong>et</strong>hod with<strong>in</strong> the programme, ma<strong>in</strong>ly because these m<strong>et</strong>hods have not y<strong>et</strong> been validated by publication <strong>in</strong> a<br />
peer-reviewed journal. It was decided that CO2 emissions result<strong>in</strong>g from land use change will not be considered<br />
<strong>in</strong> the Agri-BALYSE LCI database. However, a description of both m<strong>et</strong>hods proposed here and LCI<br />
results <strong>in</strong>clud<strong>in</strong>g CO2 emissions accord<strong>in</strong>g to both m<strong>et</strong>hods will be documented <strong>in</strong> the m<strong>et</strong>hodological report<br />
of the programme.<br />
5. Conclusion<br />
This work allowed a major advance <strong>in</strong> the consideration of soil carbon dynamic <strong>in</strong> <strong>LCA</strong>s of French agricultural<br />
goods. Two m<strong>et</strong>hods to estimate soil C dynamics from direct LUC for permanent grassland and annual<br />
crops <strong>in</strong> ma<strong>in</strong>land <strong>France</strong> were developed. However, there is scope for a further ref<strong>in</strong>ement of these<br />
m<strong>et</strong>hods. We identified some specific po<strong>in</strong>ts <strong>in</strong> the m<strong>et</strong>hodology which can be improved. These m<strong>et</strong>hods<br />
have not been implemented <strong>in</strong> the current version of the Agri-BALYSE database. They should be tested before<br />
implement<strong>in</strong>g them <strong>in</strong> an operational database dest<strong>in</strong>ed to support the sensitive issue of environmental<br />
labell<strong>in</strong>g.<br />
These improvements concern: i) estimation of areas that have undergone LUC and ii) calculation of cropspecific<br />
emission factors. The results presented <strong>in</strong> Table 5 are a first estimation of these crop-specific emission<br />
factors and need to be validated. Concern<strong>in</strong>g estimations of areas hav<strong>in</strong>g undergone LUC, while develop<strong>in</strong>g<br />
the two m<strong>et</strong>hods, we used data from Teruti-Lucas. These data need a treatment to be used <strong>in</strong> the calculations.<br />
This has been done by CITEPA on the one hand and by SSP on the other hand. The LUC areas ob-
PARALLEL SESSION 3A: LAND USE CHANGE 8 th Int. Conference on <strong>LCA</strong> <strong>in</strong> the<br />
Agri-<strong>Food</strong> Sector, 1-4 Oct <strong>2012</strong><br />
ta<strong>in</strong>ed by these two m<strong>et</strong>hods do not match. Work on this land-use calculation must be undertaken to obta<strong>in</strong><br />
harmonised and consensual estimation of land-use.<br />
Consideration of soil C dynamics <strong>in</strong> French <strong>LCA</strong> can also be improved by tak<strong>in</strong>g <strong>in</strong>to account the impact<br />
of modifications of management practices, for areas that have not undergone LUC. With<strong>in</strong> the Agri-<br />
BALYSE programme time was too short to collect the data required. However, these data exist, for annual<br />
crops and grasslands, and are currently be<strong>in</strong>g collected <strong>in</strong> the framework of an INRA –ADEME project and<br />
could be used to implement the IPCC 2003 m<strong>et</strong>hod for a revised version of the Agri-BALYSE database.<br />
6. References<br />
Arrouays D., Balesdent J., Germon J.C., Jay<strong>et</strong> P.A. Soussana J.F. <strong>et</strong> Stengel P., 2002 – Contribution à la lutte contre l’eff<strong>et</strong> de serre.<br />
Stocker du carbone dans les sols agricoles de <strong>France</strong> ? Expertise scientifique collective. Rapport. INRA, 332p.<br />
AGRESTE, <strong>2012</strong>. Statistiques agricoles annuelles – Occupation du territoire (1990-2010). http://agreste.agriculture.gouv.fr/page-daccueil/article/donnees-en-ligne.<br />
BSI, 2011. Guide to PAS 2050. Specification for the assessment of the life cycle greenhouse gas emissions of goods and services.<br />
British Standards Institution, London, United K<strong>in</strong>gdom.<br />
CITEPA, <strong>2012</strong>. CCNUCC – Rapport national d’<strong>in</strong>ventaire pour la <strong>France</strong> au titre de la convention cadre des Nations Unies sur les<br />
changements climatiques <strong>et</strong> du protocol de Kyoto. CITEPA, Paris, <strong>France</strong>.<br />
Commission Européenne, 2010. Décision n°2010/335/UE du 10/06/10 relative aux lignes directrices pour le calcul des stocks de<br />
carbone dans les sols aux f<strong>in</strong>s de l’annexe V de la directive 2009/28/CE.<br />
Doreau, M., Dollé, J.B., 2011. Strategies for reduc<strong>in</strong>g greenhouse gas emissions <strong>in</strong> dairy production. A european perspective. Publication<br />
scientifique du Département Techniques d’Elevage <strong>et</strong> Qualité. http://www.<strong>in</strong>st-elevage.asso.fr/IMG/pdf_CR_1133009strategies_reduc_emiss_GES.pdf.<br />
Doreau, M., van der Werf, H.M.G., Micol, D., Dubroeucq, H., Agabriel, J., Roch<strong>et</strong>te, Y., Mart<strong>in</strong>, C., 2011. Enteric m<strong>et</strong>hane production<br />
and greenhouse gases balance of di<strong>et</strong>s differ<strong>in</strong>g <strong>in</strong> concentrate <strong>in</strong> the fatten<strong>in</strong>g phase of a beef production system. Journal of<br />
animal science, 89: 2518-2528.<br />
Dussol, A.M., Hilal, M., Kroll, J.C., 2003. 30 ans de PAC: plus de grandes cultures, mo<strong>in</strong>s de fourrages, autant de disparités<br />
géographiques, <strong>in</strong> Agreste: Cahiers n°3, pp: 28-33.<br />
Gerber, P., Vell<strong>in</strong>ga, T., Opio, C., Henderson, B., Ste<strong>in</strong>feld, H., 2010. Greenhouse gas emissions from the dairy sector. A life Cycle<br />
Assessment. FAO, Rome, Italy.<br />
IDF, 2010. A common carbon footpr<strong>in</strong>t approach for dairy. The IDF guide to standard lifecycle assessment m<strong>et</strong>hodology for the<br />
dairy sector. Bull<strong>et</strong><strong>in</strong> of the International Dairy Federation 445. International Dairy Federation, Brussels, Belgium.<br />
IPCC, 2003. Good practices guidance for Land Use, Land-Use Change and Forestry, <strong>in</strong>: J., Penman, M., Gytarsky, T., Hiraishi, T.,<br />
Krug, D., Kruger, R., Pipatti, L., Buendia, K., Miwa, T., Ngara, K., Tanabe, F., Wagner (Eds), IPCC National Greenhouse Gas<br />
Inventories Programme. IGES, Kamiyamaguchi, pp 632.<br />
JRC, EIS, 2010. ILCD handbook: General guide for Life Cycle Assessment – D<strong>et</strong>ailed guidance.<br />
Leip, A., Weiss, F., Wassenaar, T., Perez, I., Fellmann, T., Loudjani, P., Tubiello, F., Grandgirard, D., Monni, S., 2010. Evaluation<br />
of the livestock sector’s contribution to the EU greenhouse gas emissions (GGELS). F<strong>in</strong>al report. European Commission, Jo<strong>in</strong>t<br />
Research Centre, Ispra, Italy.<br />
Mart<strong>in</strong>, M.P., Wattenbach M., Smith P., Meersmans J., Joliv<strong>et</strong> C., Boulonne L., <strong>et</strong> Arrouays D.. 2011. Spatial distribution of soil<br />
organic carbon stocks <strong>in</strong> <strong>France</strong>. Biogeosciences 8 (5): 1053-1065.<br />
Milà i Canals, L., Rigarlsford, G., Sim, S., <strong>2012</strong>. Land use impact assessment of margar<strong>in</strong>e. Int. J. Life Cycle Assess.<br />
Nguyen, T.T.H., van der Werf, H.M.G., Eugène, M., Veyss<strong>et</strong>, P., Devun, J., Chesneau, G., Doreau, M., <strong>2012</strong> Eff<strong>et</strong>s ot type of ration<br />
and allocation m<strong>et</strong>hods on the environmental impacts of beef-production systems. Livestock science, 145: 239-251.<br />
Schulze, E.D., Luyssaert, S., Ciais, P., Freibauer, A., Janssens, I.A., <strong>et</strong> al., 2009. Importance of m<strong>et</strong>hane and nitrous oxide for<br />
Europe’s terrestrial greenhouse-gas balance. Nature Geoscience 2: 842-850.<br />
Soussana, J.F., Tallec, T., Blanfort, V., 2009. Mitigat<strong>in</strong>g greenhouse gas balance of rum<strong>in</strong>ant production systems through carbon<br />
sequestration <strong>in</strong> grasslands. Animal, 4:3, pp 334-350.<br />
273
PARALLEL SESSION 3B: PACKAGING 8 th Int. Conference on <strong>LCA</strong> <strong>in</strong> the<br />
Parallel session 3b: Pac kag<strong>in</strong>g<br />
274<br />
Agri-<strong>Food</strong> Sector, 1-4 Oct <strong>2012</strong><br />
Us<strong>in</strong>g packag<strong>in</strong>g to reduce food environmental impacts for<br />
commercial food service: an example<br />
1 Institute for Environmental Research and Education<br />
Correspond<strong>in</strong>g author. E-mail: rita@iere.org<br />
Rita Schenck 1 , Matthew Leighton<br />
ABSTRACT<br />
The very first life cycle assessment was one compar<strong>in</strong>g packag<strong>in</strong>g options (Damar and Nuss, 1969), and studies of food packag<strong>in</strong>g<br />
cont<strong>in</strong>ue to be a common <strong>in</strong> the <strong>LCA</strong> field. Part of the reason for that is that approximately one-half of all packag<strong>in</strong>g is used for food,<br />
and used packag<strong>in</strong>g is a conspicuous fraction of the solid waste stream <strong>in</strong> developed countries (Staley and Barlaz, 2009).<br />
With few exceptions, the environmental impact of packag<strong>in</strong>g tends to be much smaller than the environmental impact of the contents<br />
of the packag<strong>in</strong>g. The primary function of packag<strong>in</strong>g is to protect and conserve the contents of the packag<strong>in</strong>g, with secondary functions<br />
to <strong>in</strong>form and to track and to mark<strong>et</strong> the product. We can then ask the question: can the packag<strong>in</strong>g, by reduc<strong>in</strong>g the losses of the<br />
contents lead to overall reduction of environmental impacts?<br />
We evaluated the opportunity for food service losses to be mitigated by packag<strong>in</strong>g, compar<strong>in</strong>g frozen food packag<strong>in</strong>g to a shelf-stable<br />
r<strong>et</strong>ort packag<strong>in</strong>g to no packag<strong>in</strong>g (made from scratch) scenarios, with and without food waste. The recipe for the contents (a beef<br />
chilli) was kept constant. In no case was the packag<strong>in</strong>g more than 15% of the life cycle environmental impact, when us<strong>in</strong>g the<br />
TRACI model. The three packag<strong>in</strong>g scenarios had essentially equivalent impacts per serv<strong>in</strong>g, with the exception that photochemical<br />
smog formation was higher <strong>in</strong> the packaged scenarios, due to transportation impacts.<br />
Primary data was obta<strong>in</strong>ed for approximately 60% of the mass of the r<strong>et</strong>ort packag<strong>in</strong>g and its contents. Secondary data was provided<br />
for the rema<strong>in</strong>der and for the other scenarios. Wherever choices were made, they were selected to provide the most conservative<br />
impact of the frozen and made from scratch scenarios (i.e., the choice caus<strong>in</strong>g the least potential environmental impact of the product<br />
system).<br />
We evaluated the scenario when 100 serv<strong>in</strong>gs were prepared, and different fractions of the serv<strong>in</strong>gs were not consumed (i.e. were<br />
wasted). We assumed that chilli that was heated to serve was discarded, the likely outcome when the menu cycle is more than approximately<br />
three days. The r<strong>et</strong>orted package can be heated and r<strong>et</strong>urned to storage on the shelf when not opened.<br />
The results showed that the r<strong>et</strong>orted pouch could potentially reduce wastes prior to food service, and this could reduce the overall<br />
environmental impact of the food service by as much as 50%. S<strong>in</strong>ce the majority of food waste <strong>in</strong> developed countries occurs <strong>in</strong> the<br />
consumer portion of the life cycle (FAO 2011), this could show substantial improvements <strong>in</strong> the environmental impact of food service,<br />
especially <strong>in</strong> the case where the number of serv<strong>in</strong>gs required is uncerta<strong>in</strong>.<br />
This study illustrates how packag<strong>in</strong>g, although caus<strong>in</strong>g a small proportion of the life cycle impacts can provide significant environmental<br />
benefits when its use leads to less food waste. It highlights the importance of food waste and the need to educate food service<br />
organisations of their choices to reduce food waste.<br />
References<br />
Darnar, A. and G. Nuss. 1969. Environmental Impacts of Coca-Cola Beverage Conta<strong>in</strong>ers.<br />
Gustavsson, J, C. Cederberg and U. Sonneson, 2001. Global <strong>Food</strong> Losses and <strong>Food</strong> Waste. Extent, Causes and Prevention. <strong>Food</strong> and<br />
Agriculture Organization, Interpack2011, Dusseldorf, Germany.http://www.fao.org/fileadm<strong>in</strong>/user_upload/ags/publications/GFL_web.pdf<br />
Staley, B. and M. Barlaz. 2009. Composition of Municipal Solid Waste <strong>in</strong> the United States and Implications for Carbon Sequestration<br />
and M<strong>et</strong>hane Yield. J. Env. Engr. October 2009: 901.
PARALLEL SESSION 3B: PACKAGING 8 th Int. Conference on <strong>LCA</strong> <strong>in</strong> the<br />
Agri-<strong>Food</strong> Sector, 1-4 Oct <strong>2012</strong><br />
Recycl<strong>in</strong>g of aseptic milk packag<strong>in</strong>g and reverse logistic cha<strong>in</strong><br />
account<strong>in</strong>g<br />
Anna Lúcia Mourad 1,* , Fernando von Zuben 2 , Eloísa E. Correia Garcia 1<br />
1 CETEA – Packag<strong>in</strong>g Technology Center / ITAL – Institute of <strong>Food</strong> Technology, Brazil<br />
2 T<strong>et</strong>ra Pak, Brazil<br />
Correspond<strong>in</strong>g author. E-mail: anna@ital.sp.gov.br<br />
ABSTRACT<br />
The production of the liquid packag<strong>in</strong>g board used for manufacture of aseptic milk packag<strong>in</strong>g has been recently modernised. So, one<br />
of the objectives of the present work is to <strong>in</strong>corporate this data <strong>in</strong> a previous study consider<strong>in</strong>g also its reverse logistic cha<strong>in</strong>. Although<br />
post-consumer packag<strong>in</strong>g recycl<strong>in</strong>g is a goal pursued around the world, the m<strong>et</strong>hodological approach to calculate the environmental<br />
changes based on an <strong>LCA</strong> are not always clearly expla<strong>in</strong>ed. In this project it was used an open-loop with closed-loop<br />
recycl<strong>in</strong>g procedure with expanded system boundaries to model the system. The follow<strong>in</strong>g reductions were obta<strong>in</strong>ed for a 27% current<br />
recycl<strong>in</strong>g rate compared to no recycl<strong>in</strong>g: 23% <strong>in</strong> global warm<strong>in</strong>g, 8% <strong>in</strong> abiotic depl<strong>et</strong>ion, 13% <strong>in</strong> acidification, 15% <strong>in</strong> photochemical<br />
ozone creation, 11% <strong>in</strong> human toxicity and 8% <strong>in</strong> eutrophication measured by the functional unit of 1,000 litres of milk<br />
packag<strong>in</strong>g. It can be concluded from this project that recycl<strong>in</strong>g can still br<strong>in</strong>g about environmental advantages.<br />
Keywords: recycl<strong>in</strong>g model, post-consumer packag<strong>in</strong>g, open-loop recycl<strong>in</strong>g, system expansion<br />
1. Introduction<br />
Recycl<strong>in</strong>g is one of the best options to reduce the environmental impact of products and this objective has<br />
been pursued by T<strong>et</strong>ra Pak for the last two decades (Mourad <strong>et</strong> al., 2008a). As the production of the liquid<br />
packag<strong>in</strong>g board (LPB) used for manufacture of aseptic structure for milk packag<strong>in</strong>g has been recently<br />
modernised, one of the objectives of the present work is to measure the environmental benefits due to this<br />
significant component. Actually, the reverse cha<strong>in</strong> of milk aseptic packag<strong>in</strong>g is well established and the<br />
composite material is almost totally recovered. Cellulose fibre content is recovered by efficient modern<br />
hydropulpers which are able to separate wood fibre from the residue of poly<strong>et</strong>hylene / alum<strong>in</strong>ium. The high<br />
quality fibre is used to produce new paper products. The residue of PE/Al is partially converted <strong>in</strong>to roof tiles<br />
and she<strong>et</strong>s and partially processed by a plasma technology which breaks down the long polymer structure <strong>in</strong><br />
the short cha<strong>in</strong> of hydrocarbons obta<strong>in</strong><strong>in</strong>g paraff<strong>in</strong> and also recovers the m<strong>et</strong>al content <strong>in</strong> high purity<br />
alum<strong>in</strong>ium <strong>in</strong>gots. Although the agricultural phase is usually responsible by most of the environmental<br />
impacts of the whole milk cha<strong>in</strong> (Hospido <strong>et</strong> al., 2003, Berl<strong>in</strong>, 2002), beverage cartons has a significant<br />
environmental impacts such as land use, summer smog and terrestrial eutrophication (Falkenste<strong>in</strong> <strong>et</strong> al.,<br />
2010).<br />
2. M<strong>et</strong>hods<br />
This study has been conducted <strong>in</strong> accordance with the recommendations and requirements for conduct<strong>in</strong>g life<br />
cycle assessment studies s<strong>et</strong> forth <strong>in</strong> ISO Standards 14040 (ISO 2006) and 14049 (ISO 2000).<br />
2.1 Functional unit<br />
The packag<strong>in</strong>g material system studied was assessed by us<strong>in</strong>g a functional unit of 1,000 litres of milk packag<strong>in</strong>g<br />
consist<strong>in</strong>g of T<strong>et</strong>ra Brik Aseptic (TBA) packages with a hold<strong>in</strong>g capacity of 1 litre each. The aseptic<br />
package is a composite structure of liquid packag<strong>in</strong>g board (LPB), poly<strong>et</strong>hylene and alum<strong>in</strong>ium.<br />
2.2 Energy and virg<strong>in</strong> packag<strong>in</strong>g materials data<br />
In Brazil, electric energy for public utility services is produced by an <strong>in</strong>terconnected system of electric<br />
plants, mostly hydroelectric. Most of the energy used <strong>in</strong> oil ref<strong>in</strong>eries is generated from their own subproducts,<br />
i.e. from fossil fuels. The ma<strong>in</strong> aspects (consumption and emission) related to the extraction and<br />
production of fossil fuels (pre-combustion) such as diesel oil, fuel oil, coal, natural gas and liquefied p<strong>et</strong>roleum<br />
gas, have been <strong>in</strong>cluded with<strong>in</strong> the boundaries of the study. The data concern<strong>in</strong>g the generation and<br />
distribution of Brazilian electric energy were collected b<strong>et</strong>ween 1997 and 1998 and updated <strong>in</strong> 2000. Sitespecific<br />
data from 15 companies along with sector energy production data have been comb<strong>in</strong>ed to build an<br />
energy production model (Coltro <strong>et</strong> al., 2003).<br />
275
PARALLEL SESSION 3B: PACKAGING 8 th Int. Conference on <strong>LCA</strong> <strong>in</strong> the<br />
Agri-<strong>Food</strong> Sector, 1-4 Oct <strong>2012</strong><br />
The emissions stemm<strong>in</strong>g from truck transportation due to the burn<strong>in</strong>g ma<strong>in</strong>ly of diesel fuel have been considered<br />
for the transport of all the ma<strong>in</strong> <strong>in</strong>puts for the manufactur<strong>in</strong>g of packag<strong>in</strong>g materials, from their extraction,<br />
manufactur<strong>in</strong>g of <strong>in</strong>termediary products up to the obta<strong>in</strong>ment of the f<strong>in</strong>al packag<strong>in</strong>g material.<br />
The data relative to the production of LPB were provided by Klab<strong>in</strong>, the ma<strong>in</strong> supplier of the paperboard<br />
used to manufacture the TBA packages. The material is produced from p<strong>in</strong>us and eucalypyus fibres through<br />
the kraft process at the Telêmaco Borba plant <strong>in</strong> the South of the country and its <strong>in</strong>ventory collected for 2008<br />
was employed <strong>in</strong> this study (Mourad <strong>et</strong>. al, <strong>2012</strong>).<br />
The data concern<strong>in</strong>g the production of <strong>et</strong>hylene (catalytic crack<strong>in</strong>g of naphtha) from crude oil ref<strong>in</strong><strong>in</strong>g were<br />
estimated based on public Brazilian sector data and the study published by Bousted (1992). The manufactur<strong>in</strong>g<br />
of low density poly<strong>et</strong>hylene (polymerisation) from <strong>et</strong>hylene was quantified from the data obta<strong>in</strong>ed from<br />
the two res<strong>in</strong> suppliers of T<strong>et</strong>ra Pak and weighted by the rate of supply <strong>in</strong> 2003.<br />
The data concern<strong>in</strong>g the manufactur<strong>in</strong>g of alum<strong>in</strong>um foil refer to data collected b<strong>et</strong>ween 1998 and 2000 and<br />
were provided by all three Brazilian manufacturers of this m<strong>et</strong>al. These data are relative to average alum<strong>in</strong>ium<br />
foil life cycle <strong>in</strong>ventory <strong>in</strong>formation surveyed by the Project “Life Cycle Assessment of Alum<strong>in</strong>ium<br />
Products” (Gatti <strong>et</strong> al., 2000). The energy required for the production of alum<strong>in</strong>ium is almost entirely produced<br />
by hydroelectric plants owned by the alum<strong>in</strong>ium manufacturers.<br />
2.2 Aseptic lam<strong>in</strong>at<strong>in</strong>g, fill<strong>in</strong>g stages and f<strong>in</strong>al disposal<br />
The manufacture of the multilayer lam<strong>in</strong>ated plastic and alum<strong>in</strong>ium coated paperboard consists of the pr<strong>in</strong>t<strong>in</strong>g<br />
of the paperboard, followed by its lam<strong>in</strong>at<strong>in</strong>g with alum<strong>in</strong>ium foil with extrusion of low density poly<strong>et</strong>hylene<br />
(LDPE) and the application of <strong>in</strong>ternal LDPE layers, also by extrusion. The transportation steps considered<br />
for the manufactur<strong>in</strong>g of the paperboard take <strong>in</strong>to account the distance b<strong>et</strong>ween the production sites<br />
of raw material suppliers (paperboard, poly<strong>et</strong>hylene, alum<strong>in</strong>ium and <strong>in</strong>k) and the T<strong>et</strong>ra Pak manufactur<strong>in</strong>g<br />
plant located <strong>in</strong> the town of Monte Mor, SP. The consumption of electric power, vapour and water were<br />
based on the characteristics of the T<strong>et</strong>ra Brik Aseptic – TBA fill<strong>in</strong>g mach<strong>in</strong>es available on the Brazilian <strong>in</strong>dustrial<br />
equipment mark<strong>et</strong>. The average distribution radius for packaged milk was estimated at 200km, s<strong>in</strong>ce<br />
there are long life milk producers <strong>in</strong> practically all regions of the country. The f<strong>in</strong>al disposal considers that<br />
post-consumer packages are recycled or landfilled. The modell<strong>in</strong>g of the f<strong>in</strong>al degradation processes of the<br />
packages <strong>in</strong> landfills is the same as that described previously (Mourad <strong>et</strong> al., 2008b).<br />
2.3 Reverse logistic cha<strong>in</strong> and recycl<strong>in</strong>g modell<strong>in</strong>g<br />
The high quality of the fibres conta<strong>in</strong>ed <strong>in</strong> the post-consumer packages turns this waste material <strong>in</strong>to excellent<br />
raw material for the corrugated paperboard sector. The recycl<strong>in</strong>g of these requires hydropulpers specifically<br />
designed for this particular purpose. The mach<strong>in</strong>e separates cellulose fibres from a mixed material<br />
made up of alum<strong>in</strong>ium and poly<strong>et</strong>hylene and recovers around 90% of the total fibre content. The mixed material<br />
is partially used to manufacture plates and tiles after previous mill<strong>in</strong>g and subsequent hot-press<strong>in</strong>g<br />
(Zuben, 2006) and partially used to recover alum<strong>in</strong>ium and produces paraff<strong>in</strong> us<strong>in</strong>g a plasma process<br />
(Szente, 1997).<br />
Us<strong>in</strong>g the pr<strong>in</strong>ciples of ISO 14041 and ISO/TR 14049, data from the reverse logistic cha<strong>in</strong> <strong>in</strong>clud<strong>in</strong>g the<br />
recycl<strong>in</strong>g processes were collected and an open-loop with closed-loop recycl<strong>in</strong>g procedure with expanded<br />
system boundaries was used to model the system.<br />
Aseptic packages are collected post-consumption and undergo the first process of recovery of cellulose fibers<br />
made by Klab<strong>in</strong> Company <strong>in</strong> Piracicaba. This generates poly<strong>et</strong>hylene and alum<strong>in</strong>um residue (PE/Al).<br />
To model this stage, a hybrid <strong>in</strong>ventory on fiber recovery was built from the data of power consumption provided<br />
by Klab<strong>in</strong>, from data on process yield provided by T<strong>et</strong>ra Pak relat<strong>in</strong>g to the production process of Mercoplas<br />
Company <strong>in</strong> Val<strong>in</strong>hos <strong>in</strong> 2011, and data on emissions published <strong>in</strong> the 2010 corporate susta<strong>in</strong>ability<br />
report of Klab<strong>in</strong> (Klab<strong>in</strong>, 2011).<br />
S<strong>in</strong>ce one of the purposes of the study was to predict the ma<strong>in</strong> environmental and benefits accru<strong>in</strong>g from<br />
recycl<strong>in</strong>g post-consumer packages, the follow<strong>in</strong>g considerations are deemed important: a) the recycled cellulose<br />
fibres from post-consumer milk cartons were reused <strong>in</strong> the manufacture of new sleeves; b) the alum<strong>in</strong>ium<br />
obta<strong>in</strong>ed by the plasma process replaces primary alum<strong>in</strong>ium from bauxite <strong>in</strong> the manufactur<strong>in</strong>g process<br />
of alum<strong>in</strong>ium foil and c) the environmental burdens of crack<strong>in</strong>g naphtha used to manufacture <strong>et</strong>hylene, later<br />
on converted <strong>in</strong>to poly<strong>et</strong>hylene, were subtracted by than the paraff<strong>in</strong> obta<strong>in</strong>ed by the plasma process.<br />
The credits of roof tiles co-production was done by the subtraction of the <strong>in</strong>ventory of an equivalent mass of<br />
virg<strong>in</strong> alum<strong>in</strong>ium roof tiles which are replaced by the recycled one. Alum<strong>in</strong>ium recovery by plasma is con-<br />
276
PARALLEL SESSION 3B: PACKAGING 8 th Int. Conference on <strong>LCA</strong> <strong>in</strong> the<br />
Agri-<strong>Food</strong> Sector, 1-4 Oct <strong>2012</strong><br />
sidered as be<strong>in</strong>g at the boundary of this system as the recovered material has no changes <strong>in</strong> its <strong>in</strong>herent properties.<br />
The paraff<strong>in</strong> obta<strong>in</strong>ed is used to replace the p<strong>et</strong>rochemical naphtha that is a precursor of poly<strong>et</strong>hylene<br />
production. This reverse flow was called “recycled poly<strong>et</strong>hylene” and was applied to discount the use of<br />
virg<strong>in</strong> poly<strong>et</strong>hylene. Fig. 1 shows the boundaries of the system evaluated, along with the recycl<strong>in</strong>g model<br />
used. This m<strong>et</strong>hod was used for modell<strong>in</strong>g the system <strong>in</strong> 2000 with no recycl<strong>in</strong>g and the system <strong>in</strong> 2011 for<br />
recycl<strong>in</strong>g rates of 0%, 27%, 35%, 50% and 70%.<br />
T<br />
Forestry (wood<br />
production)<br />
Cellulose<br />
production<br />
Cardboard<br />
manufactur<strong>in</strong>g<br />
Cellulose virg<strong>in</strong> kg<br />
T<br />
Cardboard<br />
Aseptic lam<strong>in</strong>ate production with x % recycl<strong>in</strong>g<br />
Milk consumption<br />
Post-consumer packag<strong>in</strong>g recycl<strong>in</strong>g:<br />
cellulose fibers (Rc kg)<br />
PE/Al residue (PEAl kg)<br />
Paraff<strong>in</strong> (P kg) and alum<strong>in</strong>um (Al<br />
plasma kg) recovered by plasma<br />
Oil extraction<br />
P<strong>et</strong>rochemical<br />
naphtha<br />
(N- P) kg<br />
Ethylene<br />
production<br />
Poly<strong>et</strong>hylene<br />
Milk fill<strong>in</strong>g (1,000 litres)<br />
Figure 1. Model used to account the production and recover<strong>in</strong>g of the aseptic milk packag<strong>in</strong>g (open-loop<br />
with closed-loop recycl<strong>in</strong>g procedure and expanded system boundaries).<br />
2.4 Environmental impact categories evaluated<br />
T<br />
Recovered<br />
cellulose fibres<br />
(Rc kg)<br />
PEAl for plasma<br />
kg<br />
T<br />
T<br />
Paraff<strong>in</strong> (P kg)<br />
Recycled<br />
<strong>et</strong>hylene<br />
production<br />
Recycled<br />
poly<strong>et</strong>hylene<br />
T T T<br />
R% – recycl<strong>in</strong>g rate<br />
PE/Al roof tiles<br />
production (Rt kg)<br />
Bauxite m<strong>in</strong><strong>in</strong>g<br />
Alum<strong>in</strong>a<br />
production<br />
Primary<br />
alum<strong>in</strong>um<br />
production<br />
Alum<strong>in</strong>um foil<br />
F<strong>in</strong>al disposal<br />
<strong>in</strong> landfills<br />
The <strong>in</strong>ventories obta<strong>in</strong>ed were evaluated accord<strong>in</strong>g to the CML 2001 m<strong>et</strong>hodology developed by the Center<br />
of Environmental Science at Leiden University (Gu<strong>in</strong>née <strong>et</strong> al., 2001) and updated <strong>in</strong> December, 2007 for the<br />
follow<strong>in</strong>g environmental impact categories and <strong>in</strong> accordance with the pr<strong>in</strong>ciples of ISO Standard 14044:<br />
abiotic depl<strong>et</strong>ion potential – ADP (kg Sb equiv), global warm<strong>in</strong>g potential – GWP (kg CO2 equiv.), acidifica-<br />
T<br />
PEAl kg – PEAl for plasma<br />
kg<br />
T<br />
Emissions<br />
Inverse process of virg<strong>in</strong> alum<strong>in</strong>um<br />
production:<br />
(Al tile equivalent to Rt kg)<br />
Resources<br />
T<br />
Al virg<strong>in</strong> kg<br />
Al plasma kg<br />
T<br />
Milk production<br />
and sterilization<br />
Emissions<br />
from milk<br />
consumption<br />
Milk<br />
277
PARALLEL SESSION 3B: PACKAGING 8 th Int. Conference on <strong>LCA</strong> <strong>in</strong> the<br />
Agri-<strong>Food</strong> Sector, 1-4 Oct <strong>2012</strong><br />
tion potential - AP (kg SO2 equiv.), euthrophication potential – EP (kg PO3 4- equiv.), human toxicity potential<br />
- HTP(kg DCB equiv.) and photochemical ozone creation potential - POCP(kg <strong>et</strong>hylene equiv.).<br />
A sensitivity analysis was undertaken for the current recycl<strong>in</strong>g rate of 27% <strong>in</strong> order to measure the <strong>in</strong>fluence<br />
of the roof tile and paraff<strong>in</strong> co-production credits.<br />
3. Results<br />
3.1 Energy consumption<br />
The analysis of Table 1 shows that the total energy for the system was reduced by 20% b<strong>et</strong>ween 2000 and<br />
2011 and that the reduction is ma<strong>in</strong>ly due to lower consumption of renewable energy. The present recycl<strong>in</strong>g<br />
rate of 27% saves 15% of energy compared to no recycl<strong>in</strong>g. If the recycl<strong>in</strong>g rate <strong>in</strong>creases to a maximum<br />
estimate of 70%, the sav<strong>in</strong>g of energy can be raised up to 39%.<br />
Table 1. Energy consumption profile of evaluated systems. Functional unit: 1,000 litres of milk packag<strong>in</strong>g.<br />
Year/Recycl<strong>in</strong>g Energy (MJ/1,000 litres of packag<strong>in</strong>g milk) % Non Renewable Reduçtion (%) relative to:<br />
rate<br />
Renewable Non Renewable Total energy<br />
2000 2011<br />
0% recycl<strong>in</strong>g 0% recycl<strong>in</strong>g<br />
2000 0% 1444 728 2172 33.5 - -<br />
2011 0% 960 783 1743 44.9 20 -<br />
2011 27% 755 728 1483 49.1 - 15<br />
2011 35% 694 712 1406 50.6 - 19<br />
2011 50% 581 681 1262 54.0 - 28<br />
2011 70% 429 640 1069 59.9 - 39<br />
3.2 Environmental impacts<br />
The analysis of Table 2 shows that the system <strong>in</strong> 2011 had benefits for all the environmental impact categories<br />
analysed compared with the same production <strong>in</strong> 2000. Despite the fact that most transport distances <strong>in</strong><br />
the country are long and there is a consumption of natural resources as well as air/water emissions <strong>in</strong> the<br />
reverse logistic cha<strong>in</strong>, the <strong>in</strong>crease of recycl<strong>in</strong>g br<strong>in</strong>gs environmental advantages.<br />
Table 2. Ma<strong>in</strong> environmental impact <strong>in</strong>dicators for aseptic packag<strong>in</strong>g systems and different recycl<strong>in</strong>g rates.<br />
Functional unit: 1,000 litres of milk packag<strong>in</strong>g.<br />
Reference year / recycl<strong>in</strong>g rate<br />
Environmental impact <strong>in</strong>dicator (*)<br />
2000<br />
2011<br />
0% 0% 27% 35% 50% 70%<br />
Abiotic resource depl<strong>et</strong>ion – ADP (kg Sb equiv.) 0.45 0.38 0.35 0.34 0.32 0.30<br />
Global warm<strong>in</strong>g potential – GWP (kg CO2 equiv.) 189 178 138 125 103 72<br />
Acidification potential – AP (kg SO2 equiv.) 1.98 0.46 0.40 0.38 0.34 0.30<br />
Euthrophication potential – EP (kg phosphate equiv.) 0.17 0.05 0.05 0.05 0.05 0.04<br />
Human toxicity – HTP (kg de DCB equiv.)<br />
Photochemical ozone creation potential – POCP (kg <strong>et</strong>hylene<br />
1.56 0.55 0.49 0.47 0.44 0.39<br />
equiv.)<br />
*=accord<strong>in</strong>g to CML 2001 (updated <strong>in</strong> Dec. 2007)<br />
0.25 0.09 0.08 0.08 0.07 0.06<br />
The results of the sensitivity analysis undertaken for the current recycl<strong>in</strong>g rate of 27% are shown <strong>in</strong> Table 3.<br />
Table 3. Sensitivity analysis related to the roof-tile and paraff<strong>in</strong> co-production credits <strong>in</strong> an aseptic packag<strong>in</strong>g<br />
system evaluated <strong>in</strong> 2011. Functional unit: 1,000 litres of milk packag<strong>in</strong>g.<br />
System evaluated<br />
ADP<br />
Environmental impact <strong>in</strong>dicators (*)<br />
GWP AP EP HTP POCP<br />
System with no recycl<strong>in</strong>g 0.45 189 1.98 0.17 1.56 0.25<br />
Current approach with 27% of recycl<strong>in</strong>g rate 0.35 138 0.40 0.05 0.49 0.08<br />
Without roof-tile co-production credits (27% RR) 0.36 141 0.42 0.05 0.51 0.08<br />
Without paraff<strong>in</strong> co-production credits (27% RR) 0.35 138 0.40 0.05 0.49 0.08<br />
Without roof-tile and paraff<strong>in</strong> co-production credits (27%<br />
0.36 (3%)<br />
RR)<br />
141(2%) 0.42 (5%) 0.05 0.51(4%) 0.08<br />
RR=recycl<strong>in</strong>g rate *= accord<strong>in</strong>g to CML 2001 (updated <strong>in</strong> Dec. 2007)<br />
278
PARALLEL SESSION 3B: PACKAGING 8 th Int. Conference on <strong>LCA</strong> <strong>in</strong> the<br />
Agri-<strong>Food</strong> Sector, 1-4 Oct <strong>2012</strong><br />
The sensitivity analysis showed that the environmental impacts could <strong>in</strong>crease from 2% (GWP) up to 5%<br />
(AP) if the credits were disregarded.<br />
4. Discussion<br />
The closed-loop recycl<strong>in</strong>g procedure tog<strong>et</strong>her with the expansion of system boundaries were used <strong>in</strong> order to<br />
account for all the valuable products from this cha<strong>in</strong>. The model used represents the real situation concern<strong>in</strong>g<br />
the production of roof tiles, recovered cellulose fibres, and also alum<strong>in</strong>ium and paraff<strong>in</strong> recovered by plasma<br />
technology. There are some uncerta<strong>in</strong>ties related to the credit of alum<strong>in</strong>ium due to the production of roof<br />
tiles and the paraff<strong>in</strong> substitution of the p<strong>et</strong>rochemical naphtha.<br />
The alum<strong>in</strong>ium credit is not totally correct because the ma<strong>in</strong> comp<strong>et</strong>itor of post-consumer roof tile is cement<br />
tile and not alum<strong>in</strong>ium tile (the only <strong>in</strong>ventory available). Paraff<strong>in</strong> is not a p<strong>et</strong>rochemical naphta, but this<br />
approach is a way to account for the reduction <strong>in</strong> the oil required for <strong>et</strong>hylene production.<br />
The sensitivity analysis showed that recycl<strong>in</strong>g has a favorable environmental profile even without consider<strong>in</strong>g the<br />
credit for co-products for a 27% recycl<strong>in</strong>g rate. In this recycl<strong>in</strong>g rate, the maximum <strong>in</strong>crease <strong>in</strong> environmental impacts<br />
analysed was 5%.<br />
However, while the approach used does not represent the real situation and presents m<strong>in</strong>or scientific uncerta<strong>in</strong>ties,<br />
it is extremely important to f<strong>in</strong>d solutions for modell<strong>in</strong>g recycl<strong>in</strong>g processes <strong>in</strong> order to account for<br />
all the co-products from the cha<strong>in</strong>. The existence of these co-products makes this reverse logistic cha<strong>in</strong> economically<br />
viable.<br />
5. Conclusion<br />
Based on the results of this study, it is possible to state: The <strong>in</strong>crease <strong>in</strong> the process efficiency ma<strong>in</strong>ly due to<br />
the modernisation of liquid packag<strong>in</strong>g board manufactur<strong>in</strong>g brought a reduction of 20% of total energy consumption<br />
compared with the same functional units <strong>in</strong> 2000.<br />
The <strong>in</strong>crease <strong>in</strong> the recycl<strong>in</strong>g rate up to 70% could still br<strong>in</strong>g about energy benefits even consider<strong>in</strong>g the consumption<br />
of new natural resources and air/water emissions related to the logistic reverse cha<strong>in</strong>.<br />
A comparison of the years 2000 and 2011 shows that for the current recycl<strong>in</strong>g rate of 27% compared with no<br />
recycl<strong>in</strong>g the follow<strong>in</strong>g reductions could be observed: 23% <strong>in</strong> global warm<strong>in</strong>g, 8% <strong>in</strong> abiotic depl<strong>et</strong>ion, 13%<br />
<strong>in</strong> acidification, 15% <strong>in</strong> photochemical ozone creation, 11% <strong>in</strong> human toxicity and 8% <strong>in</strong> eutrophication<br />
measured by the functional unit of 1,000 litres of milk packag<strong>in</strong>g.<br />
The cha<strong>in</strong> analysed <strong>in</strong> this study is not only a hypoth<strong>et</strong>ical model but also represents almost all the <strong>in</strong>dustrial<br />
plants <strong>in</strong>volved <strong>in</strong> this cha<strong>in</strong>. This is the result of T<strong>et</strong>ra Pak efforts dur<strong>in</strong>g the last two decades f<strong>in</strong>d<strong>in</strong>g partners<br />
who could implement these processes and to make the recovery of their post consumer packages an<br />
economic, environmental and socially viable solution.<br />
6. Acknowledgments<br />
The authors are grateful to T<strong>et</strong>ra Pak by provid<strong>in</strong>g data and valuable discussions for this work. Authors are<br />
also grateful for f<strong>in</strong>ancial support of this company, to Fapesp who f<strong>in</strong>anced the first <strong>LCA</strong> study for CETEA<br />
<strong>in</strong> 1998 and for the f<strong>in</strong>ancial support of travell<strong>in</strong>g expenses.<br />
7. References<br />
Berl<strong>in</strong>, J., 2002. Environmental life cycle asseessmentg (<strong>LCA</strong>) of Swedish semi-hard cheese. International Dairy journal 12, 939-953.<br />
Coltro, L., Castilho, G., Garcia, E.E.C., 2003. Life Cycle Inventory for Electric Energy System <strong>in</strong> Brazil. Int. J. <strong>LCA</strong>, 8(5), 290-296.<br />
Falkenste<strong>in</strong> E.V., Wellenreuther F., D<strong>et</strong>zel, A.(2010) <strong>LCA</strong> studies compar<strong>in</strong>g beverage cartons and alternative packag<strong>in</strong>g: can overall<br />
conclusions be drawn? Int. J. <strong>LCA</strong>, 15, 938–945.<br />
Gatti, J.B., Castilho, G., Garcia, E.E., 2000. Análise de Ciclo de Vida de produtos de alumínio (Available <strong>in</strong> Portuguese language,<br />
confidential document for <strong>in</strong>ternal use), CETEA/ITAL, Camp<strong>in</strong>as. Relatório CETEA P004/00, 88p.<br />
Gu<strong>in</strong>ée, J. B. <strong>et</strong> al., 2001. Life Cycle Assessment – An operational Guide to the ISO Standards. Leiden.<br />
Hospido, A., Moreira, M.T., Feijoo, G., 2003. Simplified life cycle assessment of Galician milk production. International Dairy<br />
Journal 13, 783e796.<br />
International Organization for Standardization – ISO, 2006. Environmental management – Life cycle assessment – Pr<strong>in</strong>ciples and<br />
framework – ISO 14040. Genève/Switzerland: ISO, 44p.<br />
International Organization for Standardization - ISO 14049, 2000. Environmental management – Life cycle assessment – Examples<br />
of ISO 14041 to goal and scope def<strong>in</strong>ition and <strong>in</strong>ventory analysis, Genève/Switzerland, 44p<br />
Mourad A.L. <strong>et</strong> al., 2000. Análise de Ciclo de Vida de Embalagens para o Mercado Brasileiro, Relatório S<strong>et</strong>orial ABPO – Associação<br />
Brasileira de Papelão Ondulado (Available <strong>in</strong> Portuguese language, confidential document for <strong>in</strong>ternal use), CETEA/ITAL;<br />
Camp<strong>in</strong>as, 1-120.<br />
Mourad, A.L., Garcia, E.E.C., Vilela, G.B., Zuben, F., 2008a. Environmental effects from a recycl<strong>in</strong>g rate <strong>in</strong>crease of cardboard of<br />
aseptic packag<strong>in</strong>g system for milk us<strong>in</strong>g life cycle approach. Int. J. <strong>LCA</strong> 13, 140-146.<br />
279
PARALLEL SESSION 3B: PACKAGING 8 th Int. Conference on <strong>LCA</strong> <strong>in</strong> the<br />
Agri-<strong>Food</strong> Sector, 1-4 Oct <strong>2012</strong><br />
Mourad, A. L., Garcia, E.E.C., Vilela, G.B., Von Zuben, F., 2008b Influence of recycl<strong>in</strong>g rate <strong>in</strong>crease of aseptic carton for long-life<br />
milk on GWP reduction. Resource, Conservation and Recycl<strong>in</strong>g, 52(4), 678-689.<br />
Mourad, A.L., Silva, H.L.G., Nogueira, J.C.B., <strong>2012</strong>. Carton for beverage: A decade of process efficiency improvements enhanc<strong>in</strong>g<br />
its environmental profile. Int. J. <strong>LCA</strong>, 17, 176-183.<br />
Szente, R.N.; Schro<strong>et</strong>er, M.G.; Garcia, M.G.; Bender, O.W. 1997. Recover<strong>in</strong>g alum<strong>in</strong>ium via plasma process<strong>in</strong>g, Journal of M<strong>et</strong>allurgy,<br />
49/11:52-55.<br />
Zuben, F.V., 2006. Recycl<strong>in</strong>g Poly<strong>et</strong>hylene and Alum<strong>in</strong>ium from Aseptic Packag<strong>in</strong>g via Plasma Process. In: Annals of IV Global<br />
Conference on Susta<strong>in</strong>able Product Development and Life Cycle Eng<strong>in</strong>eer<strong>in</strong>g - Susta<strong>in</strong>able Manufactur<strong>in</strong>g, 3-6 October 2006,<br />
São Carlos, São Paulo, Brazil, CD Rom, 5p (RR14).<br />
280
PARALLEL SESSION 3B: PACKAGING 8 th Int. Conference on <strong>LCA</strong> <strong>in</strong> the<br />
Agri-<strong>Food</strong> Sector, 1-4 Oct <strong>2012</strong><br />
A multicriteria analysis for food packag<strong>in</strong>g end-of-life optimisation<br />
based on a configurable life cycle assessment approach<br />
Claude Emma Komly 1 , Cather<strong>in</strong>e Azzaro-Pantel 2 , Anto<strong>in</strong>e Hubert 1 , Alan Jean-Marie 1 , Valérie Archambault 1<br />
1<br />
Altran Research, 2 rue Paul Vaillant Couturier, 92300 Levallois-Perr<strong>et</strong>, <strong>France</strong><br />
2<br />
Université de Toulouse, Laboratoire de Génie Chimique, UMR 5503 CNRS/INPT/UPS, 4 all. E. Monso, 31432 Toulouse Cedex 4,<br />
<strong>France</strong><br />
<br />
Correspond<strong>in</strong>g author. E-mail: Cather<strong>in</strong>e.AzzaroPantel@ensiac<strong>et</strong>.fr<br />
ABSTRACT<br />
A model based on life-cycle assessment results is developed to assess the environmental efficiency of the end-of-life management of<br />
a food packag<strong>in</strong>g: poly<strong>et</strong>hylene terephtalate (PET) bottles. The global environmental impacts associated with the treatment of PET<br />
bottles from their cradle to ultimate graves (<strong>in</strong>c<strong>in</strong>eration, landfilled, recycl<strong>in</strong>g by mechanical, chemical or thermal processes) are<br />
computed <strong>in</strong> function of the flow of bottles <strong>in</strong> the different valorisation paths. Gen<strong>et</strong>ic algorithms are used to solve the result<strong>in</strong>g<br />
multi-objectives. A decision support tool then d<strong>et</strong>erm<strong>in</strong>es the best compromise among the s<strong>et</strong> of solutions. The model is applied to<br />
the case of <strong>France</strong> <strong>in</strong> 2010. The variables that m<strong>in</strong>imize simultaneously abiotic depl<strong>et</strong>ion, acidification and global warm<strong>in</strong>g potential<br />
are d<strong>et</strong>erm<strong>in</strong>ed, <strong>in</strong> particular the number of recycl<strong>in</strong>g loops. The approach can be easily adapted to any specific product like biobased<br />
food packag<strong>in</strong>g or organic wastes to f<strong>in</strong>d the optimal allocation b<strong>et</strong>ween valorisation paths.<br />
Keywords: life cycle assessment, food packag<strong>in</strong>g, recycl<strong>in</strong>g, multi-criteria analysis, gen<strong>et</strong>ic algorithm<br />
1. Introduction<br />
This study proposes the development of a mathematical model based on <strong>LCA</strong> results to assess the environmental<br />
efficiency of the end-of-life management of a common food packag<strong>in</strong>g, i.e. Poly<strong>et</strong>hylene terephalate<br />
(PET) bottles. For this purpose, multi-objective optimisation <strong>in</strong>volv<strong>in</strong>g Gen<strong>et</strong>ic Algorithms and decision<br />
support tools were used to def<strong>in</strong>e optimal targ<strong>et</strong>s for efficient waste management.<br />
This issue is of first importance for food packag<strong>in</strong>g companies which have to deal with their products susta<strong>in</strong>ability<br />
all along their life cycle; their products be<strong>in</strong>g <strong>in</strong> comp<strong>et</strong>ition more and more with tap water.<br />
This model can be easily adapted to any other food packag<strong>in</strong>g, or any specific product like bio-based<br />
plastics or organic wastes to f<strong>in</strong>d the optimal allocation b<strong>et</strong>ween valorisation paths, or b<strong>et</strong>ween supply paths<br />
(for <strong>in</strong>stance supply of a bio-ref<strong>in</strong>ery), <strong>in</strong> order to m<strong>in</strong>imize the associated environmental impacts.<br />
2. M<strong>et</strong>hods<br />
The model developed <strong>in</strong> this work computes the global environmental impacts associated with the treatment<br />
of PET bottles (expressed <strong>in</strong> kg) from cradle to ultimate graves, i.e. either <strong>in</strong>c<strong>in</strong>eration or landfill, <strong>in</strong><br />
function of the flow of bottles <strong>in</strong> the different valorisation paths.<br />
After each use, PET bottles can be landfilled, <strong>in</strong>c<strong>in</strong>erated, or recycled by mechanical, chemical or thermal<br />
processes. Each recycl<strong>in</strong>g process leads to a different product e.g. fibres, films, bottles, chemicals, fuels (Al-<br />
Salem <strong>et</strong> al., 2009)<br />
Fig. 1 shows these different paths, di be<strong>in</strong>g the decision variables deal<strong>in</strong>g with the waste flow repartition:<br />
281
PARALLEL SESSION 3B: PACKAGING 8 th Int. Conference on <strong>LCA</strong> <strong>in</strong> the<br />
Agri-<strong>Food</strong> Sector, 1-4 Oct <strong>2012</strong><br />
Figure1. The PET bottles waste management system, di decision variables (% <strong>in</strong> weight)<br />
In this study, r-PET regenerated mechanically <strong>in</strong>to a bottle can be further recycled, while the other recycled<br />
products (fibre, film, unsaturated polyester) can only be <strong>in</strong>c<strong>in</strong>erated or landfilled. The fraction of the<br />
<strong>in</strong>itial M kg of bottle that is recycled <strong>in</strong>to bottle grade PET is called λ. It is then <strong>in</strong>tegrated <strong>in</strong>to a flow of<br />
virg<strong>in</strong> PET and reprocessed <strong>in</strong>to λM kg of bottle, which is submitted to the same recycl<strong>in</strong>g alternatives as <strong>in</strong><br />
its first life, s<strong>in</strong>ce it is not dist<strong>in</strong>guishable from the virg<strong>in</strong> flow of bottle. The environmental impacts consequent<br />
to these successive end-of-lives are taken <strong>in</strong>to account, until the ultimate graves. The life cycle of<br />
packag<strong>in</strong>g waste is considered to be short enough to ignore any temporal evolution of the processes and param<strong>et</strong>ers.<br />
The allocation of the flow of bottles is consequently the same for each end-of-life cycle. λ is therefore<br />
constant <strong>in</strong> time and given by the material balance of the system. After n recycl<strong>in</strong>g trips, the amount of<br />
PET recycled to bottles is given by λ n M. The valorisation paths could be then simplified as presented <strong>in</strong> Fig.<br />
2.<br />
Transportation steps are also considered with an average distance b<strong>et</strong>ween Material Recycl<strong>in</strong>g Facility<br />
and sort<strong>in</strong>g plant (a value of 400 km is considered <strong>in</strong> the calculations, y<strong>et</strong>, the local situation may be very<br />
different).<br />
Figure2. An exhaustive <strong>LCA</strong>: the cradle-to-grave approach<br />
The environmental impacts are based on the calculation of the impacts <strong>in</strong>volved <strong>in</strong> each elementary process<br />
with Simapro <strong>LCA</strong> software tool, us<strong>in</strong>g the CML impact assessment m<strong>et</strong>hod. The model also takes <strong>in</strong>to<br />
account the fraction of PET regenerated <strong>in</strong>to bottles that can be further recycled. A non-l<strong>in</strong>ear model for the<br />
bottle waste collection stage is also considered; reflect<strong>in</strong>g that the more diffuse the flow of bottles is, the<br />
more difficult it is to collect and consequently, the more environmentally impact<strong>in</strong>g.<br />
F<strong>in</strong>ally, the global impacts are the cumulative impacts correspond<strong>in</strong>g to each “end-of-life”, as expressed<br />
<strong>in</strong> Eq. 1:<br />
282<br />
Intermediate<br />
product 1<br />
Intermediate<br />
product 2<br />
Product X<br />
Recycled<br />
products<br />
Recycled<br />
products<br />
!
PARALLEL SESSION 3B: PACKAGING 8 th Int. Conference on <strong>LCA</strong> <strong>in</strong> the<br />
Agri-<strong>Food</strong> Sector, 1-4 Oct <strong>2012</strong><br />
q<br />
q<br />
q<br />
n 1<br />
<br />
I I l,<br />
n I l,<br />
0 I l,<br />
1<br />
I l,<br />
0 I l,<br />
1<br />
Eq. 1<br />
1<br />
<br />
n0<br />
n1<br />
For each impact l, the total impact Il is expressed as the sum of impacts caused by each end-of-life,<br />
I<br />
<br />
I l n l,<br />
n , n be<strong>in</strong>g the life cycle number. The Il,0 are the impacts result<strong>in</strong>g from the virg<strong>in</strong> life of the<br />
product, from the extraction of the raw materials to its discard<strong>in</strong>g. Il,1 are the impacts result<strong>in</strong>g from the first<br />
life of the used product, from its cradle (bottle waste collection) to its different graves.<br />
Global Warm<strong>in</strong>g Potential (GWP 100), abiotic depl<strong>et</strong>ion and acidification have been selected among the<br />
<strong>in</strong>dicators: ozone depl<strong>et</strong>ion and photochemical oxidation are excluded due to the low emissions associated to<br />
the processes considered. Toxicity and ecotoxicity have not been considered as well due to the important<br />
uncerta<strong>in</strong>ty <strong>in</strong> the calculations for several reasons: the synergies b<strong>et</strong>ween pollutants are not considered, LCI<br />
are often <strong>in</strong>compl<strong>et</strong>e and uncerta<strong>in</strong>, and characterisation factors are lack<strong>in</strong>g for many pollutants.<br />
The result<strong>in</strong>g multi-objective problem is to f<strong>in</strong>d the allocation of bottles b<strong>et</strong>ween valorisation paths that<br />
m<strong>in</strong>imizes the environmental impacts of bottle end-of-lives. It is solved us<strong>in</strong>g a gen<strong>et</strong>ic algorithm (Ouattara<br />
<strong>et</strong> al., <strong>2012</strong>), and the trade-off b<strong>et</strong>ween environmental impacts is illustrated through Par<strong>et</strong>o curves (Fig. 3).<br />
Figure 3. Triobjective optimisation results, <strong>in</strong> the case of multiple recycl<strong>in</strong>g loops (red po<strong>in</strong>t shows the best<br />
compromise found with TOPSIS m<strong>et</strong>hod).<br />
A decision support tool <strong>in</strong>volv<strong>in</strong>g a variant of the so-called TOPSIS m<strong>et</strong>hod (Technique for Order Preference<br />
by Similarity to Ideal Solution) then d<strong>et</strong>erm<strong>in</strong>es best compromises among the optimal solutions (Ren <strong>et</strong><br />
al., 2007).<br />
3. Results<br />
The model has been applied first to the case of <strong>France</strong> <strong>in</strong> 2010, with the dedicated values of decision variables<br />
di (Fig. 1) given <strong>in</strong> the literature (ADEME, 2002; RDC-Environnement, 2010; Valorplast, 2011). When<br />
consider<strong>in</strong>g multiple recycl<strong>in</strong>g for PET bottles, the best solution is to collect 87% bottles and to regenerate<br />
all of them <strong>in</strong>to bottles by mechanical recycl<strong>in</strong>g. In this case, abiotic depl<strong>et</strong>ion, acidification and GWP impacts<br />
respectively decrease by 141, 72 and 61%.<br />
We then applied the model to the Ile-de-<strong>France</strong> region with its current waste treatment <strong>in</strong>dustrial sites.<br />
The PREDMA regulation is aim<strong>in</strong>g at a 60% waste collection rate <strong>in</strong> 2014 and 75% <strong>in</strong> 2019. Results <strong>in</strong> Figure<br />
4 show that <strong>in</strong>f<strong>in</strong>ite recycl<strong>in</strong>g loops reduce abiotic depl<strong>et</strong>ion, acidification and GWP respectively by 64.5,<br />
65 and 65%; meanwhile a 75% collection rate leads to a decrease of abiotic depl<strong>et</strong>ion, acidification and<br />
GWP respectively by 28.5, 25 and 115%.<br />
283
PARALLEL SESSION 3B: PACKAGING 8 th Int. Conference on <strong>LCA</strong> <strong>in</strong> the<br />
Agri-<strong>Food</strong> Sector, 1-4 Oct <strong>2012</strong><br />
Figure 4. Effect of recycl<strong>in</strong>g loop number (q[1;3]) and collection rate (c = 50% ; 60% ; 75%) on the environmental<br />
impacts assessment of PET bottle waste treatment <strong>in</strong> Ile-de-<strong>France</strong> region. The unit of the y-axis is<br />
directly expressed <strong>in</strong> the unit of the considered impact.<br />
The effect of multiple recycl<strong>in</strong>g trips for PET bottles on the f<strong>in</strong>al result is analysed (Fig. 5). With the<br />
<strong>France</strong> param<strong>et</strong>ers, multiple recycl<strong>in</strong>g trips allow a reduction of abiotic depl<strong>et</strong>ion (resp. Acidification) of<br />
11.1% (resp.10.9%) more than if there is only a s<strong>in</strong>gle end-of-life. GWP decreases by only 3.4%. The effect<br />
of multiple recycl<strong>in</strong>g trips is significant from the third end-of-life (Fig. 5).<br />
Figure 5: Effect of the number of recycl<strong>in</strong>g loops on the f<strong>in</strong>al impacts.<br />
4. Discussion<br />
4.1. Evaluation of the recycl<strong>in</strong>g routes.<br />
First, it must be said that the three scenarios are <strong>in</strong> agreement with the literature. With the data used, either<br />
secondary or tertiary recycl<strong>in</strong>g is always preferable to thermal recycl<strong>in</strong>g. This is not surpris<strong>in</strong>g s<strong>in</strong>ce<br />
thermal recycl<strong>in</strong>g techniques were not created to treat PET (ADEME, 2002), and are more adapted to composite<br />
waste flow that cannot be sorted. However, the data used for the LCI of pyrolysis and hydrocrack<strong>in</strong>g<br />
could be outdated as underl<strong>in</strong>ed <strong>in</strong> Perug<strong>in</strong>i <strong>et</strong> al., 2005. Indeed, this range of recycl<strong>in</strong>g techniques suffers<br />
from a general lack of data concern<strong>in</strong>g environmental impacts as highlighted <strong>in</strong> Al-Salem <strong>et</strong> al., 2009. The<br />
hypothesis on hydrogen production is even not relevant <strong>in</strong> eco<strong>in</strong>vent: <strong>in</strong> this database used for our impact<br />
assessment, the hydrogen production is an average of different process, water electrolysis ma<strong>in</strong>ly, which is a<br />
non-sense or a cont<strong>in</strong>uous production. In reality, almost all <strong>in</strong>dustrial sites worldwide like ref<strong>in</strong>eries do use<br />
stream reform<strong>in</strong>g of natural gas followed by water gas shift for hydrogen production (Chaum<strong>et</strong>te, 1996;<br />
Raimbault, 1997; Yurum, 1995). Then, impacts assessment of hydrocrack<strong>in</strong>g is underestimated <strong>in</strong> our model,<br />
and those of pyrolyis are overestimated.<br />
284<br />
0,04<br />
0,03<br />
0,02<br />
0,01<br />
0<br />
-0,01<br />
-0,02<br />
-0,03<br />
-0,04<br />
-0,05<br />
0,03<br />
0,02<br />
0,01<br />
0<br />
-0,01<br />
-0,02<br />
-0,03<br />
-0,04<br />
Current situation Objective PREDMA<br />
-0,05q=1<br />
(c=50 %)<br />
q=3<br />
2014 (c=60 %)<br />
q= ∞<br />
0,04<br />
0,03<br />
0,02<br />
0,01<br />
0<br />
-0,01<br />
-0,02<br />
-0,03<br />
-0,05<br />
GWP/100, end-of-lives (kg CO2 eq)<br />
GWP/100, virg<strong>in</strong> production (kg CO2 eq)<br />
Acidification, end-of-lives (kg SO2 eq)<br />
Acidification, virg<strong>in</strong> production (kg SO2 eq)<br />
Abiotic depl<strong>et</strong>ion, end-of-lives (kg Sb eq)<br />
Objective PREDMA<br />
-0,04<br />
2019 (c=75 Abiotic %) depl<strong>et</strong>ion, virg<strong>in</strong> production (kg Sb eq)<br />
Current situation<br />
(c=50 %)<br />
Objective PREDMA<br />
2014 (c=60 %)<br />
Abiotic depl<strong>et</strong>ion, virg<strong>in</strong> production (kg Sb eq) Abiotic depl<strong>et</strong>ion, end-of-lives (kg Sb eq)<br />
Acidification, virg<strong>in</strong> production (kg SO2 eq) Acidification, end-of-lives (kg SO2 eq)<br />
GWP/100, virg<strong>in</strong> production (kg CO2 eq) GWP/100, end-of-lives (kg CO2 eq)<br />
Objective PREDMA<br />
2019 (c=75 %)<br />
GWP/100, end-of-live<br />
GWP/100, virg<strong>in</strong> prod<br />
Acidification, end-of-<br />
Acidification, virg<strong>in</strong> p<br />
Abiotic depl<strong>et</strong>ion, en<br />
Abiotic depl<strong>et</strong>ion, vir<br />
eq)
PARALLEL SESSION 3B: PACKAGING 8 th Int. Conference on <strong>LCA</strong> <strong>in</strong> the<br />
Agri-<strong>Food</strong> Sector, 1-4 Oct <strong>2012</strong><br />
Second, for closed loop recycl<strong>in</strong>g, mechanical pathway is preferable to glycolysis followed by repolymerisation.<br />
This difference had already been demonstrated <strong>in</strong> (Shen <strong>et</strong> al., 2010) <strong>in</strong> the case of bottle to fibre<br />
recycl<strong>in</strong>g. Chemical recycl<strong>in</strong>g has long been the only possibility to achieve closed loop recycl<strong>in</strong>g, but s<strong>in</strong>ce<br />
the beg<strong>in</strong>n<strong>in</strong>g of the century mechanical processes have reached the necessary requirements, <strong>in</strong> terms of mechanical<br />
propri<strong>et</strong>y of the polymer and decontam<strong>in</strong>ation of the matrix (Welle, 2011). Mechanical processes<br />
are also cheaper than chemical depolymerisation (Karayannidis <strong>et</strong> al., 2007; Awaja <strong>et</strong> al., 2005). This expla<strong>in</strong>s<br />
the renewal of <strong>in</strong>terest for orig<strong>in</strong>al applications of glycolysed PET with higher added-value, like unsaturated<br />
polyester or polyur<strong>et</strong>hane. Unsaturated polyester synthesis from glycolysed PET seems to be an<br />
<strong>in</strong>terest<strong>in</strong>g environmental solution to avoid the used of several chemicals when multi-recycl<strong>in</strong>g is not possible.<br />
However, the data orig<strong>in</strong>at<strong>in</strong>g from a pilot plant, additional research is necessary to ensure the viability<br />
of the process and confirm the results of this study.<br />
4.2. Multi-recycl<strong>in</strong>g loops and quality<br />
It was also checked that the recycled bottle quality was not affected by successive bottle-to-bottle recycl<strong>in</strong>g,<br />
mean<strong>in</strong>g that <strong>in</strong>tr<strong>in</strong>sic viscosity and colour rema<strong>in</strong> above the quality threshold standards. For this purpose,<br />
a property Q has been considered, e.g. <strong>in</strong>tr<strong>in</strong>sic viscosity. After each recycl<strong>in</strong>g cycle, the property of<br />
the PET res<strong>in</strong> is degraded, and the relation b<strong>et</strong>ween cycle n+1 and n is given by Qn+1=αQn (Rieckmann <strong>et</strong> al.,<br />
2011), α be<strong>in</strong>g the quality r<strong>et</strong>ention rate. The propri<strong>et</strong>y after n closed-loop recycl<strong>in</strong>g is therefore a geom<strong>et</strong>ric<br />
sequence and Qn = α n Q0. k is the fraction of r-PET <strong>in</strong>troduced <strong>in</strong> a bottle. This fraction is a mix b<strong>et</strong>ween PET<br />
recycled once, twice... q times, as represented <strong>in</strong> Fig. 6.<br />
Figure 6. Mix of res<strong>in</strong>s <strong>in</strong> a PET bottle. Qn represents the quality, l<strong>in</strong>ked to the number of times this fraction<br />
has been recycled, Q0 be<strong>in</strong>g virg<strong>in</strong> PET and q the number of recycl<strong>in</strong>g trips.<br />
The quantity of res<strong>in</strong> recycled n times <strong>in</strong>troduced <strong>in</strong> a bottle is equal to fn = k n (1 - k) (see Fig. 5 for q =<br />
1.4). Under the hypothesis that the blend of recycled and virg<strong>in</strong> PET obeys the law of mixes, the f<strong>in</strong>al quality<br />
Q of a bottle conta<strong>in</strong><strong>in</strong>g r-PET recycled up to q times is given by Eq. 2:<br />
q<br />
<br />
Q f Q <br />
<br />
n0<br />
n<br />
n<br />
q<br />
n<br />
( 1<br />
k)<br />
Q0<br />
k<br />
n0<br />
n<br />
Eq. 2<br />
When k = 0.35 and α= 0.95 (<strong>in</strong> the case of <strong>in</strong>tr<strong>in</strong>sic viscosity, r is near to 0.98 accord<strong>in</strong>g to the results <strong>in</strong><br />
Rieckmann <strong>et</strong> al., 2011), for q → +∞, Q quickly converges towards ≈ 0.973.Q0. The hypothesis of <strong>in</strong>f<strong>in</strong>ity<br />
closed-loop recycl<strong>in</strong>g therefore does not imply serious degradation of the quality of the bottles consider<strong>in</strong>g<br />
current practices.<br />
4.3. Economic viability<br />
The environmental performance of the different processes is not the only argument that has to be considered<br />
to design PET waste management system. A low environmental impact solution that is not economically<br />
viable will not be selected. The difficulty of modell<strong>in</strong>g the economical flows of the PET waste management<br />
system relies on the fact that <strong>in</strong>volved stakeholders generally have conflict<strong>in</strong>g <strong>in</strong>terests, economical profits or<br />
costs be<strong>in</strong>g different for <strong>in</strong>dustrials, municipalities and citizens. A global approach similar to the one adopted<br />
285
PARALLEL SESSION 3B: PACKAGING 8 th Int. Conference on <strong>LCA</strong> <strong>in</strong> the<br />
Agri-<strong>Food</strong> Sector, 1-4 Oct <strong>2012</strong><br />
for environmental impacts is therefore of limited <strong>in</strong>terest. The model developed <strong>in</strong> this study is a useful tool<br />
to select most <strong>in</strong>terest<strong>in</strong>g processes <strong>in</strong> terms of environmental impacts. This process be<strong>in</strong>g selected, its economical<br />
viability must then be tested by classical m<strong>et</strong>hods: N<strong>et</strong> Present Value, annual cost (Ouattara <strong>et</strong> al.,<br />
<strong>2012</strong>).<br />
5. Conclusion<br />
The model of the PET packag<strong>in</strong>g management system proposed here is particularly <strong>in</strong>terest<strong>in</strong>g to quantify<br />
the environmental impacts and d<strong>et</strong>erm<strong>in</strong>e optimal targ<strong>et</strong>s. The use of a gen<strong>et</strong>ic algorithm is an efficient<br />
m<strong>et</strong>hod to def<strong>in</strong>e the optimal allocation of bottle waste b<strong>et</strong>ween valorisation paths. The use of multirecycl<strong>in</strong>g<br />
loops for PET bottles reduces significantly the environmental burdens. Accord<strong>in</strong>g to the number of<br />
recycl<strong>in</strong>g trips possible, the optimal collection rate varies b<strong>et</strong>ween 80 and 90% which is <strong>in</strong> average ten percent<br />
higher than the targ<strong>et</strong> values fixed for 2019 <strong>in</strong> <strong>France</strong>.<br />
This could lead to new strategies for food packag<strong>in</strong>g companies like develop<strong>in</strong>g new partnerships with local<br />
communities and waste treatment companies.<br />
Further work is now devoted to the application of this m<strong>et</strong>hodology both to <strong>LCA</strong> of other food plastic<br />
packag<strong>in</strong>g (polylactic acid (PLA) bottles and bio-based PET bottles), other food packag<strong>in</strong>g (paper, glass or<br />
m<strong>et</strong>als) and to the optimal material supply for bio-based <strong>et</strong>hanol synthesis used <strong>in</strong> different biomaterials by<br />
compar<strong>in</strong>g different crops.<br />
6. References<br />
ADEME, 2002. Recyclage chimique des matieres plastiques. Technical report, ADEME.<br />
Al-Salem, S.M., L<strong>et</strong>tieri, P. and J. Baeyens, J., 2009. Recycl<strong>in</strong>g and recovery routes of plastic solid waste (PSW): A review. Waste<br />
Management, 29(10):2625-2643.<br />
Awaja, F. and Pavel, D., 2005. Recycl<strong>in</strong>g of PET. European polymer journal, 41(7):1453-1477.<br />
Chaum<strong>et</strong>te, P., 1996. Conversion du gaz naturel <strong>in</strong> Revue de l’IFP N°5, 51(5), pp.711-727.<br />
Karayannidis, G.P. and Achilias, D.S., 2007. Chemical recycl<strong>in</strong>g of poly-(<strong>et</strong>hylene terephthalate). Macromolecular Materials and<br />
Eng<strong>in</strong>eer<strong>in</strong>g, 292(2):128-146.<br />
Ouattara, A., Pibouleau, L., Azzaro-Pantel, C., Domenech, S., Baud<strong>et</strong>, P., Yao, B., <strong>2012</strong>. Economic and environmental strategies for<br />
process design, Computers & Chemical Eng<strong>in</strong>eer<strong>in</strong>g, 36(10):174-188.<br />
Perug<strong>in</strong>i, F., Mastellone, M.L. and Arena, U., 2005. A life cycle assessment of mechanical and feedstock recycl<strong>in</strong>g options for management<br />
of plastic packag<strong>in</strong>g wastes. Environmental Progress, 24(2):137-154.<br />
RDC-Environnement, 2010. Analyse du cycle de vie d'une bouteille PET. Technical report, Elipso, Valorplast and Eco-Emballages.<br />
Raimbault, C., 1997. L’hydrogène <strong>in</strong>dustriel : synthèse, purification, L’actualité chimique.<br />
Ren, L., Zhang, Y., Wang, Y., and Z. Sun, Z., 2007. Comparative analysis of a novel m-topsis m<strong>et</strong>hod and topsis. Applied Mathematics<br />
Research Express, 10.<br />
Rieckmann, T., Frei, F. and Volker, S. 2011. Modell<strong>in</strong>g of PET quality param<strong>et</strong>ers for a closed-loop recycl<strong>in</strong>g system for food contact,<br />
<strong>in</strong> Macro-molecular Symposia, volume 302, pp. 34-45. Wiley Onl<strong>in</strong>e Library.<br />
Shen, L., Worrell, E. and Patel, M.K. Open-loop recycl<strong>in</strong>g: A <strong>LCA</strong> case study of PET bottle-to-fibre recycl<strong>in</strong>g. Resources, Conservation<br />
and Recycl<strong>in</strong>g, 55:34-52, 2010.<br />
Valorplast, 2011. Applications des bouteilles <strong>et</strong> flacons plastiques recycées. URL http://www.valorplast.com.<br />
Welle, F., 2011. Twenty years of PET bottle to bottle recycl<strong>in</strong>g-an overview. Resources, Conservation and Recycl<strong>in</strong>g, 55(11):865-<br />
875.<br />
Yurum, Y., 1995. Hydrogen Energy System, Kluwer Academic Publishers.<br />
286
PARALLEL SESSION 3B: PACKAGING 8 th Int. Conference on <strong>LCA</strong> <strong>in</strong> the<br />
Agri-<strong>Food</strong> Sector, 1-4 Oct <strong>2012</strong><br />
Environmental aspects used for food packag<strong>in</strong>g design and product<br />
carbon footpr<strong>in</strong>t assessment<br />
Carlos Naranjo 1,* , Juan Leal 1 , Oscar Agudelo 2 , Aura Ochoa 2 , Octavio Morales 3 , Diana Guevara 4<br />
1 Gaia Environmental Services, Medellín, Colombia<br />
2 Industria de Alimentos Zenú S.A.S, Medellín, Colombia<br />
3 Microplast S.A., Medellín, Colombia<br />
4 Phoenix Group, Bogotá, Colombia<br />
Correspond<strong>in</strong>g author. E-mail: cnaranjo@gaiasa.com<br />
ABSTRACT<br />
In develop<strong>in</strong>g new designs for long-shelf-life food packag<strong>in</strong>g, this study took a product life cycle <strong>in</strong>to account, with the product<br />
carbon footpr<strong>in</strong>t as an <strong>in</strong>dicator. Technical and mark<strong>et</strong> variables were also <strong>in</strong>cluded <strong>in</strong> the evaluation. The assessment exam<strong>in</strong>ed four<br />
different packages for sausage products: alum<strong>in</strong>ium can, rigid plastic, flexible 100% plastic pouch, and flexible alum<strong>in</strong>ium pouch.<br />
The m<strong>et</strong>hodologies used for the study were ISO14040, ISO14044 and PAS2050:2008. The alum<strong>in</strong>ium can had the largest carbon<br />
footpr<strong>in</strong>t, while the rigid plastic conta<strong>in</strong>er and flexible plastic pouch had the lowest carbon footpr<strong>in</strong>ts (80% and 60% lower than the<br />
alum<strong>in</strong>ium can, respectively). The Alum<strong>in</strong>ium can carbon footpr<strong>in</strong>t is four times higher than plastics ones.<br />
Keywords: eco-design, carbon footpr<strong>in</strong>t, consumer behaviour, food packag<strong>in</strong>g.<br />
1. Introduction<br />
“Packag<strong>in</strong>g is necessary to protect food dur<strong>in</strong>g storage and transportation <strong>in</strong> the food cha<strong>in</strong> from producer<br />
to consumer. It also plays an important role <strong>in</strong> creat<strong>in</strong>g a product brand and <strong>in</strong> communicat<strong>in</strong>g with<br />
the consumer.” (Williams, 2008)<br />
The processed meat <strong>in</strong>dustry sells its products through r<strong>et</strong>ailers, such as supermark<strong>et</strong>s and grocery stores.<br />
Modern lifestyles and social changes have demanded that the processed meat <strong>in</strong>dustry develop new packag<strong>in</strong>g<br />
that adds convenience and longer shelf life to the product. Particularly important is the development of<br />
packag<strong>in</strong>g that provides <strong>in</strong>dividual portions and makes refrigeration unnecessary.<br />
The ma<strong>in</strong> function of food packag<strong>in</strong>g is to protect the product from spoilage and outside contam<strong>in</strong>ation.<br />
The packag<strong>in</strong>g also provides other <strong>in</strong>formation, communicat<strong>in</strong>g to consumers the identity of the product and<br />
its particular characteristics.<br />
The motivation can be government regulation, consumer pressure, r<strong>et</strong>ailer pressure, cost, or functionality<br />
of the package which improves the convenience of the f<strong>in</strong>al product. If a company wants to use susta<strong>in</strong>able<br />
packag<strong>in</strong>g, the life cycle assessment (<strong>LCA</strong>) m<strong>et</strong>hodology represents the “perfect tool” for work<strong>in</strong>g on such<br />
procedures (Siracusa, 2011).<br />
This study aims to assess the carbon footpr<strong>in</strong>t of four types of packag<strong>in</strong>g for sausage products. The alum<strong>in</strong>ium<br />
can, it is an exist<strong>in</strong>g package, and for this project the company development three prototypes <strong>in</strong> rigid<br />
plastic, flexible 100% plastic pouch and flexible alum<strong>in</strong>ium pouch. In develop<strong>in</strong>g new designs for longshelf-life<br />
food packag<strong>in</strong>g, this study takes a product life cycle <strong>in</strong>to account, with the product carbon footpr<strong>in</strong>t<br />
as an <strong>in</strong>dicator. Technical and mark<strong>et</strong> variables are also <strong>in</strong>cluded <strong>in</strong> the evaluation. The expected shelf life<br />
for the conta<strong>in</strong>ers without refrigeration is two years.<br />
2. M<strong>et</strong>hods<br />
Prototypes of the three conta<strong>in</strong>ers were manufactured <strong>in</strong> a pilot plant and compared to an exist<strong>in</strong>g alum<strong>in</strong>ium<br />
canned sausage product (Fig. 1). The conta<strong>in</strong>ers were sent to a laboratory for test<strong>in</strong>g and comparison of<br />
technical and sensory param<strong>et</strong>ers:<br />
pH, texture profile (TPA), colour, sensory test and shelf life.<br />
Samples were also sent for a mark<strong>et</strong><strong>in</strong>g study with different targ<strong>et</strong> groups <strong>in</strong> three major mark<strong>et</strong>s:<br />
Use Test: a qualitative evaluation for the performance of each prototype <strong>in</strong> the location that consumers<br />
typically used the products. The targ<strong>et</strong> mark<strong>et</strong> <strong>in</strong>cluded homemakers, work<strong>in</strong>g women and<br />
those responsible for household purchases.<br />
Channel Distribution Test: a qualitative evaluation through <strong>in</strong>-depth <strong>in</strong>terviews with store owners<br />
and school store managers.<br />
Concept Test and Sensory Test: evaluation with men and women aged 15-50 of middle and high<br />
class.<br />
287
PARALLEL SESSION 3B: PACKAGING 8 th Int. Conference on <strong>LCA</strong> <strong>in</strong> the<br />
Agri-<strong>Food</strong> Sector, 1-4 Oct <strong>2012</strong><br />
<strong>LCA</strong> to estimate a carbon footpr<strong>in</strong>t of each product was accomplished follow<strong>in</strong>g the m<strong>et</strong>hodology<br />
ISO14040, ISO14044 and PAS2050:2008. The manufacturer of each package provided design and test<strong>in</strong>g<br />
prototype <strong>in</strong>formation. The consumption of tap water, steam and electricity, as well as packag<strong>in</strong>g disposal<br />
was considered <strong>in</strong> the f<strong>in</strong>al analysis. The functional unit for the <strong>LCA</strong> was "packag<strong>in</strong>g able to hold 180 g of<br />
sausage". The data for the life cycle of each conta<strong>in</strong>er, <strong>in</strong>clud<strong>in</strong>g raw materials; packag<strong>in</strong>g manufacture;<br />
transportation; and food production processes, distribution, use and disposal were modelled with Umberto<br />
software and the Eco<strong>in</strong>vent 2.2 database. The raw materials are imported for Colombia, and the data for the<br />
carbon footpr<strong>in</strong>t were taken from the Eco<strong>in</strong>vent database 2.2 The data to build the Inventory for the raw material<br />
process<strong>in</strong>gs were measured.<br />
a) b) c) d)<br />
Figure 1. Package prototypes tested: a) alum<strong>in</strong>ium can, b) rigid plastic, c) plastic pouch, d) alum<strong>in</strong>ium pouch.<br />
3. Results<br />
3.1. Technical analysis<br />
The alternate conta<strong>in</strong>ers showed no significant differences with the exist<strong>in</strong>g packag<strong>in</strong>g design for pH, TPA,<br />
colour or sensory param<strong>et</strong>ers. However, shelf life <strong>in</strong> the flexible plastic pouch was 60% less than the exist<strong>in</strong>g<br />
conta<strong>in</strong>er; shelf life <strong>in</strong> rigid plastic conta<strong>in</strong>er was 58% less than the exist<strong>in</strong>g conta<strong>in</strong>er, while the flexible<br />
alum<strong>in</strong>ium pouch provided 50% less shelf life.<br />
3.2. Mark<strong>et</strong><strong>in</strong>g analysis<br />
The flexible plastic pouch could not be studied because it had leaks. Mark<strong>et</strong><strong>in</strong>g analysis revealed some positive<br />
and negative perceptions of the rema<strong>in</strong><strong>in</strong>g three conta<strong>in</strong>ers (Table 1).<br />
Table 1. Ma<strong>in</strong> results of the mark<strong>et</strong><strong>in</strong>g analysis of three conta<strong>in</strong>er prototypes.<br />
Packag<strong>in</strong>g type Positive perceptions Negative perceptions<br />
Alum<strong>in</strong>ium Safest m<strong>et</strong>hod of packag<strong>in</strong>g. The packag<strong>in</strong>g has not changed over time.<br />
can<br />
Protects aga<strong>in</strong>st all outside<br />
contam<strong>in</strong>ation and spoilage.<br />
No consumer excitement.<br />
Rigid plastic Reusable packag<strong>in</strong>g. Similar packag<strong>in</strong>g as for refrigerated products.<br />
Attractive new design. Less resistant to outside contam<strong>in</strong>ation as the conta<strong>in</strong>er<br />
may break.<br />
Lower price expectancy not m<strong>et</strong>.<br />
Flexible alu- New <strong>in</strong>novative packag<strong>in</strong>g. Difficulty open<strong>in</strong>g. In some cases people need to use scism<strong>in</strong>ium<br />
pouch<br />
sors.<br />
Consumers dislike putt<strong>in</strong>g their hands <strong>in</strong>side the bag to<br />
remove the product.<br />
Consumers believe the bag product should have a lower<br />
price.<br />
Consumers demand that the product be refrigerated.<br />
It is not easy to stack and consumes a lot of shelf space.<br />
3.3. Environmental analysis: carbon footpr<strong>in</strong>t of the packag<strong>in</strong>g<br />
The raw materials used had a large <strong>in</strong>fluence for the carbon footpr<strong>in</strong>t of the packag<strong>in</strong>g. For example, for<br />
the alum<strong>in</strong>ium pouch, 95% of the carbon footpr<strong>in</strong>t came from raw materials, and alum<strong>in</strong>ium was the ma<strong>in</strong><br />
material.<br />
288
PARALLEL SESSION 3B: PACKAGING 8 th Int. Conference on <strong>LCA</strong> <strong>in</strong> the<br />
Agri-<strong>Food</strong> Sector, 1-4 Oct <strong>2012</strong><br />
To model the carbon footpr<strong>in</strong>t of the different packag<strong>in</strong>gs the Umberto for carbon footpr<strong>in</strong>t software was<br />
used (Fig 2).<br />
Figure 2. Life cycle carbon footpr<strong>in</strong>t flow for plastic pouch. Umberto for Carbon footpr<strong>in</strong>t v1.2 ®<br />
For the rigid plastic conta<strong>in</strong>er, 63% of the carbon footpr<strong>in</strong>t came from raw materials, mostly polypropylene.<br />
The rigid plastic conta<strong>in</strong>er’s three components, a polypropylene cup, an alum<strong>in</strong>ium lid and a polypropylene<br />
cap and fork. For the carbon footpr<strong>in</strong>t of the rigid plastic conta<strong>in</strong>er the polypropylene cup represents<br />
24%, the alum<strong>in</strong>ium lid 17%, and the polypropylene cap and fork 22%. For the flexible plastic pouch, 60%<br />
of the carbon footpr<strong>in</strong>t came from raw materials. For the flexible alum<strong>in</strong>ium pouch, 95% of the carbon footpr<strong>in</strong>t<br />
came from raw materials, and the alum<strong>in</strong>ium is 30% of the carbon footpr<strong>in</strong>t of the product. The corrugated<br />
box is 20% of the carbon footpr<strong>in</strong>t of the product. The corrugated cardboard box used to ship packaged<br />
products it is about 30% of the carbon footpr<strong>in</strong>t of all the different packages. The mass of the empty corrugated<br />
box is 255 g and holds only 23 flexible packages, 23 rigid conta<strong>in</strong>ers, or 48 cans. The alum<strong>in</strong>ium can<br />
have the largest carbon footpr<strong>in</strong>t, while the rigid plastic conta<strong>in</strong>er and flexible plastic pouch had the lowest<br />
carbon footpr<strong>in</strong>ts (80% and 60% lower than the alum<strong>in</strong>ium can, respectively) (Fig. 3).<br />
100%<br />
90%<br />
80%<br />
70%<br />
60%<br />
50%<br />
40%<br />
30%<br />
20%<br />
10%<br />
0%<br />
Alum<strong>in</strong>ium<br />
Conta<strong>in</strong>er<br />
Rigid Plastic Flexible Flexible<br />
plastic 100% Alum<strong>in</strong>ium<br />
Disposal<br />
Distribution<br />
Raw Materials<br />
Figure 3. Relative carbon footpr<strong>in</strong>t of the “packag<strong>in</strong>g able to hold 180 g of sausage”.<br />
4. Discussion<br />
One important consideration for eco-design packag<strong>in</strong>g is the mark<strong>et</strong><strong>in</strong>g study. It will be a start<strong>in</strong>g po<strong>in</strong>t<br />
for future eco-designs. The mark<strong>et</strong><strong>in</strong>g study related to multiple aspects of public perception must be translated<br />
<strong>in</strong>to design variables to achieve effective consumer satisfaction with the new packag<strong>in</strong>g. The ma<strong>in</strong> cos-<br />
289
PARALLEL SESSION 3B: PACKAGING 8 th Int. Conference on <strong>LCA</strong> <strong>in</strong> the<br />
Agri-<strong>Food</strong> Sector, 1-4 Oct <strong>2012</strong><br />
tumer perceptions were concern with preserv<strong>in</strong>g and ma<strong>in</strong>ta<strong>in</strong><strong>in</strong>g the quality of the product as well as the<br />
price. The alum<strong>in</strong>ium can received positive comments for its ability to protect and preserve the product but<br />
the production cost is higher than other ones. However the consumers are will<strong>in</strong>g to pay more for it.<br />
5. Conclusion<br />
The carbon footpr<strong>in</strong>t of product is a tool that <strong>in</strong>cludes eco-design criteria <strong>in</strong> food packag<strong>in</strong>g and<br />
can be used for mark<strong>et</strong><strong>in</strong>g.<br />
Raw materials represent 50-80% of the carbon footpr<strong>in</strong>t of these packages.<br />
The Alum<strong>in</strong>ium can carbon footpr<strong>in</strong>t is four times higher than plastics ones. Nevertheless, it provides<br />
the safest m<strong>et</strong>hod of protect<strong>in</strong>g and preserv<strong>in</strong>g the product as well as provid<strong>in</strong>g the longest<br />
shelf life.<br />
The mark<strong>et</strong><strong>in</strong>g study reached an important conclusion, as consumers prefer the can conta<strong>in</strong>er for<br />
the long life sausage; it will be a decid<strong>in</strong>g factor for the packag<strong>in</strong>g equipment design.<br />
All materials me<strong>et</strong> quality specifications, but the shelf life of the sausage is the most important<br />
factor to consider, as plastic packag<strong>in</strong>g leaves the product with less shelf life.<br />
6. References<br />
Carbon Trust, DEFRA, BSI. PAS2050:2008. Specification for the assessment of the life cycle greenhouse gas emissions of goods<br />
and services. BSI, London. 2008<br />
ISO. ISO 14040:2006. Environmental management -- Life cycle assessment -- Pr<strong>in</strong>ciples and framework. ISO, 2006.<br />
ISO. ISO 14044:2006. Environmental management -- Life cycle assessment -- Requirements and guidel<strong>in</strong>es. ISO, 2006<br />
Siracusa V <strong>et</strong> al., Life Cycle Assessment of multilayer polymer film used <strong>in</strong> food packag<strong>in</strong>g field. In: Procedia <strong>Food</strong> Science 1 (2011)<br />
235-239.<br />
Williams H <strong>et</strong> al., A life cycle perspective on environmental effects of customer focused packag<strong>in</strong>g development. Journal of Cleaner<br />
Production. 16, 853-859.<br />
290
PARALLEL SESSION 3B: PACKAGING 8 th Int. Conference on <strong>LCA</strong> <strong>in</strong> the<br />
Agri-<strong>Food</strong> Sector, 1-4 Oct <strong>2012</strong><br />
The <strong>in</strong>fluence of packag<strong>in</strong>g attributes on consumer behaviour <strong>in</strong> foodpackag<strong>in</strong>g<br />
<strong>LCA</strong> studies - a neglected topic<br />
Fredrik Wikström 1 , Helén Williams 1 , Karli Verghese 2 , Stephen Clune 2<br />
1 Karlstad University, Sweden<br />
2 Centre for Design, RMIT University, Australia<br />
Correspond<strong>in</strong>g author. E-mail: fredrik.wikstrom@kau.se<br />
ABSTRACT<br />
It is well known that consumers waste a significant amount of food product and that the functions of packag<strong>in</strong>g can <strong>in</strong>fluence how<br />
much food is wasted. Examples <strong>in</strong>clude portion sizes, accessibility of the pack and ability to dispense the product. The role of packag<strong>in</strong>g<br />
systems to reduce food waste is rarely modelled <strong>in</strong> <strong>LCA</strong>-studies. This means that a packag<strong>in</strong>g system format with a lower<br />
environmental impact, but that causes high food waste, appears to be a b<strong>et</strong>ter alternative than a packag<strong>in</strong>g system format with a<br />
higher environmental impact, but reduces food waste. This can be contradictory to the purpose of us<strong>in</strong>g <strong>LCA</strong> to reduce the overall<br />
environmental impact of the packaged food product, because food has generally much higher environmental impact than the packag<strong>in</strong>g.<br />
Ensur<strong>in</strong>g that <strong>LCA</strong> studies of packaged products <strong>in</strong>clude associated food wastage across the supply cha<strong>in</strong> can drastically change<br />
the outcome of an <strong>LCA</strong> study.<br />
Keywords: functional unit, consumer behaviour, packag<strong>in</strong>g,, food waste, life cycle assessment<br />
1. Introduction<br />
Attention to date has seen the focus of reduc<strong>in</strong>g the environmental impacts of the sourc<strong>in</strong>g, production<br />
and waste management of packag<strong>in</strong>g materials. This has <strong>in</strong>cluded lighweight<strong>in</strong>g of materials, chang<strong>in</strong>g packag<strong>in</strong>g<br />
system formats, provid<strong>in</strong>g different portion sizes and enhanc<strong>in</strong>g the efficiency of material and energy<br />
consumption <strong>in</strong> the sourc<strong>in</strong>g, production and conversion of these materials. Regulatory frameworks <strong>in</strong>clud<strong>in</strong>g<br />
the Directive on Packag<strong>in</strong>g and Packag<strong>in</strong>g Waste <strong>in</strong> Europe (European Council, 1994; European Commission,<br />
2006) and the voluntary Australian Packag<strong>in</strong>g Covenant (APC 2010) have provided mechanisms for<br />
the packag<strong>in</strong>g supply cha<strong>in</strong> to r<strong>et</strong>h<strong>in</strong>k the design of packag<strong>in</strong>g materials and formats to reduce environmental<br />
impact. Packag<strong>in</strong>g performs important functions <strong>in</strong> the provision of food <strong>in</strong>clud<strong>in</strong>g conta<strong>in</strong>ment, protection,<br />
distribution, mark<strong>et</strong><strong>in</strong>g of the brand and dispens<strong>in</strong>g of the product. However, it is known that about 30% of<br />
the food purchased <strong>in</strong> the <strong>in</strong>dustrialised world is wasted by consumers (Engström and Carlsson-Kanyama,<br />
2004; Ventour, 2008; Quested and Johnson, 2009). Understand<strong>in</strong>g the reasons for this wastage and the role<br />
that packag<strong>in</strong>g can play <strong>in</strong> reduc<strong>in</strong>g this waste is important and the rema<strong>in</strong>der of this paper beg<strong>in</strong>s to <strong>in</strong>vestigate<br />
these reasons.<br />
If <strong>LCA</strong> m<strong>et</strong>hodology is used as a tool to reduce the environmental impact of packag<strong>in</strong>g, the impact on<br />
food waste and possibilities to reduce this should be <strong>in</strong>cluded. However, the function of packag<strong>in</strong>g to reduce<br />
food waste is rarely discussed <strong>in</strong> the Packag<strong>in</strong>g Directive (European Council, 1994). Packag<strong>in</strong>g plays an<br />
important role <strong>in</strong> reduc<strong>in</strong>g food waste, as Williams <strong>et</strong>. al’s (<strong>2012</strong>) estimated, 20% of food waste <strong>in</strong> households<br />
could be attributed to packag<strong>in</strong>g (not <strong>in</strong>clud<strong>in</strong>g food waste of fruit and veg<strong>et</strong>ables due to too little<br />
packag<strong>in</strong>g).<br />
By exclud<strong>in</strong>g food waste when estimat<strong>in</strong>g the environmental impact of packag<strong>in</strong>g systems means that<br />
packag<strong>in</strong>g with a lower environmental impact that causes high food waste, may appear to be a b<strong>et</strong>ter alternative<br />
than packag<strong>in</strong>g with somewhat higher environmental impact, but reduces food waste. This is contradictory<br />
to the purpose of us<strong>in</strong>g <strong>LCA</strong> to reduce environmental impacts, because food generally has a much<br />
higher environmental impact than the packag<strong>in</strong>g (Hanssen, 1998). For example, 1 kg of beef has approximately<br />
1,730 times more global warm<strong>in</strong>g potential than a 5 g LDPE plastic bag (extrapolated from Eady <strong>et</strong><br />
al., 2011, p.1; Eco<strong>in</strong>vent 2011). If it was found that the packag<strong>in</strong>g configuration of the plastic bag resulted <strong>in</strong><br />
an <strong>in</strong>crease <strong>in</strong> product wastage, a change <strong>in</strong> packag<strong>in</strong>g material format to say a rigid plastic tray may be a<br />
b<strong>et</strong>ter option. It would be important to understand the relationship b<strong>et</strong>ween packag<strong>in</strong>g format and food waste<br />
to ensure that optimisation of the product-packag<strong>in</strong>g system as a whole is achieved. In this particular scenario,<br />
while a rigid tray would be heavier (e.g., 22 g), if it delivered a reduced product wastage rate then the<br />
overall environmental impact would be lower through sav<strong>in</strong>gs <strong>in</strong> beef waste. Williams and Wikström (2011)<br />
found a similar scenario <strong>in</strong> the case of bread whereby the climate impact of bread packag<strong>in</strong>g could be doubled,<br />
if it led to a reduction <strong>in</strong> bread waste by 5 percent .<br />
The importance of consumer behaviour <strong>in</strong> a food <strong>LCA</strong> is som<strong>et</strong>imes stated (e.g. Verghese <strong>et</strong>. al., <strong>2012</strong>a)<br />
but seldom <strong>in</strong>cluded. There can be several reasons for this. The h<strong>et</strong>erogeneous behaviour, <strong>in</strong>clud<strong>in</strong>g preferences<br />
and conditions among consumers is difficult to handle along with scarce knowledge of how the design<br />
of different food products, <strong>in</strong>clud<strong>in</strong>g packag<strong>in</strong>g, affects consumer behaviour. However the broader design<br />
291
PARALLEL SESSION 3B: PACKAGING 8 th Int. Conference on <strong>LCA</strong> <strong>in</strong> the<br />
Agri-<strong>Food</strong> Sector, 1-4 Oct <strong>2012</strong><br />
literature does acknowledge the ‘script<strong>in</strong>g’ role of designed goods (Jelsma 2006). Product attributes enable<br />
or restrict consumers to act <strong>in</strong> a particular way. Jelsma posits that we may design ‘moralised products’ that<br />
encourage consumers to act <strong>in</strong> the most desirable way. For example, packag<strong>in</strong>g that reseals properly after<br />
open<strong>in</strong>g may script a reduction <strong>in</strong> waste. If one acknowledges that packag<strong>in</strong>g attributes contributes to or<br />
ameliorates food waste then more comprehensive packag<strong>in</strong>g <strong>LCA</strong>’s <strong>in</strong>clud<strong>in</strong>g food product and food waste<br />
are desirable. This requires an ‘upscal<strong>in</strong>g of the functional unit’(Verghese <strong>et</strong> al., <strong>2012</strong>a) to become the delivery<br />
of consumed food.<br />
‘Upscal<strong>in</strong>g the functional unit’ to <strong>in</strong>clude food waste presents m<strong>et</strong>hodological challenges for <strong>LCA</strong>, <strong>in</strong> that<br />
it is hard to imag<strong>in</strong>e how the user phase can be standardized to make <strong>LCA</strong> studies comparable. This also<br />
raises questions of why <strong>LCA</strong> is used. Is it to improve environmental performace or to compare products?<br />
The purpose of this paper is not to solve these problems, but to demonstrate how packag<strong>in</strong>g attributes affect<br />
consumer behaviour and food waste, and thus should <strong>in</strong>fluence the outcome from a <strong>LCA</strong> study on packag<strong>in</strong>g.<br />
Our <strong>in</strong>tention is to establish this opportunity on the agenda for the future discussion on how this knowledge<br />
should be implemented <strong>in</strong>to the <strong>LCA</strong> m<strong>et</strong>hodology for packaged food.<br />
The structure of the paper first provides a background to issues of consumer food waste and <strong>in</strong>troduces<br />
fourteen packag<strong>in</strong>g attributes that can affect food waste.Streaml<strong>in</strong>ed <strong>LCA</strong> case studies are presented to illustrate<br />
the importance of consider<strong>in</strong>g food waste and packag<strong>in</strong>g systems <strong>in</strong> conjunction with the food product.<br />
The paper closes with a discussion of possible m<strong>et</strong>hods that could assist <strong>in</strong> <strong>in</strong>clud<strong>in</strong>g food waste with<strong>in</strong> <strong>LCA</strong><br />
studies.<br />
2. Background: packag<strong>in</strong>g attributes that assist <strong>in</strong> reduc<strong>in</strong>g food waste<br />
Recent studies <strong>in</strong> the United K<strong>in</strong>gdom suggest that up to a 1/3 rd of food that is purchased is thrown away<br />
by the consumer, with 72% of the discarded food potentially avoidable, classified as either avoidable (57%)<br />
and possibly avoidable (16%) (WRAP 2009, p.5). This suggests that theor<strong>et</strong>ically 24% of all money spent on<br />
food is wasted (1/3 rd food wasted x 72% potentially avoidable). The highest wasted foods, classifed by<br />
WRAP, by category were salad items, bakery goods, fruit and veg<strong>et</strong>ables. The reasons identified as to why<br />
food was wasted are outl<strong>in</strong>ed <strong>in</strong> Table 1.<br />
Table 1. Reasons for food waste and packag<strong>in</strong>g attributes that may ameliorate. Source: Ventour (2008, p.<br />
139)<br />
Reason for food waste % weight Description Potential packag<strong>in</strong>g <strong>in</strong>terventions<br />
Inedible 36.5 Bones, hard fruits, tea bags Debone prior to packag<strong>in</strong>g<br />
Left on plate 15.7 Not eaten after the meal Portion siz<strong>in</strong>g<br />
Out of date 15.1 Past ‘used by’ or ‘best before’ Portion siz<strong>in</strong>g comb<strong>in</strong>ed with labell<strong>in</strong>g<br />
292<br />
date<br />
Mouldy 9.3 Portion siz<strong>in</strong>g, chemical protection & resealability<br />
Looked bad 8.8<br />
Smelt/tasted bad 4.5 Chemical protection & resealability<br />
Left from cook<strong>in</strong>g 4 Not served up onto plate Assist <strong>in</strong> portion siz<strong>in</strong>g<br />
In fridge/cupboard too 1.5 Portion siz<strong>in</strong>g,<br />
long<br />
Freezer burn .5 Mechanical protection<br />
Other 4.1<br />
With an understand<strong>in</strong>g of the top ten reasons for food waste and potential packag<strong>in</strong>g <strong>in</strong>terventions, we<br />
turn our attention to look<strong>in</strong>g <strong>in</strong> more d<strong>et</strong>ail at some of the numerous benefits that packag<strong>in</strong>g materials and<br />
packag<strong>in</strong>g systems play <strong>in</strong> conta<strong>in</strong><strong>in</strong>g, protect<strong>in</strong>g and deliver<strong>in</strong>g food. One of the core functions of packag<strong>in</strong>g<br />
is to protect the product. A wide range of packag<strong>in</strong>g attributes exist that may ameliorate food waste. Williams<br />
<strong>et</strong> al., (2008) identified a range of packag<strong>in</strong>g attributes that may affect food waste, see below.<br />
Packag<strong>in</strong>g should also provide for mechanical protection. The packag<strong>in</strong>g should not leak and it should<br />
protect fragile products from mechanical impact. The packag<strong>in</strong>g must resist pressure, strikes, rips and should<br />
facilitate ease of handl<strong>in</strong>g and stack<strong>in</strong>g at the r<strong>et</strong>ailer, home transport and storage and handl<strong>in</strong>g at home.<br />
Packag<strong>in</strong>g also offers physical-chemical protection of product, such as protect<strong>in</strong>g the product aga<strong>in</strong>st oxygen,<br />
water or other agents from the surround<strong>in</strong>g atmosphere. This can be achieved by <strong>in</strong>troduc<strong>in</strong>g different<br />
k<strong>in</strong>ds of barriers <strong>in</strong> the packag<strong>in</strong>g material or by a modified atmosphere. These solutions can extend the time<br />
that the product is fresh.
PARALLEL SESSION 3B: PACKAGING 8 th Int. Conference on <strong>LCA</strong> <strong>in</strong> the<br />
Agri-<strong>Food</strong> Sector, 1-4 Oct <strong>2012</strong><br />
The attribute resealability can affect physical-chemical protection by avoid<strong>in</strong>g degradation of food <strong>in</strong> an<br />
opened packag<strong>in</strong>g, for example a packag<strong>in</strong>g placed where it can <strong>in</strong>corporate odour from other food products<br />
and result <strong>in</strong> a reduction of experienced consumer quality. A b<strong>et</strong>ter resealability can also help to avoid spillage<br />
dur<strong>in</strong>g consumer handl<strong>in</strong>g <strong>in</strong> home or “on-the go”.<br />
Spillage dur<strong>in</strong>g handl<strong>in</strong>g could also be avoided by the attributes easy to open, grip, dose and empty. Packag<strong>in</strong>g<br />
is normally handled by many different consumers, children, elderly, people with reduced strength <strong>in</strong><br />
their hands, visually impaired, <strong>et</strong>c. About one-third of a group of elderly reported that spillage occurred frequently<br />
<strong>in</strong> connection with open<strong>in</strong>g (Duizer <strong>et</strong>.al., 2009). The design of the packag<strong>in</strong>g’s open<strong>in</strong>g, the shape<br />
and the surface of the packag<strong>in</strong>g can affect how much food is wasted. Packag<strong>in</strong>g that is too large or too<br />
heavy can also <strong>in</strong>crease the risk for spillage. A smooth surface can be safer to grip by us<strong>in</strong>g lam<strong>in</strong>ate on the<br />
surface, mak<strong>in</strong>g creases <strong>in</strong> board packag<strong>in</strong>g or by mak<strong>in</strong>g the surface ribbed. The attribute easy to dose may<br />
be improved by e.g. <strong>in</strong>troduc<strong>in</strong>g a spout mechanism. The eas<strong>in</strong>ess to empty can be <strong>in</strong>fluenced by surface<br />
treatment <strong>in</strong>side the package, possibility to reach all food <strong>in</strong> the package, and ability to mechanically squeeze<br />
the last food out of the packag<strong>in</strong>g.<br />
Conta<strong>in</strong>s the correct quantity is an important function of packag<strong>in</strong>g and also environmental attribute. If<br />
the food quantity <strong>in</strong> a package is higher than the turnover of the food item <strong>in</strong> the household, the risk that the<br />
food item is wasted <strong>in</strong>creases, either because of physical degradation of food, or because the product is outof-date<br />
(see below). In a Swedish food waste diary study, the households documented “too large packag<strong>in</strong>g”<br />
as one important factor for food losses (Williams <strong>et</strong>.al., <strong>2012</strong>). If the quantity of product <strong>in</strong> a package is<br />
slightly more than desired, there is a possibility that it <strong>in</strong>creases the surplus that is wasted directly, or worse,<br />
too much food is prepared and wasted after the meal. The waste of prepared food can be significant <strong>in</strong><br />
households (ibid.). As the amount of s<strong>in</strong>gle households and elderly <strong>in</strong>creases <strong>in</strong> many countries, it is especially<br />
important to offer suitable packag<strong>in</strong>g sizes to avoid food waste. Williams <strong>et</strong>. al. (<strong>2012</strong>) noted that the<br />
amount of wasted food per person was higher <strong>in</strong> households with few persons.<br />
<strong>Food</strong> saf<strong>et</strong>y/freshness <strong>in</strong>formation is also important. One of the most important reasons for food waste is<br />
consumer confusion about date cod<strong>in</strong>g. “Best before”, “Sell by” and other dat<strong>in</strong>g that <strong>in</strong>dicate the premium<br />
quality period are treated as dates when the food should be thrown away. These misconceptions cause substantial<br />
food waste, either at r<strong>et</strong>ailer (food items with “short” dates are rejected) and at home. <strong>Food</strong> waste<br />
could probably be reduced by more with b<strong>et</strong>ter <strong>in</strong>formation on the packag<strong>in</strong>g that expla<strong>in</strong>s the dat<strong>in</strong>g system,<br />
if and when the food item could be unhealthy, and how the consumer could judge the quality of the food<br />
item. Introduction of smart labels or ‘<strong>in</strong>telligent <strong>in</strong>dicators’ that <strong>in</strong>dicate when the food item is safe/of high<br />
quality is also a possibility (WRAP 2007, p. 37). Other <strong>in</strong>formation channels other than packag<strong>in</strong>g could be<br />
used but this provides a disconnect with the actual packaged product that the consumer purchases.<br />
This list is by no means compl<strong>et</strong>e, however, it demonstrates that there are many packag<strong>in</strong>g attributes that<br />
<strong>in</strong>fluence consumer behaviour and food waste. In the “move towards susta<strong>in</strong>able food packag<strong>in</strong>g, the relational<br />
complexity b<strong>et</strong>ween the role of packag<strong>in</strong>g and reduced food waste needs to be <strong>in</strong>cluded beyond just<br />
extend<strong>in</strong>g shelf life to consider user behaviour” (Verghese <strong>et</strong> al., <strong>2012</strong>, p 402). The follow<strong>in</strong>g section <strong>in</strong>troduces<br />
case studies of food waste scenarios quantified though streaml<strong>in</strong>ed <strong>LCA</strong>.<br />
3. Case studies of food waste scenarios quantified though streaml<strong>in</strong>ed <strong>LCA</strong><br />
The environmental impact of packag<strong>in</strong>g can be assessed <strong>in</strong> a streaml<strong>in</strong>ed fashion by add<strong>in</strong>g the life cycle<br />
impacts of the wasted food to the lifecycle impact of the packag<strong>in</strong>g as outl<strong>in</strong>ed <strong>in</strong> the follow<strong>in</strong>g formula:<br />
Impact (i) = packag<strong>in</strong>g (p) + food wasted (fw)<br />
The functional unit shifts to become ‘the delivery of consumed food per kg’, attribut<strong>in</strong>g the environmental<br />
impact of the unconsumed food to the total product-packag<strong>in</strong>g system. To compl<strong>et</strong>e the formula requires<br />
data of three <strong>in</strong>terrelated elements.:<br />
(p) Input and outputs of process related to packag<strong>in</strong>g type<br />
(f) Input and outputs of processes related to food production from farm to fork<br />
(w) The percentage of food wasted per packag<strong>in</strong>g type (w =% wasted)<br />
Life cycle data is readily available on packag<strong>in</strong>g and food <strong>in</strong> a streaml<strong>in</strong>ed form. It is well known that different<br />
food types have differ<strong>in</strong>g environmental impacts and characteristics. For example, cattle require more<br />
feed per edible weight than poultry and emit m<strong>et</strong>hane from the foregut with a higher global warm<strong>in</strong>g potential<br />
(GWP) than mono gastric livestock (pigs and chickens) that <strong>in</strong> turn have a higher GWP than veg<strong>et</strong>ables<br />
(Eady, <strong>et</strong> al., 2011, p.1). Peer reviewed <strong>LCA</strong> and Environmental Product Disclosure (EPD) data is widely<br />
293
PARALLEL SESSION 3B: PACKAGING 8 th Int. Conference on <strong>LCA</strong> <strong>in</strong> the<br />
Agri-<strong>Food</strong> Sector, 1-4 Oct <strong>2012</strong><br />
available <strong>in</strong> the public doma<strong>in</strong> on the majority of food types. For example the authors identified CO2-eq data<br />
for 200+ foods from 62 studies, Audsley <strong>et</strong> al., (2009) study provide environmental impact data on 100+<br />
foods <strong>in</strong> the United K<strong>in</strong>gdom, and the International EPDsystem (<strong>2012</strong>) lists 44 EPD's from a range of brands.<br />
With respect to packag<strong>in</strong>g streaml<strong>in</strong>ed tools, the Packag<strong>in</strong>g Impact Quick Evaluation Tool (PIQET) enables<br />
the environmental impacts of packag<strong>in</strong>g types to be quickly evaluated and re-run with changed packag<strong>in</strong>g<br />
system specifications (Verghese <strong>et</strong> al., 2010).<br />
The part of the equation that lacks sound data is the percentage of food wasted per packag<strong>in</strong>g type. Sensitivity<br />
analysis can be constructed model<strong>in</strong>g various ‘scenarios of use’ to measure the viability of <strong>in</strong>creased<br />
packag<strong>in</strong>g and possible reduced food waste. Two case studies are presented below based on recent lived<br />
experience of the authors. While acknowledg<strong>in</strong>g that this is not a valid sample, it is viewed to be <strong>in</strong>dicative<br />
of the impact that food waste may have.<br />
3.1. Case Study 1: rice packag<strong>in</strong>g<br />
Baker <strong>et</strong> al., estimated that Australians waste over $550 million <strong>in</strong> rice and pasta each year (2009, p. 8),<br />
with the Australian state of New South Wales (NSW) Love <strong>Food</strong> Hate Waste surveys <strong>in</strong>dicat<strong>in</strong>g that 1/3 of<br />
recipiants found it hard to estimate how much to cook per person (DECCW 2009, p.2). Rice is a dish that<br />
doubles <strong>in</strong> size when cooked, therefore mak<strong>in</strong>g judgements on how much to cook difficult. Two packag<strong>in</strong>g<br />
scenarios for rice are presented: i) uses a pre-cooked 250 g rice packag<strong>in</strong>g <strong>in</strong> a plastic lam<strong>in</strong>ate flexible<br />
pouch and ii) a bulk purchase 1 kg bag (Table 2).<br />
Table 2. Two types of rice packag<strong>in</strong>g compared<br />
294<br />
Packag<strong>in</strong>g (p) = 8 g LDPE pouch a<br />
= 8 x 2.92 g CO2-eq/g<br />
= 10 g LDPE pack<strong>et</strong> a<br />
= 10 x 2.92 g CO2-eq/g<br />
<strong>Food</strong> impact (f)<br />
= 23.4 g CO2-eq<br />
= 250 g rice<br />
= 29.2 g CO2-eq<br />
b<br />
= 250 x 6.4 g CO2-eq/g<br />
= 1 600 g CO2-eq<br />
= 1000 g rice #<br />
Waste (w)<br />
= 1 000 x 6.4 g CO2-eq/g<br />
= 6 400 g CO2-eq<br />
c = 2% Residual rice left <strong>in</strong> pack = 20% rice (cooked to much)<br />
Impact/pack = p + fw<br />
= p + fw<br />
= 23.4 + (1 600 x 2%)<br />
= 29.2 + (6 400 x 20%)<br />
= 55.4 g CO2-eq /250 g pack = 1 309.2 g CO2-eq/1 kg pack<br />
Impact/kg d =221.6 g CO2-eq/kg = 1 309.2 g CO2-eq/kg<br />
a. impact factors from Eco<strong>in</strong>vent database (<strong>2012</strong>) us<strong>in</strong>g the Australian impact m<strong>et</strong>hod<br />
b. . Carlsson-Kanyama (1998)<br />
c. emissions from the biodegradation of the wasted food were not considered <strong>in</strong> this model, if <strong>in</strong>cluded the emission factor for food<br />
waste would be higher<br />
d. functional unit of packag<strong>in</strong>g is the ‘delivery of consumed food per kg’<br />
The <strong>in</strong>clusion of food waste substantially changes the outcomes of the environmental impact. The precooked<br />
rice appears preferable with an environmental impact 6 times less than the bulk pack<strong>et</strong> once food<br />
waste is considered. If waste is not considered the pre-cooked pack<strong>et</strong> has a higher environmental impact. As<br />
the pre-cooked pack<strong>et</strong> conta<strong>in</strong>s the correct quantity it is viewed to be easy to dose. This should not rubber<br />
stamp smaller portions as always be<strong>in</strong>g preferred, <strong>in</strong>stead the results <strong>in</strong>dicate challenges for packag<strong>in</strong>g designers<br />
to redesign rice packag<strong>in</strong>g to make it easy to dose and by elim<strong>in</strong>at<strong>in</strong>g the potential for over portion<strong>in</strong>g.<br />
This could be achieved by a number of design <strong>in</strong>novations <strong>in</strong> either visual communication and or packag<strong>in</strong>g<br />
design so that rice is dosed <strong>in</strong> appropriate amounts <strong>in</strong>clud<strong>in</strong>g clearly illustrat<strong>in</strong>g the relationship b<strong>et</strong>ween<br />
uncooked rice and cooked rice.<br />
3.2. Case Study 2: yogurt packag<strong>in</strong>g<br />
Youghurt once opened has a limited shelf life with<strong>in</strong> the refrigerator. The two packag<strong>in</strong>g types: i) 6 pack<br />
175 g connected tubs of yogurts are purchased <strong>in</strong> comparison to ii) one large 900 g polypropelene
PARALLEL SESSION 3B: PACKAGING 8 th Int. Conference on <strong>LCA</strong> <strong>in</strong> the<br />
Agri-<strong>Food</strong> Sector, 1-4 Oct <strong>2012</strong><br />
tubErreur ! Source du renvoi <strong>in</strong>trouvable.Erreur ! Source du renvoi <strong>in</strong>trouvable.Erreur ! Source du<br />
renvoi <strong>in</strong>trouvable.. The authors experience is that once opened the large yogurt needs be consumed <strong>in</strong> a<br />
timeframe that is not always m<strong>et</strong>, where as the <strong>in</strong>dividual pack<strong>et</strong>s are consumed <strong>in</strong> one serv<strong>in</strong>g.<br />
Table 4. Two types of yogurt packag<strong>in</strong>g compared<br />
Packag<strong>in</strong>g (p) = 6 x 7 g PS a tubs<br />
= 42 x 3.97 g CO2-eq/g<br />
= 35 g PP a tub & lid + 2 g alum<strong>in</strong>ium a foil<br />
= 35 x 2.90 g CO2-eq/g + 2 x 12.57 g CO2-eq/g<br />
<strong>Food</strong> impact (f)<br />
= 166.7 g CO2-eq<br />
= 6 x 175 g yogurt<br />
= 126.7 g CO2-eq<br />
b<br />
= 900 g yogurt<br />
= 1 050 x 1.22 g CO2-eq/g<br />
= 1 281 g CO2-eq<br />
b<br />
Waste (w)<br />
= 900 x 1.22 g CO2-eq/g<br />
= 1 098 g CO2-eq<br />
c = 5% residual yogurt <strong>in</strong> pack = 30% yogurt (mouldy <strong>in</strong> fridge)<br />
Impact/pack = p + fw<br />
= p + fw<br />
= 166.7 + (1 281 x 5%) = 126.7 + (1 098 x 30%)<br />
= 230.8 g CO2-eq /6 pack = 456.1 g CO2-eq/900 g tub<br />
Impact/kg d = 219.8 g CO2-eq/kg = 506.7 g CO2-eq/kg<br />
a. impact factors from Eco<strong>in</strong>vent database (<strong>2012</strong>) us<strong>in</strong>g the Australian impact m<strong>et</strong>hod<br />
b. . L<strong>in</strong>denthal <strong>et</strong> al., (2010)<br />
c. emissions from the biodegradation of the wasted food were not considered <strong>in</strong> this model, if <strong>in</strong>cluded the emission factor for food<br />
waste would be higher<br />
d. functional unit of packag<strong>in</strong>g is the ‘delivery of consumed food per kg’<br />
The results <strong>in</strong>dicate that once food waste is <strong>in</strong>cluded the environmental impact differ substantially. In the<br />
yogurt example, the bulk 900g pack<strong>et</strong> has a 24% lower GWP than the 6 pack when viewed <strong>in</strong> isolation of<br />
food waste, and a 230% higher GWP when <strong>in</strong>cluded <strong>in</strong> the above scenario. Appropriate portion siz<strong>in</strong>g that<br />
reduce food waste has a dom<strong>in</strong>ant impact, even with a food type such as yogurt that has a relatively low<br />
GWP <strong>in</strong> comparison to meat based products.<br />
From a design perspective it is also possible to foresee that packag<strong>in</strong>g design to reduce food waste should<br />
not always result <strong>in</strong> an <strong>in</strong>crease <strong>in</strong> the environmental impact of packag<strong>in</strong>g <strong>in</strong> isolation. Traditional packag<strong>in</strong>g<br />
design solutions such as lightwieght<strong>in</strong>g and material selection could apply to make the 6 pack less material<br />
<strong>in</strong>tense than the 900 g tub.<br />
4. Discussion: Possible means to <strong>in</strong>tegrate food waste <strong>in</strong>to <strong>LCA</strong><br />
The results of the rice and yogurt case studies <strong>in</strong>dicate scenarios where <strong>in</strong>creases <strong>in</strong> packag<strong>in</strong>g may reduce<br />
the overall environmental impact by avoid<strong>in</strong>g food waste. The most critical data gap to successfully<br />
compl<strong>et</strong><strong>in</strong>g replicable <strong>LCA</strong>’s is <strong>in</strong> estimat<strong>in</strong>g the amount of food wasted. A very small variation <strong>in</strong> the percentage<br />
of food wasted that has a high GWP potential like red meat substantially differs the environmental<br />
impact of packag<strong>in</strong>g once food waste is <strong>in</strong>cluded. It is also acknowledge that packag<strong>in</strong>g is only one of many<br />
ways that food waste could be reduced. In a recent stakeholder engagement forum <strong>in</strong> Australia brand owners<br />
identified that they rarely compl<strong>et</strong>e user trials on how packag<strong>in</strong>g is actually used <strong>in</strong> the home (Verghese <strong>et</strong><br />
al., <strong>2012</strong>b). To test the success of alternate packag<strong>in</strong>g scenarios requires ‘additional fieldwork and empirical<br />
research outside the traditional boundaries of <strong>LCA</strong>’ (Verghese, <strong>et</strong> al., <strong>2012</strong>a, p. 403). Understand<strong>in</strong>g food<br />
waste <strong>in</strong> the home is a fundamental first step to improv<strong>in</strong>g the resolution of waste estimates. Multiple sensitivities<br />
can quickly be run by alter<strong>in</strong>g the percentage wasted and packag<strong>in</strong>g type to see the impact of reduced<br />
wastage and they can be used to develop hypothesis that require empirical test<strong>in</strong>g.<br />
The packag<strong>in</strong>g attributes that <strong>in</strong>fluence food waste elaborated <strong>in</strong> section 2 provide a useful guide for<br />
packag<strong>in</strong>g designers to assist them <strong>in</strong> design<strong>in</strong>g packag<strong>in</strong>g to faciliate reduced food waste. By tak<strong>in</strong>g a service<br />
perspective the focus can move from the product itself, to the process it is used for (Vargo and Lush,<br />
2004; Edvardsson <strong>et</strong> al., 2005). The product can be described by attributes, each attribute provid<strong>in</strong>g prerequisites<br />
for the service. Each packag<strong>in</strong>g attribute assists to script <strong>in</strong>dividual behaviour and experiences, and<br />
potentially the environmental outcome e.g. , the amount of food waste generated. The consumer <strong>in</strong>teraction<br />
with the product depends on the design of the product, the consumer preferences and experiences, and the<br />
context of the consumer (Löfgren, 2006).<br />
295
PARALLEL SESSION 3B: PACKAGING 8 th Int. Conference on <strong>LCA</strong> <strong>in</strong> the<br />
Agri-<strong>Food</strong> Sector, 1-4 Oct <strong>2012</strong><br />
For example, consider the attribute conta<strong>in</strong> the desired quantity. If the offered quantity of fresh bread does<br />
not agree with the desired, the service of eat<strong>in</strong>g fresh bread may not be used for the entire piece of bread,<br />
some may be frozen, some may be eaten “old”, and some may be wasted, depend<strong>in</strong>g on consumer preferences<br />
and behaviour. Therefore, the size of the bread can affect the consumer behaviour and the amount of<br />
food that is discharged, and thus the environmental outcome. In Australia Bakers Delight <strong>in</strong>troduced small<br />
block loaves of bread provide a simple alternative to the full loaf of bread – potentially reduc<strong>in</strong>g associated<br />
food waste for s<strong>in</strong>gle person or small households (Verghese <strong>et</strong> al., 2011). By understand<strong>in</strong>g the consumer<br />
preferences and behaviour the services that are provided from a specific packag<strong>in</strong>g attribute can be designed<br />
to b<strong>et</strong>ter me<strong>et</strong> the consumer needs and facilitate consumers to waste less food.<br />
5. Conclusion<br />
There are many packag<strong>in</strong>g attributes that <strong>in</strong>fluence consumer behaviour and the portion of food that is<br />
wasted. A small change <strong>in</strong> the percentage of food wasted significantly affects the outcome of an <strong>LCA</strong> of food<br />
products. Due to the high environmental impact of the food sector, it is important to <strong>in</strong>clude these aspects <strong>in</strong><br />
the <strong>LCA</strong> of food products, especially when the results are used for decision-mak<strong>in</strong>g about packag<strong>in</strong>g. There<br />
is certa<strong>in</strong>ly a long journey ahead until this can be done <strong>in</strong> a standardized way. It will be necessary for the<br />
food packag<strong>in</strong>g supply cha<strong>in</strong> <strong>in</strong>clud<strong>in</strong>g food producers, manufacturers, brandowners and r<strong>et</strong>ailers to <strong>in</strong>clude<br />
both qualitative and quantitative <strong>in</strong>formation about how different packag<strong>in</strong>g attributes <strong>in</strong>fluence consumer<br />
behaviour and food waste. It will also be important to consider and <strong>in</strong>clude consumer behaviour <strong>in</strong> <strong>LCA</strong>studies<br />
of food products to take <strong>in</strong>to account the environm<strong>et</strong>nal impacts of the 30% of bought food that is<br />
ultimately wasted. If a <strong>LCA</strong> study is used for packag<strong>in</strong>g development, or for packag<strong>in</strong>g regulations, the<br />
packag<strong>in</strong>g function to avoid food waste certa<strong>in</strong>ly should be <strong>in</strong>cluded to <strong>in</strong>form b<strong>et</strong>ter decisions. In such studies,<br />
the proper functional unit should be s<strong>et</strong> to “consumed food” rather than “delivered food” or “bought<br />
food”. The assumptions of how different packag<strong>in</strong>g attributes affect food waste should also be clearly stated<br />
and discussed.<br />
6. References<br />
APCC. 2010. Australian Packag<strong>in</strong>g Covenant – A commitment by governments and <strong>in</strong>dustry to the susta<strong>in</strong>able design, use and recovery<br />
of packag<strong>in</strong>g. Australian Packag<strong>in</strong>g Covenant Council, Amended 10 October 2011.<br />
Audsley, E., Brander, M., Chatterton, J., Murphy-Bokern, D., Webster, C., and Williams, A. 2009. “How low can we go? An assessment<br />
of greenhouse gas emissions from the UK food system and the scope to reduce them by 2050”. FCRN-WWF-UK.<br />
Baker, D., J. Fear and R. Denniss. 2009. What a waste: An analysis of household expenditure on food. Policy Brief No. 6. Canberra,<br />
The Australia Institute.<br />
Carlsson-Kanyama, A. 1998. "Climate change and di<strong>et</strong>ary choices—how can emissions of green-house gases from food consumption<br />
be reduced?" <strong>Food</strong> Policy 23(3/4): 277-193.)<br />
DECCW. 2009. "<strong>Food</strong> Waste Avoidance Benchmark Study 2009." R<strong>et</strong>rieved 12/10/2010, 2010, from<br />
http://www.lovefoodhatewaste.nsw.gov.au/portals/0/kit/pr<strong>in</strong>t/10242FWAFactshe<strong>et</strong>CMYK_pr<strong>in</strong>t.pdf.<br />
Duizer, L.M., Robertson, T., Han, J., 2009. Requirements for packag<strong>in</strong>g from an age<strong>in</strong>g consumer's perspective. Packag<strong>in</strong>g Technology<br />
and Science. Vol 22, 4, 187-197<br />
Eady, S. J., P. Sanguansri, R. Bektash, B. Ridoutt, L. Simons and P. Swiergon. 2011. Carbon foot-pr<strong>in</strong>t for Australian agricultural<br />
products and downstream food products <strong>in</strong> the supermark<strong>et</strong>. A<strong>LCA</strong>S Conference. Melbourne, A<strong>LCA</strong>S.<br />
Edvardsson, B., Gustafsson, A., Roos, I., 2005. Service Portraits <strong>in</strong> Service Research – A Critical Review, International Journal of<br />
Service Industry Management. Vol. 16, No. 1, pp. 107-121.<br />
Engström, R., Carlsson-Kanyama, A., 2004. <strong>Food</strong> losses <strong>in</strong> food service <strong>in</strong>stitutions: Examples from Sweden. <strong>Food</strong> Policy. Vol. 29,<br />
No 3, pp. 203-294.<br />
European Commission. COM(2006) 767 f<strong>in</strong>al. 2006. Report from the Commission to the Council and the European Parliament on<br />
the implementation of Directive 94/62/EC on packag<strong>in</strong>g and packag<strong>in</strong>g waste and its impact on the environment, as well as the<br />
function<strong>in</strong>g of the <strong>in</strong>ternal mark<strong>et</strong>.<br />
Eco<strong>in</strong>vent .<strong>2012</strong>. Eco<strong>in</strong>vent Database v2.2. Swiss Centre for Life Cycle Inventories. Hamburg.<br />
European Council. 1994. Directive 94/62/EC on packag<strong>in</strong>g and packag<strong>in</strong>g waste. Official Journal of the European Union.<br />
31/12/1994; L365:0010 - 0023.<br />
Hammond, G. and C. Jones. 2011. Inventory of Carbon & Energy (ICE). University of Bath. Department of Mechanical Eng<strong>in</strong>eer<strong>in</strong>g.<br />
Bath. ICE V2.0.<br />
Hanssen, O.J., 1998. Environmental impacts of product systems <strong>in</strong> a life cycle perspective: a survey of five product types based on<br />
life cycle assessments studies. Journal of Cleaner Production. Vol. 6, pp. 299-311.<br />
Jelsma, J. 2006. Design<strong>in</strong>g ‘moralized’ products. User Behavior and Technology Development. P.-P. Verbeek and A. Slob. N<strong>et</strong>herlands,<br />
Spr<strong>in</strong>ger 221-231.<br />
L<strong>in</strong>denthal, T., T. Markut, S. Hörtenhuber and G. Rudolph. 2010. Greenhouse Gas Emissions of Organic and Conventional <strong>Food</strong>stuffs<br />
<strong>in</strong> Austria.<br />
Löfgren, M., 2006. The leader of the pack. Faculty of Economic Sciences, Communication and IT. Karlstad, Karlstad University.<br />
ISBN: 91-7063-089-5.<br />
Löfgren, M., Witell, L., 2005. Kano's Theory of Attractive Quality and Packag<strong>in</strong>g. Quality Management Journal. Vol. 12, pp. 7-20.<br />
Quested, T., Johnson, H., 2009. Household food and dr<strong>in</strong>k waste <strong>in</strong> the UK. wrap. Banbury UK. 2009. ISBN: 1-84405-430-6.<br />
296
PARALLEL SESSION 3B: PACKAGING 8 th Int. Conference on <strong>LCA</strong> <strong>in</strong> the<br />
Agri-<strong>Food</strong> Sector, 1-4 Oct <strong>2012</strong><br />
Roy, P., Nei, D., Orikasa, T., Xu Q. and Okadome, H. 2009. A review of life cycle assessment (<strong>LCA</strong>) on some food products. Journal<br />
of <strong>Food</strong> Eng<strong>in</strong>eer<strong>in</strong>g 90, 1-10.<br />
Vargo, S.L, Lusch, R.F. 2004. Evolv<strong>in</strong>g to a New Dom<strong>in</strong>ant Logic for Mark<strong>et</strong><strong>in</strong>g, Journal of Mark<strong>et</strong><strong>in</strong>g, Vol. 68, No. 1, pp. 1-17.<br />
Ventour, L. 2008. The food we waste. WRAP. Banbury UK. ISBN: 1-84405-383-0.<br />
Verghese, K., R. Horne and A. Carre. 2010. "PIQET: the design and development of an onl<strong>in</strong>e 'streaml<strong>in</strong>ed' <strong>LCA</strong> tool for susta<strong>in</strong>able<br />
packag<strong>in</strong>g design decision support." International Journal of Life Cycle Assessment 15(6): 608-620.<br />
Verghese, K., H. Lewis, S. Clune, S. Lockrey and P. Crittenden 2011. AFGC future of packag<strong>in</strong>g background paper. Melbourne,<br />
RMIT University, Helen Lewis Research, and Susta<strong>in</strong>able Bus<strong>in</strong>ess.<br />
Verghese, K., S. Lockrey, S. Clune and D. Sivaraman. <strong>2012</strong>a. Life cycle assessment of food and beverage packag<strong>in</strong>g. Innovative and<br />
susta<strong>in</strong>able food and beverage packag<strong>in</strong>g. K. L. Yam. Cambridge, Woodhead.<br />
Verghese, K., Clune, S., Lockrey, S., Lewis, H and Crittenden, P. <strong>2012</strong>b. Future of Packag<strong>in</strong>g White Paper; Executive Summary<br />
(April), Australian <strong>Food</strong> and Grocery Council (AFGC), Canberra, Australia<br />
Williams, H., Wikström, F., 2011. Environmental impact of packag<strong>in</strong>g and food losses <strong>in</strong> a life cycle perspective: a comparative<br />
analysis of five food items. Journal of Cleaner Production. 19, pp. 43-48.<br />
Williams, H., Wikström, F., Löfgren, M., 2008. A life-cycle perspective on environmental effects of customer focused packag<strong>in</strong>g<br />
development. Journal of Cleaner Production 16, pp. 853-859.<br />
Williams, H., Wikström, F., Otterbr<strong>in</strong>g, T., Löfgren, M., Gustafsson, A., <strong>2012</strong>. Reasons for household food waste with special attention<br />
to packag<strong>in</strong>g. Journal of Cleaner Production 24 pp.141-148<br />
WRAP. 2007. "M<strong>in</strong>imisation of Household <strong>Food</strong> Waste." R<strong>et</strong>rieved 15/12/2011, 2011, from<br />
http://www.wrap.org.uk/downloads/WRAP_<strong>Food</strong>_Waste_M<strong>in</strong>imisation_adp_-_27_10_071.7aaf9619.4672.pdf.<br />
WRAP. 2009. Household <strong>Food</strong> and Dr<strong>in</strong>k Waste <strong>in</strong> the UK. F<strong>in</strong>al Report. H. J. Tom Quested. Oxon, Waste & Resources Action<br />
Programme.<br />
297
PARALLEL SESSION 3B: PACKAGING 8 th Int. Conference on <strong>LCA</strong> <strong>in</strong> the<br />
Agri-<strong>Food</strong> Sector, 1-4 Oct <strong>2012</strong><br />
298<br />
Comparative <strong>LCA</strong> of fruit and veg<strong>et</strong>able packag<strong>in</strong>g trays<br />
Jean-François Ménard 1,* , Claude Belley 1 , Réjean Samson 1 , Dom<strong>in</strong>ique Maxime 1 , Mathieu Roberge 2<br />
1 CIRAIG, École Polytechnique de Montréal (QC, Canada)<br />
2 Cascades Speciality Products Group, Consumer Product Packag<strong>in</strong>g – CSP, CPP (QC, Canada)<br />
Correspond<strong>in</strong>g author. E-mail: jean-francois.menard@polymtl.ca<br />
ABSTRACT<br />
Seven types of fruits and veg<strong>et</strong>ables r<strong>et</strong>ail packag<strong>in</strong>g trays currently used <strong>in</strong> Quebec are compared cradle-to-grave: polystyrene foam<br />
(XPS, 100% virg<strong>in</strong>), oriented polystyrene (OPS, 90% virg<strong>in</strong>), poly<strong>et</strong>hylene terephthalate (PET, 90% virg<strong>in</strong>, and RPET, 100% recycled),<br />
polylactide polymer (PLA, 90% virg<strong>in</strong>), polypropylene (PP, 90% virg<strong>in</strong>), and molded pulp (MP, 100% recycled). Ma<strong>in</strong> contributors<br />
to potential impacts throughout the entire life cycles of the trays are l<strong>in</strong>ked to production processes (raw materials and<br />
manufactur<strong>in</strong>g energy production). PLA, PET and PP post the worst performances while XPS and MP have the best overall performances.<br />
The ma<strong>in</strong> ass<strong>et</strong> of the XPS tray lies <strong>in</strong> its significantly lower weight despite the virg<strong>in</strong> material and the impact from tray production.<br />
Seven sensitivity analyses are performed on key param<strong>et</strong>ers, confirm<strong>in</strong>g the robustness of <strong>in</strong>itial f<strong>in</strong>d<strong>in</strong>gs. Plastic systems are<br />
very sensitive to the electricity grid mix used at the production step.<br />
Keywords: packag<strong>in</strong>g, fruits and veg<strong>et</strong>ables, plastics, PLA, moulded pulp, life cycle impact assessment<br />
1. Introduction<br />
The Consumer Product Packag<strong>in</strong>g sector is a member of the Cascades Specialty Products Group that designs,<br />
manufactures and mark<strong>et</strong>s packag<strong>in</strong>g products made of moulded pulp and plastic, some of which are<br />
100% recyclable. It covers the food, hardware and consumer product <strong>in</strong>dustries. Its diversified portfolio also<br />
<strong>in</strong>cludes site furnish<strong>in</strong>gs and construction materials made of 100% recycled plastic. In an effort to reduce its<br />
potential environmental impacts, CSPG, CPP is currently carry<strong>in</strong>g out <strong>in</strong>ternal evaluations of the environmental<br />
performances of its products. The company seeks to compare its own products and take a proactive<br />
stance given the <strong>in</strong>creased number of green procurement policies of bus<strong>in</strong>ess and <strong>in</strong>stitutional buyers. S<strong>in</strong>gleuse<br />
packag<strong>in</strong>g trays are widely used <strong>in</strong> Quebec (Canada) for the r<strong>et</strong>ail sale of fruits and veg<strong>et</strong>ables.Earlier<br />
studies compar<strong>in</strong>g bio-based and hydrocarbon polymer res<strong>in</strong>s for food packag<strong>in</strong>g generally showed no clear<br />
environmental preference but rather trade-offs when all the environmental <strong>in</strong>dicators are considered (Athena<br />
Institute, 2006 ; D<strong>et</strong>zel and Kruger, 2006). In addition, procurement logistic and the transport of the packag<strong>in</strong>g<br />
conta<strong>in</strong>ers’ are key param<strong>et</strong>ers with<strong>in</strong> the North american context (Madival <strong>et</strong> al., 2009). This study aims<br />
to carry out a comparative life cycle assessment of the various materials currently used to manufacture the<br />
trays, <strong>in</strong>clud<strong>in</strong>g moulded pulp trays. The results will enable CSPG, CPP to enhance its understand<strong>in</strong>g of the<br />
potential environmental impacts associated with the life cycle of their food trays sold <strong>in</strong> Quebec and provide<br />
answers that will help the company reduce its impacts and position itself to me<strong>et</strong> mark<strong>et</strong>-driven susta<strong>in</strong>ability<br />
requirements.<br />
2. M<strong>et</strong>hods<br />
2.1. Goal and scope, and functional unit<br />
The goal of this study is to establish and compare the environmental profiles of the compl<strong>et</strong>e life cycle of<br />
various s<strong>in</strong>gle-use fruit and veg<strong>et</strong>able packag<strong>in</strong>g trays sold <strong>in</strong> Quebec (Canada) by CSP, CPP. The compared<br />
options are actual trays that are, or were <strong>in</strong> the recent past, manufactured by CSPG, CPP and available on the<br />
mark<strong>et</strong>; the extruded polystyrene foam currently be<strong>in</strong>g the most used one. The 10% recycled content for<br />
some of the trays represents post-<strong>in</strong>dustrial recycl<strong>in</strong>g (CSPG, CPP estimate).<br />
The functional unit is to ”Conta<strong>in</strong> and permit the stack<strong>in</strong>g and r<strong>et</strong>ail<strong>in</strong>g of an amount of fruits or veg<strong>et</strong>ables<br />
that can be conta<strong>in</strong>ed <strong>in</strong> a tray volume of 52 cubic <strong>in</strong>ches to consumers <strong>in</strong> Québec <strong>in</strong> 2010.” The volume<br />
refers to a tray that measures 8.38 <strong>in</strong>ches <strong>in</strong> length, 5.88 <strong>in</strong>ches <strong>in</strong> width and 1.06 <strong>in</strong>ches <strong>in</strong> height.<br />
The reference flows are the amounts of product necessary to deliver the functional unit – one tray of each<br />
type. The characteristics of each tray are presented <strong>in</strong> Table 1.
PARALLEL SESSION 3B: PACKAGING 8 th Int. Conference on <strong>LCA</strong> <strong>in</strong> the<br />
Agri-<strong>Food</strong> Sector, 1-4 Oct <strong>2012</strong><br />
Table 1. Studied food tray options<br />
System Tray Weight (g)<br />
XPS 100% virg<strong>in</strong> extruded polystyrene foam 10.45<br />
OPS 90% virg<strong>in</strong>-10% recycled oriented polystyrene 20.85<br />
PET 90% virg<strong>in</strong>-10% recycled poly<strong>et</strong>hylene terephthalate 27.15<br />
RPET 100% recycled PET 27.15<br />
PLA 90% virg<strong>in</strong>-10% recycled polylactide polymer 25.20<br />
PP 90% virg<strong>in</strong>-10% recycled polypropylene 19.80<br />
MP 100% recycled moulded pulp 20.00<br />
2.2. System boundaries and assumptions<br />
The study <strong>in</strong>cludes all of the flows and processes <strong>in</strong>volved <strong>in</strong> the production, distribution and end-of-life<br />
stages of the trays, <strong>in</strong>clud<strong>in</strong>g the production and transport of the resources consumed and the management of<br />
the waste generated at each stage (Figure 1).<br />
Preproduction generally <strong>in</strong>cludes plastic (granulates) and old newspapers procurement. Depend<strong>in</strong>g on the<br />
type of raw material, the follow<strong>in</strong>g processes are <strong>in</strong>cluded:<br />
Virg<strong>in</strong> plastic: Oil extraction, ref<strong>in</strong>ement and transport, polymerisation and granulation.<br />
Recycled plastic: Transport of the used plastics and production of the recycled plastic granules (electricity<br />
consumption only).<br />
PLA: Corn production, starch extraction, dextrose and lactic acid production, polymerisation and<br />
granulation.<br />
Recycled newspapers: Transport of the old newspapers and production of the recycled pulp (electricity<br />
consumption at CSP, CPP plant only).<br />
The production sub-system consists of the various stages that occur at the tray manufactur<strong>in</strong>g site (CSPG,<br />
CPP plant <strong>in</strong> Québec). It therefore <strong>in</strong>cludes the operation of the manufactur<strong>in</strong>g <strong>in</strong>frastructure for the extrusion<br />
and thermoform<strong>in</strong>g (only modeled as an electricity consumption) of the plastic trays or the mould<strong>in</strong>g<br />
and dry<strong>in</strong>g of the MP trays (only modeled as a consumption of electricity and heat from natural gas), and the<br />
f<strong>in</strong>ished product packag<strong>in</strong>g (LDPE bags for the XPS tray and the same corrugated board boxes for the other<br />
plastic trays and a slightly heavier corrugated board box for the MP tray).<br />
The distribution sub-system <strong>in</strong>cludes the transport of the trays from the production sites to the r<strong>et</strong>ailers.<br />
F<strong>in</strong>ally, the use sub-system <strong>in</strong>cludes the packag<strong>in</strong>g of the fruits and veg<strong>et</strong>ables <strong>in</strong> the tray (no impacts associated<br />
with this activity) and their transport to the consumer’s house. The end-of-life sub-system <strong>in</strong>cludes<br />
the end-of-life management of the trays and the various packag<strong>in</strong>g items used <strong>in</strong> the life cycle and the transports<br />
b<strong>et</strong>ween the consumer and waste management sites.<br />
Figure 1. Boundaries of the product system. (Note: the European flag only means that the processes were<br />
modeled with European data from the eco<strong>in</strong>vent database, whereas they are most probably produced <strong>in</strong> North<br />
America)<br />
299
PARALLEL SESSION 3B: PACKAGING 8 th Int. Conference on <strong>LCA</strong> <strong>in</strong> the<br />
Agri-<strong>Food</strong> Sector, 1-4 Oct <strong>2012</strong><br />
The follow<strong>in</strong>g elements were excluded from the system boundaries: the transport of the plastic granulates<br />
from the production sites to the plastic she<strong>et</strong> extrusion sites for the plastic trays other than the XPS one; the<br />
warehous<strong>in</strong>g and handl<strong>in</strong>g of the trays by r<strong>et</strong>ailers (and wholesalers or other <strong>in</strong>termediaries, if applicable);<br />
the production and transport of the plastic film used to package the fruits and veg<strong>et</strong>ables; human activities<br />
(e.g. employees’ daily travel); the life cycles of the capital goods (e.g., roads, production equipment), with<br />
the exception of those already <strong>in</strong>cluded <strong>in</strong> the eco<strong>in</strong>vent data modules used <strong>in</strong> the <strong>LCA</strong> model. In addition,<br />
the materials recovered by the studied systems (plastic scraps and old newspapers) are considered to be resources<br />
consumed by these systems (and not as waste generated by other systems). The recovery (i.e. collection<br />
and recycl<strong>in</strong>g) processes are therefore entirely attributed to the use of these materials and the studied<br />
systems. However, <strong>in</strong> the same fashion, the recovery of the trays at the end of their service lives is therefore<br />
not attributed to the studied systems.<br />
General assumptions perta<strong>in</strong><strong>in</strong>g to the studied systems are:<br />
The OPS and XPS granulates production processes were considered identical;<br />
The tray manufactur<strong>in</strong>g (only the electricity consumption for the she<strong>et</strong> extrusion and thermoform<strong>in</strong>g<br />
was considered) was assumed to be the identical for all plastic trays, per kilogram of tray, based on<br />
the primary data obta<strong>in</strong>ed for the XPS tray from CSPG, CPP;<br />
The truck transport dur<strong>in</strong>g the distribution of the trays to the r<strong>et</strong>ailers was modeled as volume limited<br />
(or volume based) s<strong>in</strong>ce the trailer of the truck is full before its weight limit is reached because of the<br />
bulk of the packaged trays;<br />
The average transport distance of the trays to the r<strong>et</strong>ailers was assumed to be 106 km;<br />
No tray loss was assumed dur<strong>in</strong>g the distribution transport b<strong>et</strong>ween the manufactur<strong>in</strong>g site and the<br />
r<strong>et</strong>ailers;<br />
The average transport distance of the trays to the consumer’s house was assumed to be 5 km;<br />
The average transport distance of the trays at the end of their service lives to the waste management<br />
(i.e. landfill) sites was assumed to be 50 km;<br />
The plastics average recycl<strong>in</strong>g rates were assumed to be 0% for the XPS, 15% for OPS, 38% for the<br />
PET and RPET, 17% for the PP and 0% for the PLA, based on the latest residential solid waste characterisation<br />
published by Recyc-Quebec (Recyc-Quebec, 2010);<br />
All studied trays are considered equivalent <strong>in</strong> regard to the above-mentioned function even if their <strong>in</strong>dividual<br />
technical characteristics (e.g. rigidity, water-resistance) are not the same. No actual performance<br />
measurements were made but the fact that each tray is actually used <strong>in</strong> stores for the considered function<br />
supports this equivalency assumption.<br />
2.3. Life cycle <strong>in</strong>ventory (LCI) data, and Life cycle impact assessment (LCIA)<br />
This study ma<strong>in</strong>ly relied on available primary data collected from CSPG, CPP and it suppliers by way of<br />
questionnaires and direct communications, they represent annual averages. Any miss<strong>in</strong>g, <strong>in</strong>compl<strong>et</strong>e or <strong>in</strong>accessible<br />
data was compl<strong>et</strong>ed with hypotheses and secondary data (i.e., generic or theor<strong>et</strong>ical data available <strong>in</strong><br />
the literature or LCI databases, essentially from the European eco<strong>in</strong>vent database (www.eco<strong>in</strong>vent.ch), version<br />
2.0). For all of the activities tak<strong>in</strong>g place <strong>in</strong> Québec, Ontario or the United States, the generic modules<br />
were adapted by replac<strong>in</strong>g the European electricity grid mixes with the average Québec, Ontarian or North<br />
American grid mixes for the foreground processes, and with the North American grid mix for the background<br />
processes.<br />
LCIA was carried out us<strong>in</strong>g the IMPACT2002+ m<strong>et</strong>hod (Jolli<strong>et</strong> <strong>et</strong> al., 2003) (version 2.05). The <strong>in</strong>ventory<br />
calculation and the assessment of the potential impacts of the <strong>in</strong>ventoried emissions were carried out us<strong>in</strong>g<br />
the SimaPro software developed by PRé Consultants (www.pre.nl).<br />
3. Results<br />
Table 2 illustrates the relative contributions of the various foreground processes as they perta<strong>in</strong> to the total<br />
obta<strong>in</strong>ed for each system, for the four damage <strong>in</strong>dicator results and the two impact <strong>in</strong>dicator results not<br />
aggregated <strong>in</strong>to one of the damage category (aquatic eutrophication and acidification). Globally, it shows<br />
how the virg<strong>in</strong> material production (plastic granulates or PLA), the production of recycled pulp, and the<br />
form<strong>in</strong>g (extrusion, thermoform<strong>in</strong>g, or mould<strong>in</strong>g) dom<strong>in</strong>ate damages and impacts. The distribution box production<br />
for the MP tray also contributes significantly, and to a lesser degree the tray distribution packag<strong>in</strong>g.<br />
300
PARALLEL SESSION 3B: PACKAGING 8 th Int. Conference on <strong>LCA</strong> <strong>in</strong> the<br />
Agri-<strong>Food</strong> Sector, 1-4 Oct <strong>2012</strong><br />
Table 2. Relative contributions (<strong>in</strong>%) of the foreground steps to the total for each tray system (shaded cells <strong>in</strong><br />
red are contributions that are equal to or greater than 15%) (Note: recycled pulp production and tray mould<strong>in</strong>g<br />
are aggregated tog<strong>et</strong>her <strong>in</strong> the results for MP).<br />
Compar<strong>in</strong>g the environmental profiles of the systems studied provides answers as to the potential environmental<br />
ga<strong>in</strong>s associated with the use of different materials (virg<strong>in</strong> or recycled) to manufacture the trays,<br />
without, however, confirm<strong>in</strong>g wh<strong>et</strong>her one or another posts b<strong>et</strong>ter performances <strong>in</strong> all damage/impact categories<br />
CIRAIG (Figure 2). The Figure 2 allowed deriv<strong>in</strong>g a system Pi19P2 hierarchy, - Rapport where f<strong>in</strong>al the green group<strong>in</strong>g represents the<br />
systems CIRAIG with the least potential impacts, the red Cascades one Groupe those Produits systems Spécialisés with the most potential impacts and the<br />
grey one represents the <strong>in</strong>termediate systems.<br />
% of worst system<br />
100%<br />
90%<br />
80%<br />
70%<br />
60%<br />
50%<br />
40%<br />
30%<br />
20%<br />
10%<br />
0%<br />
Figure 2. Comparative cradle-to-grave damage/impact of the packag<strong>in</strong>g trays. Green boxed group<strong>in</strong>g: systems<br />
with the least potential Figure impacts, 3-7: System red group<strong>in</strong>g: hierarchy systems for each damage/impact with the most category potential impacts, grey group<strong>in</strong>gs:<br />
<strong>in</strong>termediate systems.<br />
CIRAIG.org © 2009<br />
PLA PET PP OPS RPET XPS MP PLA PP PET RPET OPS MP XPS PLA PP PET OPS RPET MP XPS PET PLA PP OPS RPET XPS MP PLA PP PET OPS RPET XPS MP PLA PP PET MP OPS RPET XPS<br />
Human Health Ecosystems Quality Climate Change Resources Aquatic Acidification Aquatic Eutrophication<br />
ACV comparative de produits<br />
d’emballage alimentaire<br />
Damage/Impact Categories<br />
Page 26<br />
301
PARALLEL SESSION 3B: PACKAGING 8 th Int. Conference on <strong>LCA</strong> <strong>in</strong> the<br />
Agri-<strong>Food</strong> Sector, 1-4 Oct <strong>2012</strong><br />
4. Discussion<br />
Given this hierarchy, the PLA tray holds the last place s<strong>in</strong>ce it is, for all categories, among the systems<br />
with the most potential impacts. The high contribution to ecosystem quality of PLA material production is<br />
expla<strong>in</strong>ed by the use of large areas of arable land for the corn cultivation generat<strong>in</strong>g a very high land occupation<br />
score. The PET, OPS and PP trays follow s<strong>in</strong>ce they are for several categories among the systems with<br />
the most potential impacts (however, the OPS tray seems to be b<strong>et</strong>ter s<strong>in</strong>ce it is among the systems with the<br />
least potential impacts for two categories). Then comes the RPET tray s<strong>in</strong>ce it shows the least potential impacts<br />
for two categories and shows <strong>in</strong>termediate results for all the other. F<strong>in</strong>ally, the XPS and MP trays come<br />
<strong>in</strong> first and second place s<strong>in</strong>ce they show the least potential impacts for four out of the six categories. The<br />
ma<strong>in</strong> advantage of the XPS tray lies <strong>in</strong> its mass, which is far less than that of other trays (up to 62% less). On<br />
the contrary, the PLA and PET trays are the heaviest of the trays and the virg<strong>in</strong> material production processes<br />
are important contributors. The ma<strong>in</strong> advantage of the MP tray lies <strong>in</strong> its recycled nature s<strong>in</strong>ce no virg<strong>in</strong> material<br />
production is necessary and its manufactur<strong>in</strong>g is relatively low energy <strong>in</strong>tensive (58% higher than the<br />
XPS tray but 27% lower on average than the other plastic trays). The system is however penalised by a heavier<br />
distribution packag<strong>in</strong>g.<br />
Seven sensitivity analyses were carried out to assess how robust the results are with regards to the uncerta<strong>in</strong>ty<br />
beh<strong>in</strong>d ma<strong>in</strong> assumptions, generic data modules and various m<strong>et</strong>hodological choices.<br />
1. Tray weight: it is an important param<strong>et</strong>er s<strong>in</strong>ce it affects the amount of material used and the amount<br />
of energy used dur<strong>in</strong>g the tray manufactur<strong>in</strong>g and its distribution (the marg<strong>in</strong>al amount of energy per<br />
unit of mass is still considered <strong>in</strong> the volume-based transport). A 20% higher and lower weight was<br />
considered <strong>in</strong> the analysis. The results show a high degree of overlapp<strong>in</strong>g for the plastic trays other<br />
than the XPS (i.e. lower <strong>in</strong> the comparative hierarchy). Y<strong>et</strong>, the XPS and MP trays show very little<br />
overlapp<strong>in</strong>g except with each other and thus ma<strong>in</strong>ta<strong>in</strong> their b<strong>et</strong>ter rank<strong>in</strong>g overall.<br />
2. PET recycl<strong>in</strong>g: In the basel<strong>in</strong>e scenario, a generic process was used to model the recycled PET. The<br />
use of a recycled PET-specific process makes it possible to assess the degree to which the relative<br />
contribution of the RPET trays can change as compared to the other trays. As compared to the first<br />
approximation (simple electricity consumption), the specific process yields practically identical results<br />
and the conclusions therefore rema<strong>in</strong> the same.<br />
3. Allocation approach: In the basel<strong>in</strong>e scenario, the allocation approach attributed 100% of the impacts<br />
of recycl<strong>in</strong>g to the user of the recycled material (the system that generates the waste to be recycled<br />
is attributed 0% of the impacts). A sensitivity analysis was carried out to <strong>in</strong>clude the end-of-life<br />
recycl<strong>in</strong>g process with<strong>in</strong> the system boundaries through system expansion so as to account for the affected<br />
processes, e.g. the use of recycled plastic <strong>in</strong> the manufactur<strong>in</strong>g of the tray avoids the landfill<strong>in</strong>g<br />
of plastic wastes, thus the landfill<strong>in</strong>g process is credited (i.e. has a negative contribution to the<br />
total score) to the system and is <strong>in</strong>cluded <strong>in</strong> the Recycled Material life cycle step; and the recycl<strong>in</strong>g<br />
of the tray avoids the production of virg<strong>in</strong> plastic <strong>in</strong> other products systems, thus the virg<strong>in</strong> production<br />
process is credited to the system and is <strong>in</strong>cluded <strong>in</strong> the End-of-Life life cycle step. The conclusions<br />
rema<strong>in</strong> the same. In fact, the MP system shows an overall negative result for the ecosystem<br />
quality <strong>in</strong>dicator associated with the non-de<strong>in</strong>ked old newspaper used to manufacture the tray (the<br />
de<strong>in</strong>k<strong>in</strong>g process is avoided s<strong>in</strong>ce the old newspaper would have been de<strong>in</strong>ked had it been recycled<br />
<strong>in</strong>to new newspaper).<br />
4. The North American electricity grid mix: This analysis used the North American electricity grid for<br />
the recycled granulates/pulp production and tray manufactur<strong>in</strong>g (extrusion and thermoform<strong>in</strong>g). The<br />
XPS tray rema<strong>in</strong>s the favourite plastic option and the MP tray becomes the clear favourite for all <strong>in</strong>dicators<br />
(it is practically equal to the XPS tray for the ecosystem quality and aquatic eutrophication<br />
categories) <strong>in</strong> light of its low electricity consumption (MP consumes natural gas, which, per MJ,<br />
generates less potential impacts than the North American energy grid).<br />
5. The Québec electricity grid mix: This analysis used the Québec electricity grid for the recycled<br />
granulates/pulp production and tray manufactur<strong>in</strong>g. Because the RPET system uses no virg<strong>in</strong> material<br />
and only consumes electricity dur<strong>in</strong>g granulates production and tray manufactur<strong>in</strong>g, it comes out<br />
as the favoured option (even if it shows a little higher results than the XPS tray for the ecosystems<br />
quality category because of the corrugated board distribution box and granulates transport which<br />
have not changed). The XPS tray r<strong>et</strong>a<strong>in</strong>s its advantage over the other plastic trays because of its<br />
lower weight. The systems that profit the most from this grid mix change are those that relied on the<br />
U.S. grid (PLA and PP trays for the recycled granulates production and the she<strong>et</strong> extrusion), which is<br />
far more impactful as compared to the Québec grid mix than is the Ontarian mix (used by the OPS,<br />
302<br />
PET and RPET trays); the PLA tray obta<strong>in</strong>s an even lower result for the aquatic acidification cate-
PARALLEL SESSION 3B: PACKAGING 8 th Int. Conference on <strong>LCA</strong> <strong>in</strong> the<br />
Agri-<strong>Food</strong> Sector, 1-4 Oct <strong>2012</strong><br />
gory than the XPS tray. The MP tray shows good results compared to the plastic trays, but is still penalised<br />
for the climate change and resources depl<strong>et</strong>ion categories by the natural gas used to dry it<br />
once it is moulded.<br />
6. The LCIA m<strong>et</strong>hod: The European m<strong>et</strong>hod ReCiPe (version 1.03, Hierarchist vision) was used to verify<br />
wh<strong>et</strong>her the variability of the receiv<strong>in</strong>g environments and characterisation models changed the<br />
conclusions. It therefore aimed to test the robustness of the IMPACT2002+ results. This second<br />
m<strong>et</strong>hod confirmed the advantage of the XPS and MP for the human health and ecosystem quality <strong>in</strong>dicators<br />
(the climate change category contributes to these two <strong>in</strong>dicators). In the case of resource<br />
consumption, the clear preference for the RPET is based on the uranium characterisation factor,<br />
which is much lower for ReCiPe (nuclear energy be<strong>in</strong>g the ma<strong>in</strong> contributor for the RPET <strong>in</strong> the<br />
IMPACT2002+, its contribution is significantly curbed).<br />
7. The tray distribution to r<strong>et</strong>ailers (distance): This distance was <strong>in</strong>creased from 106 km for all of the<br />
scenarios to 1500 km for the sensitivity test. Clearly, for the ecosystem quality <strong>in</strong>dicator, the relative<br />
contribution of the transport <strong>in</strong>creases without chang<strong>in</strong>g the comparative analysis of the trays. The<br />
low weight of the XPS trays puts the option ahead of MP.<br />
The sensitivity analyses do not change the prelim<strong>in</strong>ary conclusions, and XPS and MP rema<strong>in</strong> the systems<br />
with the least potential impacts.<br />
5. Conclusion<br />
The results obta<strong>in</strong>ed <strong>in</strong>dicate that the ma<strong>in</strong> contributors to damages and impacts categories throughout the<br />
entire life cycles of the trays are l<strong>in</strong>ked to production processes (raw materials and manufactur<strong>in</strong>g energy<br />
production). From a comparative perspective, the results provide answers regard<strong>in</strong>g the potential environmental<br />
ga<strong>in</strong>s associated with the use of different materials (virg<strong>in</strong> or recycled) for tray production, without<br />
affirm<strong>in</strong>g the advantage of one or another <strong>in</strong> every damage category. Specifically, PLA, PET and PP post the<br />
worst performances while XPS and MP have the best overall performances. The ma<strong>in</strong> advantage of the XPS<br />
tray lies <strong>in</strong> its mass, which is far less than that of other trays (up to 62% less). To enhance the performance of<br />
the other trays, it would be important to reduce their respective weights and optimize the subsequent transformation<br />
processes (extrusion and thermoform<strong>in</strong>g or mould<strong>in</strong>g).<br />
The sensitivity analyses show that the plastic systems are very sensitive to the electricity grid mix used to<br />
form the tray, highlight<strong>in</strong>g the environmental advantage of manufactur<strong>in</strong>g the trays <strong>in</strong> Quebec Prov<strong>in</strong>ce<br />
where hydroelectricity is 95% of the grid mix. Besides revers<strong>in</strong>g the popular belief over the negative attributes<br />
of polystyrene packag<strong>in</strong>g (<strong>in</strong> the Quebec context where almost no recycl<strong>in</strong>g channel for PS exist), this<br />
critically reviewed <strong>LCA</strong> study has supported strategic decision processes with<strong>in</strong> the company. S<strong>in</strong>ce this<br />
analysis was performed, Cascades has improved its manufactur<strong>in</strong>g process by <strong>in</strong>tegrat<strong>in</strong>g upstream with an<br />
RPET extrusion and thermoform<strong>in</strong>g l<strong>in</strong>e <strong>in</strong> its plants <strong>in</strong> Quebec prov<strong>in</strong>ce and is work<strong>in</strong>g cont<strong>in</strong>uously to<br />
enhance the recycled content of RPET material (currently 60%). Prelim<strong>in</strong>ary results <strong>in</strong>dicate that the environmental<br />
impacts of RPET with a high degree of recycled content could be compared to those of XPS foam<br />
and moulded pulp.<br />
6. References<br />
Athena Institute, 2006. Life cycle <strong>in</strong>ventory of five products produced from polylactide (PLA) and p<strong>et</strong>roleum-based res<strong>in</strong>s. Available<br />
from: www.athenasmi.ca/projects/docs/Plastic_Products_<strong>LCA</strong>_Summary_Rpt.pdf<br />
D<strong>et</strong>zel A., Kruger M., 2006. Life cycle assessment of polylactide. A comparison of food packag<strong>in</strong>g made from NatureWorks PLA<br />
and alternative materials. IFEU Institute (Institute for Energy and Environmental Research) Report No 168.<br />
Jolli<strong>et</strong> O, Margni M, Charles R, Humbert S, Pay<strong>et</strong> J, Rebitzer G and Rosenbaum R., 2003. IMPACT 2002+: A New Life Cycle Impact<br />
Assessment M<strong>et</strong>hodology. Int. Journal of <strong>LCA</strong>, 8(6), 324-330.<br />
Madival S, Auras R, S<strong>in</strong>gh SP, Narayan R, 2009. Assessment of the environmental profile of PLA, PET and PS clamshell conta<strong>in</strong>ers<br />
us<strong>in</strong>g <strong>LCA</strong> m<strong>et</strong>hodology. J. Cleaner Production, 17(13), 1183-1194.<br />
Recyc-Quebec, 2010. Caractérisation des matières résiduelles du secteur résidentiel au Québec 2006-2009, Document complémentaire,<br />
http://www.recyc-quebec.gouv.qc.ca/Upload/ Publications/doc_comp.pdf<br />
303
PARALLEL SESSION 3C: SHEEP AND DAIRY PRODUCTION SYSTEMS 8 th Int. Conference on <strong>LCA</strong> <strong>in</strong> the<br />
Parallel session 3c: Sheep and Dairy Production Systems<br />
304<br />
Agri-<strong>Food</strong> Sector, 1-4 Oct <strong>2012</strong><br />
A systems-<strong>LCA</strong> model of the stratified UK sheep <strong>in</strong>dustry<br />
Adrian Williams * , Eric Audsley, Daniel Sandars<br />
Centre for Environmental Risks and Futures, School of Applied Sciences, Cranfield University, Bedford, MK43 0AL, UK.<br />
Correspond<strong>in</strong>g author. E-mail: adrian.williams@cranfield.ac.uk<br />
ABSTRACT<br />
A systems model of the stratified UK sheep <strong>in</strong>dustry was developed to provide the activity data <strong>in</strong>puts for life cycle assessment<br />
(<strong>LCA</strong>) <strong>in</strong> the Cranfield systems-<strong>LCA</strong> model. It <strong>in</strong>cludes the biophysical performance of the lowland, upland and hill sheep flocks,<br />
which are economically <strong>in</strong>terl<strong>in</strong>ked and provide meat and wool as outputs. The sheep m<strong>et</strong>abolisable energy requirements are calculated<br />
from standard formulae and the graz<strong>in</strong>g needs are d<strong>et</strong>erm<strong>in</strong>ed from the feed supplied by grass coupled with a bespoke grass<br />
production model. This calculates the N requirements and productivity over a wide range of climatic and soil zones.<br />
Basel<strong>in</strong>e results were compared with alternative scenarios. The potential for improvement under reasonable changes <strong>in</strong> management<br />
and technology could reduce ma<strong>in</strong> burdens by about 14% and about 24% with more demand<strong>in</strong>g changes. Changes <strong>in</strong> the <strong>in</strong>dustry<br />
structure have major effects on land occupation, but smaller effects on energy use and greenhouse gas emissions.<br />
Keywords: lamb, systems model, greenhouse gases, enteric m<strong>et</strong>hane, wool<br />
1. Introduction<br />
The UK sheep <strong>in</strong>dustry can be divided <strong>in</strong>to hill, upland and lowland flocks. The overwhelm<strong>in</strong>g purpose is to<br />
produce meat (of which lamb is economically dom<strong>in</strong>ant), with wool as a co-product. The milk<strong>in</strong>g flock is<br />
negligible and not addressed <strong>in</strong> this paper. There are many breeds rang<strong>in</strong>g from the smaller breeds most<br />
suited to the severe conditions of hill farm<strong>in</strong>g, which struggle to produce a lamb each year, to the larger<br />
breeds associated with lowland farm<strong>in</strong>g. These <strong>in</strong>clude very local traditional breeds (e.g. Herdwick) to more<br />
recently-imported breeds, such as the Texel. The system that has developed comb<strong>in</strong>es the qualities of these<br />
different breeds to develop hybrid vigour and make best use of the available land at different altitudes (Figure<br />
1).<br />
Hill<br />
Upland<br />
Lowland<br />
Male<br />
lambs<br />
Pure bred hill<br />
Male<br />
lambs<br />
Draught<br />
ewes<br />
F<strong>in</strong>ished lambs<br />
Ewe lambs<br />
r<strong>et</strong>a<strong>in</strong>ed<br />
Halfbreds Rams Longwool<br />
Cross-bred<br />
ewes & lambs<br />
Lowland Rams Downland<br />
Figure 1. Simplified structural model of sheep production <strong>in</strong> the UK.<br />
Thus, hill farms produce ewes that are sold to upland farms where they are crossed with high gen<strong>et</strong>ic merit<br />
rams to produce ewes that are, <strong>in</strong> turn, sold for breed<strong>in</strong>g to lowland farms. In addition, there are purebred<br />
flocks with <strong>in</strong>termediate characteristics. Whilst most male lambs on lowland farms can be f<strong>in</strong>ished (i.e. reach<br />
slaughter weight and condition) before the autumn, a decreas<strong>in</strong>g proportion on upland and hill farms can<br />
achieve this and many must be sold to lower land farms, where they are grown and f<strong>in</strong>ished over w<strong>in</strong>ter or<br />
kept as “stores”, typically kept on ma<strong>in</strong>tenance rations until be<strong>in</strong>g f<strong>in</strong>ished the next spr<strong>in</strong>g. A small proportion<br />
of lowland flocks lamb very early and lambs are reared with a high concentrate di<strong>et</strong> to me<strong>et</strong> the Easter<br />
mark<strong>et</strong> (high prices). Lamb<strong>in</strong>g then proceeds with the rest of the lowlands, upland and hills <strong>in</strong> sequence.<br />
Sheep are major emitters of enteric m<strong>et</strong>hane and so contribute about 8% the UK national agricultural m<strong>et</strong>hane<br />
emissions and about 7% of direct agricultural N2O emissions (Sneddon <strong>et</strong> al., 2010). The sheep sector<br />
has historically operated at the marg<strong>in</strong>s of livestock production <strong>in</strong> the UK, but is important <strong>in</strong> support<strong>in</strong>g<br />
rural communities as well as particular grassland ecosystems and utilis<strong>in</strong>g these relatively poor grasslands.<br />
Surplus<br />
lambs<br />
Surplus<br />
lambs
PARALLEL SESSION 3C: SHEEP AND DAIRY PRODUCTION SYSTEMS 8 th Int. Conference on <strong>LCA</strong> <strong>in</strong> the<br />
Agri-<strong>Food</strong> Sector, 1-4 Oct <strong>2012</strong><br />
The <strong>LCA</strong> analysis of the production of lamb meat thus has to take <strong>in</strong>to account the different sizes of the<br />
breeds and consequent feed requirements, different types of land and consequent yields of grass (and management<br />
requirements), and different rates of lamb growth and ewe productivity.<br />
The Cranfield <strong>LCA</strong> model addresses this us<strong>in</strong>g systems modell<strong>in</strong>g to l<strong>in</strong>k the various sub-systems. The equations<br />
l<strong>in</strong>k<strong>in</strong>g the systems ensure that the numbers are coherent and enable various options to be analysed.<br />
Options that can be explored may be economic, long term breed<strong>in</strong>g goals, such as greater fecundity or policy<br />
oriented, such as concentrat<strong>in</strong>g sheep production <strong>in</strong> the hills or lowlands, as land demand changes.<br />
2. M<strong>et</strong>hods<br />
2.1 Functional unit<br />
The functional unit (FU) is 1000 kg expected edible lamb carcass at the national level. This is derived as<br />
liveweight for slaughter multiplied by the kill<strong>in</strong>g out percentage (47%), so that the system boundary is the<br />
farm gate, but the FU represents the useful carcass weight that can be expected. The relatively small burdens<br />
of transport and slaughter<strong>in</strong>g are not <strong>in</strong>cluded. Adult sheep meat and wool are co-products.<br />
2.2 Biophysical performance of flocks<br />
The basis of the model is the def<strong>in</strong>ition of the biophysical performance of each type of sheep flock. These<br />
<strong>in</strong>clude terms for ewe and ram longevity, fecundity (lambs per ewe per year), ram/ewe ratios, growth rate,<br />
mature body weights and mortality rates. This gives the data to calculate flock replacements required and<br />
hence how many surplus lambs are produced for exports to other flocks or for slaughter (Table 1). Data came<br />
from standard agricultural texts (e.g. Nix, 2005; Agro Bus<strong>in</strong>ess Consultants, 2005), contact with the <strong>in</strong>dustry<br />
and further research (Warkup <strong>et</strong> al., 2008). It is important to note that a distribution of lamb weights comes<br />
from each system, not just an average. Hill sheep are clearly smaller and shorter lived than lowland ones.<br />
Table 1. Ma<strong>in</strong> characteristics of the sheep flocks<br />
Hill pure<br />
bred<br />
flocks<br />
Upland<br />
purebred<br />
flocks<br />
Upland<br />
crossbred<br />
flocks<br />
Lowland<br />
purebred<br />
flocks<br />
Lowland<br />
crossbred<br />
flocks<br />
Ewe life, years 3.5 4.3 4.3 4.3 4.3<br />
Ram life, years 3 3 3 3 3<br />
Ewes/ram 47 47 47 20 20<br />
Annual ewe cull<strong>in</strong>g rate 5% 4% 4% 4% 4%<br />
Annual ewe mortality rate 3% 3% 3% 3% 3%<br />
Lambs per year 1.0 1.4 1.4 1.5 1.6<br />
Ewe weight, kg 52 62 76 74 78<br />
Lamb daily liveweight ga<strong>in</strong>, kg/d 0.10 0.14 0.17 0.18 0.19<br />
Lamb mean f<strong>in</strong>al liveweight, kg 28 34 38 38 39<br />
Distribution of lamb weights<br />
25-32, kg 92% 29% 2% 2% 1%<br />
32-36, kg 8% 49% 23% 21% 17%<br />
36-39, kg 0% 18% 38% 37% 35%<br />
39-45.5, kg 0% 4% 36% 40% 46%<br />
Wool, kg 2.1 2.9 2.9 3.1 3.1<br />
2.2 Structural model of the national flock<br />
The <strong>in</strong>dividual flocks are l<strong>in</strong>ked by a s<strong>et</strong> of l<strong>in</strong>ear equations to allow transfers b<strong>et</strong>ween them (e.g. a store<br />
lamb moves from the hills to an upland or lowland flock to be f<strong>in</strong>ished). If the balance of production systems<br />
is changed, the model recalculates the systems <strong>in</strong> order to supply the functional unit. The balance may be<br />
altered by chang<strong>in</strong>g the productivity of one part, e.g. more lambs per ewe <strong>in</strong> upland flocks, or by chang<strong>in</strong>g<br />
the proportions of hill, upland and lowland flocks. The l<strong>in</strong>k<strong>in</strong>g equations have the follow<strong>in</strong>g structure. The<br />
solution is the amount, X, of each activity, i, that produces the desired mass of the functional unit, Z,<br />
n<br />
<br />
i<br />
i i X z Z<br />
1 Eq. 1<br />
where zi is the output (types of sheep) of activity i, and also satisfies the s<strong>et</strong> of flows b<strong>et</strong>ween activities:<br />
305
PARALLEL SESSION 3C: SHEEP AND DAIRY PRODUCTION SYSTEMS 8 th Int. Conference on <strong>LCA</strong> <strong>in</strong> the<br />
306<br />
n<br />
<br />
i1<br />
c<br />
ij<br />
X<br />
i<br />
<br />
0,<br />
j 1...<br />
p<br />
Agri-<strong>Food</strong> Sector, 1-4 Oct <strong>2012</strong><br />
where cij is the supply or demand of j by activity i, which describes the relationship b<strong>et</strong>ween enterprises.<br />
Demands are negative and supplies are positive and total supply must equal total demand. For example,<br />
purebred lowland flocks produce rams, which are, <strong>in</strong> turn, demanded as term<strong>in</strong>al sires by lowland f<strong>in</strong>ish<strong>in</strong>g<br />
flocks. The total amount of material k flow<strong>in</strong>g <strong>in</strong>to the system is:<br />
M<br />
k<br />
n<br />
Eq. 2<br />
mik<br />
X i,<br />
k 1...<br />
q<br />
i<br />
1<br />
Eq. 3<br />
where mik is the flow of material k <strong>in</strong>to activity i. The life cycle <strong>in</strong>ventory (LCI) for the system is the total of<br />
each burden l<br />
B<br />
l<br />
<br />
p<br />
<br />
k1<br />
M<br />
k<br />
b<br />
k l<br />
, l 1...<br />
r<br />
where bkl is the amount of burden l produced by the use or disposal of material k and Mk is the total amount<br />
of material. The LCI identifies the contribution of each material<br />
Bkl M kbkl<br />
Eq. 5<br />
or activity<br />
B<br />
il<br />
X<br />
2.3 Feed demands<br />
q<br />
i<br />
k<br />
Eq. 4<br />
mikbkl<br />
1 Eq. 6<br />
The ma<strong>in</strong> demand for feed energy is m<strong>et</strong> by graz<strong>in</strong>g, with relatively small contributions from conserved forage<br />
or concentrates. The energy demand of a ewe was calculated from the AFRC feed<strong>in</strong>g system (Alderman<br />
and Cottrill, 1993), much of which is derived from ARC (1980). These <strong>in</strong>clude terms for ma<strong>in</strong>tenance (a<br />
function of body weight, wool production and activity), pregnancy (a function of lamb weight) and lactation<br />
until wean<strong>in</strong>g, a function of lamb size and daily liveweight ga<strong>in</strong> (DLWG). The m<strong>et</strong>abolisable energy demand<br />
is calculated per ewe each year and <strong>in</strong>cludes the energy needs for lambs until they leave the system.<br />
Energy demand is converted to a demand for graz<strong>in</strong>g dry matter <strong>in</strong>take (DMI) by allow<strong>in</strong>g for the management<br />
choice of the quantitative supply of concentrates and conserved forage to lambs and ewes and thus<br />
obta<strong>in</strong><strong>in</strong>g the graz<strong>in</strong>g energy demand by difference. This is converted to DMI from the energy density of<br />
grazed pasture. The comb<strong>in</strong>ation of graz<strong>in</strong>g, conserved forage and concentrates normally me<strong>et</strong>s sheep prote<strong>in</strong><br />
requirements when energy demand is m<strong>et</strong>. So, these are not explicitly calculated separately.<br />
2.4 Graz<strong>in</strong>g land requirements<br />
A grass sub-model was developed to calculate the area of grass required tog<strong>et</strong>her with the managerial <strong>in</strong>puts<br />
needed. Grass yield was modelled us<strong>in</strong>g the grass site class system (Brockman and Gwynn, 1988). Site<br />
classes range from 1 to 7, with 7 be<strong>in</strong>g least productive. The ma<strong>in</strong> d<strong>et</strong>erm<strong>in</strong>ants of site class are summer<br />
ra<strong>in</strong>fall (low ra<strong>in</strong>fall restricts production) and soil texture (lighter soils dra<strong>in</strong> more quickly and have lower<br />
yield potentials). An allowance is also made for reduced productivity at higher altitudes. Effects of site class<br />
and N application rate on grass yield are shown <strong>in</strong> Figure 1.<br />
In a graz<strong>in</strong>g system, N may be supplied applied fertiliser, fixation by clover, atmospheric deposition and by<br />
the animals’ excr<strong>et</strong>a. This causes the organic matter to build up and cycle round the system to become available<br />
to both the pasture and loss processes to air and water. The result<strong>in</strong>g system can be described by a system<br />
of equations which can be solved for a steady state.
PARALLEL SESSION 3C: SHEEP AND DAIRY PRODUCTION SYSTEMS 8 th Int. Conference on <strong>LCA</strong> <strong>in</strong> the<br />
Agri-<strong>Food</strong> Sector, 1-4 Oct <strong>2012</strong><br />
Figure 1. Effects of site class and N application rate on grass DM yield<br />
The total nitrogen available annually to the grass crop is:<br />
N N N N N N , Eq. 7<br />
a<br />
atm<br />
c<br />
f<br />
s<br />
e<br />
where Natm is the atmospheric nitrogen deposition, which ranges from 15-35 kgN/ha, Nc is the nitrogen fixed<br />
by the clover proportion, Nf is the fertiliser N applied, Ns is the nitrogen surplus not leached or denitrified<br />
over the w<strong>in</strong>ter, Ne is the nitrogen <strong>in</strong> grazed animal excr<strong>et</strong>a, which is not lost.<br />
The N content of the grass (gN) is a function of the N available.<br />
gN =20.14+0.0136(Na-Natm) Eq. 8<br />
The total N taken up by the crop is thus gNYGDM. The balance is thus at risk of loss to air and water. The<br />
proportions emitted to air and water are given by Sandars <strong>et</strong> al., (2003). When graz<strong>in</strong>g, 20% of the dry matter<br />
yield is assumed to be spoilt by trampl<strong>in</strong>g and defoliation and thus unavailable for consumption by the animal<br />
and r<strong>et</strong>urned as organic matter to the soil. When graz<strong>in</strong>g, sheep utilise about 6% of forage N and the<br />
balance is excr<strong>et</strong>ed. Of the excr<strong>et</strong>ed proportion, 70% is ur<strong>in</strong>e and 10% of the dung is soluble. 15% of this<br />
soluble N is volatised as ammonia and the balance of excr<strong>et</strong>ed N becomes <strong>in</strong>crementally available to crops,<br />
Ne. This system of equations is solved (iteratively) for Na and the result<strong>in</strong>g Nf were found to be comparable<br />
with typical values of fertiliser application as found <strong>in</strong> the British Survey of Fertiliser Practice (BSFP, 2005).<br />
The proportions of grass productivities to sheep types was described by Williams <strong>et</strong> al., (2006). This also<br />
describes other managerial <strong>in</strong>puts to grassland, e.g. reseed<strong>in</strong>g rates and silage harvest<strong>in</strong>g.<br />
2.5 Other LCI data<br />
LCI data, such as the burdens of concentrate production and direct management energy requirements came<br />
from Williams <strong>et</strong> al., (2006). Emissions of ammonia were calculated from N excr<strong>et</strong>ion (NEX) at graz<strong>in</strong>g and<br />
<strong>in</strong> hous<strong>in</strong>g us<strong>in</strong>g values from the UK ammonia <strong>in</strong>ventory (Misselbrook <strong>et</strong> al., 2010). Nitrous oxide emissions<br />
from NEX dur<strong>in</strong>g graz<strong>in</strong>g followed the IPPC (2006). Nitrous oxide and m<strong>et</strong>hane emissions from manure management<br />
were derived from the UK 1997 <strong>in</strong>ventories for GHG emissions (Sneath, 1997, Chadwick, 1997).<br />
Enteric m<strong>et</strong>hane was calculated from the IPCC (2006) Tier 2 formula <strong>in</strong> which an average gross energy density<br />
of 18.4 MJ/kg DM was used (McDonald <strong>et</strong> al., 2011).<br />
2.6 Implementation<br />
The model was implemented <strong>in</strong> Microsoft Excel, us<strong>in</strong>g code <strong>in</strong> VBA for Applications to solve the equations.<br />
The results were expressed as LCIs us<strong>in</strong>g the IPCC (2007) coefficients for GWP and the CML coefficients<br />
for other impacts.<br />
2.7 Scenarios<br />
307
PARALLEL SESSION 3C: SHEEP AND DAIRY PRODUCTION SYSTEMS 8 th Int. Conference on <strong>LCA</strong> <strong>in</strong> the<br />
Agri-<strong>Food</strong> Sector, 1-4 Oct <strong>2012</strong><br />
Scenarios were <strong>in</strong>vestigated to consider changes <strong>in</strong> sheep management that represented the ways farmers<br />
may respond to economic drivers, changes <strong>in</strong> gen<strong>et</strong>ic potential and management quality (<strong>in</strong>clud<strong>in</strong>g animal<br />
health) and the emission factor for enteric m<strong>et</strong>hane. Results were compared with the current, basel<strong>in</strong>e state of<br />
sheep production and considered energy use, GHGE land occupation. All changes <strong>in</strong> scenario variables<br />
caused effects that were l<strong>in</strong>ear or close to be<strong>in</strong>g l<strong>in</strong>ear with<strong>in</strong> the range explored.<br />
3. Results<br />
With the current national flock, it takes about 22 GJ/t to produce 1 t expected edible carcass weight with the<br />
emission of about 22 t CO2e/t, of which about 67% was from enteric m<strong>et</strong>hane (Table 2). “Good quality” land<br />
<strong>in</strong>cluded grassland from site classes 1-3 and arable land for crop production, while poor quality land <strong>in</strong>cluded<br />
grassland of site classes 4 to 7.<br />
Table 2 Basel<strong>in</strong>e burdens of produc<strong>in</strong>g 1 t expected edible carcass weight of lamb at the national level.<br />
CED, GJ<br />
308<br />
GWP, t<br />
CO2e<br />
Eutrophication<br />
potential, kg PO4<br />
eqv.<br />
Acidification<br />
potential, kg<br />
SO2 eqv.<br />
Abiotic<br />
resource<br />
use, kg Sb<br />
Good<br />
quality<br />
land, ha<br />
Poor<br />
quality<br />
land, ha<br />
22.2 22.3 100 87 13 0.5 10.0 10.5<br />
All land,<br />
ha<br />
Halv<strong>in</strong>g the proportion of the flock that is lowland could result from economic drivers. It <strong>in</strong>creases land occupation<br />
(ma<strong>in</strong>ly on poorer land) and causes a relatively small <strong>in</strong>crease <strong>in</strong> GHGE (from more slow grow<strong>in</strong>g<br />
sheep) and decrease <strong>in</strong> CED from lower N fertilisation and concentrate use (Table 3).<br />
Table 3 Results of chang<strong>in</strong>g scenarios on ma<strong>in</strong> burdens of produc<strong>in</strong>g lamb. Values are the ratio of scenario<br />
results over basel<strong>in</strong>e results.<br />
Effect of results<br />
Land occupation<br />
Basel<strong>in</strong>e Effect of<br />
Good Poor<br />
Scenario description<br />
value scenario CED GWP quality quality Total<br />
Proportion of ewes on lowland 37%<br />
Halve<br />
Double<br />
93%<br />
112<br />
102%<br />
97%<br />
107%<br />
88%<br />
125%<br />
58%<br />
125%<br />
60%<br />
Proportion lowland lambs f<strong>in</strong>ished <strong>in</strong><br />
early spr<strong>in</strong>g<br />
10%<br />
Halve<br />
Double<br />
99%<br />
103%<br />
100%<br />
101%<br />
99%<br />
103%<br />
100%<br />
100%<br />
100%<br />
100%<br />
Increase sheep weight 66 kg # +5%<br />
+10%<br />
113%<br />
124%<br />
113%<br />
126%<br />
113%<br />
123%<br />
109%<br />
119%<br />
109%<br />
119%<br />
Increase <strong>in</strong> fecundity<br />
1.2 lambs<br />
per ewe #<br />
-10%<br />
+10%<br />
111%<br />
96%<br />
108%<br />
95%<br />
111%<br />
96%<br />
107%<br />
95%<br />
107%<br />
95%<br />
Increase <strong>in</strong> kill<strong>in</strong>g out percentage 47%<br />
+2.35%<br />
+4.7%<br />
99%<br />
95%<br />
97%<br />
93%<br />
99%<br />
95%<br />
96%<br />
92%<br />
96%<br />
92%<br />
Increase <strong>in</strong> ewe longevity, years 3.7 # +0.5 year<br />
+1 year<br />
100%<br />
98%<br />
98%<br />
96%<br />
100%<br />
98%<br />
98%<br />
96%<br />
98%<br />
96%<br />
Comb<strong>in</strong>ed improvements Low 86% 88% 86% 89% 89%<br />
Comb<strong>in</strong>ed improvements High 76% 78% 77% 80% 80%<br />
Note: # Weighted average across sheep types<br />
Doubl<strong>in</strong>g the proportion of early spr<strong>in</strong>g lamb production <strong>in</strong>crease GHGE and CED through demand<strong>in</strong>g more<br />
concentrates, but has no effect on land occupation. Increas<strong>in</strong>g sheep weight (ewes and lambs) <strong>in</strong>creases all<br />
burdens, ma<strong>in</strong>ly because of the extra ma<strong>in</strong>tenance overheads of larger breed<strong>in</strong>g sheep. Increas<strong>in</strong>g the fecundity<br />
of ewes by 10% reduces all burdens by 5-6%, while decreas<strong>in</strong>g fecundity by 5% (e.g. through ill health,<br />
such as Schmallenberg virus) <strong>in</strong>creases burdens by 6-8%. Increas<strong>in</strong>g the kill<strong>in</strong>g out percentage from 47% to<br />
51.7% (i.e. relative <strong>in</strong>crease of 10%) reduces all burdens by 8%. Increas<strong>in</strong>g ewe longevity by 0.5 years<br />
(about 13% <strong>in</strong>crease) reduces burdens by about 5%.<br />
The scenario variables that are under most managerial and technical <strong>in</strong>fluence were comb<strong>in</strong>ed at low and<br />
high levels to assess the potential for improvement (this excluded a change <strong>in</strong> the proportions of the national<br />
flock). The low level improvements comb<strong>in</strong>ed to reduce burdens by about 14% and the high level improvements<br />
by about 24% (Table 3).
PARALLEL SESSION 3C: SHEEP AND DAIRY PRODUCTION SYSTEMS 8 th Int. Conference on <strong>LCA</strong> <strong>in</strong> the<br />
Agri-<strong>Food</strong> Sector, 1-4 Oct <strong>2012</strong><br />
4. Discussion<br />
The results show similarity with other studies <strong>in</strong> the UK, e.g. Taylor <strong>et</strong> al., (2010) found the carbon footpr<strong>in</strong>t<br />
of Welsh lamb to be 24 kg CO2e/kg. The results are very sensitive to the enteric m<strong>et</strong>hane emission factor and<br />
m<strong>et</strong>hod of calculation. This is under active research <strong>in</strong> work to improve the UK GHG <strong>in</strong>ventory for agriculture<br />
(http://www.ghgplatform.org.uk/). Apply<strong>in</strong>g a Tier 2 approach will lead to different outcomes from a<br />
Tier 1 approach, which assumes the same emission rate for all sizes and di<strong>et</strong>s, which is far from reality is<br />
sheep production. Any change <strong>in</strong> the structure of the <strong>in</strong>dustry that ma<strong>in</strong>ta<strong>in</strong>s output, but at different altitudes<br />
is clearly constra<strong>in</strong>ed by land availability. The potential for improvement is substantial, but depends on a<br />
synergistic comb<strong>in</strong>ation of improvements <strong>in</strong> animal health, management and breed<strong>in</strong>g. These are often only<br />
enabled by a positive economic climate, to which government policies often play a major role.<br />
5. Conclusion<br />
The systems approach to <strong>LCA</strong> is a powerful tool for assess<strong>in</strong>g the complexity that is the UK sheep <strong>in</strong>dustry.<br />
It allows exploration of alternative approaches. Potential for improvement through technical and managerial<br />
changes exists and could reduce burdens significantly. Changes <strong>in</strong> the structure of the <strong>in</strong>dustry could have<br />
profound impacts on land occupation, particularly the balance b<strong>et</strong>ween good and poor quality land.<br />
6. Acknowledgments<br />
The authors thank the UK Department for the Environment, <strong>Food</strong> and Rural Affairs for fund<strong>in</strong>g and Dr<br />
Stewart Ledgard of AgResearch, NZ for helpful comments on the model.<br />
7. References<br />
Agro Bus<strong>in</strong>ess Consultants, 2005. The Agricultural Budg<strong>et</strong><strong>in</strong>g and Cost<strong>in</strong>g Book, (59th edition). Agro Bus<strong>in</strong>ess Consultants, Melton<br />
Mobray.<br />
Alderman, G. and Cottrill, B., 1993. Energy and prote<strong>in</strong> requirements of rum<strong>in</strong>ants. An advisory manual prepared by the AFRC<br />
Technical Committee on Responses to Nutrients. CAB International, Wall<strong>in</strong>gford.<br />
ARC, 1980. The Nutrient requirements of rum<strong>in</strong>ant livestock: technical review. Published on behalf of the Agricultural Research<br />
Council by the Commonwealth Agricultural Bureaux, Wall<strong>in</strong>gford, UK.<br />
Brockman, J.S. and Gwynn, P.E.J., 1988. Journal of the British Grassland Soci<strong>et</strong>y, 19, 169-155.<br />
BSFP, 2005. British Survey of Fertiliser Practice. Defra, London.<br />
McDonald, P., Greenhalgh, J.F.D., Morgan, C.A., Edwards, R., S<strong>in</strong>clair, L., Wilk<strong>in</strong>son, R., 2011. Animal Nutrition. 7th Edition,<br />
Prentice Hall, Harlow, UK.<br />
Measur<strong>in</strong>g holistic carbon footpr<strong>in</strong>ts for lamb and beef farms <strong>in</strong> the Cambrian mounta<strong>in</strong>s <strong>in</strong>itiative.<br />
Misselbrook, T.H., Chadwick, D.R., Gilhespy, S.L., Chambers, B.J., Smith, K.A., Williams, J, Dragosits, U, 2010. Inventory of<br />
Ammonia Emissions from UK Agriculture 2009. DEFRA Contract AC0112 Inventory Submission Report October 2010,<br />
http://preview.t<strong>in</strong>yurl.com/UK-NH3-Inv<br />
Nix, J.S., 2005. Farm Management Pock<strong>et</strong>book, 36 th (2006) Edition. The Andersons Centre, Imperial College London, Wye Campus.<br />
Sandars, D.L., Audsley, E., Can<strong>et</strong>e, C., Cumby, T.R., Scotford, I.M. and Williams, A.G., 2003. Environmental Benefits of Livestock<br />
Manure Management Practices and Technology by Life Cycle Assessment, Biosystems Eng<strong>in</strong>eer<strong>in</strong>g, 84,, 3., 267-281.<br />
Sneddon, S., Brophy, N., Li, Y., MacCarthy, J., Mart<strong>in</strong>ez, C., Murrells, T., Passant, N., Thomas, J., Thistl<strong>et</strong>hwaite, G., Tsagatakis, I.,<br />
Walker, H., Thomson, A., Cardenas, L., 2010. Greenhouse Gas Inventories for England, Scotland, Wales and Northern Ireland:<br />
1990 – 2008. AEAT, Harwell. http://preview.t<strong>in</strong>yurl.com/UK-GHGI-2008<br />
Taylor, R., Jones, A. Edwards-Jones, G., 2010. Countryside Commission for Wales Policy Research Report No. 10/8.<br />
http://preview.t<strong>in</strong>yurl.com/CCW-Sheep-CF<br />
Warkup, CC., Jones, H.E., Audsley, E, Williams, A.G., 2008. A study of the scope for the application of research <strong>in</strong> animal genomics<br />
and breed<strong>in</strong>g to reduce nitrogen and m<strong>et</strong>hane emissions from livestock based food cha<strong>in</strong>s. F<strong>in</strong>al report to Defra on project<br />
AC0204.<br />
Williams, A.G., Audsley, E., Sandars, D.L., 2006. D<strong>et</strong>erm<strong>in</strong><strong>in</strong>g the environmental burdens and resource use <strong>in</strong> the production of<br />
agricultural and horticultural commodities. F<strong>in</strong>al report to Defra on project IS0205. http://preview.t<strong>in</strong>yurl.com/Cranfield-IS0205<br />
309
PARALLEL SESSION 3C: SHEEP AND DAIRY PRODUCTION SYSTEMS 8 th Int. Conference on <strong>LCA</strong> <strong>in</strong> the<br />
Agri-<strong>Food</strong> Sector, 1-4 Oct <strong>2012</strong><br />
310<br />
Carbon footpr<strong>in</strong>t of sheep farms <strong>in</strong> <strong>France</strong> and New Zealand and<br />
m<strong>et</strong>hodology analysis<br />
Armelle Gac 1 , Stewart Ledgard 2,* , Elise Lor<strong>in</strong>quer 1 , Mark Boyes 2 , André Le Gall 1<br />
1 Institut de l'Elevage, Build<strong>in</strong>g and Environment Department, BP 85225, F-35652 Le Rheu, <strong>France</strong><br />
2 AgResearch, Ruakura Research Station, Hamilton, New Zealand<br />
Correspond<strong>in</strong>g author. E-mail: elise.lor<strong>in</strong>quer@idele.fr<br />
ABSTRACT<br />
For eco-labell<strong>in</strong>g of products, the environmental performance is an important factor and this can be significant for meat products.<br />
This study deals with the carbon footpr<strong>in</strong>t of French and New Zealand lamb production at the cradle-to-farm gate. In <strong>France</strong>, the<br />
analysis was performed on two contrast<strong>in</strong>g systems: “<strong>in</strong>-shed lamb” vs “grass lamb”, while <strong>in</strong> New Zealand, the ma<strong>in</strong> “grass” system<br />
was studied. The average carbon footpr<strong>in</strong>t of “grass” (19 farms) and “<strong>in</strong> shed” (85farms) French lamb was 12.7 and 12.9 kg CO2<br />
eq/kg live weight (LW) sold, respectively, and of the ma<strong>in</strong> New Zealand system (151 farms) was 8.52 kg CO2 eq/kg LW The results<br />
were highly dependent on m<strong>et</strong>hodological choices, especially regard<strong>in</strong>g enteric fermentation assessment and allocation. These results<br />
provide <strong>in</strong>sights <strong>in</strong>to requirements for build<strong>in</strong>g an <strong>in</strong>ternationally common framework to allow comparison of results.<br />
Keywords: life cycle assessment, lamb, farm<strong>in</strong>g systems, m<strong>et</strong>hodology<br />
1. Introduction<br />
The environment is becom<strong>in</strong>g <strong>in</strong>creas<strong>in</strong>gly important to consumers and there are economic implications<br />
<strong>in</strong> the comparison b<strong>et</strong>ween products based on their environmental performance. For eco-labell<strong>in</strong>g of products,<br />
this issue is particularly important for meat products because of their significant impact on climate<br />
change (Hamershlag, 2011). In this context, environmental assessments of farm systems and agricultural<br />
products are becom<strong>in</strong>g essential at an <strong>in</strong>ternational scale. This should <strong>in</strong>clude identification of m<strong>et</strong>hodology<br />
issues to ensure reliable and equitable comparisons. These environmental assessments will also <strong>in</strong>crease understand<strong>in</strong>g<br />
of the different emissions sources <strong>in</strong> order to identify options to reduce them.<br />
This study deals with the carbon footpr<strong>in</strong>t of French and New Zealand lamb production. These two countries<br />
are both major lamb producers and are react<strong>in</strong>g positively to environmental concerns about their production.<br />
New Zealand is the third largest sheep meat producer <strong>in</strong> the world (0.6 Mt) and is one of the largest<br />
exporters to Europe (FAO). It has <strong>in</strong>itiated environmental research to respond to the eco-labell<strong>in</strong>g <strong>in</strong>itiatives<br />
<strong>in</strong> Europe (e.g. Ledgard <strong>et</strong> al., 2010). <strong>France</strong> has the fourth largest ov<strong>in</strong>e flock <strong>in</strong> Europe and the planned<br />
move to environmental labell<strong>in</strong>g of products by the end of <strong>2012</strong> has lead to several recent or ongo<strong>in</strong>g studies<br />
on agricultural products (e.g. Dollé <strong>et</strong> al., 2011, Van der Werf <strong>et</strong> al., 2010). This study has been led by two<br />
applied research teams who have already worked on the topic of environmental impacts of lamb production.<br />
The objectives were to analyse the differences b<strong>et</strong>ween systems and countries and to share knowledge about<br />
m<strong>et</strong>hodological issues, through collaboration (Lor<strong>in</strong>quer, 2011).<br />
2. M<strong>et</strong>hods<br />
2.1. The lamb production systems<br />
The analysis was performed <strong>in</strong> the two countries for the year 2008, on a sample of farms. In <strong>France</strong>, sheep<br />
meat comes from a large diversity of farm<strong>in</strong>g systems, all with a significant part of the year where sheep are<br />
<strong>in</strong>-doors. A sample of farms represent<strong>in</strong>g two contrast<strong>in</strong>g specialised systems was selected: “<strong>in</strong>-shed lamb”<br />
(85 survey farms with significant use of hous<strong>in</strong>g systems) vs “grass lamb” (19 survey farms with significant<br />
use of perennial grasslands) (Table 1). The data comes from the French Breed<strong>in</strong>g N<strong>et</strong>work database led by<br />
Institut de l’Elevage. In New Zealand, the ma<strong>in</strong> “grass” system (mixed sheep and beef on North Island hill<br />
country; perennial grasslands) was studied (Table 1). The data comes from 151 farms surveyed by Beef +<br />
Lamb New Zealand.<br />
Most of the technical data were provided by those survey sources (size of the flock, weight, area of the<br />
farm, practices, <strong>et</strong>c.). Nitrogen excr<strong>et</strong>ion and the dry matter <strong>in</strong>take by the animals was assessed us<strong>in</strong>g <strong>in</strong>formation<br />
on the forage stocks and feed purchased by farms <strong>in</strong> <strong>France</strong>. In New Zealand it was calculated us<strong>in</strong>g a<br />
validated energy-requirement model (Clark <strong>et</strong> al., 2007; from the National Inventory m<strong>et</strong>hods) based on<br />
animal productivity data.
PARALLEL SESSION 3C: SHEEP AND DAIRY PRODUCTION SYSTEMS 8 th Int. Conference on <strong>LCA</strong> <strong>in</strong> the<br />
Agri-<strong>Food</strong> Sector, 1-4 Oct <strong>2012</strong><br />
Table 1. Technical description of the lamb production systems studied.<br />
Technical param<strong>et</strong>ers<br />
<strong>France</strong> “In-shed” <strong>France</strong> “Grass” New Zealand “Grass”<br />
Number of survey farms 85 19 151<br />
Ma<strong>in</strong> characteristics Significant use of hous- Significant use of peren- Significant use of peren<strong>in</strong>gnial<br />
grasslands<br />
nial grasslands<br />
Mixed (M) or specialised (S) S S M<br />
Average effective area (ha) 102 114 430<br />
% of grassland <strong>in</strong> the area (%) 63% 88% 100%<br />
Number of ewes / farm (head) 555 670 2000<br />
Ewe productivity (lambs weaned /<br />
ewe/year)<br />
1.35 1.19 1.21<br />
Kg concentrate fed / ewe / year 210 145 0<br />
Time of graz<strong>in</strong>g (days / year) 205 280 365<br />
2.2. Environmental assessment<br />
The system boundary of the study covered the production of lamb from cradle-to-farm-gate. The functional<br />
unit is one kg of total sheep live weight exit<strong>in</strong>g the farm gate. Capital, medic<strong>in</strong>es and clean<strong>in</strong>g products<br />
were not <strong>in</strong>cluded.<br />
Each system was analysed us<strong>in</strong>g a m<strong>et</strong>hodology developed to fit its own country. Those m<strong>et</strong>hodologies<br />
are described respectively <strong>in</strong> the GES’TIM guidebook (Gac <strong>et</strong> al., 2010) for <strong>France</strong> and by Ledgard <strong>et</strong> al.,<br />
(2010) for New Zealand. Table 2 lists the models used for each source of emissions, occurr<strong>in</strong>g on-farm and<br />
off-farm, as well as the atmospheric carbon stored by soil under pastures and hedges for <strong>France</strong> (as an assumption<br />
of the compensation of emissions). The impact on climate change was assessed by us<strong>in</strong>g the 100year<br />
global warm<strong>in</strong>g potentials proposed by IPCC (2007).<br />
To ensure comparability of the results, a common mass allocation was firstly used to allocate impacts b<strong>et</strong>ween<br />
meat and wool, the two co-products of the sheep production systems.<br />
Table 2. Sources of emissions and models used <strong>in</strong> <strong>France</strong> and New Zealand<br />
Sources of emissions Gas <strong>France</strong> New-Zealand<br />
Enteric fermentation CH4 Vermorel <strong>et</strong> al., 2008 Clark <strong>et</strong> al., 2007 (Tier 2)<br />
Manure <strong>in</strong> build<strong>in</strong>gs CH4, N2O GES’TIM -<br />
Manure storage CH4, N2O GES’TIM -<br />
Graz<strong>in</strong>g CH4, N2O GES’TIM Overseer®<br />
Nitrogen <strong>in</strong>puts - direct (fertilisers, crop residues)<br />
and <strong>in</strong>direct (volatilisation, leach<strong>in</strong>g)<br />
N2O IPCC 2006 Overseer®<br />
Energy use on farm (fuel combustion) CO2 GES’TIM<br />
Inputs (e.g., feed, fertilisers, pesticides, energy CO2eq GES’TIM Eco<strong>in</strong>vent, Ledgard <strong>et</strong> al.,<br />
purchased)<br />
2010, 2011<br />
Carbon storage (pasture, hedges)<br />
Overseer® (Wheeler <strong>et</strong> al., 2007)<br />
CO2 Arrouays <strong>et</strong> al., 2002 -<br />
A sensitivity analysis was performed by compar<strong>in</strong>g the same m<strong>et</strong>hodologies across both countries, i.e.,<br />
the New Zealand data s<strong>et</strong> was analysed with the French m<strong>et</strong>hodology and vice versa. Effects of allocation<br />
m<strong>et</strong>hod were also tested, i.e., economic vs mass allocation.<br />
3. Results<br />
The average carbon footpr<strong>in</strong>t of French lamb was 12.9 kg CO2 eq/kg live weight (LW) sold (Table 3).<br />
There was no significant difference b<strong>et</strong>ween the average values for the two French systems (Grass 12.74 –<br />
19 farms surveyed; In-shed 12.94 – 85 farms surveyed), but there was a high variability b<strong>et</strong>ween farms<br />
with<strong>in</strong> each system (standard deviations of 2.9 and 2.8, respectively). The carbon footpr<strong>in</strong>t of the ma<strong>in</strong> New<br />
Zealand system was 8.52 kg CO2 eq/kg LW.<br />
311
PARALLEL SESSION 3C: SHEEP AND DAIRY PRODUCTION SYSTEMS 8 th Int. Conference on <strong>LCA</strong> <strong>in</strong> the<br />
Agri-<strong>Food</strong> Sector, 1-4 Oct <strong>2012</strong><br />
Table 3. Carbon footpr<strong>in</strong>t of French and New Zealand lamb at the farm gate and the relative contribution<br />
from different sources of emissions (us<strong>in</strong>g mass allocation).<br />
<strong>France</strong> <strong>France</strong> <strong>France</strong> New Zealand<br />
Average “In-shed” “Grass” “Grass”<br />
Carbon footpr<strong>in</strong>t (kg CO2 eq/ kg LW) 12.9 12.9 12.7 8.5<br />
Enteric fermentation (%) 53.3 53.1 54.1 72.5<br />
Manure <strong>in</strong> build<strong>in</strong>gs (%) 5.7 5.9 4.5 -<br />
Manure storage (%) 3.7 3.8 3.2 -<br />
Fertiliser use (%) 6.3 6.5 5.5 3.5<br />
Graz<strong>in</strong>g (%) 10.6 9.9 13.3 20.1<br />
Energy use on farm (%) 3.3 3.2 3.9 1.4<br />
Inputs 1 (%) 17.0 17.5 15.0 2.5<br />
Carbon compensation (%)<br />
1<br />
Inputs: feed, fertilisers, energy purchased, ...<br />
25.9 23.6 36.7 -<br />
Carbon sequestration <strong>in</strong> pastoral soils can potentially have a significant effect on reduc<strong>in</strong>g the carbon<br />
footpr<strong>in</strong>t at farm level. In the French Grass system, application of the carbon sequestration m<strong>et</strong>hod of Arrouays<br />
<strong>et</strong> al., (2002) was calculated to reduce GHG emissions by 36.7% (pasture constitut<strong>in</strong>g 88% of the farm<br />
area), while <strong>in</strong> the In-shed system pastures it reduced emissions by 23.6% (pasture constitut<strong>in</strong>g 63% of the<br />
farm area).<br />
The sensitivity analysis showed that results were also highly dependent on m<strong>et</strong>hodological choices. The<br />
cross-test performed resulted <strong>in</strong> variation of results b<strong>et</strong>ween -2.5% to +47%. In particular, two po<strong>in</strong>ts can be<br />
mentioned. M<strong>et</strong>hane from enteric fermentation, which is the ma<strong>in</strong> source of emissions <strong>in</strong> <strong>France</strong> (53%) and<br />
<strong>in</strong> New Zealand (73%) was calculated us<strong>in</strong>g tier 1 and 2 m<strong>et</strong>hods respectively.<br />
The choice of allocation b<strong>et</strong>ween meat and wool is also crucial; there was a small difference b<strong>et</strong>ween<br />
countries when mass allocation was used and a much larger difference us<strong>in</strong>g economic allocation (Table 4).<br />
In New Zealand, wool has an economic value because of its use <strong>in</strong> carp<strong>et</strong> mak<strong>in</strong>g, whereas <strong>in</strong> <strong>France</strong> it has<br />
little economic value (less than 1% of total economic r<strong>et</strong>urns <strong>in</strong> 2008). This led to variation of results from -<br />
5.9% to 11.7%.<br />
Table 4. Percentage of the carbon footpr<strong>in</strong>t allocated to meat depend<strong>in</strong>g on the allocation m<strong>et</strong>hodology.<br />
Country Economic allocation Mass allocation<br />
<strong>France</strong> 99.7% 89.6%<br />
New Zealand 78.0% 85.4%<br />
4. Discussion<br />
Previous lamb carbon footpr<strong>in</strong>t studies cover<strong>in</strong>g the cradle-to-farm-gate showed a wide variation <strong>in</strong> results<br />
(Table 5). As <strong>in</strong> our study, this could be expla<strong>in</strong>ed by technical characteristics of the systems and also<br />
by m<strong>et</strong>hodological choices. Most of those studies represented European production systems. Our results are<br />
<strong>in</strong> the range of those presented, especially for <strong>France</strong>.<br />
Table 5. Carbon footpr<strong>in</strong>ts of lamb from countries <strong>in</strong> some publications<br />
Publication Country Carbon footpr<strong>in</strong>ts <strong>in</strong> kg CO2eq/ kg LW<br />
average and (range of values)<br />
Ledgard <strong>et</strong> al., 2010 New Zealand 8.6<br />
Leip <strong>et</strong> al., 2010 Europe 9.5 1<br />
Dollé <strong>et</strong> al., 2001 <strong>France</strong> 9.7 (8.3-11.7)<br />
Benoit <strong>et</strong> al., 2010 <strong>France</strong> 9.7 1<br />
Williams <strong>et</strong> al., 2006 UK 6.6 (4.7-8.2) 1<br />
Eblex, 2009 UK 6.9 1<br />
1 The results were published with the FU 1 kg of carcass weight meat. Conversion <strong>in</strong>to LW us<strong>in</strong>g a standard kill<strong>in</strong>g-out<br />
percentage of 47%.<br />
The higher carbon footpr<strong>in</strong>t of French lamb was due to the use of external feed <strong>in</strong>puts and the fact that<br />
sheep are housed <strong>in</strong>-shed for part of the year <strong>in</strong> all French systems, with emissions from manure management<br />
(especially for the In-shed system <strong>in</strong> both cases). Conversely, <strong>in</strong> New Zealand, where productivity is often<br />
higher due to warmer climatic conditions, the animals stay outside all year round eat<strong>in</strong>g perennial pastures<br />
and therefore there are no gaseous emissions l<strong>in</strong>ked to external food production and manure management.<br />
312
PARALLEL SESSION 3C: SHEEP AND DAIRY PRODUCTION SYSTEMS 8 th Int. Conference on <strong>LCA</strong> <strong>in</strong> the<br />
Agri-<strong>Food</strong> Sector, 1-4 Oct <strong>2012</strong><br />
The m<strong>et</strong>hodological choices <strong>in</strong>fluence the results. Allocation procedure is a crucial factor: ideally, it has<br />
to be common b<strong>et</strong>ween countries but the choice should be mean<strong>in</strong>gful <strong>in</strong> every context. That was not the case<br />
for economic allocation, usually used <strong>in</strong> New Zealand, because <strong>in</strong> <strong>France</strong> there was no real mark<strong>et</strong> for wool.<br />
Another factor is the m<strong>et</strong>hod of modell<strong>in</strong>g of the systems and the environmental fluxes. In <strong>France</strong>, a lot has<br />
been done concern<strong>in</strong>g data collection at farm level to assess, among others the animal <strong>in</strong>take and excr<strong>et</strong>ion,<br />
while the models concern<strong>in</strong>g the emissions were quite simple (emission factors). In contrast, <strong>in</strong> New Zealand,<br />
the pasture <strong>in</strong>take was modelled due to <strong>in</strong>accuracy <strong>in</strong> estimat<strong>in</strong>g it <strong>in</strong> hill country conditions. It is recommended<br />
that sufficiently d<strong>et</strong>ailed models are used that have been tested and validated for pasture types<br />
and farm systems and adapted for the country of <strong>in</strong>terest. In that way the models will reflect the ma<strong>in</strong> d<strong>et</strong>erm<strong>in</strong><strong>in</strong>g<br />
factors and be used to identify options for <strong>in</strong>creas<strong>in</strong>g feed conversion efficiency and reduc<strong>in</strong>g the<br />
carbon footpr<strong>in</strong>t.<br />
To make the results comparable b<strong>et</strong>ween countries, there is a need to build a common m<strong>et</strong>hodology about<br />
the carbon footpr<strong>in</strong>t of lamb. This requires a common framework with respect to some m<strong>et</strong>hodological rules<br />
but with the possibility for countries to take <strong>in</strong>to account their specificities and to use their own validated<br />
models or param<strong>et</strong>ers.<br />
5. Conclusions<br />
Our study provides data on the carbon footpr<strong>in</strong>t of lamb for two countries with specific production systems.<br />
M<strong>et</strong>hodological issues were very important because of their <strong>in</strong>fluence on the results. Currently, because<br />
of the potential economical stakes l<strong>in</strong>ked to this topic and the need to build an <strong>in</strong>ternational common<br />
framework to allow comparison of results, a range of <strong>in</strong>ternational groups are work<strong>in</strong>g on a standard for carbon<br />
footpr<strong>in</strong>t<strong>in</strong>g of lamb, through the <strong>in</strong>itiative of the Beef + Lamb New Zealand organisation. This should<br />
be available <strong>in</strong> 2013. This group has also already identified requirements for future work, <strong>in</strong> the areas of soil<br />
carbon sequestration and development of a biophysical allocation approach for meat vs wool.<br />
In the future, it will be important to obta<strong>in</strong> results over several years to analyse the annual variability of<br />
the results. Indeed, it is known that the practices could vary a lot from year to year, due to climatic or economic<br />
conditions, such as drought, high costs of some <strong>in</strong>puts, diseases and mark<strong>et</strong> opportunities.<br />
Learn<strong>in</strong>gs from studies such as this one, <strong>in</strong>volv<strong>in</strong>g research teams from several countries, enables identification<br />
of key factors for carbon footpr<strong>in</strong>t and life cycle assessment m<strong>et</strong>hodology, to ensure objective comparability<br />
of the ecological performance of systems.<br />
6. Acknowledgements<br />
The authors want to thank the farmers of the French Breed<strong>in</strong>g N<strong>et</strong>work and Beef+LambNZ for farm data,<br />
Interbev (the French Meat sector board), Institut de l’Elevage and AgResearch for its fund<strong>in</strong>g.<br />
7. References<br />
Arrouays, D., Balesdent, J., Germon, J.C., Jay<strong>et</strong>, P.A., Soussana, J.F., Stengel, P., 2002. Contribution à la lutte contre l'eff<strong>et</strong> de serre.<br />
Stocker du carbone dans les sols agricoles de <strong>France</strong>? Expertise scientifique collective. INRA report. 332 pp.<br />
Benoit, M., Laigner G., Roulenc, M., 2010. Emissions de gaz à eff<strong>et</strong> de serre <strong>et</strong> consommations d’énergie en élevage ov<strong>in</strong> viande.<br />
Renc. Rech. Rum<strong>in</strong>ants 17, 351-354.<br />
Clark, H., Kelliher, F.M., Waghorn, G.C., Johnstone, P., Rys, G., 2007. An updated New Zealand enteric m<strong>et</strong>hane <strong>in</strong>ventory calculated<br />
us<strong>in</strong>g algorithms developed from an analysis of New Zealand experiments conducted b<strong>et</strong>ween 1997 and 2005. Greenhouse<br />
gas and Animal Agriculture Conference Book. Christchurch, New Zealand. p. 163.<br />
Dollé J.B., Manneville V., Gac A., Charpiot A., 2011. Emissions de gaz à eff<strong>et</strong> de serre <strong>et</strong> consommations d'énergie des viandes<br />
bov<strong>in</strong>es <strong>et</strong> ov<strong>in</strong>es françaises: revue bibliographique <strong>et</strong> évaluations sur l’amont agricole. Institut de l’Elevage, <strong>France</strong>.<br />
Eblex, 2009. Change <strong>in</strong> the air. The English beef and sheep production roadmap-Phase 1. AHDB. 50 p.<br />
FAO. Faostat.fao.org<br />
Gac, A., Cariolle, M., Deltour, L., Dollé, J.B., Espagnol, S., Flén<strong>et</strong>, F., Gu<strong>in</strong>gand, N., Lagadec, S., Le Gall, A., Lellahi, A., Malaval,<br />
C., Ponchant, P., Tailleur, A., 2010. GES'TIM — Guide méthodologique pour l'estimation des impacts des activités agricoles sur<br />
l'eff<strong>et</strong> de serre. Réalisé dans le cadre du proj<strong>et</strong> «Gaz à Eff<strong>et</strong> de Serre <strong>et</strong> Stockage de Carbone en exploitations agricoles» (CAS-<br />
DAR 6147).<br />
Hamershlag, K., 2011. Meat eater's guide to climate change and health. Environmental Work<strong>in</strong>g Group, USA.<br />
IPCC, 2006. 2006 IPCC Guidel<strong>in</strong>es for National Greenhouse Gas Inventories. Volume 4: Agriculture, Forestry and Other Land Use.<br />
Prepared by the National Greenhouse Gas Inventories Programme, Eggleston H.S., Buendia L., Miwa K., Ngara T. and Tanabe<br />
K. (Eds). Published: IGES, Japan.<br />
IPCC, 2007. IPCC Fourth Assessment Report (AR4) — Climate Change 2007. In: Solomon, S., Q<strong>in</strong>, D., Mann<strong>in</strong>g, M., Chen, Z.,<br />
Marquis, M., Averyt, K.B., Tignor, M., Miller, H.L. (Eds.), Work<strong>in</strong>g Group I Report “The Physical Science Basis". Cambridge<br />
University Press, Cambridge, UK, New York, NY, USA.<br />
Ledgard, S.F., Lieffer<strong>in</strong>g, M., McDevitt, J., Boyes, M. and Kemp, R., 2010. A greenhouse gas footpr<strong>in</strong>t study for exported New<br />
Zealand lamb. Report for Meat Industry Association, Ballance Agri-nutrients, Landcorp and MAF. AgResearch, Hamilton. 26p.<br />
313
PARALLEL SESSION 3C: SHEEP AND DAIRY PRODUCTION SYSTEMS 8 th Int. Conference on <strong>LCA</strong> <strong>in</strong> the<br />
Agri-<strong>Food</strong> Sector, 1-4 Oct <strong>2012</strong><br />
Ledgard, S.F., Boyes, M. and Brentrup, F., 2011. Life cycle assessment of local and imported fertilisers used on New Zealand farms.<br />
In: Currie, L.D., Christensen, C.L. (Eds), “Add<strong>in</strong>g to the knowledge base for the nutrient manager”.<br />
http://flrc.massey.ac.nz/publications.html. Occasional Report No. 24, Fertilizer and Lime Research Centre, Massey University,<br />
Palmerston North, New Zealand. 13p.<br />
Leip, A., Weiss, F., Wassenaar, T., Perez, I., Fellmann, T., Loudjani, P., Tubiello, F., Grandgirard, D., Monni, S., Biala, K., 2010.<br />
Evaluation of the livestock sector's contribution to the EU greenhouse gas emissions (GGELS), f<strong>in</strong>al report. Europ. Comm. Jo<strong>in</strong>t<br />
Res. Centre, 32p.<br />
Lor<strong>in</strong>quer, E., 2011. L’analyse environnementale de la viande ov<strong>in</strong>e française <strong>et</strong> néo-zélandaise: Enjeux-Résultats. Doit-on aller vers<br />
une harmonisation des méthodes ? Mémoire de f<strong>in</strong> d’études. ENSAIA. 39 p.<br />
Van der Werf, H.M.G., Gaillard, G., Biard, Y., Koch, P., Bass<strong>et</strong>-Mens, C., Gac, A., Lellahi, A., Deltour, L., 2010. Creation of a<br />
public <strong>LCA</strong> database of French agricultural raw products: agriBALYSE. Proceed<strong>in</strong>gs of the 7 th International Conference on Life<br />
Cycle Assessment <strong>in</strong> the Agri-<strong>Food</strong> Sector. Bari, Italy, September 22-24, 2010.<br />
Vermorel, M., Jouany, J.P., Eugène, M., Sauvant, D., Nobl<strong>et</strong>, J., Dourmad, J.Y., 2008. Evaluation quantitative des émissions de<br />
méthane entérique par les animaux d'élevage en 2007 en <strong>France</strong>. INRA Prod. Anim. 21, 403–418.<br />
Wheeler, D.M., Ledgard, S.F., de Kle<strong>in</strong>, C.A.M., 2007. Us<strong>in</strong>g the OVERSEER nutrient budg<strong>et</strong> model to estimate on-farm greenhouse<br />
gas emissions. Australian Journal of Experimental Agriculture 48, 99-103.<br />
Williams, A.G., Audsley, E., Sandars, D.L., 2006. D<strong>et</strong>erm<strong>in</strong><strong>in</strong>g the environmental burdens and resource use <strong>in</strong> the production of<br />
agricultural and horticultural commodities. Ma<strong>in</strong> Report Defra Research Project ISO205, Bedford: Cranfield University and Defra.<br />
314
PARALLEL SESSION 3C: SHEEP AND DAIRY PRODUCTION SYSTEMS 8 th Int. Conference on <strong>LCA</strong> <strong>in</strong> the<br />
Agri-<strong>Food</strong> Sector, 1-4 Oct <strong>2012</strong><br />
Regionalised land use impact modell<strong>in</strong>g of milk production <strong>in</strong> the U.S.<br />
Rosie Saad 1,* , Dom<strong>in</strong>ique Maxime 2 , Manuele Margni 2<br />
1<br />
Quantis, 395 Laurier Ouest, Montreal, QC, H2V 2K3, Canada ;<br />
2<br />
CIRAIG, Mathematical and Industrial Eng<strong>in</strong>eer<strong>in</strong>g Departement, P.O. Box 6079, École Polytechnique de Montréal (Qc), Canada<br />
H3C 3A7<br />
<br />
Correspond<strong>in</strong>g author. E-mail: rosie.saad@quantis-<strong>in</strong>tl.com<br />
ABSTRACT<br />
As a natural resource essential <strong>in</strong> the food and agriculture sector, the susta<strong>in</strong>able use of land requires <strong>in</strong>formed decisions based on a<br />
mean<strong>in</strong>gful impact assessment. However, most studies address<strong>in</strong>g milk and dairy-based products account for land use impacts as an<br />
<strong>in</strong>ventory data related, by simply report<strong>in</strong>g the amount <strong>in</strong> square m<strong>et</strong>ers of land occupied or transformed with<strong>in</strong> a time span. Part of<br />
an US fluid milk beyond carbon Life Cycle Assessment study, this project aims to provide <strong>in</strong>sights on a regionalized assessment of<br />
land use impacts related to milk production. The ma<strong>in</strong> focus is to assess the role of dairy livestock, for which different supply mix<br />
models and feed produced at different states locations were assumed <strong>in</strong> the ration. A spatial differentiated approach was considered,<br />
us<strong>in</strong>g regionalized impact factors at the state level to address potential land use impacts.<br />
Keywords: land use, impact, spatial, milk, <strong>LCA</strong><br />
1. Introduction<br />
Land is a natural resource that is often taken for granted, y<strong>et</strong> essential <strong>in</strong> the food and agriculture sector.<br />
Thus, a susta<strong>in</strong>able use of land requires <strong>in</strong>formed decisions based on a mean<strong>in</strong>gful impact assessment <strong>in</strong> Life<br />
Cycle Assessment (<strong>LCA</strong>), a decision-support tool used to address potential environmental impacts of a<br />
product over its entire life cycle. So far, most studies address<strong>in</strong>g milk and dairy-based products account for<br />
land use impacts based on an <strong>in</strong>ventory data related, simply by report<strong>in</strong>g the amount <strong>in</strong> hectare or square<br />
m<strong>et</strong>ers of land occupied or transformed with<strong>in</strong> a time span (Thomassen <strong>et</strong> al., 2008; Bass<strong>et</strong>-Mens <strong>et</strong> al.,<br />
2009; Roy <strong>et</strong> al., 2009).<br />
In light of its extremely slow renewal rate (Pimentel <strong>et</strong> al., 1987), soil is considered to be a non-renewable<br />
resource. Though un<strong>in</strong>tentional, mechanisms of natural environment quality d<strong>et</strong>erioration <strong>in</strong>duce substantial<br />
changes <strong>in</strong> land cover and land use, constitut<strong>in</strong>g a primary source of soil degradation (Lamb<strong>in</strong> <strong>et</strong> al., 2001).<br />
While such impacts are highly relevant from an environmental perspective, the development of land use<br />
impact assessment m<strong>et</strong>hods are still <strong>in</strong> their <strong>in</strong>fancy. Most m<strong>et</strong>hods found <strong>in</strong> the literature account for<br />
impacts on biodiversity and are limited to one geographical scope (e.g. Europe) result<strong>in</strong>g <strong>in</strong> damages to<br />
ecosystem quality. Recent developments have advanced the necessity to address impacts on soil ecological<br />
functions and their contribution to ecosystem services (Mila i Canals <strong>et</strong> al., 2007; LULCIA, 2008-<strong>2012</strong>).<br />
1.1. Goal and scope<br />
This project is part of US fluid milk comprehensive <strong>LCA</strong> study (Jolli<strong>et</strong> <strong>et</strong> al., <strong>2012</strong>). The system boundaries<br />
<strong>in</strong>clude the upstream processes up to the farm-gate level, namely feed production (on farm and purchased),<br />
fertilisers and pesticides application, animal and manure management as well as the downstream<br />
processes, such as milk process<strong>in</strong>g, transportation/distribution, r<strong>et</strong>ail and use at the consumer level. The<br />
functional unit is def<strong>in</strong>ed as one kg of fat prote<strong>in</strong> corrected milk (FPCM).<br />
The ma<strong>in</strong> goal of this paper is to provide <strong>in</strong>sights on a regionalised assessment of land use impacts related<br />
to milk production <strong>in</strong> the US with a particular focus on the feed production life cycle stage and soil ecological<br />
functions impact <strong>in</strong>dicators and biodiversity.<br />
2. M<strong>et</strong>hods<br />
2.1. Life Cycle Inventory<br />
From a Life Cycle <strong>in</strong>ventory perspective, land occupation processes needed at each life cycle stage are<br />
accounted for. The correspond<strong>in</strong>g <strong>in</strong>ventory flows are measured <strong>in</strong> units of area used dur<strong>in</strong>g a period of time<br />
(m 2 .year). For feed production, land occupation flows refer to agricultural activities, which were assumed to<br />
occur <strong>in</strong> exist<strong>in</strong>g agricultural land <strong>in</strong> the U.S. Thus, no land transformation was assumed. In addition, it is<br />
considered that the land is occupied dur<strong>in</strong>g the year long for agricultural use, <strong>in</strong>dependently of the length of<br />
the grow<strong>in</strong>g season.<br />
315
PARALLEL SESSION 3C: SHEEP AND DAIRY PRODUCTION SYSTEMS 8 th Int. Conference on <strong>LCA</strong> <strong>in</strong> the<br />
Agri-<strong>Food</strong> Sector, 1-4 Oct <strong>2012</strong><br />
Given data availability limitations on agricultural land uses and grow<strong>in</strong>g seasons <strong>in</strong> the same year, no allocation<br />
among different types of agricultural production (crop rotations) was established. Allocation b<strong>et</strong>ween<br />
milk and meat was done based on the quantity of feed required to make milk and meat, as feeds have<br />
different available energies for growth and lactation. Other co-products allocations <strong>in</strong>clude soybean and soybean<br />
meal, corn gra<strong>in</strong> and dried distillers gra<strong>in</strong>s with solubles (DDGS).<br />
To perform land use impact assessment related to feed production, feed mix <strong>in</strong> the rations and crop production<br />
data were collected. Average rations (<strong>in</strong> kg dry matter / kg FPCM) that were identified <strong>in</strong> the Milk<br />
carbon footpr<strong>in</strong>t study (Thoma <strong>et</strong> al., 2010) and calculated for each of all five major dairy productions regions<br />
were considered. In addition, annual data on crop production and area harvested were collected at the<br />
state level for each feed component from the United States Department of Agriculture (USDA) and National<br />
Agricultural Statistics Service (NASS) (USDA NASS, 2010). These param<strong>et</strong>ers were also used to calculate<br />
the correspond<strong>in</strong>g annual yields of production.<br />
Eleven ma<strong>in</strong> feed components were considered <strong>in</strong> the ration, <strong>in</strong>clud<strong>in</strong>g:<br />
commodity crops that are traded and shipped on national scale mark<strong>et</strong>s are assumed to be produced<br />
<strong>in</strong> any state<br />
domestic crops such as light forage and haylage are assumed to be produced with<strong>in</strong> a region (out<br />
of the five def<strong>in</strong>ed regions) where the farm is located<br />
pasture and local crops that are heavy or not transportable feed are assumed to be grown locally<br />
on-farm<br />
Table 1 shows the different feed supply mix models that were assumed for a spatial impact assessment related<br />
to feed production.<br />
Table 1. Supply mix models for each feed components<br />
Supply mix models Feed components<br />
National, based on <strong>in</strong>ter stated transport data DDGS dry<br />
DDGS w<strong>et</strong><br />
Corn gra<strong>in</strong><br />
Soybean<br />
Soybean meal<br />
State Alfalfa silage<br />
Corn silage<br />
Grass pasture<br />
Grass silage<br />
Regional Alfalfa hay<br />
Grass hay<br />
2.2. Life Cycle Impact Assessment<br />
From a life cycle impact assessment (LCIA) perspective, the m<strong>et</strong>hod used is built upon recommendations<br />
of previously published works as well as the framework and the pr<strong>in</strong>ciples established by the UNEP/SETAC<br />
Life Cycle Initiative Task Force on Land Use LCIA phase 1 (Milà i Canals <strong>et</strong> al., 2007) and phase 2 (LUL-<br />
CIA, 2008-<strong>2012</strong>). Unlike traditional categories that assess impacts of emissions, land use impact characterisation<br />
is not structured accord<strong>in</strong>g to the conventional steps of fate, exposure and effect, nor is it based on<br />
mass and energy balance. Rather, the assessment stems from the change <strong>in</strong> environmental quality (EQ) <strong>in</strong>duced<br />
by land use over time (Fig. 1).<br />
316<br />
Figure 1. Environmental quality curve (adapted from Milà i Canals <strong>et</strong> al., (2007), Saad <strong>et</strong> al., (2011))
PARALLEL SESSION 3C: SHEEP AND DAIRY PRODUCTION SYSTEMS 8 th Int. Conference on <strong>LCA</strong> <strong>in</strong> the<br />
Agri-<strong>Food</strong> Sector, 1-4 Oct <strong>2012</strong><br />
The general equation used to quantify land use impact is shown <strong>in</strong> Eq.1.<br />
<br />
<br />
Q(t)).dt ( A.t = CF flow<br />
LOI Inventory<br />
occ occ E<br />
Eq.1<br />
where LOI corresponds to land occupation impacts, A is the used land surface area (m 2 ), tocc the occupation<br />
time (the product of both term be<strong>in</strong>g the <strong>in</strong>ventory flow) [m 2 .yr] and CFocc is the characterisation factor<br />
for the occupation [m 2 ·yr·impact_<strong>in</strong>dicator].<br />
2.3. Characterisation factor data<br />
Location is required to enable the l<strong>in</strong>k b<strong>et</strong>ween the <strong>in</strong>ventory flow and a spatial impact assessment us<strong>in</strong>g<br />
regionalised impact factors, also known as characterisation factors (CFs).<br />
Different impact pathways are considered, impacts on biodiversity and the impacts on a series of ecosystem<br />
services. CFs from Pfister <strong>et</strong> al., (2010) are used for impacts on biodiversity. Such factors are based on<br />
the ones provided <strong>in</strong> EI 99 (Goedkoop and Spriensma, 2001) and <strong>in</strong>clude ecosystem scarcity and vulnerability.<br />
CFs for impacts on soil ecological functions, namely groundwater recharge potential, erosion resistance<br />
potential, physico-chemical filtration and mechanical filtration potential are provided by Saad <strong>et</strong> al., (submitted).<br />
An example of regionalised CFs for land use agricultural impacts on biodiversity adapted to the states<br />
geographical context is illustrated <strong>in</strong> Figure 2. The CF for the rema<strong>in</strong><strong>in</strong>g impact categories are given <strong>in</strong> the<br />
ma<strong>in</strong> report (Jolli<strong>et</strong> <strong>et</strong> al., <strong>2012</strong>).<br />
Figure 2. Land use impact factor for biodiversity for the U.S. geographical context<br />
3. Results<br />
3.1 Inventory flow for feed production<br />
Yield production measured <strong>in</strong> kg crop dry matter produced per unit surface (kg DM/m 2 ) is a ma<strong>in</strong> param<strong>et</strong>er<br />
that enables convert<strong>in</strong>g a crop quantity needed to be grown <strong>in</strong>to the necessary harvested area. Thus,<br />
the smaller the yield, the larger the harvested area is required. As illustrated <strong>in</strong> Figure 3, yields for corn gra<strong>in</strong><br />
vary considerably across the states from 0.4 to 1.1 kg DM/m 2 . In addition to Western U.S. states, where<br />
Wash<strong>in</strong>gton has the highest yield, states located <strong>in</strong> the Midwest, not only have high yields but also high productivity<br />
(annual total bushels produced). These high-yield regions require a smaller harvested area than<br />
states located <strong>in</strong> the South-eastern U.S., which have smaller yields. In general, b<strong>et</strong>ween 1.5 and 2.5 m 2 of<br />
land area are needed to be harvested to produce 1 kg DM of corn gra<strong>in</strong>.<br />
Comb<strong>in</strong><strong>in</strong>g state corn gra<strong>in</strong> yields (on the y-axis) with national production fractions (on the x-axis), the<br />
variable width graph presented <strong>in</strong> Figure 4 <strong>in</strong>dicates the total land use area requirement needed <strong>in</strong> each state<br />
to produce one kg of corn gra<strong>in</strong> at the national level. Results per state, shown as the areas of the rectangles,<br />
highlight states <strong>in</strong> the Corn Belt (Iowa, Ill<strong>in</strong>ois, Nebraska, M<strong>in</strong>nesota and Indiana) hav<strong>in</strong>g high crop production<br />
fractions and moderate yields. Conversely, states like South Dakota have slightly smaller yields (higher<br />
land area) but smaller production, thus do not have sizeable contributions to corn gra<strong>in</strong> land use area requirements<br />
at the national level. Total land use impacts, reported as land use area requirements, for national<br />
corn gra<strong>in</strong> production sum up to 1.26 m 2 .yr/kg DM.<br />
317
PARALLEL SESSION 3C: SHEEP AND DAIRY PRODUCTION SYSTEMS 8 th Int. Conference on <strong>LCA</strong> <strong>in</strong> the<br />
Agri-<strong>Food</strong> Sector, 1-4 Oct <strong>2012</strong><br />
Figure 3. Yield production of corn gra<strong>in</strong> per state<br />
(kg DM corn gra<strong>in</strong>/m 2 )<br />
3.2 Land use impacts related to feed production<br />
318<br />
Figure 4. Land use area requirements and contribution<br />
to corn gra<strong>in</strong> national production per state (m 2 ·yr/kg<br />
DM corn gra<strong>in</strong>)<br />
Part of the national impact assessment, Figure 5 <strong>in</strong>dicates land use impact factors on biodiversity for the<br />
production of corn gra<strong>in</strong> <strong>in</strong> each state. Although results show that highest potential impacts occur <strong>in</strong> Florida<br />
and Alabama, such states do not necessarily produce significant amounts of corn gra<strong>in</strong>. Thus, potential land<br />
use impacts on biodiversity were quantified based on two key-param<strong>et</strong>ers. These are <strong>in</strong>dicated <strong>in</strong> the variable<br />
width graph presented <strong>in</strong> Figure 6; the land use impact on biodiversity due to state production of corn gra<strong>in</strong><br />
(on the y axis) and the national crop production fraction (on the x axis).<br />
Typical land use impacts on biodiversity are expressed <strong>in</strong> units of potentially disappeared fraction (PDF)<br />
of species on a unit surface. Results are shown as the area of each state rectangle, quantify<strong>in</strong>g land use impacts<br />
per kg of crop (PDF.m 2 .yr /kg DM) at the national level. A state with a high crop production fraction<br />
and a high impact factor on biodiversity contributes to a larger share of the national impacts of the crop produced.<br />
States with the highest impacts are Indiana (18% of total share), Ill<strong>in</strong>ois (16%) and Iowa (16%). Land<br />
use impacts on biodiversity for a national corn gra<strong>in</strong> production sum up to a total of 1.24 m 2 .yr.PDF/kg DM.<br />
Figure 5. Impacts on biodiversity per state per kg<br />
DM corn gra<strong>in</strong> (m 2 .yr.PDF/kg DM corn gra<strong>in</strong>)<br />
3.3 Land use impacts related to milk production<br />
Figure 6. Land use impacts on biodiversity and contribution<br />
to the national corn gra<strong>in</strong> production per state<br />
(m 2 .yr.PDF/kg DM corn gra<strong>in</strong>)<br />
When account<strong>in</strong>g for a national production of 1 kg of milk, overall results <strong>in</strong>dicate a large variation of<br />
land use area requirements (<strong>in</strong> m 2 .yr/kg milk) across states. Consider<strong>in</strong>g all types of crop <strong>in</strong> the feed, California,<br />
Wiscons<strong>in</strong> and New York share the largest total land use area requirement to produce 1 kg milk at the<br />
national level. This result is driven by these states’ large contribution to national milk production of 22%,<br />
13% and 6.5% respectively (shown <strong>in</strong> Figure 7).<br />
Results <strong>in</strong> terms of land use impacts on biodiversity are shown <strong>in</strong> the variable width graph presented <strong>in</strong><br />
Figure 8. California requires a larger land area for produc<strong>in</strong>g 1 kg of milk at the national level, and shows a<br />
greater share of the national-level impact, which is ma<strong>in</strong>ly due to a large national milk production share.
PARALLEL SESSION 3C: SHEEP AND DAIRY PRODUCTION SYSTEMS 8 th Int. Conference on <strong>LCA</strong> <strong>in</strong> the<br />
Agri-<strong>Food</strong> Sector, 1-4 Oct <strong>2012</strong><br />
Total land use impacts on biodiversity across states, when account<strong>in</strong>g for all crops, are equal to 1.37<br />
m 2 .yr.PDF/kg milk at the national level. California and Wiscons<strong>in</strong> contribute to 17% and 15% respectively.<br />
Figure 7. Milk production per state (m<strong>et</strong>ric<br />
ton/year)<br />
Figure 8. Land use impacts on biodiversity and contribution<br />
to the milk at the national level production per<br />
state (m 2 .yr.PDF/kg FPCM)<br />
4. Discussion<br />
Land use area requirements, which are ma<strong>in</strong>ly driven by the yield, for each crop to be produced <strong>in</strong> the<br />
feed ration varied up to 6 times from one crop to another. Another key-param<strong>et</strong>er is the crop production contribution<br />
per state. Results of land use impacts per kg of milk produced from state to state varied up to 15<br />
times for nationally produced crops. A comparison of the results <strong>in</strong>dicate different share of contribution to<br />
the total impacts and for which the crop provenance could be traced back to its production location.<br />
Given the distribution of feed components’ production and their share to the national level production,<br />
states such as California and Wiscons<strong>in</strong>, which are major contributors to the national milk production require<br />
significant amount of crop to feed cows. However, not be<strong>in</strong>g a sizeable <strong>in</strong>-state corn gra<strong>in</strong> production, they<br />
require a large supply of feed from other states. The latter are located <strong>in</strong> the Corn Belt region and constitute<br />
the ma<strong>in</strong> suppliers’ to many other dairy producers states (i.e. receiver states). Consequently, land use impacts<br />
on biodiversity per kg of milk produced are greater than the ones <strong>in</strong>duced by M<strong>in</strong>nesota’s milk production,<br />
as it only contributes to 4% of the national milk production. Thus, impacts from an <strong>in</strong>ducer perspective are<br />
larger than those from a receiver perspective. This reason<strong>in</strong>g applies to feed components, which their supply<br />
mix is assumed to be a national production (eg. commodity crops such as corn gra<strong>in</strong>). For local and not<br />
transportable crops, assumed to be produced with<strong>in</strong> the state where the farm is located, their contribution to<br />
land use impacts of milk production at the national level is ma<strong>in</strong>ly local. Thus, <strong>in</strong>duced and received impacts<br />
are equivalent.<br />
As part of the spatial assessment, results for land use impacts on a series of ecosystem services (groundwater<br />
recharge potential, erosion resistance potential, physico-chemical filtration and mechanical filtration<br />
potential) wer also accounted for. Impact results were ma<strong>in</strong>ly driven by the milk production fraction at national<br />
scale and thus aligned with the one observed for the biodiversity <strong>in</strong>dicator. California, Wiscons<strong>in</strong>,<br />
Pennsylvania and New York were consistently among the top contributors to total impact (results not<br />
shown). D<strong>et</strong>ailed results can be foun <strong>in</strong> the orig<strong>in</strong>al report (Jolli<strong>et</strong> <strong>et</strong> al., <strong>2012</strong>).<br />
5. Conclusion<br />
Land use impacts related to milk production across its entire life cycle are ma<strong>in</strong>ly driven by land use<br />
needed for feed production, which is required for dairy consumption. The rema<strong>in</strong><strong>in</strong>g processes beyond the<br />
farm gate contribute to 5% of the total impact to biodiversity (results not shown). These are dom<strong>in</strong>ated by<br />
forest land use necessary for pulp production used <strong>in</strong> manufactur<strong>in</strong>g paperboard cartons and other packag<strong>in</strong>g.<br />
We found that impacts of feed vary significantly depend<strong>in</strong>g on the production location. Both <strong>in</strong>ventory<br />
and impact assessment contributes to this variation. Inventory is directly <strong>in</strong>fluenced by the yield that d<strong>et</strong>erm<strong>in</strong>es<br />
the area requirements per unit of crops production. Impact assessment is directly <strong>in</strong>fluenced by several<br />
bio-geographic factors, such as climate conditions, veg<strong>et</strong>ation patterns and soil type properties. We<br />
found that spatial differentiation at the state level (the chosen regionalisation scale for this study) is as a key<br />
element when address<strong>in</strong>g land use impacts. However, future work and improvement could address a f<strong>in</strong>er<br />
and more relevant scale assessment. The latter can be addressed on U.S. ecoregions scale level <strong>in</strong>stead of<br />
319
PARALLEL SESSION 3C: SHEEP AND DAIRY PRODUCTION SYSTEMS 8 th Int. Conference on <strong>LCA</strong> <strong>in</strong> the<br />
Agri-<strong>Food</strong> Sector, 1-4 Oct <strong>2012</strong><br />
be<strong>in</strong>g based on states’ level. This could br<strong>in</strong>g additional discrim<strong>in</strong>ation to the results consider<strong>in</strong>g more specific<br />
and spatially-differentiated CFs.<br />
When <strong>in</strong>ventory data are available, it is shown that spatial differentiation <strong>in</strong>creases the discrim<strong>in</strong>at<strong>in</strong>g<br />
power of <strong>LCA</strong>.<br />
F<strong>in</strong>ally, when consider<strong>in</strong>g the global environmental profile related to the US dairy production <strong>in</strong>dustry,<br />
possible trade-offs b<strong>et</strong>ween impact categories (land use, water use, climate change, <strong>et</strong>c.) may arise. In this<br />
respect this work provides valuable <strong>in</strong>sights to guide decision makers to identify priorities for action to reduce<br />
overall potential impacts related to milk production.<br />
6. References<br />
Bass<strong>et</strong>-Mens, C., Ledgard, S., Boyes, M., 2009. Eco-efficiency of <strong>in</strong>tensification scenarios for milk production <strong>in</strong> New Zealand.<br />
Ecological Economics 68(6): 1615-1625<br />
Goedkoop M, Spriensma R. (2001): Eco-<strong>in</strong>dicator 99, a damage oriented <strong>LCA</strong> impact assessment m<strong>et</strong>hod. M<strong>et</strong>hodology report Nr.<br />
1999/36a. 3rd ed. The N<strong>et</strong>herlands, Amersfoort.<br />
Lamb<strong>in</strong>, E. F., Turner, B. L., Geist, H. J., Agbola, S. B., Angelsen, A., Bruce, J. W., Coomes, O. T., Dirzo, R., Fischer, G., Folke, C.,<br />
George, P. S., Homewood, K., Imbernon, J., Leemans, R., Li, X., Moran, E. F., Mortimore, M., Ramakrishnan, P. S., Richards,<br />
J. F., Skånes, H., Steffen, W., Stone, G. D., Sved<strong>in</strong>, U., Veldkamp, T. A., Vogel C., Xu, J., 2001. The causes of land-use and<br />
land-cover change: mov<strong>in</strong>g beyond the myths. Global Environmental Change 11(4): 261-269<br />
LULCIA (2008–<strong>2012</strong>). Operational Characterization Factors for Land use Impacts on Biodiversity and Ecosystem Services <strong>in</strong> the<br />
Life-Cycle Impact Assessment—Compatible with the Framework of the UNEP- SETAC Life Cycle Initiative (LULCIA).<br />
http://www.pes.uni-bayreuth.de/en/research/projects/LULCIA/<br />
Milà i Canals, L., Bauer, C., Depestele, J., Dubreuil, A., Freiermuth Knuchel, R., Gaillard, G., Michelsen, O., Müller-Wenk, R.,<br />
Rydgren, B., 2007. Key Elements <strong>in</strong> a Framework for land Use Impact Assessment with<strong>in</strong> <strong>LCA</strong> Int J <strong>LCA</strong>, 12(1), 5-15.<br />
Pimentel, D., Allen, Beers, J., Gu<strong>in</strong>and, L., L<strong>in</strong>der, R., McLaughl<strong>in</strong>, P., Meer, B., Musonda, D., Perdue, D., Poisson, S., Siebert, S.,<br />
Stoner, K., Salazar, R., Hawk<strong>in</strong>s, A., 1987. World Agriculture and Soil Erosion. BioScience 37(4): 277-283<br />
Pfister, S., Curran, M., Koehler, A., Hellweg, S., 2010. Trade-offs b<strong>et</strong>ween land and water use: regionalized impacts of energy crops.<br />
In: Proceed<strong>in</strong>gs of the7th International Conference on <strong>LCA</strong> <strong>in</strong> the Agri-<strong>Food</strong> Sector, Bari, Italy<br />
Roy, P., D. Nei, T. Orikasa, Q. Xu, H. Okadome, N. Nakamura and T. Shi<strong>in</strong>a (2009): A review of life cycle assessment (<strong>LCA</strong>) on<br />
some food products. Journal of <strong>Food</strong> Eng<strong>in</strong>eer<strong>in</strong>g 90 (1): 1-10<br />
Saad R., Koellner, T., Margni, M., (submitted). Land use impacts on freshwater regulation, erosion regulation and water purification:<br />
a spatial approach for a global scale level. Int J <strong>LCA</strong><br />
Saad R, Margni M., Koellner T., Wittstock B., Deschênes L., 2011. Assessment of land use impacts on soil ecological functions :<br />
development of spatially differentiated characterization factors with<strong>in</strong> a Canadian context. The International Journal of Life Cycle<br />
Assessment 16(3): 198-211<br />
Thoma, G., Popp, J., Shonnard, D., Nutter, D., Ulrich, R., Matlock, M.,Kim, D, Neiderman, Z., East, C.,<br />
Adom, F., Kemper, N., Mayes, A., 2010. Greenhouse Gas Emissions from Production <strong>in</strong> Fluid Milk<br />
<strong>in</strong> the US. Dairy Management, Inc., Rosemount, IL, USA<br />
Thomassen, M., R. Dalgaard, R. Heijungs and I. de Boer (2008): Attributional and consequential <strong>LCA</strong> of milk production. The International<br />
Journal of Life Cycle Assessment 13 (4): 339-349<br />
USDA NASS, 2010. USDA/NASS - Data and Statistics - QuickStats 2.0. http://quickstats.nass.usda.gov/<br />
Jolli<strong>et</strong>, O., Assel<strong>in</strong>, A., Burek, J., Heller, M., Henderson, A., Humbert, S., Kim, D. S., Lessard, L., Matlock, M., Margni, M., Saad,<br />
R., Thoma, G., Vionn<strong>et</strong>, S. (<strong>in</strong> alphab<strong>et</strong>ical order), (<strong>2012</strong>): US fluid milk comprehensive <strong>LCA</strong>, Report <strong>in</strong> progress,<br />
www.css.snre.umich.edu/project/us-fluid-milk-beyond-carbon-lca-study<br />
320
PARALLEL SESSION 3C: SHEEP AND DAIRY PRODUCTION SYSTEMS 8 th Int. Conference on <strong>LCA</strong> <strong>in</strong> the<br />
Agri-<strong>Food</strong> Sector, 1-4 Oct <strong>2012</strong><br />
Greenhouse gas emissions from production of imported and local<br />
cattle feed<br />
Lisb<strong>et</strong>h Mogensen * , Troels Kristensen, Thu Lan T. Nguyen, Marie T. Knudsen<br />
Dept. of Agroecology, Aarhus University, Blichers Allé 20, Postbox 50, DK-8830 Tjele, Denmark<br />
Correspond<strong>in</strong>g author. E-mail: Lisb<strong>et</strong>h.Mogensen@agrsci.dk<br />
ABSTRACT<br />
Emissions related to feed production are hotspots <strong>in</strong> milk production. In this paper, carbon footpr<strong>in</strong>t (CF) of different feedstuffs is<br />
estimated, tak<strong>in</strong>g <strong>in</strong>to account contribution from grow<strong>in</strong>g, process<strong>in</strong>g, transport and land use change (LUC). Subsequently, the effect<br />
of a ‘local’ versus an ‘import’ feed<strong>in</strong>g strategy on the GHG emissions from feed was <strong>in</strong>vestigated. There were large variations <strong>in</strong> CF<br />
of different feedstuffs and b<strong>et</strong>ween concentrated feed and home grown roughage. When calculat<strong>in</strong>g CF of a compl<strong>et</strong>e feed ration for<br />
cows by attributional <strong>LCA</strong>, the ma<strong>in</strong> reason for differences was related to contribution from transport, and especially from LUC.<br />
However, if calculated by consequential <strong>LCA</strong> there was no differences b<strong>et</strong>ween a ‘local’ and an ‘import’ strategy regard<strong>in</strong>g GHG<br />
emissions from feed production.<br />
Keywords: animal feed, green house gas, transport, land use change, attributional and consequential <strong>LCA</strong><br />
1. Introduction<br />
Studies of carbon footpr<strong>in</strong>t (CF) of milk have shown that 80-90% of the total greenhouse gas (GHG) emissions<br />
are related to processes before the milk leaves the farm (Hermansen and Kristensen, 2011). On the<br />
farm, m<strong>et</strong>hane emission from enteric fermentation gives the highest s<strong>in</strong>gle contribution to CF of milk followed<br />
by the emissions related to feed production (Kristensen <strong>et</strong> al., 2011). The hypothesis of the present<br />
study was that by choice of feed, farmers can reduce CF of milk.<br />
2. M<strong>et</strong>hods<br />
The aim of this paper is to 1) estimate carbon footpr<strong>in</strong>t (CF) of different feedstuffs for dairy cattle and 2)<br />
compare two feed<strong>in</strong>g strategies for dairy cows regard<strong>in</strong>g GHG emissions from the feed production.<br />
The functional unit (FU) is ‘1 kg dry matter (DM) of feed ready to eat’ (1) and for the comparison of the two<br />
feed<strong>in</strong>g strategies, the FU is ‘amount of feed for production of 1 kg milk (ECM)’ (2). The ma<strong>in</strong> system studied<br />
was production of conventional grown fodder crops at dairy farms <strong>in</strong> Denmark. Besides that, a system<br />
produc<strong>in</strong>g soybean from which soybean meal is extracted – assumed to be located <strong>in</strong> Brazil - was also <strong>in</strong>cluded.<br />
An attributional life cycle assessment (A<strong>LCA</strong>) approach has been used, handl<strong>in</strong>g co-products by economic<br />
allocation and tak<strong>in</strong>g <strong>in</strong>to account LUC which was quantified based on PAS2050 (BSI,2008). For comparison,<br />
a consequential approach (C<strong>LCA</strong>) was applied, where co-products were handled by system expansion<br />
and contribution from <strong>in</strong>direct LUC was estimated accord<strong>in</strong>g to Audsley <strong>et</strong> al., (2009). The same <strong>in</strong>ventory<br />
data on the production of fertiliser, manure, diesel, and electricity were used for both A<strong>LCA</strong> and C<strong>LCA</strong>.<br />
The rate of resource use, energy use and output <strong>in</strong> relation to grow<strong>in</strong>g 1 ha of different crops is presented <strong>in</strong><br />
Table 1. Regard<strong>in</strong>g soybean, data related to grow<strong>in</strong>g the crop <strong>in</strong> Brazil were taken from Eco<strong>in</strong>vent (2010).<br />
For other crops, data represent Danish average production level.<br />
Crop yield and <strong>in</strong>put of fertiliser and manure<br />
Data for crop yield and <strong>in</strong>put of fertiliser for different crops are the national norms (Plantedirektorat<strong>et</strong>, 2010)<br />
and correspond to the typical level found at Danish dairy farms (Kristensen <strong>et</strong> al., 2011). For the roughage<br />
produced at the farm, manure produced at the same farm is used at a rate up to 170 kg total N/ha. The gap<br />
b<strong>et</strong>ween the <strong>in</strong>put of 170 kg N from manure and N norm was assumed to be filled by supply<strong>in</strong>g fertiliser N.<br />
Accord<strong>in</strong>g to the national rules (Plantedirektorat<strong>et</strong>, 2010), 70% of N <strong>in</strong> cattle slurry could be utilised by the<br />
plants. In relation to the issue of allocation of emissions burden created by the two sources, manure spread<strong>in</strong>g<br />
and manure <strong>in</strong> hous<strong>in</strong>g and storage, emissions from the former were fully allocated to crop production,<br />
whereas those from the latter to the milk production. Barley and rape seed were assumed to be imported from<br />
other Danish farms where they are grown without <strong>in</strong>put of manure.<br />
321
PARALLEL SESSION 3C: SHEEP AND DAIRY PRODUCTION SYSTEMS 8 th Int. Conference on <strong>LCA</strong> <strong>in</strong> the<br />
Agri-<strong>Food</strong> Sector, 1-4 Oct <strong>2012</strong><br />
Table 1. Resource use, energy use and output per ha of crops (farm gate)<br />
Feed Grass silage Maize silage Barley Rape seed Soybean<br />
Place of production Denmark Denmark Denmark Denmark Brazil<br />
Input<br />
Dairy farm Dairy farrn Crop farm Crop farm<br />
M<strong>in</strong>eral fertiliser 1) , kg N/ha 118 39 119 178 0,3<br />
M<strong>in</strong>eral fertiliser, kg P/ha 32 45 23 30 13<br />
M<strong>in</strong>eral fertiliser, kg K/ha 192 139 49 82 25<br />
Manure, kg total N 170 170 0 0 0<br />
Diesel, /ha 102 207 118 118 26<br />
Seed, kg 13 5 150 106<br />
Electricity, kWh/ha 2) Output<br />
378 34 17 23 0<br />
Crop yield, kg DM/ha 8269<br />
11325 4121 3321 2300<br />
(kg/ha)<br />
1) Calcium ammonium nitrate<br />
(-)<br />
(-) (4848) (3590) (2544)<br />
2) Electricity used for water<strong>in</strong>g was assumed to be based on natural gas<br />
Estimation of emissions<br />
Factors used for estimat<strong>in</strong>g emissions are shown <strong>in</strong> Table 2. For the Danish grown crops, factors for estimat<strong>in</strong>g<br />
nitrous oxide emissions were from IPCC (2006) whereas those for ammonia emission were national<br />
emission factors. For soybean, data from Eco<strong>in</strong>vent (2010) was updated us<strong>in</strong>g IPCC guidel<strong>in</strong>es (IPCC,<br />
2006).<br />
Table 2. Factors for estimation of emissions from crop production and <strong>in</strong>ventory of GHG emissions embod-<br />
ied <strong>in</strong> different <strong>in</strong>puts<br />
Emission source Amount Emission<br />
322<br />
Factor (EF)<br />
N2O direct, kg Spread<strong>in</strong>g of<br />
- slurry kg N <strong>in</strong> manure ab storage 0.01 1)<br />
Source -<br />
EF<br />
- fertiliser N <strong>in</strong> fertiliser 0.01<br />
Crop residues,<br />
Crop: kg N/ha/year 0.01 1) + 2)<br />
kg N pr ha per year Grass 60<br />
Maize, whole crop 25<br />
Other arable crops 28<br />
NH3-N, kg Spread<strong>in</strong>g of 2)<br />
- slurry kg N <strong>in</strong> manure ab storage 0.12<br />
- fertiliser N <strong>in</strong> fertiliser 0.022 2)<br />
Crop residues Grass<br />
0.5 kg / ha 3)<br />
Other arable crops<br />
2.0 kg / ha<br />
N2O, kg<br />
<strong>in</strong>direct<br />
From NH3 NH3-N 0.01 1)<br />
From leach<strong>in</strong>g NO3-N=0.33*( manure-N + fertiliser-N) 0.0075 4) + 1)<br />
Input Fertiliser-N<br />
Fertiliser-P<br />
Fertiliser-K<br />
Seed<br />
Diesel<br />
Electricity (natural gas<br />
based)<br />
4.4 kg CO2/kg N<br />
2.7 kg CO2/kg P<br />
0.8 kg CO2/kg K<br />
0.4 kg CO2/kg<br />
3.3 kg CO2/L<br />
0.66 kg CO2/kWh<br />
1) IPCC (2006)<br />
2) Mikkelsen <strong>et</strong> al., (2006)<br />
3) Gyldenkærne and Albrektsen (2008)<br />
4) Nielsen <strong>et</strong> al., (2009)<br />
5) Elsgaard (2010). GHG emissions from average N-fertiliser (Calcium ammonium nitrate) used <strong>in</strong> Denmark:<br />
60% of this N-fertiliser is imported from Yara, where it is produced <strong>in</strong> accordance with Best Available Techniques<br />
for N2O emission reduction , and 40% of the N-fertiliser is imported from Baltic<br />
6) Nielsen <strong>et</strong> al., (2003)<br />
7) GHG emissions rate from grow<strong>in</strong>g 1 kg barley was used for approximation of GHG emissions per kg seed<br />
5)<br />
6)<br />
6)<br />
7)<br />
6)<br />
6)
PARALLEL SESSION 3C: SHEEP AND DAIRY PRODUCTION SYSTEMS 8 th Int. Conference on <strong>LCA</strong> <strong>in</strong> the<br />
Agri-<strong>Food</strong> Sector, 1-4 Oct <strong>2012</strong><br />
Place of orig<strong>in</strong><br />
Data on Danish import and export of different foodstuffs (www.statistikbanken.dk) used to quantify the proportion<br />
of feed import. The amount of feed imported from different countries was quantified by us<strong>in</strong>g FAO<br />
Stat data (www.faostat.fao.org). For calculat<strong>in</strong>g the contribution from feed transport the actual place of orig<strong>in</strong><br />
was used. Whereas, when calculat<strong>in</strong>g the contribution from grow<strong>in</strong>g the crop, only one place of orig<strong>in</strong><br />
was <strong>in</strong>cluded for each crop. For example, grow<strong>in</strong>g of soybeans is only based on production conditions <strong>in</strong><br />
Brazil.<br />
Feed transport<br />
The <strong>in</strong>ventory data for GHG emission per tkm feed import were taken from <strong>LCA</strong><strong>Food</strong> database (Nielsen <strong>et</strong><br />
al., 2003) which are based on ETH data. Data on distances and means of transportation were obta<strong>in</strong>ed from<br />
the feed <strong>in</strong>dustry and the literature.<br />
Co-product handl<strong>in</strong>g – A<strong>LCA</strong> and allocation<br />
In the calculation based on A<strong>LCA</strong>, economic allocation was used to distribute the environmental burdens<br />
among co-products. One hectare planted with rapeseed yields 3590 kg, of which 36.4% is extracted as rapeseed<br />
oil and 61.6% as rapeseed cake (Dalgaard <strong>et</strong> al., 2008). The CF of rapeseed (708 g CO2e/kg) was allocated<br />
by a ratio of 24% to the rapeseed cake and 76% to the oil tak<strong>in</strong>g <strong>in</strong>to account the difference <strong>in</strong> the<br />
prices of the two products (<strong>in</strong>formation from FAO). The energy consumption for process<strong>in</strong>g one tonne of<br />
rapeseed was 50 kWh electricity and 340 MJ heat (Dalgaard <strong>et</strong> al., 2008). Soybeans yield <strong>in</strong> Brazil is 2544<br />
kg/ha (Eco<strong>in</strong>vent, 2010) of which 15.8% is extracted as soy oil and 82.6% as soybean meal (Dalgaard <strong>et</strong> al.,<br />
2008). The CF of soybean (399 g CO2e /kg) was divided b<strong>et</strong>ween soybean meal and oil by a ratio of<br />
66.3:33.7. We assumed that the soybean was milled where it was produced. The use of energy for process<strong>in</strong>g<br />
1 kg soybean meal creates 34 g CO2e (Eco<strong>in</strong>vent, 2010).<br />
Co-product handl<strong>in</strong>g - C<strong>LCA</strong> and system expansion<br />
When calculat<strong>in</strong>g CF of feeds <strong>in</strong> a consequential approach, it is sufficient to have <strong>LCA</strong> data on those crops,<br />
whose production is affected by an <strong>in</strong>creased demand for feed (e.g., <strong>in</strong> the present case the concentrated<br />
feed) <strong>in</strong> the mark<strong>et</strong>. In the C<strong>LCA</strong> calculation of CF of soybean meal we used system expansion. How an<br />
<strong>in</strong>creased demand for soybean meal affects agricultural production follows the soybean loop suggested by<br />
Dalgaard <strong>et</strong> al., (2008), where soybean oil is sold on the mark<strong>et</strong> and assumed to substitute palm oil, which is<br />
a mix of palm oil and palm kernel oil. As with the A<strong>LCA</strong> calculation of the CF of soybean meal, the C<strong>LCA</strong><br />
calculation was based on data taken from Eco<strong>in</strong>vent (2010) on soybean cultivation with the update of emissions<br />
estimate tak<strong>in</strong>g <strong>in</strong>to account the 2006 IPCC Guidel<strong>in</strong>es for National Greenhouse Gas Inventories.<br />
The C<strong>LCA</strong> calculation of CF of rapeseed meal was based on the assumption by Dalgaard <strong>et</strong> al., (2008) that<br />
an <strong>in</strong>creased demand for rapeseed meal will not affect the production of rapeseed as the rapeseed oil is the<br />
ma<strong>in</strong> product, whereas the production of soybean meal and barley will be affected.<br />
Land use chance (LUC)<br />
In the A<strong>LCA</strong> calculation, GHG emissions from direct LUC (dLUC) were calculated accord<strong>in</strong>g to PAS2050<br />
(BSI, 2008) on the feeds grown where deforestation takes place. In the present study, only the use of soybean<br />
meal from South America was considered a source of GHG emissions from dLUC. Direct LUC result<strong>in</strong>g<br />
from the production of soybean meal <strong>in</strong> Brazil and Argent<strong>in</strong>a would add 7.7 kg and 0.93 kg CO2 per kg soybean<br />
meal, respectively. Import of soybean meal to Denmark is made up of 73% from Argent<strong>in</strong>a and 17%<br />
from Brazil. A weighted average dLUC-GHG emissions rate of 2.0 kg CO2/kg soybean meal was thus calculated.<br />
In the C<strong>LCA</strong> calculation, GHG emissions from LUC were referred to as <strong>in</strong>direct use change (iLUC) emissions<br />
calculated accord<strong>in</strong>g to Audsley <strong>et</strong> al., (2009) on all feeds. This is essentially based on the assumption<br />
that use of land for crop production would <strong>in</strong>crease pressure on land use and thereby causes LUC somewhere<br />
<strong>in</strong> the world. From a total LUC-related-GHG emissions of 8.5 GT CO2 per year, the fraction of 58% that<br />
agriculture is responsible for would result <strong>in</strong> a contribution of 1.43 t CO2/ha/year, tak<strong>in</strong>g <strong>in</strong>to account the<br />
total agriculture area of 3,475 Mha (Audsley <strong>et</strong> al., 2009). In the present study, iLUC was calculated by multiplication<br />
of land use rate (m 2 a/kg feed) by an iLUC-GHG emissions factor of 143 g CO2/m 2 a.<br />
Land use (LU) and soil carbon change<br />
Enhanc<strong>in</strong>g carbon (C) sequestration <strong>in</strong> soil is a way to reduce GHG emissions. However, the size of the sequestration<br />
potential is debatable. In this paper, the effect of changes <strong>in</strong> soil C was <strong>in</strong>cluded <strong>in</strong> a very simple<br />
323
PARALLEL SESSION 3C: SHEEP AND DAIRY PRODUCTION SYSTEMS 8 th Int. Conference on <strong>LCA</strong> <strong>in</strong> the<br />
Agri-<strong>Food</strong> Sector, 1-4 Oct <strong>2012</strong><br />
way, where the changes were assumed to depend only on type of land where crops are grown. Accord<strong>in</strong>g to<br />
Vleeshouwers and Verhagen (2002), grassland is a carbon s<strong>in</strong>k (i.e. more carbon is stored than released) of<br />
0.52 Mg C/ha/year (191 g CO2/m 2 /year), whereas cropland (arable land) is a carbon source (i.e. more carbon<br />
is released than stored) of 0.84 Mg C/ha/year (308 g CO2/m 2 /year).<br />
Feed<strong>in</strong>g strategies<br />
Two different strategies for cow feed<strong>in</strong>g were given, a ‘local’ and an ‘import’ strategy. In both strategies, the<br />
cows have the same level of feed <strong>in</strong>take (energy) and milk production. In the ‘local’ strategy all feeds are<br />
grown <strong>in</strong> Denmark and the concentrated prote<strong>in</strong> feed is based on rapeseed cake and cereals (27% and 16% of<br />
energy requirement, respectively). In the ‘import’ strategy, 70% of the feeds are grown <strong>in</strong> Denmark and the<br />
concentrated prote<strong>in</strong> feed is based on imported soybean meal and cereals (19% and 24% of energy requirement,<br />
respectively). In both strategies, the ma<strong>in</strong> roughage is maize silage (43%) which is supplemented with<br />
grass silage (14%).<br />
3. Results<br />
CF values of animal feeds, based on A<strong>LCA</strong>, are shown <strong>in</strong> Table 3a. Roughage is grown on the farm, so there<br />
is no contribution to its CF from transport. Roughage has relative high dry matter (DM) yields per ha, especially<br />
maize silage. Therefore CF of roughage (g CO2e./kg DM) is lower than that of concentrated feeds.<br />
Rapeseed cake and soybean meal are both prote<strong>in</strong> feeds and they are co-products from oilseed production.<br />
GHG emissions from grow<strong>in</strong>g and process<strong>in</strong>g rapeseed cake and soybean meal are quite similar, but due to<br />
transport of soybean meal from South America, CF of soybean meal is nearly double that of rapeseed cake,<br />
and much higher if contribution from dLUC is also <strong>in</strong>cluded.<br />
Table 3a. Carbon footpr<strong>in</strong>t (CF) of conventionally grown animal feed – contribution from grow<strong>in</strong>g, process<strong>in</strong>g,<br />
transport and LUC, per kg dry matter, based on A<strong>LCA</strong><br />
Feedstuff Orig<strong>in</strong> Contribution to CF, g CO2e per kg DM<br />
Grow<strong>in</strong>g Process<strong>in</strong>g Transport Total<br />
Land use<br />
m 2 /kg dLUC<br />
Grass silage The farm 318 71<br />
DM g CO2/kg DM<br />
1) 0 389 1.15 0<br />
Maize silage The farm 147 63 1) 0 210 0.89 0<br />
Barley Denmark 487 11 17 515 2.43 0<br />
Rape seed Denmark/ 310 28 118 456 1.24 0<br />
cake<br />
Germany<br />
Soybean meal Argent<strong>in</strong>a/<br />
Brazil<br />
367 39 422 828 1.83 2288<br />
1<br />
Includ<strong>in</strong>g diesel used for traction and transport at the farm<br />
Table 3b. Carbon footpr<strong>in</strong>t (CF) of conventionally grown animal feed – contribution from grow<strong>in</strong>g, process<strong>in</strong>g,<br />
transport and LUC, per kg dry matter, based on C<strong>LCA</strong><br />
Feedstuff Orig<strong>in</strong> Contribution to CF, g CO2e per kg DM<br />
Grow<strong>in</strong>g Process<strong>in</strong>g Transport Total<br />
Land use<br />
m 2 /kg iLUC<br />
DM g CO2/kg DM<br />
Barley Denmark 528 11 18 557 2.42 346<br />
Rapseed cake Denmark/<br />
Germany<br />
368 0 118 486 2.24 320<br />
Soy bean meal Argent<strong>in</strong>a 150 59 463 672 2.41 345<br />
As can be seen <strong>in</strong> Table 4, <strong>in</strong> the attributional calculation (A<strong>LCA</strong>), there is little difference <strong>in</strong> GHG emissions<br />
related to grow<strong>in</strong>g and process<strong>in</strong>g the mixture of feedstuffs b<strong>et</strong>ween the two strategies. However, the<br />
<strong>in</strong>clusion of GHG contribution from transport <strong>in</strong>creases the difference mak<strong>in</strong>g the ‘local’ strategy a moderately<br />
b<strong>et</strong>ter choice than ‘import’ strategy. The <strong>in</strong>clusion of GHG emissions from dLUC <strong>in</strong>creases significantly<br />
the CF of feed <strong>in</strong> the ‘import’ strategy to a range that is double that <strong>in</strong> the ‘local’ strategy. As also seen<br />
<strong>in</strong> Table 4, if calculated based on C<strong>LCA</strong> there were no differences <strong>in</strong> the CF of the feed b<strong>et</strong>ween the ‘local’<br />
and ‘import’ strategy as GHG contribution from iLUC was similar for the two strategies.<br />
324
PARALLEL SESSION 3C: SHEEP AND DAIRY PRODUCTION SYSTEMS 8 th Int. Conference on <strong>LCA</strong> <strong>in</strong> the<br />
Agri-<strong>Food</strong> Sector, 1-4 Oct <strong>2012</strong><br />
Table 4. Effect of feed<strong>in</strong>g strategy and <strong>LCA</strong> m<strong>et</strong>hod (ACLA and C<strong>LCA</strong>) on GHG emission from feed production<br />
A<strong>LCA</strong> C<strong>LCA</strong><br />
Strategy Local Import Local Import<br />
GHG from feed 1) , g CO2e/kg ECM<br />
From grow<strong>in</strong>g the feed 0.20 0.21 0.23 0.19<br />
From process<strong>in</strong>g the feed 0.01 0.01 0.00 0.01<br />
From transport 0.02 0.05 0.02 0.05<br />
From LUC (direct or <strong>in</strong>direct) 0 0.23 0.15 0.15<br />
From LU 0.21 0.19 0.26 0.26<br />
Total 0.22 0.26 0.26 0.25<br />
Total, <strong>in</strong>clud<strong>in</strong>g LUC 0.22 0.48 0.41 0.40<br />
Total, <strong>in</strong>clud<strong>in</strong>g LUC and LU 0.44 0.67 0.67 0.66<br />
Land use, m 2 / kg ECM 0.90 1.01 1.07 1.06<br />
1 GHG emissions related to feed production (only for cows) calculated per kg milk produced<br />
4. Discussion<br />
From the present study it becomes clear that choice of m<strong>et</strong>hod strongly affects the calculation of CF of feed.<br />
Which <strong>LCA</strong> approach should be used depends on the goal and scope of the study (Thomassen <strong>et</strong> al., 2008).<br />
A<strong>LCA</strong> seeks to quantify the fraction of the global environmental impact related to the product, whereas<br />
C<strong>LCA</strong> seeks to capture change <strong>in</strong> environmental impact as a consequence of a certa<strong>in</strong> activity. The present<br />
study, us<strong>in</strong>g A<strong>LCA</strong>, showed a huge impact contribution from LUC when feed<strong>in</strong>g is based on feed import<br />
from areas where deforestation takes place. However, the choice of m<strong>et</strong>hod to account for emissions from<br />
LUC is critical, and so far there is no consensus on which m<strong>et</strong>hod is best for <strong>in</strong>clusion of GHG emissions<br />
from LUC. Therefore, it is recommended to present the results <strong>in</strong> relation to LUC separately. The use of the<br />
C<strong>LCA</strong> m<strong>et</strong>hod clarifies that for plann<strong>in</strong>g animal feed<strong>in</strong>g <strong>in</strong> the future, a key measure is to reduce the land use<br />
rate per unit of product output, i.e. to <strong>in</strong>crease land use efficiency. Land is a limited resource so that an <strong>in</strong>crease<br />
<strong>in</strong> demand for land would cause <strong>in</strong>direct LUC elsewhere. In addition, it is important to consider soil<br />
carbon storage or loss potential of different land use types.<br />
5. Conclusion<br />
In conclusion, there were large variations <strong>in</strong> CF of different feedstuffs and especially b<strong>et</strong>ween concentrated<br />
feed and home grown roughage. However, when calculat<strong>in</strong>g CF of a compl<strong>et</strong>e feed ration for cows us<strong>in</strong>g an<br />
attributional approach, the ma<strong>in</strong> reason for the difference was related to contribution from transport, and <strong>in</strong><br />
particular from direct LUC. However, if calculated based on consequential <strong>LCA</strong>. there was only a m<strong>in</strong>or<br />
difference <strong>in</strong> total GHG emissions b<strong>et</strong>ween a ‘local’ and an ‘import’ feed<strong>in</strong>g strategy, as the burden of <strong>in</strong>direct<br />
LUC was attributed to any type of feed, no matter it is local or imported.<br />
6. Acknowledgement<br />
This study was funded through the ÖSK Interreg IV A Programme project ‘REKS – Regional nöt och<br />
lammköttsproduktion – en tillväxtmotor’ funded by the European Union.<br />
7. References<br />
Audsley, E., Brander, M., Chatterton, J., Murphy-Bokern, D., Webster, C., and Williams, A. (2009). How low can we go? An assessment<br />
of greenhouse gas emissions from the UK food system and the scope for to reduction them by 2050. How low can we<br />
go? WWF- UK.<br />
BSI, 2008. PAS2050. Specification for the assessment of life cycle greenhouse gas emissions of goods and services.<br />
Dalgaard, R., Schmidt, J., Halberg, N., Christensen, P., Thrane, M., Pengue, W.A. 2008. <strong>LCA</strong> of soybean meal. Int. J. <strong>LCA</strong>. 13, 240-<br />
254.<br />
Eco<strong>in</strong>vent Centre, 2010. Eco<strong>in</strong>vent Data v2.2. Swiss Centre for Life Cycle Inventories, Dübendorf, Switzerland.<br />
http://www.eco<strong>in</strong>vent.ch.<br />
Elsgaard, L. 2010. GHG emission from cultivation of w<strong>in</strong>ter wheat and w<strong>in</strong>ter rapeseed for biofuels. Report requested by the Danish<br />
M<strong>in</strong>istry of <strong>Food</strong>, Agriculture and Fisheries. The faculty of Agricultural Sciences, Aarhus University. 34 pp.<br />
Gyldenkærne, S., Albrektsen, R. 2008. Revurder<strong>in</strong>g af ammoniakemissionen 2003-2007. Baggrundsnotat til vandmiljøplan III. Danmarks<br />
Miljøundersøgelser, Aarhus Universit<strong>et</strong>, Denmark.<br />
Hermansen, J.E., Kristensen, T., 2011. Management options to reduce the carbon footpr<strong>in</strong>t of livestock products.Animal Frontier. 1<br />
(1), 33-39.<br />
IPCC, 2006. IPCC Guidel<strong>in</strong>es for national greenhouse gas <strong>in</strong>ventories. http://www.ipcc-nggip.iges.or.jp/public/2006gl/vol4.html<br />
325
PARALLEL SESSION 3C: SHEEP AND DAIRY PRODUCTION SYSTEMS 8 th Int. Conference on <strong>LCA</strong> <strong>in</strong> the<br />
Agri-<strong>Food</strong> Sector, 1-4 Oct <strong>2012</strong><br />
Kristensen, . T, Mogensen, L., Knudsen, M.T., Hermansen, J.E., 2011. Effect of production system and farm<strong>in</strong>g strategy on greenhouse<br />
gas emissions from commercial dairy farms <strong>in</strong> a life cycle approach. Livestock Sci 140, 136-148.<br />
Mikkelsen M.H., Gyldenkærne, S., Poulsen, H.D., Olesen, J.E., Sommer, S.G., 2006. Emission of ammonia, nitrous oxide and m<strong>et</strong>hane<br />
from Danish Agriculture 1985 – 2002. M<strong>et</strong>hodology and Estimates. National Environmental Research Institute, Denmark. 90<br />
pp –Research Notes from NERI No. 231. http://www.dmu.dk/Pub/AR231.pdf.<br />
Nielsen, P.H., Nielsen, A.M., Weidema, B.P., Dalgaard, R., Halberg, N. 2003. <strong>LCA</strong> <strong>Food</strong> data Base. www.Lca<strong>Food</strong>.dk<br />
Nielsen, O.-K., Lyck, E., Mikkelsen, M.H., Hoffmann, L., Gyldenkærne, S., W<strong>in</strong>ther, M., Nielsen, M., Fauser, P., Thomsen, M.,<br />
Plejdrup, M.S., Albrektsen, R., Hjelgaard, K., Vesterdal, L., Møller, I.S. & Baunbæk, L. 2009. Denmark’s National Inventory<br />
Report 2009. Emission Inventories 1990-2007 - Submitted under the United Nations Framework Convention on Climate<br />
Change. National Environmental Research Institute, Aarhus University. 826 pp. – NERI Technical Report No. 724.<br />
Plantedirektorat<strong>et</strong>, 2010. Vejledn<strong>in</strong>g om gødskn<strong>in</strong>g og harmoniregler. M<strong>in</strong>isteri<strong>et</strong> for Fødevarer. Landbrug og Fiskeri. 118 pp.<br />
Thomassen, M., Dalgaard, R., Heijungs, R., de Boer, I., 2008. Atrtributional and Consequential <strong>LCA</strong> of milk production. International<br />
Journal of Life Cycle Assesment. 13, 339-349.<br />
Vleeshouwers, L.M., Verhagen, A., 2002. Carbon emission and sequestration by agricultural land use: a model study for Europe.<br />
Global Change Biologi. 8, 519-530.<br />
326
PARALLEL SESSION 3C: SHEEP AND DAIRY PRODUCTION SYSTEMS 8 th Int. Conference on <strong>LCA</strong> <strong>in</strong> the<br />
Agri-<strong>Food</strong> Sector, 1-4 Oct <strong>2012</strong><br />
Environmental life cycle assessment of milk <strong>in</strong> Canada<br />
Mia Lafonta<strong>in</strong>e 1,* , Rosie Saad 1 , Diane Gilbert 2 , Manuele Margni 3<br />
1 Quantis Canada, 395 Laurier Ouest, Montreal, QC, H2V 2K3, Canada<br />
2 Groupe AGECO Inc. 2014 Rue Cyrille-Duqu<strong>et</strong> Bureau 307. Quebec, QC G1N 4N6, Canada<br />
3 CIRAIG, Department of Chemical Eng<strong>in</strong>eer<strong>in</strong>g, P.O. Box 6079, École Polytechnique de Montréal, QC, H3C 3A7, Canada<br />
Correspond<strong>in</strong>g author. E-mail: mia.lafonta<strong>in</strong>e@quantis-<strong>in</strong>tl.com<br />
ABSTRACT<br />
As part of its <strong>in</strong>itiatives to improve the environmental performance of dairy production <strong>in</strong> Canada, the Dairy Farmers of Canada<br />
commissioned <strong>in</strong> 2010 a full environmental and socio-economic life cycle assessment (<strong>LCA</strong>) for the production of milk across Canada.<br />
This paper summarises the environmental <strong>LCA</strong> m<strong>et</strong>hodology, results and conclusions. In l<strong>in</strong>e with exist<strong>in</strong>g publications, the<br />
environmental <strong>LCA</strong> found that the ma<strong>in</strong> sources of greenhouse gases were emitted at the farm, with enteric fermentation, manure<br />
management and feed production. Potential impacts on ecosystem quality were mostly caused by feed production, l<strong>in</strong>ked to eutrophication,<br />
land use, and potential ecotoxicity. Potential burdens on human health were dom<strong>in</strong>ated by ammonia emissions. The water<br />
footpr<strong>in</strong>t was strongly l<strong>in</strong>ked to geography and the use of irrigation. To understand the impact of the choices <strong>in</strong> practices, the analysis<br />
compared regionalised prov<strong>in</strong>cial average results. Scenarios based on practices were modelled to understand the scale of impact<br />
reduction possible.<br />
Keywords: environmental impact, dairy, water footpr<strong>in</strong>t, regionalisation<br />
1. Introduction<br />
A Canadian milk life cycle assessment (<strong>LCA</strong>) study took place over two years, with the support of the<br />
Canadian Dairy Farmers, fund<strong>in</strong>g from Agriculture and Agri-<strong>Food</strong> Canada, and collaboration of many stakeholders,<br />
<strong>in</strong>clud<strong>in</strong>g prov<strong>in</strong>cial associations, researchers and stakeholders <strong>in</strong> the dairy sector. It was <strong>in</strong>novative<br />
<strong>in</strong> different ways, ma<strong>in</strong>ly by its scale and regionalisation of impact, and also by <strong>in</strong>tegrat<strong>in</strong>g the first Social<br />
<strong>LCA</strong> (S<strong>LCA</strong>) <strong>in</strong> the dairy sector. With a large <strong>in</strong>ventory of farm datas<strong>et</strong>s, environmental impacts were calculated<br />
based on prov<strong>in</strong>cial average <strong>in</strong>ventories, allow<strong>in</strong>g for <strong>in</strong>terpr<strong>et</strong>ation of variable farm<strong>in</strong>g practices and<br />
their impact on overall performance, such as understand<strong>in</strong>g how impacts were related to geo-physical conditions.<br />
Geographical coord<strong>in</strong>ates and production volumes of 13,331 farms <strong>in</strong> Canada allowed for impact regionalisation<br />
consider<strong>in</strong>g location (ecoregions, watershed, <strong>et</strong>c.) to facilitate accurate estimation of potential<br />
impacts (potential acidification, eutrophication, ecotoxicity, human toxicity, land use and water use) <strong>in</strong> the<br />
different Canadian prov<strong>in</strong>ces. Results were calculated per prov<strong>in</strong>ce and weighted <strong>in</strong>to a s<strong>in</strong>gle environmental<br />
performance, while allow<strong>in</strong>g for analysis of different practices.<br />
2. M<strong>et</strong>hods<br />
The current study followed ISO 14040/14044 standards, as well as the International Dairy Federation<br />
(IDF)’s guidel<strong>in</strong>es on <strong>LCA</strong> (IDF, 2010). As per the guidel<strong>in</strong>es, the functional unit chosen was 1 kg of fat and<br />
prote<strong>in</strong> corrected milk (FPCM). The boundaries of the study stopped at process<strong>in</strong>g-plant front gate (farm<br />
gate + transportation). As per the guidel<strong>in</strong>es, carbon sequestration <strong>in</strong> soils was excluded, and allocation b<strong>et</strong>ween<br />
milk and meat was calculated accord<strong>in</strong>g to a physicochemical equation, result<strong>in</strong>g <strong>in</strong> an average allocation<br />
to milk of 82%.<br />
2.1. Life Cycle Inventory<br />
A majority of activity data was sourced from on-farm surveys (Table 1).<br />
Table 1. Data and their ma<strong>in</strong> sources<br />
Data Source<br />
Di<strong>et</strong> percentages, manure storage practices Cost of Production Surveys (Ontario, Quebec, New Brunswick, Nova<br />
Scotia, Pr<strong>in</strong>ce Edward Island)<br />
Manure spread<strong>in</strong>g <strong>in</strong>formation, energy Sheppard <strong>et</strong> al., (2011) survey on 500 farms<br />
Equipment and energy used <strong>in</strong> feed production Mail-<strong>in</strong> surveys (Alberta, Ontario)<br />
Fertiliser types and concentrations Sheppard <strong>et</strong> al., (2009) NH3 emissions from fertilisers<br />
Hous<strong>in</strong>g, energy & equipment <strong>in</strong> feed production Eco<strong>in</strong>vent models<br />
Manure spread<strong>in</strong>g tendencies Prov<strong>in</strong>cial federations (most)<br />
Crop yields, herd size, farm area Statistics Canada<br />
In total, cost of production surveys as well as mail-<strong>in</strong> surveys collected <strong>in</strong>formation from more than 300<br />
farms <strong>in</strong> Alberta, Ontario, Quebec, and the Atlantic Prov<strong>in</strong>ces. A previous survey (Sheppard <strong>et</strong> al., 2011)<br />
327
PARALLEL SESSION 3C: SHEEP AND DAIRY PRODUCTION SYSTEMS 8 th Int. Conference on <strong>LCA</strong> <strong>in</strong> the<br />
Agri-<strong>Food</strong> Sector, 1-4 Oct <strong>2012</strong><br />
supplied additional <strong>in</strong>formation on farm practices for all prov<strong>in</strong>ces. When no specific site data were available,<br />
or the contribution to impact was known to be m<strong>in</strong>imal, life cycle <strong>in</strong>ventory databases were used,<br />
ma<strong>in</strong>ly eco<strong>in</strong>vent 2.2 (SCLCI, 2010). In the last resort, when assumptions were necessary because activity<br />
data were not available, expert judgements were used for validation. Models based on eco<strong>in</strong>vent are summarised<br />
below, with adaptation described where relevant.<br />
2.2. Life Cycle Inventory Assessment<br />
The global framework adopted <strong>in</strong> this study (Erreur ! Source du renvoi <strong>in</strong>trouvable.) is based on the<br />
peer-reviewed and <strong>in</strong>ternationally recognised LCIA m<strong>et</strong>hod IMPACT 2002+ (Jolli<strong>et</strong> <strong>et</strong> al., 2003, updated by<br />
Humbert <strong>et</strong> al., 2011) with several novelties <strong>in</strong>spired by the work done for the development of IMPACT<br />
World+, <strong>in</strong>clud<strong>in</strong>g consistent spatially explicit levels and improved impact category modell<strong>in</strong>g. Eighteen<br />
impact categories are <strong>in</strong>cluded <strong>in</strong> this study. While they can be reported and <strong>in</strong>terpr<strong>et</strong>ed separately, they can<br />
be modelled up to the five damage <strong>in</strong>dicators: Climate Change, Natural Resources, Human Health, Ecosystem<br />
Quality and Water footpr<strong>in</strong>t, allow<strong>in</strong>g their respective contribution to be put <strong>in</strong>to perspective. IMPACT<br />
2002+ group<strong>in</strong>g m<strong>et</strong>hodology was used to aggregate the midpo<strong>in</strong>t <strong>in</strong>dicators.<br />
Figure 1. The LCIA framework used (regionalised impact categories <strong>in</strong> bold)<br />
2.3. Regionalisation<br />
N<strong>in</strong>e of the 18 impact categories were regionalised (bold, Fig. 1). Hav<strong>in</strong>g a specific geographic context,<br />
this study considers a multi-scale spatially explicit life cycle approach for both <strong>in</strong>ventory and impact assessment<br />
levels. Indeed, Canada is divided <strong>in</strong>to dist<strong>in</strong>ct regions show<strong>in</strong>g differences <strong>in</strong> land covers, veg<strong>et</strong>ation<br />
patterns, climate and hydrological systems, and soil types. Spatial differentiation is important when quantify<strong>in</strong>g<br />
the environmental footpr<strong>in</strong>t at each life cycle stage of Canadian milk production for regional impacts<br />
(e.g., acidification, eutrophication, smog) and local impacts (e.g., ecotoxicity). However, potential impacts at<br />
the global level (e.g., ozone depl<strong>et</strong>ion, global warm<strong>in</strong>g) are not affected by an emission’s location.<br />
Moreover, to perform regionalised assessment that accounts for spatial differentiation, impact <strong>in</strong>dicators<br />
that address environmental problems <strong>in</strong> the agricultural sector and are highly sensitive to regional characteristics<br />
were <strong>in</strong>cluded: water use, land use, acidification, eutrophication, toxicity and ecotoxicity. The framework<br />
used <strong>in</strong> this study and the m<strong>et</strong>hods underly<strong>in</strong>g these regional-specific impact <strong>in</strong>dicators are based on<br />
the IMPACT World+ LCIA m<strong>et</strong>hod (CIRAIG <strong>et</strong> al., <strong>2012</strong>).<br />
328
PARALLEL SESSION 3C: SHEEP AND DAIRY PRODUCTION SYSTEMS 8 th Int. Conference on <strong>LCA</strong> <strong>in</strong> the<br />
Agri-<strong>Food</strong> Sector, 1-4 Oct <strong>2012</strong><br />
3. Results<br />
The average footpr<strong>in</strong>t of 1 kg of Canadian FPCM was calculated for each prov<strong>in</strong>ce us<strong>in</strong>g prov<strong>in</strong>cial averages<br />
of <strong>in</strong>ventory flows and prov<strong>in</strong>cial weighted averages of characterisation factors based on farm locations<br />
and their production.<br />
Table 2. Sources of impact and allocated profile<br />
Damage Indicator Ma<strong>in</strong> Contributor Value Unit<br />
Climate Change<br />
Ecosystem Quality<br />
Enteric fermentation, feed production, manure<br />
Land use, phosphorus eutrophication, emissions from coal for<br />
1.01<br />
14.95<br />
kg CO2e<br />
PDF.m 2 .yr<br />
power, where applicable<br />
Human Health NH3 emissions (land use), NOx, SO2 (energy & diesel) 8.3e-7 DALY<br />
Resource Depl<strong>et</strong>ion Feed production, energy on farm, transportation 3.98 MJ<br />
Water Consumption Irrigation (when applicable), evaporation <strong>in</strong> energy production 61 L<br />
3.1. Climate change<br />
The distribution of greenhouse gas emissions (Fig. 2) was similar to that of other studies. While energy,<br />
transportation and build<strong>in</strong>gs and equipment had little impact (8% of the total), the most important emissions<br />
were caused by CH4 and N2O emissions, occurr<strong>in</strong>g, <strong>in</strong> decreas<strong>in</strong>g order, from enteric fermentation, manure<br />
storage and feed production.<br />
Figure 2. Distribution of average greenhouse gas emissions per kg of fat-and-prote<strong>in</strong>-corrected milk (FPCM)<br />
across life cycle steps, with spread of prov<strong>in</strong>cial average results (error bars).<br />
Variability <strong>in</strong> prov<strong>in</strong>cial results were highest (0.025-0.17 kg CO2e/kg FPCM) for energy emissions, due<br />
to the variability of the electrical-grid-mix among prov<strong>in</strong>ces (14-293 g CO2e/kWh). Variability was likely<br />
underestimated <strong>in</strong> feed production, due to the assumption that fertilisation recommendations were always<br />
followed. Still, based on soils and crops, manure spread<strong>in</strong>g practices varied among prov<strong>in</strong>ces, while emission<br />
factors also varied based on geography, a result mostly l<strong>in</strong>ked to humidity (Roch<strong>et</strong>te <strong>et</strong> al., 2008). Feedproduction<br />
emissions were lowest <strong>in</strong> Alberta and Saskatchewan, because of their dry climate, while they<br />
were highest <strong>in</strong> British Columbia, due to a moist climate and high N recommendations for hay (200-300 kg<br />
N/ha, compared to less than 150 kg/ha elsewhere), followed by the Atlantic prov<strong>in</strong>ces, also because of moist<br />
climates, average yields and lower milk production per animal.<br />
Variability <strong>in</strong> emissions from livestock management were l<strong>in</strong>ked to chang<strong>in</strong>g replacement-animal ratios<br />
(s<strong>in</strong>ce their feed, digestion and manure is also <strong>in</strong>cluded <strong>in</strong> the milk production system), as well as digestibility<br />
of feed, with concentrates, for example, hav<strong>in</strong>g higher digestibility than forage. F<strong>in</strong>ally, different types of<br />
manure storage contributed to variability <strong>in</strong> manure-management emissions.<br />
3.2. Water footpr<strong>in</strong>t<br />
Water use was <strong>in</strong>fluenced by two dist<strong>in</strong>ct scenarios: irrigated crops <strong>in</strong> western Canada and non-irrigated<br />
crops elsewhere. Water withdrawal, based on low-resolution statistics, reached 550 L/kg FPCM <strong>in</strong> the worstcase<br />
scenario (highest prov<strong>in</strong>cial irrigation per hectare) but was as low as 29 L/kg FPCM elsewhere. In terms<br />
329
PARALLEL SESSION 3C: SHEEP AND DAIRY PRODUCTION SYSTEMS 8 th Int. Conference on <strong>LCA</strong> <strong>in</strong> the<br />
Agri-<strong>Food</strong> Sector, 1-4 Oct <strong>2012</strong><br />
of consumed water (removed from watershed through evapo(transpi)ration or <strong>in</strong>corporation <strong>in</strong> product), the<br />
this footpr<strong>in</strong>t ranged from 12-336 L/kg FPCM. With only 20% of milk produced <strong>in</strong> irrigated areas, the overall<br />
weighted average amounts to 61 L/kg FPCM.<br />
The potential impacts on human health, ecosystem quality and resource depl<strong>et</strong>ion were assessed follow<strong>in</strong>g<br />
different m<strong>et</strong>hodologies (<strong>in</strong>clud<strong>in</strong>g Maendly <strong>et</strong> al., 2010, Pfister <strong>et</strong> al., 2009,van Zelm <strong>et</strong> al.,<br />
2010,Verones <strong>et</strong> al., 2010) y<strong>et</strong> were shown to be negligible overall (< 1%). With regards to water scarcity, it<br />
is only critical <strong>in</strong> a specific location <strong>in</strong> the prairies that is not well represented <strong>in</strong> prov<strong>in</strong>cial averages y<strong>et</strong> still<br />
targ<strong>et</strong>s an important concern.<br />
3.3. Ecosystem quality<br />
In this category, potential impacts were highest for aquatic ecotoxicity, eutrophication and land use. In the<br />
first case, it was ma<strong>in</strong>ly the result of possible heavy-m<strong>et</strong>al discharges to water associated with energy production<br />
for different life cycle stages. Z<strong>in</strong>c <strong>in</strong> m<strong>in</strong>eral feed supplements also contributed. The two other<br />
sources of impact were l<strong>in</strong>ked to phosphorus fertilisation and arable land use.<br />
Interest<strong>in</strong>gly, all contributions displayed “ecosensitivity” based on farm location, as a function of geographic<br />
variation <strong>in</strong> characterisation factors (CFs), for example those for land use (Erreur ! Source du renvoi<br />
<strong>in</strong>trouvable.). The effect is obvious when prov<strong>in</strong>cial values calculated us<strong>in</strong>g regional-level CFs are<br />
compared to those calculated us<strong>in</strong>g national-level CFs (Fig. 4). The regionalised prov<strong>in</strong>cial results range<br />
from 3-33 PDF*m 2 *yr (median = 8), while the weighted mean equals 15 PDF*m 2 *yr, illustrat<strong>in</strong>g that while<br />
half the prov<strong>in</strong>ces are below the median of 8 PDF*m 2 *yr, most milk is produced <strong>in</strong> areas that are more<br />
ecosensitive, thereby driv<strong>in</strong>g up the weighted mean.<br />
Figure 3. Map of regionalised land use characterisation<br />
factors (CFs)<br />
3.4. Human health<br />
330<br />
Figure 4. Prov<strong>in</strong>cial distribution of impact on ecosystem<br />
quality us<strong>in</strong>g regional-level (“regionalised”)<br />
and national-level (“not regionalised”) characterisation<br />
factors.<br />
Potential effects on human health were modelled with six different impact categories, but only toxicity<br />
was regionalised. While toxicity plays a role <strong>in</strong> the overall impact (around 7%), ammonia emissions have the<br />
greatest <strong>in</strong>fluence (63% of potential impact). Ammonia emissions, from fertilisers, <strong>in</strong> hous<strong>in</strong>g and from manure<br />
storage, are l<strong>in</strong>ked to respiratory difficulties. The rema<strong>in</strong>der of impact<strong>in</strong>g substances also falls <strong>in</strong> the<br />
category of respiratory <strong>in</strong>organics, related to fossil-fuel combustion (emissions of NOx, SO2, and hydrocarbons),<br />
electricity production and direct use. Potential toxicity impacts are also due to the heavy m<strong>et</strong>al content<br />
of manure spread on crops not used <strong>in</strong> feed. Z<strong>in</strong>c, most notably, bio-accumulates, and excess z<strong>in</strong>c consumption<br />
(through crops) can <strong>in</strong>terfere with the absorption of other essential m<strong>in</strong>erals (ODS, 2011).
PARALLEL SESSION 3C: SHEEP AND DAIRY PRODUCTION SYSTEMS 8 th Int. Conference on <strong>LCA</strong> <strong>in</strong> the<br />
Agri-<strong>Food</strong> Sector, 1-4 Oct <strong>2012</strong><br />
3.5. Hotspot assessment<br />
Where hotspots were found, variability among prov<strong>in</strong>cial averages was analysed to understand the underly<strong>in</strong>g<br />
trends. For climate change, the largest source of variability was the carbon footpr<strong>in</strong>t of energy used at<br />
the farm. This, <strong>in</strong> turn, was l<strong>in</strong>ked to the electrical-grid mix used <strong>in</strong> each prov<strong>in</strong>ce (0.025-0.17 kg CO2e/kg<br />
FPCM), with prov<strong>in</strong>ces supplied by hydroelectricity hav<strong>in</strong>g the smallest footpr<strong>in</strong>t.<br />
Next <strong>in</strong> range of variability was manure management and feed production. For the former, the percentage<br />
contribution of CH4 and N2O varied furthermore, where solid storage caused higher N2O emissions and liquid<br />
storage was dom<strong>in</strong>ated by CH4 emissions. The prov<strong>in</strong>ce with the lowest manure footpr<strong>in</strong>t had 55% of<br />
farms us<strong>in</strong>g solid storage and tanks with a natural crust for liquid storage. Meanwhile, the prov<strong>in</strong>ce with the<br />
highest manure footpr<strong>in</strong>t had many liquid lagoons (37% of farms overall), driv<strong>in</strong>g its contribution much<br />
higher.<br />
Table 3. Comparison of manure storage practices and their emissions (FPCM = fat-and-prote<strong>in</strong>-corrected<br />
milk).<br />
Averaged Solid Solid on Liquid with Liquid with Liquid with Liquid<br />
Manag’t Storage Pasture Crust Cover No Cover Lagoon<br />
% of manure Canadian avg: 34% 13% 37% 5% 8% 3%<br />
kg CO2e/kg FCPM 0.32 0.17 0.30 0.31 0.34 0.35 0.96<br />
% CH4 47% 15% 4% 40% 52% 61% 86%<br />
% N2O 53% 85% 96% 60% 48% 39% 14%<br />
A similar evaluation of contributions was done for the feed-production stage (Table 4), especially s<strong>in</strong>ce it<br />
was a hotspot <strong>in</strong> all impact categories. Rations <strong>in</strong> the Eastern prov<strong>in</strong>ces are more corn by-product rich while<br />
rations <strong>in</strong> the West use canola meal.<br />
Table 4. Contributions of the feed production stage to impacts of crops and rations<br />
Hay Corn Dry Corn Small Soybeans Rations Rations<br />
Silage<br />
Gra<strong>in</strong>s<br />
East West<br />
Overall weight 46% 20% 11% 10% 8% 6% 3%<br />
Climate change 33% 10% 17% 15% 4% 13% 7%<br />
Ecosystem quality 42% 10% 11% 8% 19% 6% 3%<br />
Human health 39% 19% 14% 15% 8% 4% 2%<br />
There was variability <strong>in</strong> contribution based on type of crop. Corn gra<strong>in</strong> and small gra<strong>in</strong>s had relatively<br />
more impact on climate change, ma<strong>in</strong>ly to fertilisation rates, while soybeans had less. The same trend was<br />
observed for impact on human health, as ammonia emissions also depended on fertilisation rates. With potential<br />
impacts on ecosystem quality, there were different factors <strong>in</strong> play. Corn silage, for example, benefitted<br />
from the highest yield per hectare (approximately 13 t of dry matter (DM)/ha) while soybeans were <strong>in</strong> the<br />
lower range, with a yield around 2 t DM/ha, each affect<strong>in</strong>g impacts on land use.<br />
In evaluat<strong>in</strong>g sensitivity of certa<strong>in</strong> param<strong>et</strong>ers, it was important to consider the variable geopolitical and<br />
socio-economic context that <strong>in</strong>fluences practices, while remember<strong>in</strong>g that agriculture is a complex system<br />
with many <strong>in</strong>ter-related cause-effects cha<strong>in</strong>s that are difficult to model. With this <strong>in</strong> m<strong>in</strong>d, and to perform a<br />
mean<strong>in</strong>gful scenario analysis, a few “what-if” scenarios were modelled based on current practices and wellknown<br />
alternatives (as opposed to marg<strong>in</strong>al and emergent practices). These tested animal-replacement practices,<br />
alternative fertiliser types, fat supplements <strong>in</strong> feed, and manure management practices. While animalreplacement<br />
ratios affect the three ma<strong>in</strong> hotspots (feed production, enteric fermentation and manure storage),<br />
most of these options were limited <strong>in</strong> their overall impact and targ<strong>et</strong>ed different hotspots (data not shown).<br />
4. Discussion<br />
Apply<strong>in</strong>g <strong>LCA</strong> to production across Canada required a m<strong>et</strong>hod that allowed and facilitated representation<br />
of differ<strong>in</strong>g prov<strong>in</strong>cial contexts, both <strong>in</strong> terms of practices (<strong>in</strong>ventory) and geophysical conditions (CFs).<br />
Results showed that variability was driven by both aspects, depend<strong>in</strong>g on the <strong>in</strong>dicator. By separat<strong>in</strong>g the<br />
two, it was easier to understand where reductions are possible and where observance of best practices is even<br />
more important (sensitive areas based on location).<br />
Achiev<strong>in</strong>g consistency <strong>in</strong> data collection and <strong>in</strong>terpr<strong>et</strong>ation across Canada, however, was a challenge.<br />
Additionally, while great uncerta<strong>in</strong>ty exists <strong>in</strong> modell<strong>in</strong>g emissions from soils, variability is also great due to<br />
organic (manure) and synth<strong>et</strong>ic fertiliser application dosages and techniques. For the most part of dosages,<br />
only recommendations exist, from which assumptions were derived.<br />
331
PARALLEL SESSION 3C: SHEEP AND DAIRY PRODUCTION SYSTEMS 8 th Int. Conference on <strong>LCA</strong> <strong>in</strong> the<br />
Agri-<strong>Food</strong> Sector, 1-4 Oct <strong>2012</strong><br />
5. Conclusion<br />
The ma<strong>in</strong> contributions to impact came from feed production for four of the five endpo<strong>in</strong>t <strong>in</strong>dicators. For<br />
climate change, as confirmed <strong>in</strong> the literature, enteric fermentation is the most important source of emissions<br />
(46%), followed by manure management (27%) and feed production (20%).<br />
The ma<strong>in</strong> sources of variability <strong>in</strong> climate change impacts among prov<strong>in</strong>ces were l<strong>in</strong>ked to on-farm energy<br />
use (due to different grid mixes), followed by manure management and feed production. Variability <strong>in</strong><br />
results is expected to be underestimated <strong>in</strong> feed production, however, due to the assumption that fertilisation<br />
recommendations were followed.<br />
The ma<strong>in</strong> sources of potential impact to ecosystem quality were caused by land use, eutrophication, and<br />
aquatic ecotoxicity from alum<strong>in</strong>ium emissions derived from energy production and high copper concentrations<br />
<strong>in</strong> m<strong>in</strong>eral supplements. This category was also the most sensitive to geographic locations of farms. For<br />
human health, impacts were driven by respiratory <strong>in</strong>organics, mostly NH3 emissions from fertilisers, <strong>in</strong> hous<strong>in</strong>g<br />
and from manure storage. They were followed by NOx and SO2 emissions associated with fossil-fuel use<br />
for energy production <strong>in</strong> the different stages of lifecycle.<br />
Many ongo<strong>in</strong>g research projects are evaluat<strong>in</strong>g mitigation options that would be worth modell<strong>in</strong>g <strong>in</strong><br />
“what-if” scenarios. Meanwhile, there are many aspects to consider when evaluat<strong>in</strong>g agricultural practices,<br />
and some economic or social trade-offs may require much more analysis. The current study helped outl<strong>in</strong>e<br />
the <strong>in</strong>terchangeability of practices and the sensitivity of the geographical context to help guide best practices.<br />
This study acts as a first step <strong>in</strong> this direction, mapp<strong>in</strong>g the road to susta<strong>in</strong>able milk production <strong>in</strong> Canada.<br />
6. References<br />
CIRAIG, University of Michigan, Quantis and DTU, <strong>2012</strong>. IMPACT World +: A new global regionalized life cycle impact assessment<br />
m<strong>et</strong>hod. http://www.impactworldplus.org/en/<strong>in</strong>dex.php<br />
IDF (International Dairy Federation), 2010. A Common Carbon Footpr<strong>in</strong>t Approach for Dairy: The IDF Guide to Standard Lifecycle<br />
Assessment M<strong>et</strong>hodology for the Dairy Sector, http://www.idf-lca-guide.org/Files/media/Documents/445-2010-A-commoncarbon-footpr<strong>in</strong>t-approach-for-dairy.pdf<br />
Jolli<strong>et</strong> O, Margni M, Charles R, Humbert S, Pay<strong>et</strong> J, Rebitzer G and Rosenbaum R, 2003. IMPACT 2002+: A New Life Cycle Impact<br />
Assessment M<strong>et</strong>hodology. Int J <strong>LCA</strong> 8(6): 324-330.<br />
Humbert S, Margni M and Jolli<strong>et</strong> O, 2011. IMPACT 2002+ User Guide: Draft for version 2.2”. Quantis, Lausanne, Switzerland.<br />
Available at: sebastien.humbert@quantis-<strong>in</strong>tl.com<br />
Pfister, S., Koehler, A., and Hellweg, S., 2009. Assess<strong>in</strong>g the environmental impacts of freshwater consumption. Environmental<br />
Science and Technology, 43(11), 4098-4104.<br />
Office of Di<strong>et</strong>ary Supplements, 2011. Di<strong>et</strong>ary Supplement Fact She<strong>et</strong>: Z<strong>in</strong>c, Office of Di<strong>et</strong>ary Supplements, National Institutes of<br />
Health, USA Gov, http://ods.od.nih.gov/factshe<strong>et</strong>s/Z<strong>in</strong>c-HealthProfessional/<br />
Roch<strong>et</strong>te, P., Worth, D., Lemke, B., McConkey B., Pennock, D., Wagner-Riddle C., Desjard<strong>in</strong>s, R., 2008. Estimation of N2O emissions<br />
from agricultural soils <strong>in</strong> Canada. I. Development of a country-specific m<strong>et</strong>hodology, Canadian Journal of Soil Science,<br />
2008, 88(5): 641-654<br />
Sheppard S, Bittman S, and Bruulsema W, 2009. Monthly ammonia emissions from fertilizers <strong>in</strong> 12 Canadian ecoregions, Can. J.<br />
Soil. Sci, 90(1), 113-127<br />
Sheppard SC, Bittman S, 2011. Farm survey used to guide estimates of nitrogen <strong>in</strong>take and ammonia emissions for beef cattle, <strong>in</strong>clud<strong>in</strong>g<br />
early season graz<strong>in</strong>g and piosphere effects. Animal Feed Science and Technology, 166-167, 688-698.<br />
Swiss Center for Life Cycle Inventories (SCLCI) (2010) eco<strong>in</strong>vent database v2.2. Available at http://www.eco<strong>in</strong>vent.org/home/.<br />
van Zelm, R., Schipper, A., Rombouts, M., Snepvangers, J., and Huijbregts, M. (2010). Implement<strong>in</strong>g groundwater extraction <strong>in</strong> Life<br />
Cycle Impact Assessment: characterization factors based on plant species richness for the N<strong>et</strong>herlands. Enivronmental Science<br />
and Technology, 45, 629-635.<br />
Verones, F., Hanafiah, M., Pfister, S., Huijbregts, M., Pell<strong>et</strong>ier, G., and Koehler, A., 2010. Characterization factors for thermal pollution<br />
<strong>in</strong> freshwater aquatic environments. Environmental Science and Technology, 44, 9364 - 9369.<br />
332
PARALLEL SESSION 3C: SHEEP AND DAIRY PRODUCTION SYSTEMS 8 th Int. Conference on <strong>LCA</strong> <strong>in</strong> the<br />
Agri-<strong>Food</strong> Sector, 1-4 Oct <strong>2012</strong><br />
Quantification of the reduction potential of GHG mitigation measures<br />
<strong>in</strong> Swiss organic milk production us<strong>in</strong>g a life cycle assessment<br />
approach<br />
Christian Schader 1,* , Katja Jud 1,2 , Matthias S. Meier 1,* , Till Kuhn 1,3 , Bernad<strong>et</strong>te Oehen 1 , Andreas Gatt<strong>in</strong>ger 1<br />
1 FiBL - Research Institute of Organic Agriculture, Frick, Switzerland<br />
2 Institute for Environmental Decisions, ETH Zürich, Switzerland<br />
3 Institute for <strong>Food</strong> and Resource Economics, University of Bonn, Germany<br />
Correspond<strong>in</strong>g author. E-mail: christian.schader@fibl.org<br />
ABSTRACT<br />
Quantitative assessments of the effectiveness of GHG mitigation measures at farm level are scarce. Hence, the aim of this study was<br />
to quantify the GHG mitigation potential of selected measures on two typical organic farms <strong>in</strong> Switzerland. We built a s<strong>in</strong>gle-farm<br />
model which enabled us to calculate the GHG emissions and energy consumption at farm level us<strong>in</strong>g a life cycle assessment approach.<br />
The model was used to calculate the effect of 13 different mitigation measures on a Swiss organic dairy and a Swiss organic<br />
mixed farm. At the dairy and mixed farm, respectively, 5.4% and 5.5% of mitigation can be realized by technical means and 15.4%<br />
and 12.9% with agronomic measures, <strong>in</strong>clud<strong>in</strong>g conversion to full-graz<strong>in</strong>g systems, compost<strong>in</strong>g livestock manure, and the use of<br />
dual-purpose cattle breeds, where losses <strong>in</strong> productivity may occur. Total mitigation potential of the measures analysed is 20.8%<br />
(dairy farm) and 18.4% less emissions (mixed farm), respectively.<br />
Keywords: global warm<strong>in</strong>g potential, greenhouse gas mitigation, organic agriculture, carbon footpr<strong>in</strong>t, dairy production<br />
1. Introduction<br />
The environmental benefits of organic farm<strong>in</strong>g compared to conventional farm<strong>in</strong>g <strong>in</strong>clude a reduced<br />
toxicity potential and mitigation of greenhouse gases (GHG) (Schader <strong>et</strong> al., <strong>2012</strong>b). However, from a <strong>LCA</strong><br />
perspective, i.e. when relat<strong>in</strong>g emissions to food production, organic farm<strong>in</strong>g frequently performs worse than<br />
conventional or <strong>in</strong>tegrated management due to reduced productivity (e.g. Williams <strong>et</strong> al., 2006).<br />
Furthermore, recent studies found a high variability b<strong>et</strong>ween farms, even if they are of the same farm type or<br />
region (Hersener <strong>et</strong> al., 2011). This implies a high potential for optimis<strong>in</strong>g farm management with respect to<br />
environmental performance on organic farms. Currently, different mitigation measures for reduc<strong>in</strong>g GHG<br />
emissions from agriculture are discussed by farmers, policy makers and researchers (BLW, 2011). However,<br />
quantitative assessments of these measures at farm level are scarce. Hence, the aim of this study was to<br />
quantify the GHG mitigation potential of selected measures for two organic farms <strong>in</strong> Switzerland.<br />
2. M<strong>et</strong>hods<br />
2.1 Selection of typical farms<br />
Two Swiss organic farms (Table 1) were selected based on their farm type, size, production portfolio and<br />
location, for modell<strong>in</strong>g the impacts of 13 mitigation measures <strong>in</strong> a typical farm-specific context. The real<br />
farms where adapted for improv<strong>in</strong>g the transferability of the results with respect to the impacts of the<br />
measures.<br />
Due to the dom<strong>in</strong>ant role of milk production for the Swiss organic sector two dairy farms were selected.<br />
The first farm is a typical organic farm located <strong>in</strong> the mounta<strong>in</strong> areas on rather marg<strong>in</strong>al land. 20 dairy cows<br />
<strong>in</strong>clud<strong>in</strong>g offspr<strong>in</strong>g are kept on about 25 hectares. The average milk yield (ECM) per cow and year is 5,300<br />
kg. Organic manure, mostly slurry, is applied via pipes. The second farm is a typical organic mixed farm as<br />
prevalent <strong>in</strong> the Swiss lowlands. 40 dairy cows <strong>in</strong>clud<strong>in</strong>g offspr<strong>in</strong>g are kept on about 50 hectares. The<br />
average milk yield (ECM) per cow and year is 6,425 kg.<br />
2.2 Selection and specification of GHG mitigation measures<br />
Based on a literature review Bischhofberger and Gatt<strong>in</strong>ger (2011) identified 21 measures applicable on<br />
Swiss organic farms which are potentially effective <strong>in</strong> mitigat<strong>in</strong>g GHG. Based on this study, 13 potential<br />
GHG mitigation measures were selected for quantification on the two specific farms (Table 2). The measures<br />
were chosen accord<strong>in</strong>g to a) their presumed mitigation potential, b) the absence of trade-offs with other environmental<br />
and <strong>et</strong>hological impact categories and c) their applicability on Swiss organic farms. The farm specific<br />
characterisations of the measures were def<strong>in</strong>ed accord<strong>in</strong>g to the local conditions of the selected farms<br />
and <strong>in</strong> consent with the farmers (Table 2).<br />
333
PARALLEL SESSION 3C: SHEEP AND DAIRY PRODUCTION SYSTEMS 8 th Int. Conference on <strong>LCA</strong> <strong>in</strong> the<br />
Agri-<strong>Food</strong> Sector, 1-4 Oct <strong>2012</strong><br />
Table 1. Overview of selected farms.<br />
Characteristics Specialised dairy farm Mixed farm<br />
Region Mounta<strong>in</strong> region Lowlands<br />
Elevation above sea level (m) 800 500<br />
Summer feed<strong>in</strong>g period (days) 200 215<br />
W<strong>in</strong>ter feed<strong>in</strong>g period (days) 165 150<br />
Farm size (ha) 25.1 51<br />
Share permanent grassland 100% 52%<br />
Share arable crops 0% 48%<br />
Crops Permanent meadows and pastures Permanent meadows and pastures, ley, silage<br />
maize, triticale, peas, potatoes, w<strong>in</strong>ter wheat<br />
Livestock (LU a ) 24.77 52.16<br />
Stock<strong>in</strong>g density (LU a /ha) 0.98 0.99<br />
Number of dairy cows 20 40<br />
Milk production b per cow 5300 kg 6425 kg<br />
Cattle hous<strong>in</strong>g system Loose hous<strong>in</strong>g system Loose hous<strong>in</strong>g system<br />
a Swiss livestock units<br />
b fat and prote<strong>in</strong> corrected milk (FPCM)<br />
Table 2. Farm-specific characterisations of selected GHG mitigation measures.<br />
Measure Specification of measure<br />
Compost<strong>in</strong>g livestock<br />
manure<br />
Due to b<strong>et</strong>ter aeration of manure, CH4 and N2O emissions can be reduced. However, additional use of<br />
mach<strong>in</strong>ery and fleece is necessary for compost preparation.<br />
Increased number of An <strong>in</strong>creased number of lactations (up to 3.6) decreases the share of cattle <strong>in</strong> an unproductive stage and<br />
lactations<br />
cows<br />
of dairy thus total m<strong>et</strong>hane emissions<br />
Use of dual-purpose Cattle race ‘Orig<strong>in</strong>al Braunvieh” is used <strong>in</strong>stead of ‘Swiss Braunvieh”. Changes <strong>in</strong> milk yield were esti-<br />
cattle breeds<br />
mated accord<strong>in</strong>g to Mahrer (2011)<br />
Use of photovoltaics Photovoltaics are used on the total roof area (Dairy farm: 500 m 2 , mixed farm: 900 m 2 ) of the farms under<br />
consideration of local solar radiation levels.<br />
Conversion to full- Enhance the share of pastures for allow<strong>in</strong>g the cattle herd to graze outside dur<strong>in</strong>g the summer feed<strong>in</strong>g<br />
graz<strong>in</strong>g system period. This leads to a reduction of manure management emissions and energy use due to grassland management<br />
Mach<strong>in</strong>e use dur<strong>in</strong>g Mach<strong>in</strong>es and tractors were assumed to be used beyond the amortisation period up to their technical life<br />
technical life time time.<br />
Shade trees on pastures Plant<strong>in</strong>g of walnut trees (Juglans regia) on pastures (5 on dairy farm; 20 on mixed farm)<br />
Energy-efficient<br />
cool<strong>in</strong>g devices<br />
milk Installation of waste heat recovery devices from milk cool<strong>in</strong>g for warm water heat<strong>in</strong>g<br />
Concentrate-free feed<strong>in</strong>g<br />
rations<br />
Concentrate use <strong>in</strong> feed<strong>in</strong>g rations of dairy cows and offspr<strong>in</strong>g is substituted by grass-based fodder<br />
Application of Eco Studies show that an application of ‘eco-efficient driv<strong>in</strong>g” can save 10-20% fuel compared to standard<br />
drive mode<br />
driv<strong>in</strong>g practice<br />
Optimisation of mach<strong>in</strong>es<br />
and tractors<br />
We assumed that farmers purchase and use the more energy efficient tractor (<strong>in</strong>stead of an average tractor)<br />
Use of solar heat Solar heat is used for heat<strong>in</strong>g process water<br />
Reduced tillage Plough<strong>in</strong>g is replaced by cultivator, except after ley (measure only on the mixed farm). Fuel can be saved<br />
and soil carbon stocks is likely to be <strong>in</strong>creased but was assumed to rema<strong>in</strong> constant as reliable figures were<br />
unavailable for a situation where plough<strong>in</strong>g is reduced <strong>in</strong>stead of compl<strong>et</strong>ely stopped.<br />
2.3. Farm model<br />
We built a s<strong>in</strong>gle-farm model based on a <strong>LCA</strong> approach which enabled us to calculate the GHG emissions<br />
and energy use of a farm <strong>in</strong> different conditions, us<strong>in</strong>g eco<strong>in</strong>vent and other data sources as well as data from<br />
own assessments (Schader <strong>et</strong> al., <strong>2012</strong>a).<br />
Ma<strong>in</strong> components of the model are the plant and the livestock production module which take <strong>in</strong>to account<br />
all processes and <strong>in</strong>puts relevant for def<strong>in</strong><strong>in</strong>g the production <strong>in</strong>ventories (Fig. 1). Inventories are based on<br />
eco<strong>in</strong>vent (Nemecek und Kägi, 2007) and own <strong>in</strong>ventories of organic production processes. The model is<br />
able to reflect <strong>in</strong>teractions b<strong>et</strong>ween plant and livestock production <strong>in</strong>clud<strong>in</strong>g emissions of purchased <strong>in</strong>puts,<br />
<strong>in</strong> l<strong>in</strong>e with life cycle assessment m<strong>et</strong>hodology as def<strong>in</strong>ed <strong>in</strong> ISO14040 and 14044.<br />
GHG emissions were calculated based on the production <strong>in</strong>ventories accord<strong>in</strong>g to the IPCC guidel<strong>in</strong>e<br />
(2006) and PAS2050. For calculat<strong>in</strong>g on-farm N2O emissions a model was employed, which specifically<br />
takes <strong>in</strong>to account the mode of action of organic fertilisers when applied to the soil (Meier <strong>et</strong> al., <strong>2012</strong>). En-<br />
334
PARALLEL SESSION 3C: SHEEP AND DAIRY PRODUCTION SYSTEMS 8 th Int. Conference on <strong>LCA</strong> <strong>in</strong> the<br />
Agri-<strong>Food</strong> Sector, 1-4 Oct <strong>2012</strong><br />
teric fermentation was calculated us<strong>in</strong>g a model by Kirchgessner (1995), while the IPCC model (2006) was<br />
used for sensitivity analysis.<br />
GHG emissions are calculated for the functional units ‘ha of cultivated area’ and ‘kg FPCM (fat- and prote<strong>in</strong>-corrected)<br />
milk produced’. For calculat<strong>in</strong>g the milk production-related impacts the emissions directly<br />
associated with cash crops were excluded, while emissions for dairy production were allocated economically<br />
b<strong>et</strong>ween milk, meat and live animals output. Changes <strong>in</strong> productivity due to GHG mitigation measures have<br />
to be d<strong>et</strong>erm<strong>in</strong>ed exogenously. Each farm was assessed a) without implementation of the measures and b)<br />
with each of the measures implemented <strong>in</strong>dividually. The difference <strong>in</strong> GHG emissions b<strong>et</strong>ween both states<br />
of a farm is <strong>in</strong>terpr<strong>et</strong>ed as the effectiveness of the measure for mitigat<strong>in</strong>g GHG emissions on the specific<br />
farm.<br />
3. Results<br />
3.1 GHG emission profiles without implementation of GHG mitigation measures<br />
Without any mitigation measure implemented the dairy farm (DF) emits 139 t CO2-eq, while the mixed<br />
farm (MF) 278 t CO2-eq annually (Fig. 2; columns). Per hectare, this means almost equal emissions of 5.54 t<br />
CO2-eq (DF) and 5.50 t CO2-eq (MF), respectively. Both farms have a similar stock<strong>in</strong>g density. However,<br />
the MF has a higher production. Therefore, the MF is more GHG efficient (0.89 kg CO2-eq/kg milk) compared<br />
to the DF (1.08 kg CO2-eq/kg milk) (Fig. 2; diamonds). The ma<strong>in</strong> reason for this difference lies <strong>in</strong> the<br />
more favourable climatic conditions for the MF as it is located <strong>in</strong> the lowlands and benefits from a longer<br />
veg<strong>et</strong>ation period and higher temperatures.<br />
The by far greatest share of GHG emissions is associated with enteric fermentation of both dairy cows<br />
and offspr<strong>in</strong>gs (DF: 56.1%; MF: 55.7%) (Fig. 2). Further important factors are manure management with<br />
18.6% (DF) and 20.7% (MF), respectively, and fodder production (DF: 18.7%; MF: 13.7%). While the DF<br />
does not purchase any fodder from outside, the mixed farm imports concentrates (4.4%) which contribute<br />
1.9% to the total emissions.<br />
Figure 2. Annual GHG emissions (CO2-eq) on a typical Swiss organic dairy and mixed farm<br />
3.2 Mitigation potential of the measures<br />
Effective measures are conversion to full-graz<strong>in</strong>g systems, use of dual-purpose cattle breeds, <strong>in</strong>creased<br />
number of lactations of dairy cows, compost<strong>in</strong>g livestock manure, use of photovoltaics, use of solar heat, and<br />
optimisation of mach<strong>in</strong>e life. At the dairy and mixed farm, respectively, 5.4% and 5.5% of mitigation can be<br />
realised by technical means (use of photovoltaics, optimisation of mach<strong>in</strong>e life, energy-efficient milk cool<strong>in</strong>g<br />
devices, application of eco drive mode, optimisation of mach<strong>in</strong>es and tractors, use of solar heat) and 15.4%<br />
and 12.9% with agronomic measures (compost<strong>in</strong>g livestock manure, <strong>in</strong>creased number of lactations of dairy<br />
cows, use of dual-purpose cattle breeds, conversion to full-graz<strong>in</strong>g system, shade trees on pastures, concentrate-free<br />
feed<strong>in</strong>g rations) where losses <strong>in</strong> productivity may occur. Total mitigation potential of the measures<br />
analysed is 20.8% (dairy farm) and 18.4% less emissions (mixed farm), respectively.<br />
335
PARALLEL SESSION 3C: SHEEP AND DAIRY PRODUCTION SYSTEMS 8 th Int. Conference on <strong>LCA</strong> <strong>in</strong> the<br />
Agri-<strong>Food</strong> Sector, 1-4 Oct <strong>2012</strong><br />
A limited mitigation potential of below 1% of total GHG emissions (Table 3) can be associated with the<br />
measures ‘shade trees on pastures’, ‘energy-efficient milk cool<strong>in</strong>g devices’, ‘concentrate-free feed<strong>in</strong>g rations’,<br />
‘application of eco drive mode’, ‘optimisation of mach<strong>in</strong>es and tractors’, ‘use of solar heat’ and ‘reduced<br />
tillage’. The relative effects of these measures are limited, as they address predom<strong>in</strong>antly energy use,<br />
while CH4 emissions from enteric fermentation dom<strong>in</strong>ate the emission profile of the selected farms. Furthermore,<br />
some of the measures may perform b<strong>et</strong>ter <strong>in</strong> a different context. For <strong>in</strong>stance, we assumed that<br />
under local farm conditions on the mixed farm, a full conversion to reduced tillage is not feasible due to<br />
weed control problems. However, from field and on farm-trials <strong>in</strong> other locations <strong>in</strong> Switzerland we know<br />
that if a full conversion is undertaken, soil carbon stocks build up, improv<strong>in</strong>g the GHG balance of production<br />
(Berner <strong>et</strong> al., 2008; Gadermaier <strong>et</strong> al., 2010).<br />
The low performance of the measure ‘concentrate-free feed<strong>in</strong>g rations’ depends on the fact, that organic<br />
farms <strong>in</strong> Switzerland are restricted already to use only 10% concentrates <strong>in</strong> their feed<strong>in</strong>g rations. Furthermore,<br />
soy used <strong>in</strong> Swiss organic feed<strong>in</strong>g rations at present does not orig<strong>in</strong>ate from regions where direct land<br />
use change from ra<strong>in</strong> forest or savannah to arable land is relevant.<br />
Table 3. Optimisation potential of selected GHG-reduction measures on two typical Swiss organic farms (kg<br />
CO2-eq / per farm and year)<br />
Specialised dairy Mixed farm<br />
farm<br />
(dairy/arable)<br />
Potential reduction of GHG emissions Absolute Relative Absolute Relative Potential impact on productivity<br />
Total GHG emissions 139,066 100.00% 277,911 100.00%<br />
Compost<strong>in</strong>g livestock manure -4429 -3.18% -12,128 -4.36%<br />
Increased number of lactations of dairy cows -7,788 -5.60% -8,677 -3.12%<br />
slightly reduced<br />
expected<br />
productivity<br />
Use of dual-purpose cattle breeds -3,977 -2.86% -7,357 -2.65%<br />
reduced milk production but <strong>in</strong>creased<br />
meat production expected<br />
Use of photovoltaics (on total roof area) -4,073 -2.93% -6,153 -2.21%<br />
Conversion to full-graz<strong>in</strong>g system -4,672 -3.36% -6,128 -2.21%<br />
Estimated reduction <strong>in</strong> milk production<br />
11-19%<br />
Optimisation of mach<strong>in</strong>e life -2,206 -1.59% -4,237 -1.52%<br />
Shade trees on pastures -226 -0.16% -753 -0.27%<br />
< 1% reduced pasture productivity<br />
expected<br />
Energy-efficient milk cool<strong>in</strong>g devices -235 -0.17% -518 -0.19%<br />
Concentrate-free feed<strong>in</strong>g rations -371 -0.27% -343 -0.12%<br />
0-10% reduced productivity<br />
expected (Notz <strong>et</strong> al., <strong>2012</strong>)<br />
Application of Eco drive mode -728 -0.52% -2,206 -0.79%<br />
Optimisation of mach<strong>in</strong>es and tractors -111 -0.08% -1,935 -0.70%<br />
Use of solar heat (for process water on farm) -139 -0.10% -262 -0.09%<br />
Reduced tillage* - -564 -0.20%<br />
+/- 10% productivity changes<br />
expected (Berner <strong>et</strong> al., 2008)<br />
Potential GHG sav<strong>in</strong>gs if all measures are<br />
implemented<br />
-28,955 -20.82% -51,261 -18.45%<br />
* calculations do not take <strong>in</strong>to account potential ga<strong>in</strong>s <strong>in</strong> carbon stocks<br />
4. Discussion and conclusions<br />
Our model results demonstrate that the 13 measures for GHG mitigation have a cumulative potential of<br />
about 20.8% (dairy farm) and 18.4% (mixed farm), respectively. However, the effectiveness of the optimisation<br />
measures depends on farm-specific characteristics. For <strong>in</strong>stance, the effectiveness <strong>in</strong>stall<strong>in</strong>g a photovoltaic<br />
plant may be limited if the roof exposition is sub-optimal. Furthermore, if the mitigation potential is<br />
calculated for the functional unit ‘milk production’, implement<strong>in</strong>g measures that reduce productivity could<br />
decrease the effectiveness of the measures or even lead to negative impacts on the global warm<strong>in</strong>g potential.<br />
Possible productivity losses depend, however, on farm-specific characteristics and are difficult to anticipate.<br />
It is important to understand that the mitigation potential must not be <strong>in</strong>terpr<strong>et</strong>ed as optimisation potential.<br />
The comparison of the two farms – one on favourable and one on marg<strong>in</strong>al land – illustrates that geographical<br />
conditions can <strong>in</strong>fluence the GHG efficiency of production substantially. As we have shown, the mitigation<br />
potential of these two farms is limited, even if all measures are applied. Especially on organic farms, the<br />
<strong>in</strong>put-side is <strong>in</strong> most cases already optimised to a large extent. Optimisation potential on organic farms with<br />
respect to GHG efficiency lies largely <strong>in</strong> improv<strong>in</strong>g farm management <strong>in</strong> order to <strong>in</strong>crease productivity.<br />
F<strong>in</strong>ally, it is important to note, that we only analysed the impacts of the measures on GHG emissions. We<br />
regard the occurrence of trade-offs to other environmental impact categories with implement<strong>in</strong>g the measures<br />
as unlikely. Therefore, the implementation of the analysed optimisation measures can be recommended from<br />
336
PARALLEL SESSION 3C: SHEEP AND DAIRY PRODUCTION SYSTEMS 8 th Int. Conference on <strong>LCA</strong> <strong>in</strong> the<br />
Agri-<strong>Food</strong> Sector, 1-4 Oct <strong>2012</strong><br />
an ecological perspective, <strong>in</strong> particular if substantial productivity losses can be avoided on farm. In fact,<br />
there is a high potential of co-benefits <strong>in</strong> terms of other environmental and <strong>et</strong>hological impacts associated<br />
with some measures. For <strong>in</strong>stance, compost<strong>in</strong>g of livestock manure is known to have a positive <strong>in</strong>fluence on<br />
soil fertility. Therefore, when rank<strong>in</strong>g the measures aga<strong>in</strong>st each other, these co-benefits should be considered.<br />
The farm model proved to be a useful tool for assess<strong>in</strong>g farm- and product-specific GHG emissions and<br />
modell<strong>in</strong>g the potential of measures for mitigat<strong>in</strong>g greenhouse gases.<br />
5. Acknowledgements<br />
The authors thank the many experts that contributed to the project underly<strong>in</strong>g this paper, particularly An<strong>et</strong><br />
Spengler, Silvia Ivemeyer, P<strong>et</strong>er Klocke, Barbara Früh, Christian W<strong>in</strong>kler, Hansueli Dierauer, Paul Mäder,<br />
Christophe Notz, Eric Meili, Pamela Staehli, and Christoph Fankhauser.<br />
6. References<br />
Berner, A., Hildermann, I., Fliessbach, A., Pfiffner, L., Niggli, U. and Mäder, P. (2008). 'Crop yield and soil fertility response to<br />
reduced tillage under organic management'. Soil & Tillage Research 101, pp. 89-96.<br />
Bischofberger, N. and Gatt<strong>in</strong>ger, A. (2011). 'Klimaschutz auf Biob<strong>et</strong>rieben - Merkblatt', Forschungs<strong>in</strong>stitut für biologischen Landbau<br />
(FiBL), Frick, Schweiz.<br />
BLW (2011). 'Klimastrategie Landwirtschaft. Klimaschutz und Anpassung an den Klimawandel für e<strong>in</strong>e nachhaltige Schweizer<br />
Land- und Ernährungswirtschaft', Bern, Bundesamt für Landwirtschaft (BLW).<br />
Gadermaier, F., Berner, A., Fließbach, A., Friedel, J.K. and Mäder, P. (2010). 'Impact of reduced tillage on soil organic carbon and<br />
nutrient budg<strong>et</strong>s under organic farm<strong>in</strong>g'. Renewable Agriculture and <strong>Food</strong> Systems 27: 1, pp. 68-80.<br />
Hersener, J.-L., Baumgartner, D. and Dux, D. (2011). 'Zentrale Auswertung von Ökobilanzen landwirtschaftlicher B<strong>et</strong>riebe (ZA-<br />
ÖB). Schlussbericht', Agroscope Reckenholz-Tänikon (ART).<br />
IPCC (2006). '2006 IPCC Guidel<strong>in</strong>es for National Greenhouse Gas Inventories - Volume 4: Agriculture, Forestry and Other Land<br />
Use', Intergovernmental Panel on Climate Change (IPCC).<br />
Kirchgessner, M. (1995). Tierernährung, Frankfurt/Ma<strong>in</strong>: DLG-Verlag.<br />
Mahrer, D.D. (2011). 'Unterschiede zwischen F1 und F2 Kreuzungstieren von Orig<strong>in</strong>al Braunvieh (OB) x Braunvieh (BV) und<br />
Tieren der Elternpopulation'. Bachelor Thesis. Berner Fachhochschule (BFH), Schweizer Hochschule für Landwirtschaft<br />
(SHL). Zollikofen.<br />
Meier, M., Schader, C. and Gatt<strong>in</strong>ger, A. (<strong>2012</strong>). 'Model<strong>in</strong>g N2O emissions from organic fertilisers for <strong>LCA</strong> <strong>in</strong>ventories', 8th International<br />
Conference on <strong>LCA</strong> <strong>in</strong> the Agri-<strong>Food</strong> Sector (<strong>LCA</strong>food<strong>2012</strong>) 2-4 October <strong>2012</strong>, Rennes, <strong>France</strong>.<br />
Nemecek, T. and Kägi, T. (2007). 'Life Cycle Inventories of Agricultural Production Systems. Data v2.0. Eco<strong>in</strong>vent report No. 15',<br />
Zürich and Dübendorf, eco<strong>in</strong>vent centre. Swiss Centre for Life Cycle Inventories. Agroscope Reckenholz-Tänikon Research<br />
Station (ART).<br />
Notz, C., Böhler, D., Hecht, J., Ivemeyer, S., Maeschli, A., Meier, M., Meili, E., Klocke, P., Kuhn, T., Schader, C., Schumann, T.,<br />
Staehli, P., Walkenhorst, M. and W<strong>in</strong>kler, C. (<strong>2012</strong>). 'Feed no <strong>Food</strong> – E<strong>in</strong>fluss der kraftfutterm<strong>in</strong>imierten R<strong>in</strong>derfütterung<br />
auf Tiergesundheit, Ökologie und Ökonomie - Projektabschlussbericht 2009-2011', Frick, Research Institute of Organic<br />
Agriculture (FiBL).<br />
Schader, C., Meier, M., Kuhn, T., Jud, K., Oehen, B., Gatt<strong>in</strong>ger, A. and Stolze, M. (<strong>2012</strong>a). 'Modell zur Quantifizierung des Energieberbrauchs<br />
und der Treibhausgasemissionen von Biob<strong>et</strong>rieben. Diskussionspapier. Version 30.3.<strong>2012</strong>', Frick, Research Institute<br />
of Organic Agriculture (FiBL).<br />
Schader, C., Stolze, M. and Gatt<strong>in</strong>ger, A. (<strong>2012</strong>b). 'Environmental performance of organic agriculture'. <strong>in</strong> Boye, J. and Arcand, Y.<br />
(eds.), Green Technologies <strong>in</strong> <strong>Food</strong> Production and Process<strong>in</strong>g, New York: Spr<strong>in</strong>ger, pp. 183-206.<br />
Williams, A.G., Audsley, E. and Sandars, D.L. (2006). 'Energy and environmental burdens of organic and non-organic agriculture<br />
and horticulture'. Aspects of Applied Biology. What will organic farm<strong>in</strong>g deliver? 79: COR 2006, pp. 19-23.<br />
337
PLENARY SESSION 3: METHODS FOR BIODIVERSITY AND SOIL QUALITY 8 th Int. Conference on <strong>LCA</strong> <strong>in</strong> the<br />
Plenary session 3: M<strong>et</strong>hods for Biodiversity and Soil Quality<br />
338<br />
Agri-<strong>Food</strong> Sector, 1-4 Oct <strong>2012</strong><br />
Produce beef or biodiversity? The trade-offs b<strong>et</strong>ween <strong>in</strong>tensive and<br />
extensive beef fatten<strong>in</strong>g<br />
Thomas Nemecek*, Frank Hayer, Mart<strong>in</strong>a Alig, Philippe Jeanner<strong>et</strong>, Gérard Gaillard<br />
Agroscope Reckenholz-Tänikon Research Station ART, CH-8046 Zürich, Switzerland,<br />
Correspond<strong>in</strong>g author. E-mail: thomas.nemecek@art.adm<strong>in</strong>.ch<br />
ABSTRACT<br />
Accord<strong>in</strong>g to the concept of multi-functionality, agriculture has to fulfil several functions. In addition to the production of food, feed,<br />
fibre and fuels, it aims at ma<strong>in</strong>ta<strong>in</strong><strong>in</strong>g a high level of biodiversity, ma<strong>in</strong>ta<strong>in</strong><strong>in</strong>g agricultural production <strong>in</strong> marg<strong>in</strong>al areas, and ensur<strong>in</strong>g<br />
liv<strong>in</strong>g for a rural population. The productive function requires highly productive systems, whereas to <strong>in</strong>crease biodiversity, extensive<br />
management is needed. This trade-off b<strong>et</strong>ween high productivity and high biodiversity potential is highlighted <strong>in</strong> this paper, us<strong>in</strong>g a<br />
case study with different beef production systems <strong>in</strong> Switzerland.<br />
The SA<strong>LCA</strong>-biodiversity m<strong>et</strong>hod (Jeanner<strong>et</strong> <strong>et</strong> al., 2008) is used to assess potential impacts of agricultural management on the overall<br />
species diversity. The m<strong>et</strong>hod uses 11 <strong>in</strong>dicator organisms groups to describe the potential impacts on biodiversity. Three different<br />
beef production systems were evaluated us<strong>in</strong>g model farms: an <strong>in</strong>tegrated beef fatten<strong>in</strong>g (IBF), an <strong>in</strong>tegrated suckler cow system<br />
(ISC), and an organic suckler cow system (OSC), all located <strong>in</strong> the lowlands. First an <strong>in</strong>ventory of all used agricultural areas (for<br />
feedstuff production, graz<strong>in</strong>g, rear<strong>in</strong>g animals, <strong>et</strong>c.) was established. Then, an <strong>in</strong>ventory of all management activities <strong>in</strong>fluenc<strong>in</strong>g<br />
biodiversity was established and the potential impacts on the <strong>in</strong>dicator organism groups were assessed. The average biodiversity<br />
scores were calculated as area and time weighted averages of all used agricultural areas. With<strong>in</strong> a given crop the differences were<br />
relatively small, whereas the differences due to different management <strong>in</strong>tensities of grassland were very large. The f<strong>in</strong>al result is thus<br />
d<strong>et</strong>erm<strong>in</strong>ed by the composition of the feed ration, the yields of the different feed raw materials, which d<strong>et</strong>erm<strong>in</strong>e the area required for<br />
their production, and the management <strong>in</strong>tensity and type of use (graz<strong>in</strong>g, cutt<strong>in</strong>g) for grassland.<br />
The <strong>in</strong>tegrated beef fatten<strong>in</strong>g system uses two to three times less area to produce 1 kg of beef compared to the suckler cow systems.<br />
This is due to the fact that the suckler cow has to be fully allocated to the beef production, whereas <strong>in</strong> an <strong>in</strong>tensive beef fatten<strong>in</strong>g<br />
system, the calf can be considered as a by-product of dairy production and the mother cow is allocated ma<strong>in</strong>ly to the milk. Furthermore,<br />
the suckler cow systems use partly extensively managed grassland with lower yields. The OSC needs slightly more area to<br />
produce the same amount of beef than ISC, due to lower yields of organic crops and grasslands.<br />
The overall species diversity was estimated to be lowest for the IBF and higher for the suckler cow systems (Fig. 1). This difference<br />
is expla<strong>in</strong>ed by the fact that overall species diversity is generally higher <strong>in</strong> grassland than <strong>in</strong> crops. In particular less <strong>in</strong>tensively and<br />
extensively managed grassland had higher scores for overall species diversity. Due to the ban of pesticides, the OSC had a slightly<br />
higher biodiversity score than ISC.<br />
Now we have to consider that the areas used are very different: the <strong>in</strong>tegrated beef system uses less area; this leaves area for other<br />
uses. If we assume that the excess area is used for ecological compensation areas, the <strong>in</strong>tegrated system would have the highest overall<br />
biodiversity score. If however, the excess area is managed <strong>in</strong> the same way as the rest of the system, the extensive systems would<br />
have the highest scores, but the overall production would not be the same.<br />
Two scenarios have been calculated to estimate the theor<strong>et</strong>ical potentials for biodiversity and productivity of beef fatten<strong>in</strong>g: one<br />
scenario assesses the maximal biodiversity potentials, which could be achieved by extensive management (Fig. 1). The difference to<br />
the studied systems is considerable. This shows that the current beef production systems have a high potential for development both<br />
<strong>in</strong> terms of higher productivity or higher biodiversity. These two goals are <strong>in</strong> conflict. Research is needed to develop beef fatten<strong>in</strong>g<br />
systems which b<strong>et</strong>ter reconcile a good productivity with a high level of biodiversity (the green arrow “susta<strong>in</strong>able development”).<br />
Acknowledgement<br />
These research results were developed by ART with the support of COOP Switzerland.<br />
Reference<br />
Jeanner<strong>et</strong>, P., Baumgartner, D.U., Knuchel, R.F. & Gaillard, G., 2008. A new LCIA m<strong>et</strong>hod for assess<strong>in</strong>g impacts of agricultural<br />
activities on biodiversity (SA<strong>LCA</strong>-Biodiversity). In: Proceed<strong>in</strong>gs of the 6th International Conference on <strong>LCA</strong> <strong>in</strong> the Agri-<strong>Food</strong><br />
Sector – Towards a susta<strong>in</strong>able management of the <strong>Food</strong> cha<strong>in</strong>, Nemecek, T. & Gaillard, G. (eds.). November 12–14, 2008, Zurich.<br />
Agroscope ART, 34-39.
PLENARY SESSION 3: METHODS FOR BIODIVERSITY AND SOIL QUALITY 8 th Int. Conference on <strong>LCA</strong> <strong>in</strong> the<br />
Agri-<strong>Food</strong> Sector, 1-4 Oct <strong>2012</strong><br />
OSD<br />
18<br />
16<br />
14<br />
12<br />
10<br />
8<br />
6<br />
4<br />
2<br />
0<br />
Susta<strong>in</strong>able development<br />
0 0.05 0.1 0.15 0.2<br />
kg lw per m 2<br />
Max OSD ISC OSC IBF Max productivity per ha<br />
Figure 1. Comparison of overall species diversity (OSD) of three beef fatten<strong>in</strong>g systems: <strong>in</strong>tegrated beef<br />
fatten<strong>in</strong>g (IBF), <strong>in</strong>tegrated suckler cow system (ISC), organic suckler cow system (OSC). “Max OSD” shows<br />
the theor<strong>et</strong>ical potential for highest biodiversity <strong>in</strong> a beef production system, “Max productivity per ha”<br />
shows the theor<strong>et</strong>ical potential for high productivity.<br />
339
PLENARY SESSION 3: METHODS FOR BIODIVERSITY AND SOIL QUALITY 8 th Int. Conference on <strong>LCA</strong> <strong>in</strong> the<br />
Agri-<strong>Food</strong> Sector, 1-4 Oct <strong>2012</strong><br />
Assess<strong>in</strong>g land use impacts on biodiversity on a regional scale: the case<br />
of crop production <strong>in</strong> Kenya<br />
Laura de Baan 1* , Michael Curran 2 , Stefanie Hellweg 2 , Thomas Koellner 3<br />
1 NSSI, Institute for Environmental Decisions, ETH Zurich, Universitätstr. 22, 8092 Zurich, Switzerland<br />
2 ESD, Institute for Environmental Eng<strong>in</strong>eer<strong>in</strong>g, ETH Zurich, Schafmattstr. 6, 8093 Zurich, Switzerland<br />
3 Professorship of Ecological Services, University of Bayreuth, Universitätsstr. 30, 95440 Bayreuth, Germany<br />
Correspond<strong>in</strong>g author. E-mail: laura.debaan@<strong>et</strong>hz.env.ch<br />
ABSTRACT<br />
In current Life Cycle Impact Assessment (LCIA), impacts of land use on biodiversity are often assessed at a local (e.g. field) scale.<br />
The relevance of these local impacts is often limited, as species that are not able to survive on agricultural land may persi st <strong>in</strong> adjacent<br />
undisturbed areas. However, if habitat is scarce on a regional scale, the risk of regional or even global ext<strong>in</strong>ction <strong>in</strong>creases. Here,<br />
we present a m<strong>et</strong>hod to upscale local land use impacts <strong>in</strong> LCIA to the ecoregional scale us<strong>in</strong>g an adapted species-area relationship<br />
model. This model is applied to land use <strong>in</strong> Kenya, where conversion of natural habitats to small and large-scale farms is threaten<strong>in</strong>g<br />
areas of high biodiversity value. As we use globally available data as a start<strong>in</strong>g po<strong>in</strong>t, this m<strong>et</strong>hod is potentially applicable to other<br />
world regions and provides a more environmentally relevant assessment of the land use impacts of agricultural products.<br />
Keywords: biodiversity, land use, regional assessment, Kenya, spatial scales<br />
1. Introduction<br />
Agricultural production occupies about one third of the global terrestrial surface. This causes major<br />
impacts on ecosystems and biodiversity at multiple spatial scales (e.g. local, regional and global). To<br />
evaluate options for reduc<strong>in</strong>g these impacts, decision-support tools such as life cycle assessment (<strong>LCA</strong>)<br />
should help decision-makers to obta<strong>in</strong> the relevant environmental <strong>in</strong>formation related to their product or<br />
product system. In many life cycle impact assessment (LCIA) m<strong>et</strong>hods for land use, local impacts on<br />
biodiversity are assessed (e.g. de Baan <strong>et</strong> al., <strong>2012</strong>), which reflect the direct impacts on the used piece of land<br />
(e.g. by remov<strong>in</strong>g forest-species to cultivate crops). These local impacts are traditionally assessed as<br />
potentially disappeared fraction of species (PDF), represent<strong>in</strong>g relative changes <strong>in</strong> species richness b<strong>et</strong>ween<br />
a used piece of land and a reference situation (e.g. undisturbed natural veg<strong>et</strong>ation). However, these local<br />
assessment m<strong>et</strong>hods do not provide the <strong>in</strong>formation relevant for decisions-makers concerned about<br />
conservation of species at larger scales, i.e. the absolute loss of species <strong>in</strong> a region or globally. Local<br />
extirpation of species from a used piece of land can be fully reversible if the species can survive <strong>in</strong> adjacent<br />
wild areas, and thus recolonize the field after its abandonment. As local conversion of habitat cont<strong>in</strong>ues,<br />
ext<strong>in</strong>ction risk <strong>in</strong>creases to an extent that there is not enough habitat rema<strong>in</strong><strong>in</strong>g at a regional or global level,<br />
lead<strong>in</strong>g to regional or global ext<strong>in</strong>ction, respectively. Global ext<strong>in</strong>ction is fully irreversible and thus of<br />
highest environmental concern. An assessment that <strong>in</strong>corporates both local and regional factors requires<br />
additional <strong>in</strong>formation on the landscape surround<strong>in</strong>g the agricultural field, and is thus more data demand<strong>in</strong>g.<br />
In this paper, we present a m<strong>et</strong>hod to upscale impacts from local to regional scale and to transform<br />
relative <strong>in</strong>to absolute species losses. We apply the m<strong>et</strong>hod <strong>in</strong> a prelim<strong>in</strong>ary case study of agricultural<br />
production and mammal species diversity <strong>in</strong> Kenya, us<strong>in</strong>g globally available data.<br />
1.1. The case: agricultural production <strong>in</strong> Kenya<br />
Previous land use LCIA m<strong>et</strong>hods have been mostly developed for the European (e.g. De Schryver <strong>et</strong> al.,<br />
2010; Koellner and Scholz 2008) or North American context (e.g. Geyer <strong>et</strong> al., 2010), and to our knowledge,<br />
only one study has focused on the African cont<strong>in</strong>ent (Burke <strong>et</strong> al., 2008). We chose Kenya as a case study to<br />
assess regional impacts on biodiversity because it harbours biodiverse areas at threat from human encroachment.<br />
Kenya hosts two global biodiversity hotspots that have already lost more than 70% of their natural<br />
habitats due to human activities. This largely results from an overlap <strong>in</strong> agricultural suitability and biological<br />
value, which are both concentrated <strong>in</strong> South-Central and Western Kenya, and have attracted a dense and<br />
grow<strong>in</strong>g population caus<strong>in</strong>g cont<strong>in</strong>ued land use change or <strong>in</strong>tensification and encroachment of protected<br />
areas. Large shares of species rich ecosystems have been converted to small-holder and large-scale agricultural<br />
land to produce subsistence or export-orientated cash crops such as tea, coffee, cashews, and flowers. A<br />
strong dependence of the often poor rural populations on ecosystems for food, fuel and graz<strong>in</strong>g land, coupled<br />
with <strong>in</strong>creas<strong>in</strong>g population densities puts further pressures on ecosystems (Biggs <strong>et</strong> al., 2004). A more recent<br />
threat to biodiversity comes from an <strong>in</strong>crease <strong>in</strong> land excisions and sales to foreign <strong>in</strong>vestors for the purpose<br />
of large-scale, export-oriented farm<strong>in</strong>g for food and biofuels production (Odhiambo 2011).<br />
340
PLENARY SESSION 3: METHODS FOR BIODIVERSITY AND SOIL QUALITY 8 th Int. Conference on <strong>LCA</strong> <strong>in</strong> the<br />
Agri-<strong>Food</strong> Sector, 1-4 Oct <strong>2012</strong><br />
2. M<strong>et</strong>hods<br />
We calculated land use impacts on biodiversity accord<strong>in</strong>g the UNEP/SETAC Life Cycle Initiative<br />
Framework (Koellner <strong>et</strong> al., <strong>2012</strong>a; Milà i Canals <strong>et</strong> al., 2007), and dist<strong>in</strong>guished b<strong>et</strong>ween occupation (land<br />
use), transformation (land use change) and permanent impacts (irreversible changes <strong>in</strong> ecosystems, see Fig<br />
1). Occupation and transformation impacts were calculated based on regional ext<strong>in</strong>ction risk of non-endemic<br />
species. Permanent impacts were based on the ext<strong>in</strong>ction risk of species endemic to that ecoregion. Below,<br />
we outl<strong>in</strong>e how the number of potentially ext<strong>in</strong>ct species was estimated and how we derived regional characterisation<br />
factors for the three land use impacts (occupation, transformation, and permanent impacts).<br />
Figure 1. Graphical illustration of occupation, transformation and permanent impacts (adapted from Koellner<br />
<strong>et</strong> al., <strong>2012</strong>a)<br />
2.1 Calculat<strong>in</strong>g potential regional mammal species ext<strong>in</strong>ctions due to land transformation and occupation<br />
As <strong>in</strong> earlier land use LCIA studies, we based our assessment on changes <strong>in</strong> the predicted species numbers<br />
accord<strong>in</strong>g to the species-area relationship (SAR), a model often used to predict ext<strong>in</strong>ction rates due to<br />
habitat loss. The SAR is derived from island biogeography theory, which describes a non-l<strong>in</strong>ear (often<br />
power) function b<strong>et</strong>ween species richness S and area A of island ecosystems (Rosenzweig 1995):<br />
S= cA Eq. 1<br />
with two constants c (species richness of area A=1) and z (species accumulation rate). If the area of primary<br />
habitat is reduced from an orig<strong>in</strong>al area to an area , and if we assume , then the<br />
relative number of species S rema<strong>in</strong><strong>in</strong>g can be calculated as (Koh and Ghazoul 2010):<br />
z<br />
A A c org new new = corg z<br />
Snew Sorg =<br />
Eq. 2<br />
The number of species lost <strong>in</strong> an ecosystem due to habitat loss is given as (Koh and Ghazoul 2010):<br />
A æ ö<br />
new<br />
ç<br />
è A<br />
÷<br />
org ø<br />
æ A ö<br />
new<br />
Slost = Sorg - Sorg ç<br />
A<br />
÷<br />
è org ø<br />
Eq. 3<br />
As SAR models tend to overestimate ext<strong>in</strong>ction rates, we base our m<strong>et</strong>hod on an adapted SAR model, the<br />
matrix-SAR developed by Koh and Ghazoul (2010), which gave more realistic estimates of species ext<strong>in</strong>ction<br />
rates than the conventional SAR model. Unlike the conventional SAR, the matrix-SAR model considers<br />
that the human-modified area (i.e. the land use matrix) is not void of species, but provides a certa<strong>in</strong> habitat<br />
quality for different species groups. This is accounted for by adapt<strong>in</strong>g z, the exponent of Eq. 3, depend<strong>in</strong>g on<br />
the composition of the matrix (i.e. the area share of different land use types pi) and the sensitivity of each<br />
taxonomic group to different land use types i (Koh and Ghazoul 2010):<br />
å<br />
n<br />
z<br />
S lost<br />
z ¢ = z* pis i ; with Eq. 4<br />
i<br />
A i<br />
pi =<br />
Aorg - Anew s i<br />
Eq. 5<br />
341
PLENARY SESSION 3: METHODS FOR BIODIVERSITY AND SOIL QUALITY 8 th Int. Conference on <strong>LCA</strong> <strong>in</strong> the<br />
Agri-<strong>Food</strong> Sector, 1-4 Oct <strong>2012</strong><br />
The taxon sensitivity s is calculated as the relative decrease <strong>in</strong> species richness on a human modified<br />
i<br />
land compared to an undisturbed reference ref. F<strong>in</strong>ally, the predicted number of species that might g<strong>et</strong> regionally<br />
ext<strong>in</strong>ct can be calculated as (Koh and Ghazoul 2010).<br />
n<br />
z<br />
æ A ö<br />
å p<br />
i is i<br />
new<br />
Slost = Sorg - Sorg ç<br />
è A<br />
÷<br />
Eq. 6<br />
org ø<br />
From the regionally ext<strong>in</strong>ct species, some species might not occur <strong>in</strong> any other world region (i.e. species<br />
endemic to one ecoregion), and thus g<strong>et</strong> globally ext<strong>in</strong>ct. This is considered a global land use impact and is<br />
fully irreversible. We thus split the calculations <strong>in</strong>to non-endemic and endemic species. The first are used to<br />
calculate occupation and transformation impacts (which are considered to be reversible) and the latter are<br />
used to calculate permanent impacts, which are considered to be irreversible. The total number of species<br />
regionally ext<strong>in</strong>ct is equal to the number of endemic and non-endemic species lost.<br />
We calculated the potential regionally or globally ext<strong>in</strong>ct mammal species us<strong>in</strong>g data from WWF ecoregions<br />
(Olson <strong>et</strong> al., 2001) as spatial units. The area shares of different land use types were derived from the<br />
Globcover land cover map v2.3 (ESA 2009). Values for z were derived from Drakare <strong>et</strong> al., (2006) and for<br />
the taxon sensitivity σ we used data from de Baan <strong>et</strong> al., (<strong>2012</strong>).<br />
2.2 Calculation of characterisation factors<br />
Above, we used the matrix SAR to estimate the number of endemic and non-endemic species lost due to<br />
all accumulated land use activities with<strong>in</strong> one ecoregion. For application <strong>in</strong> <strong>LCA</strong>, the impact per land use<br />
type and area is required. Therefore, the total regional impact had to be allocated to the different land use<br />
activities occurr<strong>in</strong>g with<strong>in</strong> the region, to g<strong>et</strong> an estimate of the number of species lost due to a specific land<br />
use type. In a first step, we divided the number of lost endemic and non-endemic species by the used area.<br />
Then, we allocated the impacts per area to the different land use activities, whereby the land use activity with<br />
the lowest habitat value and the largest area share got the highest share of the impacts.<br />
F<strong>in</strong>ally, we calculated characterisation factors for land occupation and transformation based on impacts<br />
on non-endemic species (considered as reversible impacts, see Fig 1). Impacts on endemic species were used<br />
to calculate permanent (irreversible) impacts.<br />
The regional characterisation factor for occupation impacts were calculated by divid<strong>in</strong>g the number of<br />
lost non-endemic species by the total used area and multiply<strong>in</strong>g it with the allocation factor.<br />
Transformation impacts were then calculated by multiply<strong>in</strong>g the CF of occupation with half the time required<br />
for species to recolonize an area after the land was abandonment. As empirical data on regeneration<br />
times are miss<strong>in</strong>g, we assumed a constant regeneration time of 150 years for artificial area and 100 years for<br />
agricultural land.<br />
Permanent impacts were calculated as the number of endemic species lost due to land use. These species<br />
are not occurr<strong>in</strong>g <strong>in</strong> any other global ecosystem and are thus permanently ext<strong>in</strong>ct, if they cannot persist <strong>in</strong> the<br />
ecoregion. In order for the three impacts (transformation, occupation and permanent) to be aggregated <strong>in</strong> a<br />
f<strong>in</strong>al step, they must be <strong>in</strong> the same units, i.e. [species loss* area * time], see Fig 1. Thus, we assessed the<br />
permanent impacts over a certa<strong>in</strong> modell<strong>in</strong>g period. Here we used a 500 years modell<strong>in</strong>g period as suggested<br />
by Koellner <strong>et</strong> al., (<strong>2012</strong>a).<br />
For calculat<strong>in</strong>g occupation impacts of agricultural products, the characterisation factor for occupation is<br />
multiplied by the land use <strong>in</strong>ventory flow of land occupation, given as [area * time]. The transformation and<br />
permanent impacts are multiplied by the <strong>in</strong>ventory flow of land transformation, given as [area].<br />
3. Results<br />
We calculated the habitat loss <strong>in</strong> each Kenyan ecoregion due to the total current land occupation and past<br />
transformation and modelled the potential loss of endemic and non-endemic mammals per ecoregion. The<br />
degree of habitat conversion varied substantially across ecoregions, with very little use <strong>in</strong> desert ecosystems<br />
and up to 85% converted land <strong>in</strong> agriculturally suitable areas (Fig 2). The total mammals species richness<br />
varied b<strong>et</strong>ween ecoregion from 27 to 221 with zero to 6 endemic mammals per ecoregion. For nonendemic<br />
mammals, zero to 14 species were predicted to be regionally ext<strong>in</strong>ct due to all land use activities (Fig 3). For<br />
endemic species, zero to 0.4 species per ecoregion were predicted at risk of global ext<strong>in</strong>ction due to past<br />
habitat conversion (Fig 4).<br />
A selection of the result<strong>in</strong>g regional characterisation factors for occupation, transformation and permanent<br />
impacts is displayed <strong>in</strong> Table 1. Compared to local (relative) characterisation factors calculated by de Baan <strong>et</strong><br />
342
PLENARY SESSION 3: METHODS FOR BIODIVERSITY AND SOIL QUALITY 8 th Int. Conference on <strong>LCA</strong> <strong>in</strong> the<br />
Agri-<strong>Food</strong> Sector, 1-4 Oct <strong>2012</strong><br />
al., (<strong>2012</strong>), the regional (absolute) characterisation factors were several orders of magnitude smaller. The<br />
regional occupation and transformation impacts ranged b<strong>et</strong>ween ecoregions by a factor 10 to over 180,<br />
whereas the regional permanent impacts ranged from zero (ecoregions with no endemic mammals) to 2*10 -08<br />
with a factor 80 from lowest to highest impact.<br />
Table 1. Local and regional characterisation factors calculated for selected regions and land use types. The<br />
respective units are <strong>in</strong>dicated <strong>in</strong> brack<strong>et</strong>s. The land use types follow the classification suggested <strong>in</strong> Kollner <strong>et</strong><br />
al., (<strong>2012</strong>b).<br />
Biome<br />
Local occupation impacts [potentially disappeared fraction of species (PDF)] (from de Baan <strong>et</strong> al., <strong>2012</strong>)<br />
World average<br />
0.56 0.6 0.42 0.2 0.2 0.44<br />
(Sub)-tropical moist broadleaf forest 1 0.51 0.54 0.42 0.18 0.18 -<br />
(Sub)-tropical grassland, savannas, and shrublands 7 0.65 0.65 - - - -<br />
Regional occupation impacts [potentially regionally ext<strong>in</strong>ct non-endemic species]<br />
East African montane forests (AT0108) 1 5.5E-10 5.9E-10 4.6E-10 2.0E-10 2.0E-10 4.8E-10<br />
Eastern Arc forests (AT0109)<br />
Northern Zanzibar-Inhambane coastal forest mosaic<br />
1 1.1E-09 - 8.8E-10 - 3.8E-10 9.2E-10<br />
(AT0125)<br />
Northern Acacia-Commiphora bushlands and thick<strong>et</strong>s<br />
1 2.8E-10 3.0E-10 2.3E-10 9.8E-11 9.8E-11 2.4E-10<br />
(AT0711)<br />
Somali Acacia-Commiphora bushlands and thick<strong>et</strong>s<br />
7 1.3E-10 1.3E-10 8.7E-11 4.1E-11 4.1E-11 9.1E-11<br />
(AT0715)<br />
Southern Acacia-Commiphora bushlands and thick<strong>et</strong>s<br />
7 3.0E-11 3.0E-11 - 9.3E-12 9.3E-12 2.1E-11<br />
(AT0716) 7 1.9E-10 1.9E-10 - 5.8E-11 5.8E-11 1.3E-10<br />
Victoria Bas<strong>in</strong> forest-savanna mosaic (AT0721) 7 3.8E-10 3.8E-10 2.5E-10 1.2E-10 1.2E-10 2.6E-10<br />
Regional transformation impacts [potentially regionally ext<strong>in</strong>ct non-endemic species * years]<br />
East African montane forests (AT0108) 1 2.8E-08 2.9E-08 2.3E-08 9.8E-09 9.8E-09 3.6E-08<br />
Eastern Arc forests (AT0109)<br />
Northern Zanzibar-Inhambane coastal forest mosaic<br />
1 5.3E-08 - 4.4E-08 - 1.9E-08 6.9E-08<br />
(AT0125)<br />
Northern Acacia-Commiphora bushlands and thick<strong>et</strong>s<br />
1 1.4E-08 1.5E-08 1.1E-08 4.9E-09 4.9E-09 1.8E-08<br />
(AT0711)<br />
Somali Acacia-Commiphora bushlands and thick<strong>et</strong>s<br />
7 6.7E-09 6.7E-09 4.3E-09 2.1E-09 2.1E-09 6.8E-09<br />
(AT0715)<br />
Southern Acacia-Commiphora bushlands and thick<strong>et</strong>s<br />
7 1.5E-09 1.5E-09 - 4.7E-10 4.7E-10 1.5E-09<br />
(AT0716) 7 9.3E-09 9.3E-09 - 2.9E-09 2.9E-09 9.5E-09<br />
Victoria Bas<strong>in</strong> forest-savanna mosaic (AT0721) 7 1.9E-08 1.9E-08 1.2E-08 5.8E-09 5.8E-09 1.9E-08<br />
Regional permanent impacts [potentially globally ext<strong>in</strong>ct endemic species * years]<br />
East African montane forests (AT0108) 1 4.5E-09 4.7E-09 3.7E-09 1.6E-09 1.6E-09 3.8E-09<br />
Eastern Arc forests (AT0109)<br />
Northern Zanzibar-Inhambane coastal forest mosaic<br />
1 1.7E-08 - 1.4E-08 - 5.9E-09 1.4E-08<br />
(AT0125)<br />
Northern Acacia-Commiphora bushlands and thick<strong>et</strong>s<br />
1 4.1E-09 4.4E-09 3.4E-09 1.5E-09 1.5E-09 3.6E-09<br />
(AT0711)<br />
Somali Acacia-Commiphora bushlands and thick<strong>et</strong>s<br />
7 3.2E-10 3.2E-10 2.1E-10 9.8E-11 9.8E-11 2.2E-10<br />
(AT0715)<br />
Southern Acacia-Commiphora bushlands and thick<strong>et</strong>s<br />
7 5.7E-10 5.7E-10 - 1.8E-10 1.8E-10 3.9E-10<br />
(AT0716) 7 0.0E+00 0.0E+00 - 0.0E+00 0.0E+00 0.0E+00<br />
Victoria Bas<strong>in</strong> forest-savanna mosaic (AT0721) 7 2.6E-09 2.6E-09 1.7E-09 8.0E-10 8.0E-10 1.8E-09<br />
5 Agriculture<br />
5.1 Annual crops<br />
5.2. Permanent crops<br />
6. Agriculture, mosaic 50-<br />
70%<br />
6. Agriculture, mosaic 20-<br />
50%<br />
7. Artificial areas<br />
343
PLENARY SESSION 3: METHODS FOR BIODIVERSITY AND SOIL QUALITY 8 th Int. Conference on <strong>LCA</strong> <strong>in</strong> the<br />
Agri-<strong>Food</strong> Sector, 1-4 Oct <strong>2012</strong><br />
Figure 2. Rema<strong>in</strong><strong>in</strong>g share of natural<br />
habitat <strong>in</strong> and around Kenya<br />
(country marked as white l<strong>in</strong>e)<br />
344<br />
Figure 3. Modelled loss of nonendemic<br />
mammals<br />
Figure 4. Modelled loss of endemic<br />
mammals<br />
4. Discussion<br />
In this paper we assessed absolute regional land use impacts (i.e. numbers of species that potentially disappear<br />
regionally due to land use) by upscal<strong>in</strong>g local relative impacts (i.e. the potential fraction of locally<br />
disappeared species). Absolute and regional characterisation factors are b<strong>et</strong>ter suited to compare land use<br />
impacts across ecosystems and across land use types. In contrast to local relative impacts, the presented regional<br />
absolute characterisation factors reflect differences of land use impacts occurr<strong>in</strong>g <strong>in</strong> species rich or<br />
species poor ecosystems with high or low levels of endemism, or of land use impacts occurr<strong>in</strong>g <strong>in</strong> highly<br />
disturbed or prist<strong>in</strong>e ecosystems. In addition, they directly reflect conservation targ<strong>et</strong>s that aim to prevent<br />
regional (occupation and transformation impacts) and global ext<strong>in</strong>ction (permanent impacts).<br />
The presented approach used globally available data to allow transferr<strong>in</strong>g the approach to other world regions.<br />
However, the accuracy of such global data <strong>in</strong> the regional context still has to be further assessed. B<strong>et</strong>ter<br />
regional land use maps, more region- and taxon-specific habitat suitability scores and b<strong>et</strong>ter data on restoration<br />
times would improve the credibility of the results. Modell<strong>in</strong>g species ext<strong>in</strong>ction at regional and global<br />
scales for use <strong>in</strong> <strong>LCA</strong> improves the <strong>in</strong>terpr<strong>et</strong>ability of results, but also <strong>in</strong>troduces many uncerta<strong>in</strong>ties. The<br />
validity of the matrix-SAR model still has to be further tested, as many important factors driv<strong>in</strong>g ext<strong>in</strong>ction<br />
risk were not considered here (e.g. h<strong>et</strong>erogeneity with<strong>in</strong> ecoregions, temporal dynamics, connectivity of<br />
habitats).<br />
5. Conclusion<br />
Upscal<strong>in</strong>g local land use impacts to regional impacts provides more environmentally relevant <strong>in</strong>formation<br />
to policy makers on the effects of land use on biodiversity. The presented m<strong>et</strong>hod can potentially help to<br />
b<strong>et</strong>ter evaluate the environmental impacts of globally traded agricultural goods orig<strong>in</strong>at<strong>in</strong>g from Kenya or<br />
other world regions. As we use globally available data as a start<strong>in</strong>g po<strong>in</strong>t, this m<strong>et</strong>hod can be applied to other<br />
world regions. However, the robustness and validity of the presented characterisation factors still needs to be<br />
evaluated and tested aga<strong>in</strong>st more d<strong>et</strong>ailed data and techniques <strong>in</strong> a vari<strong>et</strong>y of s<strong>et</strong>t<strong>in</strong>gs.<br />
6. References<br />
Biggs, R., Bohensky, E., Desanker, P. V., <strong>et</strong> al., , 2004. Nature Support<strong>in</strong>g People: The Southern African Millennium Ecosystem<br />
Assessment. Integrated report. Pr<strong>et</strong>oria, South Africa: Council for Scientific and Industrial Research.<br />
Burke, A., Kyläkorpi, L., Rydgren, B., Schneeweiss, R., 2008. Test<strong>in</strong>g a scand<strong>in</strong>avian biodiversity assessment tool <strong>in</strong> an African<br />
desert environment. Environ. Manage. 42: 698–706.<br />
de Baan, L., Alkemade, R., and Koellner, T., <strong>2012</strong>. Land use impacts on biodiversity <strong>in</strong> <strong>LCA</strong>: a global approach. Int. J. Life Cycle<br />
Assess. (onl<strong>in</strong>e first).<br />
De Schryver, A. M., Goedkoop, M. J., Leuven, R. S. E. W., and Huijbregts, M. A. J., 2010. Uncerta<strong>in</strong>ties <strong>in</strong> the application of the<br />
species area relationship for characterisation factors of land occupation <strong>in</strong> life cycle assessment. Int. J. Life Cycle Assess. 15:<br />
682-691.<br />
Drakare, S., Lennon, J., and Hillebrand, H., 2006. The impr<strong>in</strong>t of the geographical, evolutionary and ecological context on speciesarea<br />
relationships. Ecol L<strong>et</strong>t 9: 215-227.<br />
ESA, 2009. GlobCover land cover map, v2.3. European Space Agency.
PLENARY SESSION 3: METHODS FOR BIODIVERSITY AND SOIL QUALITY 8 th Int. Conference on <strong>LCA</strong> <strong>in</strong> the<br />
Agri-<strong>Food</strong> Sector, 1-4 Oct <strong>2012</strong><br />
Geyer, R., L<strong>in</strong>dner, J.P., Stoms, D.M., Davis, F.W., and Wittstock, B., 2010. Coupl<strong>in</strong>g GIS and <strong>LCA</strong> for biodiversity assessments of<br />
land use: Part 2: Impact assessment. Int J Life Cycle Assess 15: 692-703.<br />
Koellner, T. and Scholz, R.W., 2008. Assessment of land use impacts on the natural environment. Part 2: Generic characterization<br />
factors for local species diversity <strong>in</strong> Central Europe. Int. J. Life Cycle Assess. 13: 32-48.<br />
Koellner, T., de Baan, L., Beck, T., Brandão, M., Civit, B., Margni, M., Milà i Canals, L., Saad, R., de Souza, D. M., and Müller-<br />
Wenk, R., <strong>2012</strong>a. UNEP-SETAC Guidel<strong>in</strong>e on Global Land Use Impact Assessment on Biodiversity and Ecosystem Services <strong>in</strong><br />
<strong>LCA</strong>. Int. J. Life Cycle Assess. (accepted).<br />
Koellner, T., de Baan, L., Beck, T., Brandão, M., Civit, B., Goedkoop, M. J., Margni, M., Milà i Canals, L., Müller-Wenk, R., Weidema,<br />
B., and Wittstock, B., <strong>2012</strong>b. Pr<strong>in</strong>ciples for Life Cycle Inventories of land use on a global scale. Int. J. Life Cycle Assess.<br />
(onl<strong>in</strong>e first).<br />
Koh, L.P. and Ghazoul, J., 2010. A Matrix-Calibrated Species-Area Model for Predict<strong>in</strong>g Biodiversity Losses Due to Land-Use<br />
Change. Conserv. Biol. 24: 994–1001.<br />
Milà i Canals, L., Bauer, C., Depestele, J., Dubreuil, A., Freiermuth Knuchel, R., Gaillard, G., Michelsen, O., Müller-Wenk, R., and<br />
Rydgren, B., 2007. Key Elements <strong>in</strong> a Framework for Land Use Impact Assessment With<strong>in</strong> <strong>LCA</strong>. Int. J. Life Cycle Assess. 12: 5-<br />
15.<br />
Odhiambo, M.O. 2011. Commercial pressures on land <strong>in</strong> Africa: A regional overview of opportunities, challenges and impacts.<br />
Rome: The International Land Coalition.<br />
Olson, D., D<strong>in</strong>erste<strong>in</strong>, E., Wikramanayake, E., <strong>et</strong> al., 2001. Terrestrial ecoregions of the worlds: A new map of life on Earth. BioScience<br />
51: 933-938.<br />
Rosenzweig, M.L., 1995. Species diversity <strong>in</strong> space and time. Cambridge University Press.<br />
345
PLENARY SESSION 3: METHODS FOR BIODIVERSITY AND SOIL QUALITY 8 th Int. Conference on <strong>LCA</strong> <strong>in</strong> the<br />
Agri-<strong>Food</strong> Sector, 1-4 Oct <strong>2012</strong><br />
Modell<strong>in</strong>g effects of river water withdrawals on aquatic biodiversity <strong>in</strong><br />
LCIA<br />
346<br />
Danielle Tendall 1,2,* , Stephan Pfister 2 , Stefanie Hellweg 2 , Gérard Gaillard 1<br />
1 Agroscope Reckenholz-Tänikon research station ART, 8046 Zürich, Switzerland<br />
2 Ecological Systems Design, ETHZ, 8093 Zürich, Switzerland<br />
Correspond<strong>in</strong>g author. E-mail: danielle.tendall@art.adm<strong>in</strong>.ch<br />
ABSTRACT<br />
Water abstraction for crop production is expected to <strong>in</strong>crease dur<strong>in</strong>g the next century <strong>in</strong> Switzerland (Fuhrer <strong>et</strong> al., 2009) and certa<strong>in</strong><br />
regions of Europe (EEA 2009) due to climate change. Rivers are a significant source of water for irrigation, and therefore impacts of<br />
river water withdrawals should be <strong>in</strong>cluded <strong>in</strong> LCIA of crop production. The impact of river water withdrawals on freshwater biodiversity<br />
has been modelled <strong>in</strong> <strong>LCA</strong> (Hanafiah <strong>et</strong> al., 2011) by us<strong>in</strong>g a relationship b<strong>et</strong>ween fish species richness aggregated with<strong>in</strong><br />
river bas<strong>in</strong>s to average discharge at the mouth of the bas<strong>in</strong>s, based on statistical regression. However the param<strong>et</strong>erisation used,<br />
developed for latitudes below 42° and near-natural rivers, is not applicable to Switzerland and much of Europe. Furthermore, local<br />
effects are not addressed.<br />
We therefore developed species-discharge param<strong>et</strong>erisations for Switzerland and Europe, <strong>in</strong>clud<strong>in</strong>g macro-<strong>in</strong>vertebrate taxa <strong>in</strong> addition<br />
to fish for Switzerland, so as to reflect more ecosystem functionality. We show that the goodness of fit can be highly improved<br />
for certa<strong>in</strong> regions if a higher spatial resolution is used (for example subs<strong>et</strong>s based on eco-region): such spatial subs<strong>et</strong>s for Europe<br />
revealed Pearson’s R 2 of up to 0.59 compared to 0.35 for the whole datas<strong>et</strong> (Fig. 1), and for Switzerland R 2 was improved from 0.69<br />
to 0.9. We assessed the sensitivity of results b<strong>et</strong>ween such “improved-fits” and the <strong>in</strong>itial generic model: predictions of PDF are<br />
similar, although the param<strong>et</strong>erisations with higher spatial resolution predict species richness more accurately (the slopes of the<br />
param<strong>et</strong>erisations show similar trends, whereas absolute values such as maxima differ). The param<strong>et</strong>erisations for Switzerland show<br />
that the potential fraction of species lost (PDF) due to marg<strong>in</strong>al withdrawals of river water is higher for smaller rivers and suggest<br />
threshold behaviour b<strong>et</strong>ween small and large rivers. Uncerta<strong>in</strong>ty <strong>in</strong> the species-discharge relationship was observed to be high for<br />
discharges below 20m 3 /s for Switzerland, <strong>in</strong> which range other sources of variability should be explored.<br />
Generalised relationships b<strong>et</strong>ween discharge and aquatic species richness are not confirmed by experimental studies, as effects are<br />
highly site-specific (Poff and Zimmerman 2010). Additionally, the major hypothesis of the reference model is debated, namely:<br />
<strong>in</strong>ferr<strong>in</strong>g causality b<strong>et</strong>ween changes <strong>in</strong> discharge and aggregate species richness <strong>in</strong> the watershed (“aggregated-level”). Us<strong>in</strong>g site<br />
species richness (“site-level”) rather than aggregated-level richness <strong>in</strong> the regression may be an improvement, as we show with the<br />
example of a small watershed. In keep<strong>in</strong>g with the site-specific nature of such relationships (as mentioned above), correlations tested<br />
for larger spatial scales were found to be weak, illustrat<strong>in</strong>g their limited use for larger spatial scales and generic application.<br />
We conclude that our aggregated-level param<strong>et</strong>erisations can be used to calculate characterisation factors specifically for Switzerland<br />
and for eco-regions of Europe, however with high uncerta<strong>in</strong>ties for small rivers. For adequate species richness prediction, the use of<br />
such spatially-differentiated param<strong>et</strong>erisations is recommended, whereas the generic param<strong>et</strong>erisation is sufficient for estimates of<br />
PDF. Site-level models may improve ecological mean<strong>in</strong>gfulness <strong>in</strong> localised assessments, but additional drivers should be <strong>in</strong>cluded<br />
to improve model strength and reduce uncerta<strong>in</strong>ties.<br />
Figure 1. Improvement of correlation strength us<strong>in</strong>g regionalised species-discharge relationships: an example for Europe: a) map of<br />
river bas<strong>in</strong>s of Europe, with ibero-macronesian eco-region highlighted <strong>in</strong> red, b) species-discharge relationship for Europe, c) species-discharge<br />
relationship for ibero-macronesian region.<br />
References<br />
European Environment Agency (EEA), 2009. Water resources across Europe - confront<strong>in</strong>g water scarcity and drought. Copenhagen,<br />
55 p.<br />
Fuhrer, J., Jasper, K., 2009. Bewässerungsbedürftigkeit <strong>in</strong> der Schweiz. Agroscope Reckenholz-Tänikon, Swiss Federal Office for<br />
Agriculture, 74 p.<br />
Hanafiah, M.M., Xenopoulos, M.A., Pfister, S., Leuven, R.S.E.W., Huijbregts, M.A.J., 2011. Characterization factors for water<br />
consumption and greenhouse gas emissions based on freshwater fish species ext<strong>in</strong>ction. Environ. Sci. Technol. 45, 5272-5278.<br />
Poff, N.L., Zimmerman, J.K.H., 2010. Ecological responses to altered flow regimes: a literature review to <strong>in</strong>form the science and<br />
management of environmental flows. Freshwater Biology 55, 194-205.
PLENARY SESSION 3: METHODS FOR BIODIVERSITY AND SOIL QUALITY 8 th Int. Conference on <strong>LCA</strong> <strong>in</strong> the<br />
Agri-<strong>Food</strong> Sector, 1-4 Oct <strong>2012</strong><br />
Soil-quality <strong>in</strong>dicators <strong>in</strong> <strong>LCA</strong>: m<strong>et</strong>hod presentation with a case study<br />
Emmanuelle Garrigues 1,2,* , Michael S. Corson 1,2 , Christian Walter 2,1 , Denis A. Angers 3 , Hayo van der Werf 1,2<br />
1 INRA, UMR1069, Soil Agro and hydroSystems, F-35000 Rennes, <strong>France</strong><br />
2 Agrocampus Ouest, UMR1069, Soil Agro and hydroSystems, F-35000 Rennes, <strong>France</strong><br />
3 Agriculture and Agri-<strong>Food</strong> Canada, 2560 Blvd. Hochelaga, Quebec City, Quebec, G1V 2J3, Canada<br />
Correspond<strong>in</strong>g author: emmanuellegarrigues@hotmail.com<br />
ABSTRACT<br />
Impacts on soil quality should be <strong>in</strong>cluded <strong>in</strong> life cycle assessments because of the essential role that soils play <strong>in</strong> ecosystem function<strong>in</strong>g.<br />
We propose a m<strong>et</strong>hod that <strong>in</strong>tegrates impacts on quality of agricultural soils (erosion, soil organic matter, and compaction) of<br />
each stage of an agricultural product as a function of the soil and climate contexts of its agricultural processes. Input data must be as<br />
site-specific and accurate as possible, but if measured data are miss<strong>in</strong>g, the m<strong>et</strong>hod has a standardised framework of rules and recommendations<br />
for estimat<strong>in</strong>g or f<strong>in</strong>d<strong>in</strong>g them. We present a case study focused on the soil-quality impacts of produc<strong>in</strong>g pig feed <strong>in</strong><br />
Brittany, <strong>France</strong>. The framework allows for <strong>in</strong>cremental improvement of the m<strong>et</strong>hod through the <strong>in</strong>clusion of new soil-quality impacts.<br />
Keywords: soil quality, life cycle assessment, <strong>in</strong>dicators, site dependence<br />
1. Introduction<br />
Soils are an essential resource <strong>in</strong> both managed and natural systems, and ma<strong>in</strong>ta<strong>in</strong><strong>in</strong>g soil quality is critical<br />
to the susta<strong>in</strong>able development of human activities, <strong>in</strong> particular agriculture. The difficulty <strong>in</strong> represent<strong>in</strong>g<br />
impacts on soil quality rema<strong>in</strong>s an unresolved problem <strong>in</strong> Life Cycle Assessment (<strong>LCA</strong>) because of soil’s<br />
spatial and temporal variability and the complex <strong>in</strong>teractions among soil properties. Current status of soil<br />
quality <strong>in</strong> <strong>LCA</strong> <strong>in</strong> presented <strong>in</strong> (Garrigues <strong>et</strong> al., <strong>2012</strong>). It is crucial to consider soil quality <strong>in</strong> the environmental<br />
assessment of products, especially those with a majority of their life cycle <strong>in</strong> bio-based processes<br />
(such as agriculture and forestry).<br />
Soil is def<strong>in</strong>ed here<strong>in</strong> as naturally occurr<strong>in</strong>g, unconsolidated m<strong>in</strong>eral or organic material at least 10 cm<br />
thick that occurs at the earth's surface and is capable of support<strong>in</strong>g plant growth. In this def<strong>in</strong>ition “naturally<br />
occurr<strong>in</strong>g” excludes displaced materials such as gravel dumps and m<strong>in</strong>e spoils, but “unconsolidated material”<br />
<strong>in</strong>cludes that compacted or cemented by soil-form<strong>in</strong>g processes. Soil quality can be def<strong>in</strong>ed by its capacity<br />
to function (Karlen <strong>et</strong> al., 1997) and/or its fitness for use (Larson and Pierce, 1994; L<strong>et</strong>ey <strong>et</strong> al., 2003).<br />
The objective of this study was to establish a framework for quantify<strong>in</strong>g <strong>in</strong>dicator(s) of impact on soil<br />
quality <strong>in</strong> a life cycle perspective, valid for all soil and climate conditions, and consider<strong>in</strong>g both on-site and<br />
off-site agricultural soils. The m<strong>et</strong>hod developed answers needs identified by Garrigues <strong>et</strong> al., (<strong>2012</strong>) for<br />
<strong>LCA</strong> <strong>in</strong>dicators of impacts on soil quality. It <strong>in</strong>cludes the impact categories erosion, soil organic matter<br />
(SOM) and compaction. Erosion and SOM impacts already exist <strong>in</strong> <strong>LCA</strong> approaches (Milà i Canals <strong>et</strong> al.,<br />
2007; Nuñez <strong>et</strong> al., 2010), but compaction impacts have y<strong>et</strong> to be quantified <strong>in</strong> d<strong>et</strong>ail <strong>in</strong> <strong>LCA</strong>. Cowell and<br />
Clift (2000) provided some ideas but excluded soil compactibility of their <strong>in</strong>dicator. We applied the m<strong>et</strong>hod<br />
to a case study of soil-quality impacts of produc<strong>in</strong>g pig feed <strong>in</strong> Brittany, <strong>France</strong>.<br />
2. M<strong>et</strong>hod Presentation<br />
2.1. General framework<br />
Integrat<strong>in</strong>g soil-quality impacts throughout the life cycle of an agricultural product requires a global approach<br />
to assess impacts on soil quality that can be adapted to <strong>in</strong>dividual soil and climate contexts. Input data<br />
must be as site-specific and accurate as possible, but if measured data are miss<strong>in</strong>g, the m<strong>et</strong>hod has a standardised<br />
framework of rules and recommendations for estimat<strong>in</strong>g or f<strong>in</strong>d<strong>in</strong>g them.<br />
Soil-quality impact assessment with<strong>in</strong> <strong>LCA</strong> is quantified with midpo<strong>in</strong>t <strong>in</strong>dicators describ<strong>in</strong>g processes<br />
that can degrade or improve the soil. Soil physical, chemical and biological properties and function are excluded<br />
as <strong>in</strong>dicators because of the difficulty <strong>in</strong> d<strong>et</strong>erm<strong>in</strong><strong>in</strong>g how they <strong>in</strong>fluence the system functions reflected<br />
<strong>in</strong> the functional units. Pathways were selected to l<strong>in</strong>k elementary flows of the <strong>in</strong>ventory (LCI) to the<br />
midpo<strong>in</strong>t impact <strong>in</strong>dicators, which result from the comb<strong>in</strong>ation of soil, climate, and management characteristics<br />
(Fig. 1).<br />
347
PLENARY SESSION 3: METHODS FOR BIODIVERSITY AND SOIL QUALITY 8 th Int. Conference on <strong>LCA</strong> <strong>in</strong> the<br />
Agri-<strong>Food</strong> Sector, 1-4 Oct <strong>2012</strong><br />
Figure 1. Steps for assess<strong>in</strong>g impacts on soil quality (outl<strong>in</strong>ed) (adapted from Garrigues <strong>et</strong> al., <strong>2012</strong>).<br />
The LCI and impact assessment (LCIA) are based on simulation modell<strong>in</strong>g, us<strong>in</strong>g models simple enough<br />
for use by non-experts, general enough to param<strong>et</strong>erise with available data at a global scale, and already<br />
validated: RUSLE2 for erosion (Renard and Ferreira, 1993); RothC for SOM (Coleman <strong>et</strong> al., 1997; Coleman<br />
and Jenk<strong>in</strong>son, 2008), and COMPSOIL for compaction (O'Sullivan <strong>et</strong> al., 1999). Most of the <strong>in</strong>put data<br />
necessary for establish<strong>in</strong>g the LCI are common to the three midpo<strong>in</strong>t <strong>in</strong>dicators. For each <strong>in</strong>dicator, total<br />
impact is estimated by summ<strong>in</strong>g the impacts from <strong>in</strong>dividual upstream agricultural sites tog<strong>et</strong>her. Thus, the<br />
m<strong>et</strong>hod currently has no regionalised characterisation factors for LCIA, assum<strong>in</strong>g that a given erosion, SOM,<br />
or compaction impact has equal impact regardless of location.<br />
2.2. Inventory – <strong>in</strong>put data requirements<br />
2.2.1 Soil data<br />
Soil characteristics such as texture, C content, bulk density, and slope are required. If necessary, national<br />
or <strong>in</strong>ternational databases, such as the Harmonized World Soil Database (FAO <strong>et</strong> al., 2009), can provide the<br />
required data. In the future, the Global Soil Map project (http://www.globalsoilmap.n<strong>et</strong>) will provide data at<br />
a f<strong>in</strong>er resolution. Users can assume that agricultural processes <strong>in</strong> a region occur on its dom<strong>in</strong>ant soil type, a<br />
compromise b<strong>et</strong>ween data precision and availability.<br />
2.2.2 Agricultural-practice data<br />
Crop data (e.g., yield, residues), management data, and vehicle characteristics (e.g., type and weight of<br />
vehicle, tyre size) are necessary.<br />
2.2.3 Climate data<br />
Monthly (erosion and SOM) and daily (compaction) temperature, precipitation, and potential evapotranspiration<br />
(PET) data are necessary. For SOM predictions, a time series up to 20 years is preferable. We used<br />
the TURC m<strong>et</strong>hod (Federer, 1996) to estimate PET:<br />
PET=0.313 Tm (Rs + 2.1)/(Tm + 15) with PET=0 when Tm
PLENARY SESSION 3: METHODS FOR BIODIVERSITY AND SOIL QUALITY 8 th Int. Conference on <strong>LCA</strong> <strong>in</strong> the<br />
Agri-<strong>Food</strong> Sector, 1-4 Oct <strong>2012</strong><br />
2.3. Simulation models used<br />
2.3.1 Erosion: RUSLE2<br />
The RUSLE2 (Revised Universal Soil Loss Equation) model (Renard and Ferreira, 1993) improves upon<br />
the orig<strong>in</strong>al USLE model. The fundamental equation is:<br />
A = R × K × LS × C × P (2)<br />
where A is the computed annual soil loss, R is the ra<strong>in</strong>fall-runoff erosivity factor, K is the soil erodibility<br />
factor, LS is a topographic factor comb<strong>in</strong><strong>in</strong>g slope length (L) and steepness (S), C is a cover-management<br />
factor, and P is a support<strong>in</strong>g-practice factor. Three <strong>in</strong>put databases are required that describe climate, crops<br />
and field operations.<br />
2.3.2 Soil organic matter change: RothC<br />
RothC (version 26.3) simulates the dynamics of organic carbon (C) <strong>in</strong> soil (Coleman and Jenk<strong>in</strong>son,<br />
2008). The effects of soil type, temperature, moisture content and plant cover are considered <strong>in</strong> the turnover<br />
process. It uses a monthly time-step to calculate total organic carbon (TOC, t/ha) and microbial biomass carbon<br />
(t/ha) over one to hundreds of years. The m<strong>et</strong>hod simulates 20 years of the same management practice<br />
and divides the total change <strong>in</strong> SOM by 20 to provide the rate over one year.<br />
2.3.3 Compaction: COMPSOIL<br />
COMPSOIL (O'Sullivan <strong>et</strong> al., 1999) predicts the effect of an agricultural mach<strong>in</strong>e on soil bulk density<br />
us<strong>in</strong>g readily available mach<strong>in</strong>e and tyre data. Topsoil and subsoil compaction are reported both separately<br />
(0-30 and 30-50 cm, respectively) and tog<strong>et</strong>her. Initial dry bulk density comes from the SOTWIS database<br />
(ISRIC, <strong>2012</strong>) from which soil texture is divided <strong>in</strong>to five classes (coarse to very f<strong>in</strong>e, accord<strong>in</strong>g to the FAO<br />
texture triangle), each associated with an <strong>in</strong>itial bulk density. Soil water content, a required <strong>in</strong>put, is predicted<br />
from soil and precipitation data with the two-reservoir BILHY model (Jacquart and Choisnel, 1995).<br />
The m<strong>et</strong>hod assumes uniform <strong>in</strong>itial bulk density and water content profiles.<br />
2.3. Indicators of impact on soil quality<br />
The erosion <strong>in</strong>dicator represents a loss of soil (t), while the SOM <strong>in</strong>dicator represents an <strong>in</strong>crease or decrease<br />
<strong>in</strong> the stock of soil C (t C). The compaction <strong>in</strong>dicator represents a loss of soil porosity (m 3 /ha) and<br />
dist<strong>in</strong>guishes topsoil from subsoil compaction because the former is more easily reversible. Estimates of<br />
these soil processes <strong>in</strong> an <strong>in</strong>ventory level are already <strong>in</strong>formative enough to serve as <strong>in</strong>dicators impact without<br />
requir<strong>in</strong>g characterisation factors. A s<strong>in</strong>gle <strong>in</strong>dicator of impact on soil quality has not y<strong>et</strong> been developed<br />
because of the difficulty <strong>in</strong> aggregat<strong>in</strong>g diverse impacts <strong>in</strong>to a s<strong>in</strong>gle measure.<br />
2.4. Case study<br />
The case study was selected to illustrate impacts of a composite product formed from crop-based <strong>in</strong>gredients<br />
produced with widely differ<strong>in</strong>g soils, climates, and crop-management practices. It focused on the global<br />
soil-quality impacts of produc<strong>in</strong>g pig feed <strong>in</strong> Brittany, <strong>France</strong>, with <strong>in</strong>gredients com<strong>in</strong>g from Brittany, Brazil,<br />
and Pakistan (Table 1).<br />
Table 1. Ingredient composition (by mass) and sources of representative pig feed produced <strong>in</strong> Brittany.<br />
Ingredient Maize Wheat Triticale Barley Pea<br />
Rapeseed<br />
cake<br />
Soya<br />
cake<br />
Soya<br />
oil<br />
Molasses<br />
Soil type Loam Loam Loam Loam Loam Loam Clay Loam<br />
Country<br />
<strong>France</strong> <strong>France</strong> <strong>France</strong> <strong>France</strong> <strong>France</strong> <strong>France</strong><br />
(Brittany) (Brittany) (Brittany) (Brittany) (Brittany) (Brittany)<br />
Brazil<br />
(Santa Catar<strong>in</strong>a)<br />
Pakistan<br />
Source crop Maize W<strong>in</strong>ter<br />
wheat<br />
Triticale Barley Pea Rapeseed Soya<br />
Sugarcane<br />
Yield (t<br />
DM/ha)<br />
9.0 7.0 7.0 6.5 4.2 3.3 2.8 35.0<br />
Pig feed <strong>in</strong>gredient<br />
(%)<br />
3.1 34.5 14.6 4.3 16.3 8.8 1.1 7.8 3.6<br />
Economic<br />
allocation (%)<br />
100 100 100 100 100 23.8 65.4 34.6 18.1<br />
The system boundary for crop products used as feed <strong>in</strong>gredients was s<strong>et</strong> at the farm gate, while that for<br />
feed <strong>in</strong>gredients was s<strong>et</strong> at the factory gate. For each crop, the temporal boundary <strong>in</strong>cluded the <strong>in</strong>ter-crop<br />
349
PLENARY SESSION 3: METHODS FOR BIODIVERSITY AND SOIL QUALITY 8 th Int. Conference on <strong>LCA</strong> <strong>in</strong> the<br />
Agri-<strong>Food</strong> Sector, 1-4 Oct <strong>2012</strong><br />
period (if any) that occurs just before the crop. Impacts were predicted per ha of each crop and then converted<br />
to impact per tonne of feed <strong>in</strong>gredient based on crop yields and economic allocation for rapeseed<br />
cake, cane molasses and soya oil and cake. Impacts per tonne of <strong>in</strong>gredient <strong>in</strong> pig feed were added tog<strong>et</strong>her<br />
to calculate total impact per tonne of pig feed produced <strong>in</strong> Brittany.<br />
3. Results and discussion<br />
Table 2 shows predicted erosion, SOM change, and compaction impacts per t of feed; note that SOM<br />
change is the only <strong>in</strong>dicator that can have a negative value.<br />
Table 2. Erosion, change <strong>in</strong> soil organic matter (SOM), and compaction impacts per tonne of pig feed <strong>in</strong><br />
Brittany.<br />
350<br />
EROSION SOM CHANGE COMPACTION<br />
0.177 t soil/t feed -0.026 t C/t feed<br />
Topsoil: 17.6 m 3 /t feed<br />
Subsoil: 5.9 m 3 /t feed<br />
Total: 23.5 m 3 /t feed<br />
For erosion, despite constitut<strong>in</strong>g only 9% (by mass) of pig feed (Fig. 2 left), soya-based <strong>in</strong>gredients (cake<br />
+ oil) contributed 69% of the impact (Fig. 2 right). Agriculture-related erosion <strong>in</strong> Brazil tends to be higher<br />
than <strong>in</strong> Europe, especially <strong>in</strong> the location where we assumed soya to orig<strong>in</strong>ate: Santa Catar<strong>in</strong>a state, where<br />
precipitation and mean slopes are high. The erosion model used, RUSLE2, represents well the high sensitivity<br />
of erosion to precipitation and mean slope.<br />
Soya cake<br />
1%<br />
Rapeseed<br />
cake<br />
9%<br />
Molasses Others<br />
4% 6%<br />
Soya oil<br />
8%<br />
Pea<br />
16%<br />
Barley<br />
4%<br />
Triticale<br />
15%<br />
Maize<br />
3%<br />
Wheat<br />
34%<br />
Molasses<br />
0.2%<br />
Soya cake<br />
54.1%<br />
Figure 2. Left: Ingredient composition by mass of representative pig feed produced <strong>in</strong> Brittany. Right: Contribution<br />
of crop-based <strong>in</strong>gredients to erosion impact per tonne of pig feed <strong>in</strong> Brittany (total soil loss: 0.177 t<br />
soil/t feed).<br />
For SOM change, rapeseed cake and pea contributed most to the n<strong>et</strong> negative impact (Fig. 3). In Brittany<br />
pea is mostly cultivated with only m<strong>in</strong>eral fertilisation and has few residues left on field. The C dynamics<br />
simulate by Roth C is sensitive to manure and plant-residues supplies. Furthermore, the soil of Brittany has a<br />
high C content (2.5% TOC), which requires high C <strong>in</strong>put over the 20 years of simulation of pea cultivation to<br />
be able to ma<strong>in</strong>ta<strong>in</strong> it.<br />
For compaction, as crops grown <strong>in</strong> Brittany require similar agricultural practices, the relative impact of<br />
each <strong>in</strong>gredient is similar to its relative mass <strong>in</strong> the feed (Fig. 4). The impact of wheat is relatively higher<br />
because of the highest number of passes <strong>in</strong> field than the others crops. In Brazil, mach<strong>in</strong>es are heavy, but<br />
reduced-tillage practices result <strong>in</strong> fewer passes than <strong>in</strong> Brittany. Furthermore, Brazilian soils have high clay<br />
contents, which decrease their sensitivity to compaction (unlike the loamy soils of Brittany).<br />
Maize<br />
0.8%<br />
Wheat<br />
5.6%<br />
Soya oil<br />
14.6%<br />
Pea<br />
21.1%<br />
Triticale<br />
2.4%<br />
Barley<br />
0.8%<br />
Rapeseed<br />
cake<br />
0.5%
PLENARY SESSION 3: METHODS FOR BIODIVERSITY AND SOIL QUALITY 8 th Int. Conference on <strong>LCA</strong> <strong>in</strong> the<br />
Agri-<strong>Food</strong> Sector, 1-4 Oct <strong>2012</strong><br />
Δ t C/t pigf feed<br />
0,010<br />
0,005<br />
0,000<br />
-0,005<br />
-0,010<br />
-0,015<br />
-0,020<br />
-0,025<br />
-0,030<br />
-0,035<br />
Maize, 0,001<br />
Wheat, 0,005<br />
Triticale, 0,002<br />
Barley, 0,001<br />
Soya cake, -0,003<br />
Soya oil, -0,001<br />
Rapeseed cake,<br />
-0,003<br />
Pea, -0,027<br />
Maize<br />
Wheat<br />
Triticale<br />
Barley<br />
Pea<br />
Rapeseed cake<br />
Soya oil<br />
Soya cake<br />
Molasses<br />
Figure 3. Contribution of crop-based <strong>in</strong>gredients to impact of change <strong>in</strong> soil organic matter (SOM) per tonne<br />
of pig feed <strong>in</strong> Brittany (n<strong>et</strong> SOM change: -0.026 t C/t feed).<br />
Soya cake<br />
1%<br />
Rapeseed<br />
cake<br />
9%<br />
Molasses Others<br />
4% 6%<br />
Soya oil<br />
8%<br />
Pea<br />
16%<br />
Barley<br />
4%<br />
Triticale<br />
15%<br />
Maize<br />
3%<br />
Wheat<br />
34%<br />
Rapeseed<br />
cake<br />
4.8%<br />
Soya cake<br />
1.5%<br />
Pea<br />
29.4%<br />
Triticale<br />
15.2%<br />
Figure 4. Left: Ingredient composition by mass of representative pig feed produced <strong>in</strong> Brittany. Right: Contribution<br />
of crop-based <strong>in</strong>gredients to compaction impact <strong>in</strong> the upper 50 cm of soil (topsoil + subsoil) per<br />
tonne of pig feed <strong>in</strong> Brittany (loss of porosity: 23.5 m 3 /t feed). The subsoil compaction is irreversible.<br />
These soil-quality impact <strong>in</strong>dicators can be used <strong>in</strong> <strong>LCA</strong>s of bio-based materials (e.g., plants, wood, food,<br />
<strong>in</strong>dustrial bio-based materials) for cultivation processes or for waste-management processes if consider<strong>in</strong>g<br />
compost<strong>in</strong>g. Although, the impact of non-cultivation processes on soil quality could be <strong>in</strong>cluded, many of<br />
them, such as soil seal<strong>in</strong>g with concr<strong>et</strong>e, transform soil <strong>in</strong>to nonsoil, which has zero soil quality. Thus, we<br />
believe that non-cultivation processes are b<strong>et</strong>ter <strong>in</strong>cluded with impacts of land use and land-use change.<br />
In a life cycle perspective, soil-quality impact <strong>in</strong>dicators can <strong>in</strong>teract with other impact categories, such as<br />
climate change, <strong>in</strong> which SOM changes <strong>in</strong>fluence n<strong>et</strong> C emissions <strong>in</strong>to the atmosphere. Also, soil-quality<br />
impact <strong>in</strong>dicators complement other impact categories, provid<strong>in</strong>g <strong>in</strong>creased ability to identify “impact swapp<strong>in</strong>g”<br />
or trade-offs b<strong>et</strong>ween transport distance and agricultural soil quality.<br />
All the <strong>in</strong>put data necessary for establish<strong>in</strong>g the LCI (approximately 30 param<strong>et</strong>ers) will be presented <strong>in</strong><br />
the project report <strong>in</strong> late <strong>2012</strong> and can be found <strong>in</strong> the <strong>in</strong>ternational databases cited. Most <strong>in</strong>put data are<br />
common to the three <strong>in</strong>dicators. As the framework allows for <strong>in</strong>cremental improvement, the <strong>in</strong>clusion of new<br />
soil-quality impact <strong>in</strong>dicators (such as sal<strong>in</strong>isation) will <strong>in</strong>crease <strong>in</strong>put-data requirements little. A forthcom<strong>in</strong>g<br />
users’ guide will describe each step of the m<strong>et</strong>hod.<br />
Barley<br />
4.8%<br />
Soya oil<br />
5.6%<br />
Molasses<br />
0.1%<br />
Maize<br />
2.7%<br />
Wheat<br />
35.9%<br />
351
PLENARY SESSION 3: METHODS FOR BIODIVERSITY AND SOIL QUALITY 8 th Int. Conference on <strong>LCA</strong> <strong>in</strong> the<br />
Agri-<strong>Food</strong> Sector, 1-4 Oct <strong>2012</strong><br />
5. Conclusion<br />
Impacts on soil quality should be taken <strong>in</strong>to account <strong>in</strong>to a life cycle perspective because of the essential<br />
role of soils <strong>in</strong> ecosystem function<strong>in</strong>g. We have developed a framework for quantify<strong>in</strong>g <strong>in</strong>dicators of impact<br />
on soil quality, valid for all soil and climate conditions, and consider<strong>in</strong>g both on-site and off-site agricultural<br />
soils. These <strong>in</strong>dicators can be used <strong>in</strong> <strong>LCA</strong>s of bio-based materials or the waste-management stage when<br />
consider<strong>in</strong>g compost<strong>in</strong>g.<br />
The first <strong>in</strong>dicators developed represent the most prevalent threats on soil: erosion, SOM change and<br />
compaction. Overall impact estimates result from the comb<strong>in</strong>ation of soil, climate, and management characteristics.<br />
Results to date can beg<strong>in</strong> to fill a database of soil-quality impact <strong>in</strong>dicators for crops and crop-based<br />
products from a several regions. Most of the <strong>in</strong>put data necessary for establish<strong>in</strong>g the LCI are common to the<br />
three midpo<strong>in</strong>t <strong>in</strong>dicators and can be found <strong>in</strong> exist<strong>in</strong>g databases.<br />
The framework allows for <strong>in</strong>cremental improvement of the m<strong>et</strong>hod through the <strong>in</strong>clusion of new soilquality<br />
impacts. Improvement efforts will focus first on develop<strong>in</strong>g robust impact <strong>in</strong>dicators for <strong>in</strong>dividual<br />
soil processes before consider<strong>in</strong>g wh<strong>et</strong>her to aggregate them <strong>in</strong>to a s<strong>in</strong>gle <strong>in</strong>dicator. Non<strong>et</strong>heless, a vari<strong>et</strong>y of<br />
aggregation approaches can be explored (Garrigues <strong>et</strong> al., <strong>2012</strong>).<br />
6. References<br />
Coleman, K., Jenk<strong>in</strong>son, D.S., 2008. ROTHC-26.3 A model for the turnover of carbon <strong>in</strong> soil. Model description and w<strong>in</strong>dows users<br />
guide. Harpenden, Herts, UK, p. 47.<br />
Coleman, K., Jenk<strong>in</strong>son, D.S., Crocker, G.J., Grace, P.R., Klír, J., Körschens, M., Poulton, P.R., Richter, D.D., 1997. Simulat<strong>in</strong>g<br />
trends <strong>in</strong> soil organic carbon <strong>in</strong> long-term experiments us<strong>in</strong>g RothC-26.3. Geoderma 81, 29-44.<br />
Cowell, S.J., Clift, R., 2000. A m<strong>et</strong>hodology for assess<strong>in</strong>g soil quantity and quality <strong>in</strong> life cycle assessment. Journal of Cleaner Production<br />
8, 321-331.<br />
FAO, IIASA, ISRIC, ISSCAS, JRC, 2009. Harmonized World Soil Database (version 1.1). FAO, Rome, Italy and IIASA, Laxenburg,<br />
Austria.<br />
Federer, C., 1996. Intercomparison of m<strong>et</strong>hods calculat<strong>in</strong>g potential evaporation <strong>in</strong> regional and global water balance models. Water<br />
Resources Research 32, 2315-2321.<br />
Garrigues, E., Corson, M.S., Angers, D.A., van der Werf, H.M.G., Walter, C., <strong>2012</strong>. Soil quality <strong>in</strong> Life Cycle Assessment: Towards<br />
development of an <strong>in</strong>dicator. Ecol. Indic. 18, 434-442.<br />
ISRIC, <strong>2012</strong>. Harmonized cont<strong>in</strong>ental SOTER-derived database (SOTWIS) (http://www.isric.org/projects/harmonized-cont<strong>in</strong>entalsoter-derived-database-sotwis<br />
).<br />
Jacquart, C., Choisnel, E., 1995. Un modèle de bilan hydrique simplifié à deux réservoirs utilisable en agrométéorologie. La<br />
Météorologie 8ième série - n°9 - mars, 29-44.<br />
Karlen, D.L., Mausbach, M.J., Doran, J.W., Cl<strong>in</strong>e, R.G., Harris, R.F., Schuman, G.E., 1997. Soil quality: a concept, def<strong>in</strong>ition, and<br />
framework for evaluation. Soil Science Soci<strong>et</strong>y of America Journal 61, 4-10.<br />
Larson, W.E., Pierce, F.J., 1994. The dynamics of soil quality as a measure of susta<strong>in</strong>able management. Def<strong>in</strong><strong>in</strong>g soil quality for a<br />
susta<strong>in</strong>able environment. Soil Science Soci<strong>et</strong>y of America, pp. 37-51.<br />
L<strong>et</strong>ey, J., Sojka, R.E., Upchurch, D.R., Cassel, D.K., Olson, K.R., Payne, W.A., P<strong>et</strong>rie, S.E., Price, G.H., Reg<strong>in</strong>ato, R.J., Scott, H.D.,<br />
Sm<strong>et</strong>hurst, P.J., Tripl<strong>et</strong>t, G.B., 2003. Deficiencies <strong>in</strong> the soil quality concept and its application. Journal of Soil and Water Conservation<br />
58, 180-187.<br />
Milà i Canals, L., Romanya, J., Cowell, S.J., 2007. M<strong>et</strong>hod for assess<strong>in</strong>g impacts on life support functions (LSF) related to the use of<br />
'fertile land' <strong>in</strong> Life Cycle Assessment (<strong>LCA</strong>). Journal of Cleaner Production 15, 1426-1440.<br />
NASA, <strong>2012</strong>. Climatology Resources for Agroclimatology Daily Average Data (http://power.larc.nasa.gov/cgib<strong>in</strong>/cgiwrap/solar/agro.cgi?email=agroclim@larc.nasa.gov).<br />
Nuñez, M., Civit, B., Muñoz, P., Arena, A.P., Rieradevall, J., Anton, A., 2010. Assess<strong>in</strong>g potential desertification environmental<br />
impact <strong>in</strong> life cycle assessment. The International Journal of Life Cycle Assessment 15, 67-78.<br />
O'Sullivan, M.F., Henshall, J.K., Dickson, J.W., 1999. A simplified m<strong>et</strong>hod for estimat<strong>in</strong>g soil compaction. Soil & Tillage Research<br />
49, 325-335.<br />
Renard, K.G., Ferreira, V.A., 1993. RUSLE model description and database sensitivity. Journal of Environmental Quality 22, 458-<br />
466.<br />
352
PARALLEL SESSION 4A: CARBON FOOTPRINT 8 th Int. Conference on <strong>LCA</strong> <strong>in</strong> the<br />
Parallel session 4a: Carbon Footpr<strong>in</strong>t<br />
Agri-<strong>Food</strong> Sector, 1-4 Oct <strong>2012</strong><br />
F<strong>in</strong>nish consumer understand<strong>in</strong>g of carbon footpr<strong>in</strong>t<strong>in</strong>g and food<br />
product labell<strong>in</strong>g<br />
Hanna Hartika<strong>in</strong>en * , Juha-Matti Katajajuuri, Hannele Pulkk<strong>in</strong>en, Taneli Ro<strong>in</strong><strong>in</strong>en<br />
1 MTT Agrifood Research F<strong>in</strong>land, 00790 Hels<strong>in</strong>ki<br />
Correspond<strong>in</strong>g author. E-mail: hanna.hartika<strong>in</strong>en@mtt.fi<br />
ABSTRACT<br />
Production and consumption of food products have significant impacts on climate change. Carbon labell<strong>in</strong>g of food products represents<br />
a major means of communicat<strong>in</strong>g the impacts of food products on climate. However, there is little knowledge on how consumers<br />
perceive carbon labell<strong>in</strong>g. The aim of the Climate Communication 2 (2011-2013) project was to study how F<strong>in</strong>nish consumers<br />
perceive the communication of carbon footpr<strong>in</strong>ts for food products. The study comprised 5 semi-structured focus groups and an<br />
onl<strong>in</strong>e-survey. The focus groups showed that the term ‘carbon footpr<strong>in</strong>t’ was familiar to many, but there was substantial misunderstand<strong>in</strong>g<br />
of its mean<strong>in</strong>g. There were positive attitudes towards carbon labels, but the participants <strong>in</strong>dicated that the <strong>in</strong>formation became<br />
mean<strong>in</strong>gful only when other key purchas<strong>in</strong>g criteria (such as price and taste) were satisfied. Furthermore, there was divergence<br />
on perceived needs for carbon label content.<br />
Keywords: carbon footpr<strong>in</strong>t, carbon labell<strong>in</strong>g, food, consumer behaviour, survey<br />
1. Introduction<br />
In F<strong>in</strong>land around 25% of greenhouse gas emissions (GHG-emissions) from private consumption orig<strong>in</strong>ate<br />
from the production and consumption of food, <strong>in</strong>clud<strong>in</strong>g household food preparation, food preservation,<br />
journeys to shops and meal services (Reg<strong>in</strong>a <strong>et</strong> al., 2011; Seppälä <strong>et</strong> al., 2009). Communication of climate<br />
impacts for food products is highlighted by there be<strong>in</strong>g no great reductions made solely by adapt<strong>in</strong>g low<br />
carbon technology (Weidema <strong>et</strong> al., 2008). Therefore, the greatest potential for reduc<strong>in</strong>g GHG-emissions<br />
from food products lies <strong>in</strong> consumer behaviour.<br />
One way to <strong>in</strong>form consumers about food product GHG-emissions is carbon labell<strong>in</strong>g of food products,<br />
which has expanded steadily <strong>in</strong> F<strong>in</strong>land dur<strong>in</strong>g recent years. The first carbon label appeared <strong>in</strong> 2008, and to<br />
date six F<strong>in</strong>nish food companies <strong>in</strong>clude carbon labels on their product packages. Overall more than 40 F<strong>in</strong>nish<br />
food products are carbon labelled and more will be labelled <strong>in</strong> the future. Some F<strong>in</strong>nish food companies<br />
are also communicat<strong>in</strong>g product carbon footpr<strong>in</strong>ts only on their websites. Additionally, some state that they<br />
compensate for their product carbon footpr<strong>in</strong>ts. Consumer perceptions of product carbon footpr<strong>in</strong>t and attitudes<br />
toward climate-friendly products rema<strong>in</strong> challeng<strong>in</strong>g non<strong>et</strong>heless. It is unclear wh<strong>et</strong>her F<strong>in</strong>nish consumers<br />
seek <strong>in</strong>formation on climate-friendly food products or not. From recent <strong>in</strong>ternational studies it is <strong>in</strong>dicated<br />
that there is a grow<strong>in</strong>g need among consumers for accurate <strong>in</strong>formation about the impacts of food<br />
and its production on climate (i.e. European commission 2009, The Climate Group 2006). However, there is<br />
also a need for a deeper and more up-to-date study.<br />
In the F<strong>in</strong>nish Climate Communication 2 project (2011-2013) F<strong>in</strong>nish consumer understand<strong>in</strong>g about carbon<br />
footpr<strong>in</strong>t<strong>in</strong>g and <strong>in</strong>formation needs are studied. Appreciat<strong>in</strong>g the complexity and broad scope of the<br />
topic, the aim of the study is to establish the nature of:<br />
Consumer perception of product carbon footpr<strong>in</strong>ts and labels<br />
Consumer understand<strong>in</strong>g of the message transmitted by carbon labels<br />
Consumer perception of the <strong>in</strong>formation content <strong>in</strong> the carbon label<br />
2. M<strong>et</strong>hods<br />
There were five focus groups <strong>in</strong> the group discussions and 33 participants <strong>in</strong> total. The key criterion for<br />
consumer recruitment was that the consumer stated that environmental friendl<strong>in</strong>ess was at least quite important<br />
when grocery shopp<strong>in</strong>g (by giv<strong>in</strong>g a score of at least 3 on a scale of 1 to 5, 5 be<strong>in</strong>g very important), and<br />
thus be<strong>in</strong>g more concerned than the average consumer <strong>in</strong> that respect. The participants were grouped accord<strong>in</strong>g<br />
to their ages. There was a group of young adults (ages 24-28), two middle-aged groups (ages 31-44) and<br />
an elderly group (ages 53-65). Additionally, the members of the fifth group (ages 28-47) considered themselves<br />
even more environmentally conscious <strong>in</strong> comparison with other focus groups when grocery shopp<strong>in</strong>g.<br />
Each group discussion lasted around two hours: first the participants discussed their own criteria for grocery<br />
shopp<strong>in</strong>g, then they discussed how environmentally conscious they were <strong>in</strong> general and how their consciousness<br />
related to food consumption. Lastly the groups discussed carbon footpr<strong>in</strong>t<strong>in</strong>g and carbon labell<strong>in</strong>g<br />
of food products. The participants were also shown various carbon labels from which they chose their favourites<br />
(Figures 1a-f). Each of the labels emphasised one of the follow<strong>in</strong>g <strong>in</strong>formation po<strong>in</strong>ts:<br />
353
PARALLEL SESSION 4A: CARBON FOOTPRINT 8 th Int. Conference on <strong>LCA</strong> <strong>in</strong> the<br />
Agri-<strong>Food</strong> Sector, 1-4 Oct <strong>2012</strong><br />
354<br />
The product carbon footpr<strong>in</strong>t is calculated (Figure 1a).<br />
The product GHG-emissions are compensated for by emission reductions elsewhere (Figure 1b).<br />
The company is committed to reduc<strong>in</strong>g its product carbon footpr<strong>in</strong>t by xx% per year (Figure 1c).<br />
The product has a low carbon footpr<strong>in</strong>t compared with other food products <strong>in</strong> its category (e.g. cereal<br />
products) (Figure 1d).<br />
The product carbon footpr<strong>in</strong>t is <strong>in</strong>dicated on a scale (on a scale with five ranges: 200 or less, 200-<br />
400, 400-800, 800-1200, 1200 or more grams CO2-equivalents per 100 gram of product). The scale<br />
is broad enough for all food products, and thus it enables rough comparisons b<strong>et</strong>ween different food<br />
product categories to be made (Figure 1e).<br />
The product carbon footpr<strong>in</strong>t is <strong>in</strong>dicated numerically: xx CO2-equivalents per 100 gram of product<br />
(Figure 1f).<br />
Figures 1a-f. Carbon labels.<br />
1a. 1b.<br />
1c. 1d.<br />
1e. (edit. Raisio 2011) 1f.<br />
3. Results<br />
In the discussions all the participants (when grocery shopp<strong>in</strong>g) regarded many other buy<strong>in</strong>g criteria, such<br />
as taste, price, and health<strong>in</strong>ess, as more important factors than environmental friendl<strong>in</strong>ess. Only a couple<br />
participants regarded food as one of the ma<strong>in</strong> environmental stress factors, whereas hous<strong>in</strong>g and transportation<br />
were mentioned often. However, when asked directly: Does food impact the environment?, the participants<br />
replied that food had an at least some impact on the environment. All groups mentioned food packag<strong>in</strong>g<br />
waste, food waste, food transport, and meat production as hav<strong>in</strong>g an impact on the environment. Also, <strong>in</strong><br />
the elderly group (ages 53-65) there was more talk about food scarcity.<br />
A surpris<strong>in</strong>g f<strong>in</strong>d<strong>in</strong>g was that while the participants had heard of the term ‘product carbon footpr<strong>in</strong>t’, only<br />
two respondents were able to describe the term at least somewhat accurately. About 50 per cent of respondents<br />
thought that the term referred to environmental impacts <strong>in</strong> general, and 6 respondents thought that the<br />
carbon footpr<strong>in</strong>t would be calculated by tak<strong>in</strong>g <strong>in</strong>to account only the energy needed to produce the product.
PARALLEL SESSION 4A: CARBON FOOTPRINT 8 th Int. Conference on <strong>LCA</strong> <strong>in</strong> the<br />
Agri-<strong>Food</strong> Sector, 1-4 Oct <strong>2012</strong><br />
Furthermore, <strong>in</strong>terest<strong>in</strong>gly, terms like ‘climate impact’ and ‘global warm<strong>in</strong>g’ were not mentioned <strong>in</strong> the context<br />
of environmental impacts of food. Similar f<strong>in</strong>d<strong>in</strong>gs were also made <strong>in</strong> a UK study where 89 per cent of<br />
respondents had confusion <strong>in</strong> <strong>in</strong>terpr<strong>et</strong><strong>in</strong>g and understand<strong>in</strong>g carbon labels (Gadelma and Ogl<strong>et</strong>horpe, 2011).<br />
After be<strong>in</strong>g provided with the correct def<strong>in</strong>ition of ‘product carbon footpr<strong>in</strong>t’ the participants were s<strong>in</strong>glem<strong>in</strong>ded<br />
that communicat<strong>in</strong>g product carbon footpr<strong>in</strong>ts was positive. However, the majority agreed on the<br />
focus be<strong>in</strong>g quite narrow. Many claimed that other environmental impacts should also be taken <strong>in</strong>to account.<br />
Participants also questioned wh<strong>et</strong>her communicat<strong>in</strong>g product carbon footpr<strong>in</strong>ts would really have any impact<br />
on their buy<strong>in</strong>g behaviour. For <strong>in</strong>stance, they stated that at their current level of understand<strong>in</strong>g of carbon<br />
footpr<strong>in</strong>t it would be hard to put the <strong>in</strong>formation <strong>in</strong>to perspective and say wh<strong>et</strong>her a carbon footpr<strong>in</strong>t was low<br />
or high. However, several participants stated that a carbon label could have a positive impact on their purchase<br />
decisions, but only when the choice was to be made b<strong>et</strong>ween two otherwise comparable food products.<br />
The most preferred carbon label among the participants (12 of the 33 respondents preferred this carbon<br />
label) was that provid<strong>in</strong>g the carbon footpr<strong>in</strong>t accord<strong>in</strong>g to a scale (Figure 1e). Many considered the label to<br />
be illustrative because it <strong>in</strong>dicated an approximate product carbon footpr<strong>in</strong>t <strong>in</strong> comparison with that for other<br />
food products. Meanwhile, some found the label to be quite confus<strong>in</strong>g.<br />
Other favourites were the label show<strong>in</strong>g that the product had low GHG-emissions <strong>in</strong> comparison with<br />
other products <strong>in</strong> its product category (6/33) (Fig. 1c), and the label giv<strong>in</strong>g the carbon footpr<strong>in</strong>t as an exact<br />
number (5/33) (Fig. 1f). The former label (Fig. 1c) was considered good because its message was easy to<br />
understand, although it did not allow comparisons b<strong>et</strong>ween different product categories. The latter label (Fig.<br />
1f) was considered good because if a company were to use such a label on its product packages it would<br />
seem<strong>in</strong>gly require considerable <strong>in</strong>put from the company, and which could lead to reductions <strong>in</strong> the product<br />
carbon footpr<strong>in</strong>t. However, the <strong>in</strong>formation of such a label was seen as be<strong>in</strong>g rather abstract without adequate<br />
an understand<strong>in</strong>g of the magnitude of the figure. Additionally, some participants stated that the exact<br />
figure should be on all products <strong>in</strong> order to make valid choices based on it.<br />
The rema<strong>in</strong><strong>in</strong>g carbon labels did not g<strong>et</strong> much support. ‘The carbon label has been calculated’ label (Fig.<br />
1a) was quite poorly received because it did not <strong>in</strong>dicate magnitude, and thus the footpr<strong>in</strong>t could be relatively<br />
high. Additionally, some participants saw a potential risk of ‘green wash<strong>in</strong>g’ on a label stat<strong>in</strong>g that the company<br />
was committed to reduc<strong>in</strong>g its product carbon footpr<strong>in</strong>t on an annual basis (Fig. 1c).<br />
4. Discussion and conclusion<br />
Overall group discussions deepened understand<strong>in</strong>g of how some consumers currently perceive carbon<br />
footpr<strong>in</strong>t<strong>in</strong>g and labell<strong>in</strong>g, and how unclear, but <strong>in</strong>terest<strong>in</strong>g, the issue is and could be <strong>in</strong> the future. Firstly, the<br />
participants stated that the issue is at least somewhat <strong>in</strong>terest<strong>in</strong>g and important, but there seem to be diverse<br />
requirements for the type of <strong>in</strong>formation to be <strong>in</strong>cluded <strong>in</strong> a carbon label. The most def<strong>in</strong>ite outcome from<br />
the discussions was that there is a clear need to educate consumers to understand b<strong>et</strong>ter the concept of product<br />
carbon footpr<strong>in</strong>t. This would allow b<strong>et</strong>ter understand<strong>in</strong>g of the importance of the product carbon footpr<strong>in</strong>t<br />
<strong>in</strong>formation to consumers. Aga<strong>in</strong>, it is also quite <strong>in</strong>terest<strong>in</strong>g to see how consumers perceive carbon footpr<strong>in</strong>t<strong>in</strong>g<br />
and labell<strong>in</strong>g given their current level of understand<strong>in</strong>g. Wh<strong>et</strong>her accurate understand<strong>in</strong>g of carbon footpr<strong>in</strong>t<strong>in</strong>g<br />
would <strong>in</strong>crease demand for carbon labelled food products is still uncerta<strong>in</strong>.<br />
The focus groups gave only a narrow view on the consumer thoughts on the issue, and therefore to g<strong>et</strong> a<br />
broader view and perhaps g<strong>et</strong> answers to some unanswered questions and issues raised <strong>in</strong> the group discussions,<br />
the next step was an extensive quantitative survey (held <strong>in</strong> spr<strong>in</strong>g <strong>2012</strong>). The aim of the quantitative<br />
survey was to obta<strong>in</strong> around 1000 responses from a miscellaneous consumer group (e.g. different age groups,<br />
different levels of environmental consciousness <strong>et</strong>c.).<br />
5. References<br />
European Commission, 2009. Europeans’ attitudes towards the issue of susta<strong>in</strong>able consumption and production, Analytical report,<br />
Flash EB Series 256<br />
Gadema Z., Ogl<strong>et</strong>horpe D. 2011. The use and usefulness of carbon labell<strong>in</strong>g food: A policy perspective from a survey of UK supermark<strong>et</strong><br />
shoppers. <strong>Food</strong> Policy 36: 815–822<br />
Raisio 2011. http://www.ekologia.fi/www/page/Ekologia_CO_merkki<br />
Reg<strong>in</strong>a K., Lehtonen H., Perälä P., 2011. The role of agriculture as a greenhouse gas emissions producer and as a part of climate<br />
policy (<strong>in</strong> F<strong>in</strong>nish): Maatalouden rooli kasvihuonekaasupäästöjen tuottajana ja osana ilmastopolitiikkaa, Selvitys Maa- ja<br />
m<strong>et</strong>sätalousm<strong>in</strong>isteriölle, Maa- ja el<strong>in</strong>tarvik<strong>et</strong>alouden tutkimuskeskus (MTT)<br />
Seppälä J., Mäenpää I., Koskela S., Mattila T., Niss<strong>in</strong>en A., Katajajuuri J-M., Härmä T., Korhonen M-R., Saar<strong>in</strong>en M., Virtanen Y.,<br />
2009. The environmental impact assessment of material flows of F<strong>in</strong>land's national economy with ENVIMAT-model (<strong>in</strong> F<strong>in</strong>nish):<br />
Suomen kansantalouden materiaalivirtojen ympäristövaikutusten arvio<strong>in</strong>ti ENVIMAT-mallilla, Suomen Ympäristö<br />
20/2009, Suomen ympäristökeskus (SYKE)<br />
The Climate Group, Carbon footpr<strong>in</strong>t consumer survey (2006)<br />
355
PARALLEL SESSION 4A: CARBON FOOTPRINT 8 th Int. Conference on <strong>LCA</strong> <strong>in</strong> the<br />
Agri-<strong>Food</strong> Sector, 1-4 Oct <strong>2012</strong><br />
Weidema B. P., Wesnæs M., Hermansen J., Kristensen T., Halberg N., Eder P., Delgado L., 2008. Environmental improvement<br />
potentials of meat and dairy products. European Commission Jo<strong>in</strong>t Research Centre (JRC) – Institute for Prospective Technological<br />
Studies (IPTS) EUR 23491 EN 2008<br />
356
PARALLEL SESSION 4A: CARBON FOOTPRINT 8 th Int. Conference on <strong>LCA</strong> <strong>in</strong> the<br />
Agri-<strong>Food</strong> Sector, 1-4 Oct <strong>2012</strong><br />
Application of PAS 2050-1 supplementary requirements for<br />
horticultural products: carbon footpr<strong>in</strong>t of pumpk<strong>in</strong> and asparagus<br />
Michael Blanke * , Florian Schaefer<br />
INRES - University of Bonn, Auf dem Hügel 6, D-53121 Bonn, Germany<br />
* Correspond<strong>in</strong>g author. E-mail: mmblanke@uni-bonn.de<br />
ABSTRACT<br />
This contribution provides <strong>in</strong>formation on the new PAS 2050-1 supplementary requirements (formerly ‘Product Category Rules –<br />
PCRs) for horticultural products released <strong>in</strong> March <strong>2012</strong>. This is one of the first supplementary requirements and may be used as a<br />
guidel<strong>in</strong>e for <strong>in</strong>dustries other than horticulture such as the food <strong>in</strong>dustry. The data presented orig<strong>in</strong>ate from one of the five <strong>in</strong>ternational<br />
pilot projects. In the German application trial, asparagus, strawberry, rhubarb and pumpk<strong>in</strong> were employed. The new PAS<br />
2050-1 <strong>in</strong>cludes recommendations for a "cradle to gate" or "bus<strong>in</strong>ess to bus<strong>in</strong>ess" approach. It provides an Excel tool for both land<br />
use change (LUC) and the nitrogen balance with<strong>in</strong> a crop rotation. Examples will be given for issues to be excluded such as Capital<br />
goods or <strong>in</strong>cluded such as biogenic carbon of the horticultural product. The objective of this contribution was to d<strong>et</strong>erm<strong>in</strong>e experiences<br />
(pro and cons) of the implementation of these new supplementary requirements (‘SRs’) for horticultural products to the PAS<br />
2050: 2011 as part of this pilot study, while calculat<strong>in</strong>g the carbon footpr<strong>in</strong>t for the four crops, <strong>in</strong>clud<strong>in</strong>g autumn pumpk<strong>in</strong> and asparagus<br />
<strong>in</strong> Germany.<br />
Three pumpk<strong>in</strong> farms with different pumpk<strong>in</strong> cultivation were chosen: a) a small scale organic (50 kg N/ha), b) a small scale <strong>in</strong>tegrated<br />
production (IP) (120 kg N/ha), and c) a large scale bus<strong>in</strong>ess enterprise (70 kg N/ha). Area viz. hectare was chosen as the first<br />
and mass i.e. kg saleable product as the second functional unit. System boundaries ranged from plantl<strong>et</strong> or seed acquisition to sale.<br />
The carbon footpr<strong>in</strong>t at the cultivation level (FCF) ranged b<strong>et</strong>ween 157 kg CO2eq/ha (organic) and 251 kg CO2eq/ha (small scale<br />
(IP)). Tak<strong>in</strong>g the yield <strong>in</strong>to account the mass specific Carbon Footpr<strong>in</strong>t was from 8 g CO2eq/kg saleable pumpk<strong>in</strong> to 20 g CO2eq/kg<br />
saleable pumpk<strong>in</strong>. The nitrous oxide emissions, which orig<strong>in</strong>ated from the nitrogen fertilisation, were calculated based on 0.7% N2O<br />
per kg applied N. They were the most relevant source of GHG emissions <strong>in</strong> the cultivation phase. Neither the form (organic or <strong>in</strong>organic)<br />
nor the amount of applied nitrogen (2.5-fold difference) <strong>in</strong>fluenced the carbon footpr<strong>in</strong>t. However, carbon reduction potentials<br />
<strong>in</strong>clude use of nitrification <strong>in</strong>hibitors such as DMPP and DCD, which reduce the nitrous oxide emissions by ca. 47 or 40%, respectively,<br />
or the CULTAN fertilisation system. Plant protection (m<strong>et</strong>hiocarb <strong>in</strong> the IP) contributed less than 1% to the carbon footpr<strong>in</strong>t.<br />
The large specialised farm showed the best carbon footpr<strong>in</strong>t of 8 g CO2eq/kg pumpk<strong>in</strong> due to the use of potassium fertiliser and 3fold<br />
larger yields (18 t/ha versus 5.8 t/ha <strong>in</strong> the organic) and, to a lesser extent, its sheer scale. On the other two farms, cultivation is<br />
more extensive with the ma<strong>in</strong> <strong>in</strong>come not from pumpk<strong>in</strong>; any <strong>in</strong>crease <strong>in</strong> farm size or their pumpk<strong>in</strong> acreage would not improve their<br />
efficacy and cradle-to-gate carbon footpr<strong>in</strong>t.<br />
The farm carbon footpr<strong>in</strong>t of asparagus (FCF), also corrected for biogenic carbon (0.198 t CO2-e/ha/a), was 2.8 t CO2-e/ha. The<br />
product carbon footpr<strong>in</strong>t for asparagus (PCF – B2C), calculated over an 11-year life-span of the orchard <strong>in</strong> Germany <strong>in</strong>clud<strong>in</strong>g the<br />
first unproductive years, was 801 g CO2eq/kg saleable asparagus.<br />
In conclusion, the present application trial led to 3-17% less product carbon footpr<strong>in</strong>ts (PCF) due to the offs<strong>et</strong> of the biogenic carbon<br />
<strong>in</strong> the harvested produce and confirmed the benefits and suitability of PAS 2050-1 for the horticultural <strong>in</strong>dustry.<br />
Keywords: carbon footpr<strong>in</strong>t, PAS 2050-1, horticultural products, application trial, land use change (LUC)<br />
1. Introduction<br />
The PAS 2050-1 ‘Assessment of life cycle greenhouse gas emissions from horticultural products‘ was<br />
developed as one of the first product category rules (PCR) and for the agri-food sector. Other sectors may<br />
develop their own PCRs and use or modify the PAS 2050-1 <strong>in</strong> full or <strong>in</strong> part. The authors were part of the<br />
steer<strong>in</strong>g group for the development of this PAS 2050-1 and hosted one out of five pilot projects for its potential<br />
implementation <strong>in</strong> horticulture (Table1). This <strong>in</strong>cluded pumpk<strong>in</strong>, asparagus, rhubarb and strawberry <strong>in</strong><br />
Germany (BSI, <strong>2012</strong>).<br />
Table 1. Pilot projects for the PAS 2050-1 (horticulture) dur<strong>in</strong>g w<strong>in</strong>ter 2011/<strong>2012</strong><br />
Pilot project <strong>in</strong>stitution Country Crop<br />
<strong>Food</strong> Research New Zealand Kiwi (open cultivation)<br />
Karen Fisher Great Brita<strong>in</strong> Orange juice (product)<br />
IRTA , Lleida Spa<strong>in</strong> Protected apple under hailn<strong>et</strong><br />
Productshap Tu<strong>in</strong>bouw, Gouda N<strong>et</strong>herlands Greenhouse veg<strong>et</strong>ables and flowers, nursery trees and conta<strong>in</strong>er plants<br />
University of Bonn, INRES –<br />
Horticultural Science<br />
Germany Pumpk<strong>in</strong>, rhubarb, asparagus, strawberry (all field production)<br />
2. Materials and M<strong>et</strong>hods<br />
2.1 Features of PAS 2050-1 (March, <strong>2012</strong>)<br />
The PAS 2050-1 is now designated as ‘Supplemental Requirements’ (SR) to PAS 2050 rather than as<br />
‘PCR- Product Category Rule(s)’. It is the first, freely and publicly available guidel<strong>in</strong>e for all horticultural<br />
357
PARALLEL SESSION 4A: CARBON FOOTPRINT 8 th Int. Conference on <strong>LCA</strong> <strong>in</strong> the<br />
Agri-<strong>Food</strong> Sector, 1-4 Oct <strong>2012</strong><br />
products, <strong>in</strong>clud<strong>in</strong>g plants, production, flowers, fruits, nuts, veg<strong>et</strong>ables, nursery trees and orchards, for assessment<br />
of their <strong>in</strong>herent/associated greenhouse gas emissions. This PAS 2050-1 is suited for ‘cradle-togate’<br />
assessment, formerly designated as “B-2-B” (“bus<strong>in</strong>ess to bus<strong>in</strong>ess”) approach. For cradle-to-grave<br />
assessments of horticultural products/production to the f<strong>in</strong>al consumer, the first part of the assessment is<br />
supported by the PAS 2050-1 (hort; March, <strong>2012</strong>) and the second latter part by the PAS 2050 (2011). Overall,<br />
the follow<strong>in</strong>g life cycle processes are <strong>in</strong>cluded (BSI, 2011).<br />
Seed or young plant production;<br />
Storage of young plantl<strong>et</strong>s before plant<strong>in</strong>g<br />
Crop cultivation (e.g. fertiliser, plant protection, cultivation, harvest)<br />
Storage of crop products<br />
Transport (from and to the field);<br />
Waste management (at farm level)<br />
Annual crops are def<strong>in</strong>ed as plants sown or planted dur<strong>in</strong>g one production season, which is the m<strong>in</strong>imum<br />
report<strong>in</strong>g period for carbon footpr<strong>in</strong>t assessment.<br />
Perennial crops with harvests over several productive seasons require a report<strong>in</strong>g time of at least 3 years<br />
(roll<strong>in</strong>g average), which <strong>in</strong>cludes all developmental stages <strong>in</strong> proportion. In fruit or nut trees (or sugar cane,<br />
bananas, asparagus), these <strong>in</strong>clude the juvenile phase without yield and age<strong>in</strong>g phase of lesser yields.<br />
Carbon sequestration, as part of a horticultural production scheme, is calculated over the last 20 years and<br />
considered under land use change (LUC). An Excel tool for LUC calculations is provided, which <strong>in</strong>cludes<br />
the relevant worldwide data, e.g. for most horticultural crops as well as deforestation. LUC results are <strong>in</strong>cluded<br />
<strong>in</strong> the overall carbon footpr<strong>in</strong>t values, but are not separated from the carbon footpr<strong>in</strong>t value as <strong>in</strong> the<br />
World Bus<strong>in</strong>ess Council for Susta<strong>in</strong>able Development/World Resource Institute (WBCSD/WRI) Standard,<br />
s<strong>in</strong>ce they may have a great contribution to the calculated values.<br />
Table 2. Features of the PAS 2050-1<br />
Feature Previous approach New approach <strong>in</strong> PAS 2050-1<br />
Word<strong>in</strong>g/ designation a Product Category Rule -PCR Supplemental Requirements (SR)<br />
Only B to B approach PAS 2050 2011 for B to C PAS 2050-1 (hort) for B to B<br />
Perennial crops n.a. m<strong>in</strong>imum 3 years (roll<strong>in</strong>g average) to proportionally<br />
<strong>in</strong>clude all developmental stages (e.g. juvenile<br />
phase without yield)<br />
Annual crops n.a. m<strong>in</strong>imum 3 years or at least 3 productive cultivation<br />
cycles<br />
Carbon sequestration Separate entity Integrated <strong>in</strong> L U C<br />
LUC values 100 years approach based on the last 20 years and <strong>in</strong>tegrated<br />
<strong>in</strong> overall CF value<br />
Biogenic carbon (if for food or feed) Not <strong>in</strong>cluded Offs<strong>et</strong> aga<strong>in</strong>st horticultural production<br />
Biogenic carbon (if not for food or feed- e.g. Included Offs<strong>et</strong> aga<strong>in</strong>st horticultural production<br />
tree trunk for timber/furniture production)<br />
Capital goods Excluded Excluded <strong>in</strong> carbon footpr<strong>in</strong>t (e.g. greenhouses<br />
and superstructures for polytunnels)<br />
Consumables Included Materials (film and foils <strong>et</strong>c.) given as examples,<br />
which are replaced regularly are <strong>in</strong>cluded<br />
Fertiliser S<strong>in</strong>gle crop assessment Crop rotation<br />
Calculation tools Not provided Calculation tools <strong>in</strong> Excel with data basis provided<br />
for both L U C and allocation of fertiliser (<strong>in</strong>cl.<br />
organic) for crop rotation systems<br />
2.2 Biogenic carbon<br />
Biogenic carbon, i.e. the carbon conta<strong>in</strong>ed <strong>in</strong> the harvested product exported outside the system boundary<br />
(out of the farm gate), is offs<strong>et</strong> <strong>in</strong> the PAS 2050-1 aga<strong>in</strong>st the carbon emissions dur<strong>in</strong>g horticultural production,<br />
if used for food or feed. Similarly, biogenic carbon not used for food or feed, e.g. tree trunks for the<br />
timber or furniture <strong>in</strong>dustry, can be offs<strong>et</strong> aga<strong>in</strong>st horticultural production (BSI, <strong>2012</strong>) (Table 2).<br />
Capital goods <strong>in</strong> horticulture such as greenhouse support structures for poly-tunnels, build<strong>in</strong>gs, grad<strong>in</strong>g<br />
facilities and cold stores are def<strong>in</strong>ed and excluded from the Carbon Footpr<strong>in</strong>t calculations <strong>in</strong> PAS 2050-1.<br />
Consumables, which are replaced on a regular basis, such as plastic foils for plant cover<strong>in</strong>g and grow<strong>in</strong>g<br />
substrates, are <strong>in</strong>cluded. Similarly, fertilisers and plant protection compounds are <strong>in</strong>cluded <strong>in</strong> the product<br />
carbon footpr<strong>in</strong>t.<br />
358
PARALLEL SESSION 4A: CARBON FOOTPRINT 8 th Int. Conference on <strong>LCA</strong> <strong>in</strong> the<br />
Agri-<strong>Food</strong> Sector, 1-4 Oct <strong>2012</strong><br />
3. Results<br />
3.1. Carbon footpr<strong>in</strong>t of pumpk<strong>in</strong><br />
The results presented here are part of one out of five pilot projects of the PAS 2050-1 (Table 1). Autumn<br />
pumpk<strong>in</strong> was chosen here as one of the crops from the pilot project. The objective of the study was to d<strong>et</strong>erm<strong>in</strong>e<br />
the carbon footpr<strong>in</strong>t for four farm<strong>in</strong>g and mark<strong>et</strong><strong>in</strong>g systems, us<strong>in</strong>g primary data obta<strong>in</strong>ed on the farms<br />
for autumn pumpk<strong>in</strong> as an example and model crop for the pilot project to test the application of the PAS<br />
2050-1 dur<strong>in</strong>g its draft version. Acreage, viz. hectare for the crop cultivation and weight, i.e., kg saleable<br />
product for the mark<strong>et</strong><strong>in</strong>g phase were employed as the two functional units with system boundaries from<br />
seed acquisition to disposal; offs<strong>et</strong> was not used.<br />
In the farm carbon footpr<strong>in</strong>t (FCF), pumpk<strong>in</strong>s from the organic farm with 240 kg CO2eq/ha scored best<br />
due to the least (50 kg N/ha) (organic) nitrogen application, compared with twice that value (448 kg CO2<br />
eq/ha) for those from the IP farm and large specialised farm. This was due to nitrous oxide emissions, as a<br />
consequence of N fertilisation, with 99% of FCF <strong>in</strong> the cultivation phase; it contributed ca. 10% and plant<br />
protection (m<strong>et</strong>hiocarb <strong>in</strong> the IP) and
PARALLEL SESSION 4A: CARBON FOOTPRINT 8 th Int. Conference on <strong>LCA</strong> <strong>in</strong> the<br />
Agri-<strong>Food</strong> Sector, 1-4 Oct <strong>2012</strong><br />
Table 4. Carbon footpr<strong>in</strong>t of asparagus cultivated <strong>in</strong> an <strong>in</strong>tegrated production system<br />
Integrated Production (IP) of Asparagus<br />
Farm carbon footpr<strong>in</strong>t per area [t/ha]<br />
Average asparagus yield per ha and per year (over 11 years) 7.020 t/ha<br />
Yearly cultivation, tillage and plant<strong>in</strong>g (per ha) without biogenic carbon 2.406 t CO2eq/ha/a<br />
LUC (asparagus after annual cropland) 0.0 kg CO2eq/ha/a*<br />
Bio-genic carbon per ha (6% dry matter of asparagus) -0.198 t CO2eq/ha/a<br />
From plant<strong>in</strong>g to harvest (over 11 years) (ha) 2.208 t CO2eq/ha/a<br />
360<br />
Farm carbon footpr<strong>in</strong>t [g per kg]<br />
From plant<strong>in</strong>g to harvest (over 11 years) (kg) 315 g CO2eq/kg asparagus<br />
Cool<strong>in</strong>g, grad<strong>in</strong>g and packag<strong>in</strong>g (5 kg cardboard carton) 086 g CO2eq/kg asparagus<br />
Carbon footpr<strong>in</strong>t from seedl<strong>in</strong>g to harvest accord<strong>in</strong>g to PAS 2050 -1 (B 2 B) 401 g CO2eq/kg asparagus<br />
Product carbon footpr<strong>in</strong>t [g per kg]<br />
Overall transportation farm to r<strong>et</strong>ail 096 g CO2eq/kg asparagus<br />
Use phase (shopp<strong>in</strong>g tour, fridge and cook<strong>in</strong>g) 304 g CO2eq/kg asparagus<br />
Product Carbon Footpr<strong>in</strong>t from harvest via use phase to disposal 400 g CO2eq/kg asparagus<br />
Product Carbon Footpr<strong>in</strong>t (PCF) CO2eq/kg asparagus (B 2 C) 801 g CO2eq/kg asparagus<br />
*LUC result was negative but assumed as zero.<br />
4. Discussion- Carbon reduction potential<br />
The pilot project PAS2050-1 sponsored by Productshap Tu<strong>in</strong>bow was successful and established guidel<strong>in</strong>es,<br />
with examples and references for the horticultural sector, and appears the first product category rule<br />
(PCR). Carbon reduction potential for autumn pumpk<strong>in</strong>, chosen as part of the associated pilot project, appears<br />
<strong>in</strong> three sectors i) potassium fertilisation, ii) reduction of nitrous oxide (N2O) emissions and iii) consumer<br />
behaviour. The first carbon reduction potential lies <strong>in</strong> improv<strong>in</strong>g viz., <strong>in</strong>creas<strong>in</strong>g the potassium fertilisation<br />
<strong>in</strong> all farm<strong>in</strong>g systems, except for the large farm, which would <strong>in</strong>crease yields and hence reduce the<br />
product carbon footpr<strong>in</strong>t (PCF). The second carbon reduction potential lies <strong>in</strong> the reduction of N2O emissions:<br />
With 99%, nitrous oxides had the largest share of the carbon footpr<strong>in</strong>t dur<strong>in</strong>g cultivation. Use of the<br />
global IPCC values of 1.0% (IPCC, 2006) or 1.25% (IPCC, 2007) N2O-N per kg applied fertiliser-N would<br />
nearly double the N2O from 0.8% dur<strong>in</strong>g cultivation (Kuikman <strong>et</strong> al., 2006). By contrast, the use of nitrification<br />
<strong>in</strong>hibitors such as DMPP with a 49% reduction <strong>in</strong> nitrous oxide emissions from regional soils (Weiske <strong>et</strong><br />
al., 2001) could halve the carbon footpr<strong>in</strong>t dur<strong>in</strong>g cultivation. Alternatively, depot nitrogen fertilisers like the<br />
ammonium-based CULTAN system (Bacher and Blanke, 1996; Sommer and Scherer, 2009) could reduce the<br />
amount of applied nitrogen by ca. 25%.<br />
The third carbon reduction potential is the consumer behaviour regard<strong>in</strong>g the means of transport for shopp<strong>in</strong>g.<br />
The use of bicycles, public transport or non-fossil-based cars could reduce the product carbon footpr<strong>in</strong>t.<br />
5. Conclusion<br />
Overall, the application trial showed PAS 2050-1:<strong>2012</strong> is suitable for the horticultural <strong>in</strong>dustry. These<br />
supplementary requirements enable the user <strong>in</strong> the horticultural bus<strong>in</strong>ess to have a clear and structured approach<br />
for the special issues <strong>in</strong> this specific sector. The new supplementary requirements, which offs<strong>et</strong> biogenic<br />
carbon <strong>in</strong> the horticultural/harvested product (Table 2), result <strong>in</strong> lesser carbon footpr<strong>in</strong>t values than <strong>in</strong><br />
previous studies. In the present pilot study, the product carbon footpr<strong>in</strong>t (PCF, cradle to grave, or B 2 C) was<br />
3% (asparagus), 8% (rhubarb) and 17% (strawberry) less due to subtract<strong>in</strong>g the biogenic carbon <strong>in</strong> the harvested<br />
produce. Hence, larger yields and produce with a large carbon contents play an <strong>in</strong>creas<strong>in</strong>g (positive)<br />
role <strong>in</strong> the carbon footpr<strong>in</strong>t; yields e.g. <strong>in</strong> pumpk<strong>in</strong> cultivated <strong>in</strong> the same region (soil and climate) with a<br />
different cultivation system (organic or IP) can vary by a factor of 3 (Table 3).<br />
Our value of 0.801 kg CO2eq/kg asparagus compares with another study on carbon emissions <strong>in</strong> the horticultural<br />
sector and 0.7-0.8 kg CO2eq/kg asparagus <strong>in</strong> Switzerland (Stoessel <strong>et</strong> al., <strong>2012</strong>), <strong>in</strong> which nitrogen<br />
fertiliser <strong>in</strong>clud<strong>in</strong>g related N2O emission played the greatest role. The Swiss values may be 10-15% less,<br />
because the system boundary of the study ended at r<strong>et</strong>ail level. This section from r<strong>et</strong>ail to the consumer was<br />
0.304 kg CO2eq/kg asparagus <strong>in</strong> the present pilot study (Table 4), the PCF to r<strong>et</strong>ail amounted to 0.497 kg<br />
CO2eq/kg asparagus <strong>in</strong> Germany.<br />
6. References<br />
Bacher, W., Blanke, M.M, Pr<strong>in</strong>g, R. Baker, E.A., 1996: Ammonium nutrition enhances chlorophyll and glaucousness <strong>in</strong> Brassica<br />
kohlrabi. Annals of Botany 78, 559-604.
PARALLEL SESSION 4A: CARBON FOOTPRINT 8 th Int. Conference on <strong>LCA</strong> <strong>in</strong> the<br />
Agri-<strong>Food</strong> Sector, 1-4 Oct <strong>2012</strong><br />
BSI, 2011. PAS 2050:2011. Specification for the assessment of life cycle greenhouse gas emissions of goods and services. British<br />
Standards Institute. London, England<br />
BSI, 2011. PAS 2050 Review 2011: Summary of the Changes to PAS 2050 and rationale<br />
BSI, <strong>2012</strong>. PAS 2050-1:<strong>2012</strong>: Assessment of life cycle greenhouse gas emissions from horticultural products - Supplementary requirements<br />
for the cradle to gate stages of GHG assessments of horticultural products undertaken <strong>in</strong> accordance with PAS 2050,<br />
British Standards Institute. London, England<br />
Intergovernmental Panel on Climate Change (IPCC), 2007. Climate Change 2007 Synthesis Report.<br />
Intergovernmental Panel on Climate Change (IPCC), 2006. Guidel<strong>in</strong>es for National Greenhouse Gas Inventories. Published by the<br />
Institute for Global Environmental Strategies (IGES) for the IPCC. ISBN 4-88788-032-4<br />
Intergovernmental Panel on Climate Change (IPCC), 2007. Climate Change 2007 Synthesis Report.<br />
Kuikmann, P.J., van der Hoek K.W., Smit, A., Zwart, K., 2006. Update of emission factors for nitrous oxide from agricultural soils<br />
on the basis of measurements <strong>in</strong> the N<strong>et</strong>herlands. Alterra report 1217. 40 pp.<br />
Schaefer, F., M.M. Blanke, <strong>2012</strong>. Farm<strong>in</strong>g and mark<strong>et</strong><strong>in</strong>g system affects carbon and water footpr<strong>in</strong>t - a case study us<strong>in</strong>g Hokaido<br />
pumpk<strong>in</strong>. J. Cleaner Production 28, 113-119.<br />
Sommer, K., Scherer, H.W., 2009. Source/S<strong>in</strong>k-Relationships <strong>in</strong> plants as depend<strong>in</strong>g on ammonium as “CULTAN”, nitrate or urea as<br />
available nitrogen fertilisers. Acta Horticulturae 835, 65-88.<br />
Weiske, A., Benckiser, G., Herbert, T., Ottow, J.C.G., 2001. Influence of the nitrification <strong>in</strong>hibitor 3,4-dim<strong>et</strong>hylpyrazole phosphate<br />
(DMPP) <strong>in</strong> comparison to dicyandiamide (DCD) on nitrous oxide emissions, carbon dioxide fluxes and m<strong>et</strong>hane oxidation dur<strong>in</strong>g<br />
3 years of repeated application <strong>in</strong> field experiments. Biology and Fertility of Soils 34, 109-117.<br />
Stoessel, F., Juraske, R., Pfister, S., Hellweg, S., <strong>2012</strong>. Life cycle <strong>in</strong>ventory and carbon and water foodpr<strong>in</strong>t of fruits and veg<strong>et</strong>ables:<br />
Application to a Swiss r<strong>et</strong>ailer. Environ. Sci. Technol. 46, 3253-3262.<br />
361
PARALLEL SESSION 4A: CARBON FOOTPRINT 8 th Int. Conference on <strong>LCA</strong> <strong>in</strong> the<br />
Agri-<strong>Food</strong> Sector, 1-4 Oct <strong>2012</strong><br />
Environmental and nutritional assessment of Br<strong>et</strong>on pâté production<br />
Anne Himeno, Lori Gustavus, Ricardo Teixeira *<br />
Bluehorse Associates, 12 rue Soyer, 92200 Neuilly-sur-Se<strong>in</strong>e, <strong>France</strong><br />
Correspond<strong>in</strong>g author. E-mail: ricardo.teixeira@bluehorseassociates.com<br />
ABSTRACT<br />
As part of its commitment to corporate social responsibility, the Jean Hénaff company, a <strong>France</strong>-based pork meat processor, partnered<br />
with Bluehorse Associates and a lead<strong>in</strong>g French eng<strong>in</strong>eer<strong>in</strong>g school Ecole Centrale Paris to conduct a study to measure the<br />
carbon footpr<strong>in</strong>t of its country-style pâté l<strong>in</strong>e, which conta<strong>in</strong>s pork meat produced with different agricultural m<strong>et</strong>hods (conventional,<br />
organic, high-quality labelled meat, and meat from l<strong>in</strong>seed-fed pigs) and various packag<strong>in</strong>g materials. The study was done with the<br />
lifecycle assessment application Carbonostics and <strong>in</strong>cluded nutritional data analysis. the analysis identified pork meat as the first<br />
source of carbon emissions with differences l<strong>in</strong>ked to the recipe. The second most important source of emissions was the process<strong>in</strong>g<br />
stage. In addition, the results revealed that the Hénaff “country-style” pâtés had a carbon footpr<strong>in</strong>t lower than <strong>in</strong>ternational benchmarks.<br />
The study <strong>in</strong>cluded recommendations for the elaboration of new recipes, for mark<strong>et</strong><strong>in</strong>g and for operations improvement.<br />
Keywords: life cycle assessment, pâté, pork, carbon emissions, nutrition<br />
1. Introduction<br />
Product environmental footpr<strong>in</strong>t, and particularly product carbon footpr<strong>in</strong>t (PCF), is now driv<strong>in</strong>g susta<strong>in</strong>able<br />
bus<strong>in</strong>ess strategy. PCF is particularly important for food and agriculture companies s<strong>in</strong>ce food products<br />
have high impacts throughout their lifecycle, particularly dur<strong>in</strong>g the agricultural stage. As the true impact of<br />
these products is <strong>in</strong>creas<strong>in</strong>gly disclosed, consumers are empowered to make <strong>in</strong>formed choices. Ensur<strong>in</strong>g<br />
susta<strong>in</strong>ability is today as important as ensur<strong>in</strong>g nutritional quality of the product. This is a new reality to<br />
which companies must adapt.<br />
The company Jean Hénaff (http://www.Hénaff.com/) has established itself over more than one hundred<br />
years of existence as a reference <strong>in</strong> southern F<strong>in</strong>istère, Brittany (western coast of <strong>France</strong>). The company is<br />
specialised <strong>in</strong> pork food products, most importantly pâté. For the past several years, Jean Hénaff has focused<br />
on its corporate social responsibility through its susta<strong>in</strong>ability policy and via its local engagement with suppliers<br />
and commitment to nutrition and health. Hénaff was <strong>France</strong>'s first SME and the first Br<strong>et</strong>on company<br />
to have signed the voluntary nutritional progress commitment charter with the French M<strong>in</strong>istry of Health <strong>in</strong><br />
November 2010.<br />
In 2008 Hénaff concluded a Bilan Carbone, an <strong>in</strong>ventory of Greenhouse Gas (GHG) emissions generated<br />
by all of the company's activities (ADEME, 2006). Follow<strong>in</strong>g this <strong>in</strong>itial company-level <strong>in</strong>ventory, Hénaff<br />
wished to conduct a more <strong>in</strong>-depth analysis at the product level for their flagship l<strong>in</strong>e of pâtés. In l<strong>in</strong>e with its<br />
strong health and nutrition commitment, Hénaff wished to <strong>in</strong>corporate the nutritional aspect <strong>in</strong> parallel to<br />
GHG emissions <strong>in</strong>to this study (Hénaff, <strong>2012</strong>).<br />
A project <strong>in</strong> partnership with Bluehorse Associates and Ecole Centrale Paris was thus <strong>in</strong>itiated <strong>in</strong> 2011 to<br />
assess the carbon footpr<strong>in</strong>t of its l<strong>in</strong>e of country-style pâté products, <strong>in</strong>tegrat<strong>in</strong>g the nutritional profile <strong>in</strong>to the<br />
analysis and recommendations.<br />
2. M<strong>et</strong>hods<br />
2.1. Goals of the study<br />
Besides the carbon footpr<strong>in</strong>t assessment of the considered products, the goals of this study for Jean Hénaff<br />
were:<br />
To identify the ma<strong>in</strong> sources of emissions for each product <strong>in</strong> its range of country-style pâtés,<br />
throughout their life cycle;<br />
To compare country-style pâtés tog<strong>et</strong>her (impact of meat type, recipe, packag<strong>in</strong>g, <strong>et</strong>c.) tak<strong>in</strong>g nutritional<br />
quality <strong>in</strong>to consideration;<br />
To identify potential avenues for carbon footpr<strong>in</strong>t improvement.<br />
2.2. Products analysed<br />
First, the number and type of products to analyse was d<strong>et</strong>erm<strong>in</strong>ed. Consider<strong>in</strong>g the objectives Hénaff<br />
posed for this study, the study targ<strong>et</strong>ed n<strong>in</strong>e pork-based products, with n<strong>et</strong> weights of b<strong>et</strong>ween 78 and 200 g,<br />
dist<strong>in</strong>guished by recipe, type of pork meat (conventional, organic and other quality certifications), and type<br />
of packag<strong>in</strong>g.<br />
362
PARALLEL SESSION 4A: CARBON FOOTPRINT 8 th Int. Conference on <strong>LCA</strong> <strong>in</strong> the<br />
Agri-<strong>Food</strong> Sector, 1-4 Oct <strong>2012</strong><br />
We considered four meat types dist<strong>in</strong>guished by the agricultural circuit from which they are obta<strong>in</strong>ed:<br />
Conventional agriculture: use of synth<strong>et</strong>ic fertilisers and pesticides for the production of feeds is<br />
allowed, as is the use of standard antibiotics for pigs;<br />
Label Rouge: approved production that conforms to specifications for the production of superior<br />
quality meat accord<strong>in</strong>g to a specific recipe;<br />
Organic farm<strong>in</strong>g: no synth<strong>et</strong>ic fertilisers or pesticides, strict restriction of the use of conventional<br />
v<strong>et</strong>er<strong>in</strong>ary medic<strong>in</strong>e;<br />
Bleu-Blanc-Cœur: pigs are fed a f<strong>in</strong>ish<strong>in</strong>g phase feed with traditional and high-Omega 3 plant<br />
sources (grass, l<strong>in</strong>seed, alfalfa, lup<strong>in</strong>, <strong>et</strong>c.).<br />
We considered also the follow<strong>in</strong>g 3 packag<strong>in</strong>g types:<br />
T<strong>in</strong> can;<br />
Alum<strong>in</strong>ium can;<br />
Glass jar with t<strong>in</strong> plate lid.<br />
2.3. Scope and functional unit<br />
S<strong>in</strong>ce the objective was to f<strong>in</strong>d hotspots throughout the supply cha<strong>in</strong>, we chose a Life Cycle Assessment<br />
(<strong>LCA</strong>) m<strong>et</strong>hodology. The life cycle considered for pâté production is shown <strong>in</strong> Figure 1. The scope of the<br />
study <strong>in</strong>cluded compl<strong>et</strong>e product life-cycle, from the production of raw materials <strong>in</strong> the agricultural phase<br />
(<strong>in</strong>clud<strong>in</strong>g the production of animal feed), all the raw material and f<strong>in</strong>ished product transport phases, the pâté<br />
production processes, consumption and end of life. The functional unit studied was a 78 g-equivalent pâté<br />
product eaten, with refrigeration for 24 hrs <strong>in</strong> the consumer's home <strong>in</strong>cluded for products <strong>in</strong> excess of 180 g.<br />
Figure 1. Representation of the life cycle studied.<br />
2.4. Software and data used<br />
The study was conducted by Bluehorse Associates <strong>in</strong> collaboration with Ecole Centrale Paris.<br />
363
PARALLEL SESSION 4A: CARBON FOOTPRINT 8 th Int. Conference on <strong>LCA</strong> <strong>in</strong> the<br />
Agri-<strong>Food</strong> Sector, 1-4 Oct <strong>2012</strong><br />
Primary data for the recipe used, packag<strong>in</strong>g composition, process<strong>in</strong>g energy consumption and transport<br />
was primarily obta<strong>in</strong>ed from the Bilan Carbone report or, where it was miss<strong>in</strong>g, collected by Jean Hénaff and<br />
its suppliers.<br />
For GHG emission data, the Carbonostics (<strong>2012</strong>) onl<strong>in</strong>e food <strong>LCA</strong> application was used. Carbonostics is<br />
a lifecycle assessment tool designed to p<strong>in</strong>po<strong>in</strong>t the hotspots of any food product or menu along three key<br />
criteria: cost + carbon + nutrition. Carbonostics' built-<strong>in</strong> database <strong>in</strong>cludes GHG emission factors to assess all<br />
the life cycle stages, as well as nutritional <strong>in</strong>formation on <strong>in</strong>gredients. Us<strong>in</strong>g Carbonostics enabled the <strong>in</strong>tegration<br />
of GHG and six nutritional <strong>in</strong>dicators, namely calories, prote<strong>in</strong>, lipids, carbohydrates, sodium and<br />
sugar - all <strong>in</strong> the same analysis.<br />
Local data was also collected for the life cycle stages with higher <strong>in</strong>fluence <strong>in</strong> f<strong>in</strong>al results, namely the agricultural<br />
production phase. Bass<strong>et</strong>-Mens and van der Werf (2005) provide GHG emissions factors at the<br />
farm outl<strong>et</strong> for pigs reared <strong>in</strong> Brittany <strong>in</strong> three agricultural circuits: conventional (2.30 kg CO2e/kg live pig),<br />
Label Rouge (3.46 kg CO2e/kg live pig) and organic (3.97 kg CO2e/kg live pig). We then used local study<br />
(Chevillon <strong>et</strong> al., 2011) to allocate GHG emissions for rear<strong>in</strong>g pigs amongst the different parts of the carcass<br />
(liver, throat, breast, sk<strong>in</strong>, <strong>et</strong>c.). We used mass allocation, <strong>in</strong> l<strong>in</strong>e with the BPX 30-323 guidel<strong>in</strong>es (AFNOR-<br />
ADEME, 2009), the reference frame for the experimentation on the environmental display of consumer<br />
products conducted <strong>in</strong> <strong>France</strong> from mid-2011 to the end of <strong>2012</strong>.<br />
Amongst the hypotheses used, the follow<strong>in</strong>g should be noted:<br />
The emission factors for Bleu-Blanc-Cœur (BBC) pork are the same as those for conventional meat.<br />
Indeed, the specific feed<strong>in</strong>g phase is of relatively short duration (2 months) and the proportion of<br />
high-Omega 3 plants <strong>in</strong> the food ration is low, circa 2%.<br />
Emissions ascribed to secondary and tertiary packag<strong>in</strong>g are negligible when compared to those of the<br />
product. They were thus not <strong>in</strong>cluded <strong>in</strong> the study.<br />
F<strong>in</strong>ally, a sensitivity analysis (study of the impact of modulat<strong>in</strong>g different <strong>in</strong>put variables on end result<br />
variation) was conducted and the ma<strong>in</strong> results are presented <strong>in</strong> the follow<strong>in</strong>g section. As part of the sensitivity<br />
analysis we also changed the procedure for allocat<strong>in</strong>g emissions to pork parts from mass to economic.<br />
3. Results<br />
3.1. GHG emissions for each pâté l<strong>in</strong>e<br />
An <strong>in</strong>itial observation is that the carbon footpr<strong>in</strong>t of pâté products is b<strong>et</strong>ween 160 g and 260 g CO2e for<br />
78 g (Figure 2), i.e. b<strong>et</strong>ween 200 and 330 g CO2e for 100 g, which is below available <strong>in</strong>ternational benchmarks.<br />
This can be attributed to the fact that the GHG emissions for pork production <strong>in</strong> Bass<strong>et</strong>-Mens and van<br />
der Werf (2005) were lower than the equivalent emission factors for other countries <strong>in</strong> the Carbonostics<br />
(<strong>2012</strong>) database. Moreover, the organic country-style pâté has the highest carbon footpr<strong>in</strong>t, while Label<br />
Rouge and conventional/Bleu-Blanc-Cœur pâtés have a comparable footpr<strong>in</strong>t. This result is expla<strong>in</strong>ed not<br />
only because organic pork production <strong>in</strong> Br<strong>et</strong>agne has higher emissions (Bass<strong>et</strong>-Mens and van der Werf,<br />
2005), but also because the proportions of the different pork cuts <strong>in</strong> the recipe vary.<br />
An analysis of results per life-cycle phase for GHG shows that raw materials are responsible for over 80%<br />
of the total impact. Pork is the ma<strong>in</strong> hotspot amongst raw materials. The contribution of packag<strong>in</strong>g to emissions<br />
reveals that glass has the greatest impact, followed by t<strong>in</strong> plate and alum<strong>in</strong>ium. Although packag<strong>in</strong>g<br />
emissions are not comparable to pork emissions, the difference b<strong>et</strong>ween packag<strong>in</strong>g materials is sufficient to<br />
differentiate b<strong>et</strong>ween pâtés. Energy spent for process<strong>in</strong>g, the only life cycle step that Hénaff controls directly,<br />
lag far beh<strong>in</strong>d with only 10% of the total impact. The transport-related impact appears negligible.<br />
These percentages are consistent with the Bilan Carbone f<strong>in</strong>d<strong>in</strong>gs for the bundle of Hénaff products.<br />
364
PARALLEL SESSION 4A: CARBON FOOTPRINT 8 th Int. Conference on <strong>LCA</strong> <strong>in</strong> the<br />
Agri-<strong>Food</strong> Sector, 1-4 Oct <strong>2012</strong><br />
Figure 2. Results per life-cycle phase (pork production impacts allocated by mass to pork products). Raw<br />
material production is the hotspot (bar on the bottom). Second highest bar is for process<strong>in</strong>g. BBC - Bleu-<br />
Blanc-Cœur pâté.<br />
3.2. Comb<strong>in</strong>ed analysis of GHG emissions and nutrition<br />
Label Rouge pâtés cause higher emissions than conventional pâtés, despite provid<strong>in</strong>g less calories (Figure<br />
3) and more prote<strong>in</strong> (results not shown <strong>in</strong> this paper). Organic pâté falls b<strong>et</strong>ween the two on the calories scale<br />
and has a carbon footpr<strong>in</strong>t similar to Label Rouge. These nutritional variations are ma<strong>in</strong>ly expla<strong>in</strong>ed by recipe<br />
variations. This means that even if we had chosen a different functional unit (nutritional units <strong>in</strong>stead of<br />
mass units), results would change, and Label Rouge would be the most beneficial.<br />
Results obta<strong>in</strong>ed <strong>in</strong> Carbonostics for the nutritional <strong>in</strong>dicators were validated us<strong>in</strong>g laboratorial measurements.<br />
Figure 3. Results for carbon emissions vs. calories. Two clusters of products are shown – Label Rouge and<br />
organic pâtés on the left, conventional and Bleu-Blanc-Cœur pâté (BBC) on the right.<br />
365
PARALLEL SESSION 4A: CARBON FOOTPRINT 8 th Int. Conference on <strong>LCA</strong> <strong>in</strong> the<br />
Agri-<strong>Food</strong> Sector, 1-4 Oct <strong>2012</strong><br />
3.3. Sensitivity analysis<br />
The follow<strong>in</strong>g simulations were performed <strong>in</strong> the context of the sensitivity analysis. We list next the<br />
analysis made and the changes <strong>in</strong> results.<br />
- Economic allocation of emissions for pork parts (<strong>in</strong>stead of mass) - the magnitude of the diference <strong>in</strong><br />
emissions b<strong>et</strong>ween organic, Label Rouge and conventional pâtés <strong>in</strong>creases very significantly (more than<br />
10%), but the relative position<strong>in</strong>g and the qualitative results regard<strong>in</strong>g hotspots rema<strong>in</strong> the same.<br />
- Economic allocation of energy consumption at the pâté production site – Hénaff measured the energy<br />
consumption of all mach<strong>in</strong>ery <strong>in</strong>volved <strong>in</strong> the production of the pâté and then physically allocated the<br />
energy step by step to each unit produced. As an alternative, quicker route, we allocated the total energy bill<br />
to each pâté produced us<strong>in</strong>g economic allocation, ie, attribut<strong>in</strong>g a fraction of total energy consumed at the<br />
production site to each unit of product accord<strong>in</strong>g to its contribution to total turnover. Overall, there was no<br />
signifficant difference <strong>in</strong> results (less than 1%).<br />
- Us<strong>in</strong>g foreign emission factors for pork parts – we used other emission factors from the Carbonostics<br />
database, which correspond to records <strong>in</strong> <strong>in</strong>ternational databases for different pork parts. For example, we<br />
used an emission factor from the <strong>LCA</strong> <strong>Food</strong> Denmark database (Nielsen <strong>et</strong> al., 2003) for pork neck, and a<br />
CLM (2010) database record for tenderlo<strong>in</strong>. The f<strong>in</strong>al carbon footpr<strong>in</strong>t of all pâtés <strong>in</strong>creased. However, the<br />
relative results did not change.<br />
- Consider<strong>in</strong>g freez<strong>in</strong>g of certa<strong>in</strong> meat parts <strong>in</strong>stead of refrigeration, and consider<strong>in</strong>g the impacts from<br />
the slaughter<strong>in</strong>g process, not <strong>in</strong>cluded at first due to low quality data: there was no significant impact <strong>in</strong> total<br />
emissions and no change <strong>in</strong> relative results.<br />
4. Discussion<br />
This work produced two types of results. For Jean Hénaff, results had operational significance. For Bluehorse<br />
Associates and Ecole Centrale Paris, the results were m<strong>et</strong>hodological very <strong>in</strong>terest<strong>in</strong>g.<br />
Regard<strong>in</strong>g operational results, Hénaff discovered that their pâtés have lower emissions than <strong>in</strong>ternational<br />
benchmarks. This could be used as an export mark<strong>et</strong><strong>in</strong>g strategy <strong>in</strong> particular to the United States, where<br />
Hénaff is already the only French meat manufacturer to be USDA-certified.<br />
Hénaff also learned that the <strong>in</strong>gredients, and ma<strong>in</strong>ly pork, are the lead<strong>in</strong>g GHG source of emissions. The<br />
recipe, and more specifically the proportions of the various pork cuts used, have a significant <strong>in</strong>fluence on<br />
carbon footpr<strong>in</strong>t and of course on the nutritional profile. These choices are made primarily accord<strong>in</strong>g to the<br />
desired organoleptic profile of the end product: its taste, texture, <strong>et</strong>c.<br />
Equally important to Hénaff is to know where not to focus efforts. Transport, cold storage of <strong>in</strong>gredients<br />
and slaughterhouse processes did not have a significant impact for any of the 9 vari<strong>et</strong>ies of country-style pâté<br />
products studied. They thus do not appear to constitute an <strong>in</strong>terest<strong>in</strong>g avenue for achiev<strong>in</strong>g a rapid and significant<br />
reduction of the carbon footpr<strong>in</strong>t of country-style pâtés. This study thus raised questions concern<strong>in</strong>g<br />
certa<strong>in</strong> preconceived notions of the relative importance of the various sources of emissions (e.g., “foodmiles”).<br />
To effectively reduce the carbon footpr<strong>in</strong>t of its products, while ma<strong>in</strong>ta<strong>in</strong><strong>in</strong>g or improv<strong>in</strong>g their nutritional<br />
properties, Jean Hénaff must therefore consider optimiz<strong>in</strong>g its choices <strong>in</strong> terms of recipe, type of meat and<br />
packag<strong>in</strong>g, while pursu<strong>in</strong>g its nutritional commitments. Hénaff now has a platform that allows the company<br />
to comb<strong>in</strong>e these different angles. Naturally, s<strong>in</strong>ce this study was a first step us<strong>in</strong>g only one environmental<br />
<strong>in</strong>dicator, namely carbon emissions, other <strong>in</strong>dicators can be used <strong>in</strong> the future to draw additional conclusions.<br />
For Bluehorse Associates and Ecole Centrale Paris, this difference <strong>in</strong> results when choos<strong>in</strong>g different<br />
functional units was very important. We discovered that if the reference flow is unit of nutritional <strong>in</strong>dicator<br />
(e.g. calories, prote<strong>in</strong>, <strong>et</strong>c.) <strong>in</strong>stead of mass of product, results can be <strong>in</strong>verted. This fact highlights the difficulty<br />
of choos<strong>in</strong>g a functional unit for studies on food products. The function of a food product is to provide<br />
quality nutrition. S<strong>in</strong>ce there are many different nutritional <strong>in</strong>dicators, <strong>LCA</strong> practitioners normally use simple<br />
comparisons b<strong>et</strong>ween mass amounts. This may lead to biased results.<br />
Pork meat was particularly challeng<strong>in</strong>g as a case study also because the choice of allocation m<strong>et</strong>hod for<br />
pork parts has a dramatic effect on absolute results. Pâtés use parts such as pork neck and fat, which share<br />
the majority of the pork production impacts. We used economic and mass allocation, and results changed<br />
significantly (more than 10%). Some <strong>in</strong>ternational standards like PAS2050 (BSI, 2010) <strong>in</strong> the UK recommend<br />
economic allocation, while others like BPX30-323 (AFNOR-ADEME, 2009) and the GHG Protocol<br />
(WRI/WBCSD, 2011) recommend mass allocation. This discrepancy is a strong limitation to <strong>in</strong>ter-study<br />
comparability.<br />
366
PARALLEL SESSION 4A: CARBON FOOTPRINT 8 th Int. Conference on <strong>LCA</strong> <strong>in</strong> the<br />
Agri-<strong>Food</strong> Sector, 1-4 Oct <strong>2012</strong><br />
5. Conclusion<br />
A life-cycle approach tak<strong>in</strong>g <strong>in</strong>to consideration all life-cycle steps can identify the ma<strong>in</strong> sources of emissions<br />
and elim<strong>in</strong>ate certa<strong>in</strong> preconceived ideas concern<strong>in</strong>g the relative significance of transport, packag<strong>in</strong>g or<br />
processes, or concern<strong>in</strong>g the compared impact of <strong>in</strong>gredients obta<strong>in</strong>ed from organic farm<strong>in</strong>g. The present<br />
studied displayed the power of <strong>LCA</strong> to improve bus<strong>in</strong>ess management. Besides the knowledge of the carbon<br />
footpr<strong>in</strong>t of its country-style pâtés, along with the ma<strong>in</strong> sources of emissions, Hénaff was empowered by this<br />
study to make educated decisions about the company’s susta<strong>in</strong>ability agenda and how to implement it when<br />
design<strong>in</strong>g new products. Hénaff can also use the attributes discovered <strong>in</strong> the study, like the fact that the emissions<br />
per 100g of pâté are lower than <strong>in</strong>ternational benchmarks, for mark<strong>et</strong><strong>in</strong>g purposes, <strong>in</strong> particular for<br />
foreign sales of its top-of-the-l<strong>in</strong>e products. F<strong>in</strong>ally, Hénaff can now use this precise consumption data per<br />
unit of product, delivered <strong>in</strong> the Carbonostics results, which could be leveraged to optimize its manufactur<strong>in</strong>g<br />
processes.<br />
The study also raised <strong>in</strong>terest<strong>in</strong>g m<strong>et</strong>hodological po<strong>in</strong>ts that should be addressed by the <strong>LCA</strong> community.<br />
The dramatic changes <strong>in</strong> conclusions depend<strong>in</strong>g on the functional unit chosen are one example, as is the importance<br />
of the impact allocation procedure. For food products, environmental aspects should never be covered<br />
separately from nutrition. A comb<strong>in</strong>ed analysis of carbon-related and nutritional aspects provides more<br />
extensive and reliable <strong>in</strong>formation.<br />
6. References<br />
ADEME, 2006. Bilan Carbone – Bilan des Emissions de Gaz a Eff<strong>et</strong> de Serre d’une Entreprise Industrielle ou Tertiaire (“Bilan Carbone”<br />
– Bill of Greenhouse Gas Emissions of an Industrial or Tertiary-sector company”, <strong>in</strong> English). ADEME, Paris.<br />
AFNOR-ADEME, 2009. BP X 30-323: General pr<strong>in</strong>ciples for an environmental communication on mass mark<strong>et</strong> products. AFNOR,<br />
Paris.<br />
Bass<strong>et</strong>-Mens, C. and van der Werf, H.M.G., 2005. Scenario-based environmental assessment of farm<strong>in</strong>g systems: the case of pig<br />
production <strong>in</strong> <strong>France</strong>. Agr. Ecos. & Env. 105, 127–144.<br />
BSI, 2010. PAS 2050:2010: Specification for the assessment of the life cycle greenhouse gas emissions of goods and services. British<br />
Standards Institution, London.<br />
Carbonostics. <strong>2012</strong>. http://www.carbonostics.com/. Accessed March <strong>2012</strong>.<br />
Chevillon, P., Nassy, G. and Gault, E., 2011. Impact carbone du maillon Abattage Déoupe sur la filière porc<strong>in</strong>e (“Carbon emissions<br />
of l<strong>in</strong>ked slaughter<strong>in</strong>g-dismantl<strong>in</strong>g on the pork <strong>in</strong>dustry”, <strong>in</strong> English). IFIP (Insitut du Porc), Paris.<br />
CLM. 2010. http://www.clm.nl/<strong>in</strong>dex_eng.php?id=m<strong>et</strong>hodology. Accessed January 2010.<br />
Hénaff, <strong>2012</strong>. http://www.henaff.com/fr/entreprise-responsable/nutrition-<strong>et</strong>-sante/. Assessed March <strong>2012</strong>.<br />
Nielsen, P.H., Nielsen, A.M., Weidema, B.P., Dalgaard R. and Halberg, N., 2003. <strong>LCA</strong> data on basic food products produced and<br />
consumed <strong>in</strong> Denmark. Danish Institute of Agriculture Sciences. Available from: http://www.lcafood.dk.<br />
WRI/WBCSD, 2011. The Greenhouse Gas Protocol: Product Life Cycle Account<strong>in</strong>g & Report<strong>in</strong>g Standard. World Resources Institute/World<br />
Bus<strong>in</strong>ess Council for Susta<strong>in</strong>able Development, Wash<strong>in</strong>gton DC.<br />
367
PARALLEL SESSION 4A: CARBON FOOTPRINT 8 th Int. Conference on <strong>LCA</strong> <strong>in</strong> the<br />
Agri-<strong>Food</strong> Sector, 1-4 Oct <strong>2012</strong><br />
368<br />
Estimat<strong>in</strong>g carbon footpr<strong>in</strong>ts of <strong>in</strong>dividual crops <strong>in</strong> organic arable<br />
crop rotations<br />
Marie Trydeman Knudsen 1* , John E. Hermansen 1 , Jørgen E. Olesen 1 , Andreas Meyer-Aurich 2 , Ngonidzashe<br />
Chir<strong>in</strong>da 1<br />
1 Dept. of Agroecology, Aarhus University, Blichers Allé 20, Postbox 50, DK-8830 Tjele, Denmark<br />
2 Dept. of Technology Assessment and Substance Cycles,Leibniz-Institute for Agricultural Eng<strong>in</strong>eerign, 14469 Potsdam, Germany<br />
Correspond<strong>in</strong>g author. E-mail: MarieT.Knudsen@agrsci.dk<br />
ABSTRACT<br />
Organic agriculture relies to a high degree on crop rotations, which <strong>in</strong>terl<strong>in</strong>ks the environmental impact of the crops. This constitutes<br />
a challenge when us<strong>in</strong>g <strong>LCA</strong> for analys<strong>in</strong>g organic products, specifically with regard to allocation aspects. This was studied <strong>in</strong> an<br />
organic arable crop rotation experiment grown at three different locations <strong>in</strong> Denmark for three years. The aim was to compare the<br />
carbon footpr<strong>in</strong>t of the crops at farm gate <strong>in</strong> four different crop rotations. The carbon footpr<strong>in</strong>ts were estimated based on either a) the<br />
full crop rotation or b) the <strong>in</strong>dividual crops. The last approach was done by splitt<strong>in</strong>g the environmental burden and benefits from e.g.<br />
the green manure equally among the crops on a per hectare basis. The study highlights the importance of analys<strong>in</strong>g the whole crop<br />
rotation and <strong>in</strong>clud<strong>in</strong>g soil carbon stock changes when estimat<strong>in</strong>g carbon footpr<strong>in</strong>ts of organic crops where green manure crops are<br />
<strong>in</strong>cluded.<br />
Keywords: life cycle assessment, greenhouse gas emissions, organic, crop rotation<br />
1. Introduction<br />
Organic agriculture relies to a high degree on recycl<strong>in</strong>g of nutrients and us<strong>in</strong>g crop residues as a means to<br />
fertilise crops and ma<strong>in</strong>ta<strong>in</strong> soil fertility. Thus, the bask<strong>et</strong> of products that orig<strong>in</strong>ates from organic production<br />
is diverse and to a high degree <strong>in</strong>terl<strong>in</strong>ked. This constitutes a challenge when us<strong>in</strong>g life cycle assessment<br />
(<strong>LCA</strong>) for analys<strong>in</strong>g organic agricultural products derived from the more complex systems. For example<br />
with regard to allocation aspects when green manure crops or catch crops are <strong>in</strong>cluded <strong>in</strong> the crop rotation.<br />
Thus, while ISO standards for <strong>LCA</strong> (ISO 14040 and 14044) provide overall guidel<strong>in</strong>es, there is still a need<br />
for further development of <strong>LCA</strong> m<strong>et</strong>hodologies for complex systems such as organic agriculture. Furthermore,<br />
the need to <strong>in</strong>clude soil carbon changes <strong>in</strong> the <strong>LCA</strong> of organic products is more urgent s<strong>in</strong>ce organic<br />
farm<strong>in</strong>g practices on average <strong>in</strong>crease soil carbon sequestration (FAO, 2011).<br />
The aim of the present paper is to explore and suggest a m<strong>et</strong>hod to estimate the carbon footpr<strong>in</strong>ts of <strong>in</strong>dividual<br />
crops <strong>in</strong> organic arable crop rotations.<br />
2. M<strong>et</strong>hods<br />
The challenge of estimat<strong>in</strong>g carbon footpr<strong>in</strong>ts of organic crops was studied <strong>in</strong> an organic arable crop rotation<br />
experiment grown at three different locations <strong>in</strong> Denmark for three years (2006-8). The organic crop<br />
rotations were designed to explore ways to avoid the use of conventional manure. Organic arable production<br />
is often <strong>in</strong> practice dependent on conventional manure, which is considered problematic by parts of the organic<br />
sector <strong>in</strong> e.g. Denmark. Four different crop rotations were compared <strong>in</strong> the experiment <strong>in</strong> order to provide<br />
alternative solutions to secure nitrogen (N) supply for the crops without us<strong>in</strong>g conventional manure.<br />
2.1 The crop rotations<br />
The four scenarios are illustrated <strong>in</strong> Figure 1; three organic (‘Slurry’, ‘No <strong>in</strong>put’ and ‘Mulch<strong>in</strong>g’) and one<br />
conventional crop rotation. The first organic scenario (Slurry) represents the present situation where slurry<br />
(often conventional) is imported and used on arable farms and all four crops <strong>in</strong> the crop rotation can be sold<br />
as sales crops. The second organic rotation (No <strong>in</strong>put) represents a scenario where still all four crops can be<br />
sold as sales crops, but no organic fertiliser is used. The third organic scenario (Mulch<strong>in</strong>g) represents a solution<br />
where the faba beans are replaced by a green manure crop (grass-clover) that is <strong>in</strong>corporated <strong>in</strong> the soil<br />
and thus only three sales crops can be sold from the rotation. Furthermore, a conventional rotation was <strong>in</strong>cluded<br />
that is similar to the ‘Slurry’ rotation, where all four crops can be sold as sales crops, but m<strong>in</strong>eral<br />
fertiliser is used <strong>in</strong>stead of slurry and <strong>in</strong> addition pesticides are used. Where possible, catch crops were <strong>in</strong>cluded<br />
<strong>in</strong> the rotations (Figure 1).
PARALLEL SESSION 4A: CARBON FOOTPRINT 8 th Int. Conference on <strong>LCA</strong> <strong>in</strong> the<br />
Agri-<strong>Food</strong> Sector, 1-4 Oct <strong>2012</strong><br />
ORGANIC<br />
CONVENTIONAL<br />
’Mulch<strong>in</strong>g<br />
rotation’<br />
’No <strong>in</strong>put<br />
rotation’<br />
’Slurry<br />
rotation’<br />
’Conventional<br />
rotation’<br />
Spr<strong>in</strong>g barley<br />
Spr<strong>in</strong>g barley<br />
Spr<strong>in</strong>g barley<br />
Catch<br />
crop<br />
Catch<br />
crop<br />
Emissions to air (N2O, NH3, CO2 <strong>et</strong>c.)<br />
Faba bean<br />
Faba bean<br />
Faba bean<br />
Figure 1. Illustration of the crop rotations analysed <strong>in</strong> the study. The studied crop rotations were grown at<br />
three locations <strong>in</strong> a randomised and replicate long-term experiment <strong>in</strong> Denmark (Jyndevad, Foulum and<br />
Flakkebjerg) dur<strong>in</strong>g three years (2006-8).<br />
2.1 Estimation of the carbon footpr<strong>in</strong>t <strong>in</strong> a life cycle assessment approach<br />
A life cycle assessment (<strong>LCA</strong>) approach until farm gate was used <strong>in</strong> the present study focus<strong>in</strong>g on greenhouse<br />
gas emissions. The carbon footpr<strong>in</strong>ts are expressed <strong>in</strong> g CO2 eq. per kg dry matter (DM) of the total<br />
sales crops or the specific crops. Thus, the functional unit is one kg crop DM.<br />
The system boundaries <strong>in</strong> the studied systems <strong>in</strong>cluded ma<strong>in</strong>ly the production of agricultural <strong>in</strong>puts and<br />
the agricultural production <strong>in</strong> the field, <strong>in</strong>clud<strong>in</strong>g soil carbon stock changes (Fig. 2).<br />
Figure 2. Illustration of the processes <strong>in</strong>volved and system boundaries <strong>in</strong> the present study of crop rotations.<br />
The carbon footpr<strong>in</strong>ts are calculated based on both the full crop rotation and separately for the specific crops.<br />
The data are primarily based on the field experiment for the five treatments, two blocks, three locations<br />
and three years. Crop DM and nitrogen (N) yields were measured <strong>in</strong> the field experiment for both gra<strong>in</strong> and<br />
straw. For the catch crops, total DM and N yield were measured. The above and below ground crop residues<br />
Catch<br />
crop<br />
Catch<br />
crop<br />
Spr<strong>in</strong>g barley Catch Faba bean Catch Potatoes W<strong>in</strong>ter wheat<br />
crop<br />
Faba bean<br />
crop<br />
Input<br />
production<br />
Green<br />
manure Green<br />
manure crop<br />
Emissions to soil and water (NO3 - <strong>et</strong>c.)<br />
Spr<strong>in</strong>g barley<br />
Potatoes<br />
Soil C change<br />
Green manure/<br />
Faba bean<br />
W<strong>in</strong>ter wheat<br />
Potatoes W<strong>in</strong>ter wheat<br />
Potatoes<br />
Potatoes<br />
W<strong>in</strong>ter wheat<br />
W<strong>in</strong>ter wheat<br />
Sales crop yield<br />
Catch<br />
crop<br />
Catch<br />
crop<br />
Catch<br />
crop<br />
Catch<br />
crop<br />
369
PARALLEL SESSION 4A: CARBON FOOTPRINT 8 th Int. Conference on <strong>LCA</strong> <strong>in</strong> the<br />
Agri-<strong>Food</strong> Sector, 1-4 Oct <strong>2012</strong><br />
were estimated accord<strong>in</strong>g to IPCC guidel<strong>in</strong>es 2006 (IPCC, 2006). The N content <strong>in</strong> applied manure was<br />
measured <strong>in</strong> the experiment. The diesel and energy consumption was based on the operations <strong>in</strong> the experiment.<br />
GHG emissions related to diesel and energy consumption was based on data from the Eco<strong>in</strong>vent database<br />
(Eco<strong>in</strong>vent Centre, 2009).<br />
Direct and <strong>in</strong>direct emissions of nitrous oxide (N2O) were estimated accord<strong>in</strong>g to the IPCC guidel<strong>in</strong>es<br />
2006 (IPCC, 2006). N leach<strong>in</strong>g was based on measurements <strong>in</strong> the experiment as reported by Askegaard <strong>et</strong><br />
al., (2011). The greenhouse gas emissions and characterisation factors were based on IPCC 2007 standards<br />
(IPCC, 2007).<br />
2.2 Allocation of environmental burden <strong>in</strong> crop rotations and soil C change<br />
At the agricultural production stage, the crops are <strong>in</strong>terl<strong>in</strong>ked <strong>in</strong> the organic crop rotations s<strong>in</strong>ce the yields<br />
of the sales crops depend on the recycl<strong>in</strong>g of nitrogen (and carbon) from the green manure crop through its<br />
effects on soil fertility. Thus, the environmental impacts from the green manure crops need to be <strong>in</strong>cluded <strong>in</strong><br />
the carbon footpr<strong>in</strong>t of the sales crops. Two approaches are used <strong>in</strong> the present paper:<br />
A) Assessment of the full crop rotation: The full crop rotation was assessed as a ‘black box’,<br />
where the emissions where based on all the <strong>in</strong>puts used for the crop rotation and related to the<br />
total sales crop DM yield from the crop rotation. This approach is represented by the dotted<br />
l<strong>in</strong>e surround<strong>in</strong>g the full crop rotation <strong>in</strong> Figure 2. Thus, the emissions from the green manure<br />
crop are <strong>in</strong>cluded, but the carbon footpr<strong>in</strong>t result can only be estimated as an average over the<br />
full crop rotation per kg DM.<br />
B) Assessment of s<strong>in</strong>gle crops: allows to estimate carbon footpr<strong>in</strong>t results of the s<strong>in</strong>gle crops <strong>in</strong><br />
the crop rotation (e.g. for spr<strong>in</strong>g barley). However, <strong>in</strong> this approach it is assumed that the environmental<br />
burdens and benefits from green manure crops (<strong>in</strong>cl. soil carbon changes) and catch<br />
crops are divided equally among the other sales crops <strong>in</strong> the crop rotation on an area basis. The<br />
carbon <strong>in</strong>put and N2O emissions from organic (and m<strong>in</strong>eral) fertilisers were allocated to the<br />
specific crops that received the fertiliser. Likewise, carbon <strong>in</strong>put and N2O emissions from the<br />
above and below ground crop residues from the ma<strong>in</strong> crops were allocated to the specific ma<strong>in</strong><br />
crop. The carbon <strong>in</strong>put and N2O emissions from the above and below ground crop residues<br />
from the catch crops and green manure crops were allocated equally on the crops <strong>in</strong> the crop<br />
rotation on a per hectare basis.<br />
Long-term soil carbon changes were <strong>in</strong>cluded <strong>in</strong> the study based on recorded carbon <strong>in</strong>puts from manure<br />
and estimated above and below ground crop residues (based on measured yields and IPCC guidel<strong>in</strong>es 2006<br />
(IPCC, 2006)) from ma<strong>in</strong> crops, catch crops and green manure crops. It was assumed that the conventional<br />
crop rotation would be the po<strong>in</strong>t of departure – and thus the relative soil carbon changes from the conventional<br />
crop rotation were estimated <strong>in</strong> a 100 years perspective. The relative difference relative to the conventional<br />
crop rotation <strong>in</strong> total carbon <strong>in</strong>put was calculated for each organic scenario. It was then assumed that<br />
approx. 10% of the surplus of carbon would be sequestered (P<strong>et</strong>ersen <strong>et</strong> al., 2011, Christensen 1986).<br />
2.3 Statistical analysis<br />
Statistical analyses by Proc Mixed were performed us<strong>in</strong>g SAS software. The carbon footpr<strong>in</strong>t values for<br />
the full crop rotation were estimated for each of the four treatments, three locations, two blocks and three<br />
years. The model <strong>in</strong>cluded treatment and location as ma<strong>in</strong> effects and year and blocks as random effects. The<br />
significant difference b<strong>et</strong>ween treatments was estimated us<strong>in</strong>g the Tukey’s Studentized range test with Pf<br />
0.05 if a ma<strong>in</strong> effect or <strong>in</strong>teraction was significant. The carbon footpr<strong>in</strong>t results are shown as an average over<br />
the years due to non-significant differences b<strong>et</strong>ween the three years.<br />
3. Results<br />
The analysis of the full crop rotation showed no significant difference <strong>in</strong> carbon footpr<strong>in</strong>t of sales crops<br />
b<strong>et</strong>ween the different crop rotations (Fig. 3). The higher N2O emissions from grass-clover <strong>in</strong> the ‘Mulch<strong>in</strong>g’<br />
rotation were counteracted by a higher soil carbon sequestration. The ‘No <strong>in</strong>put’ rotation had lower yields<br />
and a negative soil carbon sequestration, which <strong>in</strong>creased the carbon footpr<strong>in</strong>t of the sales crop from this<br />
rotation (Fig. 3).<br />
370
PARALLEL SESSION 4A: CARBON FOOTPRINT 8 th Int. Conference on <strong>LCA</strong> <strong>in</strong> the<br />
Agri-<strong>Food</strong> Sector, 1-4 Oct <strong>2012</strong><br />
Greenhouse gas emissions<br />
(g CO2 eq. kg-1 crop DM)<br />
500<br />
400<br />
300<br />
200<br />
100<br />
0<br />
Mulch<strong>in</strong>g No <strong>in</strong>put Slurry Conventional<br />
Figure 3. Carbon footpr<strong>in</strong>ts per kg sales crop DM at farm gate based on the full crop rotations 2006-8. The<br />
values are the means over the three years ± S.E.<br />
The analysis of the <strong>in</strong>dividual crops provided a specific carbon footpr<strong>in</strong>t value of e.g. spr<strong>in</strong>g barley grown<br />
<strong>in</strong> the different crop rotations (Figure 4). Figure 4 shows that the carbon footpr<strong>in</strong>t values for e.g. spr<strong>in</strong>g barley<br />
grown <strong>in</strong> the ‘Mulch<strong>in</strong>g’ rotation was affected by the soil carbon sequestration and the N2O emissions<br />
caused by the green manure crop compared to the ‘Slurry’ or ‘Conventional’ rotations. These f<strong>in</strong>d<strong>in</strong>gs show<br />
that the contributions caused by the green manure crop to the carbon footpr<strong>in</strong>t of the organic crops are considerable.<br />
Mulch<strong>in</strong>g<br />
No <strong>in</strong>put<br />
Slurry<br />
Conventional<br />
-400 -200 0 200 400 600<br />
SPRING BARLEY<br />
2006-2008<br />
Manure <strong>in</strong>put<br />
N2O, ma<strong>in</strong> crop<br />
N2O, grass-clover<br />
N2O, catch crop<br />
Diesel and mach<strong>in</strong>ery, ma<strong>in</strong> crop<br />
Diesel and mach<strong>in</strong>ery, grass clover<br />
Soil C change<br />
Greenhouse gas emissions per kg spr<strong>in</strong>g barley<br />
(g CO2 eq. kg<br />
Figure 4. Carbon footpr<strong>in</strong>ts of spr<strong>in</strong>g barley at farm gate <strong>in</strong> the different crop rotations 2006-8. The values<br />
are the means over the three locations and three years (2006-8).<br />
-1 spr<strong>in</strong>g barley)<br />
4. Discussion<br />
When calculat<strong>in</strong>g the carbon footpr<strong>in</strong>t of crops from crop rotations where green manure crops or catch<br />
crops are <strong>in</strong>cluded, there is a need to <strong>in</strong>clude the environmental burdens and benefits from the green manure<br />
or catch crops and thus <strong>in</strong>clude the full crop rotation <strong>in</strong> the assessment.<br />
One solution, as suggested here, is to assess the full crop rotation as a ‘black box’ based on kg sales crop<br />
DM from the different crops. The analysis over the whole rotation can be used to judge on different rotation<br />
designs. The evaluation could be based on kg DM, as suggested here or be related to the functions of agriculture<br />
as discussed by Nemecek <strong>et</strong> al., (2011). Another option is to use a functional unit that reflects the di<strong>et</strong>ary<br />
needs by humans as discussed by Smedman <strong>et</strong> al., (2010).<br />
However, there is a need for carbon footpr<strong>in</strong>t values for the specific crops. Furthermore, the full crop rotation<br />
implies several crop specific <strong>in</strong>puts and several outputs i.e. different sales crops from the rotation,<br />
371
PARALLEL SESSION 4A: CARBON FOOTPRINT 8 th Int. Conference on <strong>LCA</strong> <strong>in</strong> the<br />
Agri-<strong>Food</strong> Sector, 1-4 Oct <strong>2012</strong><br />
which should be <strong>in</strong>cluded <strong>in</strong> the assessment s<strong>in</strong>ce these <strong>in</strong>puts might be very different b<strong>et</strong>ween crops. Thus,<br />
the environmental burdens and benefits need to be divided and allocated to the specific crops. Accord<strong>in</strong>g to<br />
the ISO standards for <strong>LCA</strong> (ISO 14040 and 14044) allocation ‘...wherever possible should be avoided by<br />
divid<strong>in</strong>g the unit process <strong>in</strong> two or more sub processes...’. In a conventional crop rotation, this is often no<br />
problem and the analysis can be focused on the crop specific <strong>in</strong>puts and outputs i.e. crop yields. Likewise, <strong>in</strong><br />
simple organic rotations without green manure and catch crops (Knudsen <strong>et</strong> al., 2010) or organic perennial<br />
crops, that do not imply other crops (Knudsen <strong>et</strong> al., 2011), it is possible to focus on the specific crop. The<br />
advantage of this approach is that the crop-specific <strong>in</strong>puts will be reflected <strong>in</strong> the carbon footpr<strong>in</strong>t of the<br />
crop, such as e.g. high diesel consumption <strong>in</strong> the potatoes. If it is not possible to subdivide the unit process,<br />
i.e. the crop rotation, and economic or mass allocation is performed to allocate the environmental burden<br />
among the different sales crops, the crop specific <strong>in</strong>puts would not be reflected. This would mean that e.g.<br />
high diesel consumption <strong>in</strong> the potatoes, would also burden the e.g. spr<strong>in</strong>g barley that happens to be grown <strong>in</strong><br />
the same crop rotation.<br />
Therefore, <strong>in</strong> order to calculate carbon footpr<strong>in</strong>t values for the specific crops, we recommend subdivid<strong>in</strong>g<br />
the crop rotation <strong>in</strong> the specific crop productions. The challenge is then how to divide the environmental<br />
burdens and benefits from the green manure and catch crops. This could be done either on a per hectare basis<br />
or based on the N residual effect. The last approach would have the theor<strong>et</strong>ical advantage that the crop follow<strong>in</strong>g<br />
the green manure crop, here: potatoes, which might benefit more from the N <strong>in</strong> the green manure<br />
residues would also bear a higher share of the burden. However, the disadvantage is that exact numbers of<br />
the residual effect are needed and those would differ from study to study and <strong>in</strong>crease the uncerta<strong>in</strong>ty. Furthermore,<br />
the beneficial residual effect is not only caused by N but also carbon (C) with an <strong>in</strong>creased soil<br />
carbon level, which affects all of the crops <strong>in</strong> the crop rotation equally. Therefore, we recommend divid<strong>in</strong>g<br />
the environmental burdens and benefits from these green manure and catch crops equally on the hectares<br />
used for sales crops <strong>in</strong> the crop rotation.<br />
The study shows that both the carbon footpr<strong>in</strong>t results based on the full crop rotation and the results for<br />
the specific crops would had been very different if the environmental burden from the green manure and<br />
catch crops and the soil carbon changes had not been <strong>in</strong>cluded.<br />
5. Conclusion<br />
In conclusion, the study highlights the importance of analys<strong>in</strong>g the whole crop rotation and <strong>in</strong>clud<strong>in</strong>g soil<br />
carbon changes when estimat<strong>in</strong>g carbon footpr<strong>in</strong>ts of organic crops especially where green manure crops are<br />
<strong>in</strong>cluded. Two m<strong>et</strong>hods were presented, which enable an <strong>in</strong>tegration of green manure crops and catch crops<br />
<strong>in</strong> the overall analysis. The analysis over the whole rotation should be used to judge on different rotation<br />
designs. In order to calculate carbon footpr<strong>in</strong>t values for the specific crops, it is recommended to <strong>in</strong>clude the<br />
environmental impacts from green manure and catch crops equally on the hectares used for sales crops <strong>in</strong> the<br />
crop rotation.<br />
6. References<br />
Askegaard M, Olesen JE, Rasmussen IA, Kristensen K (2011) Nitrate leach<strong>in</strong>g from organic arable crop rotations is mostly d<strong>et</strong>erm<strong>in</strong>ed<br />
by autumn field management. Agriculture, Ecosystems & Environment 142(3–4): 149–160<br />
Christensen BT (1986) Straw <strong>in</strong>corporation and soil organic matter <strong>in</strong> macro-aggregates and particle size separates. Journal of Soil<br />
Science 37: 125-135<br />
FAO (2011) Organic agriculture and climate change mitigation. A report of the Round Table on Organic Agriculture and Climate<br />
Change. December 2011, Rome, Italy.<br />
Eco<strong>in</strong>vent Centre. 2009. Eco<strong>in</strong>vent Database v.2.0. Swiss Centre for Life Cycle Inventories. Onl<strong>in</strong>e at: http://www.eco<strong>in</strong>vent.org/ .<br />
IPCC (2006) 2006 IPCC Guidel<strong>in</strong>es for National Greenhouse Gas Inventories. Intergovernmental Panel of Climate Change (IPCC),<br />
National Greenhouse Gas Inventories Programme. Onl<strong>in</strong>e at: http://www.ipcc-nggip.iges.or.jp/public/2006gl/<strong>in</strong>dex.html<br />
IPCC (2007) Climate Change 2007: the physical science basis. In: Solomon, S., Q<strong>in</strong>, D., Mann<strong>in</strong>g, M., Chen, Z., Marquis, M., Averyt,<br />
K.B., Tignor, M., Miller, H.L. (Eds.) Contribution of Work<strong>in</strong>g Group I to the Fourth Assessment Report of the Intergovernmental<br />
Panel on Climate Change. Cambridge University Press, Cambridge, United K<strong>in</strong>gdom and New York, NY, USA 996 p.<br />
Knudsen MT, Yu-Hui Q, Yan L, Halberg N (2010) Environmental assessment of organic soybean (Glyc<strong>in</strong>e max.) imported from<br />
Ch<strong>in</strong>a to Denmark: a case study. Journal of Cleaner Production 18:1431–1439<br />
Knudsen MT, de Almeida GF, Langer V, de Abreu LS and Halberg N. 2011. Environmental assessment of organic juice imported to<br />
Denmark: a case study on oranges (Citrus s<strong>in</strong>ensis) from Brazil. Organic Agriculture 1: 167-185<br />
Nemecek T, Dubois D, Huguen<strong>in</strong>-Elie O, Gaillard G (2011) Life cycle assessment of Swiss farm<strong>in</strong>g systems: I. Integrated and organic<br />
farm<strong>in</strong>g. Agricultural Systems 104: 217-232<br />
P<strong>et</strong>ersen BM, Knudsen MT, Hermansen JE, Halberg N (2011) A m<strong>et</strong>hodological approach to <strong>in</strong>clude soil carbon changes <strong>in</strong> life<br />
cycle assessments. In Knudsen (2011) Environmental assessment of imported organic products – focus<strong>in</strong>g on orange juice from<br />
Brazil and soybeans from Ch<strong>in</strong>a. ISBN 978-87-7611-408-4.<br />
Smedman A, L<strong>in</strong>dmark-Månsson H, Drewnowski A, Edman A-KM (2010) Nutrient density of beverages <strong>in</strong> relation to climate impact.<br />
<strong>Food</strong> and Nutritional Research, 54: 5170. DOI: 10.3402/fnr.v54i0.5170.<br />
372
PARALLEL SESSION 4A: CARBON FOOTPRINT 8 th Int. Conference on <strong>LCA</strong> <strong>in</strong> the<br />
Agri-<strong>Food</strong> Sector, 1-4 Oct <strong>2012</strong><br />
The carbon footpr<strong>in</strong>t of Brazilian canary melon<br />
Maria Cléa Brito de Figueirêdo 1,* , Imke J.M. de Boer 2 , Carolien Kroeze 3 , José Pott<strong>in</strong>g 3 , Viviane da Silva<br />
Barros 1 , Fernando Aragão 1 , Rubens Sonsol Gondim 1<br />
1 Embrapa Tropical Agro<strong>in</strong>dustry, Ceará, Brazil<br />
2 Animal Production Systems Group, Wagen<strong>in</strong>gen University, the N<strong>et</strong>herlands<br />
3 Environmental System Analysis Group, Wagen<strong>in</strong>gen University, the N<strong>et</strong>herlands<br />
* Correspond<strong>in</strong>g author. E-mail: mariacleabrito@gmail.com<br />
ABSTRACT<br />
Emission of greenhouse gases (GHG) is an environmental concern that has been the focus of food producers and consumers worldwide.<br />
The objective of this study, therefore, is to quantify GHG emissions along the production cha<strong>in</strong> of Brazilian melon, and, to<br />
identify improvement options. The product system encompasses (i) upstream processes, i.e. the production and transport of <strong>in</strong>puts,<br />
such as seeds, pesticides, diesel and plastics, (ii) melon processes <strong>in</strong> the Low Jaguaribe and Açu region, i.e. the production of seedl<strong>in</strong>gs,<br />
melons and pack<strong>in</strong>g, and (iii) downstream processes, i.e. transport of melons to Europe and solid waste disposal. The functional<br />
unit is one tonne of exported canary melon. Primary data related to <strong>in</strong>puts and solid waste generation was obta<strong>in</strong>ed from farmers<br />
and researchers at the Brazilian Agriculture Research Corporation (Embrapa) - Tropical Agro<strong>in</strong>dustry branch, through a structured<br />
questionnaire, dur<strong>in</strong>g the first semester of 2011. The emissions of carbon dioxide, nitrous oxide and m<strong>et</strong>hane are estimated<br />
from the amount of <strong>in</strong>put used <strong>in</strong> different activities, apply<strong>in</strong>g emission factors proposed by IPCC and Brazilian GHG Inventories.<br />
GHG emissions from melon processes <strong>in</strong> the Low Jaguaribe and Açu region are considered, regard<strong>in</strong>g the follow<strong>in</strong>g activities: land<br />
use change (biomass loss, with cutt<strong>in</strong>g and burn<strong>in</strong>g, and soil organic matter m<strong>in</strong>eralisation); nitrogen fertilisation (<strong>in</strong>clud<strong>in</strong>g <strong>in</strong>corporation<br />
of field residues <strong>in</strong> soils); and fossil fuel combustion by tractors. The impact on climate change is calculated <strong>in</strong> CO2equivalentes,<br />
consider<strong>in</strong>g the global warm<strong>in</strong>g potential of GHG <strong>in</strong> a time period of 100 years. GHG emissions from upstream and<br />
downstream processes are ma<strong>in</strong>ly taken from the Eco<strong>in</strong>vent database. Consider<strong>in</strong>g all processes and the uncerta<strong>in</strong>ty <strong>in</strong> measurements,<br />
the total impact on climate change of canary melon, up to their distribution <strong>in</strong> the European mark<strong>et</strong>, can reach 710 kg CO 2-eq/t<br />
melon. Indirect emissions, from the production of <strong>in</strong>puts and transports, exceeded direct emissions from melon processes located <strong>in</strong><br />
the Low Jaguaribe and Açu region. The major melon process <strong>in</strong> this region contribut<strong>in</strong>g to GHG emission is crop production,<br />
whereas the major upstream and downstream processes were fertiliser and plastic production. Moreover, scenario analyses showed<br />
that the carbon footpr<strong>in</strong>t of canary melon can be reduced by 24% if melon fields are located <strong>in</strong> former agricultural areas and by 6% if<br />
nitrogen fertilisation is reduced to best practice levels <strong>in</strong> crop production. The results of this study may support Brazilian melon<br />
producers when account<strong>in</strong>g melon carbon footpr<strong>in</strong>t and decid<strong>in</strong>g about which management practices use to reduce it.<br />
Keywords: canary melon, Brazil, carbon footpr<strong>in</strong>t, climate change<br />
1. Introduction<br />
Melon (Cucumis melo L.) is a cucurbit crop, whose fruit is rich <strong>in</strong> vitam<strong>in</strong>s, m<strong>in</strong>erals, and has low calorie<br />
content. It is produced mostly <strong>in</strong> tropical regions, and subsequently exported across the world. The high<br />
lum<strong>in</strong>osity (about to 3,000 h/year) tog<strong>et</strong>her with the low precipitation rate (from August to December) and<br />
humidity constitute excellent conditions for melon production (Silva and Costa, 2003).<br />
Brazil was the second largest world melon exporter <strong>in</strong> 2010 (FAO, 2011). The ma<strong>in</strong> export<strong>in</strong>g melon<br />
producers <strong>in</strong> Brazil are clustered <strong>in</strong> the Low Jaguaribe and Açu region, <strong>in</strong> the Northeast States of Ceará and<br />
Rio Grande do Norte. In 2009, melon production <strong>in</strong> this region contributed to 99% of the country melon<br />
exports (MDIC, 2011). From 1999 to 2009, the area cultivated with melon <strong>in</strong> this region <strong>in</strong>creased more than<br />
60% (IBGE, 2011).<br />
The type of melon commonly produced and exported belongs to the Cucumis melo <strong>in</strong>odorous Naud<br />
group, popularly known as canary yellow melon (Silva and Costa, 2003). Melon production occurs <strong>in</strong> open<br />
fields and relies on drip irrigation and fertirrigation (i.e. application of soluble fertiliser through an irrigation<br />
system). Fertirrigation is required because of <strong>in</strong>significant ra<strong>in</strong>fall dur<strong>in</strong>g the production period (from July to<br />
December) (Miranda <strong>et</strong> al., 2008) and a low nutrient content of soils (Crisóstomo <strong>et</strong> al., 2002).<br />
The release of new requirements related to carbon footpr<strong>in</strong>t (CF) certification has raised the attention of<br />
Brazilian melon producers. Examples of CF protocols are PAS 2050 (BSI, 2011) and the Product Life Cycle<br />
Account<strong>in</strong>g and Report<strong>in</strong>g Standard (WRI, WBCSD 2011). These standards consider emissions from<br />
processes related to the life cycle of a product, and facilitate identification of improvement options through<br />
product value cha<strong>in</strong>s. Accord<strong>in</strong>g to Pandey <strong>et</strong> al., (2011), the CF of a product is def<strong>in</strong>ed as the amount of<br />
GHGs expressed <strong>in</strong> terms of CO2-eq or CO2-equivalents emitted by that product dur<strong>in</strong>g its life cycle, with<br />
specific system boundaries.<br />
So far, few studies have assessed the CF of melon. Audsley <strong>et</strong> al., (2009) quantified the CF of melon<br />
produced <strong>in</strong>- and outside Europe <strong>in</strong> general terms, us<strong>in</strong>g proxy values from exist<strong>in</strong>g data related to similar<br />
food products. Cellura <strong>et</strong> al., (<strong>2012</strong>) quantified the CF of Italian melon produced <strong>in</strong> pavilion and tunnel<br />
greenhouses <strong>in</strong> a Sicilian agricultural district. These studies, however, do not address melon production <strong>in</strong><br />
tropical countries such as the mark<strong>et</strong>-leader Brazil. They did not look <strong>in</strong>to the emission reduction potential of<br />
373
PARALLEL SESSION 4A: CARBON FOOTPRINT 8 th Int. Conference on <strong>LCA</strong> <strong>in</strong> the<br />
Agri-<strong>Food</strong> Sector, 1-4 Oct <strong>2012</strong><br />
possible improvement options nor analyse the uncerta<strong>in</strong>ties <strong>in</strong> the CF calculations of melons planted <strong>in</strong> open<br />
fields.<br />
Our objectives, therefore, are to assess the CF of Brazilian exported canary melon, consider<strong>in</strong>g the<br />
uncerta<strong>in</strong>ties <strong>in</strong> the GHG emissions, and to evaluate reduction potentials of improvement options. Results<br />
give melon producers <strong>in</strong>sight <strong>in</strong> the CF of their product, and <strong>in</strong> potential options to reduce it.<br />
2. M<strong>et</strong>hods<br />
This study is based on life cycle assessment (<strong>LCA</strong>), accord<strong>in</strong>g to ISO (ISO 14040 and 14044, 2006a,<br />
2006b), but focuses on climate change.<br />
2.1 System boundary and functional unit<br />
The system boundary <strong>in</strong>cludes (i) upstream processes, i.e. the production and transport of <strong>in</strong>puts (seeds,<br />
pesticides, fertilisers, coconut substrate, clean<strong>in</strong>g materials, diesel, paper and plastics), (ii) melon processes<br />
<strong>in</strong> the Low Jaguaribe and Açu region, i.e. the production of seedl<strong>in</strong>gs, melons and pack<strong>in</strong>g, and (iii) downstream<br />
processes, i.e. transport of melons to Europe and solid waste disposal. Melon distribution by European<br />
r<strong>et</strong>ailers and the f<strong>in</strong>al consumption are outside the scope of this study.<br />
The functional unit is one tonne of exported canary melon. Allocation of <strong>in</strong>puts and outputs is performed<br />
based on the mark<strong>et</strong> price of exported and nationally commercialised melons, consider<strong>in</strong>g that 99% of total<br />
revenue is due to exported melons.<br />
2.2 Data collection<br />
Primary data related to seedl<strong>in</strong>g, plant production and melon pack<strong>in</strong>g was collected at production units <strong>in</strong><br />
the Jaguaribe/Açu region, us<strong>in</strong>g a structured questionnaire. As seed production occurs outside Brazil, data<br />
was collected from an experimental seed greenhouse, ma<strong>in</strong>ta<strong>in</strong>ed by the Brazilian Agriculture Research Corporation<br />
(Embrapa). Data from the production of coconut substrate were obta<strong>in</strong>ed from Figueirêdo <strong>et</strong> al.,<br />
(2009). Data regard<strong>in</strong>g the other processes of the product system was obta<strong>in</strong>ed from Eco<strong>in</strong>vent (Frischknecht<br />
and Jungbluth, 2007). The amount of <strong>in</strong>puts and solid wastes related to melon processes is presented <strong>in</strong> Table<br />
1.<br />
Table 1. Primary data related to one tonne of exported melon, obta<strong>in</strong>ed from farms and compl<strong>et</strong>ed with experimental<br />
data from a melon seed greenhouse.<br />
Unit per produc-<br />
Seedl<strong>in</strong>g pro-<br />
Inputs and outputs<br />
tion unit Seed production<br />
duction Crop production Melon pack<strong>in</strong>g<br />
Area m 2 0.30 0.01 441.92 0.52<br />
Seed g 0.08 33.66 0.00 0.00<br />
Seedl<strong>in</strong>g g 9.03 0.00 2.471.75 0.00<br />
Coconut substrate g 1,011.11 3,564.00 0.00 0.00<br />
Water L 0.09 0.06 186.05 0.15<br />
Electricity kWh 11.49 0.46 72.60 18.15<br />
Diesel g 0.00 0.00 7,207.20 0.00<br />
Clean<strong>in</strong>g products g 0.00 0.00 0.00 648.10<br />
Plastics g 73.27 519.31 38,008.36 659.01<br />
Papers g 0.00 0.00 0.00 58,495.80<br />
Wood (pall<strong>et</strong>s)<br />
Fertilisers<br />
g 0.00 0.00 0.00 11,965.80<br />
Organic compost g 0.00 0.00 123,684.66 0.00<br />
N g 4.05 1.65 5,548.72 0.00<br />
P2O5 g 0.59 1.65 6,660.24 0.00<br />
K2O g 7.47 0.00 9,613.66 0.00<br />
Others<br />
Pesticides<br />
g 3.98 0.00 2,347.80 0.00<br />
Insecticide g 1.28 0.01 765.72 0.00<br />
Fungicide g 0.55 0.02 480.19 2.66<br />
Herbicide<br />
Solid waste<br />
g 0.46 0.00 0.00 0.00<br />
plastic g 66.01 523.47 38,008.36 0.00<br />
empty pesticide packages g 0.16 0.00 643.50 0.31<br />
374
PARALLEL SESSION 4A: CARBON FOOTPRINT 8 th Int. Conference on <strong>LCA</strong> <strong>in</strong> the<br />
Agri-<strong>Food</strong> Sector, 1-4 Oct <strong>2012</strong><br />
2.3 Estimation of GHG emissions<br />
To estimate GHG <strong>in</strong> seed, seedl<strong>in</strong>g, melon production and pack<strong>in</strong>g, the follow<strong>in</strong>g activities are <strong>in</strong>cluded:<br />
land use change (i.e. biomass loss from cutt<strong>in</strong>g and burn<strong>in</strong>g, and soil organic matter m<strong>in</strong>eralisation); nitrogen<br />
fertilisation (<strong>in</strong>clud<strong>in</strong>g <strong>in</strong>corporation of field residues <strong>in</strong> soils); and fossil fuel combustion by tractors. These<br />
activities may release CO2, CH4 and N2O. These GHG are estimated consider<strong>in</strong>g climate and soil characteristics<br />
of the Jaguaribe/Açu region, apply<strong>in</strong>g emission factors proposed by IPCC (2006). Carbon storage <strong>in</strong><br />
biomass and soil were accord<strong>in</strong>g to the Brazilian GHG Inventory (MCT, 2010).<br />
GHG emissions from production of other <strong>in</strong>puts (agrochemicals, diesel, electricity, substrates and clean<strong>in</strong>g<br />
materials), from transport of <strong>in</strong>puts and melons, and from f<strong>in</strong>al disposal of solid wastes were accounted<br />
us<strong>in</strong>g the Eco<strong>in</strong>vent database (Frischknecht and Jungbluth, 2007). Emissions from the production of coconut<br />
substrate were estimated based on Figueirêdo <strong>et</strong> al., (2009).<br />
2.4 Impact assessment<br />
The CF of each process is quantified consider<strong>in</strong>g the mass (kg) of GHG emitted <strong>in</strong> each activity and their<br />
respective GWP, over a timeframe of 100 years, accord<strong>in</strong>g to IPCC (2007). The CF of canary melon is the<br />
sum of the footpr<strong>in</strong>ts of all processes that <strong>in</strong>tegrate this product system apply<strong>in</strong>g economic allocation ratios<br />
for co-products.<br />
2.5 Scenario and uncerta<strong>in</strong>ty analysis<br />
A reference situation is def<strong>in</strong>ed to quantify the use of <strong>in</strong>puts, generation of solid wastes, GHG emissions,<br />
and CF of the canary melon. This reference situation has the follow<strong>in</strong>g characteristics: i) the average amount<br />
of nitrogen fertiliser applied <strong>in</strong> melon production fields is 6 kg N/t melon and ii) savannah (Caat<strong>in</strong>ga) forests<br />
previously occupied the area where seedl<strong>in</strong>g and melon production currently takes place, as well as where<br />
pack<strong>in</strong>g houses are now located (i.e. forest cutt<strong>in</strong>g and burn<strong>in</strong>g occurred just before melon fields were established),<br />
less than 20 years ago.<br />
GHG emissions may vary among farms depend<strong>in</strong>g on farm practices. We, therefore, performed a sensitivity<br />
analysis to test the sensitivity of the CF calculated <strong>in</strong> the reference situation to variations <strong>in</strong> the production<br />
process. The most important variations <strong>in</strong> production practices <strong>in</strong> melon farms that potentially change<br />
GHG emissions are related to issues i) to ii), formerly described. These variations are used to def<strong>in</strong>e five<br />
different scenarios: 1) the amount of nitrogen fertiliser applied <strong>in</strong> melon fields is 4 kg N/t, as suggested by<br />
previous study <strong>in</strong> the study area (Crisóstomo <strong>et</strong> al., 2002) and 2) previous land use was agricultural land area.<br />
The CF was calculated for each scenario, consider<strong>in</strong>g the average yield of 23 t/ha <strong>in</strong> crop production. In<br />
addition, the uncerta<strong>in</strong>ty <strong>in</strong> each scenario was analysed us<strong>in</strong>g Monte Carlo analysis, assum<strong>in</strong>g log normal<br />
distributions of probability functions. The Pedigree matrix was used to d<strong>et</strong>erm<strong>in</strong>e the deviations of each param<strong>et</strong>er<br />
(Goedkoop <strong>et</strong> al., 2008).<br />
3. Results and discussion<br />
3.1 GHG emissions<br />
The export of one ton of canary melon generates the average total amount of 509 g of CO2, 1,430 g of<br />
CH4, 482 g of N2O and 30 g of other GHG (Table 2). Land conversion (from Caat<strong>in</strong>ga veg<strong>et</strong>ation to melon<br />
production fields) is a major source of CO2 emissions <strong>in</strong> melon processes. Nitrous oxide and m<strong>et</strong>hane emissions<br />
ma<strong>in</strong>ly occur <strong>in</strong> the production of fertilisers that are applied <strong>in</strong> melon fields.<br />
The overall emission from upstream and downstream processes is higher than the overall emissions from<br />
melon processes at the Jaguaribe and Açu region. Upstream and downstream processes tog<strong>et</strong>her contribute<br />
63% of CO2, 85% of CH4, 55% of N2O and 100% of all other GHG emissions.<br />
Consider<strong>in</strong>g <strong>in</strong>dividual processes <strong>in</strong> the canary melon cha<strong>in</strong>, however, plant production generates the<br />
largest emissions of CO2 (37%). The production of fertilisers is the largest source of CH4 (71%) and N2O<br />
(53%).<br />
375
PARALLEL SESSION 4A: CARBON FOOTPRINT 8 th Int. Conference on <strong>LCA</strong> <strong>in</strong> the<br />
Agri-<strong>Food</strong> Sector, 1-4 Oct <strong>2012</strong><br />
Table 2. Estimated GHG greenhouse of one tonne of exported canary melon <strong>in</strong> the reference situation.<br />
Processes CO2 (g) % CH4 (g) % N2O (g) % Other GHG (g) %<br />
Seedl<strong>in</strong>g 3.96 0% 0.01 0% 0.04 0% 0.00 0%<br />
Cropp<strong>in</strong>g 187,375.32 37% 215.82 15% 217.80 45% 0.00 0%<br />
Pack<strong>in</strong>g 201.96 0% 0.30 0% 0.03 0% 0.00 0%<br />
Total melon processes<br />
(Jaguaribe and Açu region) 187,581.24 37% 216.13 15% 217.87 45% 0.00 0%<br />
Seed production 106.92 0% 0.10 0% 0.10 0% 0.00 0%<br />
Transport of melon BR-NL 60,100.17 12% 0.35 0% 1.73 0% 67.67 0%<br />
Paper production 52,058.96 10% 5.78 0% 3.70 1% 109.22 0%<br />
Plastic production 89,301.73 18% 2.39 0% 0.97 0% 496.99 2%<br />
Production of fertilisers 47,570.40 9% 1,013.54 71% 253.68 53% 2,378.72 8%<br />
Production and distribution of<br />
electricity 17,885.73 4% 167.78 12% 0.81 0% 16.97 0%<br />
Transport of materials to<br />
farms 22,544.48 4% 0.14 0% 0.63 0% 23.32 0%<br />
Other processes 32,269.12 6% 23.98 2% 2.79 1% 27,144.80 90%<br />
Total upstream and downstream<br />
processes 321,837.51 63% 1,214.05 85% 264.42 55% 30,237.70 100%<br />
Total emissions 509,418.75 100% 1,430.18 100% 482.29 100% 30,237.70 100%<br />
3.2 CF <strong>in</strong> the reference situation and alternative scenarios<br />
The average CF of canary melon <strong>in</strong> the reference situation is 710 kg CO2-eq/t exported melon (Figure 1),<br />
rang<strong>in</strong>g from 632 to 787 kg CO2-eq/t melon. Among all processes <strong>in</strong> the product system, crop production has<br />
a relatively large share <strong>in</strong> the CF <strong>in</strong> most of the scenarios.<br />
Figure 1. Canary melon CFs by scenario, <strong>in</strong>clud<strong>in</strong>g estimated uncerta<strong>in</strong>ty.<br />
The average CF value is reduced by 6% if the nitrogen application is brought down from 6 to 4 kg N/t of<br />
melon (scenario 1). Locat<strong>in</strong>g melon processes <strong>in</strong> the Low Jaguaribe/Açu region <strong>in</strong> former agricultural areas<br />
reduces CF by 24% (scenario 2).<br />
The distances b<strong>et</strong>ween <strong>in</strong>put production sites and melon fields and pack<strong>in</strong>g houses and the transport of<br />
melons from Brazil to The N<strong>et</strong>herlands are considerable. However, <strong>in</strong> none of the scenarios the GHG emissions<br />
from transportation make a large contribution to the CF of canary melon.<br />
Uncerta<strong>in</strong>ty regard<strong>in</strong>g CF values ma<strong>in</strong>ly concerns variations <strong>in</strong> carbon fractions of veg<strong>et</strong>ation types and<br />
soil, <strong>in</strong> GHG emission factors and <strong>in</strong> transport distances. The carbon fraction of Savannah was estimated by<br />
MCT (2010), vary<strong>in</strong>g accord<strong>in</strong>g to local physiognomies. The soil carbon content varies accord<strong>in</strong>g to soil<br />
types that may be found <strong>in</strong> the studied region (low clay activity, high clay activity and sandy soils). Emission<br />
factors used to estimate GHG emissions were accord<strong>in</strong>g to IPCC (2006) and may be two times more or less<br />
the average value (factors for nitrous oxide vary from -70% to +300%). Distances from sites where materials<br />
and fuels are produced to melon farms and pack<strong>in</strong>g houses may also vary from farm to farm. The estimation<br />
376
PARALLEL SESSION 4A: CARBON FOOTPRINT 8 th Int. Conference on <strong>LCA</strong> <strong>in</strong> the<br />
Agri-<strong>Food</strong> Sector, 1-4 Oct <strong>2012</strong><br />
of these distances consider<strong>in</strong>g major export<strong>in</strong>g countries or national states is just an approximation of the real<br />
distances.<br />
The CF result of 710 kg CO2-eq/t of exported canary melon from the Low Jaguaribe/Açu region <strong>in</strong> the<br />
reference scenario is low compared to results reported <strong>in</strong> earlier studies (Cellura <strong>et</strong> al., <strong>2012</strong>). The average<br />
CF of Italian melon cultivated <strong>in</strong> greenhouses <strong>in</strong> southern Sicilia was 1,427 kg CO2-eq/t melon (Cellura <strong>et</strong><br />
al., <strong>2012</strong>). Ma<strong>in</strong> differences <strong>in</strong> melon production systems refer to the total amount of agrochemicals, plastics<br />
(greenhouses) and fuels used by Italian producers.<br />
4. Conclusion<br />
The CF for Brazilian canary melon <strong>in</strong> the reference situation is 710 kg CO2-eq/t of exported melon (rang<strong>in</strong>g<br />
from 632 to 787 kg CO2-eq/t melon). Emissions from upstream and downstream of melon processes <strong>in</strong><br />
the Low Jaguaribe and Açu region have a large share <strong>in</strong> this total footpr<strong>in</strong>t. Direct emissions from seedl<strong>in</strong>g,<br />
cropp<strong>in</strong>g and melon pack<strong>in</strong>g contributed less than 50% <strong>in</strong> all scenarios, <strong>in</strong>clud<strong>in</strong>g the reference situation.<br />
Melon cropp<strong>in</strong>g is the ma<strong>in</strong> process responsible for direct emissions among the processes <strong>in</strong> the Low<br />
Jaguaribe and Açu region.<br />
Scenario analysis shows that the footpr<strong>in</strong>t can be reduced to 539 kg CO2-eq/t of exported melon. This reduction<br />
is achievable when melons are produced on farms located <strong>in</strong> already existent agricultural areas.<br />
5. References<br />
British Standards (BSI), 2008. PAS 2050:2011 - Specification for the assessment of the life cycle greenhouse gas emissions of goods<br />
and services. DEFRA, United K<strong>in</strong>gdom. Available at: (accessed 22.09.2010).<br />
Cellura, M., Ardente, F., Longo, S., <strong>2012</strong>. From the <strong>LCA</strong> of food products to the environmental assessment of protected crops districts:<br />
a case-study <strong>in</strong> the South of Italy. Journal of Environmental Management, 93, 194-208.<br />
Crisóstomo, L. A., Santos, A. A., Raij, B., Faria, C. M. B., Silva, D. J., Fernandes, F. A. M., Santos, F. J. S., Crisóstomo, J. R.,<br />
Freitas, J. A. D., Holanda, J. S., Cardoso, J. W., Costa, N. D., 2002. Adubação, Irrigação, Híbridos e Práticas Culturais para o<br />
Meloeiro no Nordeste [Fertilization, irrigation, hybrids and cultural practices to the melon plant <strong>in</strong> the Brazilian Northeast]. Circular<br />
Técnica 14. Embrapa Agro<strong>in</strong>dústria Tropical, Fortaleza.<br />
Figueirêdo, M. A., Rodrigues, G. S., Caldeira-Pires, A., Rosa, M. F., Aragão, F. A. S., Vieira, V. P. P. B., Mota, F. S. B., 2010.<br />
Environmental performance evaluation of agro-<strong>in</strong>dustrial <strong>in</strong>novations. Part 1: Ambitec-LifeCycle, a m<strong>et</strong>hodological approach for<br />
consider<strong>in</strong>g life cycle th<strong>in</strong>k<strong>in</strong>g. Journal of Cleaner Production, 18, 1366-1375.<br />
<strong>Food</strong> and Agriculture Organization (FAO), 2011. FAOSTAT: melon production. FAO, Rome. Available at:<br />
(accessed 26.09.2011).<br />
Frischknecht, R.; Jungbluth, N. 2007. Eco<strong>in</strong>vent – overview and m<strong>et</strong>hodology. Swiss Centre for Life Cycle Inventories, Dubendorf.<br />
Goedkoop, M., Schryver, A., Oele, M., 2008. Simapro 7: <strong>in</strong>troduction <strong>in</strong>to <strong>LCA</strong>. PRé Consultants, N<strong>et</strong>herlands.<br />
Instituto Brasileiro de Geografia e Estatística (IBGE) [Brazilian Institute for Geography and Statistics], 2009. Produção Agrícola<br />
Municipal [National Agriculture Production]. IBGE, Brasília. Available at: (accessed 20.09.2011).<br />
International Organization for Standardization (ISO), 2006a. ISO 14040:2006- Environmental management, Life cycle assessment,<br />
Pr<strong>in</strong>ciples and framework. ISO, Geneva.<br />
International Organization for Standardization (ISO), 2006b. ISO 14044:2006- Environmental management - Life cycle assessment -<br />
Requirements and guidel<strong>in</strong>es. ISO, Geneva.<br />
International Panel on Climate Change (IPCC), 2007. IPCC Fourth Assessment Report: Climate Change 2007. IPCC, Geneva.<br />
Available at: < http://www.ipcc.ch/publications_and_data/ar4/wg1/en/tssts-2-5.html>. (accessed 22.09.2010).<br />
International Panel on Climate Change (IPCC), 2006. Guidel<strong>in</strong>es for National Greenhouse Gas Inventories. IPCC, Geneva. Available<br />
at: . (accessed 22.09.2010).<br />
M<strong>in</strong>istério da Ciência e Tecnologia (MCT) [Brazilian Science and Technology M<strong>in</strong>istry], 2010. Inventário Brasileiro de Emissões<br />
Antrópicas por Fontes e Remoções por Sumidouros de Gases de Efeito Estufa não Controlados pelo Protocolo de Montreal [Brazilian<br />
<strong>in</strong>ventory of emissions and removal of GHG not controlled by the Montreal Protocol]. MCT, Brasília. Available at:<br />
(accessed 25.02.11).<br />
M<strong>in</strong>istério do Desenvolvimento, Indústria e Comércio (MDIC) [Brazilian M<strong>in</strong>istry of Development, Industry and Commerce], 2011.<br />
Sistema de Análise das Informações de Comércio Exterior [System for the analysis of foreign commerce]. MDIC, Brasília.<br />
Available at: (accessed 29.09.2011).<br />
Miranda, F. R., Gondim, R. S., Freitas, J. A. D., P<strong>in</strong>heiro N<strong>et</strong>o, L. G., 2008. Irrigação do meloeiro [Melon irrigation], <strong>in</strong>: Sobr<strong>in</strong>ho,<br />
R. B., Guimarães, J. A., Freitas, J. A. D., Terao, D. (Eds.), Produção <strong>in</strong>tegrada de melão [Melon <strong>in</strong>tegrated production]. Embrapa<br />
Agro<strong>in</strong>dústria Tropical, Banco do Nordeste do Brasil, Fortaleza.<br />
Pandey. D., Agrawal, M., Pandey, J. S., 2011. Carbon footpr<strong>in</strong>t: current m<strong>et</strong>hods of estimation. Environ Monitor<strong>in</strong>g Assessment,<br />
178, 135–160.<br />
Silva, H. R., Costa, N., 2003. Melão: produção aspectos técnicos [Melon: technical aspects of production]. Embrapa, Brasília.<br />
World Resource Institute (WRI), World Bus<strong>in</strong>ess Council for Susta<strong>in</strong>able Development (WBCSD), 2011. Product life cycle report<strong>in</strong>g<br />
and standard. WRI, Wash<strong>in</strong>gton. Available at: (accessed 10.01.<strong>2012</strong>).<br />
377
PARALLEL SESSION 4B: DIET 8 th Int. Conference on <strong>LCA</strong> <strong>in</strong> the<br />
Parallel session 4b: D i<strong>et</strong><br />
378<br />
Nutrient based functional unit for meals<br />
Thomas Kägi * , Mischa Zschokke, Fredy D<strong>in</strong>kel<br />
1 Carbotech AG, environmental consult<strong>in</strong>g, 4002 Basel, Switzerland<br />
Correspond<strong>in</strong>g author. E-mail: t.kaegi@carbotech.ch<br />
Agri-<strong>Food</strong> Sector, 1-4 Oct <strong>2012</strong><br />
ABSTRACT<br />
The goal of this study was to compare the environmental impact of meals and their <strong>in</strong>gredients and to analyse the <strong>in</strong>fluence of the<br />
functional unit on the results. For this study all relevant life cycle phases were considered. The functional units we compared: 1 meal<br />
(about 450g); adjusted by the nutrient density score (NDS); adjusted by the nutrient rich food <strong>in</strong>dex (NRF9.3). A comparison of the<br />
different meals per plate or adjusted by the NRF9.3 m<strong>et</strong>hod shows that the most relevant impact comes from meat. If the results are<br />
weighted by the NDS m<strong>et</strong>hod, beef still shows a high impact but is not as dom<strong>in</strong>ant due to its high nutrient density. Us<strong>in</strong>g this<br />
m<strong>et</strong>hod wh<strong>et</strong>her the <strong>in</strong>gredients are regionally or seasonally produced becomes much more relevant. Tak<strong>in</strong>g the uncerta<strong>in</strong>ty <strong>in</strong>to<br />
account a meal with veg<strong>et</strong>ables out of season can but must not have a significant lower environmental impact than a meat meal. The<br />
different outcomes due to the three different functional units used show the importance to take <strong>in</strong>to account the adequate circumstances<br />
when def<strong>in</strong><strong>in</strong>g the functional unit. What is adequate to compare - the amount of food, the nutritional value of food or the<br />
nutritional health of food? Otherwise, the functional unit and the results may not answer the questions.<br />
Keywords: <strong>LCA</strong>, meal, nutritional value, functional unit<br />
1. Introduction<br />
In the European Union more than a quarter of the environmental impact is estimated to come from the<br />
food cha<strong>in</strong>. There is an on-go<strong>in</strong>g discussion on how to reduce the environmental impact along the food production<br />
and supply cha<strong>in</strong>. One of the most widely spread proposition is to alter food consumption patterns by<br />
replac<strong>in</strong>g animal foods with plant-based foods. And of course there is a big difference b<strong>et</strong>ween the environmental<br />
impacts of the production of 1kg veg<strong>et</strong>ables and 1 kg meat. However, nutritional values or nutritional<br />
health of food are seldom considered <strong>in</strong> such comparisons. It is important to use a functional unit that is relevant<br />
from a nutritional perspective.<br />
2. M<strong>et</strong>hods<br />
2.1. Goal and scope<br />
The goal of this study was to compare the environmental impact of real restaurant meals and their <strong>in</strong>gredients<br />
and to show the <strong>in</strong>fluence of the functional unit on the results. The follow<strong>in</strong>g meal comb<strong>in</strong>ations were<br />
compared (among others): prote<strong>in</strong>s (beef vs. poultry vs. mushrooms) with potatoes and green beans (fresh<br />
beans Switzerland vs. fresh beans Egypt vs. fresh beans greenhouse grown).<br />
For this study all relevant life cycle phases were considered <strong>in</strong>clud<strong>in</strong>g production, further process<strong>in</strong>g,<br />
transportation, packag<strong>in</strong>g and cook<strong>in</strong>g of the meals.<br />
The functional units we compared:<br />
1 meal (about 450g).<br />
1 meal adjusted by the nutrient density score (NDS).<br />
1 meal adjusted by the nutrient rich food <strong>in</strong>dex (NRF9.3)<br />
2.2. Nutrient density score (NDS) and nutrient rich food <strong>in</strong>dex (NRF9.3)<br />
In this study, the NDS was calculated accord<strong>in</strong>g to Drewnowski (2005). The sum of prote<strong>in</strong>s, carbohydrates,<br />
fats, 10 vitam<strong>in</strong>s and 8 trace elements were considered and each weighted accord<strong>in</strong>g to the recommended<br />
daily <strong>in</strong>take mean<strong>in</strong>g the higher the nutrient density the more valuable the food was. Nutrient contents<br />
were taken from the USDA National Nutrient Database for Standard Reference (2011). The nutrient<br />
density of an <strong>in</strong>gredient was calculated as follows:<br />
Nutrient density (NDS) = ∑(PNR x PropN)<br />
PNR: Percentage of nutrient recommendation<br />
= 100 x (Content of nutrient i <strong>in</strong> 100g of edible portion divided by the recommended daily value<br />
of nutrient i)
PARALLEL SESSION 4B: DIET 8 th Int. Conference on <strong>LCA</strong> <strong>in</strong> the<br />
Agri-<strong>Food</strong> Sector, 1-4 Oct <strong>2012</strong><br />
PropN: Proportion number of nutrients >5% of recommended daily value<br />
= Number of nutrients <strong>in</strong> 100g of edible portion >5% of recommended daily value divided by 21<br />
(amount of considered nutrients).<br />
The nutrient rich food <strong>in</strong>dex (NRF) was calculated accord<strong>in</strong>g to Drewnowski (2009). The NRF9.3 was chosen<br />
because it best correlates to a healthy di<strong>et</strong> (Drewnowski 2009). The NRF9.3 conta<strong>in</strong>s n<strong>in</strong>e nutrients to<br />
encourage (prote<strong>in</strong>, fibre, Vitam<strong>in</strong>s A, C and E, M<strong>in</strong>erals Ca, Fe, Mg, K) and 3 nutrients to limit (saturated<br />
fat, added sugar, Na). Nutrient contents were taken from the USDA National Nutrient Database for Standard<br />
Reference (2011). The nutrient rich food <strong>in</strong>dex was calculated as follows:<br />
Nutrient rich food <strong>in</strong>dex (NRF9.3) = ∑NE – ∑LIM<br />
NE: Nutrients to encourage<br />
= 100 x (content of nutrient i <strong>in</strong> 100g of edible portion divided by the recommended daily value<br />
of nutrient i)<br />
LIM: Nutrients to limit<br />
= 100 x (content of limit<strong>in</strong>g nutrient i <strong>in</strong> 100g of edible portion divided by the maximum recommended<br />
daily value of nutrient i)<br />
2.3. Inventory data<br />
Production data for beef and poultry (<strong>in</strong>tegrated production, Switzerland) were based on Jungbluth (2000)<br />
updated by the Wirz handbook (LBL 2005) and own data <strong>in</strong>ventories. Potato production (<strong>in</strong>tegrated production,<br />
Switzerland) was taken from the eco<strong>in</strong>vent report No. 15 (Nemecek & Kägi 2007). Data for bean production<br />
(good agricultural practice, Germany) was based on Lattauschke (2002) and data for mushroom production<br />
(conventional, Poland) was taken from Hessische Landesfachgruppe (2002). Data for the further<br />
process<strong>in</strong>g of the <strong>in</strong>gredients and prepar<strong>in</strong>g of meals was based on D<strong>in</strong>kel <strong>et</strong> al., (2006). Data for meals was<br />
based on real restaurant dishes. The eco<strong>in</strong>vent <strong>in</strong>ventory V2.2 database (eco<strong>in</strong>vent 2010) was used for other<br />
secondary data (fertiliser production, transportation and other) and emission factors.<br />
2.4. Impact assessment<br />
The <strong>LCA</strong> was performed us<strong>in</strong>g the software EMIS 5.7 (Environmental Management and Information System)<br />
developed by Carbotech (D<strong>in</strong>kel 2011).<br />
For valuation of the environmental footpr<strong>in</strong>t the ecological scarcity m<strong>et</strong>hod (Frischknecht <strong>et</strong> al., 2009)<br />
was used. The m<strong>et</strong>hod represents the environmental policy of Switzerland and evaluates the emissions and<br />
their environmental impacts accord<strong>in</strong>g to a “distance-to-targ<strong>et</strong>”-approach. For evaluation of processes of<br />
which the emissions are generated outside of Switzerland it is assumed, that the relative importance of the<br />
emission factors is similar. The Eco-<strong>in</strong>dicator 99 m<strong>et</strong>hod (Goedkoop and Spriensma 2001) was used as a<br />
second m<strong>et</strong>hod for the evaluation of the environmental footpr<strong>in</strong>t.<br />
2.5. Uncerta<strong>in</strong>ty considerations<br />
To describe the uncerta<strong>in</strong>ty of data and model calculations distribution functions like normal or lognormal<br />
distribution are used. Especially for emissions where the distributions typically are not symm<strong>et</strong>ric the lognormal<br />
distribution is a b<strong>et</strong>ter approximation than the normal distribution. But the advantage of normal distributions<br />
is that there are analytic functions to calculate the uncerta<strong>in</strong>ty propagation over the process cha<strong>in</strong> if<br />
it is assumed that the uncerta<strong>in</strong>ties are <strong>in</strong>dependent of each other which is of course not always the case. Due<br />
to this shortcom<strong>in</strong>g an overestimation of the uncerta<strong>in</strong>ties may be obta<strong>in</strong>ed. By us<strong>in</strong>g normal distributions the<br />
results can be calculated with<strong>in</strong> seconds <strong>in</strong>stead of hours .This is one of the ma<strong>in</strong> reasons why <strong>in</strong> the EMIS<br />
software a simplified uncerta<strong>in</strong>ty calculation us<strong>in</strong>g normal distribution function is used. This means that the<br />
uncerta<strong>in</strong>ty propagation will be calculated and the user always g<strong>et</strong>s an estimation of the confidence <strong>in</strong>tervals<br />
of the <strong>LCA</strong> results. Even today there are few <strong>LCA</strong> studies giv<strong>in</strong>g the uncerta<strong>in</strong>ties of the results even if there<br />
are lead<strong>in</strong>g software tools giv<strong>in</strong>g the opportunity to do an uncerta<strong>in</strong>ty calculation with Monte Carlo simulation.<br />
The m<strong>et</strong>hodological uncerta<strong>in</strong>ties were assumed to be around 20%. Consider<strong>in</strong>g the appropriateness of<br />
the data be<strong>in</strong>g used, uncerta<strong>in</strong>ties of the <strong>in</strong>– and output processes were taken <strong>in</strong>to account. These uncerta<strong>in</strong>-<br />
379
PARALLEL SESSION 4B: DIET 8 th Int. Conference on <strong>LCA</strong> <strong>in</strong> the<br />
Agri-<strong>Food</strong> Sector, 1-4 Oct <strong>2012</strong><br />
ties were def<strong>in</strong>ed accord<strong>in</strong>g to the pedigree matrix used <strong>in</strong> eco<strong>in</strong>vent (2010). The uncerta<strong>in</strong>ty <strong>in</strong>tervals are<br />
presented on the 68% level (standard deviation).<br />
3. Results<br />
The comparison of the environmental impacts of the meals depends on the functional unit we choose.<br />
A comparison of the environmental impact <strong>in</strong> reference to one meal shows as expected that the most relevant<br />
impact comes from meat (Fig. 1). Meals with beef have a significantly higher environmental impact<br />
than meals with poultry whilst veg<strong>et</strong>arian meals show the lowest environmental impact. All other <strong>in</strong>puts are<br />
of secondary relevance compared to meat.<br />
If the results are weighted by the NDS <strong>in</strong> order to compare the environmental impact of the meals <strong>in</strong> reference<br />
to their nutritional value, meat (especially beef) still shows a high impact but is not as dom<strong>in</strong>ant due<br />
to its high nutrient density (Fig. 2). Other <strong>in</strong>gredients such as potatoes and beans also contribute significantly<br />
especially if the ecological scarcity m<strong>et</strong>hod is considered. This is because the nutrient density of meat is<br />
much higher than the nutrient density of veg<strong>et</strong>ables. Us<strong>in</strong>g this NDS adjusted functional unit wh<strong>et</strong>her the<br />
<strong>in</strong>gredients are regionally or seasonally produced becomes much more relevant. Tak<strong>in</strong>g the uncerta<strong>in</strong>ty <strong>in</strong>to<br />
account a meal with veg<strong>et</strong>ables out of season can but must not have a significant lower environmental impact<br />
than a meat meal.<br />
If the results are wighted by the NRF9.3 <strong>in</strong> order to compare the environmental impact of the meals <strong>in</strong><br />
reference to their nutritional health, meat (especially beef) shows an even higher impact than <strong>in</strong> the comparison<br />
per meal. All other <strong>in</strong>puts are of secondary relevance compared to meat.<br />
eco po<strong>in</strong>ts / meal<br />
140%<br />
120%<br />
100%<br />
80%<br />
60%<br />
40%<br />
20%<br />
0%<br />
ecological scarcity 2006<br />
Var 1 Var 2 Var 3 Var 4 Var 5<br />
green green beans beans<br />
potatoes potatoes<br />
meat/mushrooms<br />
sauce sauce<br />
Figure 1. Environmental impact per meal, normalised to the maximum. Var 1: beef+potatoes+green beans<br />
CH, Var 2: poultry+potatoes+green beans ES, Var 3: poultry+potatoes+green beans CH, Var 4: mushrooms+potatoes+green<br />
beans greenhouse, Var 5: mushrooms+potatoes+green beans CH.<br />
eco po<strong>in</strong>ts / NDS of meal<br />
140%<br />
120%<br />
100%<br />
80%<br />
60%<br />
40%<br />
20%<br />
0%<br />
ecological scarcity 2006<br />
Var 1 Var 2 Var 3 Var 4 Var 5<br />
green green beans beans<br />
potatoes potatoes<br />
meat/mushrooms<br />
sauce<br />
sauce<br />
Figure 2. Environmental impact per nutritional value (NDS), normalised to the maximum. Var 1:<br />
beef+potatoes+green beans CH, Var 2: poultry+potatoes+green beans ES, Var 3: poultry+potatoes+green<br />
beans CH, Var 4: mushrooms+potatoes+green beans greenhouse, Var 5: mushrooms+potatoes+green beans<br />
CH.<br />
380<br />
eco po<strong>in</strong>ts / meal<br />
eco po<strong>in</strong>ts / NDS of meal<br />
140%<br />
120%<br />
100%<br />
80%<br />
60%<br />
40%<br />
20%<br />
0%<br />
140%<br />
120%<br />
100%<br />
80%<br />
60%<br />
40%<br />
20%<br />
0%<br />
Eco-<strong>in</strong>dicator 99 (H/A) Total<br />
Var 1 Var 2 Var 3 Var 4 Var 5<br />
Eco-<strong>in</strong>dicator 99 (H/A) Total<br />
Var 1 Var 2 Var 3 Var 4 Var 5
PARALLEL SESSION 4B: DIET 8 th Int. Conference on <strong>LCA</strong> <strong>in</strong> the<br />
Agri-<strong>Food</strong> Sector, 1-4 Oct <strong>2012</strong><br />
eco po<strong>in</strong>ts / NRF9.3 of meal<br />
140%<br />
120%<br />
100%<br />
80%<br />
60%<br />
40%<br />
20%<br />
0%<br />
ecological scarcity 2006<br />
1 2 3 4 5<br />
green green beans beans<br />
potatoes potatoes<br />
meat/mushrooms<br />
sauce<br />
sauce<br />
Figure 3. Environmental impact per nutritional health (NRF9.3), normalised to the maximum. Var 1:<br />
beef+potatoes+green beans CH, Var 2: poultry+potatoes+green beans ES, Var 3: poultry+potatoes+green<br />
beans CH, Var 4: mushrooms+potatoes+green beans greenhouse, Var 5: mushrooms+potatoes+green beans<br />
CH.<br />
4. Discussion<br />
With <strong>in</strong>creas<strong>in</strong>g frequency, people and <strong>in</strong>stitutions draw conclusions on di<strong>et</strong>ary recommendations from an<br />
environmental perspective without a comprehensive analysis of nutritional relevance. Us<strong>in</strong>g a functional unit<br />
<strong>in</strong>volv<strong>in</strong>g only comparable menus <strong>in</strong> an average restaurant may lead to the conclusion that veg<strong>et</strong>able alternatives<br />
are always b<strong>et</strong>ter than those of animal orig<strong>in</strong>. There are few studies such as Kurppa <strong>et</strong> al., (2009) that<br />
already <strong>in</strong>cluded nutritional aspects <strong>in</strong> environmental impact assessment of food. However, accord<strong>in</strong>g to our<br />
knowledge, most previous studies did not take nutrient aspects <strong>in</strong>to account when discuss<strong>in</strong>g the environmental<br />
impact of food choices and accord<strong>in</strong>g to Swedman <strong>et</strong> al., (2010) environmental emissions have not<br />
been explicitly studied when mak<strong>in</strong>g nutrition recommendations. It is thus important to use both knowledge<br />
<strong>in</strong> nutrition and environmental footpr<strong>in</strong>t to avoid simplistic and erroneous conclusions for food recommendations<br />
to mitigate the environmental footpr<strong>in</strong>t.<br />
The question rises wh<strong>et</strong>her it is appropriate to consider nutrient aspects if compar<strong>in</strong>g food choices as most<br />
persons choose their meal based on taste, app<strong>et</strong>ite and economic considerations rather than on nutrients.<br />
However, there are many labels (e.g. weight watchers) that guide through the food offer on basis of nutrient<br />
considerations. On the one hand, although people are driven by app<strong>et</strong>ite and taste, the ma<strong>in</strong> goal of eat<strong>in</strong>g is<br />
not to eat a certa<strong>in</strong> amount of food or savour<strong>in</strong>g good food but rema<strong>in</strong>s <strong>in</strong> provid<strong>in</strong>g the body with necessary<br />
nutrients. Consider<strong>in</strong>g this aspect, it is simply not enough to compare food per weight or per meal without<br />
<strong>in</strong>clud<strong>in</strong>g nutrient considerations. On the other hand, the NDS m<strong>et</strong>hod does not consider the fact, that too<br />
much of nutrient rich food (e.g. meat) is unhealthy and is today a big problem especially <strong>in</strong> western civilisations.<br />
The NRF9.3 considers this aspect by punish<strong>in</strong>g saturated fat, sodium and added sugar. It refers to the<br />
nutritional health of food. However, it seems dissatisfy<strong>in</strong>g that it does not <strong>in</strong>clude all vital nutrients (e.g.<br />
unsaturated fatty acids).<br />
Regard<strong>in</strong>g the three different functional units and their different outcomes (Results per NDS differ to the<br />
ones per NRF9.3 or per plate) it is of importance to clearly def<strong>in</strong>e the circumstances of the study and def<strong>in</strong>e<br />
the functional unit accord<strong>in</strong>gly: what shall be compared - the amount of food, the nutritional value of food or<br />
the nutritional health of food? Otherwise, the choice of the functional will not lead to the adequate results<br />
answer<strong>in</strong>g the questions of the study. This result also shows that there is not one functional unit to be right<br />
for compar<strong>in</strong>g meals but it has to be chosen carefully accord<strong>in</strong>g to the circumstances. The right functional<br />
unit for one country, region or group of people may be the wrong one for other countries, regions or groups<br />
of people.<br />
5. Conclusion<br />
This study compared three different functional units for meals of which two considered nutritional aspects<br />
of food. Different conclusions may be derived based on the chosen functional unit lead<strong>in</strong>g to different food<br />
recommendations. The functional unit to be chosen depends not only on the goal of the study but also on the<br />
circumstances such as the cultural background or the measure of value of the stakeholder.<br />
ei99 eco po<strong>in</strong>ts / NRF9.3 of Meal<br />
140%<br />
120%<br />
100%<br />
80%<br />
60%<br />
40%<br />
20%<br />
0%<br />
Eco-<strong>in</strong>dicator 99 (H/A) Total<br />
1 2 3 4 5<br />
381
PARALLEL SESSION 4B: DIET 8 th Int. Conference on <strong>LCA</strong> <strong>in</strong> the<br />
Agri-<strong>Food</strong> Sector, 1-4 Oct <strong>2012</strong><br />
We are conv<strong>in</strong>ced that the consideration of nutrient density and nutritional health of food is important <strong>in</strong><br />
the context of the environmental debate. Furthermore, environmental impacts of meals can be directly l<strong>in</strong>ked<br />
to nutritional considerations of meals.<br />
6. References<br />
D<strong>in</strong>kel <strong>et</strong> al., (2006). Calculations for „Der kluge E<strong>in</strong>kaufswagen“ Unterrichtse<strong>in</strong>heit zu den Themen Umwelt, Konsum, Ökobilanzen.<br />
Bundesamt für Umwelt (BAFU)<br />
D<strong>in</strong>kel F. (2011). EMIS, Environmental Management and Information System, version 5.7, Carbotech AG, Basel, Switzerland.<br />
Drewnowski A. (2005). Concept of a nutrious food: toward a nutrient density score. Am J Cl<strong>in</strong>ical Nutr 2005; 82: 721-32<br />
Drewnowski A. (2009). Def<strong>in</strong><strong>in</strong>g Nutrient Density: Development and Validation of the Nutrient Rich <strong>Food</strong> Index. Journal of the<br />
American College of Nutrition, Vol.28, No. 4, 421S–426S<br />
Eco<strong>in</strong>vent (2010). Eco<strong>in</strong>vent 2010: Version 2.2, Swiss Center for Life Cycle Inventories. May 2010.<br />
Frischknecht <strong>et</strong> al., (2009) M<strong>et</strong>hode der ökologischen Knappheit Ökofaktoren 2006. Bundesamt für Umwelt (BAFU)/ÖBU.<br />
Goedkoop M. and Spriensma R. (2001) The Eco-<strong>in</strong>dicator 99 – a damage oriented m<strong>et</strong>hod for LCIA, m<strong>et</strong>hodology report, ,<br />
http://www.pre-susta<strong>in</strong>ability.com/content/reports<br />
Hessische Landesfachgruppe, 2002. Fachexkursion nach Polen – Austern- und Champignonanbau, Handel und Substratherstellung.<br />
Der Champignon 5/2002.<br />
Kurppa <strong>et</strong> al., (2009). Environmental impacts of a lunch plate – challenges <strong>in</strong> <strong>in</strong>terpr<strong>et</strong><strong>in</strong>g the <strong>LCA</strong> results. Future of the Consumer<br />
Soci<strong>et</strong>y, May 2009, Tampere<br />
Landwirtschaftliche Beratungszentrale L<strong>in</strong>dau (LBL), 2005. Wirz Handbuch – Pflanzen und Tiere. Wirz Verlag<br />
Lattauschke, G, 2002. H<strong>in</strong>weise zum umweltgerechten Anbau von Freilandgemüse im Freistaat Sachsen – Buschbohnen. Sächsische<br />
Landesanstalt für Landwirtschaft. http://www.landwirtschaft.sachsen.de/LFL<br />
Nemecek T. & Kägi T. (2007). Life Cycle Inventories of Swiss and European Agricultural Production Systems. F<strong>in</strong>al report eco<strong>in</strong>vent<br />
V2.0 No. 15a. Agroscope Reckenholz-Taenikon Research Station ART, Swiss Centre for Life Cycle Inventories, Zurich and<br />
Dubendorf, CH, r<strong>et</strong>rieved from www.eco<strong>in</strong>vent.ch<br />
Swedman <strong>et</strong> al., (2010). Nutrient density of beverages <strong>in</strong> relation to climate impact. <strong>Food</strong> & Nutrition Research 2010, 54: 5170<br />
U.S. Department of Agriculture, Agricultural Research Service (2011). USDA National Nutrient Database for Standard Reference.<br />
Nutrient Data Laboratory Home Page, http://www.ars.usda.gov/ba/bhnrc/ndl<br />
382
PARALLEL SESSION 4B: DIET 8 th Int. Conference on <strong>LCA</strong> <strong>in</strong> the<br />
Agri-<strong>Food</strong> Sector, 1-4 Oct <strong>2012</strong><br />
Carbon footpr<strong>in</strong>t of organic vs. conventional food consumption <strong>in</strong><br />
<strong>France</strong><br />
Noëllie Oud<strong>et</strong> * , Perr<strong>in</strong>e Lavelle, Grégoire Thonier, Maxime Pousse, Eric Labouze<br />
BIO Intelligence Service<br />
Correspond<strong>in</strong>g author. E-mail: noellie.oud<strong>et</strong>@biois.com<br />
ABSTRACT<br />
Our di<strong>et</strong> has been proven directly concerned by the struggle aga<strong>in</strong>st environmental damages. Simultaneously, organic agriculture<br />
emerges as a way to mitigate our impact on the environment. Assess<strong>in</strong>g to which extent the rapid development of this ris<strong>in</strong>g form of<br />
agriculture can have a positive effect on the environment thus appears relevant. The <strong>in</strong>novative scientific goal of this project is to<br />
evaluate the environmental impact of “organic vs. conventional consumption”, a wider scale than <strong>in</strong>dividual products.<br />
Two steps were followed: characterisation of organic and conventional patterns – consider<strong>in</strong>g the global amount of food annually<br />
purchased – and application of the <strong>LCA</strong> m<strong>et</strong>hodology to quantify their environmental burden – only global warm<strong>in</strong>g potentials were<br />
established as no satisfy<strong>in</strong>g consumption patterns footpr<strong>in</strong>ts could be calculated for other impacts.<br />
Organic and conventional consumer carbon footpr<strong>in</strong>ts respectively reach 1 149 aga<strong>in</strong>st 1 173 kg CO2 eq. Improv<strong>in</strong>g the def<strong>in</strong>ition of<br />
the organic pattern could strengthen the conclusions,<br />
Keywords: food consumption pattern, organic, conventional, life cycle assessment, carbon footpr<strong>in</strong>t<br />
1. Introduction<br />
European food consumption accounts for 20 to 30% of the environmental impacts generated by consumer<br />
products (Tukker, 2006). Our di<strong>et</strong> is thus directly concerned by the struggle aga<strong>in</strong>st environmental damages.<br />
Simultaneously, organic agriculture, scheme with strict specification, emerges as a way to mitigate our impact<br />
on the environment, and organic mark<strong>et</strong> has been boom<strong>in</strong>g for the past 10 years. It appears relevant to<br />
assess the extent to which the rapid development of this ris<strong>in</strong>g form of agriculture can have a positive effect<br />
on the environment. Indeed, if the environmental benefit of organic farm<strong>in</strong>g m<strong>et</strong>hods is fairly accepted when<br />
results relate to the hectare of land use, impact calculation per unit of production lead to more h<strong>et</strong>erogeneous<br />
conclusions. Given foods aim at be<strong>in</strong>g eaten, as part of a whole di<strong>et</strong>, is it relevant to compare environmental<br />
impacts of non-organic product and its organic equivalent to estimate the impacts and benefit of the organic<br />
farm<strong>in</strong>g, as the studies carried out so far seem to suggest? Indeed, what happens if an organic consumer’s<br />
behaviour differed slightly from the average French consumer’s one? Thus, the ma<strong>in</strong> scientific and <strong>in</strong>novative<br />
goal of this project is to evaluate the environmental impact of “organic vs. conventional consumption”<br />
on a wider scale than <strong>in</strong>dividual products.<br />
This project has been carried out <strong>in</strong> association with the Synabio, the professional union dedicated to<br />
French organic food process<strong>in</strong>g companies.<br />
2. M<strong>et</strong>hod<br />
Our project was conducted follow<strong>in</strong>g two steps: first the organic and conventional consumption patterns<br />
were def<strong>in</strong>ed; second the <strong>LCA</strong> m<strong>et</strong>hodology was applied to quantify their environmental burdens. We focused<br />
on the global warm<strong>in</strong>g potential, as it rema<strong>in</strong>s the only consensual quantitative environmental <strong>in</strong>dicator<br />
and has thus been assessed for a greater number of products, comparability of the results be<strong>in</strong>g easy to ensure.<br />
2.1. Def<strong>in</strong>ition of the organic and conventional consumption patterns<br />
Our def<strong>in</strong>ition of the organic consumer is based on the annual quantity of purchased organic items. Kantar<br />
Worldpanel, specialist of consumer knowledge based on cont<strong>in</strong>uous consumer panels provided us with the<br />
number of households purchas<strong>in</strong>g a given number of products per year. For reasons of sample data robustness,<br />
we had to def<strong>in</strong>e our organic households as purchas<strong>in</strong>g more than 50 organic products per year. The<br />
conventional pattern was considered representative of the first two quartile of the population, i.e. purchas<strong>in</strong>g<br />
less than 3 organic products per year. On average, annual purchase of organic products <strong>in</strong> <strong>France</strong> reaches 20<br />
products.<br />
383
PARALLEL SESSION 4B: DIET 8 th Int. Conference on <strong>LCA</strong> <strong>in</strong> the<br />
Agri-<strong>Food</strong> Sector, 1-4 Oct <strong>2012</strong><br />
2.2. Environmental assessment<br />
The follow<strong>in</strong>g functional unit was chosen: “to product, supply and consume and average food bask<strong>et</strong> per<br />
person <strong>in</strong> <strong>France</strong> <strong>in</strong> 2009”.<br />
The carbon footpr<strong>in</strong>t of each bask<strong>et</strong> was established look<strong>in</strong>g at each step of the products life cycle. Given<br />
the variable accessibility to data accord<strong>in</strong>g to the life cycle step, different approaches were used to evaluate<br />
the associated greenhouse gases emissions.<br />
Cultivation and farm<strong>in</strong>g<br />
Literature review was performed to list available and usable carbon footpr<strong>in</strong>ts. Obviously, the list of food<br />
products provided by Kantar Worldpanel was not compl<strong>et</strong>ely covered by the publications results; simple<br />
orig<strong>in</strong>al products like kiwis, or processed products such as ratatouille have no publicly available environmental<br />
<strong>in</strong>formation. In addition, organic products have been far less studied than conventional ones, and<br />
often lack environmental impact data.<br />
When miss<strong>in</strong>g, environmental <strong>in</strong>formation for conventional items were estimated conducted simplified<br />
<strong>LCA</strong>, or by analogy with closest products (e.g. grapefruit environmental burdens were considered equal to<br />
oranges ones). We acknowledge the uncerta<strong>in</strong>ty related to these approximations. Regard<strong>in</strong>g organic items,<br />
miss<strong>in</strong>g environmental data was replaced with conventional products ones (e.g. organic goat milk environmental<br />
impacts were replaced with conventional goat milk burdens).<br />
From raw material transportation to consumer use<br />
Several scenarios were established for each of the follow<strong>in</strong>g steps of the products life cycles. Number and<br />
param<strong>et</strong>ers of the scenarios were def<strong>in</strong>ed accord<strong>in</strong>g to their representativeness and their <strong>in</strong>fluence on the f<strong>in</strong>al<br />
results.<br />
Raw material freight: 2 scenarios based on transportation modes and distances differences;<br />
Industrial process<strong>in</strong>g: 19 scenarios based on the energy consumption and the refrigerant emissions;<br />
Packag<strong>in</strong>g: only primary packag<strong>in</strong>g were considered and 14 scenarios were modelled based on<br />
material type and weight, and <strong>in</strong>dustrial processes;<br />
Distribution and r<strong>et</strong>ail: 3 scenarios accord<strong>in</strong>g to storage conditions;<br />
Consumer use: 6 scenarios depend<strong>in</strong>g on the storage and cook<strong>in</strong>g practices.<br />
GHG emissions were calculated for each of these scenarios.<br />
End-of-life<br />
A survey performed on behalf of the ADEME (ADEME, 2007) mentions that a French consumer wastes<br />
about 79 kg or food per year on average, mean<strong>in</strong>g that 16% of the food constitut<strong>in</strong>g our bask<strong>et</strong> is thrown<br />
away. This figure is <strong>in</strong> agreement with values provided by WRAP (WRAP, 2008) which <strong>in</strong>dicates that 68 kg<br />
of food is wasted per person and per year <strong>in</strong> the UK. However, different values have been found <strong>in</strong> other<br />
studies. For <strong>in</strong>stance, Munoz (Munoz <strong>et</strong> al., 2010) <strong>in</strong>dicates that approximately 200 kg of food waste are<br />
produced per person and per year <strong>in</strong> Spa<strong>in</strong>. The 79 kg value was used <strong>in</strong> the study but this value rema<strong>in</strong>s<br />
quite uncerta<strong>in</strong> and a more precise assessment of food waste is needed.<br />
Repartition of waste accord<strong>in</strong>g to their dest<strong>in</strong>ation (landfill, <strong>in</strong>c<strong>in</strong>eration, recovery) was made thanks to<br />
data from the ADEME (2007) and the ADEME AFNOR platform for packag<strong>in</strong>gs (2011).<br />
3. Results<br />
3.1. Organic and conventional consumption patterns<br />
Kantar Worldpanel provided us with a list of 215 food items which were distributed <strong>in</strong>to 10 categories:<br />
Meat, fish and eggs; Dairies; Ready-made meals; Fruits and veg<strong>et</strong>ables; Starchy foods; Bakery wares; Condiments;<br />
Coffee, tea and chocolate dr<strong>in</strong>ks; Beverages and Baby food.<br />
Among the 215 items, 149 were dist<strong>in</strong>guished b<strong>et</strong>ween organic and conventional, 66 rema<strong>in</strong>ed und<strong>et</strong>erm<strong>in</strong>ed.<br />
Conventional and organic consumers’ purchases amount to 524 and 496 kg per year, with respective<br />
mass shares of organic products of 0.3 and 11.6%, beverages excluded.<br />
Figure 2 shows the composition of the five food bask<strong>et</strong>s. We can notice that organic consumer’s purchases<br />
exceed conventional ones by near 30 kg. This can be expla<strong>in</strong>ed by the higher <strong>in</strong>comes of this population,<br />
and by the need of consum<strong>in</strong>g more given the less energy dense products purchased.<br />
384
PARALLEL SESSION 4B: DIET 8 th Int. Conference on <strong>LCA</strong> <strong>in</strong> the<br />
Agri-<strong>Food</strong> Sector, 1-4 Oct <strong>2012</strong><br />
Regard<strong>in</strong>g the composition, some differences can also be observed. One notable trend appears: fruits and<br />
veg<strong>et</strong>ables consumption is closely correlated with organic product purchases. As for Dairies, Meat, fish and<br />
eggs, and Ready-made meals purchases, they slightly decrease while the organic product purchases <strong>in</strong>creases.<br />
Mass per capita (%)<br />
100%<br />
90%<br />
80%<br />
70%<br />
60%<br />
50%<br />
40%<br />
30%<br />
20%<br />
10%<br />
0%<br />
Group 1*<br />
French consumer average**<br />
(505 kg)<br />
Figure 2. Composition of the food bask<strong>et</strong>s<br />
*: group 1: French average consumer, group 2: conventional consumer, group 5: organic consumer<br />
**: number of organic products purchased per year and per household<br />
3.2. Emission of GHG per kg of product overview<br />
Emissions of GHG per kg of product (carbon footpr<strong>in</strong>ts) used <strong>in</strong> this study come from publications or<br />
<strong>LCA</strong> performed dur<strong>in</strong>g this project, reconstruction via simplified <strong>LCA</strong> or approximations as expla<strong>in</strong>ed before.<br />
Table 12 d<strong>et</strong>ails the orig<strong>in</strong>s of the selected values, and their respective shares of bask<strong>et</strong> mass and impact<br />
for French average consumers. If <strong>LCA</strong>s (exhaustive or simplified) cover the half of the products, they encompass<br />
more than 2/3rd of the global footpr<strong>in</strong>t either because of their significant amounts or because of<br />
their high environmental burdens, are covered.<br />
Table 12. Number of carbon footpr<strong>in</strong>ts selected accord<strong>in</strong>g to the different sources – Dist<strong>in</strong>ction provided per<br />
number of product, mass and impact shares and per production modes for the French average consumption<br />
bask<strong>et</strong> (l<strong>in</strong>e totals may differ from 100% due to round<strong>in</strong>g).<br />
French average consumer<br />
Group 2*<br />
< 3 products**<br />
(496 kg)<br />
Emissions factors from<br />
published <strong>LCA</strong><br />
Group 5*<br />
> 50 products**<br />
(524 kg)<br />
Emissions factors recalculated<br />
from pub-<br />
lished <strong>LCA</strong><br />
Meat, fish and eggs<br />
Dairy products<br />
Ready-made meals<br />
Fruits and veg<strong>et</strong>ables<br />
Starchy foods, cereals, semol<strong>in</strong>a<br />
Bakery wares<br />
Salt, spices, soups, sauces,<br />
salads<br />
Coffee, tea, chocolate dr<strong>in</strong>ks<br />
Beverages<br />
Other<br />
Number of product 104 (28%) 85 (23%) 176 (48%)<br />
Organic 26 (17%) 34 (23%) 89 (60%)<br />
Conventional 51 (34%) 42 (28%) 56 (38%)<br />
Und<strong>et</strong>erm<strong>in</strong>ed 27 (40%) 9 (13%) 31 (46%)<br />
Mass distribution 52% 11% 37%<br />
Organic 54% 5% 41%<br />
Conventional 46% 19% 35%<br />
Und<strong>et</strong>erm<strong>in</strong>ed 59% 3% 38%<br />
Impact distribution 51% 18% 31%<br />
Organic 54% 6% 41%<br />
Conventional 38% 24% 39%<br />
Und<strong>et</strong>erm<strong>in</strong>ed 70% 11% 19%<br />
385
PARALLEL SESSION 4B: DIET 8 th Int. Conference on <strong>LCA</strong> <strong>in</strong> the<br />
Agri-<strong>Food</strong> Sector, 1-4 Oct <strong>2012</strong><br />
3.3. Environmental impact assessment<br />
Table 13 displays the global annual GHG emissions of each k<strong>in</strong>d of consumer. At first glance, one can<br />
see that despite organic consumers purchase more products (<strong>in</strong> weight), their carbon footpr<strong>in</strong>t is very close,<br />
but slightly <strong>in</strong>ferior, to the conventional consumers’ one. Given the uncerta<strong>in</strong>ty of both activity data and<br />
emissions factors, the lower carbon footpr<strong>in</strong>t of the organic consumer cannot be considered significant.<br />
However, it can be propounded that organic consumption bask<strong>et</strong> composition counteracts the higher mass<br />
purchased. If the mass were the same as for the conventional consumer, the carbon footpr<strong>in</strong>t would be 5.5%<br />
lower.<br />
Table 13. Annual purchases and GHG emissions per capita<br />
Consumers groups<br />
<strong>Food</strong> bask<strong>et</strong> weight Global Warm<strong>in</strong>g Potential<br />
(nb of organic products purchased) (kg/capita/year)<br />
(kg. CO2 eq.)<br />
Group 1 - French consumer average 505 1179<br />
Group 2 - Conventional consumer 496 1173<br />
Group 5 - Organic consumer 524 1149<br />
When consider<strong>in</strong>g the impact repartition accord<strong>in</strong>g to food products categories, we can notice that for<br />
most categories, and especially Meat, fish and eggs, Ready-made meals, Fruits and veg<strong>et</strong>ables and Beverages,<br />
trends are very correlated to the ones observed on the bask<strong>et</strong> composition (i.e. less Meat, fish and eggs<br />
<strong>in</strong> group 5 bask<strong>et</strong> results <strong>in</strong> a lower impact). Indeed, mass variation has more effect than the difference b<strong>et</strong>ween<br />
organic and conventional carbon footpr<strong>in</strong>ts, the latter be<strong>in</strong>g often little and not always favour<strong>in</strong>g one<br />
or the other farm<strong>in</strong>g practices type.<br />
Regard<strong>in</strong>g the organic consumer, the higher carbon footpr<strong>in</strong>ts of organic products are counterbalanced by<br />
the composition of the food bask<strong>et</strong> (i.e. more fruits and veg<strong>et</strong>ables, less beverages, meat and dairy products<br />
<strong>in</strong> comparison to the average consumer). Hence, the latter emerges as a major lever to reduce the carbon<br />
footpr<strong>in</strong>t of the di<strong>et</strong>.<br />
The comparison of the mass and impact profiles of each consumer highlights that these two aspects are<br />
not correlated, as illustrated <strong>in</strong> Figure 3. Indeed, some categories are highly consumed but lead to m<strong>in</strong>or contributions<br />
to global GHG emissions (e.g. beverages, fruits and veg<strong>et</strong>ables), others carry significant part of the<br />
impact even if they are consumed <strong>in</strong> lower quantities (e.g. Meat, fish and eggs, Dairy products). This comes<br />
from the fact that carbon footpr<strong>in</strong>ts vary greatly from one food category to another.<br />
Dairy products<br />
Ready-made<br />
meals<br />
Meat, fish and<br />
eggs<br />
Fruits and<br />
veg<strong>et</strong>ables<br />
Baby food<br />
Starchy foods,<br />
cereals, semol<strong>in</strong>a<br />
Beverages<br />
Bakery wares<br />
Coffee, tea,<br />
chocolate dr<strong>in</strong>ks<br />
Salt, spices, soups,<br />
sauces, salads<br />
Figure 3. Mass and impact repartition for the French average consumer (1 graduation – 5%)<br />
Focus<strong>in</strong>g on specific categories, we have noticed that although carbon footpr<strong>in</strong>ts are higher for organic<br />
meat and dairy <strong>in</strong>dividual products, the average footpr<strong>in</strong>ts of the respective categories are lower for this<br />
386<br />
Mass<br />
Impact
PARALLEL SESSION 4B: DIET 8 th Int. Conference on <strong>LCA</strong> <strong>in</strong> the<br />
Agri-<strong>Food</strong> Sector, 1-4 Oct <strong>2012</strong><br />
scheme of production. This results from the k<strong>in</strong>ds of meat and dairies purchased, s<strong>in</strong>ce less impact<strong>in</strong>g meats<br />
(chicken, eggs) are most commonly consumed when consider<strong>in</strong>g organic products while pork and beef consumptions,<br />
two strong emitt<strong>in</strong>g products, are significant among conventional (and und<strong>et</strong>erm<strong>in</strong>ed) purchased<br />
meat products.<br />
F<strong>in</strong>ally, provided consumption levels and environmental impacts of these categories, Meat, fish and eggs<br />
and Dairy products appear as the ma<strong>in</strong> leverages to mitigate the emissions of the consumption bask<strong>et</strong>.<br />
4. Discussion<br />
The comparison of our results to those from previous studies shows that orders of magnitude are on the<br />
whole similar, the two Spanish studies (Munoz <strong>et</strong> al., 2010; Santacana <strong>et</strong> al., 2008) outcomes be<strong>in</strong>g superior.<br />
Our results are thus <strong>in</strong> l<strong>in</strong>e with the literature, provid<strong>in</strong>g the uncerta<strong>in</strong>ty <strong>in</strong> these k<strong>in</strong>ds of studies, and the<br />
various followed m<strong>et</strong>hodologies.<br />
Moreover, our conclusions about the high contributors to the global emissions are concordant. For example,<br />
the share of “raw material production” is dom<strong>in</strong>at<strong>in</strong>g the general result. This phase is actually for all<br />
groups the most contribut<strong>in</strong>g to the general food bask<strong>et</strong> impact. It represents about 75% of the total impact<br />
for each group. This conclusion is <strong>in</strong> adequacy with Munoz’ study on the impact of the average Spanish di<strong>et</strong>,<br />
food production account<strong>in</strong>g for circa 2/3rd of the global GHG emissions (Munoz <strong>et</strong> al., 2010). The most<br />
impact<strong>in</strong>g products categories are Meats, fish and eggs as well as Dairy products, with respectively 406 and<br />
372 kg CO2eq <strong>in</strong> the average consumer’s bask<strong>et</strong>. The predom<strong>in</strong>ance of these two categories of products <strong>in</strong><br />
the impact of raw material production is also coherent with Munoz’ results: meat and dairy products contribute<br />
to 54% of the impact of raw material production, while their contribution reaches 62% of raw material<br />
production <strong>in</strong> the present study.<br />
We acknowledge our model faces several limitations; first regard<strong>in</strong>g the consumption profiles def<strong>in</strong>ition,<br />
the lack of discrim<strong>in</strong>ation b<strong>et</strong>ween organic and conventional products and the share of approximated carbon<br />
footpr<strong>in</strong>ts <strong>in</strong> the model.<br />
When study<strong>in</strong>g the distribution of organic, conventional and und<strong>et</strong>erm<strong>in</strong>ed products, organic consumption<br />
represents 8% of the total weight of organic food bask<strong>et</strong>. This result raises questions about the “organic”<br />
consumer and the little differences among the organic and conventional consumption bask<strong>et</strong>s. However, the<br />
Kantar Worldpanel data did not allow def<strong>in</strong><strong>in</strong>g a more d<strong>et</strong>ailed and representative sample, based on consumers<br />
buy<strong>in</strong>g more than 100 or 200 organic products a year for <strong>in</strong>stance. In addition, <strong>in</strong> the panel, the share of<br />
und<strong>et</strong>erm<strong>in</strong>ed products rema<strong>in</strong> high (48% and 25% consider<strong>in</strong>g Beverages or not). In particular, fresh (i.e.<br />
unprocessed) products such as meats or fruits and veg<strong>et</strong>able showed very little dist<strong>in</strong>ction of the agricultural<br />
production scheme, while they account for respectively 13 and 17% of the global organic products turnover<br />
<strong>in</strong> 2010, beh<strong>in</strong>d grocery products and beverages (24%) and dairy products (22%) (Agence Bio, 2011); and<br />
their contributions to the global emissions of the bask<strong>et</strong>s are predom<strong>in</strong>ant.<br />
Therefore, further research is needed to establish the organic consumption pattern; as both the number of<br />
products <strong>in</strong> the bask<strong>et</strong> – which may result <strong>in</strong> a new bask<strong>et</strong> composition – and the precision of the agricultural<br />
production mode of key products have to be improved. This new and more accurate organic profile could be<br />
built thanks to consumers <strong>in</strong>terviews for <strong>in</strong>stance, the consumers be<strong>in</strong>g selected among recurrent buyers of<br />
organic food stores.<br />
F<strong>in</strong>ally, still, one third of the global impact results from product carbon footpr<strong>in</strong>ts that have been approximated,<br />
either by consider<strong>in</strong>g the GHG emissions per kg of product of the closest product or by tak<strong>in</strong>g<br />
the conventional item carbon footpr<strong>in</strong>t when the organic one was miss<strong>in</strong>g or the production scheme und<strong>et</strong>erm<strong>in</strong>ed.<br />
For <strong>in</strong>stance, 10 emissions factors were modelled from the emissions factors of organic wheat, and as<br />
oranges production mode was not available; the emissions factor of conventional oranges was used. Thus,<br />
not only is the emissions factors accessibility a limit to our assessment, but also the availability of dist<strong>in</strong>ct<br />
<strong>in</strong>formation b<strong>et</strong>ween organic and conventional product. This result tends to confirm the uneas<strong>in</strong>ess to conclude<br />
about the potential benefits or drawbacks of consum<strong>in</strong>g organic food compared with conventional<br />
food, provid<strong>in</strong>g the low availability of emissions factors for organic food. This also addresses the need to<br />
conduct <strong>LCA</strong>s compar<strong>in</strong>g the environmental impacts of organic and conventional products. Ideally, the<br />
<strong>LCA</strong>s conducted should compare the products, the production modes (organic, conventional, <strong>in</strong>tegrated) and<br />
the geographical areas (region of a country).<br />
5. Conclusion<br />
Although limitations rema<strong>in</strong> about our def<strong>in</strong>ition of the organic pattern, dist<strong>in</strong>ctions <strong>in</strong> the consumption<br />
have been established, result<strong>in</strong>g <strong>in</strong> environmental impacts variations. Given the uncerta<strong>in</strong>ties of the results no<br />
conclusion can be drawn about the effective benefit of the organic pattern, but the fact that this specific bas-<br />
387
PARALLEL SESSION 4B: DIET 8 th Int. Conference on <strong>LCA</strong> <strong>in</strong> the<br />
Agri-<strong>Food</strong> Sector, 1-4 Oct <strong>2012</strong><br />
k<strong>et</strong> composition counterbalances the higher purchased food amount has been proven. In the context of research<br />
to identify new consumption modes, our results are a first step toward the def<strong>in</strong>ition of a “more environmentally-friendly”<br />
di<strong>et</strong>.<br />
For a def<strong>in</strong>ition of a susta<strong>in</strong>able di<strong>et</strong> (<strong>in</strong> terms of environmental impacts), it could be <strong>in</strong>terest<strong>in</strong>g to <strong>in</strong>vestigate<br />
other environmental impacts, such as water consumption or eutrophication, relevant issues for food<br />
products (ADEME AFNOR, 2011). However, these <strong>in</strong>dicators are still under development, as no consensual<br />
calculation m<strong>et</strong>hod has been established, and available results rema<strong>in</strong> hardly comparable.<br />
A further step address<strong>in</strong>g the nutritional value of the various consumption bask<strong>et</strong>s would help def<strong>in</strong><strong>in</strong>g<br />
b<strong>et</strong>ter consumption patterns for both human and our plan<strong>et</strong>’s health.<br />
6. References<br />
ADEME, 2007, Campagne nationale de caractérisation des ordures ménagères (MODECOM), résultats<br />
2007. http://www2.ademe.fr/servl<strong>et</strong>/KBaseShow?sort=-1&cid=96&m=3&catid=15163<br />
Agence Bio, 2011, L'agriculture biologique, chiffres clés - Edition 2011. www.agencebio.org<br />
Muñoz, I., Mila I Canals, L., Fernandez-Alba, A., 2010. Life cycle assessment of the average Spanish di<strong>et</strong><br />
2010 <strong>in</strong>clud<strong>in</strong>g human excr<strong>et</strong>ion. Int J of Life Cycle Assess. 15:794-805<br />
Santacana M, Pon J, Pon D, Arto I, Casanovas S (2008) Greenhouse gas emissions from a consumption perspective<br />
<strong>in</strong> a global economy — opportunities for the Mediterranean region. Susta<strong>in</strong>able consumption and<br />
production <strong>in</strong> the mediterranean, regional activity centre for cleaner production (CP/RAC). Annual Technical<br />
Publication 7:101 – 112<br />
Tukker, A., Huppes, G., Gu<strong>in</strong>ée, J., Heijungs, R., de Kon<strong>in</strong>g, A., van Oers, L., Suh, S., Geerken, T., Van<br />
Holderbeke, M., Jansen, B., Nielsen, P., European Commission - Jo<strong>in</strong>t Research Center - Institute for<br />
Prospective Technological Studies, European Science and Technology Observatory, TNO, 2006, Environmental<br />
Impact of Products (EIPRO), Analysis of the life cycle, environmental impacts related to the<br />
f<strong>in</strong>al consumption of the EU-25, EUR 22284 EN.<br />
WRAP, 2008, <strong>Food</strong> waste report v2, The food we waste, ISBN: 1-84405-383-0 (version 2), Written by Lorrayne<br />
Ventour, July 2008.<br />
388
PARALLEL SESSION 4B: DIET 8 th Int. Conference on <strong>LCA</strong> <strong>in</strong> the<br />
Agri-<strong>Food</strong> Sector, 1-4 Oct <strong>2012</strong><br />
Nutrition <strong>in</strong> <strong>LCA</strong>: Are nutrition <strong>in</strong>dexes worth us<strong>in</strong>g?<br />
MTT Agrifood Research F<strong>in</strong>land, E-mail: merja.saar<strong>in</strong>enr@mtt.fi<br />
Merja Saar<strong>in</strong>en<br />
ABSTRACT<br />
Environmental impact of food is mostly considered on a mass basis, although nutrition undoubtedly is one of the ma<strong>in</strong> functions of<br />
food. The paper develops a m<strong>et</strong>hodology to comb<strong>in</strong>e nutritional and environmental aspects <strong>in</strong> food <strong>LCA</strong>. The usability of nutrition<br />
<strong>in</strong>dexes is tested and discussed. The nutrition <strong>in</strong>dexes tested were Nutrient Rich <strong>Food</strong>, NRF9, Naturally Nutrient Rich, NNR15, and<br />
Nutrient Adequacy Ratio, NAR15. They are <strong>in</strong>tended for application to all types of food. The test calculation <strong>in</strong>cluded several foods<br />
from several product groups based on general nutrient composition data and environmental impact data. Prelim<strong>in</strong>ary results show that<br />
environmental impact seems to dom<strong>in</strong>ate and strengthen the recommendation to restrict animal-based foods and favour plant-based<br />
foods. However, <strong>in</strong>clusion of recommended and limited nutrients is a necessity before further application of the m<strong>et</strong>hod, and a reformulation<br />
of the nutrient composition of the <strong>in</strong>dex has also to be considered.<br />
Keywords: food, nutrient <strong>in</strong>dex, <strong>LCA</strong><br />
1. Introduction<br />
Accord<strong>in</strong>g to the ISO 14040, standard functions of the system be<strong>in</strong>g studied shall be clearly specified, and<br />
comparisons b<strong>et</strong>ween systems shall be made on the basis of the same function(s), quantified by the same<br />
functional unit(s) <strong>in</strong> the form of their reference flows. Selected FU(s) should go tog<strong>et</strong>her with a goal and<br />
scope of the study.<br />
Currently environmental impact of food is mostly considered on a mass basis <strong>in</strong> public debate and<br />
scientific discussion. There is however a grow<strong>in</strong>g <strong>in</strong>terest <strong>in</strong> consider<strong>in</strong>g nutrition and environment<br />
simultaneously (e.g. Saar<strong>in</strong>en <strong>et</strong> al., <strong>2012</strong>; Schau and F<strong>et</strong>, 2008; Smedman <strong>et</strong> al., 2011). This can be seen as<br />
an outgrowth of <strong>in</strong>creas<strong>in</strong>g efforts to <strong>in</strong>form consumers about susta<strong>in</strong>ability of food products <strong>in</strong>stead of us<strong>in</strong>g<br />
<strong>LCA</strong> as a tool to improve the production cha<strong>in</strong>. As long as environmental susta<strong>in</strong>ability of food products is<br />
considered a field for improv<strong>in</strong>g eco-efficiency of producers, nutrition will be neglected. But consumer<br />
<strong>in</strong>formation on susta<strong>in</strong>able food choices is valueless without consider<strong>in</strong>g nutrition. There are also several<br />
other functions associated with eat<strong>in</strong>g that are very relevant to consumers, like pleasure, social <strong>in</strong>teraction<br />
<strong>et</strong>c., but nutrition is the basic function of food when comparisons are made <strong>in</strong> the context of susta<strong>in</strong>ability.<br />
As comparison b<strong>et</strong>ween products is made on the basis of the same functional units, opportunities to use<br />
“nutritional functional units” should be carefully considered.<br />
The paper develops a m<strong>et</strong>hodology to comb<strong>in</strong>e nutritional and environmental aspects <strong>in</strong> food <strong>LCA</strong>.<br />
Climate change and eutrophication potential were used as examples of the environmental category. The<br />
usability of nutrition <strong>in</strong>dexes is tested and discussed.<br />
2. M<strong>et</strong>hods<br />
The nutrition <strong>in</strong>dexes tested were Nutrient Rich <strong>Food</strong>, NRF9, Naturally Nutrient Rich, NNR, and Nutrient<br />
Adequacy Ratio, NAR16 (Drewnowski and Fulgoni, 2007). NAR16 <strong>in</strong>cludes 16 nutrients, but the F<strong>in</strong>nish<br />
nutrient database does not provide <strong>in</strong>formation on pantothenic acid (B5), so <strong>in</strong> this study NAR16 <strong>in</strong>cluded 15<br />
nutrients as NAR15. NNR also <strong>in</strong>cludes 15 nutrients, and is thus NNR15. These <strong>in</strong>dexes comb<strong>in</strong>e recommended<br />
nutrients and quantify an average share of nutrients <strong>in</strong> 100 g of a product (or any other amount of<br />
food) from their daily nutrient recommendation. The <strong>in</strong>dexes, their nutrient composition and formulas, are<br />
presented <strong>in</strong> (Table 1).<br />
Other <strong>in</strong>dexes consist<strong>in</strong>g of nutrients to recommend were also considered, but the lack of nutritional data<br />
restricted their use. From the po<strong>in</strong>t of view of the science of nutrition, <strong>in</strong>dexes that <strong>in</strong>clude nutrients to be<br />
recommended and nutrients to be limited provide the most accurate feature of the nutritional value of foods,<br />
and therefore basically both types of nutrient should be considered. In this study, <strong>in</strong>dexes consist<strong>in</strong>g of both<br />
nutrients to recommend and nutrients to limit were applied to nutrient calculations, but not to environmental<br />
assessment because they confer negative values to some foods (not shown <strong>in</strong> the paper). Negative values are<br />
not directly applicable <strong>in</strong> <strong>LCA</strong> as they result <strong>in</strong> a negative environmental impact. Indexes that proportion<br />
nutrients to energy content of food (i.e. nutrient density <strong>in</strong>dexes) were also applied to nutrient calculations,<br />
but not to environmental assessment. They basically are suitable for nutrient calculation <strong>in</strong> situations where<br />
energy needs to be limited. In such a case energy is regarded as a disadvantage. Accord<strong>in</strong>gly, high energy<br />
content reduces the nutrient density value, and low energy content <strong>in</strong>creases the nutrient density value. If<br />
these are used as a FU <strong>in</strong> the <strong>LCA</strong>, the <strong>in</strong>terpr<strong>et</strong>ation would be reversed so that energy would be an advantage;<br />
high energy content would result <strong>in</strong> lower environmental impact than lower energy content. Indexes<br />
389
PARALLEL SESSION 4B: DIET 8 th Int. Conference on <strong>LCA</strong> <strong>in</strong> the<br />
Agri-<strong>Food</strong> Sector, 1-4 Oct <strong>2012</strong><br />
consist<strong>in</strong>g of only nutrients to be limited were not regarded as suitable for l<strong>in</strong>k<strong>in</strong>g to the <strong>LCA</strong> by means of<br />
FU because they do not represent a benefit ga<strong>in</strong>ed from food, but rather a disadvantage.<br />
The nutrient <strong>in</strong>dexes attempt to represent a general nutritional value for <strong>in</strong>dividual foods by reflect<strong>in</strong>g di<strong>et</strong><strong>et</strong>ic<br />
nutritional values. They are <strong>in</strong>tended for application to all types of food. Indexes are meant to be applied<br />
to unfortified foods as they are <strong>in</strong>tended to illustrate the natural nutritional value of food. In this study however,<br />
dr<strong>in</strong>ks were fortified, like skimmed milk with vitam<strong>in</strong> D, and oat dr<strong>in</strong>k and soya dr<strong>in</strong>k with calcium and<br />
vitam<strong>in</strong> D. These products are generally fortified, milk actually even by law (<strong>in</strong> F<strong>in</strong>land). They are used as<br />
alternative dr<strong>in</strong>ks l<strong>in</strong>ked to meals.<br />
The test calculation <strong>in</strong>cluded several foods from several product groups. Nutritional data were based on<br />
national nutrition recommendations (Anon., 2005) and national food composition database (F<strong>in</strong>eli® - F<strong>in</strong>nish<br />
<strong>Food</strong> Composition Database). <strong>LCA</strong> results <strong>in</strong> categories of climate change and eutrophication potential used<br />
<strong>in</strong> the calculations are approximations for f<strong>in</strong>al products derived from raw material use (recipes) and <strong>LCA</strong><br />
data from previous studies (Saar<strong>in</strong>en <strong>et</strong> al., <strong>2012</strong>; Usva <strong>et</strong> al., <strong>2012</strong>; see also Virtanen <strong>et</strong> al., 2011 and<br />
Saar<strong>in</strong>en <strong>et</strong> al., 2011), the Eco<strong>in</strong>vent database and Wanhal<strong>in</strong>na (2010). <strong>LCA</strong> results for most products represent<br />
raw material production of ma<strong>in</strong> <strong>in</strong>gredients on farm, but the <strong>LCA</strong> results for rye breads <strong>in</strong>clude also<br />
bak<strong>in</strong>g. <strong>LCA</strong> results for bread are not sensitive to the production m<strong>et</strong>hod and “ the darkness of bread”, so<br />
they were only applied to <strong>in</strong>dustrial rye bread and light bread <strong>in</strong> environmental calculations (exclud<strong>in</strong>g traditional<br />
rye bread and whole gra<strong>in</strong> wheat bread, unlike <strong>in</strong> the nutritional calculation). Manufacture of added<br />
calcium and vitam<strong>in</strong> D for fortified soy dr<strong>in</strong>k and oat dr<strong>in</strong>k were not <strong>in</strong>cluded <strong>in</strong> the <strong>LCA</strong> values. The <strong>LCA</strong><br />
values for skimmed milk represent milk from the dairy, i.e. there was no allocation applied that differentiated<br />
milk and fat. <strong>LCA</strong> results for macaroni were not available, nor were <strong>in</strong>formation on recipe. Therefore macaroni<br />
was not <strong>in</strong>cluded <strong>in</strong> the environmental calculation. The eutrophication potential of olive oil, and rye and<br />
light bread were not available, so they were not <strong>in</strong>cluded <strong>in</strong> the eutrophication calculation.<br />
The nutrient <strong>in</strong>dexes were comb<strong>in</strong>ed <strong>in</strong> the <strong>LCA</strong> by the formula:<br />
390<br />
E/N <strong>in</strong>dex = <strong>LCA</strong> result / nutrient <strong>in</strong>dex (equation 1)<br />
Both <strong>LCA</strong> results and nutrient <strong>in</strong>dex measure were calculated per 100 g of a product.<br />
Table 1. Nutrient <strong>in</strong>dexes tested <strong>in</strong> the study.<br />
Nutrient <strong>in</strong>dex Formula Nutrients <strong>in</strong>cluded<br />
Nutrient Rich <strong>Food</strong>,<br />
NRF9<br />
NRF9 = Σ1–9((Nutrient/DV) * 100)/9 Prote<strong>in</strong>, fibre,<br />
Ca, Fe, Mg, K,<br />
Vit A, C and E<br />
Naturally Nutrient Rich, NNR = Σ₁₋₁₅((Nutrient/DV) * 100)/15 Prote<strong>in</strong>, fibre, MUFA,<br />
NNR<br />
Ca, Fe, Zn, K,<br />
Vit A, C, D, E, thiam<strong>in</strong> (B1), riboflav<strong>in</strong> (B2), B12<br />
and folate<br />
Nutrient Adequacy Ratio, NAR15 = Σ₁₋₁5((Nutrient/DV) * 100)/15 Prote<strong>in</strong>, fibre,<br />
NAR15<br />
Ca, Fe, Mg,<br />
Vit A, C, D, E, thiam<strong>in</strong> (B1), riboflav<strong>in</strong> (B2), niac<strong>in</strong><br />
(B3), pyridox<strong>in</strong>e (B6), B12, and folate<br />
3. Results<br />
3.1. Nutrient <strong>in</strong>dex scores<br />
Nutrient <strong>in</strong>dexes NRF9, NNR15 and NAR15 rank foods quite similarly (Figure 1). In general, veg<strong>et</strong>ables,<br />
veg<strong>et</strong>able oils, fruits and berries and rye breads fare well accord<strong>in</strong>g to every <strong>in</strong>dex. However, <strong>in</strong>dexes seem<br />
to treat meat and fish products differently and also veg<strong>et</strong>able oils.
PARALLEL SESSION 4B: DIET 8 th Int. Conference on <strong>LCA</strong> <strong>in</strong> the<br />
Agri-<strong>Food</strong> Sector, 1-4 Oct <strong>2012</strong><br />
Figure1. Scores for NNR15, NAR15 and NRF9 of foods sorted accord<strong>in</strong>g to NRF9.<br />
3.2. E/N <strong>in</strong>dex<br />
In this study the E/N (environmental/nutrient) <strong>in</strong>dex was applied <strong>in</strong> the categories of climate change and<br />
eutrophication potential. In general the E/N <strong>in</strong>dex values for the climate impact varied more than the nutrient<br />
<strong>in</strong>dex values, but not so much for eutrophication. For the climate impact (Figure 2) animal-based foods and<br />
rice, especially ref<strong>in</strong>ed rice, have the highest values, while carrot and olive oil have the lowest values. Values<br />
for sausage, pork, ra<strong>in</strong>bow trout, milk, whole gra<strong>in</strong> and ref<strong>in</strong>ed rice and rapeseed oil vary the most among the<br />
different m<strong>et</strong>hods.<br />
For the eutrophication potential (Figure 3), ra<strong>in</strong>bow trout have by far the highest values follow<strong>in</strong>g sausage,<br />
pork, milk, fatless and natural yoghurt, rapeseed oil and strawberry, while soy dr<strong>in</strong>k and carrot have the<br />
lowest values. However, the scale of the E/N <strong>in</strong>dex values for eutrophication potential is so large that differences<br />
among the lowest foods cannot be seen <strong>in</strong> the general picture.<br />
The E/N <strong>in</strong>dex values are very prelim<strong>in</strong>ary as the <strong>LCA</strong> values are approximations based on <strong>LCA</strong> results<br />
for raw material production of ma<strong>in</strong> <strong>in</strong>gredients: they are not results from the full <strong>LCA</strong>s. In addition, both<br />
environmental and nutritional data used <strong>in</strong> the study are general data, not data from production <strong>in</strong> a specific<br />
production cha<strong>in</strong>. The data are well suited for m<strong>et</strong>hodology development, but not for comparisons b<strong>et</strong>ween<br />
products <strong>in</strong> general or b<strong>et</strong>ween products from specific production cha<strong>in</strong>s.<br />
391
PARALLEL SESSION 4B: DIET 8 th Int. Conference on <strong>LCA</strong> <strong>in</strong> the<br />
Agri-<strong>Food</strong> Sector, 1-4 Oct <strong>2012</strong><br />
Figure 2. Carbon footpr<strong>in</strong>ts for the nutritional value unit of foods accord<strong>in</strong>g to NNR15, NAR16 and NRF9<br />
<strong>in</strong>dexes.<br />
Figure 3. Eutrophication potentials for the nutritional value unit of foods accord<strong>in</strong>g to NNR15, NAR16 and<br />
NRF9 <strong>in</strong>dexes.<br />
392
PARALLEL SESSION 4B: DIET 8 th Int. Conference on <strong>LCA</strong> <strong>in</strong> the<br />
Agri-<strong>Food</strong> Sector, 1-4 Oct <strong>2012</strong><br />
4. Discussion<br />
4.1. Nutrient <strong>in</strong>dex scores<br />
Nutrient <strong>in</strong>dexes quantify an average share (%) of selected nutrients <strong>in</strong> 100 g of a product with reference<br />
to the daily nutrient recommendation. Differences b<strong>et</strong>ween results for nutrient <strong>in</strong>dexes (Figure 1) highlight<br />
the fact that it is crucial to decide which nutrients to <strong>in</strong>clude <strong>in</strong> the <strong>in</strong>dex. Vitam<strong>in</strong>s from group B favour<br />
meat products (scores of NNR15 and NAR15) while MUFA (monounsaturated fat acids) favours veg<strong>et</strong>able<br />
oils (scores of NNR15).<br />
It is also notable that the <strong>in</strong>dex with the lowest number of nutrients (NRF9) provides the most stable outcome.<br />
Fulgoni and colleagues (2009) validated nutrient <strong>in</strong>dexes, which conta<strong>in</strong> different numbers of nutrients,<br />
aga<strong>in</strong>st the healthy eat<strong>in</strong>g <strong>in</strong>dex (HEI) <strong>in</strong> the USA. They established that <strong>in</strong>dex NRF9.3 correlated best<br />
with the HEI. The <strong>in</strong>dex consists of n<strong>in</strong>e recommended nutrients, as <strong>in</strong> this study for <strong>in</strong>dex NRF9, and three<br />
nutrients to be limited, which are saturated fatty acids, added sugar and Na. In this study, the order of foods<br />
would be dramatically different if the nutrients to be limited were <strong>in</strong>cluded <strong>in</strong> the <strong>in</strong>dexes. Olive oil, ra<strong>in</strong>bow<br />
trout, pork, light bread and sausage would lose ground most, while strawberry, orange, white cabbage, potato,<br />
fortified soy dr<strong>in</strong>k, whole gra<strong>in</strong> macaroni, fortified oat dr<strong>in</strong>k, skimmed milk, oatmeal and macaroni<br />
would most clearly improve <strong>in</strong> their performance. The nutrients to limit have to be built <strong>in</strong>to the nutrient<br />
<strong>in</strong>dex before further application <strong>in</strong> the context of <strong>LCA</strong>.<br />
It is also still questionable as to the most important recommended nutrients <strong>in</strong>cluded <strong>in</strong> the <strong>in</strong>dexes. For<br />
example, unsaturated fatty acids and antioxidants are currently regarded as very important to our health.<br />
Eventually, however, selection of nutrients depends on a selective approach. The approach of the <strong>in</strong>dexes<br />
considered <strong>in</strong> this study is to generate a general nutrient value for food, which is generally applicable to all<br />
humans. Alternative approaches might be more culture dependent or even genotype dependent.<br />
4.2. E/N <strong>in</strong>dex<br />
The E/N <strong>in</strong>dex quantifies environmental impact of the nutrient <strong>in</strong>dex unit <strong>in</strong> a selected impact category.<br />
The calculation is based on 100 g of product, but the E/N <strong>in</strong>dex value is <strong>in</strong>dependent of the amount of food.<br />
The prelim<strong>in</strong>ary results should not be <strong>in</strong>terpr<strong>et</strong>ed to represent an exact order for the foods considered.<br />
General f<strong>in</strong>d<strong>in</strong>gs regard<strong>in</strong>g the logic of the m<strong>et</strong>hod can however be made. Environmental impact seems to<br />
dom<strong>in</strong>ate the E/N <strong>in</strong>dex results to a small degree. An order of foods by climate impact does not change the<br />
order of foods much by the NRF9 <strong>in</strong>dex value compared to the order of foods by the E/N <strong>in</strong>dex value (Table<br />
2).<br />
Plant-based products seem to ma<strong>in</strong>ta<strong>in</strong> their environmental benefit compared with animal-based products<br />
when nutrient content is taken <strong>in</strong>to account <strong>in</strong> the study approach. However, some shifts occur with<strong>in</strong> the<br />
plant-based foods and with<strong>in</strong> the animal-based foods. For example, fat-free yoghurt with jelly loses to natural<br />
(2.5%) yoghurt <strong>in</strong> E/N rank<strong>in</strong>g, but not <strong>in</strong> the rank<strong>in</strong>g by CO2 eq. This k<strong>in</strong>d of comparison might be clearer if<br />
the <strong>in</strong>dex were more sensitive to differences b<strong>et</strong>ween product croups (and us<strong>in</strong>g b<strong>et</strong>ter def<strong>in</strong>ed data). This<br />
idea takes us back to the start; would this k<strong>in</strong>d of general nutrient <strong>in</strong>dex provide the <strong>in</strong>formation that would<br />
take account of the nutritional function of food so that it would help consumers choose more susta<strong>in</strong>able food<br />
products? I would say, probably not <strong>in</strong> the best possible manner, but product-category-specific <strong>in</strong>dexes (and<br />
more specific data) may be needed. This is most obvious when veg<strong>et</strong>able oils are compared with other products<br />
and each other. Both olive oil and rapeseed oil act quite unexpectedly <strong>in</strong> the calculations. There are two<br />
ma<strong>in</strong> factors beh<strong>in</strong>d this: 1) typical portion size differs considerably from other foods studied here and 2)<br />
exceptional nutrient composition. These k<strong>in</strong>ds of feature could be taken <strong>in</strong>to account <strong>in</strong> a product-groupspecific<br />
<strong>in</strong>dex. Also Fulgoni and colleagues (2009) proposed that development of a nutrient <strong>in</strong>dex with<strong>in</strong> a<br />
product group should be exam<strong>in</strong>ed. The problem still is how to def<strong>in</strong>e the product groups.<br />
5. Conclusion<br />
The study provides an <strong>in</strong>terest<strong>in</strong>g new approach and m<strong>et</strong>hodological framework for l<strong>in</strong>k<strong>in</strong>g food’s nutritional<br />
function to food <strong>LCA</strong>. Nutrient <strong>in</strong>dexes are worth us<strong>in</strong>g, but before practical applications are possible,<br />
nutrient composition of the nutrient <strong>in</strong>dexes should be evaluated aga<strong>in</strong>st current nutritional science and nutritional<br />
requirements of consumers. There might be a need for a newly composed nutritional <strong>in</strong>dex, and its<br />
product-group-specific applications. Def<strong>in</strong>ition of product groups should be based on a manner to use foods,<br />
not on, for example, raw material base of foods. Nutrients to be limited have to be <strong>in</strong>corporated to the <strong>in</strong>dex,<br />
but not <strong>in</strong> the way that they are <strong>in</strong> the current <strong>in</strong>dexes. And last but not least, more specific data should be<br />
used <strong>in</strong> the practical calculations. The targ<strong>et</strong> should be to use production-cha<strong>in</strong>-specific data.<br />
393
PARALLEL SESSION 4B: DIET 8 th Int. Conference on <strong>LCA</strong> <strong>in</strong> the<br />
Agri-<strong>Food</strong> Sector, 1-4 Oct <strong>2012</strong><br />
We are address<strong>in</strong>g these challenges <strong>in</strong> the Sust<strong>Food</strong>Choice project, where m<strong>et</strong>hodological development<br />
and case-study results regard<strong>in</strong>g several food products are pursued <strong>in</strong> cooperation with the F<strong>in</strong>nish food <strong>in</strong>dustry.<br />
Table 2. The order of foods by NRF9, E/N <strong>in</strong>dex and by CO2 eq.<br />
Product Order of products by NRF9 <strong>in</strong>dex Order of products by CO2 eq Order of products by E/N <strong>in</strong>dex<br />
rapeseed oil 1 17 11<br />
carrot 2 1 1<br />
rye bread, <strong>in</strong>dustrial 3 12 10<br />
olive oil 4 3 2<br />
strawberry 5 9 9<br />
orange 6 8 7<br />
ra<strong>in</strong>bow trout, filee, low fat, baked 7 19 16<br />
pork slices, cooked 8 20 19<br />
white cabbage 9 7 6<br />
light bread 10 13 12<br />
sausage, meaty, grilled 11 18 20<br />
rice, whole gra<strong>in</strong>, boiled with salt 12 11 13<br />
potato, cooked 13 4 3<br />
soy dr<strong>in</strong>k, fortified with Ca and vit D 14 6 5<br />
joghurt, 2,5%, natural 15 15 15<br />
oat dr<strong>in</strong>k, fortified with Ca and vit D 16 2 4<br />
joghurt, fatfree, jelly 17 14 17<br />
milk, skimmed 18 16 18<br />
rice, side dish, boiled with salt 19 10 14<br />
oat meal 20 5 8<br />
6. References<br />
Anon., 2005. Suomalais<strong>et</strong> ravitsemussuosituks<strong>et</strong> - rav<strong>in</strong>to ja liikunta tasapa<strong>in</strong>oon 2005. (<strong>in</strong> F<strong>in</strong>nish) (F<strong>in</strong>nish Nutrition Recommendations<br />
– nutrition and exercise to the balance 2005.) Valtion ravitsemusneuvottelukunta. 56 p. Edita, Hels<strong>in</strong>ki. ISBN 951-37-<br />
4501-5.<br />
Drewnowski, A. and V. Fulgoni III, 2007. Nutrient profil<strong>in</strong>g of foods: creat<strong>in</strong>g a nutrient-rich food <strong>in</strong>dex. Nutrition Reviews® Vol<br />
66(1) 23-39.<br />
F<strong>in</strong>eli® - F<strong>in</strong>nish <strong>Food</strong> Composition Database. National Institute for Health and Welfare. www.f<strong>in</strong>eli.fi.<br />
Fulgoni, V.L., Keast, D.R. and A. Drewnowski, 2009. Development and Validation of the Nutrient-Rich <strong>Food</strong>s Index: A Tool to<br />
Measure Nutritional Quality of <strong>Food</strong>s. J Nutrition 139, 1549-1554.<br />
Saar<strong>in</strong>en, M., Kurppa, S., Virtanen, Y., Usva, K., Mäkelä, J. and A. Niss<strong>in</strong>en, 2011. <strong>LCA</strong> approach to the impact of homemade,<br />
ready-to-eat and school lunches on climate and eutrophication. J Cleaner Production 28, 177-186.<br />
Saar<strong>in</strong>en, M., Virtanen, Y. and H. Hyvär<strong>in</strong>en, <strong>2012</strong>. <strong>LCA</strong>s of large repertoire of F<strong>in</strong>nish outdoor plant products. Abstract for <strong>LCA</strong><br />
food <strong>2012</strong> conference.<br />
Schau EM and AM F<strong>et</strong>, 2008. <strong>LCA</strong> Studies of <strong>Food</strong> Products as Background for Environmental Product Declarations. Int J <strong>LCA</strong> 13<br />
(3) 255-264.<br />
Smedman, A., L<strong>in</strong>dmarka-Månsson, H., Drewnowski, A. and A-K.M Edman, 2011. Nutrient density of beverages <strong>in</strong> relation to<br />
climate impact. <strong>Food</strong> & Nutrition Research, 54, 5170 – DOI: 10,340/fnr,v54i0,5170.<br />
Usva, K., Nousia<strong>in</strong>en, J., Hyvär<strong>in</strong>en, H. and Y. Virtanen <strong>2012</strong>. <strong>LCA</strong>s of average animal products pork, beef, milk and eggs <strong>in</strong><br />
F<strong>in</strong>land. Abstract for <strong>LCA</strong> <strong>Food</strong> <strong>2012</strong> Conference.<br />
Wanhal<strong>in</strong>na, V., 2010. Leivän hiilijalanjälki (<strong>in</strong> F<strong>in</strong>nish) (Carbon footpr<strong>in</strong>t of bread). Masters thesis. University of Hels<strong>in</strong>ki. ISSN<br />
0355-1180.<br />
Virtanen Y, Kurppa, S., Saar<strong>in</strong>en, M., Katajajuuri, J-M., Usva, K., Mäenpää, I., Mäkelä, J., Grönroos, J. and A. Niss<strong>in</strong>en, 2011.<br />
Carbon footpr<strong>in</strong>t of food – approaches from national <strong>in</strong>put-output statistics and a <strong>LCA</strong> of food portion. J Cleaner Production,<br />
19(16), 1841-1856.<br />
394
PARALLEL SESSION 4B: DIET 8 th Int. Conference on <strong>LCA</strong> <strong>in</strong> the<br />
Agri-<strong>Food</strong> Sector, 1-4 Oct <strong>2012</strong><br />
Compar<strong>in</strong>g the environmental impact of human di<strong>et</strong>s vary<strong>in</strong>g <strong>in</strong><br />
amount of animal-source food – the impact of account<strong>in</strong>g for<br />
nutritional quality<br />
Heleen R.J. van Kernebeek * , Simon J. Oost<strong>in</strong>g, Imke J.M. de Boer<br />
Animal Production Systems Group, Wagen<strong>in</strong>gen University, The N<strong>et</strong>herlands<br />
Correspond<strong>in</strong>g author. E-mail: Heleen.vankernebeek@wur.nl<br />
ABSTRACT<br />
Studies compar<strong>in</strong>g the environmental impact of human di<strong>et</strong>s that vary <strong>in</strong> amount of animal-source food generally not account for the<br />
nutritional quality of these di<strong>et</strong>s. Because di<strong>et</strong>s may differ <strong>in</strong> amount of energy and nutrients, the impacts of these di<strong>et</strong>s are not comparable.<br />
To make impacts comparable, we quantified the amount of 12 nutrients <strong>in</strong> di<strong>et</strong>s described <strong>in</strong> 13 peer reviewed studies. We<br />
also computed their composite nutritional quality, expressed as the Nutrient Rich Di<strong>et</strong>9.3 score (NRD9.3). We expressed the GWP<br />
per unit prote<strong>in</strong> and per unit NRD9.3. Di<strong>et</strong>s that had higher levels of animal prote<strong>in</strong> had higher (excessive) levels of total prote<strong>in</strong> and<br />
were generally lower <strong>in</strong> composite nutritional quality. Di<strong>et</strong>s that had lower levels of animal prote<strong>in</strong> had lower GWPs per gram prote<strong>in</strong><br />
and per unit NRD9.3. Account<strong>in</strong>g for composite nutritional quality gave stronger contrasts <strong>in</strong> GWP b<strong>et</strong>ween human di<strong>et</strong>s than<br />
orig<strong>in</strong>al comparisons.<br />
Keywords: GWP, human di<strong>et</strong>s, prote<strong>in</strong>, nutritional quality, NRD9.3<br />
1. Introduction<br />
The production and consumption of animal-source food products (ASFP) has a high environmental impact<br />
and leads to high resource use (Cordell <strong>et</strong> al., 2009; Ste<strong>in</strong>feld, 2006). Choos<strong>in</strong>g a di<strong>et</strong> low <strong>in</strong> ASFP<br />
could mitigate environmental impacts and improve resource use efficiency. Several studies assessed the environmental<br />
impact of human di<strong>et</strong>s that varied <strong>in</strong> their ASFP concentration (Carlsson-Kanyama and Gonzalez,<br />
2009; Davis <strong>et</strong> al., 2010; Saxe <strong>et</strong> al., <strong>2012</strong>). They generally compared impacts of two or more di<strong>et</strong><br />
scenarios us<strong>in</strong>g a life cycle perspective. Life cycle assessment (<strong>LCA</strong>) is an holistic approach to assess the<br />
environmental impact dur<strong>in</strong>g the entire production cha<strong>in</strong>. These studies support the general conclusion that<br />
plant-based di<strong>et</strong>s have a lower environmental impact than animal-based di<strong>et</strong>s.<br />
To compare environmental impacts of different di<strong>et</strong> scenarios, the environmental impact should be expressed<br />
on the basis of a so-called functional unit (FU). A FU depends on the ma<strong>in</strong> function of the system,<br />
and the primary function of food production is to satisfy the human body’s need for nutrients such as kcal,<br />
prote<strong>in</strong>, fibre, vitam<strong>in</strong>s and m<strong>in</strong>erals. Studies generally use daily <strong>in</strong>take or energy, prote<strong>in</strong> or fat content of<br />
the di<strong>et</strong> as functional units. These elements, however, only partly def<strong>in</strong>e the nutritional quality of a di<strong>et</strong>.<br />
Smedman <strong>et</strong> al., (2010), therefore, accounted for the content of 21 nutrients, when compar<strong>in</strong>g emissions of<br />
greenhouse gases along the life cycle of various beverages. The FU that Smedman <strong>et</strong> al., (2010) used, was<br />
the nutrient density (NDS). The NDS of a food product is a nutrient over energy ratio represent<strong>in</strong>g the composite<br />
nutrient score of a product (Hansen, 1973). In the present paper we developed another composite nutrient<br />
score at the di<strong>et</strong> level, and used this score as a FU <strong>in</strong> the comparison of the environmental impact of<br />
human di<strong>et</strong>s.<br />
The ma<strong>in</strong> aim of this paper was to evaluate wh<strong>et</strong>her the comparison of environmental impacts among di<strong>et</strong>s<br />
that varied <strong>in</strong> their ASFP-concentration, as reported <strong>in</strong> literature, would be different when nutritional<br />
quality was accounted for. We reviewed 13 published studies that assessed the environmental impact of human<br />
di<strong>et</strong>s that varied <strong>in</strong> their ASFP-concentration.<br />
2. M<strong>et</strong>hods<br />
2.1. Selection of published studies<br />
We found 13 studies that m<strong>et</strong> the follow<strong>in</strong>g five selection criteria: the study conta<strong>in</strong>ed more than one national<br />
di<strong>et</strong> scenario; di<strong>et</strong>s with<strong>in</strong> studies varied <strong>in</strong> ASFP-concentration; the weight of each food product <strong>in</strong>cluded<br />
<strong>in</strong> the di<strong>et</strong>s was given; di<strong>et</strong>s were not designed for specific groups (e.g. <strong>in</strong>fants, people with health<br />
problems or a specific gender); the article is published <strong>in</strong> a peer-reviewed scientific journal.<br />
2.2. Calculation of <strong>in</strong>dividual nutrient scores of each di<strong>et</strong><br />
395
PARALLEL SESSION 4B: DIET 8 th Int. Conference on <strong>LCA</strong> <strong>in</strong> the<br />
Agri-<strong>Food</strong> Sector, 1-4 Oct <strong>2012</strong><br />
We quantified the daily <strong>in</strong>take of n<strong>in</strong>e qualify<strong>in</strong>g and three disqualify<strong>in</strong>g nutrients <strong>in</strong> the di<strong>et</strong>s. The n<strong>in</strong>e<br />
qualify<strong>in</strong>g nutrients were (the recommended daily value (RDV) is given <strong>in</strong> brack<strong>et</strong>s): prote<strong>in</strong> (57 g), fibre (25<br />
g), calcium (800 mg), iron (14 mg), magnesium (375 mg), potassium (2000 mg), and vitam<strong>in</strong>s A (800 µg), C<br />
(80 mg) and E (12 mg). The three disqualify<strong>in</strong>g nutrients were (maximum recommended value (MRV) given<br />
<strong>in</strong> brack<strong>et</strong>s): sodium (2400 mg), saturated fat (20 g) and total sugar (90 g) (efsa, 2009, 2010, <strong>2012</strong>; EuropeanUnion,<br />
2008). To quantify the daily <strong>in</strong>take of these 12 nutrients, we multiplied the daily <strong>in</strong>take of each<br />
food product <strong>in</strong> the di<strong>et</strong> by the nutrient concentration of the food product. The nutrient concentration of food<br />
products were taken from the onl<strong>in</strong>e Dutch Nutrients Database NEVO (RIVM, 2011). Nutrient <strong>in</strong>take of<br />
meals was scaled to daily <strong>in</strong>take by express<strong>in</strong>g it relative to a recommended daily energy <strong>in</strong>take of 2000 kcal<br />
(efsa, 2009). Yearly di<strong>et</strong>s were scaled to daily di<strong>et</strong>s by divid<strong>in</strong>g the <strong>in</strong>take of nutrients by 365.<br />
To evaluate the nutritional quality of each di<strong>et</strong> <strong>in</strong> terms of <strong>in</strong>dividual nutrients, we compared the <strong>in</strong>dividual<br />
scores of qualify<strong>in</strong>g and disqualify<strong>in</strong>g nutrients to the RDV and MRV respectively.<br />
2.3. Calculation of the composite nutrient score of each di<strong>et</strong><br />
We developed the Nutrient Rich Di<strong>et</strong> 9.3 (NRD9.3) score to calculate the composite nutrient score of<br />
each di<strong>et</strong>. The NRD9.3 score is an adaptation of the Nutrient Rich <strong>Food</strong> 9.3 (NRF9.3) algorithm<br />
(Drewnowski, 2009), the latter reflect<strong>in</strong>g the nutrient density of a given food product per 100 kcal. In contrast<br />
to the NRF9.3 algorithm, the NRD9.3 algorithm is energy <strong>in</strong>dependent.<br />
The NRD9.3 score consists of a Total Nutrient Rich9 (TNR9) and a Total Limit<strong>in</strong>g3 (TLIM3) subscore.<br />
The TNR9 subscore (Eq. 1) computes the percentages of RDV for the n<strong>in</strong>e qualify<strong>in</strong>g nutrients. Intake levels<br />
of these nutrients were capped at 100% of their RDV. The TLIM3 subscore (Eq. 2) computes the percentages<br />
of MRV for the three disqualify<strong>in</strong>g nutrients. The NRD9.3 score (Eq. 3) of each di<strong>et</strong> was computed by subtract<strong>in</strong>g<br />
the TLIM3 subscore from the TNR9 subscore.<br />
396<br />
9<br />
,<br />
9 100<br />
i nutrienti<br />
capped<br />
TNR Eq. 1<br />
RDV<br />
i1 i<br />
3<br />
3 100<br />
i nutrient i<br />
TLIM Eq. 2<br />
MDV<br />
i1 i<br />
NRD9. 3 TNR9<br />
TLIM<br />
3<br />
Eq. 3<br />
where nutrienti is the amount (<strong>in</strong> g or mg or µg) of nutrient i <strong>in</strong> the di<strong>et</strong>, RDVi is the Recommended Daily<br />
Value of nutrient i, MDVi is the Maximum Daily Value of nutrient i.<br />
2.4. Comparison of the environmental impact of di<strong>et</strong>s<br />
Subsequently, we computed the Global Warm<strong>in</strong>g Potential (GWP) of each di<strong>et</strong> per FU. The impact of the<br />
di<strong>et</strong>s were reported <strong>in</strong> the reviewed articles. The impact derived from the reviewed articles was expressed as<br />
GWP/day. In the present paper we compared this expression with GWP relative to the FUs ‘prote<strong>in</strong>’ and<br />
‘NRD9.3’.<br />
Because overconsumption of qualify<strong>in</strong>g nutrients lessens the environmental impact per unit of nutrient,<br />
we explored the effect of capp<strong>in</strong>g qualify<strong>in</strong>g nutrient levels to 100% of their RDV. We used this capp<strong>in</strong>g also<br />
to compute the NRD9.3 score, which is based on capped scores for qualify<strong>in</strong>g nutrients and uncapped scores<br />
for disqualify<strong>in</strong>g nutrients. The NRD9.3 score thus does not give credits to overconsumption of qualify<strong>in</strong>g<br />
nutrients, whereas it does account for overconsumption of disqualify<strong>in</strong>g nutrients.<br />
To test wh<strong>et</strong>her the environmental impacts of the FUs ‘prote<strong>in</strong> uncapped’, ‘prote<strong>in</strong> capped’ and ‘NRD9.3’<br />
differed from the FU ‘day’, which was reported <strong>in</strong> the reviewed articles, we calculated the <strong>in</strong>dexed GWP/FU<br />
for each study and for each FU by s<strong>et</strong>t<strong>in</strong>g GWP/FU to 100 for a di<strong>et</strong> without ASFPs. We regressed the <strong>in</strong>dexed<br />
GWP/FU to the fractional content of ASFP <strong>in</strong> the di<strong>et</strong> (assessed by animal source prote<strong>in</strong>/total di<strong>et</strong>ary<br />
prote<strong>in</strong>). By calculat<strong>in</strong>g the difference b<strong>et</strong>ween the regression coefficient for ‘GWP/day’ and GWP per FUs<br />
‘prote<strong>in</strong> uncapped’, ‘prote<strong>in</strong> capped’ and ‘NRD9.3’ and test<strong>in</strong>g (by t-test) wh<strong>et</strong>her this difference differed<br />
significantly from 0, we could conclude wh<strong>et</strong>her our functional units gave a different contrast b<strong>et</strong>ween die-
PARALLEL SESSION 4B: DIET 8 th Int. Conference on <strong>LCA</strong> <strong>in</strong> the<br />
Agri-<strong>Food</strong> Sector, 1-4 Oct <strong>2012</strong><br />
tary scenarios than the FU ‘day’. Differences with a p-value less than 0.05 were considered to be statistically<br />
significant.<br />
3. Results<br />
3.1. Characteristics of di<strong>et</strong>s <strong>in</strong> selected studies<br />
We found 13 studies that m<strong>et</strong> our selection criteria (Carlsson-Kanyama, 1998; Carlsson-Kanyama <strong>et</strong> al.,<br />
2003; Carlsson-Kanyama and Gonzalez, 2009; Coll<strong>in</strong>s and Fairchild, 2007; Davis and Sonesson, 2008;<br />
Davis <strong>et</strong> al., 2010; Gerbens-Leenes and Nonhebel, 2002; Pathak <strong>et</strong> al., 2010; P<strong>et</strong>ers <strong>et</strong> al., 2007; Risku-Norja<br />
<strong>et</strong> al., 2008; Risku-Norja <strong>et</strong> al., 2009; Saxe <strong>et</strong> al., <strong>2012</strong>; Thibert and Badami, 2011).<br />
The size of the di<strong>et</strong>s described <strong>in</strong> these studies varied from s<strong>in</strong>gle meals to yearly per capita di<strong>et</strong>s. Meals<br />
conta<strong>in</strong>ed a median of five food products, whereas daily di<strong>et</strong>s conta<strong>in</strong>ed a median of 23 products. Some of<br />
the di<strong>et</strong>s are representative for a country or region, such as the average F<strong>in</strong>nish di<strong>et</strong> (Risku-Norja <strong>et</strong> al.,<br />
2008). Other di<strong>et</strong>s are self-def<strong>in</strong>ed alternatives, such as the pork and poultry-free di<strong>et</strong> (Risku-Norja <strong>et</strong> al.,<br />
2008). The contribution of animal prote<strong>in</strong> <strong>in</strong> the di<strong>et</strong>s differed from 0% <strong>in</strong> the various vegan scenarios to<br />
90%.<br />
3.2. Nutritional quality of meals and di<strong>et</strong>s<br />
Meals are not representative for a daily di<strong>et</strong>. In case we would scale-up a meal to a daily di<strong>et</strong>, i.e. scal<strong>in</strong>g<br />
up to a 2000 kcal di<strong>et</strong>, we observed vitam<strong>in</strong> A <strong>in</strong>take levels of over 1000% of RDV. Because the meals conta<strong>in</strong><br />
a relatively small number of food products, the <strong>in</strong>dividual nutrient scores are relatively sensitive to product<br />
choice. Because meals cannot be made representative for a daily consumption, further computations focussed<br />
exclusively on daily di<strong>et</strong>s and not on meals.<br />
Fig. 1 shows the prote<strong>in</strong> levels of daily di<strong>et</strong>s. The scenarios were clustered per study (<strong>in</strong>dicated by capital<br />
l<strong>et</strong>ters at the horizontal bar). With<strong>in</strong> study, the scenarios were ranked by their fractional content of animalsource<br />
prote<strong>in</strong>, rang<strong>in</strong>g from 0 to 78%. The horizontal l<strong>in</strong>e <strong>in</strong>dicates the RDV of prote<strong>in</strong> of 57 g. Most studies<br />
have one blank bar, which represents the average/actual scenario with<strong>in</strong> the studied country of region.<br />
Total prote<strong>in</strong> content ranged from 54 g (94% of RDV) <strong>in</strong> the vegan scenarios by Risku-Norja <strong>et</strong> al., (2008) to<br />
150 grams (263% of RDV) (P<strong>et</strong>ers <strong>et</strong> al., 2007). Among the scenarios with<strong>in</strong> study, the total (excess) content<br />
of prote<strong>in</strong> generally <strong>in</strong>creased with <strong>in</strong>creas<strong>in</strong>g fractional content of animal prote<strong>in</strong>.<br />
Figure 1. Daily <strong>in</strong>take of prote<strong>in</strong>. A: Gerbens-Leenes and Nonhebel, (2002); B: Risku-Norja <strong>et</strong> al., (2009); C:<br />
Coll<strong>in</strong>s and Fairchild, (2007); D:Risku-Norja <strong>et</strong> al., (2008); E: P<strong>et</strong>ers <strong>et</strong> al., (2007); F: Pathak <strong>et</strong> al., (2010);<br />
G: Saxe <strong>et</strong> al., (<strong>2012</strong>).<br />
The NRD9.3 score was generally lower for di<strong>et</strong>s that had a higher fractional content of animal prote<strong>in</strong><br />
(Fig. 2). This decrease is due especially to higher levels of sodium, saturated fat and total sugar <strong>in</strong> di<strong>et</strong>s that<br />
had higher fractional contents of animal prote<strong>in</strong>. Although di<strong>et</strong>s which conta<strong>in</strong> a lower fractional content of<br />
animal prote<strong>in</strong> have higher excess levels of fibre, di<strong>et</strong>s were not rewarded for this due to the applied capp<strong>in</strong>g.<br />
397
PARALLEL SESSION 4B: DIET 8 th Int. Conference on <strong>LCA</strong> <strong>in</strong> the<br />
Agri-<strong>Food</strong> Sector, 1-4 Oct <strong>2012</strong><br />
Figure 2. NRD9.3 scores of daily di<strong>et</strong>s. Figure 2 has the same format as Fig. 1. A: Gerbens-Leenes and Nonhebel,<br />
(2002); B: Risku-Norja <strong>et</strong> al., (2009); C: Coll<strong>in</strong>s and Fairchild, (2007); D:Risku-Norja <strong>et</strong> al., (2008);<br />
E: P<strong>et</strong>ers <strong>et</strong> al., (2007); F: Pathak <strong>et</strong> al., (2010); G: Saxe <strong>et</strong> al., (<strong>2012</strong>)<br />
3.3. Global warm<strong>in</strong>g potential of di<strong>et</strong>s<br />
Four studies evaluated the GWP of daily di<strong>et</strong>s (Pathak <strong>et</strong> al., 2010; Risku-Norja <strong>et</strong> al., 2008; Risku-Norja<br />
<strong>et</strong> al., 2009; Saxe <strong>et</strong> al., <strong>2012</strong>). With<strong>in</strong> Risku-Norja <strong>et</strong> al., 2009 and 2008 we dist<strong>in</strong>guish b<strong>et</strong>ween di<strong>et</strong>s conta<strong>in</strong><strong>in</strong>g<br />
food products from conventional (A) and organic (B) agriculture. In Figure 3 we show the <strong>in</strong>dexed<br />
GWP per FU. In the orig<strong>in</strong>al studies, the GWP per day was lower for di<strong>et</strong>s that had lower contributions of<br />
animal prote<strong>in</strong>. The same is true for the <strong>in</strong>dexed GWP per 100 g of ‘prote<strong>in</strong> capped’ and per unit of<br />
‘NRD9.3’. The GWP per 100 grams of ‘prote<strong>in</strong> uncapped’ was generally higher for di<strong>et</strong>s that had lower contributions<br />
of animal prote<strong>in</strong>. This is due to the higher (excessive) amount of prote<strong>in</strong> with<strong>in</strong> di<strong>et</strong>s that conta<strong>in</strong><br />
more animal prote<strong>in</strong> (Fig.1). Overall, the regression coefficient for the FU ‘day’ was significantly higher<br />
compared to the regression coefficient for the FU ‘prote<strong>in</strong> uncapped’ (p
PARALLEL SESSION 4B: DIET 8 th Int. Conference on <strong>LCA</strong> <strong>in</strong> the<br />
Agri-<strong>Food</strong> Sector, 1-4 Oct <strong>2012</strong><br />
4. Discussion<br />
The number of studies <strong>in</strong>cluded <strong>in</strong> our environmental analysis was limited. Besides, two of the three studies<br />
were from the same author. We found, however, that meals are not a good basis for comparison of the<br />
environmental impact of human di<strong>et</strong>s, as meals are not representative for daily consumption. Because meals<br />
conta<strong>in</strong> a limited number of food products, the amount of quantified nutrients <strong>in</strong> meals is also more sensitive<br />
to product choice compared to the quantified amount of nutrients <strong>in</strong> daily or yearly di<strong>et</strong>s.<br />
The prote<strong>in</strong> quality of a food product can be evaluated us<strong>in</strong>g the Prote<strong>in</strong> digestibility-corrected am<strong>in</strong>o acid<br />
score (PDCAAS) (Hughes <strong>et</strong> al., 2011). Because questions were raised concern<strong>in</strong>g the usability of the<br />
PDCAAS m<strong>et</strong>hod for assess<strong>in</strong>g prote<strong>in</strong> quality at a di<strong>et</strong> level (FAO/WHO, 1991; Schaafsma, 2000), we did<br />
not account for differences <strong>in</strong> prote<strong>in</strong> quality b<strong>et</strong>ween plant and animal based products.<br />
5. Conclusion<br />
Current comparisons of the global warm<strong>in</strong>g potential (GWP) of human di<strong>et</strong>s show that di<strong>et</strong>s that have<br />
higher levels of animal-source food products have higher GWP compared to di<strong>et</strong>s that have lower levels of<br />
animal-source food products. However, these comparisons do not account for differences <strong>in</strong> the nutritional<br />
quality of these di<strong>et</strong>s. The environmental impact of these di<strong>et</strong>s is expressed relative to the functional unit<br />
(FU) ‘day’. In this review, we computed the nutritional quality of di<strong>et</strong>s and evaluated the effect of account<strong>in</strong>g<br />
for nutritional quality when compar<strong>in</strong>g the environmental impacts of di<strong>et</strong>s that vary <strong>in</strong> their amount of animal-source<br />
food products.<br />
We concluded that di<strong>et</strong>s with higher levels of animal-source food products have higher (excess) contents<br />
of prote<strong>in</strong> and generally lower composite nutritional quality compared to di<strong>et</strong>s that are lower <strong>in</strong> animalsource<br />
food products.<br />
We evaluated the effect of us<strong>in</strong>g the FUs ‘prote<strong>in</strong> <strong>in</strong>take’ and ‘composite nutritional quality’. When we<br />
expressed GWP with respect to grams of prote<strong>in</strong>, we found that GWP was lower for di<strong>et</strong>s that had higher<br />
levels of animal-source food products. This lower GWP per gram of prote<strong>in</strong> <strong>in</strong> di<strong>et</strong>s with higher levels of<br />
animal-source food products was due to the higher (excess) <strong>in</strong>take levels of total prote<strong>in</strong> <strong>in</strong> these di<strong>et</strong>s. To<br />
avoid credit for overconsumption, we capped the prote<strong>in</strong> <strong>in</strong>take levels at 100% of the Daily Recommended<br />
Value and found that GWP per unit ‘prote<strong>in</strong> capped’ was <strong>in</strong> fact higher for di<strong>et</strong>s that had higher levels of<br />
animal-source food products. When we expressed GWP <strong>in</strong> terms of the composite nutritional quality, i.e.<br />
us<strong>in</strong>g ‘NRD9.3’ as FU, we found that GWP per unit NRD9.3 was higher for di<strong>et</strong>s that had higher levels of<br />
animal-source food products.<br />
Overall, the regression coefficient for the FU ‘day’ was significantly higher compared to the regression<br />
coefficient for the FU ‘prote<strong>in</strong> uncapped’, and was significantly lower compared to the regression coefficient<br />
for the FU ‘NRD9.3’. Not credit<strong>in</strong>g for overconsumption of prote<strong>in</strong> and account<strong>in</strong>g for overall nutritional<br />
quality thus gives a stronger contrast <strong>in</strong> the GWP b<strong>et</strong>ween di<strong>et</strong>s that vary <strong>in</strong> their amount of animal-source<br />
food products.<br />
6. References<br />
Carlsson-Kanyama, A., 1998. Climate change and di<strong>et</strong>ary choices - how can emissions of greenhouse gases from food consumption<br />
be reduced? <strong>Food</strong> Policy 23, 277-293.<br />
Carlsson-Kanyama, A., Ekstrom, M.P., Shanahan, H., 2003. <strong>Food</strong> and life cycle energy <strong>in</strong>puts: consequences of di<strong>et</strong> and ways to<br />
<strong>in</strong>crease efficiency. Ecological Economics 44, 293-307.<br />
Carlsson-Kanyama, A., Gonzalez, A.D., 2009. Potential contributions of food consumption patterns to climate change. American<br />
Journal of Cl<strong>in</strong>ical Nutrition 89, S1704-S1709.<br />
Coll<strong>in</strong>s, A., Fairchild, R., 2007. Susta<strong>in</strong>able food consumption at a sub-national level: An ecological footpr<strong>in</strong>t, nutritional and economic<br />
analysis. Journal of Environmental Policy and Plann<strong>in</strong>g 9, 5-30.<br />
Cordell, D., Drangert, J.O., White, S., 2009. The story of phosphorus: Global food security and food for thought. Global Environmental<br />
Change-Human and Policy Dimensions 19, 292-305.<br />
Davis, J., Sonesson, U., 2008. Life cycle assessment of <strong>in</strong>tegrated food cha<strong>in</strong>s - A Swedish case study of two chicken meals. Int J<br />
Life Cycle Assess 13, 574-584.<br />
Davis, J., Sonesson, U., Baumgartner, D.U., Nemecek, T., 2010. Environmental impact of four meals with different prote<strong>in</strong> sources:<br />
Case studies <strong>in</strong> Spa<strong>in</strong> and Sweden. <strong>Food</strong> Research International 43, 1874-1884.<br />
Drewnowski, A., 2009. Def<strong>in</strong><strong>in</strong>g Nutrient Density: Development and Validation of the Nutrient Rich <strong>Food</strong>s Index. Journal of the<br />
American College of Nutrition 28, 421S-426S.<br />
efsa, 2009. Scientific Op<strong>in</strong>ion of the Panel on Di<strong>et</strong><strong>et</strong>ic products, Nutrition and Allergies on a request from European Commission on<br />
the review of labell<strong>in</strong>g reference <strong>in</strong>take values for selected nutritional elements. The EFSA, 1-14.<br />
efsa, 2010. EFSA Panel on Di<strong>et</strong><strong>et</strong>ic Products, Nutrition, and Allergies (NDA); Scientific Op<strong>in</strong>ion on Di<strong>et</strong>ary Reference Values for<br />
carbohydrates and di<strong>et</strong>ary fibre. EFSA Journal 3, 1462 [77 pp.].<br />
efsa, <strong>2012</strong>. EFSA Panel on Di<strong>et</strong><strong>et</strong>ic Products, Nutrition and Allergies (NDA); Scientific Op<strong>in</strong>ion on Di<strong>et</strong>ary Reference Values for<br />
prote<strong>in</strong>. EFSA Journal 2, 2557 [66 pp.].<br />
399
PARALLEL SESSION 4B: DIET 8 th Int. Conference on <strong>LCA</strong> <strong>in</strong> the<br />
Agri-<strong>Food</strong> Sector, 1-4 Oct <strong>2012</strong><br />
EuropeanUnion, 2008. COMMISSION DIRECTIVE 2008/100/EC of 28 October 2008 amend<strong>in</strong>g Council Directive 90/496/EEC on<br />
nutrition labell<strong>in</strong>g for foodstuffs as regards<br />
recommended daily allowances, energy conversion factors and def<strong>in</strong>itions, Official Journal of the European Union. pp. 9-12.<br />
FAO/WHO, 1991. Prote<strong>in</strong> quality evaluation. Report of jo<strong>in</strong>t FAO/WHO Expert Consultation B<strong>et</strong>hesda, Md., USA 4-8 December<br />
1989. , FAO <strong>Food</strong> and Nutrition Paper 51. . FAO,, Rome.<br />
Gerbens-Leenes, P.W., Nonhebel, S., 2002. Consumption patterns and their effects on land required for food. Ecological Economics<br />
42, 185-199.<br />
Hansen, R.G., 1973. An Index of <strong>Food</strong> Quality. Nutrition Reviews 31, 1-7.<br />
Hughes, G.J., Ryan, D.J., Mukherjea, R., Schasteen, C.S., 2011. Prote<strong>in</strong> Digestibility-Corrected Am<strong>in</strong>o Acid Scores (PDCAAS) for<br />
Soy Prote<strong>in</strong> Isolates and Concentrate: Criteria for Evaluation. Journal of Agricultural and <strong>Food</strong> Chemistry 59, 12707-12712.<br />
Pathak, H., Ja<strong>in</strong>, N., Bhatia, A., Patel, J., Aggarwal, P.K., 2010. Carbon footpr<strong>in</strong>ts of Indian food items. Agriculture Ecosystems &<br />
Environment 139, 66-73.<br />
P<strong>et</strong>ers, C.J., Wilk<strong>in</strong>s, J.L., Fick, G.W., 2007. Test<strong>in</strong>g a compl<strong>et</strong>e-di<strong>et</strong> model for estimat<strong>in</strong>g the land resource requirements of food<br />
consumption and agricultural carry<strong>in</strong>g capacity: The New York State example. Renewable Agriculture and <strong>Food</strong> Systems 22,<br />
145-153.<br />
Risku-Norja, H., Hi<strong>et</strong>ala, R., Virtanen, H., K<strong>et</strong>omaki, H., Helenius, J., 2008. Localisation of primary food production <strong>in</strong> F<strong>in</strong>land:<br />
production potential and environmental impacts of food consumption patterns. Agricultural and <strong>Food</strong> Science 17, 127-145.<br />
Risku-Norja, H., Kurppa, S., Helenius, J., 2009. Di<strong>et</strong>ary choices and greenhouse gas emissions - Assessment of impact of veg<strong>et</strong>arian<br />
and organic options at national scale. Prog. Ind. Ecol. 6, 340-354.<br />
RIVM, 2011. NEVO table 2011. National Institute for Public Health and the Environment,, the N<strong>et</strong>herlands.<br />
Saxe, H., Larsen, T.M., Mogensen, L., <strong>2012</strong>. The global warm<strong>in</strong>g potential of two healthy Nordic di<strong>et</strong>s compared with the average<br />
Danish di<strong>et</strong>. Clim. Change, 1-14.<br />
Schaafsma, G., 2000. The prote<strong>in</strong> digestibility-corrected am<strong>in</strong>o acid score. Journal of Nutrition 130, 1865S-1867S.<br />
Smedman, A., L<strong>in</strong>dmark-Månsson, H., Drewnowski, A., Edman, A.K.M., 2010. Nutrient density of beverages <strong>in</strong> relation to climate<br />
impact. <strong>Food</strong> Nutri. Res. 54.<br />
Ste<strong>in</strong>feld, H., Gerber, P., Wassenaar, T., Castel, V., Rosales, M., Haan de, C., 2006. Livestock's long shadow. Environmental issues<br />
and options. FAO, Rome.<br />
Thibert, J., Badami, M.G., 2011. Estimat<strong>in</strong>g and communicat<strong>in</strong>g food system impacts: A case study <strong>in</strong> Montreal, Quebec. Ecological<br />
Economics 70, 1814-1821.<br />
400
PARALLEL SESSION 4B: DIET 8 th Int. Conference on <strong>LCA</strong> <strong>in</strong> the<br />
Agri-<strong>Food</strong> Sector, 1-4 Oct <strong>2012</strong><br />
A novel nutrition-based functional equivalency m<strong>et</strong>ric for<br />
comparative life cycle assessment of food<br />
Mart<strong>in</strong> C. Heller * , Gregory A. Keoleian<br />
Center for Susta<strong>in</strong>able Systems, University of Michigan, Ann Arbor, MI, USA<br />
* Correspond<strong>in</strong>g author. E-mail: mcheller@umich.edu<br />
ABSTRACT<br />
Establish<strong>in</strong>g functional equivalency b<strong>et</strong>ween disparate food types rema<strong>in</strong>s a m<strong>et</strong>hodological challenge for comparative environmental<br />
impact studies. In this paper, we demonstrate the <strong>in</strong>fluence of functional unit choice on the life cycle energy and greenhouse gas<br />
emissions for a vari<strong>et</strong>y of food types. We <strong>in</strong>troduce a novel functional unit approach utiliz<strong>in</strong>g the NuVal nutritional quality scor<strong>in</strong>g<br />
system. NuVal comb<strong>in</strong>es over 30 micro- and macro-nutrient properties of foods <strong>in</strong>to a s<strong>in</strong>gle score weighted on the basis of the<br />
effects that nutrients have on health. “Nutritional weight<strong>in</strong>g” of environmental impact scores expressed per unit of food energy<br />
clearly <strong>in</strong>fluences the rank<strong>in</strong>g of foods based on their environmental impact. The nutritionally weighted environmental impact <strong>in</strong>dicator<br />
provides a useful means to holistically account for nutritional quality <strong>in</strong> compar<strong>in</strong>g and differentiat<strong>in</strong>g foods us<strong>in</strong>g life cycle<br />
assessment.<br />
Keywords: functional unit, nutrition, health, ONQI, NuVal, nutritional quality <strong>in</strong>dex<br />
1. Introduction<br />
Establish<strong>in</strong>g functional equivalency has always been a m<strong>et</strong>hodological challenge <strong>in</strong> life cycle assessment<br />
studies of foods. <strong>Food</strong> <strong>LCA</strong>s often use the system reference flow (mass or volume) as the functional unit<br />
(Schau and F<strong>et</strong>, 2008). Functional units are chosen to serve the goal and scope of the study (ISO, 2006), and<br />
often a mass- or volume-based functional unit is sufficient for a stand-alone system assessment. However,<br />
this reference flow basis does not fully capture the primary function of foods – deliver<strong>in</strong>g nutrition – mak<strong>in</strong>g<br />
comparisons b<strong>et</strong>ween different food types <strong>in</strong> consumer-oriented analyses difficult. Water content of foods<br />
can also play an important role with mass- or volume-based functional units as water adds mass or volume<br />
without effect<strong>in</strong>g quality such as nutrient or energy content. Numerous approaches have been put forth to<br />
address this food functional equivalency challenge. Quality-based correction factors such as “energy corrected<br />
milk” (e.g., Cederberg & Mattsson, 2000) or “prote<strong>in</strong> corrected wheat” (e.g., Audsley, 2003) assist <strong>in</strong><br />
normaliz<strong>in</strong>g natural variations <strong>in</strong> qualities that <strong>in</strong>fluence value and process<strong>in</strong>g. Mart<strong>in</strong>ez-Blanco, <strong>et</strong> al.,<br />
(2011) use antioxidant compound content as a functional unit when compar<strong>in</strong>g cultivation and fertiliser options<br />
<strong>in</strong> cauliflower production. In a recent literature review, de Vries and de Boer (2010) compare impacts<br />
of livestock products on the functional unit basis of “prote<strong>in</strong> delivered” and “average daily <strong>in</strong>take,” allow<strong>in</strong>g<br />
comparison across disparate food types. Such s<strong>in</strong>gle nutrient based functional units have merit for particular<br />
study goals, but the fact rema<strong>in</strong>s that healthy nutrition is complex and multi-dimensional. Schau and F<strong>et</strong><br />
(2008) propose the need for a quality corrected functional unit that <strong>in</strong>corporates fat, prote<strong>in</strong> and carbohydrate<br />
content, as well as potentially other quality functions, as deemed necessary.<br />
The Overall Nutritional Quality Index (ONQI) is a tool designed to aid consumers <strong>in</strong> mak<strong>in</strong>g well<strong>in</strong>formed<br />
di<strong>et</strong>ary choices (Katz <strong>et</strong> al., 2010). Developed by nutrition and public health experts, the ONQI<br />
algorithm comb<strong>in</strong>es <strong>in</strong>to a s<strong>in</strong>gle score over 30 entries represent<strong>in</strong>g both micro- and macronutrient properties<br />
of foods, weighted on the basis of the effects (both promotional and d<strong>et</strong>rimental) that nutrients have on<br />
health. The <strong>in</strong>dex has been validated through expert panel rank<strong>in</strong>gs and statistical di<strong>et</strong> comparisons, and has<br />
been implemented <strong>in</strong> over 500 supermark<strong>et</strong>s across the US as NuVal.<br />
In this paper, we explore the utility of ONQI as a nutrition-based functional equivalency m<strong>et</strong>ric <strong>in</strong> environmental<br />
impact assessments of food. Us<strong>in</strong>g the NuVal score (ONQI adjusted to values from 1-100) as a<br />
nutritional weight<strong>in</strong>g factor allows comparisons of environmental impacts of foods on the basis of their relative<br />
contribution to a healthy di<strong>et</strong>. These results are contrasted with results based on s<strong>in</strong>gle-dimension functional<br />
units (e.g., weight, serv<strong>in</strong>g, kg prote<strong>in</strong>, and energy content).<br />
2. M<strong>et</strong>hods<br />
2.1. <strong>Food</strong> nutritional <strong>in</strong>formation<br />
Nutritional and serv<strong>in</strong>g size <strong>in</strong>formation for the vari<strong>et</strong>y of foods found <strong>in</strong> Table 1 were from the USDA<br />
<strong>Food</strong> and Nutrient Database for Di<strong>et</strong>ary Studies, v 5.0 (Ahuja <strong>et</strong> al., <strong>2012</strong>), accessed via the “What’s In The<br />
<strong>Food</strong>s You Eat” Search Tool v. 5.0 (USDA, <strong>2012</strong>). Nutritional data are for foods as listed <strong>in</strong> Table 1. These<br />
were matched as closely as possible to <strong>LCA</strong> and NuVal data.<br />
401
PARALLEL SESSION 4B: DIET 8 th Int. Conference on <strong>LCA</strong> <strong>in</strong> the<br />
Agri-<strong>Food</strong> Sector, 1-4 Oct <strong>2012</strong><br />
2.2. Collection of life cycle based environmental impacts of foods<br />
Estimates of greenhouse gas emissions (GHG) (kg CO2e/ kg food) and energy use (MJ/kg food) were<br />
taken from the life cycle <strong>in</strong>ventories aggregated and reported by Gonzalez, <strong>et</strong> al., 2011. Gonzalez, <strong>et</strong> al.,<br />
present LC results on the basis of 1 kg of food product delivered to the entry port of Gothenburg, Sweden;<br />
meat products are on a bone-free carcass basis, while cereals and beans are reported as dry gra<strong>in</strong> at the port.<br />
Arithm<strong>et</strong>ic means were taken when multiple entries (represent<strong>in</strong>g different countries of orig<strong>in</strong>) were reported<br />
for the same food type. Values for veg<strong>et</strong>ables reflect impacts of open-field production rather than production<br />
<strong>in</strong> heated greenhouses. Values for salmon represent farmed salmon.<br />
A recognized discrepancy <strong>in</strong> the water content of rice and dry beans b<strong>et</strong>ween the cooked state as provided<br />
by the USDA <strong>Food</strong> and Nutrient database and the dry state “as delivered to the entry port” used by Gonzalez<br />
<strong>et</strong> al., was corrected by assum<strong>in</strong>g that dry rice and beans conta<strong>in</strong> 10% moisture (USDA, 2011). All other<br />
foods are assumed to have moisture content correspond<strong>in</strong>g to that reported by the <strong>Food</strong> and Nutrient database<br />
(Table 1). While there is likely a discrepancy <strong>in</strong> water content for meats b<strong>et</strong>ween the carcass basis and<br />
cooked basis, it is assumed that this is relatively small (
PARALLEL SESSION 4B: DIET 8 th Int. Conference on <strong>LCA</strong> <strong>in</strong> the<br />
Agri-<strong>Food</strong> Sector, 1-4 Oct <strong>2012</strong><br />
bution), whereas cheese rises from a rank<strong>in</strong>g of 7 th on a food energy basis to a rank<strong>in</strong>g of 3 rd on a “nutritionally<br />
weighted” basis. Fig. 1 shows the <strong>in</strong>fluence of the NuVal “nutritional weight<strong>in</strong>g” on life cycle energy<br />
and GHG emissions. Fruits and veg<strong>et</strong>ables with NuVal scores approach<strong>in</strong>g 100 are not affected by the<br />
weight<strong>in</strong>g whereas most animal-based foods show a marked <strong>in</strong>crease due to the nutritional weight<strong>in</strong>g.<br />
Brown rice and white rice, which are assumed to have the same environmental impact per kg, are differentiated<br />
by the nutritional weight<strong>in</strong>g, while skim and whole milk, also assumed to have the same environmental<br />
impact per kg (as consumed), show a difference per kcal food energy (due to the caloric content of the fat <strong>in</strong><br />
whole milk) that is largely negated by the nutritional weight<strong>in</strong>g (aga<strong>in</strong>, presumably due to negative effect of<br />
whole milk’s fat content on its NuVal score.)<br />
Table 1. Nutritional and environmental impact data<br />
Abbreviation<br />
used<br />
<strong>in</strong> paper<br />
<strong>Food</strong> description per USDA nutrition data a, d USDA nutrition data (per serv<strong>in</strong>g) a<br />
g/ serv<strong>in</strong>g<br />
g water/<br />
serv<strong>in</strong>g<br />
kcal/<br />
serv<strong>in</strong>g<br />
g prote<strong>in</strong>/<br />
serv<strong>in</strong>g<br />
Life Cycle environmental<br />
impact b<br />
MJ/kg kg CO2e/<br />
kg<br />
NuVal as<br />
displayed <strong>in</strong><br />
grocer<br />
beef ground beef, 85%-89% lean, cooked 87 52.3 200 21.25 44.63 29.29 32 (23-37) e<br />
lamb lamb, ground, cooked 77 42 216 18.9 46.00 25.67 27 (24-28) e<br />
pork pork, ground or patty, cooked 85 44.46 251 21.66 28.00 8.20 37 (16-39) e<br />
chicken chicken, ground 85 50.12 201 23.01 26.67 4.75 37 (16-39) e<br />
tuna tuna, canned, water pack 85 63.3 99 21.68 26.00 2.60 58<br />
salmon salmon, raw 57 41.42 83 12.32 45.00 3.27 87<br />
cheese cheese, natural, cheddar or American type 28 10.29 113 6.97 41.80 8.60 23<br />
skim milk milk, Ca fortified, cow's, fluid, skim or nonfat 247 224.28 86 8.4 3.05 1.10 81<br />
whole<br />
milk<br />
milk, cow's, fluid, whole 244 215.04 149 7.69 3.05 1.10 52<br />
egg egg, whole, raw 50 38.08 72 6.28 14.33 3.00 33<br />
brown rice rice, brown, cooked, regular, fat not added <strong>in</strong><br />
cook<strong>in</strong>g<br />
white rice rice, white, cooked, regular, fat not added <strong>in</strong><br />
cook<strong>in</strong>g<br />
dry beans beans, dry, cooked, NS as to type, fat not added<br />
<strong>in</strong> cook<strong>in</strong>g<br />
131 95 c<br />
105 71.19 c<br />
88 58.2 c<br />
144 3.35 7.87 c<br />
135 2.79 7.87 c<br />
111 7.65 2.90 c<br />
apple apple, raw 138 118.07 72 0.36 3.56 0.28 96<br />
orange orange, raw 131 113.64 62 1.23 3.75 0.33 100<br />
strawberries<br />
strawberries, raw 72 65.48 23 0.48 4.10 0.38 100<br />
tomatoes tomatoes, raw 123 116.26 22 1.08 3.35 0.33 96<br />
potato white potato, baked, peel eaten, fat not added <strong>in</strong><br />
cook<strong>in</strong>g<br />
173 128.68 159 4.29 1.98 0.20 93<br />
broccoli broccoli, raw 44 39.29 15 1.24 3.60 0.37 100<br />
l<strong>et</strong>tuce l<strong>et</strong>tuce, raw 55 52.6 8 0.5 2.20 0.20 99 (82-100) e<br />
w<strong>in</strong>ter squash, w<strong>in</strong>ter type, baked, no fat or sugar<br />
squash added <strong>in</strong> cook<strong>in</strong>g<br />
be<strong>et</strong>s be<strong>et</strong>s, cooked, from fresh, NS as to fat added <strong>in</strong><br />
cook<strong>in</strong>g<br />
1.20 c<br />
1.20 c<br />
1.00 c<br />
103 91.46 38 0.92 0.96 0.09 94 (91-100) e<br />
88 75 50 1.43 1.10 0.11 99<br />
cucumber cucumber, raw 60 58.04 7 0.35 0.84 0.08 93<br />
cabbage cabbage, green, raw 45 41.48 11 0.58 1.10 0.12 99 (96-100) e<br />
carrots carrots, raw 28 24.72 11 0.26 1.34 0.12 99<br />
onions onions, mature, raw 14 12.48 6 0.15 1.00 0.10 93 (91-100) e<br />
a<br />
USDA, <strong>2012</strong><br />
b<br />
Gonzalez, <strong>et</strong> al., 2011<br />
c<br />
corrected discrepancy b<strong>et</strong>ween cooked moisture content and “as delivered to port” moisture content used by Gonzalez, <strong>et</strong> al., (assumed to be 10%).<br />
See M<strong>et</strong>hods for correction d<strong>et</strong>ails.<br />
d<br />
“NS” <strong>in</strong> this table stands for “not specified” and refers to a lack of specificity <strong>in</strong> describ<strong>in</strong>g the food analysed for nutritional content.<br />
e<br />
these scores are averages of a collection of food products, as provided directly by NuVal LLC. Values with<strong>in</strong> parentheses represent m<strong>in</strong>imum and<br />
maximum NuVal scores for the given collection of food products.<br />
4. Discussion<br />
Functional unit choice clearly <strong>in</strong>fluences the outcome <strong>in</strong> a comparative study of the environmental impact<br />
of different foods, as is shown <strong>in</strong> Tables 2 and 3. This <strong>in</strong>fluence has been demonstrated previously: Gonzalez<br />
<strong>et</strong> al., 2011, explore the prote<strong>in</strong> delivery efficiency of various foods (the <strong>in</strong>verse of environmental<br />
82<br />
48<br />
93<br />
403
PARALLEL SESSION 4B: DIET 8 th Int. Conference on <strong>LCA</strong> <strong>in</strong> the<br />
Agri-<strong>Food</strong> Sector, 1-4 Oct <strong>2012</strong><br />
Figure 1. Influence of a NuVal “nutritional weight<strong>in</strong>g” on the life cycle (LC) greenhouse gas emissions and<br />
energy use per kcal of food energy for a vari<strong>et</strong>y of foods.<br />
Table 2. Life Cycle Energy Use for a vari<strong>et</strong>y of foods, expressed on different functional unit bases. Values<br />
<strong>in</strong> parentheses are the rank<strong>in</strong>g (high to low impact) of foods <strong>in</strong> each column.<br />
per dry weight per serv<strong>in</strong>g per g prote<strong>in</strong> per kcal food energy per kcal w/ NuVal "nutritional weight<strong>in</strong>g"<br />
MJ/ kg DW MJ/ serv<strong>in</strong>g MJ/ g prote<strong>in</strong> MJ/ kcal food energy MJ/ nutritional kcal*<br />
beef 111.88 (2) 3.88 (1) 0.18 (9) 0.019 (3) 0.061 (2)<br />
lamb 101.20 (4) 3.54 (2) 0.19 (7) 0.016 (5) 0.061 (1)<br />
pork 58.71 (9) 2.38 (4) 0.11 (14) 0.009 (12) 0.026 (8)<br />
chicken 64.98 (6) 2.27 (5) 0.10 (18) 0.011 (8) 0.030 (6)<br />
tuna 101.84 (3) 2.21 (6) 0.102 (17) 0.022 (2) 0.038 (4)<br />
salmon 164.63 (1) 2.57 (3) 0.21 (6) 0.031 (1) 0.036 (5)<br />
cheese 66.09 (5) 1.17 (7) 0.17 (9) 0.010 (10) 0.045 (3)<br />
skim milk 33.16 (13) 0.75 (8) 0.090 (22) 0.009 (13) 0.011 (12)<br />
whole milk 25.70 (16) 0.74 (9) 0.10 (19) 0.005 (17) 0.010 (14)<br />
egg 60.12 (8) 0.72 (10) 0.11 (13) 0.010 (11) 0.030 (7)<br />
brown rice 8.74 (21) 0.31 (15) 0.094 (20) 0.002 (23) 0.003 (22)<br />
white rice 8.74 (22) 0.30 (16) 0.11 (16) 0.002 (22) 0.005 (18)<br />
dry beans 3.22 (26) 0.10 (22) 0.013 (26) 0.001 (26) 0.001 (26)<br />
apple 24.66 (17) 0.49 (11) 1.37 (1) 0.007 (16) 0.007 (17)<br />
orange 28.30 (14) 0.49 (12) 0.40 (3) 0.008 (14) 0.008 (15)<br />
strawberries 45.28 (11) 0.30 (17) 0.62 (2) 0.013 (7) 0.013 (11)<br />
tomatoes 61.14 (7) 0.41 (13) 0.38 (4) 0.019 (4) 0.020 (9)<br />
potato 7.73 (24) 0.34 (14) 0.080 (24) 0.002 (24) 0.002 (24)<br />
broccoli 33.63 (12) 0.16 (18) 0.13 (12) 0.011 (9) 0.011 (13)<br />
l<strong>et</strong>tuce 50.42 (10) 0.12 (19) 0.24 (5) 0.015 (6) 0.015 (10)<br />
w<strong>in</strong>ter squash 8.57 (23) 0.10 (20) 0.11 (15) 0.003 (20) 0.003 (21)<br />
be<strong>et</strong>s 7.45 (25) 0.10 (21) 0.068 (25) 0.002 (25) 0.002 (25)<br />
cucumber 25.71 (15) 0.050 (23) 0.14 (10) 0.007 (15) 0.008 (16)<br />
cabbage 14.06 (18) 0.050 (24) 0.085 (23) 0.005 (18) 0.005 (19)<br />
carrots 11.40 (19) 0.037 (25) 0.14 (11) 0.003 (19) 0.003 (20)<br />
onions 9.21 (20) 0.014 (26) 0.093 (21) 0.002 (21) 0.003 (23)<br />
impact per g prote<strong>in</strong>); deVries and de Boer, 2010 consider the environmental impact of animal-based foods<br />
on a per kg prote<strong>in</strong> and a per average daily <strong>in</strong>take basis. In this paper, we <strong>in</strong>troduce an attempt to <strong>in</strong>corporate<br />
a more nutritionally holistic functional unit. The NuVal nutrition <strong>in</strong>dicator has been applied as a weight<strong>in</strong>g<br />
factor to environmental impacts per food energy content because the NuVal algorithm considers nutrient<br />
content relative to food energy. In essence, the “nutritionally weighted” functional unit suggests that not all<br />
food calories are created equal: depend<strong>in</strong>g on other nutritional components, food calories can contribute<br />
more or less toward a healthy di<strong>et</strong>. As can be seen <strong>in</strong> Figure 1, the carbon footpr<strong>in</strong>t of pork, chicken, tuna,<br />
404
PARALLEL SESSION 4B: DIET 8 th Int. Conference on <strong>LCA</strong> <strong>in</strong> the<br />
Agri-<strong>Food</strong> Sector, 1-4 Oct <strong>2012</strong><br />
salmon, cheese, milk and eggs on a per kcal basis are relatively similar, but apply<strong>in</strong>g the NuVal based “nutritional<br />
weight<strong>in</strong>g” clear differentiates these foods on a per nutritional kcal basis.<br />
The <strong>in</strong>fluence of a “nutritionally weighted” functional unit is perhaps clearer <strong>in</strong> more extreme comparisons.<br />
Coca-Cola reports that their product delivered <strong>in</strong> 2 L plastic bottles has a carbon footpr<strong>in</strong>t of 0.25 kg<br />
CO2e/ L (Coca-Cola Co., 2010), which, on a caloric content basis, is a factor of 3 smaller than whole milk.<br />
Coca-Cola receives a NuVal score of 1, however, so on a nutritionally weighted basis, the carbon footpr<strong>in</strong>t of<br />
Coca-Cola is 17 times greater than that of whole milk.<br />
5. Conclusion<br />
We propose a functional unit that addresses a primary function of food, which is to deliver healthpromot<strong>in</strong>g<br />
nutrition. The NuVal score, which evaluates multiple nutritional properties of food, provides a<br />
convenient basis for more comprehensive comparisons of life cycle environmental susta<strong>in</strong>ability performance<br />
across diverse food types.<br />
Table 3. Life Cycle Greenhouse Gas Emissions for a vari<strong>et</strong>y of foods, expressed on different functional unit<br />
bases. Values <strong>in</strong> parentheses are the rank<strong>in</strong>g (high to low impact) of foods <strong>in</strong> each column.<br />
per dry weight per serv<strong>in</strong>g per g prote<strong>in</strong> per kcal food energy<br />
kg CO2e/ kcal food<br />
per kcal w/ NuVal "nutritional<br />
weight<strong>in</strong>g"<br />
kg CO2 eq/ kg DW kg CO2e/ serv<strong>in</strong>g kg CO2e/ g prote<strong>in</strong> energy kg CO2 e/ nutritional kcal*<br />
beef 73.43 (1) 2.55 (1) 0.12 (1) 0.01274 (1) 0.03981 (1)<br />
lamb 56.47 (2) 1.98 (2) 0.10 (3) 0.00915 (2) 0.03389 (2)<br />
pork 17.19 (3) 0.70 (3) 0.032 (10) 0.00278 (4) 0.00751 (4)<br />
chicken 11.58 (8) 0.40 (4) 0.018 (13) 0.00201 (9) 0.00543 (6)<br />
tuna 10.18 (9) 0.22 (8) 0.010 (20) 0.00223 (6) 0.00385 (8)<br />
salmon 11.95 (7) 0.19 (9) 0.015 (15) 0.00224 (5) 0.00258 (10)<br />
cheese 13.60 (4) 0.24 (7) 0.035 (8) 0.00213 (7) 0.00927 (3)<br />
skim milk 11.96 (6) 0.27 (5) 0.032 (9) 0.00316 (3) 0.00390 (7)<br />
whole milk 9.27 (10) 0.27 (6) 0.035 (6) 0.00180 (11) 0.00346 (9)<br />
egg 12.58 (5) 0.15 (10) 0.024 (11) 0.00208 (8) 0.00631 (5)<br />
brown rice 1.33 (20) 0.048 (11) 0.014 (16) 0.00033 (20) 0.00041 (20)<br />
white rice 1.33 (19) 0.045 (12) 0.016 (14) 0.00033 (19) 0.00070 (16)<br />
dry beans 1.11 (21) 0.033 (17) 0.004 (26) 0.00030 (21) 0.00032 (21)<br />
apple 1.96 (17) 0.039 (15) 0.11 (2) 0.00054 (17) 0.00057 (18)<br />
orange 2.45 (15) 0.043 (13) 0.035 (7) 0.00069 (15) 0.00069 (17)<br />
strawberries 4.20 (13) 0.027 (18) 0.057 (4) 0.00119 (13) 0.00119 (13)<br />
tomatoes 5.93 (11) 0.040 (14) 0.037 (5) 0.00182 (10) 0.00189 (11)<br />
potato 0.79 (25) 0.035 (16) 0.008 (24) 0.00022 (25) 0.00024 (25)<br />
broccoli 3.46 (14) 0.016 (19) 0.013 (18) 0.00109 (14) 0.00109 (14)<br />
l<strong>et</strong>tuce 4.51 (12) 0.011 (20) 0.022 (12) 0.00135 (12) 0.00137 (12)<br />
w<strong>in</strong>ter squash 0.80 (24) 0.009 (22) 0.010 (21) 0.00024 (23) 0.00026 (23)<br />
be<strong>et</strong>s 0.74 (26) 0.010 (21) 0.007 (25) 0.00019 (26) 0.00020 (26)<br />
cucumber 2.45 (16) 0.005 (24) 0.014 (17) 0.00069 (16) 0.00074 (15)<br />
cabbage 1.53 (18) 0.005 (23) 0.009 (23) 0.00049 (18) 0.00050 (19)<br />
carrots 0.98 (22) 0.003 (25) 0.012 (19) 0.00029 (22) 0.00030 (22)<br />
onions 0.92 (23) 0.001 (26) 0.009 (22) 0.00023 (24) 0.00025 (24)<br />
Of course, there are always <strong>in</strong>herent limitations to scor<strong>in</strong>g systems that attempt to <strong>in</strong>corporate multiple attributes,<br />
and NuVal is no exception. The NuVal score is based on empirically derived weight<strong>in</strong>g factors that<br />
currently rema<strong>in</strong> confidential; thus, the nutritional factors that are the major drivers of the NuVal score are<br />
not immediately apparent.<br />
This approach to establish<strong>in</strong>g a nutritional equivalency m<strong>et</strong>ric for environmental impact studies of food is<br />
<strong>in</strong>tended to stimulate and encourage discussion and further exploration of an important topic. Given limitations<br />
to the approach presented here, extreme care must be taken <strong>in</strong> fully communicat<strong>in</strong>g, and further consider<strong>in</strong>g,<br />
the mean<strong>in</strong>g of a “nutritionally weighted kcal.” Other similar nutritional <strong>in</strong>dicators, such as the Nutrient<br />
Rich <strong>Food</strong>s Index (Drewnowski, 2010), may warrant consideration. Ultimately, it may be more beneficial<br />
to consider nutritional equivalency and environmental impact of foods by aggregat<strong>in</strong>g to the whole di<strong>et</strong><br />
level. Given a diversity of research goals and the complexity of food and agricultural systems, there are<br />
likely many ‘correct’ answers to the question of food functional equivalency; our hope is that the approach<br />
presented here provides practitioners with an additional tool to consider.<br />
6. References<br />
Ahuja J.K.A., Montville J.B., Omolewa-Tomobi G., Heendeniya K.Y., Mart<strong>in</strong> C.L., Ste<strong>in</strong>feldt L.C., Anand J., Adler M.E., LaComb<br />
R.P., Moshfegh A.J., <strong>2012</strong>. USDA <strong>Food</strong> and Nutrient Database for Di<strong>et</strong>ary Studies, 5.0. U.S. Department of Agriculture, Agricultural<br />
Research Service, <strong>Food</strong> Surveys Research Group, Beltsville, MD.<br />
405
PARALLEL SESSION 4B: DIET 8 th Int. Conference on <strong>LCA</strong> <strong>in</strong> the<br />
Agri-<strong>Food</strong> Sector, 1-4 Oct <strong>2012</strong><br />
Audsley, E., 2003. Harmonisation of environmental life cycle assessment for agriculture: f<strong>in</strong>al report. Concerted Action AIR3-CT94-<br />
2028, European Commission DG VI Agriculture, Brussels.<br />
Cederberg, C. Mattsson, B., 2000. Life cycle assessment of milk production – a comparison of conventional and organic farm<strong>in</strong>g. J.<br />
Cleaner Prod. 8, 49-60.<br />
Coca-Cola Co., 2010. Coca-Cola, Great Britian/Environment. Website accessed: 5/25/<strong>2012</strong>. http://www.cocacola.co.uk/environment/what-s-the-carbon-footpr<strong>in</strong>t-of-a-coca-cola.html.<br />
De Vries, M., de Boer, I.J.M., 2010. Compar<strong>in</strong>g environmental impacts for livestock products: A review of life cycle assessments.<br />
Livestock Science. 128, 1-11.<br />
Drewnowski, A., 2010. The Nutrient Rich <strong>Food</strong>s Index helps to identify healthy, affordable foods. Am. J. Cl<strong>in</strong>. Nutr. 91, 1095S-<br />
1101S.<br />
Gonzalez, A.D., Frostell, B., Carlsson-Kanyama, A., 2011. Prote<strong>in</strong> efficiency per unit energy and per unit green house gas emissions:<br />
Potential contribution of di<strong>et</strong> choices toc limate change mitigation. <strong>Food</strong> Policy 36(5). 562-570.<br />
ISO, 2006. Environmental management – life cycle assessment – pr<strong>in</strong>ciples and framework. ISO 14040.<br />
Katz, D.L., Njike, V.Y., Faridi, Z., Rhee, L.Q., Reeves, R.S., Jenk<strong>in</strong>s, D.J.A., Ayoob, K.T., 2009. The Stratification of <strong>Food</strong>s on the<br />
Basis of Overall Nutritional Quality: The Overall Nutritional Quality Index. Am. J. Health Promot. 24, 133-143.<br />
Katz, D.L., Njike, V.Y., Rhee, L.Q., Re<strong>in</strong>gold, A., Ayoob, K.T., 2010. Performance characteristics of NuVal and the Overall Nutritional<br />
Quality Index (ONQI). Am. J. Cl<strong>in</strong>. Nutr. 91, 1102S-1108S.<br />
Mart<strong>in</strong>ez-Blanco, J., Anton, A., Rieradevall, J., Castellari, M., Munoz, P., 2011. Compar<strong>in</strong>g nutritional value and yield as functional<br />
units <strong>in</strong> the environmental assessment of horticultural production with organic or m<strong>in</strong>eral fertilization. Int. J. <strong>LCA</strong>. 16(1), 12-26.<br />
NuVal, LLC., <strong>2012</strong>. Email communication, 5/22/<strong>2012</strong>. http://www.nuval.com/.<br />
Schau, E. M., F<strong>et</strong>, A. M., 2008. <strong>LCA</strong> Studies of <strong>Food</strong> Products as Background for Environmental Product Declarations. Int. J. <strong>LCA</strong>.<br />
13, 255-264.<br />
USDA, 2011. USDA National Nutrient Database for Standard Reference, Release 24. U.S. Department of Agriculture, Agricultural<br />
Research Service, Nutrient Data Laboratory Home Page, http://www.ars.usda.gov/nutrientdata<br />
USDA, <strong>2012</strong>. What’s In The <strong>Food</strong>s You Eat Search Tool, v. 5.0. U.S. Department of Agriculture, Agricultural Research Service.<br />
http://www.ars.usda.gov/Services/docs.htm?docid=17032.<br />
406
PARALLEL SESSION 4C: CROP PRODUCTION SYSTEMS 8 th Int. Conference on <strong>LCA</strong> <strong>in</strong> the<br />
Parallel session 4c: Crop Production Systems<br />
State of the art of <strong>LCA</strong> application <strong>in</strong> the fruit sector<br />
Agri-<strong>Food</strong> Sector, 1-4 Oct <strong>2012</strong><br />
Alessandro K. Cerutti 1 , Simona Bosco 2 , Gabriele L. Beccaro 1 , Cristiana Peano 1 , Bruno Notarnicola 3 ,<br />
Giancarlo Bounous 1<br />
1 Department of Arboriculture, University of Tor<strong>in</strong>o, Via Leonardo da V<strong>in</strong>ci, 44 – 10095 Grugliasco (TO), Italy<br />
2 Institute of Life Sciences – Scuola Superiore S. Anna, Piazza Martiri della Libertà, 33 - 56127 Pisa, Italy<br />
3 II Faculty of Economics, Taranto, University of Bari Aldo Moro, Piazza Umberto I, 1 - 70121 Bari, Italy<br />
Correspond<strong>in</strong>g author. E-mail: alessandro.cerutti@unito.it<br />
ABSTRACT<br />
This paper critically reviews <strong>LCA</strong> studies <strong>in</strong> fruit production and distribution systems as a part of the results of the work carried out<br />
by the Agri-<strong>Food</strong> work<strong>in</strong>g group of the “R<strong>et</strong>e Italiana <strong>LCA</strong>” (Italian <strong>LCA</strong> N<strong>et</strong>work) – fruit products subgroup. Most used features of<br />
<strong>LCA</strong> application <strong>in</strong> the fruit sector are <strong>in</strong>vestigated <strong>in</strong> order to describe a specific research framework and to suggest standardisation<br />
<strong>in</strong> some specific aspects of the evaluation.<br />
Keywords: fruit products, orchard, fruit cultivars, susta<strong>in</strong>able production, susta<strong>in</strong>able distribution, r<strong>et</strong>ail systems<br />
1. Introduction<br />
In 2010, world production of fruit was 609,213,512 t, mostly concentrated <strong>in</strong> Asia (52%) and America<br />
(22%) (FAOSTAT, <strong>2012</strong>). In Europe, the same year, there were produced 67,254,709 t of fruit (about 11%<br />
of the fruit produced <strong>in</strong> the world), with significant contributions by Italy (25.14% of the fruit produced <strong>in</strong><br />
Europe), Spa<strong>in</strong> (22.57%) and <strong>France</strong> (12.93%). The important role played by the Asian mark<strong>et</strong>s is even more<br />
evident if we analyse the production trends of the last 10 years: while America, Europe, Africa and Oceania<br />
have a fairly constant fruit production, <strong>in</strong> Asia it has <strong>in</strong>creased by about 55%, mak<strong>in</strong>g Ch<strong>in</strong>a and India the<br />
highest producers of fruits <strong>in</strong> the world with respectively 20.06% and 13.92% of the world production.<br />
Fruit products are generally considered to be some of the less environmental impact<strong>in</strong>g foods <strong>in</strong> occidental<br />
di<strong>et</strong>s. For example, Carlsson-Kanyama <strong>et</strong> al., (2003), quantified the energy consumption of different di<strong>et</strong>s<br />
and evaluated an average of 5 MJ per kg of fruit <strong>in</strong> season (26 MJ per kg of fruit out of season), 15 MJ per<br />
kg of veg<strong>et</strong>ables, 17 MJ per kg of bread and flour products, 33 MJ per kg of dairy products, 37 MJ per kg of<br />
meat, and 75 MJ per kg of fish products. Furthermore, <strong>in</strong> several works that focus on the carbon footpr<strong>in</strong>t of<br />
different food choices, it is reported that the fruit category is one with the least environmental impact (e.g.<br />
Wallén <strong>et</strong> al., 2004, Berners-Lee <strong>et</strong> al., <strong>2012</strong>). However, these works consider results <strong>in</strong> environmental assessment<br />
of generic fruit productions, which takes no account of specific issues of orchard systems and fruit<br />
supply cha<strong>in</strong>s. Indeed, different results may arise consider<strong>in</strong>g the production protocol (e.g. conventional vs<br />
organic), the production site (specific soil and climatic conditions affect yields and agronomic performances)<br />
or the r<strong>et</strong>ail<strong>in</strong>g system (long cold storage may dramatically <strong>in</strong>fluence the environmental performance of the<br />
product).<br />
2. M<strong>et</strong>hods<br />
The modern food production has a great h<strong>et</strong>erogeneity associated with high levels of specialisation and<br />
complexity. These features <strong>in</strong>evitably reflect on m<strong>et</strong>hodologies <strong>in</strong> the application of <strong>LCA</strong> to food products<br />
and agro-systems (Notarnicola <strong>et</strong> al., 2011). It is therefore important to study the works that have been already<br />
compl<strong>et</strong>ed for standardise the application protocols and make appropriate comparison among results.<br />
In order to assess papers that reflect the ma<strong>in</strong>stream ideas about application of <strong>LCA</strong> <strong>in</strong> fruit systems, just<br />
peer-reviewed papers from <strong>in</strong>ternational journals and conference proceed<strong>in</strong>gs were considered. We preferentially<br />
<strong>in</strong>cluded studies that considered the part of the life cycle until the fruit was produced. Studies that considered<br />
the whole production of derivates (e.g. fruit juice production) were only <strong>in</strong>cluded if they added to the<br />
analysis of the plantation stage.<br />
The review covers all ma<strong>in</strong> aspects for conduct<strong>in</strong>g an <strong>LCA</strong> <strong>in</strong> fruit production system; <strong>in</strong> particular the<br />
follow<strong>in</strong>g characteristics were considered: objectives, system boundaries, product considered, functional<br />
unit, data orig<strong>in</strong>, life-cycle-based m<strong>et</strong>hodology adopted and environmental impact assessment m<strong>et</strong>hod. The<br />
evaluation on the objectives was conducted consider<strong>in</strong>g eight objectives highlighted from the general literature<br />
on <strong>LCA</strong> applications <strong>in</strong> the food sector (not just fruit production). 1) Profile the environmental burden of<br />
a fruit product, <strong>in</strong> which a specific production is evaluated and results are related to the case study without<br />
mean<strong>in</strong>g of generalisations. 2) Identify the environmental hot spots <strong>in</strong> production systems performance; consider<strong>in</strong>g<br />
the different field operations and stages of the system. 3) Describe management strategies to <strong>in</strong>crease<br />
environmental performance; this focus is usually applied after the objective 2 <strong>in</strong> order to give practical<br />
407
PARALLEL SESSION 4C: CROP PRODUCTION SYSTEMS 8 th Int. Conference on <strong>LCA</strong> <strong>in</strong> the<br />
Agri-<strong>Food</strong> Sector, 1-4 Oct <strong>2012</strong><br />
suggestions after the evaluations. 4) Compare the environmental burden of different food products on a<br />
common functional unit, e.g. a specific unit of nutrient content. 5) Compare different agro-techniques, e.g.<br />
organic and conventional. 6) Compare different environmental assessment m<strong>et</strong>hods, thus compare the results<br />
of the application of m<strong>et</strong>hods, such as <strong>LCA</strong>, ecological footpr<strong>in</strong>t analysis or water footpr<strong>in</strong>t, on the same<br />
study case. 7) Profile the environmental burden of a production <strong>in</strong> a given area; <strong>in</strong> this studies the <strong>LCA</strong><br />
evaluation is applied to a statistical database of farms collected <strong>in</strong> a specific area. 8) Evaluate the environmental<br />
properties of a supply cha<strong>in</strong>, with usually focus on the different <strong>in</strong> environmental impacts on long and<br />
short distance b<strong>et</strong>ween production and consumption sites. 9) Assess a prelim<strong>in</strong>ary study for statistical <strong>in</strong>vestigations;<br />
<strong>in</strong> this case the <strong>LCA</strong> results are used with the results of other <strong>in</strong>dicators to elaborate complex <strong>in</strong>dexes.<br />
3. Critical review of <strong>LCA</strong> studies of fruit<br />
A total of 19 works were identified; 11 articles <strong>in</strong> ISI journals and 8 papers <strong>in</strong> proceed<strong>in</strong>gs from the <strong>LCA</strong><br />
congress series (Table 1).<br />
General aspects of the study cases. With the exception of rare pioneer studies, it can be assumed that<br />
ma<strong>in</strong>stream research on the <strong>LCA</strong> applied to fruit production systems began <strong>in</strong> the second part of the first<br />
decade of the century. A number of papers were published <strong>in</strong> 2010 dur<strong>in</strong>g the occurrence of the 7 th International<br />
Conference on <strong>LCA</strong> <strong>in</strong> the Agri-<strong>Food</strong> Sector. Despite the high quantity of fruit produced <strong>in</strong> Asia, most<br />
of the <strong>LCA</strong> applications published <strong>in</strong>ternationally focus on case studies which are located <strong>in</strong> Europe and<br />
South America. Just one work may be found <strong>in</strong> Ch<strong>in</strong>a (Liu <strong>et</strong> al., 2010); it is therefore realistic to assume that<br />
<strong>in</strong> the com<strong>in</strong>g years, a lot of researches on this subject will focus on the Asian cont<strong>in</strong>ent both for case studies<br />
and for environmental evaluation of fruit commercialisation.<br />
Objectives. Most of the papers present more than one objective with the exception of the works on the<br />
supply cha<strong>in</strong> (ob. 8), which are usually focused on just this aspect (e.g. Blancke and Burdick, 2008) even if<br />
they deeply <strong>in</strong>vestigate the field phase of the production process (e.g. Knudsen <strong>et</strong> al., 2011). The description<br />
of the environmental burden of the product (ob. 1) is the first result of each <strong>in</strong>vestigation, but it is often not<br />
the ma<strong>in</strong> object of the paper, which may be <strong>in</strong>stead, for example, the comparison of different m<strong>et</strong>hodologies<br />
(e.g. Cerutti <strong>et</strong> al., 2010). The suggestion of ways to <strong>in</strong>crease susta<strong>in</strong>ability (ob. 3) is often associated to the<br />
evaluation of environmental hot spots (e.g. Cudjoe <strong>et</strong> al., 2010). The comparison of different assessment<br />
m<strong>et</strong>hods is not usually applied to fruit production; it can be only found <strong>in</strong> the comparison of <strong>LCA</strong> with Ecological<br />
Footpr<strong>in</strong>t Analysis (Cerutti <strong>et</strong> al., 2010) and <strong>LCA</strong> with PAS 2050 (McLaren <strong>et</strong> al., 2010).<br />
System boundaries. The two most used system boundaries are the cradle-to-gate approach and cradle-tomark<strong>et</strong><br />
approach. In the first category, the environmental impacts are quantified for the production phase<br />
<strong>in</strong>clud<strong>in</strong>g all upstream impacts until the farm gate (8 papers). The cradle-to-mark<strong>et</strong> category <strong>in</strong>cludes studies<br />
<strong>in</strong> which the distribution and commercialisation phase is <strong>in</strong>cluded <strong>in</strong> the assessment (9 papers). Two particular<br />
boundaries are the cradle-to-r<strong>et</strong>ailer (2 papers) <strong>in</strong> which also process<strong>in</strong>g and transport to the distribution<br />
system is accounted, and the cradle-to-use (1 paper) <strong>in</strong> which also impacts from the consumer phase are accounted.<br />
The nursery, where orchard seedl<strong>in</strong>gs are produced, should be considered an upstream process deliver<strong>in</strong>g<br />
grafted plants to the orchards and the impact dur<strong>in</strong>g this stage should be <strong>in</strong>cluded <strong>in</strong> assessments of<br />
fruit production systems. Although many authors stress that it is important to consider the nursery <strong>in</strong> environmental<br />
impact assessments (Milà i Canals and Polo, 2003; Cerutti <strong>et</strong> al., 2010), the lack of data makes<br />
this difficult. Another important aspect that has to be considered, when the assessment is done on the entire<br />
life cycle of the orchard and not just on a productive year, is the yield <strong>in</strong> relation to the age of the plantation<br />
(Cerutti <strong>et</strong> al., 2010). Most of the temperate fruit cultures reach maturity <strong>in</strong> 2-4 years after <strong>in</strong>stallation of the<br />
orchard. Before that age, the yield may be significantly lower (or even zero) because the plants are still too<br />
young. This may significantly affect the average yield, and has to be considered. Furthermore, the yield variability<br />
b<strong>et</strong>ween years may be very high, e.g. McLaren <strong>et</strong> al., (2010) reported that the difference b<strong>et</strong>ween the<br />
lowest and highest yields for green kiwifruit over a period of six year, measured as a percentage of the lowest<br />
value, is 31%.<br />
Product considered and functional unit. Fruits and fruit products may have different quality, nutrient and<br />
economic values, thus it may be difficult to f<strong>in</strong>d a significant functional unit. For fruit products, typical functional<br />
units are 1 kg of fruit packed and delivered to the customer or 1 tonne of fruit at the farm gate.<br />
408
PARALLEL SESSION 4C: CROP PRODUCTION SYSTEMS 8 th Int. Conference on <strong>LCA</strong> <strong>in</strong> the<br />
Agri-<strong>Food</strong> Sector, 1-4 Oct <strong>2012</strong><br />
Table 1. List of all papers present<strong>in</strong>g applications of <strong>LCA</strong> <strong>in</strong> fruit production systems s<strong>in</strong>ce January <strong>2012</strong><br />
from ISI Journal and conferences, listed by date of publication. Country category considers the area of the<br />
study and not necessarily the location of the research group. For objectives description see reference num-<br />
bers <strong>in</strong> the text.<br />
REFERENCE<br />
Blanke and Burdick,<br />
2005<br />
Sanjuán <strong>et</strong> al.,<br />
2005<br />
Milà i Canals <strong>et</strong><br />
al., 2006<br />
Mouron <strong>et</strong> al.,<br />
2006<br />
Milà i Canals <strong>et</strong><br />
al., 2007<br />
Sim <strong>et</strong> al., 2007<br />
Williams <strong>et</strong> al.,<br />
2008<br />
Beccali <strong>et</strong> al.,<br />
2009<br />
Coltro <strong>et</strong> al.,<br />
2009<br />
Beccali <strong>et</strong> al.,<br />
2010<br />
Cerutti <strong>et</strong> al.,<br />
2010<br />
Cudjoe <strong>et</strong> al.,<br />
2010<br />
Ingwersen, 2010<br />
COUN-<br />
TRY<br />
Germany,<br />
New<br />
Zealand<br />
PROD-<br />
UCT<br />
MAIN<br />
OB-<br />
JEC-<br />
TIVE<br />
S<br />
FUNCTIONAL<br />
UNIT<br />
Apple 8 Mass based (kg)<br />
BOUNDA-<br />
RIES DATASET<br />
Cradle-tomark<strong>et</strong><br />
Spa<strong>in</strong> Orange 1, 2, 7 Mass based (kg) Cradle-to-gate<br />
New<br />
Zealand<br />
Swiss Apple<br />
UK, New<br />
Zealand<br />
Brazil,<br />
Chile,<br />
Italy, UK<br />
UK,<br />
Spa<strong>in</strong><br />
Italy<br />
Apple 1, 2, 3 Mass based (t)<br />
1, 2, 3,<br />
7<br />
Land based (ha);<br />
Currency based ($)<br />
Apple 8 Mass based (kg)<br />
Apple 8<br />
Strawberry<br />
Citrus<br />
based<br />
products<br />
8<br />
1<br />
Mass based (t, just<br />
grade 1)<br />
Mass based (t at<br />
distribution)<br />
Mass based (kg of<br />
juices and oil )<br />
Cradle-tomark<strong>et</strong><br />
Cradle-to-gate<br />
Cradle-tomark<strong>et</strong> <br />
Cradle-tor<strong>et</strong>ailer <br />
Cradle-tomark<strong>et</strong> <br />
Cradle-tomark<strong>et</strong><br />
Brazil Orange 1, 7 Mass based (t) Cradle-to-gate<br />
Italy<br />
Citrus<br />
based<br />
products<br />
3<br />
Mass based (kg of<br />
juices and oil )<br />
Cradle-tomark<strong>et</strong><br />
Italy Peach 1, 2, 6 Mass based (kg) Cradle-to-gate<br />
Ghana<br />
Costa<br />
Rica<br />
P<strong>in</strong>eapple <br />
P<strong>in</strong>eapple<br />
2, 3 Mass based (kg) Cradle-to-gate<br />
1, 9<br />
Mass based (serv<strong>in</strong>g<br />
portion)<br />
Liu <strong>et</strong> al., 2010 Ch<strong>in</strong>a Pear 2, 8 Mass based (t)<br />
Clasadonte <strong>et</strong> al.,<br />
2010 a<br />
Clasadonte <strong>et</strong> al.,<br />
2010 b<br />
McLaren <strong>et</strong> al.,<br />
2010<br />
Cerutti <strong>et</strong> al.,<br />
2011<br />
Knudsen <strong>et</strong> al.,<br />
2011<br />
Cradle-tor<strong>et</strong>ailerCradle-tomark<strong>et</strong><br />
Italy Peach 4 Mass based (kg) Cradle-to-gate<br />
Italy Orange 1, 3 Mass based (kg) Cradle-to-gate<br />
New<br />
Zealand<br />
Apple,<br />
Kiwifruit<br />
1, 3, 6 Mass based (kg) Cradle-to-use<br />
Italy Apple 8 Mass based (kg)<br />
Brazil Orange 5, 8<br />
Mass based (l of<br />
juice);<br />
Mass based (t of fruit)<br />
Cradle-tomark<strong>et</strong> <br />
Cradle-tomark<strong>et</strong>Cradl<strong>et</strong>o-gate<br />
Literature and<br />
other databases<br />
Literature and<br />
other databases<br />
Commercial<br />
orchards<br />
+ validation<br />
Commercial<br />
orchards<br />
Literature and<br />
specific databases<br />
Literature and<br />
specific databases<br />
Literature and<br />
specific databases<br />
Primary data<br />
from field and<br />
secondary from<br />
literature<br />
Commercial<br />
orchards<br />
Primary data<br />
from field and<br />
secondary from<br />
literature<br />
Commercial<br />
orchards<br />
+ validation<br />
Commercial<br />
orchards<br />
Commercial<br />
orchards<br />
Commercial<br />
orchards<br />
Commercial<br />
orchards<br />
Commercial<br />
orchard<br />
Commercial<br />
orchards<br />
R<strong>et</strong>ailer and<br />
associated orchards<br />
Commercial<br />
orchards and<br />
statistics<br />
ASSESSMENT<br />
METHOD<br />
Characterisation<br />
factors from<br />
literature<br />
CML, WMO,<br />
POPC and USES<br />
EDIP1997<br />
SA<strong>LCA</strong> (2003)<br />
Characterisation<br />
factors from<br />
literature<br />
CML 2 Basel<strong>in</strong>e<br />
2000<br />
Characterisation<br />
factors from<br />
literature<br />
IPCC 2001<br />
GWP100; CML 2<br />
Basel<strong>in</strong>e 2000<br />
Characterisation<br />
factors from<br />
literature<br />
IPCC 2001<br />
GWP100; CML 2<br />
Basel<strong>in</strong>e 2000<br />
Eco-Indicator 99<br />
Characterisation<br />
factors from<br />
literature<br />
eco<strong>in</strong>vent 2.0<br />
IPCC 2007<br />
Impact 2002+<br />
Impact 2002+<br />
PAS 2050<br />
EDIP 1997<br />
EDIP 1997 +<br />
IPCC 2007<br />
(GHG); IM-<br />
PACT2002+<br />
(energy)<br />
There is just one work (Mouron <strong>et</strong> al., 2006) <strong>in</strong> which a land based and a currency based functional unit<br />
are related. The land based functional unit, such as 1 ha of orchard, is not frequently used <strong>in</strong> <strong>LCA</strong>, partly<br />
because land use is not directly a service and does not provide a productive function, but it can give <strong>in</strong>terest-<br />
409
PARALLEL SESSION 4C: CROP PRODUCTION SYSTEMS 8 th Int. Conference on <strong>LCA</strong> <strong>in</strong> the<br />
Agri-<strong>Food</strong> Sector, 1-4 Oct <strong>2012</strong><br />
<strong>in</strong>g results. In general, convert<strong>in</strong>g resource consumption or environmental impacts to units of land use allows<br />
evaluation of the impacts of cultivat<strong>in</strong>g a certa<strong>in</strong> area. This param<strong>et</strong>er is also called the impact <strong>in</strong>tensity of a<br />
farm (Mouron <strong>et</strong> al., 2006). The land-based functional unit <strong>in</strong> fruit production is complementary to the massbased<br />
functional unit because they give different results and both should be used. Indeed, when consider<strong>in</strong>g<br />
just impacts per unit area, low <strong>in</strong>put-output systems will have b<strong>et</strong>ter rank<strong>in</strong>g for decreased impacts at regional<br />
level, but may create a need for additional land use elsewhere, giv<strong>in</strong>g rise to additional impacts (van<br />
der Werf <strong>et</strong> al., 2007). Furthermore, as most of fruit are rapidly perishable products, quantification of product<br />
loss <strong>in</strong> the supply cha<strong>in</strong> would be needed <strong>in</strong> order to evaluate the environmental impact of the product actually<br />
consumed (Schau and F<strong>et</strong>, 2008).<br />
Data orig<strong>in</strong>. Most studies (11 papers) are based on data collected from commercial orchards, either directly<br />
<strong>in</strong> field surveys or with questionnaires or <strong>in</strong>terviews with farmers. Som<strong>et</strong>ime these approaches are<br />
mixed and the data collection m<strong>et</strong>hod used for the different data <strong>in</strong> the study is not always clearly described.<br />
Four studies <strong>in</strong>vestigate commercial orchards and then compare the field datas<strong>et</strong> obta<strong>in</strong>ed with reference<br />
values. This approach allows conclusions about specific orchards to be drawn, while the validation allows<br />
identification of unusual agricultural practices only of <strong>in</strong>terest for the specific farm (e.g. Milà i Canals <strong>et</strong> al.,<br />
2006). The other m<strong>et</strong>hod used to obta<strong>in</strong> statistically robust datas<strong>et</strong>s is to consider a larger number of commercial<br />
orchards and look at average values for these farms. Seven studies used literature and available databases<br />
<strong>in</strong> order to obta<strong>in</strong> data <strong>in</strong>stead of survey<strong>in</strong>g commercial orchards. Appl<strong>in</strong>g this m<strong>et</strong>hodology it possible<br />
to achieve more generic results, but it could be impossible to consider site specific differences among orchards.<br />
Environmental impact assessment m<strong>et</strong>hod. Us<strong>in</strong>g different environmental impact assessment m<strong>et</strong>hods<br />
may lead to different conclusions. Across reviewed papers, the typical impact categories are the categories<br />
which quantifies environmental impacts on ecosystems more than the ones on resource consumption or human<br />
toxicity; with particular attention to the potentials of global warm<strong>in</strong>g, eutrophication, and acidification.<br />
The first one is ma<strong>in</strong>ly related to the combustion of fuels, thus it is considered a key <strong>in</strong>dicator <strong>in</strong> studies <strong>in</strong>volv<strong>in</strong>g<br />
comparison of systems with different transport distances (e.g. Blanke and Burdick, 2005). Eutrophication<br />
and acidification are generally more related to the use of fertilisers and pesticides, thus they depend on<br />
the agro-technique used and climatic conditions.<br />
When def<strong>in</strong><strong>in</strong>g the impact categories for fruit production, it is very important to consider the typical environmental<br />
problems that may arise <strong>in</strong> orchards (Milà i Canals and Polo, 2003). Fruit is usually produced <strong>in</strong><br />
sunny regions because sun <strong>in</strong>creases yield and improves fruit quality. However, these regions are also prone<br />
to water scarcity and result<strong>in</strong>g losses of nutrients and pesticides to the surround<strong>in</strong>g environment. These effects<br />
can <strong>in</strong>fluence all impact categories, but particularly nutrient enrichment potential and acidification potential<br />
(Coltro and Mourad, 2009), as well as human toxicity.<br />
4. Conclusions<br />
Despite a general standardisation of phases <strong>in</strong> orchard management, the high variability <strong>in</strong> agrotechniques<br />
and fruit products leads to different way of apply<strong>in</strong>g <strong>LCA</strong> <strong>in</strong> such systems. Nevertheless a tentative<br />
to standardise research protocols when apply<strong>in</strong>g environmental assessment m<strong>et</strong>hod <strong>in</strong> fruit production is<br />
needed. In particular about the s<strong>et</strong> of <strong>in</strong>dicators and the orchard model that should be considered. Otherwise<br />
result may be impossible to compare and results risk rema<strong>in</strong><strong>in</strong>g isolated to the case study. Be<strong>in</strong>g able to<br />
compare the results from different studies would be important also <strong>in</strong> order to identify susta<strong>in</strong>ability threshold,<br />
as suggested by several authors (e.g. Van der Werf and P<strong>et</strong>it, 2002).<br />
Suggestions for standardisation of assessment m<strong>et</strong>hods application <strong>in</strong> fruit production may consider the<br />
<strong>in</strong>clusion of the whole lif<strong>et</strong>ime of the orchard <strong>in</strong> the system boundaries. As a consequence also impacts from<br />
orchard <strong>in</strong>stallation, destruction and the nursery phase should be assessed. As orchards are not a s<strong>in</strong>gle year<br />
production system (as can be open field crops), the application of an environmental <strong>in</strong>dicator just to the full<br />
production year will probably underestimat<strong>in</strong>g the real ecological impact, <strong>in</strong> a variable percentage (<strong>in</strong> our<br />
studies about 30% depend<strong>in</strong>g on fruit considered and assessment m<strong>et</strong>hod) (Fig.1).<br />
As <strong>in</strong> other reviews about similar topics (P<strong>et</strong>ti <strong>et</strong> al., 2010) one of the most frequent problems was the difficulty<br />
<strong>in</strong> f<strong>in</strong>d<strong>in</strong>g specific data and characterisation factors for pesticides and fertilisers. The fate and the effects<br />
of chemicals <strong>in</strong> the environment are very different depend<strong>in</strong>g on the pedo-climatic condition of the<br />
orchard. Therefore it is necessary implement the analysis with a predictive mathematical m<strong>et</strong>hod which is<br />
able to model pesticide dispersion, such as PestLCI developed by Birkveda and Hauschild (2006). Nevertheless,<br />
the use of pesticide dispersion models requires specific comp<strong>et</strong>ences and several pedo-climatic data,<br />
such as soil properties, average ra<strong>in</strong> quantities and w<strong>in</strong>d <strong>in</strong>tensities of the <strong>in</strong>vestigation site. The alternative<br />
m<strong>et</strong>hod is to considered the environmental impact of the entire amount of pesticides as emitted to the soil.<br />
410
PARALLEL SESSION 4C: CROP PRODUCTION SYSTEMS 8 th Int. Conference on <strong>LCA</strong> <strong>in</strong> the<br />
Agri-<strong>Food</strong> Sector, 1-4 Oct <strong>2012</strong><br />
These approaches lead to different results <strong>in</strong> the assessment with potentially dramatic effects <strong>in</strong> comparative<br />
studies if one uses different m<strong>et</strong>hods of impact assessment. Similar consideration can be made when evaluat<strong>in</strong>g<br />
impacts from fertilisation. In this aspect two approaches are usually applied: the use of a dispersion<br />
model or a nutrient balance <strong>in</strong> which impacts of distribution are related to the effects <strong>in</strong> the environment of<br />
the surplus nutrient (Milà I Canals <strong>et</strong> al., 2006). This second approach requires specific agronomic <strong>in</strong>vestigations<br />
about the nutrient need<strong>in</strong>g of the plants and the nutrient content <strong>in</strong> the soil of the orchard.<br />
Figure 1. Hotspot analysis of two previous case studies. Modified from Cerutti <strong>et</strong> al., 2011.<br />
Furthermore, the use of different functional units may result <strong>in</strong> deviat<strong>in</strong>g results. The reviewed literature<br />
shows that simple mass based functional units is not always able to capture the complexity of orchard systems.<br />
Thus, us<strong>in</strong>g comb<strong>in</strong>ed functional units or other functional units may be necessary. For example, impacts<br />
per land units may be used tog<strong>et</strong>her with mass based functional unit <strong>in</strong> order to compl<strong>et</strong>e results and<br />
avoid resource use efficiency overvaluation and delocalisation of environmental impacts.<br />
Started with this critical review, the ma<strong>in</strong> objective of the Work<strong>in</strong>g Group on Fruit <strong>LCA</strong> will be the elaboration<br />
of a framework m<strong>et</strong>hodology and specific guidel<strong>in</strong>es to improve <strong>LCA</strong> analysis on orchard cultivation<br />
and fruit products.<br />
5. References<br />
Beccali, M., Cellura, M., Iudicello, M., Mistr<strong>et</strong>ta, M., 2009. Resource consumption and environmental impacts of the agrofood sector:<br />
life cycle assessment of italian citrus-based products. Environmental management. Spr<strong>in</strong>ger New York. 43, 707-24.<br />
Beccali, M., Cellura, M., Iudicello, M., Mistr<strong>et</strong>ta, M., 2010. Life cycle assessment of Italian citrus-based products. Sensitivity analysis<br />
and improvement scenarios. Journal of environmental management. 91, 1415-28.<br />
Berners-Lee, M., Hoolohan, C., Cammack, H., Hewitt, C.N., <strong>2012</strong>. The relative greenhouse gas impacts of realistic di<strong>et</strong>ary choices.<br />
Energy Policy. 43, 184-190.<br />
Blanke, M., Burdick, B., 2005. <strong>Food</strong> (miles) for Thought - Energy Balance for Locally-grown versus Imported Apple Fruit (3 pp).<br />
Environmental Science and Pollution Research - International. Spr<strong>in</strong>ger Berl<strong>in</strong> / Heidelberg. 12, 125-127.<br />
Birkveda M., Hauschild M.Z., 2006. PestLCI—A model for estimat<strong>in</strong>g field emissions of pesticides <strong>in</strong> agricultural <strong>LCA</strong>. Ecological<br />
Modell<strong>in</strong>g 198:433–451<br />
Carlsson-Kanyama, A., Ekström, M.P., Shanahan, H., 2003. <strong>Food</strong> and life cycle energy <strong>in</strong>puts: consequences of di<strong>et</strong> and ways to<br />
<strong>in</strong>crease efficiency. Ecological Economics. 44, 293-307.<br />
Cerutti, A.K., Bagliani, M., Beccaro, G.L., Peano, C., Bounous, G., 2010. Comparison of <strong>LCA</strong> and EFA for the environmental account<br />
of fruit production systems: a case study <strong>in</strong> Northern Italy. Notarnicola, B., S<strong>et</strong>tanni, E., Tassielli, G., Giungato, P. (Eds.),<br />
Proceed<strong>in</strong>gs of <strong>LCA</strong> food 2010. Bari, pp. 99-104.<br />
Cerutti, A.K., Galizia, D., Bruun, S., Mellano, G.M., Beccaro, G.L., Bounous, G., 2011. Assess<strong>in</strong>g environmental susta<strong>in</strong>ability of<br />
different apple supply cha<strong>in</strong>s <strong>in</strong> northern italy, <strong>in</strong>: F<strong>in</strong>kbe<strong>in</strong>er, M. (Ed.), Towards Life Cycle Susta<strong>in</strong>ability Management.<br />
Spr<strong>in</strong>ger N<strong>et</strong>herlands, Dordrecht, pp. 341-348.<br />
Clasadonte, M.T., Matarazzo, A., Ingrao, C., 2010. Life Cycle assessment of Sicilian peach sector. Notarnicola, B., S<strong>et</strong>tanni, E.,<br />
Tassielli, G., Giungato, P. (Eds.), Proceed<strong>in</strong>gs of <strong>LCA</strong> food 2010. Bari, pp. 295-300.<br />
Clasadonte, M.T., Lo Giudice, A., Ingrao, C., 2010. Life Cycle Assessment of the Sicilian citrus fruit field. Notarnicola, B., S<strong>et</strong>tanni,<br />
E., Tassielli, G., Giungato, P. (Eds.), Proceed<strong>in</strong>gs of <strong>LCA</strong> food 2010. Bari, pp. 301-306.<br />
Coltro, L., Mourad, A.L., Kl<strong>et</strong>ecke, R.M., Mendonça, T.A., Germer, S.P.M., 2009. Assess<strong>in</strong>g the environmental profile of orange<br />
production <strong>in</strong> Brazil. The International Journal of Life Cycle Assessment. Spr<strong>in</strong>ger Berl<strong>in</strong> / Heidelberg. 14, 656-664.<br />
Cudjoe Adebah, E., Langeveld, C., Kermah, M., 2010. Environmental impact of organic p<strong>in</strong>eapple production <strong>in</strong> Ghana: a comparison<br />
of two farms us<strong>in</strong>g Life Cycle Assessment (<strong>LCA</strong>) approach. Notarnicola, B., S<strong>et</strong>tanni, E., Tassielli, G., Giungato, P. (Eds.),<br />
Proceed<strong>in</strong>gs of <strong>LCA</strong> food 2010. Bari, pp. 225-230.<br />
Ingwersen, W., 2010. Product category range of environmental perfformance for EPDs: example of Costa Rican p<strong>in</strong>eapple. Notarnicola,<br />
B., S<strong>et</strong>tanni, E., Tassielli, G., Giungato, P. (Eds.), Proceed<strong>in</strong>gs of <strong>LCA</strong> food 2010. Bari, pp. 337-341.<br />
411
PARALLEL SESSION 4C: CROP PRODUCTION SYSTEMS 8 th Int. Conference on <strong>LCA</strong> <strong>in</strong> the<br />
Agri-<strong>Food</strong> Sector, 1-4 Oct <strong>2012</strong><br />
Knudsen, M.T., Fonseca de Almeida, G., Langer, V., Santiago de Abreu, L., Halberg, N., 2011. Environmental assessment of organic<br />
juice imported to Denmark: a case study on oranges (Citrus s<strong>in</strong>ensis) from Brazil. Organic Agriculture. Spr<strong>in</strong>ger N<strong>et</strong>herlands. 1,<br />
167-185.<br />
Liu, Y., Langer, V., Høgh-Jensen, H., Egelyng, H., 2010. Life Cycle Assessment of fossil energy use and greenhouse gas emissions<br />
<strong>in</strong> Ch<strong>in</strong>ese pear production. Journal of Cleaner Production. 18, 1423-1430.<br />
McLaren, S.J., Hume, A., Mitraratne, N., 2010. Carbon management for the primary agricultural sector <strong>in</strong> New Zealand: case studies<br />
for the pipfruit and kiwifruit <strong>in</strong>dustries. Notarnicola, B., S<strong>et</strong>tanni, E., Tassielli, G., Giungato, P. (Eds.), Proceed<strong>in</strong>gs of <strong>LCA</strong> food<br />
2010, pp. 293-298.<br />
Milà i Canals, L., Burnip, G.M., Cowell, S.J., 2006. Evaluation of the environmental impacts of apple production us<strong>in</strong>g Life Cycle<br />
Assessment (<strong>LCA</strong>): Case study <strong>in</strong> New Zealand. Agriculture, Ecosystems & Environment. 114, 226-238.<br />
Milà i Canals, L., Cowell, S.J., Sim, S., Basson, L., 2007. Compar<strong>in</strong>g domestic versus imported apples: A focus on energy use. Environmental<br />
Science and Pollution Research - International. Spr<strong>in</strong>ger Berl<strong>in</strong> / Heidelberg. 14, 338-344.<br />
Mouron, P., Nemecek, T., Scholz, R.W., Weber, O., 2006. Management <strong>in</strong>fluence on environmental impacts <strong>in</strong> an apple production<br />
system on Swiss fruit farms: Comb<strong>in</strong><strong>in</strong>g life cycle assessment with statistical risk assessment. Agriculture, Ecosystems & Environment.<br />
114, 311-322.<br />
Notarnicola, B., Tassielli G., S<strong>et</strong>tanni E., 2010. Includ<strong>in</strong>g more technology <strong>in</strong> the production of a quality w<strong>in</strong>e: the importance of<br />
functional unit. In Notarnicola B., S<strong>et</strong>tanni E., Tassielli G., Giungato P. (Eds.), Proceed<strong>in</strong>gs of <strong>LCA</strong> food 2010. Bari, vol. 2, pp.<br />
235-240.<br />
P<strong>et</strong>ti, L., Ardente, F., Bosco, S., De Camillis, C., Masotti, P., Pattara, C., Raggi, A., Tassielli, G., 2010. State of the art of Life Cycle<br />
Assessment <strong>in</strong> the w<strong>in</strong>e <strong>in</strong>dustry. In Notarnicola B., S<strong>et</strong>tanni E., Tassielli G., Giungato P. (Eds.), Proceed<strong>in</strong>gs of <strong>LCA</strong> food 2010.<br />
Bari, vol. 1, pp. 493-498.<br />
Sanjuan, N., Ubeda, L., Clemente, G., Mul<strong>et</strong>, A., Girona, F., 2005. <strong>LCA</strong> of <strong>in</strong>tegrated orange production <strong>in</strong> the Comunidad Valenciana<br />
(Spa<strong>in</strong>). International Journal of Agricultural Resources, Governance and Ecology 4 (2), 163-177.<br />
Schau E.M., F<strong>et</strong> A.M., 2008. <strong>LCA</strong> Studies of <strong>Food</strong> Products as Background for Environmental Product Declarations. International<br />
Journal of <strong>LCA</strong> 13(3):255–264.<br />
Sim, S., Barry, M., Clift, R., Cowell, S.J., 2007. The relative importance of transport <strong>in</strong> d<strong>et</strong>erm<strong>in</strong><strong>in</strong>g an appropriate susta<strong>in</strong>ability<br />
strategy for food sourc<strong>in</strong>g. The International Journal of Life Cycle Assessment. Spr<strong>in</strong>ger Berl<strong>in</strong> / Heidelberg. 12, 422-431.<br />
van der Werf H.M.G., Tzilivakis J., Lewis K., Bass<strong>et</strong>-Mens C., 2007. Environmental impacts of farm scenarios accord<strong>in</strong>g to five<br />
assessment m<strong>et</strong>hods. Agriculture, Ecosystems and Environment, 118:327–338<br />
Wallén, A., Brandt, N., Wennersten, R., 2004. Does the Swedish consumer’s choice of food <strong>in</strong>fluence greenhouse gas emissions?<br />
Environmental Science & Policy. 7, 525-535.<br />
Williams A, Pell E, Webb J, Moorhouse E, Audsley E., 2008. Strawberry and tomato production for the UK compared b<strong>et</strong>ween the<br />
UK and Spa<strong>in</strong>. Proceed<strong>in</strong>gs of the 6th International Conference on <strong>LCA</strong> <strong>in</strong> the Agri-<strong>Food</strong> Sector, pp. 254-262<br />
412
PARALLEL SESSION 4C: CROP PRODUCTION SYSTEMS 8 th Int. Conference on <strong>LCA</strong> <strong>in</strong> the<br />
Agri-<strong>Food</strong> Sector, 1-4 Oct <strong>2012</strong><br />
An LCIA-based typology for more representative results and ref<strong>in</strong>ed<br />
data collection of a horticultural cropp<strong>in</strong>g system <strong>in</strong> the Tropics. The<br />
case of tomato production <strong>in</strong> Ben<strong>in</strong>, West Africa<br />
Aurélie Perr<strong>in</strong> 1,* , Claud<strong>in</strong>e Bass<strong>et</strong>-Mens 1 , Wilfried Yehouessi 2 , Joel Huat 1 , Benoit Gabrielle 3<br />
1 CIRAD- UPR Hortsys, TA B-103/PS4 -Boulevard de la Lironde, F-34398 Montpellier Cedex 5, <strong>France</strong><br />
2 Faculté des Sciences Agronomiques (FSA) de l’Université d’Abomey – Calavi (UAC), Ben<strong>in</strong><br />
3 AgroParisTech, INRA, UMR 1091 Environnement <strong>et</strong> Grandes Cultures, F-78850 Grignon, <strong>France</strong><br />
* Correspond<strong>in</strong>g author. E-mail: aurelie.perr<strong>in</strong>@cirad.fr<br />
ABSTRACT<br />
Application of Life-Cycle Assessment (<strong>LCA</strong>) to horticultural products raises renewed and specific issues, especially <strong>in</strong> tropical areas.<br />
Given the scarcity of data and expert knowledge <strong>in</strong> these areas, the first challenge lies <strong>in</strong> obta<strong>in</strong><strong>in</strong>g Life-Cycle Inventory (LCI) representative<br />
of the diversity of cropp<strong>in</strong>g systems <strong>in</strong>volved <strong>in</strong> the production function. In this study, we identified the cropp<strong>in</strong>g systems’<br />
components that are likely to <strong>in</strong>fluence the environmental impacts of the production, and their variability. To explore the diversity of<br />
cropp<strong>in</strong>g systems from an <strong>LCA</strong> perspective, 12 cropp<strong>in</strong>g systems produc<strong>in</strong>g dry season tomato production <strong>in</strong> the coastal area of<br />
Ben<strong>in</strong> were selected based on local-expert knowledge and assessed with <strong>LCA</strong>. A two-step statistical analysis (CPA-AHC) allowed to<br />
produce a typology of cropp<strong>in</strong>g systems with regard to their environmental impacts and highlights the key components responsible<br />
for the hot-spots. This result has direct implications for a b<strong>et</strong>ter design of data collection <strong>in</strong> a highly complex system.<br />
1. Introduction<br />
The grow<strong>in</strong>g awareness regard<strong>in</strong>g the environmental issues associated with global food supply cha<strong>in</strong>s has<br />
now reached the fruits and veg<strong>et</strong>ables sector, stress<strong>in</strong>g the need for evaluat<strong>in</strong>g products with different orig<strong>in</strong>s<br />
and the associated technologies (Martínez-Blanco <strong>et</strong> al., 2011). Although the relevance of Life-Cycle Assessment<br />
(<strong>LCA</strong>) to assess agricultural systems has been validated for a large number of products (Brentrup <strong>et</strong><br />
al., 2004), its application to horticultural production systems especially <strong>in</strong> tropical contexts is more recent<br />
and comes with renewed and specific issues. Consider<strong>in</strong>g the scarcity <strong>in</strong> data and expert knowledge <strong>in</strong> tropical<br />
areas, the first challenge lies <strong>in</strong> obta<strong>in</strong><strong>in</strong>g Life-Cycle Inventory (LCI) data representative of a given function<br />
at a given scale accord<strong>in</strong>g to the goal and scope def<strong>in</strong>ed <strong>in</strong> a particular <strong>LCA</strong>. Little attention has been<br />
paid to LCI data for horticultural crops <strong>in</strong> the tropics. Characteris<strong>in</strong>g the whole diversity and complexity of<br />
these cropp<strong>in</strong>g systems is <strong>in</strong>deed data- and time-consum<strong>in</strong>g. M<strong>et</strong>hods are required to identify the key characteristics<br />
of cropp<strong>in</strong>g system specificities that d<strong>et</strong>erm<strong>in</strong>e their environmental impacts. The purpose of the present<br />
study was to propose and test an approach that allows the identification of such key drivers relevant to<br />
the <strong>LCA</strong> results for horticultural crops <strong>in</strong> the Tropics. We s<strong>et</strong> out 1) to classify cropp<strong>in</strong>g systems with a typology<br />
based on their potential impacts, and 2) to analyse the contribution of cropp<strong>in</strong>g system components to<br />
the environmental impacts of the systems. Here, we focused on dry land tomato cropp<strong>in</strong>g systems <strong>in</strong> Ben<strong>in</strong>,<br />
as a case-study. The proposed approach is generic and should be useful for design<strong>in</strong>g a more efficient data<br />
collection protocol, for researchers and <strong>in</strong>dustrials who want to properly assess the environmental impact of<br />
tropical fruits and veg<strong>et</strong>ables.<br />
2. Material and m<strong>et</strong>hods<br />
2.1. Field selection and characteristics<br />
This case-study was based on the 2011 dry season tomato production <strong>in</strong> the coastal area of Ben<strong>in</strong>. Ben<strong>in</strong><br />
is located <strong>in</strong> West Africa, and its coastl<strong>in</strong>e presents a subequatorial climate with two dry and two ra<strong>in</strong>y seasons<br />
every year. The ma<strong>in</strong> season for grow<strong>in</strong>g tomatoes <strong>in</strong> West Africa is the longest ra<strong>in</strong>y season as it does<br />
not require extra work and <strong>in</strong>frastructure for irrigation. Nevertheless, out-of-season tomato is grown commonly<br />
on the coast, where water is available for irrigation, to provide all-year long fresh tomatoes for traditional<br />
dishes. Among the 50 tomato growers identified <strong>in</strong> the region, 12 were selected based on two criteria,<br />
present<strong>in</strong>g all three modalities: geographical location (<strong>in</strong> the vic<strong>in</strong>ity of Cotonou, Pahou, and Grand-Popo,<br />
which are the largest cities <strong>in</strong> the area) and irrigation systems (manual, hose and spr<strong>in</strong>kler). On the basis of<br />
local expert knowledge, the field selection aimed to cover the different comb<strong>in</strong>ations of these modalities at<br />
regional scale. Each agricultural operation occurr<strong>in</strong>g <strong>in</strong> the field was recorded and quantified dur<strong>in</strong>g the full<br />
crop-cycle, from nursery to harvest. The ma<strong>in</strong> characteristics of the selected fields are displayed <strong>in</strong> Table 1.<br />
413
PARALLEL SESSION 4C: CROP PRODUCTION SYSTEMS 8 th Int. Conference on <strong>LCA</strong> <strong>in</strong> the<br />
Agri-<strong>Food</strong> Sector, 1-4 Oct <strong>2012</strong><br />
Table 1. Characteristics of the 12 selected field representative for aga<strong>in</strong>st the season tomato <strong>in</strong> Ben<strong>in</strong><br />
Field<br />
codes<br />
414<br />
Geo<br />
Loc<br />
Irr syst<br />
Field<br />
area (m²)<br />
Duration<br />
(days)<br />
Yield<br />
(kg.ha -1 )<br />
Nitrogen<br />
rate (kg.ha -1 )<br />
Number of<br />
pesticide appli-<br />
cations<br />
Water supplied<br />
(m 3 .ha -1 )<br />
P06 Cot Man 306 118 4902 2684 29 7200 Sand<br />
P07 Cot Man 126 104 12452 2807 4 6360 Sand<br />
P10 Cot Spr<strong>in</strong>k. 196 104 0 905 10 2665 Sand<br />
P12 Cot Man 546 111 7875 755 17 10400 Silt<br />
P28 Pa Man 922 110 8 1328 7 586 Silt<br />
P17 Pa Hose 169 102 127 665 5 4515 Sand<br />
P19 Pa Hose 1915 56 0 1389 12 919 Silt<br />
P38 Pa Hose 895 88 10 72 11 3759 Sand<br />
P39 Pa Hose 760 103 5662 507 17 10581 Sand<br />
P33 GPP Hose 2200 104 4498 2258 10 771 Clay<br />
P37 GPP Hose 576 113 21163 1595 5 5318 Sand<br />
P40 GPP Hose 963 113 1703 60 1 7048 Sand<br />
2.2. Life-cycle assessment m<strong>et</strong>hodology<br />
An ISO-compliant <strong>LCA</strong> was performed to compare the environmental impact of the 12 fields selected.<br />
The functional unit assigned for all fields was one hectare of tomato production <strong>in</strong> agreement with the farmers’<br />
strategy to give value to an area through the production of a commercial product. The fields were assessed<br />
from-cradle-to-field-gate. Input production and <strong>in</strong>frastructures were <strong>in</strong>cluded, while transport and<br />
end-of-life were not taken <strong>in</strong>to account. Data on the production of agricultural <strong>in</strong>puts was taken from the<br />
Eco<strong>in</strong>vent database (v2.2). Field emissions were estimated us<strong>in</strong>g the best available m<strong>et</strong>hods for such a specific<br />
context. Ammonia (NH3) emissions follow<strong>in</strong>g the application of m<strong>in</strong>eral fertiliser nitrogen were estimated<br />
us<strong>in</strong>g emission factors from the ECETOC report (ECETOC 1994). Emission factors of group I (high<br />
NH3 emission potential due to high temperature and pH) were chosen to be representative as much as possible<br />
for the tropical context with high temperatures. For volatilisation from poultry manure, a 20% emission<br />
factor was selected from the Eco<strong>in</strong>vent guidel<strong>in</strong>es (Nemecek and Kägi 2007). The nitrogen content of poultry<br />
manure was s<strong>et</strong> to 3% accord<strong>in</strong>g to the organic fertilisation guide of the Reunion Island (Chabalier <strong>et</strong> al.,<br />
2006) taken as representative for a tropical context. The emissions of nitrous oxide (N2O) and nitric oxide<br />
(NOx) were estimated follow<strong>in</strong>g the Tier 1 m<strong>et</strong>hodology of the IPCC guidel<strong>in</strong>es (IPCC 2006) <strong>in</strong>clud<strong>in</strong>g both<br />
direct and <strong>in</strong>direct emissions. Due to the lack of a suitable m<strong>et</strong>hod for horticultural crops <strong>in</strong> the Tropics, we<br />
estimated nitrate leach<strong>in</strong>g as 30% of total N applied (IPCC, 2006). Emissions of carbon dioxide (CO2), phosphorus,<br />
and pesticides were estimated follow<strong>in</strong>g m<strong>et</strong>hods from Nemecek and Kägi (2007). The SimaPro<br />
(v7.2) software was used to analyse the environmental impact through the 13 impact categories def<strong>in</strong>ed by<br />
ReCiPe (Goedkoop <strong>et</strong> al., 2009). The names and units of the impact categories are given <strong>in</strong> Table 2.<br />
2.3. Two-step statistical analysis<br />
To describe the diversity of environmental impacts for the studied cropp<strong>in</strong>g systems, we used a two-step<br />
statistical treatment. The first step was to transform the impacts categories <strong>in</strong>to non-correlated variables with<br />
a Pr<strong>in</strong>cipal Component Analysis (PCA). The number of variables was reduced <strong>in</strong>to less dimensions representative<br />
for most of the variability observed <strong>in</strong> the population. Once <strong>in</strong>dividual fields were spread on this multidimensional<br />
space, the PCA m<strong>et</strong>hod allowed identify<strong>in</strong>g one most representative field located closest to the<br />
<strong>in</strong>tersection of the dimensions and, fields responsible for the variability located at the edge of the cloud.<br />
Fields were then grouped <strong>in</strong>to clusters correspond<strong>in</strong>g to cropp<strong>in</strong>g system types us<strong>in</strong>g an Agglomerative Hierarchical<br />
Cluster<strong>in</strong>g (AHC) algorithm, <strong>in</strong> which the pr<strong>in</strong>cipal components of the PCA were used as <strong>in</strong>put variables.<br />
As PCA allows the calculation of one representative field for the whole population, AHC allows identify<strong>in</strong>g<br />
one representative field (called paragon) for each cluster (or type). These paragons are located near<br />
the centroid of each cluster. The population can therefore be analysed us<strong>in</strong>g those typical <strong>in</strong>dividuals, avoid<strong>in</strong>g<br />
any aggregation or averag<strong>in</strong>g often lead<strong>in</strong>g to discrepancies with the reality and the system logic of the<br />
cropp<strong>in</strong>g system. Such a two-step statistical treatment is also called a goal-oriented typology and has been<br />
used <strong>in</strong> studies from the agronomic discipl<strong>in</strong>e to analyse the diversity of cropp<strong>in</strong>g systems and farms<br />
(Pouss<strong>in</strong> <strong>et</strong> al., 2008). Our analysis was strengthened through the test<strong>in</strong>g of the distribution of additional<br />
qualitative or quantitative variables (geographical, irrigation system, soil types or cropp<strong>in</strong>g systems components)<br />
us<strong>in</strong>g Kuiper’s test aga<strong>in</strong>st dimensions and clusters. These variables are summarized <strong>in</strong> Table 1.<br />
Soil<br />
type
PARALLEL SESSION 4C: CROP PRODUCTION SYSTEMS 8 th Int. Conference on <strong>LCA</strong> <strong>in</strong> the<br />
Agri-<strong>Food</strong> Sector, 1-4 Oct <strong>2012</strong><br />
3. Results<br />
3.1. Ma<strong>in</strong> contributors for the environmental impact of out-of-season tomato <strong>in</strong> Ben<strong>in</strong><br />
Most of the variability (90%) observed b<strong>et</strong>ween <strong>in</strong>dividual fields was expla<strong>in</strong>ed by the 3 first dimensions<br />
of the PCA. In this space, the <strong>in</strong>dividual fields P38 is located near the <strong>in</strong>tersection of the dimension. By<br />
def<strong>in</strong>ition from the PCA m<strong>et</strong>hod, this <strong>in</strong>dividual field can be considered representative fields for the environmental<br />
impacts of the population. For the follow<strong>in</strong>g analysis, P38 which had the smallest distance to the<br />
orig<strong>in</strong> of the PCA map (d=1.98) is used to analyse the environmental impact of one hectare of out-of-season<br />
tomato grown <strong>in</strong> the region. The contribution analysis of P38 (Table 2) identified energy used for irrigation<br />
as the ma<strong>in</strong> contributor for 7 among 14 impact categories. Then Nitrogen reactive emissions were the ma<strong>in</strong><br />
contributor for 2 impact categories (TA and ME) and also contributed to 2 other categories (GWP and POF).<br />
Crop protection (<strong>in</strong>secticides and fungicides) showed high contribution for TET, FET and MD.<br />
Table 2. LCIA results and contribution analysis for P38 and ma<strong>in</strong> correlations b<strong>et</strong>ween environmental impacts<br />
and the first 3 dimensions of the PCA<br />
Impact categories P38 LCIA P38 contribution Correlation<br />
Global Warm<strong>in</strong>g Potential- GWP<br />
Ozone Depl<strong>et</strong>ion- OD<br />
1.17E+04 kg CO2 eq<br />
1.22E-03 kg CFC-11 eq<br />
Irr. mach<strong>in</strong>ery (85%), N emissions (15%)<br />
Irrigation (Irr.) mach<strong>in</strong>ery (100%)<br />
Dim 1 (0.99)<br />
Dim 1 (0.96)<br />
Human Toxicity- HT 6.07E+06 kg 1,4-DB eq Irrigation mach<strong>in</strong>ery (100%) Dim 1 (0.94)<br />
Photo Oxidant Formation - POF 2.11E+01 kg NMVOC Irr. mach<strong>in</strong>ery (95%), N emissions (5%) Dim 1 (0.97)<br />
Terrestrial Acidity- TA<br />
Freshwater Eutrophication- FE<br />
2.41E+02 kg SO2 eq<br />
9.54E-01 kg P eq<br />
N emissions (92%), Irr. mach<strong>in</strong>ery (8%)<br />
P emissions (59%), Irr. mach<strong>in</strong>ery (36%), Insecticides<br />
(4%)<br />
Dim 2 (0.81)<br />
Dim 3 (-0.83)<br />
Mar<strong>in</strong>e Eutrophication- ME 3.99E+01 kg N eq N emissions (99%), Irr. mach<strong>in</strong>ery (1%) Dim 2 (0.85)<br />
Terrestrial Eco Toxicity- TET 1.97E+02 kg 1,4-DB eq Insecticides (98%), Irr. mach<strong>in</strong>ery (2%) Dim 2 (0.90)<br />
Freshwater Eco Toxicity- FET 1.22E+02 kg 1,4-DB eq<br />
P emissions (51%), Insecticides (39%), Irr. mach<strong>in</strong>ery<br />
(10%)<br />
Dim 2 (0.92)<br />
Mar<strong>in</strong>e Eco Toxicity - MET 8.60E+02 kg 1,4-DB eq Irr. mach<strong>in</strong>ery (99%), Insecticides (1%) Dim 1 (0.95)<br />
Agricultural<br />
ALO<br />
Land Occupation-<br />
1.57E+03 m 2 a Field Area (99%), Irr. mach<strong>in</strong>ery (1%) -<br />
Water Depl<strong>et</strong>ion- WD 3.81E+03 m 3<br />
Irrigation water (100%) -<br />
M<strong>et</strong>al Depl<strong>et</strong>ion- MD 1.09E+02 kg Fe eq<br />
Irr. mach<strong>in</strong>ery (75%), Fungicides (24%), Insecticides<br />
(1%)<br />
-<br />
Fossil Depl<strong>et</strong>ion- FD 3.49E+03 kg oil eq Irrigation mach<strong>in</strong>ery (100%) Dim 1 (0.96)<br />
3.2. Correlations b<strong>et</strong>ween major impact categories and cropp<strong>in</strong>g system characteristics<br />
Table 2 presents the correlations b<strong>et</strong>ween the 3 first dimensions and the environmental categories, and<br />
b<strong>et</strong>ween LCIA results and cropp<strong>in</strong>g system components for the field P38. Eleven out of 14 impacts categories<br />
were correlated to one of the three dimensions. These categories are of major concern for the variability<br />
of the environmental impact for the studied system.<br />
S<strong>in</strong>ce GWP, POF, FD, OD, MET and HT (see Table 2 for acronyms) were correlated to dimension 1, this<br />
dimension was a good synth<strong>et</strong>ic descriptor for the variability of the datas<strong>et</strong> (50%). All these impact categories<br />
were primarily affected by the energy used for irrigation. GWP and POF were secondarily affected by N<br />
emissions, while MET was affected by pesticides emissions. Dimension 2 represented 26% of the overall<br />
variability, and was ma<strong>in</strong>ly correlated to FET, TET, ME, and TA. ME and TA were ma<strong>in</strong>ly impacted by<br />
nitrogen emissions, while FET was impacted by both phosphorus emissions and <strong>in</strong>secticides. F<strong>in</strong>ally TET<br />
was ma<strong>in</strong>ly impacted by <strong>in</strong>secticides.<br />
The Kuiper’s test showed that the distribution of certa<strong>in</strong> additional variables was consistent with the dimensions<br />
of the PCA. Soil type is correlated to dimension one, with sandy soils show<strong>in</strong>g higher values (v-test<br />
=2.28) and silty soils show<strong>in</strong>g lower values than the population average (v-test =-1.97). The energy use for<br />
irrigation (through the number of pump<strong>in</strong>g hours) was also correlated to dimension 1, with manual systems<br />
show<strong>in</strong>g lower values than the population average (v-test =-2.05). Unexpectedly, the volume of water supplied<br />
did not correlate with this dimension suggest<strong>in</strong>g that a greater energy use for pump<strong>in</strong>g water did not<br />
necessarily result <strong>in</strong> a greater volume applied due to important discrepancies <strong>in</strong> the technologies’ efficiency.<br />
The geographical location (urban or peri-urban), was correlated to dimension 2 with the fields of Cotonou<br />
show<strong>in</strong>g greater values (v-test=2.13) than the overall population. The number of pesticides applications at<br />
the field stage and the number of fertiliser applications were also correlated to dimension 2. F<strong>in</strong>ally the rate<br />
of m<strong>in</strong>eral nitrogen was negatively correlated to dimension 3, highlight<strong>in</strong>g a dichotomy b<strong>et</strong>ween the impact<br />
415
PARALLEL SESSION 4C: CROP PRODUCTION SYSTEMS 8 th Int. Conference on <strong>LCA</strong> <strong>in</strong> the<br />
Agri-<strong>Food</strong> Sector, 1-4 Oct <strong>2012</strong><br />
of phosphorus emission and the use of m<strong>in</strong>eral fertiliser (the ma<strong>in</strong> source of phosphorus be<strong>in</strong>g poultry manure).<br />
3.3. Variability of impacts and cropp<strong>in</strong>g system characteristics as expla<strong>in</strong>ed by the cluster<strong>in</strong>g<br />
The optimal number of clusters m<strong>in</strong>imiz<strong>in</strong>g the distance b<strong>et</strong>ween fields <strong>in</strong> a group and maximiz<strong>in</strong>g the<br />
distance b<strong>et</strong>ween groups was 4. The cluster tree and characteristics of each nod are showed <strong>in</strong> Figure 1.<br />
Figure 1. Hierarchical tree present<strong>in</strong>g the 4 clusters with positive (+) or negative (-) variations for the dimensions<br />
of PCA and correlated cropp<strong>in</strong>g system characteristics. For each cluster paragons are identified by ‘p’<br />
Cluster one (C1) was negatively correlated to dimension 1. Accord<strong>in</strong>gly, C1 showed significantly less impact<br />
for OD, MET, FD, POF and GWP (v-test>2), which were the impact categories correlated to dimension 1. In<br />
addition, cluster 1 showed significantly lower values for three additional variables: crop duration, number of<br />
irrigation and water supply (v-test>|2|). The LCIA results of the paragon P7 for cluster 1 were less than that<br />
of P38 (representative for the whole population) for almost all impact categories except for FE and MD.<br />
N,P,K-fertiliser manufactur<strong>in</strong>g was p<strong>in</strong>po<strong>in</strong>ted as the ma<strong>in</strong> contributor for impact categories correlated to<br />
dimension 1. Conversely, Cluster 4 (C4) was positively correlated to dimension 1 and showed significantly<br />
greater impacts for HT, MET, OD, FD, GWP and POF (v-test>2) than the overall population. In addition, C4<br />
was positively correlated to the number of water pump<strong>in</strong>g hours dur<strong>in</strong>g both the nursery and the field stages.<br />
For categories correlated to dimension 1, the LCIA results for the paragon P40 were two fold greater than<br />
that of the reference P38 and the ma<strong>in</strong> contributor was clearly energy use for irrigation.<br />
Cluster 2 (C2) was positively correlated with dimension 2 and had significantly greater TET and FET impacts<br />
than the overall population. C2 showed significantly greater values for the number of pesticide applications,<br />
as a result of a larger number of <strong>in</strong>secticide applications. The application rates of <strong>in</strong>secticides were also<br />
greater for cluster 2. Similarly, cluster 2 showed significantly greater values for the number of fertiliser applications,<br />
correlated to the number of m<strong>in</strong>eral fertiliser applications. Moreover, C2 was negatively correlated<br />
to sow<strong>in</strong>g date and plant<strong>in</strong>g date, suggest<strong>in</strong>g that, the earlier was the crop cycle, the higher were <strong>in</strong>put<br />
levels for those fields. LCIA results of the paragon P6 for cluster 2 further supported these results, highlight<strong>in</strong>g<br />
<strong>in</strong>secticides application as ma<strong>in</strong> contributor for both TET and FET. F<strong>in</strong>ally, cluster 3 (C3) was negatively<br />
correlated to dimension 3 and showed significantly greater impacts for FE and MD. C3 showed significantly<br />
higher values for m<strong>in</strong>eral nitrogen application rates. The LCIA results of P17 showed high contribution of<br />
416
PARALLEL SESSION 4C: CROP PRODUCTION SYSTEMS 8 th Int. Conference on <strong>LCA</strong> <strong>in</strong> the<br />
Agri-<strong>Food</strong> Sector, 1-4 Oct <strong>2012</strong><br />
fertiliser production for FE and MD. It also evidenced a high contribution of energy use for irrigation, similarly<br />
to cluster 4. P17 and P40 (the paragons of clusters 3 and 4, respectively) showed similar impacts for<br />
most categories, except for TA, FE, ME, TET and FET for which the impacts of P40 were significantly<br />
lower. The greater impacts of P17 was due to pesticide applications (TET and FET), N,P,K-fertiliser manufactur<strong>in</strong>g<br />
and nitrate emissions (TA, FE and ME).<br />
4. Discussion<br />
4. 1. Characteristics of the types of cropp<strong>in</strong>g systems with regard to field selection<br />
The diversity of horticultural cropp<strong>in</strong>g systems <strong>in</strong> the Tropics <strong>in</strong> general and <strong>in</strong> our context of study <strong>in</strong><br />
particular led us to <strong>in</strong>fer that the associated environmental impacts would vary greatly b<strong>et</strong>ween <strong>in</strong>dividual<br />
fields. To assess the environmental impacts of out-of-season tomato cropp<strong>in</strong>g systems <strong>in</strong> Ben<strong>in</strong>, we selected<br />
a large sample of 12 fields over 50 and assumed it was large enough to represent the whole population. This<br />
selection was guided by local expert knowledge and <strong>in</strong>cluded geographical location (urban/peri-urban) and<br />
irrigation system (manual/mechanised). Our pr<strong>in</strong>cipal component analysis showed that <strong>in</strong>dividual fields were<br />
all different. However, by apply<strong>in</strong>g the AHC approach, we could group the population <strong>in</strong>to four clusters def<strong>in</strong>ed<br />
each by one representative fields (the paragon) show<strong>in</strong>g a typical profile of the whole cluster <strong>in</strong> terms<br />
of environmental impacts.<br />
Look<strong>in</strong>g <strong>in</strong> more d<strong>et</strong>ail, the first driver was energy use for irrigation, as reflected by dimension 1 of the PCA<br />
(mak<strong>in</strong>g up 50% of the variability). Energy use for irrigation was also responsible for the first dimension,<br />
group<strong>in</strong>g C1 and C2 apart from C3 and C4. Soil type contributed to this effect, as the impact of energy use<br />
for irrigation was higher on sandy soils. These f<strong>in</strong>d<strong>in</strong>gs support the relevance of our <strong>in</strong>itial typology based on<br />
irrigation systems. It also emphasized the need to <strong>in</strong>clude soil type as well as an important criterion to identify<br />
representative cropp<strong>in</strong>g systems. Geographical location was correlated to the variability expla<strong>in</strong>ed by<br />
dimension 2. Farmers around Cotonou (urban area) have more <strong>in</strong>tensive practices <strong>in</strong> terms of fertilisation and<br />
crop protection than the average population. These f<strong>in</strong>d<strong>in</strong>gs suggest that practices are more <strong>in</strong>tensive <strong>in</strong> urban<br />
areas, due to scarcity of agricultural land. When assess<strong>in</strong>g the environmental impacts of out-of-season<br />
tomato cropp<strong>in</strong>g systems <strong>in</strong> Ben<strong>in</strong>, both urban and peri-urban systems need to be addressed as their environmental<br />
impacts are significantly different.<br />
In addition to the expected sources of variability identified a priori, the AHC evidenced other cropp<strong>in</strong>g systems<br />
specificities. Based on the analysis of clusters presented <strong>in</strong> table 3, we could dissociate extensive (C1<br />
and C3) from <strong>in</strong>tensive (C2 and C4) cropp<strong>in</strong>g system types and identify the source of <strong>in</strong>tensification: irrigation<br />
system (C4) or pesticides and fertilisers (C3). We also demonstrated a possible <strong>in</strong>consistency b<strong>et</strong>ween<br />
yields and practices <strong>in</strong>tensity, highlight<strong>in</strong>g the actual risk due to pest pressure and the question of rate of<br />
r<strong>et</strong>urn. This observation is quite specific to horticultural crops grown <strong>in</strong> tropical peri-urban areas and clearly<br />
questions the choice of the most relevant functional unit for such systems. F<strong>in</strong>ally, we also highlighted <strong>in</strong>consistencies<br />
result<strong>in</strong>g <strong>in</strong> m<strong>et</strong>hodological weaknesses discussed <strong>in</strong> the follow<strong>in</strong>g section.<br />
Table 3. Environmental and agronomical analysis of clusters and subsequent outcomes for a b<strong>et</strong>ter understand<strong>in</strong>g<br />
of cropp<strong>in</strong>g systems<br />
Environmental impact variability<br />
C1 Lower than P38<br />
C3<br />
C2<br />
↑ impact of irrigation system<br />
and NPK production<br />
↑ impact of nitrogen emissions<br />
↑ impact of <strong>in</strong>secticides and<br />
nitrogen emissions<br />
C4 ↑↑ impact of irrigation<br />
Agronomical performances<br />
(*not statistically significant) Ma<strong>in</strong> outcomes<br />
- Short crop length<br />
- Yield losses due to biotic &<br />
abiotic causes*<br />
- High m<strong>in</strong>eral fertiliser rates<br />
- Yield losses due to pest<br />
pressure*<br />
- High <strong>in</strong>secticide &fertiliser<br />
application number<br />
- Early plant<strong>in</strong>g dates<br />
- High use of pump<br />
- Large water supplied<br />
2 strategies<br />
- Low <strong>in</strong>vestment strategy, rate of r<strong>et</strong>urn?<br />
- Early crop failure<br />
1 conclusion<br />
Intensive practices ≠ high yields<br />
Investments = risk<br />
2 conclusions<br />
- Intensive practices ≠ technical irrigation <strong>in</strong>frastructures<br />
- Early plant<strong>in</strong>g = large use of <strong>in</strong>secticides<br />
2 questions<br />
- Valorisation of <strong>in</strong>vestments <strong>in</strong> irrigation system?<br />
- Effect of water supply on impact of nitrogen emissions?<br />
4.2. Implications of <strong>LCA</strong> impacts variability <strong>in</strong> the ref<strong>in</strong><strong>in</strong>g of m<strong>et</strong>hods and data collection<br />
417
PARALLEL SESSION 4C: CROP PRODUCTION SYSTEMS 8 th Int. Conference on <strong>LCA</strong> <strong>in</strong> the<br />
Agri-<strong>Food</strong> Sector, 1-4 Oct <strong>2012</strong><br />
Crop protection showed relatively low contributions to the impact variability compared to other cropp<strong>in</strong>g<br />
system components. This result is not due to a low impact of pesticides, s<strong>in</strong>ce normalised results (not<br />
shown) po<strong>in</strong>ted terrestrial ecotoxicity (TET) as second important impact. The ma<strong>in</strong> reason why crop protection<br />
was not discrim<strong>in</strong>at<strong>in</strong>g is that all pesticides emissions were emitted <strong>in</strong>to the soil as recommended by<br />
(Nemecek and Kägi 2007).This m<strong>et</strong>hod does not consider the behaviour of pesticides <strong>in</strong> the environment <strong>in</strong><br />
relation to application m<strong>et</strong>hods, and subsequent transports <strong>in</strong> the ma<strong>in</strong> environmental compartments. As a<br />
consequence, the ma<strong>in</strong> drivers were pesticide application rates and toxicity potentials. Consider<strong>in</strong>g these<br />
drivers, the use of cyperm<strong>et</strong>hr<strong>in</strong> and organo phosphorus compounds (terbufos and dim<strong>et</strong>hoate) were clearly<br />
discrim<strong>in</strong>at<strong>in</strong>g the systems’ impact, the first one due to its high application rate, the two other ones for their<br />
high toxicity. The assessment of crop protection practices requires improved m<strong>et</strong>hods for the estimation of<br />
pesticide emissions to the different environmental compartments as it should be a hot-spot for tropical crops.<br />
Fertilisation practices contributed to differentiat<strong>in</strong>g <strong>in</strong>tensive cropp<strong>in</strong>g systems from extensive ones, ma<strong>in</strong>ly<br />
based on fertiliser types and rates. However, <strong>in</strong>tensive fertilisation practices did not correlate with greater<br />
yields. This observation led us to question the m<strong>et</strong>hods used to estimate field emissions. Crop uptake is the<br />
ma<strong>in</strong> s<strong>in</strong>k for applied nutrients. If it varies, field emissions should vary accord<strong>in</strong>gly, especially for nitrate<br />
leach<strong>in</strong>g which is related to the amount of nitrogen available <strong>in</strong> soils dur<strong>in</strong>g dra<strong>in</strong>age events. We could not<br />
use a m<strong>et</strong>hod based on nitrogen balance for nitrate leach<strong>in</strong>g s<strong>in</strong>ce it requires to estimate dra<strong>in</strong>age events<br />
(Brentrup <strong>et</strong> al., 2000), which depended <strong>in</strong> our cropp<strong>in</strong>g systems on the tim<strong>in</strong>g of irrigation <strong>in</strong>puts. No m<strong>et</strong>hods<br />
<strong>in</strong> LCI guidel<strong>in</strong>es allowed <strong>in</strong>clud<strong>in</strong>g effect of irrigation practices on nitrate emissions. In addition, for<br />
cropp<strong>in</strong>g system with no dra<strong>in</strong>age events (low water supplied per irrigation event), there should be an accumulation<br />
of nitrogen <strong>in</strong> soil. This might <strong>in</strong>volve higher emissions of nitrous and nitric oxides than the average<br />
factor proposed by IPCC (IPCC 2006) and would deserve an improved modell<strong>in</strong>g as well. For tropical<br />
horticultural systems where yields can be significantly reduced due to pest pressure, the behaviour of nitrogen<br />
<strong>in</strong> the environment needs to be modelled consider<strong>in</strong>g irrigation practices, the tim<strong>in</strong>g and m<strong>et</strong>hod of fertiliser<br />
application and the actual yield.<br />
5. Conclusion<br />
The proposed typology allows the identification of representative <strong>in</strong>dividual fields to assess the environmental<br />
impact of tomato cropp<strong>in</strong>g systems <strong>in</strong> Ben<strong>in</strong>. Our approach identified key data to be collected and<br />
estimated accurately <strong>in</strong> the LCI for horticultural products <strong>in</strong> the Tropics. In a near future we are plann<strong>in</strong>g to<br />
<strong>in</strong>clude these data <strong>in</strong> our LCI to assess their effects on <strong>LCA</strong> results <strong>in</strong> terms of sensitivity and uncerta<strong>in</strong>ty.<br />
Identify<strong>in</strong>g cropp<strong>in</strong>g system types and specific LCI data makes it possible to reveal site-specific differences<br />
<strong>in</strong> the <strong>LCA</strong> results which did not appear when us<strong>in</strong>g the recommended LCI data s<strong>et</strong>. Although <strong>LCA</strong> claims to<br />
be a m<strong>et</strong>hod assess<strong>in</strong>g global environmental impacts, we believe that results should account for key local<br />
variables.<br />
6. References<br />
Brentrup F, Küsters J, Lammel J, Barraclough P, Kuhlmann H (2004) Environmental impact assessment of agricultural production<br />
systems us<strong>in</strong>g the life cycle assessment (<strong>LCA</strong>) m<strong>et</strong>hodology II. The application to N fertilizer use <strong>in</strong> w<strong>in</strong>ter wheat production<br />
systems. Eur. J. Agon. (3):265-279.<br />
Brentrup F, Küsters J, Lammel J, Kuhlmann H (2000) M<strong>et</strong>hods to estimate on-field nitrogen emissions from crop production as an<br />
<strong>in</strong>put to <strong>LCA</strong> studies <strong>in</strong> the agricultural sector. Int J Life Cycle Ass (6):349-357.<br />
Chabalier PF, Van de Kerchove V, Sa<strong>in</strong>t Macary H (2006) Guide de la fertilisation organique à la Réunion. CIRAD.<br />
ECETOC (1994) Ammonia emissions to air <strong>in</strong> Western Europe. Technical Report, vol Vol. 62. Brussels.<br />
Goedkoop M, Heijungs R, Huijbregts M, De Schryver A, Struijs J, van Zelm R (2009) ReCiPe 2008: A life cycle impact assessment<br />
m<strong>et</strong>hod which comprises harmonised category <strong>in</strong>dicators at the midpo<strong>in</strong>t and the endpo<strong>in</strong>t level. First edition, vol Report I:<br />
Characterisation.<br />
IPCC (2006) Chapter 11: N2O emissions from managed soils, and CO2 emissions from lime and urea application. In: Eggleston S,<br />
Buendia L, Miwa K, Ngara T, Tanabe K (eds) IPCC guidel<strong>in</strong>es for national greenhouse gas <strong>in</strong>ventories. Institute for Global<br />
Environmental Strategies, Hayama, Japan.<br />
Martínez-Blanco J, Muñoz P, Antón A, Rieradevall J (2011) Assessment of tomato Mediterranean production <strong>in</strong> open-field and<br />
standard multi-tunnel greenhouse, with compost or m<strong>in</strong>eral fertilizers, from an agricultural and environmental standpo<strong>in</strong>t. J<br />
Clean Prod (9-10):985-997.<br />
Nemecek T, Kägi T (2007) Life Cycle Inventories of Agricultural Production Systems. F<strong>in</strong>al report eco<strong>in</strong>vent, vol v2.0 No.15. Swiss<br />
Centre for Life Cycle Inventories, Zurich, Switzerland.<br />
Pouss<strong>in</strong> JC, Imache A, Beji R, Le Grusse P, Benmihoub A (2008) Explor<strong>in</strong>g regional irrigation water demand us<strong>in</strong>g typologies of<br />
farms and production units: An example from Tunisia. Agricultural Water Management (8):973-983.<br />
418
PARALLEL SESSION 4C: CROP PRODUCTION SYSTEMS 8 th Int. Conference on <strong>LCA</strong> <strong>in</strong> the<br />
Agri-<strong>Food</strong> Sector, 1-4 Oct <strong>2012</strong><br />
French agricultural practices traceability system employed for<br />
environmental assessment<br />
Paul<strong>in</strong>e Maupu 1 ,,Amand<strong>in</strong>e Berthoud 1 , Ophélie Negri 1 , Edith Mart<strong>in</strong> 2 , Seheno Ratsimbazafy 2 , Noëllie<br />
Oud<strong>et</strong> 2 , Anto<strong>in</strong>e Poupart 1<br />
1 InVivo AgroSolutions, Direction Agriculture Durable <strong>et</strong> Développement, 83 av. de la Grande Armée, 75782 Paris Cedex 16, <strong>France</strong><br />
2 Bio Intelligence Service, 20-22 Villa Deshayes, 75014 Paris, <strong>France</strong><br />
Correspond<strong>in</strong>g author. E-mail: pmaupu@<strong>in</strong>vivo-group.com<br />
ABSTRACT<br />
InVivo, a French agricultural cooperatives union, has developed and implemented decision-mak<strong>in</strong>g tools to help farmers manage<br />
fertilisation and plant protection. These tools enable pedologic, climatologic and agronomic data collection for each agricultural field<br />
on a farm, creat<strong>in</strong>g a traceability system allow<strong>in</strong>g for field-scale <strong>LCA</strong> <strong>in</strong>dicators calculation.<br />
An <strong>LCA</strong> was conducted on w<strong>in</strong>ter wheat crop based on real agricultural practices for crops harvested <strong>in</strong> 2009, <strong>in</strong>volv<strong>in</strong>g six cooperatives,<br />
13941 fields, and cover<strong>in</strong>g 95432ha <strong>in</strong> production bas<strong>in</strong>s across <strong>France</strong>. Several <strong>in</strong>dicators were calculated: water consumption,<br />
greenhouse gas emissions, mar<strong>in</strong>e and freshwater eutrophication, primary energy consumption, acidification, freshwater ecotoxicity.<br />
Every practice necessary for gra<strong>in</strong> production and harvest was considered: cultivation, sow<strong>in</strong>g, fertiliser and pesticide production and<br />
application, fuel consumption. Transportation to the gra<strong>in</strong> silo and storage were subsequently considered.<br />
The ma<strong>in</strong> conclusions are: (1) regard<strong>in</strong>g impacts on freshwater ecotoxicity, pesticide use and fertiliser use are predom<strong>in</strong>ant, (2) regard<strong>in</strong>g<br />
the other <strong>LCA</strong> <strong>in</strong>dicators, fertiliser production and fertiliser use are predom<strong>in</strong>ant (3) results are highly scattered when observed<br />
among fields; much less among production bas<strong>in</strong>s (4) results depend on the product’s technological quality.<br />
The next step will be to identify ways to improve <strong>LCA</strong> results <strong>in</strong>dicator by <strong>in</strong>dicator by improv<strong>in</strong>g agricultural practices. InVivo’s<br />
advice and decision-mak<strong>in</strong>g tools prove suitable for mass traceability and mass environmental impacts m<strong>in</strong>imization.<br />
Keywords: Agricultural <strong>LCA</strong>, Ecodesign, wheat, traceability, mass improvement<br />
1. Introduction<br />
Life cycle assessment (<strong>LCA</strong>) is the lead<strong>in</strong>g m<strong>et</strong>hodology for the environmental impact assessment of a<br />
product for two ma<strong>in</strong> reasons: it allows for the calculation of several <strong>in</strong>dicators correspond<strong>in</strong>g to different<br />
environmental impacts (global warm<strong>in</strong>g, eutrophication, primary resources depl<strong>et</strong>ion…), and takes <strong>in</strong>to account<br />
all relevant steps of the life cycle of a product, from the production of raw materials to the end of life.<br />
When it comes to agricultural products, data collection constitutes a real stake. Indeed 1 kg of wheat gra<strong>in</strong><br />
sold conta<strong>in</strong>s wheat com<strong>in</strong>g from several farms, from several fields. Each of these fields is managed follow<strong>in</strong>g<br />
different agricultural practices and under different pedoclimatic conditions.<br />
In light of the grow<strong>in</strong>g concern of the food <strong>in</strong>dustry for environmental responsibility, it becomes more<br />
and more important for their suppliers to know specifically what the impact of the raw products they produce<br />
is. This knowledge must cover the raw products variability, tak<strong>in</strong>g <strong>in</strong>to account their production conditions,<br />
their technological quality…<br />
For example, regionally aggregated data on wheat production and its potential impacts are not likely to be<br />
representative of the cooperatives members’ data with<strong>in</strong> the same region: mean regional data do not convey<br />
the fact that cooperatives are pass<strong>in</strong>g <strong>in</strong>formation, advice and tools on to their members, effectively <strong>in</strong>fluenc<strong>in</strong>g<br />
their way of produc<strong>in</strong>g wheat, as well as other agricultural products. Thus, it appears that us<strong>in</strong>g fieldscale<br />
recorded data on real practices would be the best solution for cooperatives who want to assess the potential<br />
impacts of their own products. In addition, the field scale is relevant for impact assessment because<br />
that is the scale at which farmers make decisions and it is also the scale that allows aggregation at higher<br />
scales such as the farm or the production bas<strong>in</strong>.<br />
Thus, most <strong>LCA</strong> studies on agricultural products come up aga<strong>in</strong>st the issue of obta<strong>in</strong><strong>in</strong>g real data on agricultural<br />
practices. The potential impacts of agricultural products are <strong>in</strong>deed closely related to those agricultural<br />
practices: <strong>in</strong>puts (fertiliser, fuel and pesticides) consumption vary a lot b<strong>et</strong>ween fields, as well as yield<br />
and emissions that are highly dependent on both agricultural practices and pedoclimatic conditions.<br />
InVivo is a French union of agricultural cooperatives that produces and sells, among other products and<br />
services, decision-mak<strong>in</strong>g tools to help farmers manage fertilisation and pesticide application. With the help<br />
of cooperatives and thanks to these tools, pedologic, climatologic and agronomic (<strong>in</strong> particular fertilisation<br />
and pesticide applications practices) data is collected and recorded for each agricultural plot of a farm.<br />
The ma<strong>in</strong> objectives of this study are (1) to assess the environmental impact of w<strong>in</strong>ter wheat, us<strong>in</strong>g a Life<br />
Cycle Assessment (<strong>LCA</strong>) cover<strong>in</strong>g field practices, transport and storage of the gra<strong>in</strong>s until the gra<strong>in</strong> is sold to<br />
a miller, (2) to identify the most impact<strong>in</strong>g phases of the w<strong>in</strong>ter wheat life cycle, (3) to study the scatter<strong>in</strong>g of<br />
the impact <strong>in</strong>dicators results at two scales: field scale and production bas<strong>in</strong> scale (4) to exam<strong>in</strong>e the effect of<br />
419
PARALLEL SESSION 4C: CROP PRODUCTION SYSTEMS 8 th Int. Conference on <strong>LCA</strong> <strong>in</strong> the<br />
Agri-<strong>Food</strong> Sector, 1-4 Oct <strong>2012</strong><br />
w<strong>in</strong>ter wheat technological quality on its environmental impacts. Over all, this study will make it possible to<br />
say wh<strong>et</strong>her, as demand<strong>in</strong>g as it may be, <strong>LCA</strong> based on field-scale data is as worthwhile as is expected.<br />
2. M<strong>et</strong>hods<br />
2.1 Data collection<br />
An <strong>LCA</strong> was conducted on w<strong>in</strong>ter wheat, based on real agricultural practices recorded for w<strong>in</strong>ter wheat<br />
harvested <strong>in</strong> 2009, on a sample of 13 941 fields, cover<strong>in</strong>g 95 432 ha <strong>in</strong> different production bas<strong>in</strong>s of <strong>France</strong><br />
where six cooperatives, from different regions, collect their wheat. The real agricultural practices were directly<br />
recorded with a tool used by farmers to manage their practices and to carry out their products’ traceability.<br />
To use this tool farmers have to record all their field operations. Through this system, data on pedology<br />
and agricultural practices <strong>in</strong> each field where the tool is used were gathered <strong>in</strong> a database and were analysed<br />
us<strong>in</strong>g the Statistic Analysis System (SAS) software. Thus, the results of this <strong>LCA</strong> are representative of<br />
farmers who use such decision-mak<strong>in</strong>g tools.<br />
The fields were divided <strong>in</strong>to groups, correspond<strong>in</strong>g to the 6 cooperatives’ production bas<strong>in</strong>s, which were<br />
then further divided <strong>in</strong>to second-range groups identified by their own agronomic experts. These production<br />
scenarios were thus characterised by different soil conditions and/or by different technologic qualities (prote<strong>in</strong><br />
content of the gra<strong>in</strong>s), i.e. by different agricultural practices. Such a classification allowed for a f<strong>in</strong>er<br />
analysis; however, all results cannot be d<strong>et</strong>ailed here for obvious conciseness reasons.<br />
Table 1. Description of the population<br />
Cooperative’s name Number of fields Surface of the sample (hectares)<br />
2.2 System boundaries<br />
420<br />
Coop 1 437 3 273<br />
Coop 2 2 198 23 701<br />
Coop 3 70 703<br />
Coop 4 1 908 7 831<br />
Coop 5 7 709 50 937<br />
Coop 6 1 619 8 987<br />
The functional unit studied here is “1 kg of wheat gra<strong>in</strong>, ready to be exported from the cooperative”.<br />
Figure 4. Studied w<strong>in</strong>ter wheat production system.<br />
The agricultural practices considered <strong>in</strong> this study are cultivation, sow<strong>in</strong>g, fertilis<strong>in</strong>g and pesticide application<br />
and fuel consumption on field to produce and harvest the wheat. Eco<strong>in</strong>vent 2.0 life cycle <strong>in</strong>ventories<br />
(Nemecek and Kägi, 2007) were used to consider the production of the <strong>in</strong>puts: wheat seed, fertilisers, pesticides,<br />
fuel, <strong>et</strong>c.
PARALLEL SESSION 4C: CROP PRODUCTION SYSTEMS 8 th Int. Conference on <strong>LCA</strong> <strong>in</strong> the<br />
Agri-<strong>Food</strong> Sector, 1-4 Oct <strong>2012</strong><br />
2.3 Calculation of particular fluxes and of freshwater Ecotoxicity<br />
N2O, NO, NH3 NO3- and P2O5 emissions are fluxes that need particular calculation because they depend<br />
both on agricultural practices and on pedoclimatic and agronomic conditions. Their calculation requires the<br />
use of models, as reliable and recognized as possible.<br />
Direct and <strong>in</strong>direct emissions of N2O and NO were assessed for each field separately, us<strong>in</strong>g the<br />
Bouwman emission factors (Bouwman <strong>et</strong> al., 2002). The calculation of NH3 emissions were made with the<br />
Ges’tim (Institut de l’élevage <strong>et</strong> al., 2002) and Corpen (2006) m<strong>et</strong>hods. The NO3- emissions were estimated<br />
thanks to a calculation tool <strong>in</strong>tegrated <strong>in</strong>to Epicles (one of InVivo’s decision-mak<strong>in</strong>g tools) which uses the<br />
Burns model (1976) to d<strong>et</strong>erm<strong>in</strong>e the part of nitrogen that is leachable dur<strong>in</strong>g w<strong>in</strong>ter ra<strong>in</strong>falls. For the P2O5<br />
emissions, the SA<strong>LCA</strong>-P m<strong>et</strong>hod was used (Prasuhn 2006 and Nemecek <strong>et</strong> al., 2007).<br />
The freshwater ecotoxicity impacts of pesticide applications were assessed for each field separately, us<strong>in</strong>g<br />
characterisation factors (CF) from USEtox (Rosenbaum <strong>et</strong> al., 2008) <strong>in</strong> l<strong>in</strong>e with the m<strong>et</strong>hod previously used<br />
<strong>in</strong> a published study by Berthoud <strong>et</strong> al., (2011).<br />
2.4 Characterisation<br />
A tool developed on Microsoft’s Excel by Bio Intelligence Service was used to make the characterisation<br />
calculations, <strong>in</strong> compliance with several characterisation m<strong>et</strong>hods, depend<strong>in</strong>g on the <strong>LCA</strong> <strong>in</strong>dicator.<br />
The global warm<strong>in</strong>g impacts of the <strong>in</strong>ventoried fluxes were assessed with the IPCC m<strong>et</strong>hod. The RECIPE<br />
m<strong>et</strong>hod was used to characterise the fluxes respectively relevant to freshwater and mar<strong>in</strong>e eutrophication,<br />
and terrestrial acidification. Water depl<strong>et</strong>ion and non-renewable energy <strong>in</strong>dicators were calculated accord<strong>in</strong>g<br />
to a simple fluxes assessment. As for freshwater ecotoxicity impacts, they were assessed thanks to the USEtox<br />
m<strong>et</strong>hod, as d<strong>et</strong>ailed <strong>in</strong> the previous paragraph.<br />
3. Results<br />
3.1. Environmental impact of w<strong>in</strong>ter wheat<br />
Figure 5. Contribution of the several stages of the wheat life cycle to the <strong>LCA</strong> <strong>in</strong>dicators results & Mean<br />
values of each <strong>LCA</strong> <strong>in</strong>dicator for the different cooperatives <strong>in</strong>volved <strong>in</strong> the study<br />
The results show that the most impact<strong>in</strong>g stages of wheat production on greenhouse gases emissions, mar<strong>in</strong>e<br />
eutrophication, terrestrial acidification and energy consumption are quite the same: nitrogenous fertilisers’<br />
production, transport and application on the field. This can be expla<strong>in</strong>ed by the important emissions and<br />
energy consumption dur<strong>in</strong>g the production of m<strong>in</strong>eral fertilisers, as well as by the <strong>in</strong>-field emissions (N2O,<br />
NO3 and NH3), which are l<strong>in</strong>ked to the application of both m<strong>in</strong>eral and organic fertilisers. Farm mach<strong>in</strong>ery<br />
421
PARALLEL SESSION 4C: CROP PRODUCTION SYSTEMS 8 th Int. Conference on <strong>LCA</strong> <strong>in</strong> the<br />
Agri-<strong>Food</strong> Sector, 1-4 Oct <strong>2012</strong><br />
manufactur<strong>in</strong>g and energy use also contribute <strong>in</strong> a significant way to greenhouse gases emissions and, logically,<br />
to energy consumption.<br />
The impact on water depl<strong>et</strong>ion depends on the quantity of water used for crop irrigation, but also on the<br />
phosphorous fertiliser production and, to a smaller extent, on storage.<br />
Fertiliser production is the ma<strong>in</strong> stage impact<strong>in</strong>g freshwater eutrophication, along with their application<br />
on the fields. Field emissions are mostly due to soil erosion that carry away P2O5 particles and are slightly<br />
l<strong>in</strong>ked with P-fertiliser application.<br />
Aquatic ecotoxicity is largely impacted by the ecotoxicity profile of the plant protection products applied<br />
on the field.<br />
422<br />
3.2. Scatter<strong>in</strong>g of the impact <strong>in</strong>dicators (GES & acidification)<br />
Results concern<strong>in</strong>g the scatter<strong>in</strong>g of the impact <strong>in</strong>dicators are based on <strong>in</strong>tra-cooperative data <strong>in</strong> order to<br />
free oneself from variability b<strong>et</strong>ween wide regional pedoclimatic conditions. Results submitted here are<br />
those of one cooperative among the 6 <strong>in</strong>volved <strong>in</strong> the study. This cooperative chose to subdivide its territory<br />
<strong>in</strong>to 4 scenarios depend<strong>in</strong>g on soil type.<br />
Figure 6. Inter-field variability regard<strong>in</strong>g the climate change and acidification <strong>in</strong>dicators<br />
GHG emissions rank from 0,36 to 0,39 kg eq.CO2 / kg wheat gra<strong>in</strong>, depend<strong>in</strong>g on the scenario. Statistical<br />
Student test (Table 2) shows that there is a significant difference b<strong>et</strong>ween the 4 scenarios.<br />
Potential acidification impact ranks from 5.4.10 -3 à 6.5.10 -3 kg eq.SO2 / kg wheat gra<strong>in</strong>, depend<strong>in</strong>g on the<br />
scenario. Statistical analysis (Table 2) shows that there is a significant difference b<strong>et</strong>ween the 4 scenarios.<br />
Beyond these observations on differences b<strong>et</strong>ween scenarios, it is important to note that <strong>in</strong>ter-field variability<br />
is substantial. It is much higher than variability b<strong>et</strong>ween soil types. This is why <strong>in</strong> a given improvement<br />
strategy, it will be more efficient to work on the reduction of the impacts of the fields with the higher<br />
impact taken as a whole than to select wheat produced on the lower impact<strong>in</strong>g soil.<br />
Table 2. Statistical comparison of the climate change and acidification <strong>in</strong>dicators results of the 4 wheat production<br />
scenarios<br />
Two-by-two comparison with a statistical Student test<br />
P-value<br />
Climate change Acidification<br />
Scenarios 3 vs. 1 6.04E-67 1.36E-38<br />
Scenarios 3 vs. 2 3.83E-64 1.09E-35<br />
Scenarios 3 vs. 4 3.74E-72 1.20E-13<br />
Scenarios 4 vs. 1 1.48E-2 1.92E-06<br />
Scenarios 4 vs. 2 3.43E-2 5.46E-3<br />
Scenarios 2 vs. 1 7.84E-1 7.59E-3<br />
3.3. Effect of w<strong>in</strong>ter wheat technological quality on environmental impacts<br />
Results regard<strong>in</strong>g the scatter<strong>in</strong>g of the impact <strong>in</strong>dicators b<strong>et</strong>ween high-prote<strong>in</strong> wheat and w<strong>in</strong>ter wheat are<br />
also based on <strong>in</strong>tra-cooperative data. The follow<strong>in</strong>g results are those of one cooperative that chose to study<br />
its wheat’s impacts depend<strong>in</strong>g on w<strong>in</strong>ter wheat technological quality.
PARALLEL SESSION 4C: CROP PRODUCTION SYSTEMS 8 th Int. Conference on <strong>LCA</strong> <strong>in</strong> the<br />
Agri-<strong>Food</strong> Sector, 1-4 Oct <strong>2012</strong><br />
Figure 7. Inter-field variability regard<strong>in</strong>g the climate change and acidification <strong>in</strong>dicators<br />
With 0.42 kg eq.CO2 / kg wheat gra<strong>in</strong>, improved wheat has a higher potential impact on climate change<br />
than standard w<strong>in</strong>ter wheat (0.35 kg eq.CO2 / kg gra<strong>in</strong> wheat). Accord<strong>in</strong>g to the statistical Student test this<br />
difference is significant (p-value = 0.0170).<br />
This difference can be expla<strong>in</strong>ed by the fact that, hav<strong>in</strong>g higher prote<strong>in</strong> content gra<strong>in</strong>s, improver wheat<br />
needs more nitrogen to fill up its gra<strong>in</strong>s. When the functional unit is 110g prote<strong>in</strong> rather than 1 kg of wheat<br />
gra<strong>in</strong>, conclusions on the potential impact on climate change of improver wheat and standard w<strong>in</strong>ter wheat<br />
change: their respective GHG emissions are 0.36 and 0.40 kg eq CO2 / 110g prote<strong>in</strong>.<br />
On the other hand, when consider<strong>in</strong>g terrestrial acidification potential, improver wheat has a lower potential<br />
impact than standard w<strong>in</strong>ter wheat: its emissions are 4.4.10-3 kg eq. SO2 / kg gra<strong>in</strong> when standard w<strong>in</strong>ter<br />
wheat ones stand at 4.9.10-3 kg eq. SO2 / kg gra<strong>in</strong> wheat. This b<strong>et</strong>ter result of improver wheat is due to the<br />
use of fertilisers that have lower NH3-emission rates (ammonium nitrate essentially). In this case, the fertiliser<br />
type enables to make up for the bigger use of fertilisers (reported to 1 kg wheat gra<strong>in</strong>) by improver<br />
wheat. The change of the fertiliser type constitutes a key lever for improv<strong>in</strong>g the acidification <strong>in</strong>dicator. It is<br />
also true for the climate change and energy consumption <strong>in</strong>dicators (Berthoud and Rocca, 2011). Accord<strong>in</strong>g<br />
to the statistical Student test this difference is not significant (p-value = 0.7156).<br />
4. Discussion<br />
Carry<strong>in</strong>g out such analyses at the field scale allows for more accurate results than at larger scales. This is<br />
especially true where cooperatives are <strong>in</strong>volved, as they are key players who can thus put their agroenvironmental<br />
knowledge to good use.<br />
However the ma<strong>in</strong> benefit of a field scale approach is to offer a wide range of improvement possibilities.<br />
For <strong>in</strong>stance <strong>in</strong> another case study, the results of which could not be d<strong>et</strong>ailed here and which is separately<br />
published, we worked specifically on the ecotoxicity <strong>in</strong>dicator. We were able to simulate a 50% decrease of<br />
the cooperative’s mean impact regard<strong>in</strong>g this <strong>in</strong>dicator by identify<strong>in</strong>g the most impact<strong>in</strong>g practices (<strong>in</strong> this<br />
case, pesticide use) and substitut<strong>in</strong>g them for less impact<strong>in</strong>g ones (Berthoud <strong>et</strong> al., 2011). There <strong>in</strong>deed lie<br />
the stakes of the variability study: to identify the most impact<strong>in</strong>g practices <strong>in</strong> order to improve them, as well<br />
as to identify good practices.<br />
The ma<strong>in</strong> limit to a field scale approach, however, is that it requires flux and impacts modell<strong>in</strong>g tools and<br />
m<strong>et</strong>hods to be sufficiently practice-sensitive. To date, it is not (or to the least, not enough) the case for some<br />
<strong>in</strong>dicators such as freshwater eutrophication.<br />
5. Conclusion<br />
What makes it particularly <strong>in</strong>terest<strong>in</strong>g to work on agricultural field practices is to address variability. The<br />
knowledge of this variability is a crucial ass<strong>et</strong>: understand<strong>in</strong>g, identify<strong>in</strong>g the most and the less impact<strong>in</strong>g<br />
practices, progress<strong>in</strong>g towards an eco-conception of agricultural practices or even towards a very early consideration<br />
of potential impacts through the agricultural advis<strong>in</strong>g stage by <strong>in</strong>form<strong>in</strong>g advisers of the potential<br />
impacts of the agronomical solutions they recommend.<br />
Similar studies have been carried out by InVivo Agro Solutions, with real data for agricultural practices,<br />
on other crops, such as barley, maize, <strong>et</strong>c, thus creat<strong>in</strong>g an environmental <strong>in</strong>formation system. Moreover,<br />
each of these studies will be conducted dur<strong>in</strong>g 5 years, allow<strong>in</strong>g for the cooperatives to have an <strong>in</strong>ter-annual<br />
view of their impacts.<br />
423
PARALLEL SESSION 4C: CROP PRODUCTION SYSTEMS 8 th Int. Conference on <strong>LCA</strong> <strong>in</strong> the<br />
Agri-<strong>Food</strong> Sector, 1-4 Oct <strong>2012</strong><br />
The record<strong>in</strong>g of agricultural practices for each agricultural plot of a farm us<strong>in</strong>g decision-mak<strong>in</strong>g tools or<br />
traceability tools is priceless for the cooperatives. Some of them have already started to put it to good use <strong>in</strong><br />
their commercial relationships, me<strong>et</strong><strong>in</strong>g their clients’ need for environmental <strong>in</strong>formation about agricultural<br />
products. The next challenge cooperatives deal<strong>in</strong>g with their environmental impact will have to take up is<br />
data confidentiality and environmental services payment. Under those two conditions, the high variability of<br />
the impacts of agricultural raw materials will be reflected <strong>in</strong> the impacts of transformed products, and so will<br />
their impacts improvements be reflected <strong>in</strong> the impacts of transformed products.<br />
6. References<br />
Berthoud A., Maupu P., Hu<strong>et</strong> C., Poupart A., 2011. Assess<strong>in</strong>g Freshwater Ecotoxicity of agricultural products <strong>in</strong> Life Cycle Assessment<br />
(<strong>LCA</strong>): a case study of wheat us<strong>in</strong>g French agricultural practices databases and USEtox model. Int. J. <strong>LCA</strong> 16, 841-847.<br />
Berthoud A., Rocca C., 2011. Réalisation d'une ACV sur les 3 pr<strong>in</strong>cipales formes d'azote: mise en évidence d'un eff<strong>et</strong> forme au<br />
niveau technique <strong>et</strong> environnemental. COMIFER GEMAS 2011.<br />
http://www.comifer.asso.fr/images/stories/pdf/10emes_rencontres/berthoud/1%20-%20<strong>in</strong>vivo%20-%20berthoud%20-<br />
%20article.pdf<br />
Bouwman AF., Boumans LJM., Batjes NH., 2002. Model<strong>in</strong>g global annual N2O and NO emissions from fertilized fields. Global<br />
Biogeochemical Cycles 16(4).<br />
Burns I.G., 1976. Equations to predict the leach<strong>in</strong>g of nitrate uniformly <strong>in</strong>corporated to a known depth or uniformly distributed<br />
throughout a soil profile. Journal of Agricultural Science 86, 305-313.<br />
CORPEN, 2006. Des <strong>in</strong>dicateurs Azote pour gérer des opérations de maîtrise des pollutions à l’échelle de la parcelle, de<br />
l’exploitation <strong>et</strong> du territoire.<br />
Institut de l'élevage, IFIP, ITAVI, Arvalis, CETIOM & ITB. 2009. Ges'tim - Guide méthodologique pour l'estimation des impacts des<br />
activités agricoles sur l'eff<strong>et</strong> de serre. Version provisoire 1.2, mai 2010.<br />
Nemecek T, Kägi T., 2007. Life cycle <strong>in</strong>ventories of agricultural production systems. Eco<strong>in</strong>vent report No. 15. FAL Reckenholz,<br />
FAT Tänikon, Swiss center for life cycle <strong>in</strong>ventories, Zürich and Dübendorf.<br />
Rosenbaum R.K., Bachmann T.M., Swirsky Gold L., Huijbregts M.A., 2008. USEtox- the UNEP-SETAC toxicity model: recommended<br />
characterisation factors for human toxicity and freshwater ecotoxicity <strong>in</strong> life cycle assessment, International Journal of<br />
Life Cycle Assessment 13, pp. 532-546.<br />
Prasuhn V., 2006 Erfassung der PO4-Austräge für die Ökobilanzierung – SA<strong>LCA</strong>-Phosphor. Agroscope FAL Reckenholz, 22 p.<br />
424
PARALLEL SESSION 4C: CROP PRODUCTION SYSTEMS 8 th Int. Conference on <strong>LCA</strong> <strong>in</strong> the<br />
Agri-<strong>Food</strong> Sector, 1-4 Oct <strong>2012</strong><br />
<strong>LCA</strong> of starch potato from field to starch production plant gate<br />
Godard Carol<strong>in</strong>e 1,* , Boissy Joachim 1 , Sur<strong>et</strong> Camille 1 , Gabrielle Benoît 2<br />
1 Agro-Transfert Ressources <strong>et</strong> Territoires, 2 Chaussée Brunehaut, 80200 Estrées-Mons, <strong>France</strong><br />
2 INRA-AgroParisTech, UMR 1091 Environnement <strong>et</strong> Grandes Cultures, 78850 Thiverval-Grignon, <strong>France</strong><br />
Correspond<strong>in</strong>g author. E-mail: c.godard@agro-transfert-rt.org<br />
ABSTRACT<br />
To provide accurate agricultural <strong>LCA</strong>, the local production conditions, namely crop management techniques, weather and soil conditions,<br />
need to be taken <strong>in</strong>to account. To develop adapted <strong>in</strong>ventory m<strong>et</strong>hodology, a specific <strong>LCA</strong> study was carried out on a northern<br />
<strong>France</strong> starch potato supply area. It focused on the upstream steps and used specific crop management and logistics data. To improve<br />
<strong>in</strong>ventory m<strong>et</strong>hods, the approach is based on process-based models simulat<strong>in</strong>g soil carbon dynamic and <strong>in</strong>-field pesticide emissions.<br />
The results obta<strong>in</strong>ed for 1 ton of potato showed the <strong>in</strong>fluence of soil carbon dynamic on climate change impact that resulted <strong>in</strong> carbon<br />
release b<strong>et</strong>ween 10% and 18%. This level was mitigated by the soil carbon sequestration effect from the preced<strong>in</strong>g catch crop. The<br />
soil type <strong>in</strong>fluence was limited due to rather homogenous pedoclimatic conditions. Nevertheless, the proposed approach enabled to<br />
account for specific cropp<strong>in</strong>g conditions and was designed to test various production scenarios.<br />
Keywords: starch potato <strong>LCA</strong>, <strong>in</strong>ventory m<strong>et</strong>hods, emission models, soil organic carbon, pesticide emissions<br />
1. Introduction<br />
Starch currently provides basic molecules for many <strong>in</strong>novative <strong>in</strong>dustrial applications, ma<strong>in</strong>ly non-food<br />
processes. Potato is the most common crop that produces starch <strong>in</strong> Northern <strong>France</strong>. To provide <strong>LCA</strong> of<br />
starch derived molecules and products with accurate and consistent data, a focus was made on the upstream<br />
processes, from potato field production to the gate of the starch process<strong>in</strong>g plant. To do so, a specific <strong>LCA</strong><br />
study was carried out on the supply area of a starch production plant located <strong>in</strong> Picardy. We were thus also<br />
able to provide local stakeholders (producers, advisers) with the environmental impacts of their production<br />
cha<strong>in</strong>s. There are currently scant literature references on the <strong>LCA</strong> of potato crops, moreover, most of them<br />
focus on food potato (D'Arcy <strong>et</strong> al., 2010; Williams <strong>et</strong> al., 2010), which <strong>in</strong>volves crop management practices<br />
different from those used for starch potato. Hence, to provide adapted and accurate impact assessment, we<br />
used technical data from starch potato producers and specific logistics cha<strong>in</strong> data. Those data were comb<strong>in</strong>ed<br />
to <strong>in</strong>-field fluxes <strong>in</strong>ventory m<strong>et</strong>hods us<strong>in</strong>g process-based models able to <strong>in</strong>tegrate soil and weather<br />
production conditions, and crop rotation. More precisely, two models were used to assess soil carbon<br />
dynamic and pesticide emissions. The objective of this study was thus i/ to identify the contribution of soil<br />
carbon dynamic <strong>in</strong> the global warm<strong>in</strong>g impact of starch potato upstream production process, and ii/ to focus<br />
on pesticide spray<strong>in</strong>g which is one of the important potential environmental impacts of potato. F<strong>in</strong>ally, we<br />
were also able to partly test the m<strong>et</strong>hodology developed for bioenergy cha<strong>in</strong>s (Godard <strong>et</strong> al., <strong>2012</strong>) on<br />
another application field.<br />
2. M<strong>et</strong>hods<br />
2.1. Studied system and functional unit def<strong>in</strong>ition<br />
The studied area corresponded to the specific supply area of a starch production plant <strong>in</strong> the French<br />
Picardy region. A survey of potato growers showed that the ma<strong>in</strong> crop rotation <strong>in</strong>clud<strong>in</strong>g starch potato <strong>in</strong> this<br />
area was sugar be<strong>et</strong>/w<strong>in</strong>ter wheat/potato/w<strong>in</strong>ter wheat. An <strong>in</strong>termediate crop (white mustard) was sown before<br />
potato plant<strong>in</strong>g. The crop management technique sequence selected was the most common one described<br />
by local technicians and from producer survey (Table 1). The average distance b<strong>et</strong>ween farm and<br />
starch production plant was considered to be 60 km, and a specific logistics cha<strong>in</strong> is d<strong>et</strong>ailed <strong>in</strong> Figure 1.<br />
The studied system entails all the field operations from the <strong>in</strong>termediate crop preced<strong>in</strong>g potato to its harvest<br />
and transport and storage steps before starch production plant gate. All the mach<strong>in</strong>ery, the build<strong>in</strong>gs and<br />
<strong>in</strong>puts necessary to those steps were accounted for: fuel and energy consumption, seeds, field fertilisers and<br />
pesticides, and storage treatment. The functional unit was the production of 1 t of starch potato (with a 22%<br />
dry matter content).<br />
425
PARALLEL SESSION 4C: CROP PRODUCTION SYSTEMS 8 th Int. Conference on <strong>LCA</strong> <strong>in</strong> the<br />
Agri-<strong>Food</strong> Sector, 1-4 Oct <strong>2012</strong><br />
Table 1. Input summary of starch potato and catch crop.<br />
Input (unit) Value<br />
Average annual yield (t fresh matter/ha) 52<br />
Crop management (for 1 year)<br />
Stubble plough<strong>in</strong>g (runs) 1<br />
Harrow<strong>in</strong>g and catch crop seed<strong>in</strong>g (runs) 1<br />
Catch crop crush<strong>in</strong>g (runs) 1<br />
Plough<strong>in</strong>g (runs) 1<br />
Harrow<strong>in</strong>g (runs) 2<br />
Sow<strong>in</strong>g and ridg<strong>in</strong>g up (runs) 1<br />
Haulm crush<strong>in</strong>g (runs) 1<br />
Lift<strong>in</strong>g (runs) 1<br />
Seed<strong>in</strong>g rate (kg/ha) 2100<br />
N fertiliser rate (kg N / ha) 180<br />
K Fertiliser rate (kg K2O /ha) 280<br />
P Fertiliser rate (kg P2O5 /ha) 80<br />
Magnesium fertiliser rate (kg MgO/ha) 30<br />
Pesticide application (kg active <strong>in</strong>gredient/ha) 30.06<br />
Figure 1. Logistics cha<strong>in</strong> of starch potato.<br />
2.2. Inventory m<strong>et</strong>hods<br />
Life cycle <strong>in</strong>ventories needed for the the manufactur<strong>in</strong>g and supply of <strong>in</strong>puts and build<strong>in</strong>gs were extracted<br />
from the Eco<strong>in</strong>vent Database Version 2.2 ( Swiss Center for Life Cycle Inventories, 2010).<br />
In-field emissions of N and P were assessed us<strong>in</strong>g and adapt<strong>in</strong>g several <strong>in</strong>ventory m<strong>et</strong>hods. Direct and <strong>in</strong>direct<br />
N2O emissions were assessed accord<strong>in</strong>g to the IPCC m<strong>et</strong>hod (IPCC, 2006). NH3 emissions to air were<br />
calculated us<strong>in</strong>g emission factors from Institut de l’élevage <strong>et</strong> al., 2010. The emission factor for NOx emissions<br />
was derived from ADEME, 2010. Emissions of NO3 - to water were estimated with a field N-balance<br />
m<strong>et</strong>hod adapted from IFEU, 2000, and which <strong>in</strong>tegrates previous N fluxes (N2O, NH3 and NOx). The N balance<br />
depended on crop rotation and soil type. P emissions <strong>in</strong> water by leach<strong>in</strong>g, run-off and erosion were<br />
estimated accord<strong>in</strong>g to Nemecek and Kägi, 2007. Soil erosion was estimated with the Universal Soil Loss<br />
Equation (Weischmeier and Smith, 1965).<br />
2.3. Modell<strong>in</strong>g approach for soil-carbon dynamic and pesticides emission estimates<br />
To estimate soil C sequestration and pesticide emissions, the AMG (Saffih-Hdadi and Mary, 2008) and<br />
Pest-LCI (Birkved and Hauschild, 2006) models were used, respectively. AMG simulates the dynamics of<br />
humified organic matter, account<strong>in</strong>g for <strong>in</strong>puts from preced<strong>in</strong>g and catch crop residues and their humification<br />
and m<strong>in</strong>eralisation rates. The ma<strong>in</strong> <strong>in</strong>puts of the model are crop rotation and yields, soil management and<br />
properties (texture, organic matter and CaCO3 content), and annual weather conditions. The model runs on a<br />
yearly time-step, and a 20-year series of past weather data (1988-2007) was used to simulate soil carbon<br />
sequestration. The <strong>in</strong>itial Soil Organic Carbon (SOC) content, to which model predictions are very sensitive,<br />
was estimated for the typical starch potato crop-rotation and soil types comb<strong>in</strong>ations d<strong>et</strong>erm<strong>in</strong>ed from measurements<br />
of soil organic matter changes <strong>in</strong> Picardy (Duparque <strong>et</strong> al., 2011). The major soil type <strong>in</strong> the studied<br />
area was a deep clayey loam that was selected for the param<strong>et</strong>erisation of AMG. The effect of soil type on<br />
the variations <strong>in</strong> soil C content over 20 years was also simulated. To do so, the next two soil types <strong>in</strong> terms of<br />
426
PARALLEL SESSION 4C: CROP PRODUCTION SYSTEMS 8 th Int. Conference on <strong>LCA</strong> <strong>in</strong> the<br />
Agri-<strong>Food</strong> Sector, 1-4 Oct <strong>2012</strong><br />
occurrence <strong>in</strong> the studied area (namely a deep loam and a clayey loam over chalk) were also <strong>in</strong>put to the<br />
AMG model.<br />
Pest-LCI simulates the fate of pesticides and their emissions dur<strong>in</strong>g application and after-application,<br />
from soils and crop leaves. It simulates the fate of each fraction of pesticide reach<strong>in</strong>g a compartment of the<br />
simulated system (air, crop, soil surface, water dra<strong>in</strong>age system and groundwater). This model runs on a<br />
monthly time-step. It accounts for soil and climate conditions as well as bio-physico-chemical properties of<br />
the pesticide molecule. To ensure consistent results b<strong>et</strong>ween pesticide emissions and soil C sequestration, the<br />
same past weather data and soil type as for the AMG simulation were used for Pest-LCI.<br />
2.3. Impact assessment m<strong>et</strong>hod<br />
In order to focus on the ma<strong>in</strong> agricultural environmental impacts, five mid-po<strong>in</strong>t impact categories and<br />
correspond<strong>in</strong>g reference substances were selected. Climate change (kg CO2-eq), terrestrial acidification (kg<br />
SO2-eq), freshwater eutrophication (kg P-eq), and mar<strong>in</strong>e eutrophication (kg N-eq) were calculated us<strong>in</strong>g<br />
Recipe m<strong>et</strong>hod, version 1.05 (PRé Consultants, 2008). Ecotoxicity (Comparative Toxic Units – CTU) was<br />
assessed us<strong>in</strong>g USEtox m<strong>et</strong>hod (Henderson <strong>et</strong> al., 2011), and energy consumption (MJ) was calculated accord<strong>in</strong>g<br />
to the Cumulative energy demand m<strong>et</strong>hod, version 1.08. All impact calculations were performed<br />
with SimaPro 7.3.2 software (PRé Consultants, 2011).<br />
3. Results<br />
3.1. Contribution analysis for starch potato<br />
The hot spot for three impact categories out of six (Figure 2), namely climate change (CC), terrestrial<br />
acidification (TA) and mar<strong>in</strong>e eutrophication (ME) was nitrogen fertilisation which actually compounds the<br />
production of fertiliser N and the field emissions. Its share varied from 44% to 70% of the total impacts. The<br />
CC contribution of N-fertilisation ma<strong>in</strong>ly came from <strong>in</strong>direct greenhouse gases (GHG) emissions occurr<strong>in</strong>g<br />
dur<strong>in</strong>g the production step of fertilisers, while for TA, the contribution was mostly due to the NH3 emissions<br />
occurr<strong>in</strong>g after fertiliser application. The N-fertilisation contribution to ME arose from nitrate leach<strong>in</strong>g.<br />
For freshwater eutrophication (FE), the most impact<strong>in</strong>g stage (with 69% of the total impact) was the other<br />
fertilisation step, PK fertilisation, ma<strong>in</strong>ly due to phosphate run-off and leach<strong>in</strong>g after P-fertiliser application.<br />
Ecotoxicity (E) was <strong>in</strong> turn widely dom<strong>in</strong>ated by the contribution of pesticides (<strong>in</strong>clud<strong>in</strong>g both production<br />
step and <strong>in</strong>-field emissions) up to 67%. Contrary to other impact categories, cumulative energy demand<br />
(CED) orig<strong>in</strong>ated from nearly all the life cycle steps with a similar level (b<strong>et</strong>ween 6% to 19%), the transport<br />
phase (to the farm and to the plant) be<strong>in</strong>g the major contributor with 40% of the total impact. This transport<br />
phase often contributes as the second most impact<strong>in</strong>g step to the other impact categories apart from CED.<br />
One of the specific crop management techniques of potato is seed<strong>in</strong>g. This step was the second after Nfertilisation<br />
to ME, ma<strong>in</strong>ly due to the nitrate leach<strong>in</strong>g occurr<strong>in</strong>g after N-fertilisation dur<strong>in</strong>g potato seed production<br />
step.<br />
100%<br />
90%<br />
80%<br />
70%<br />
60%<br />
50%<br />
40%<br />
30%<br />
20%<br />
10%<br />
0%<br />
Climate<br />
change<br />
Terrestrial<br />
acidification<br />
Freshwater<br />
eutrophication<br />
Mar<strong>in</strong>e Cumulative Ecotoxicity<br />
eutrophication energy demand<br />
Transport to the plant<br />
Transport to the farm + storage<br />
Seed<strong>in</strong>g<br />
Harvest<strong>in</strong>g<br />
Pesticides<br />
PK fertilization<br />
Nitrogen fertilization<br />
Tillage<br />
Soil carbon release<br />
427
PARALLEL SESSION 4C: CROP PRODUCTION SYSTEMS 8 th Int. Conference on <strong>LCA</strong> <strong>in</strong> the<br />
Agri-<strong>Food</strong> Sector, 1-4 Oct <strong>2012</strong><br />
Figure 2. Contribution to the impact categories of each life cycle step from field production to starch plant<br />
gate. (CC impact <strong>in</strong>cludes both potato and catch crop effect on the deep clayey loam soil carbon).<br />
3.2. Climate change impact and soil carbon dynamic: <strong>in</strong>fluence of soil type and <strong>in</strong>termediate crop<br />
Soil C dynamics was <strong>in</strong>fluential <strong>in</strong> the CC impact, and enhanced the life-cycle GHG emissions of potato<br />
crops. Without consider<strong>in</strong>g the preced<strong>in</strong>g <strong>in</strong>termediate crop, the latter always resulted <strong>in</strong> a release of soil C,<br />
from about 10% up to about 18% of the total GHG emissions (Table 2). Indeed all the potato haulms were<br />
exported out of field. Nevertheless, it can be noted that the catch crop preced<strong>in</strong>g potato (whose impacts were<br />
allocated to the potato crop) strongly mitigated this release, with a systematic carbon sequestration reach<strong>in</strong>g<br />
about 200kgC/ha/year on all the soil types. Thus the catch crop could even more than offs<strong>et</strong> the soil C release<br />
of potato, and reach<strong>in</strong>g, for example a C sequestration of 81 kgC/ha/year <strong>in</strong> the clayey loam over chalk.<br />
There were few differences across the three ma<strong>in</strong> soil types on the CC impact. For potato crop only, the<br />
effect of the soil type on soil C dynamic was stronger than for the catch crop. Actually, the <strong>in</strong>fluence of soil<br />
type on soil C dynamics was limited because their properties were rather close <strong>in</strong> the AMG param<strong>et</strong>erisation<br />
(texture, organic matter and CaCO3 content).<br />
Table 2. Influence of soil type and catch crop on soil carbon variations expressed per t of potato produced.<br />
(a negative value <strong>in</strong>dicates a soil C release correspond<strong>in</strong>g to a CC impact <strong>in</strong>crease)<br />
Soil type (ordered by<br />
their area share)<br />
Soil carbon dynamic contribution to climate change impact<br />
Without catch crop effect Includ<strong>in</strong>g catch crop effect<br />
kg CO2-eq % kg CO2-eq %<br />
Climate change impact<br />
(kg CO2-eq)<br />
1. deep clayey loam* -16.7 -15.6 -2.6 -2.4 106.7<br />
2. deep loam -19.5 -17.8 -5.6 -5 109.5<br />
3. clayey loam over chalk -9.8<br />
* Refers to the situation represented <strong>in</strong> Fig 2.<br />
-9.8 5.7 5.7 99.8<br />
4. Discussion<br />
4.1 Ma<strong>in</strong> contribut<strong>in</strong>g steps and comparison with other studies<br />
The comparison with Williams’ <strong>et</strong> al., study (2010) was only possible for common <strong>in</strong>dicators, as the characteris<strong>in</strong>g<br />
m<strong>et</strong>hod was not the same as the one we used. The two studies showed the same order of magnitude<br />
for the CED impact (respectively 1.4 MJ/t for Williams <strong>et</strong> al., and 1.13 MJ/t <strong>in</strong> our case). Compared to<br />
the study by Williams <strong>et</strong> al., 2010, the CED proportion due to cool storage of potato is lower <strong>in</strong> our study<br />
(8% for transport+ farm storage here versus 49% for storage only for Williams <strong>et</strong> al.). This difference is certa<strong>in</strong>ly<br />
due to a limited storage for starch potato (40% of the harvested potato), contrary to a systematic one<br />
for food potato. In our study, the harvest step contributes to CED <strong>in</strong> the same order of magnitude as the Williams’<br />
one (7% vs 10%). D’Arcy’s (2010) study showed on the contrary much higher energy consumption<br />
than <strong>in</strong> the present study (4MJ/t vs 1.13 for us). This is probably due the much lower yield they considered<br />
(28.1 t/ha <strong>in</strong> average) than the 52 t/ha we used <strong>in</strong> our case study.<br />
4.2 Soil C dynamics <strong>in</strong>tegration <strong>in</strong> <strong>LCA</strong> and its effect on CC impact<br />
We predicted the contribution of potato crop to soil C variations by simulat<strong>in</strong>g SOC dynamics with the<br />
AMG model. Our approach differs from Nemecek and Kägi, 2007, which is based on the C content of the<br />
biomass exported from the field, consider<strong>in</strong>g it a s<strong>in</strong>k for atmospheric CO2. A widespread, more practical<br />
alternative consists of consider<strong>in</strong>g crops as “climate-neutral”, as Schmidt <strong>et</strong> al., 2004) did <strong>in</strong> their study of<br />
flax production. The latter two approaches actually disregard the effects of crop cultivation on soil C dynamics,<br />
l<strong>et</strong> alone the effects of soil type, crop rotation or climate, which play a major role <strong>in</strong> the GHG balance of<br />
agricultural crops (Ceschia <strong>et</strong> al., 2010). Us<strong>in</strong>g a soil C model such as AMG is a means of overcom<strong>in</strong>g this<br />
limitation and accurately predicts soil C sequestration or release rates. In the present example of starch potato,<br />
these rates may mitigate or, conversely, <strong>in</strong>crease the global warm<strong>in</strong>g impact of crops, depend<strong>in</strong>g on soil<br />
type and climate conditions. This modell<strong>in</strong>g approach was then an alternative to the French reference from<br />
Arrouays <strong>et</strong> al., 2002, who gave a s<strong>in</strong>gle C sequestration rate for several crops. Our estimates of C release of<br />
0.02 Ct/DMt/year was far different from the sequestration of 0.008 Ct/DMt/year given by Arrouays <strong>et</strong> al.,<br />
2002, for French food potato. Their approach was maybe too generic to account for the specificities of starch<br />
potato grow<strong>in</strong>g <strong>in</strong> a particular supply area.<br />
428
PARALLEL SESSION 4C: CROP PRODUCTION SYSTEMS 8 th Int. Conference on <strong>LCA</strong> <strong>in</strong> the<br />
Agri-<strong>Food</strong> Sector, 1-4 Oct <strong>2012</strong><br />
Moreover, the AMG model <strong>in</strong>cludes crop rotations <strong>in</strong> its simulations of mid to long term soil C dynamics,<br />
and <strong>in</strong> the present case, the starch potato crop rotation always sequestrated soil C, despite the potato contribution<br />
as a n<strong>et</strong> C release. This raises the question of the account<strong>in</strong>g of crop rotation and the allocation of<br />
catch crops <strong>in</strong> the soil C sequestration assessment. Indeed, as we showed for starch potato, the allocation of<br />
catch crop to the follow<strong>in</strong>g ma<strong>in</strong> crop can result <strong>in</strong> an opposite effect on soil C dynamics.<br />
Beyond global warm<strong>in</strong>g impact assessment, another reason to use AMG is that SOC is considered a relevant<br />
<strong>in</strong>dicator of soil quality for <strong>LCA</strong> (Brandão <strong>et</strong> al., 2011; Milà i Canals <strong>et</strong> al., 2007a; Milà i Canals <strong>et</strong> al.,<br />
2007b). Thus, account<strong>in</strong>g for soil quality <strong>in</strong> <strong>LCA</strong> could be facilitated by the use of SOC models such as<br />
AMG.<br />
4.3 Modell<strong>in</strong>g approaches <strong>in</strong> agricultural <strong>LCA</strong><br />
This study showed the relevance of us<strong>in</strong>g emission models <strong>in</strong>stead of us<strong>in</strong>g default emission factors <strong>in</strong> the<br />
life-cycle <strong>in</strong>ventory to account for the characteristics of a crop supply area. Indeed this approach makes it<br />
possible to <strong>in</strong>tegrate the diversity of cropp<strong>in</strong>g production systems <strong>in</strong> supply areas <strong>in</strong> agricultural <strong>LCA</strong>s. Model<strong>in</strong>g<br />
approaches have already proven to be able to <strong>in</strong>tegrate various biophysical and technical crop production<br />
conditions <strong>in</strong> agricultural <strong>LCA</strong>, as <strong>in</strong> the studies from Adler <strong>et</strong> al., 2007; Gabrielle and Gagnaire, 2008.<br />
We were able to <strong>in</strong>tegrate the specific characteristics of crop management, logistics and storage <strong>in</strong> a supply<br />
area as well as its pedo-climatic characteristics by the use of the two models AMG and Pest-LCI. Beyond<br />
soil carbon dynamics and pesticides, crop models can provide precise assessments of <strong>in</strong>-field fluxes, and<br />
particularly N-fluxes which are highly dependent on local conditions. Nevertheless their use rema<strong>in</strong>s unusual,<br />
s<strong>in</strong>ce they <strong>in</strong>volve numerous param<strong>et</strong>ers, some which are note easily available. An alternative way to<br />
these crop models are developed balance, such as Sundial used by Williams <strong>et</strong> al., 2010, thus limit<strong>in</strong>g the<br />
param<strong>et</strong>erisation difficulty, and at the same time <strong>in</strong>tegrat<strong>in</strong>g crop rotation, crop management practices and<br />
pedoclimatic conditions <strong>in</strong> <strong>LCA</strong>s.<br />
5. Conclusion<br />
The approach proposed here has already been tested for a different context and for other crops, namely<br />
biomass feedstocks (Godard <strong>et</strong> al., <strong>2012</strong>). It is a promis<strong>in</strong>g way to b<strong>et</strong>ter account for the spatial variation of<br />
crop production conditions <strong>in</strong> agricultural <strong>LCA</strong>, by the <strong>in</strong>tegration of this variability range <strong>in</strong> model param<strong>et</strong>erisation.<br />
This k<strong>in</strong>d of approach is relevant to test new production scenarios, such as the reduction of pesticide<br />
application, or the change <strong>in</strong> a crop supply and production area. It is also a good way to b<strong>et</strong>ter account<br />
for geographical aspects <strong>in</strong> decision mak<strong>in</strong>g, by provid<strong>in</strong>g adapted and accurate <strong>LCA</strong> results to local stakeholders.<br />
6. References<br />
ADEME, 2010. Analyses de Cycle de Vie appliquées aux biocarburants de première génération consommés en <strong>France</strong>. Rapport f<strong>in</strong>al<br />
de l’étude réalisée pour le compte de l’ADEME, du MEEDD <strong>et</strong> du MAAP <strong>et</strong> de <strong>France</strong>AgriMer par Bio Intelligence Service. In<br />
French.<br />
Arrouays, D., Balesdent, J., Germon, J.-C., Jay<strong>et</strong>, P.-A., Soussana, J.-F., Stengel, P., 2002. Mitigation of the greenhouse effect Increas<strong>in</strong>g<br />
carbon stocks <strong>in</strong> French agricultural soils? Scientific Assessment Unit for Expertise, Assessment Report by the French<br />
Institute for Agriculture Research (INRA) on request of the French M<strong>in</strong>istry for Ecology and Susta<strong>in</strong>able Development. Paris.<br />
Birkved, M., Hauschild, M. Z., 2006. PestLCI--A model for estimat<strong>in</strong>g field emissions of pesticides <strong>in</strong> agricultural <strong>LCA</strong>. Ecological<br />
Modell<strong>in</strong>g. 198 (3-4), 433-451.<br />
Brandão, M., Milà i Canals, L., Clift, R., 2011. Soil organic carbon changes <strong>in</strong> the cultivation of energy crops: Implications for GHG<br />
balances and soil quality for use <strong>in</strong> <strong>LCA</strong>. Biomass and Bioenergy. 35 (6), 2323-2336.<br />
Ceschia, E., Béziat, P., Dejoux, J. F., Aub<strong>in</strong><strong>et</strong>, M., Bernhofer, C., Bodson, N., <strong>et</strong> al., 2010. Management effects on n<strong>et</strong> ecosystem<br />
carbon and GHG budg<strong>et</strong>s at European crop sites. Agriculture, Ecosystems & Environment. 139 (3), 363-383.<br />
D'Arcy, A., O'Halloran, J., Sage, C., 2010. An <strong>LCA</strong> of potato production <strong>in</strong> Ireland: impacts on ecology and environment. In: Università<br />
degli studi di Bari Aldo Moro, editor. VII <strong>in</strong>ternational conference on Life Cycle Assessment <strong>in</strong> the agri-food sector. Bari,<br />
Italy.<br />
Duparque, A., Tomis, V., Mary, B., Boizard, H., Damay, N., 2011. Le Bilan Humique AMG, pour une démarche de conseil fondée<br />
sur des cas-types régionaux. In french. 10émes rencontres de la fertilisation raisonnée <strong>et</strong> de l’analyse COMIFER-GEMAS. Reims,<br />
<strong>France</strong>.<br />
Godard, C., Boissy, J., Gabrielle, B., <strong>2012</strong>. Life-cycle assessment of local feedstock supply scenarios to compare candidate biomass<br />
sources. Accepted to Global Change Biology Bioenergy.<br />
Henderson, A., Hauschild, M., van de Meent, D., Huijbregts, M., Larsen, H., Margni, M., <strong>et</strong> al., 2011. USEtox fate and ecotoxicity<br />
factors for comparative assessment of toxic emissions <strong>in</strong> life cycle analysis: sensitivity to key chemical properties. The International<br />
Journal of Life Cycle Assessment. 16 (8), 701-709.<br />
IFEU, 2000. Bioenergy for Europe: Which ones fit best ? A comparative analysis for the Community. Heidelberg: IFEU.<br />
429
PARALLEL SESSION 4C: CROP PRODUCTION SYSTEMS 8 th Int. Conference on <strong>LCA</strong> <strong>in</strong> the<br />
Agri-<strong>Food</strong> Sector, 1-4 Oct <strong>2012</strong><br />
Institut de l’élevage, IFIP, ITAVI, Arvalis Institut du végétal, C<strong>et</strong>iom, ITB, 2010. Guide méthodologique pour l’estimation des impacts<br />
des activités agricoles sur l’eff<strong>et</strong> de serre - GES’TIM. version1.2. In french.<br />
IPCC, 2006. IPCC Guidel<strong>in</strong>es for National Greenhouse Gas Inventories. Agriculture, Forestery and Other Land Use.<br />
Milà i Canals, L., Bauer, C., Depestele, J., Dubreuil, A., Freiermuth Knuchel, R., Gaillard, G., <strong>et</strong> al., 2007a. Key Elements <strong>in</strong> a<br />
Framework for Land Use Impact Assessment With<strong>in</strong> <strong>LCA</strong>. International Journal of Life Cycle Assessment. 12 (1), 5-15.<br />
Milà i Canals, L., Romanyà, J., Cowell, S., 2007b. M<strong>et</strong>hod for assess<strong>in</strong>g impacts on life support functions (LSF) related to the use of<br />
"fertile land" <strong>in</strong> Life Cycle Assessment (<strong>LCA</strong>). Journal of Cleaner Production. 15, 1426-1440.<br />
Nemecek, T., Kägi, T., 2007. Life cycle <strong>in</strong>ventories of Agricultural Production Systems - Data v2.0. EcoInvent report No.15. Zürich<br />
and Dübendorf: Agroscope Reckenholz-Tänikon Research Station ART. pp. 360.<br />
PRé Consultants, 2008. Sima Pro Database Manual, M<strong>et</strong>hods library PRé Consultants.<br />
PRé Consultants, 2011. Sima Pro 7.3.2 software. Amersfoort, The N<strong>et</strong>herlands.<br />
Saffih-Hdadi, K., Mary, B., 2008. Model<strong>in</strong>g consequences of straw residues export on soil organic carbon. Soil Biology and Biochemistry.<br />
40 (3), 594-607.<br />
Schmidt, A., Jensen, A., Clausen, A., Kamstrup, O., Postl<strong>et</strong>hwaite, D., 2004. A comparative Life Cycle assessment of build<strong>in</strong>g <strong>in</strong>sulation<br />
products made of stone wool, paper wool and flax. The International Journal of Life Cycle Assessment. 9 (1), 53-66.<br />
Swiss Center for Life Cycle Inventories, 2010. Eco<strong>in</strong>vent database v2.2. Tänikon, Switzerland.<br />
Weischmeier, W., Smith, D., 1965. Predict<strong>in</strong>g ra<strong>in</strong>fall-erosion losses from cropland east of the Rocky Mounta<strong>in</strong>s: Guide for selection<br />
of practices for soil and water conservation.<br />
Williams, A., Audsley, E., Sandars, D., 2010. Environmental burdens of produc<strong>in</strong>g bread wheat, oilseed rape and potatoes <strong>in</strong> England<br />
and Wales us<strong>in</strong>g simulation and system modell<strong>in</strong>g. The International Journal of Life Cycle Assessment. 15 (8), 855-868.<br />
430
PARALLEL SESSION 5A: FOOD LABELLING 8 th Int. Conference on <strong>LCA</strong> <strong>in</strong> the<br />
Agri-<strong>Food</strong> Sector, 1-4 Oct <strong>2012</strong><br />
Thursday, 4 October<br />
Parallel session 5a: <strong>Food</strong> Labell<strong>in</strong>g<br />
Barilla EPD Process System to <strong>in</strong>crease reliability, comparability and<br />
communicability of <strong>LCA</strong> studies<br />
Luca Ru<strong>in</strong>i 1 , Laura Marchelli 1 , Massimo Mar<strong>in</strong>o 2 , Assunta Filar<strong>et</strong>o 2,*<br />
1 Barilla G. R. Fratelli S.p.A, via Mantova 166, 43122, Parma, Italy<br />
2 Life Cycle Eng<strong>in</strong>eer<strong>in</strong>g, via Livorno 60, 10144, Tor<strong>in</strong>o, Italy<br />
Correspond<strong>in</strong>g author. E-mail: filar<strong>et</strong>o@studiolce.it<br />
ABSTRACT<br />
The aim of this work is to show how a large company <strong>in</strong>tegrates the life cycle approach <strong>in</strong>to its policies and views to reduce the<br />
footpr<strong>in</strong>t us<strong>in</strong>g reliable data suitable also for communication purposes. Dur<strong>in</strong>g 2010 an <strong>in</strong>ternal <strong>LCA</strong> process was implemented and<br />
<strong>in</strong> February 2011 certified, be<strong>in</strong>g the first private company, <strong>in</strong> compliance with the Process Certification Clarifications guidel<strong>in</strong>es for<br />
International EPD ® System to perform environmental impact calculation <strong>in</strong> an easy, quick and reliable way and to provide certified<br />
and published results. Barilla’s EPD <strong>in</strong>ternal process is based on three ma<strong>in</strong> elements: the <strong>LCA</strong> database, the Product System and the<br />
Product Specific data. They are used tog<strong>et</strong>her as a funnel process: data from the database and from product specific <strong>in</strong>formation are<br />
processes by the product system tool to have the specific <strong>LCA</strong> data she<strong>et</strong> results, used for a type III label (EPD – Environmental<br />
Product Declaration) preparation. The reliability of the system is guaranteed by both <strong>in</strong>ternal and external verification.<br />
Keywords: Product Category Rules, Environmental Product Declaration, EPD Process System, <strong>LCA</strong> for food, verified database<br />
1. Introduction<br />
Barilla, one of the top Italian food groups, produces more than 100 products <strong>in</strong> about 50 plants around the<br />
world. The company has been us<strong>in</strong>g the <strong>LCA</strong> for more than a decade. S<strong>in</strong>ce 2008, life cycle th<strong>in</strong>k<strong>in</strong>g made<br />
its way <strong>in</strong>to company strategy, as an <strong>in</strong>strument to thoroughly study the production cha<strong>in</strong> and localise the<br />
most substantial environmental impacts.<br />
Barilla decides to jo<strong>in</strong> the International EPD System for several reasons: the System acts follow<strong>in</strong>g the International<br />
Standards (ISO 14025); the reliability of the <strong>LCA</strong> is assured by the Product Category Rules<br />
(PCR); the System allows the comparability among the same product group, each document with a public<br />
<strong>in</strong>terest (such as Product Category Rules (PCR) and General Program Instruction (GPI)) is published; public<br />
register on PCR and EPD is regularly updated; EPDs and <strong>LCA</strong>s must cover all the environmental issues not<br />
merely focus<strong>in</strong>g on greenhouse gases emissions; the System gives the possibility to develop an EPD Process<br />
Certification.<br />
Barilla’s aim is to develop the EPDs for the major part of its product and the only way to make it <strong>in</strong> an<br />
easy, simple and reliable manner is to use an EPD Process System; for this reason, dur<strong>in</strong>g 2010, it was developed<br />
and certified by Bureau Veritas <strong>in</strong> 2011.<br />
The scope of the Process System is to prepare, verify and publish EPDs for Barilla’s products related to<br />
the follow<strong>in</strong>g Product Category Rules:<br />
• Product Category Rules 2010:01 (CPC 2371): Uncooked pasta, not stuffed or otherwise prepared<br />
• Product Category Rules <strong>2012</strong>:06 (CPC 234): Bakery Products<br />
• Product Category Rules 2010:09 (CPC 23995): sauces; mixed condiments; mustard flour and meal;<br />
prepared mustard<br />
2. General Structure of the Barilla EPD Process<br />
All EPDs com<strong>in</strong>g from the Barilla’s EPD Process System are based on the Life Cycle Assessment m<strong>et</strong>hodology;<br />
us<strong>in</strong>g the follow<strong>in</strong>g three ma<strong>in</strong> elements:<br />
1. The Product Specific data<br />
2. The <strong>LCA</strong> dBase<br />
3. The Product System<br />
The system works like a “funnel process”, as showed <strong>in</strong> Figure 1. product specific <strong>in</strong>formation are collected<br />
and elaborated by the product system us<strong>in</strong>g the <strong>LCA</strong> dBase, then results are collected <strong>in</strong> a specific<br />
<strong>LCA</strong> data she<strong>et</strong>, that is then used for the preparation of the EPD.<br />
431
PARALLEL SESSION 5A: FOOD LABELLING 8 th Int. Conference on <strong>LCA</strong> <strong>in</strong> the<br />
Agri-<strong>Food</strong> Sector, 1-4 Oct <strong>2012</strong><br />
Figure 1. Scheme of the Barilla EPD Process System (“funnel process”)<br />
2.1. Product specific data<br />
Product specific data represent all the specific <strong>in</strong>formation related to the product that has to be analysed,<br />
they have to be collected for each EPD and <strong>in</strong>clude the follow<strong>in</strong>g specific <strong>in</strong>formation:<br />
Product recipe: <strong>in</strong>cludes the amount of food raw materials per unit of product (e.g. kg of sugar or<br />
veg<strong>et</strong>able oil or flour <strong>et</strong>c per kg of product)<br />
Bill of materials packag<strong>in</strong>g list: that <strong>in</strong>cludes the amount of packag<strong>in</strong>g materials used for product<br />
packag<strong>in</strong>g<br />
Production plants where the product is manufactur<strong>in</strong>g<br />
Production volume per each plant <strong>in</strong>volved<br />
F<strong>in</strong>ished product logistic distribution data (kilom<strong>et</strong>ers covered and transport means)<br />
Other relevant environmental aspects, such as liquid nitrogen and carbon dioxide consumption<br />
used for product cool<strong>in</strong>g<br />
Figure 2 provides an example of product system calculation with the relationship b<strong>et</strong>ween product specific<br />
data and <strong>LCA</strong> dBase.<br />
2.2. <strong>LCA</strong> dBase<br />
The database is organised among different data modules groups:<br />
Raw materials: <strong>in</strong>cludes <strong>in</strong>formation about materials used for food product recipe (e.g. durum<br />
wheat cultivation for semol<strong>in</strong>a production)<br />
Packag<strong>in</strong>g raw materials (e.g. cardboard manufactur<strong>in</strong>g for American box production);<br />
Energy: <strong>in</strong>cludes data about the energy mixes used <strong>in</strong> the countries <strong>in</strong> which the Barilla’s plants<br />
are located. The database is updated every time new <strong>in</strong>formation is available;<br />
Plants: conta<strong>in</strong>s <strong>in</strong>formation about the processes that take place <strong>in</strong> the Barilla’s plants. These data<br />
are based on the data collection and they are updated every year.<br />
Transports: data on the ma<strong>in</strong> means of transport used for the Barilla’s purposes<br />
Each data module conta<strong>in</strong>s all the environmental aspects related to material or process, ma<strong>in</strong> hypothesis<br />
applied, as requested by the ISO 14040 series (functional unit, system boundaries, data quality, data collection<br />
and treatment, allocation and cut-off rules).<br />
All data modules are <strong>in</strong>ternally verified and are ready to be used for EPD purposes, they are <strong>in</strong>serted <strong>in</strong><br />
software SimaPro®, that was selected as the modell<strong>in</strong>g and calculation tool for the Barilla EPD system process.<br />
432
PARALLEL SESSION 5A: FOOD LABELLING 8 th Int. Conference on <strong>LCA</strong> <strong>in</strong> the<br />
Agri-<strong>Food</strong> Sector, 1-4 Oct <strong>2012</strong><br />
2.3. The Product System<br />
The Product System represents the product group model calculation tool. It is developed for each product<br />
group <strong>in</strong> a specific fashion follow<strong>in</strong>g the Product Category Rule (PCR) and is <strong>in</strong>ternally v<strong>et</strong>ted.<br />
Barilla’s EPD Process System <strong>in</strong>cludes Product Systems for pasta, bakery and sauces products. An example<br />
of product system for bakery product is reported <strong>in</strong> Fig. 2.<br />
Figure 2. Example of product system for bakery products<br />
2.4. Verification levels<br />
The reliability of the EPDs is ensured by several verification levels done by Data Assessor, Process Assessor<br />
and Verification Body:<br />
1. Product System and <strong>LCA</strong> Database verification is performed by the Data Assessor;<br />
2. Product specific data, <strong>LCA</strong> data she<strong>et</strong> and EPD Document verification is performed by the Data<br />
Assessor per each EPD realised<br />
3. EPD Process verification by means of:<br />
<strong>in</strong>ternal audit, performed by the Process Assessor<br />
external audit, performed by a Verification Body (accredited body certified for audit of<br />
management systems)<br />
3. Process Operations<br />
Barilla EPD Process System is organised <strong>in</strong> three ma<strong>in</strong> processes, under the control of the management<br />
activities: EPD project, database update and product system update.<br />
The management activities take <strong>in</strong>to consideration all the actions that are necessary for activities coord<strong>in</strong>ation<br />
and organisation, such as EPDs plann<strong>in</strong>g, comp<strong>et</strong>ences evaluations, process assessment plann<strong>in</strong>g, non<br />
conformity management and system documentation updat<strong>in</strong>g. An overview of the processes is given <strong>in</strong> Fig.<br />
3.<br />
The first activity of the system is the EPD plann<strong>in</strong>g, it is performed each year to organize all the works related<br />
to the EPD Process System. To reliably plan the EPD projects, the collection of all the product recipe is<br />
necessary to identify raw material still not covered by an update data module.<br />
433
PARALLEL SESSION 5A: FOOD LABELLING 8 th Int. Conference on <strong>LCA</strong> <strong>in</strong> the<br />
Agri-<strong>Food</strong> Sector, 1-4 Oct <strong>2012</strong><br />
Figure 3. Overview of the process operations<br />
The ma<strong>in</strong> process of the system is the EPD Project, which leads to the verification and publication of the<br />
EPD document, start<strong>in</strong>g from the Product data collection and pass<strong>in</strong>g through data check and elaboration and<br />
EPD verification.<br />
Database update is performed each time data must be updated (e.g. for energy mix) and at least once a<br />
year. In addition, data is updated dur<strong>in</strong>g the data check of the EPD Project when data is unavailable for the<br />
model. This puts the EPD project process <strong>in</strong> standby and the database update process starts. The EPD Project<br />
process resumes only when all data necessary for the EPD preparation is available and validated.<br />
The product system update process allows to update the product system model when there is a change to<br />
its product category rules and compiles a new product system when a new product must be analysed and<br />
<strong>in</strong>serted <strong>in</strong>to the system.<br />
4. Process Indicators<br />
The Barilla EPD process performances are evaluated by mean of specific <strong>in</strong>dicators (Table 1).<br />
Table 1. Overview of the <strong>in</strong>dicators used for measur<strong>in</strong>g the EPD Process performances<br />
Indicators Unit Description<br />
Product volume covered by EPDs % Percentage of product volume covered by EPDs<br />
Planned projects n° Number of the EPD projects planned each year (one EPD project may<br />
have one or more products)<br />
Open Projects n° Number of the EPD projects that are still open <strong>in</strong> a specific moment<br />
Frozen Projects n° Number of the EPD projects that are stopped because a database/data<br />
system update is runn<strong>in</strong>g<br />
Validated EPD n° Number of validated EPD (not all of them are published)<br />
Published EPD n° Number of published EPDs available<br />
Product System n° Number of product system available for all the Barilla products<br />
Product System validated % Percentage of total product system validated and available for EPD realization<br />
Product Volume covered by Product % Percentage of product volume covered by Product System<br />
System<br />
Total module n° Total amount of the data modules that are needed for compl<strong>et</strong><strong>in</strong>g the EPD<br />
activities <strong>in</strong>cluded <strong>in</strong> the runn<strong>in</strong>g project.<br />
Available data module % Percentage of the total data module available for EPD realization. It represents<br />
how much the data collection performance is compl<strong>et</strong>ed.<br />
Validated data module % Percentage of the total data module that are validated and ready for the<br />
EPD calculation. It represents the measure on how much the database is<br />
compl<strong>et</strong>ed with validated <strong>in</strong>formation.<br />
5. Actors and roles<br />
EPD Process management is guaranteed by the mutual works of different actors: EPD process owner,<br />
<strong>LCA</strong> developer, data owners, data expert. All roles are described below:<br />
EPD Process owner: is the EPD system process responsible who has decision-mak<strong>in</strong>g power and<br />
represents Top management for the EPD purposes; def<strong>in</strong>es the policy and approves all documents<br />
and decisions related to EPD issues, avails himself of an EPD Process Manager;<br />
434
PARALLEL SESSION 5A: FOOD LABELLING 8 th Int. Conference on <strong>LCA</strong> <strong>in</strong> the<br />
Agri-<strong>Food</strong> Sector, 1-4 Oct <strong>2012</strong><br />
<strong>LCA</strong> developer: is supported by an <strong>LCA</strong> team, that manages all the activities necessary for the<br />
EPD document preparation, data modules and product system development and update;<br />
Data owners are <strong>in</strong> charge of provid<strong>in</strong>g data and <strong>in</strong>formation needed for <strong>LCA</strong> calculations. They<br />
usually have precise functions and are responsible for specific areas (e.g. packag<strong>in</strong>g production,<br />
production process, product transport, <strong>et</strong>c). They are identified and <strong>in</strong>volved <strong>in</strong> data collection accord<strong>in</strong>g<br />
to the annual EPD work plan and they have to know the procedure for the data collection;<br />
Data expert represents personnel that could assist both specific data verification (peer review)<br />
dur<strong>in</strong>g <strong>LCA</strong> calculation and EPD preparation. A data expert may be identified dur<strong>in</strong>g the management<br />
review to support data collection and verification dur<strong>in</strong>g <strong>LCA</strong> calculation. A data expert<br />
may be sought for strategic and relevant <strong>in</strong>formation such as wheat cultivation, palm oil production,<br />
<strong>et</strong>c. This figure can either be an <strong>in</strong>ternal or external resource;<br />
System reliability is guaranteed by several verifiers (data assessor, process assessor and verification<br />
body), their roles are described below:<br />
Data assessor: is personnel responsible for the verification of the <strong>LCA</strong> calculation and of the EPD<br />
document. The data assessor conducts <strong>in</strong>ternal assessments at planned <strong>in</strong>tervals to d<strong>et</strong>erm<strong>in</strong>e the<br />
reliability, relevance and <strong>in</strong>dependence of the EPD;<br />
Process assessor: is an <strong>in</strong>ternal verifier that regularly assesses the conformity of the EPD process.<br />
The process assessor is the <strong>in</strong>ternal verifier that has the responsibility to perform periodic audits<br />
on system application;<br />
Verification Body: represents an accredited body certified for audit of management systems that<br />
verifies the entire EPD process system.<br />
Each actor <strong>in</strong> the process has qualified and formalised comp<strong>et</strong>ences.<br />
6. Results and Conclusion<br />
Barilla is the first private company that has developed an EPD Process System.<br />
About the 46% of the products put on the mark<strong>et</strong> by Barilla dur<strong>in</strong>g year 2011 are covered by an Environmental<br />
Product Declaration (EPD). At 30 th April <strong>2012</strong>, fifteen EPDs were published on the website<br />
(http://www.environdec.com/en/EPD-Search/?query=barilla) and about six hundreds data modules were<br />
realised; the available data modules are over the 90% and validated data modules among the available ones<br />
are over the 75%. The use of the Barilla EPD Process System has shortened EPD publication tim<strong>in</strong>g, that<br />
now lasts about 6-10 weeks.<br />
Table 2. Performance of the EPD Process System<br />
Indicators Unit Data<br />
Product volume covered by EPDs (year 2011) % 46%<br />
Planned projects (year <strong>2012</strong>) n° 39<br />
Open Projects (po<strong>in</strong>t at 30/04/<strong>2012</strong>) n° 13<br />
Frozen Projects (po<strong>in</strong>t at 30/04/<strong>2012</strong>) n° 0<br />
Validated EPD (po<strong>in</strong>t at 30/04/<strong>2012</strong>) n° 18<br />
Published EPD (po<strong>in</strong>t at 30/04/<strong>2012</strong>) n° 15<br />
Product System (po<strong>in</strong>t at 30/04/<strong>2012</strong>) n° 6<br />
Product System validated (po<strong>in</strong>t at 30/04/<strong>2012</strong>) % 67%<br />
Product Volume covered by Product System (year 2011) % 99,7%<br />
Total module (po<strong>in</strong>t at 30/04/<strong>2012</strong>) n° 610<br />
Available data module (po<strong>in</strong>t at 30/04/<strong>2012</strong>) % 97<br />
Validated data module (po<strong>in</strong>t at 30/04/<strong>2012</strong>) % 79<br />
Table 2 shows the Barilla EPD Process System performances through the system <strong>in</strong>dicators, from 2010 to<br />
April <strong>2012</strong>. Look<strong>in</strong>g at the table, it is important to po<strong>in</strong>t out that:<br />
There are 39 EPD projects planned for <strong>2012</strong>; 13 of these conta<strong>in</strong> more than one product to be<br />
analysed because there are several recipe variants for some products;<br />
There are no frozen projects because there were no problems with data availability;<br />
There is a higher number of validated EPDs respect to published EPD because it was decided to<br />
not publish three of the validated EPDs;<br />
From 2010 to April <strong>2012</strong> forty verifications were performed: four external verifications made by Bureau<br />
Veritas, and the others made by data and process assessors for <strong>in</strong>ternal verifications.<br />
435
PARALLEL SESSION 5A: FOOD LABELLING 8 th Int. Conference on <strong>LCA</strong> <strong>in</strong> the<br />
Agri-<strong>Food</strong> Sector, 1-4 Oct <strong>2012</strong><br />
7. References<br />
ISO 14040 - Environmental management, Life cycle assessment, Pr<strong>in</strong>ciples and framework<br />
ISO 14044 - Environmental management, Life cycle assessment, Requirements and guidel<strong>in</strong>es<br />
ISO 14025 - Environmental labels and declarations - Type III environmental declarations - Pr<strong>in</strong>ciples and procedures<br />
International EPD Cooperation; <strong>in</strong>troduction, <strong>in</strong>tended uses and key programme elements; version 1 of 29/02/2008<br />
International EPD Cooperation; General Programme Instructions for Environmental Product Declaration; version 1 of 29/02/2008<br />
International EPD Cooperation; Support<strong>in</strong>g annexes for Environmental Product Declaration; version 1 of 29/02/2008<br />
International EPD Cooperation; Process Certification Clarification (PCC) for the International EPD System; Guidel<strong>in</strong>es; ver. 1.0 of<br />
23/04/2010<br />
International EPD Cooperation; Process certification clarification for the International EPD® system. Version 1.0 of 23/04/2010<br />
International EPD Cooperation ; PCR 2010:01; CPC 2371: Uncooked pasta, not stuffed or otherwise prepared; version 1.1 of<br />
18/06/2010<br />
International EPD Cooperation; PCR <strong>2012</strong>:06; CPC 234: Bakery Products; version 1.0 of 17/04/<strong>2012</strong><br />
International EPD Cooperation ; PCR 2010:09; CPC 23995: Sauces; mixed condiments; mustard flour and meal; prepared mustard;<br />
version 1.1 of 9/11/2010<br />
www.environdec.com.<br />
436
PARALLEL SESSION 5A: FOOD LABELLING 8 th Int. Conference on <strong>LCA</strong> <strong>in</strong> the<br />
Agri-<strong>Food</strong> Sector, 1-4 Oct <strong>2012</strong><br />
<strong>LCA</strong>-based hotspot analysis of food products to <strong>in</strong>form a major<br />
Chilean r<strong>et</strong>ailer’s susta<strong>in</strong>ability strategy<br />
Jonas Bengtsson, 1 Cristián Emhart, 2 Alejandro Florenzano, 2* Laura Guccione, 1 Carol<strong>in</strong>a Jaramillo 2<br />
1 Edge Environment Pty Ltd, 501/39 East Esplanade, Manly NSW 2095, Australia<br />
2 Fundación Chile, Av. Parque Antonio Rabat Sur N°6165, Vitacura, Santiago, Chile<br />
* Correspond<strong>in</strong>g author. E-mail: aflorenzano@fundacionchile.cl<br />
ABSTRACT<br />
This paper reports on a project with a major Chilean r<strong>et</strong>ailer to: engage their merchants and suppliers to focus efforts on sciencebased<br />
hotspots; provide a start<strong>in</strong>g po<strong>in</strong>t for <strong>in</strong>dustry engagement to beg<strong>in</strong> implementation of management practices based on life<br />
cycle <strong>in</strong>formation; and develop a nationally relevant product category specific measurement and report<strong>in</strong>g system. Product category<br />
life cycle assessments (PC<strong>LCA</strong>s) have been carried forward for n<strong>in</strong>e food products – milk, chicken meat, blueberries, apples, grapes,<br />
avocados, w<strong>in</strong>e, beer and pasta – us<strong>in</strong>g a commonly def<strong>in</strong>ed m<strong>et</strong>hodology. This <strong>in</strong>cludes normalisation and weight<strong>in</strong>g factors specific<br />
to Chile, result<strong>in</strong>g <strong>in</strong> a weighted environmental impact score called the Daily Eco-Impact Indicator.<br />
Keywords: life cycle assessment, PC<strong>LCA</strong>, food, Chile, r<strong>et</strong>ail, hotspot.<br />
1. Background, aim and scope<br />
<strong>Food</strong> production poses a major global susta<strong>in</strong>ability challenge for the 21 st century. R<strong>et</strong>ailers hold a key<br />
position <strong>in</strong> the food supply cha<strong>in</strong> to promote and enable sourc<strong>in</strong>g and sale of more susta<strong>in</strong>able food products.<br />
This should be done by identify<strong>in</strong>g and work<strong>in</strong>g towards reduc<strong>in</strong>g environmental impacts overall, not merely<br />
transferr<strong>in</strong>g impacts across media or stages of the product life cycle, but consider<strong>in</strong>g the whole product life<br />
cycle <strong>in</strong> improvement efforts.<br />
This paper present<strong>in</strong>g the results of product category life cycle assessments (PC<strong>LCA</strong>s) produced by Edge<br />
Environment and Fundación Chile for a major Chilean r<strong>et</strong>ailer aim<strong>in</strong>g to:<br />
• Engage their merchants and suppliers to focus efforts on science-based hotspots.<br />
• Provide a start<strong>in</strong>g po<strong>in</strong>t for <strong>in</strong>dustry engagement to beg<strong>in</strong> implementation of management practices<br />
based on life cycle <strong>in</strong>formation.<br />
• Develop a product category specific measurement and report<strong>in</strong>g system.<br />
To this end, PC<strong>LCA</strong>s have been carried forward to identify overall environmental hotspots of impacts and<br />
improvement opportunities for n<strong>in</strong>e food products: milk, chicken meat, blueberries, apples, grapes, avocados,<br />
w<strong>in</strong>e, beer and pasta. The physical scope of the studies is cradle-to-grave <strong>in</strong>clud<strong>in</strong>g raw material, production,<br />
distribution and storage, r<strong>et</strong>ail, consumer transport, consumption and disposal. The models have been built<br />
based on national and <strong>in</strong>ternational studies, typical agricultural practices, and modelled us<strong>in</strong>g background<br />
<strong>in</strong>formation derived from <strong>in</strong>ternational databases, adapted to Chilean conditions (e.g. electricity mix,<br />
recycl<strong>in</strong>g rates, transport distances).<br />
Go<strong>in</strong>g forward, the studies and results reported <strong>in</strong> this paper are <strong>in</strong>tended to be submitted for public<br />
comment, and the <strong>in</strong>ternationally sourced life cycle data to be improved with Chilean specific production<br />
data.<br />
2. M<strong>et</strong>hods<br />
The studies were conducted to allow for the transparent and consistent product comparison by use of a<br />
common <strong>LCA</strong> m<strong>et</strong>hodology (ISO 14040 and 14044 compliant) aligned with the ongo<strong>in</strong>g developments of<br />
The Susta<strong>in</strong>ability Consortium (TSC) and the level play<strong>in</strong>g field <strong>LCA</strong> m<strong>et</strong>hodology developed through the<br />
Australian Build<strong>in</strong>g Product Life Cycle Inventory project (BPIC, 2010) and AusLCI (2009). The modell<strong>in</strong>g<br />
was performed with the SimaPro software package version 7.3.<br />
2.1. Life cycle <strong>in</strong>ventory data and functional unit<br />
The cradle-to-grave models have been built based on published studies, typical agricultural practices and<br />
background <strong>in</strong>formation derived from <strong>in</strong>ternational databases, adapted to Chilean conditions (e.g. electricity<br />
mix, recycl<strong>in</strong>g rates, transport distances).<br />
The functional units used for this paper are based on a typical serv<strong>in</strong>g size (USDA) <strong>in</strong> order to allow the<br />
results to be presented on a similar scale. The functional units, ma<strong>in</strong> scenarios and key data sources are<br />
presented <strong>in</strong> Table 1. The ma<strong>in</strong> source of background life cycle <strong>in</strong>ventory (LCI) data used with<strong>in</strong> this study is<br />
a modified version of the Eco<strong>in</strong>vent database version 2.2. The modification <strong>in</strong>volves:<br />
437
PARALLEL SESSION 5A: FOOD LABELLING 8 th Int. Conference on <strong>LCA</strong> <strong>in</strong> the<br />
Agri-<strong>Food</strong> Sector, 1-4 Oct <strong>2012</strong><br />
438<br />
• Apply<strong>in</strong>g Chilean electrical conditions to the Eco<strong>in</strong>vent database. All 3,952 unit processes conta<strong>in</strong>ed <strong>in</strong><br />
the Eco<strong>in</strong>vent 2.2 datas<strong>et</strong> us<strong>in</strong>g electricity production/distribution from <strong>in</strong>ternational regions were rerouted<br />
to the Central Interconnected System (SIC, Sistema Interconectado Central) electricity production<br />
and distribution (SIC serves the central part of the country, <strong>in</strong>clud<strong>in</strong>g Santiago).<br />
• Apply<strong>in</strong>g a consistent economic allocation b<strong>et</strong>ween products and co-products on major production <strong>in</strong>put<br />
<strong>in</strong>to the life cycles, primarily packag<strong>in</strong>g materials for this study.<br />
Table 1. Functional units and key data sources<br />
Product Serv<strong>in</strong>g quantity Scenarios highlighted Key data sources<br />
Milk<br />
(functional unit)<br />
1 cup (200 ml) Cattle feed production Frankl<strong>in</strong> Associates (2006); Fundación Chile (2007); and Hospido <strong>et</strong> al.,<br />
(2003)<br />
Chicken meat ½ breast fill<strong>et</strong> (145 g) Conventional and organic Ahlmén <strong>et</strong> al., (2001); Boggia <strong>et</strong> al., (2010); <strong>LCA</strong> <strong>Food</strong> (2003); Pell<strong>et</strong>ier<br />
(2008); RIRDC (2011); Ritz <strong>et</strong> al., (2004); and Williams <strong>et</strong> al., (2006)<br />
Blueberry<br />
Apple<br />
Grape<br />
1 cup (146 g)<br />
1 fruit (182 g)<br />
1 cup (92 g)<br />
Transport to mark<strong>et</strong><br />
Transport to mark<strong>et</strong><br />
Packag<strong>in</strong>g<br />
INIA & Deuman (2010); Mila i Canals (2003); growers’ manuals and best<br />
management practices<br />
Avocado ½ fruit (100 g) Transport to mark<strong>et</strong><br />
W<strong>in</strong>e 1 glass (175 ml) Packag<strong>in</strong>g Bosco <strong>et</strong> al., (2011); Gazulla <strong>et</strong> al., (2009); and WRAP (2007)<br />
Beer 1 can (330 ml) Packag<strong>in</strong>g Cordella <strong>et</strong> al., (2008); International EPD Consortium (2010); and Talve<br />
(2001)<br />
Pasta 1 portion (57 g) Wheat transport Barilla & Life Cycle Eng<strong>in</strong>eer<strong>in</strong>g (2009); Bevilacqua <strong>et</strong> al., (2007); and<br />
Ru<strong>in</strong>i & Mar<strong>in</strong>o (2008)<br />
2.2. Allocation<br />
The approach selected for this m<strong>et</strong>hodology is based on the use of economic allocation, which is one of<br />
the options <strong>in</strong>cluded <strong>in</strong> the ISO 14044 standard for <strong>LCA</strong> when allocation cannot be avoided.<br />
The justification for consistently apply economic allocation is that the process exists <strong>in</strong> the first place because<br />
of capital <strong>in</strong>vestment and the <strong>in</strong>vestors’ anticipation of r<strong>et</strong>urns on that <strong>in</strong>vestment from the sales of the<br />
products/services that arise from the process(es). The operation of the process(es) is optimised to deliver<br />
economic r<strong>et</strong>urn, and hence there is a clear cause (<strong>in</strong>vestment) to effect (economic r<strong>et</strong>urn) from the value of<br />
the products that arise from the process(es). The extent to which each product or service contributes to the<br />
economic r<strong>et</strong>urn from the operation of the process(es) is therefore the most appropriate unit that can be used<br />
for consistent allocation across the scope of products/services.<br />
Other key reasons for select<strong>in</strong>g economic allocation are that it is the only means of allocation which can<br />
be applied consistently across all product sectors up and down the supply cha<strong>in</strong>. It is also Edge Environment’s<br />
experience that bus<strong>in</strong>ess and <strong>in</strong>dustry can easily and <strong>in</strong>tuitively relate to us<strong>in</strong>g economic value as the<br />
key d<strong>et</strong>erm<strong>in</strong>ant of assign<strong>in</strong>g proportional impact burden b<strong>et</strong>ween products and co-products.<br />
2.3. Impact Assessment<br />
The impact assessment m<strong>et</strong>hod used was the ReCiPe World Midpo<strong>in</strong>t H (Goedkoop <strong>et</strong> al., 2009) with<br />
USEtox Recommended characterisation factors for human and eco-toxicity. The m<strong>et</strong>hod was selected and<br />
customised based on the Susta<strong>in</strong>ability Consortium’s impact assessment bookshelf recommendations (version<br />
2). Normalisation factors were calculated based on Chilean pollution and resource reports and statistics.<br />
Weight<strong>in</strong>g factors were derived from a sample of public op<strong>in</strong>ion and published op<strong>in</strong>ion surveys. The<br />
weighted environmental impact score, which has been called the Daily Eco-Impact Indicator, is calculated so<br />
that a score of 100 corresponds to the average Chilean citizen’s overall daily impact on the environment.<br />
For normalisation Chilean factors were calculated based on national statistics, complemented with ReCiPe<br />
global factors if these factors are not available, to calculate the relative magnitude of each impact type.<br />
At this time there is only a prelim<strong>in</strong>ary <strong>in</strong>dication of the relative importance of the mid-po<strong>in</strong>t <strong>in</strong>dicators<br />
above based on three pilot workshops held <strong>in</strong> Santiago <strong>in</strong> September 2011. The normalised mid-po<strong>in</strong>t impacts<br />
have been aggregated assum<strong>in</strong>g equal weight<strong>in</strong>g with<strong>in</strong> each weight<strong>in</strong>g category (based on environmental<br />
issues used <strong>in</strong> Goedkoop <strong>et</strong> al., (2009)), as listed <strong>in</strong> Table 2.
PARALLEL SESSION 5A: FOOD LABELLING 8 th Int. Conference on <strong>LCA</strong> <strong>in</strong> the<br />
Agri-<strong>Food</strong> Sector, 1-4 Oct <strong>2012</strong><br />
Table 2: Weight<strong>in</strong>g and normalisation factors and categories<br />
Weight<strong>in</strong>g Weight<strong>in</strong>g category/Environmental issues Mid-po<strong>in</strong>t impact category Normalisation (per day)<br />
16.8% Water depl<strong>et</strong>ion Water depl<strong>et</strong>ion 6,030 L<br />
15.5% Climate change Climate change 15.1 kg CO2 eq<br />
9.7% Human health due to PM10 and ozone Photochemical oxidant formation 0.130 kg NMVOC<br />
Particulate matter formation 0.066 kg PM10 eq<br />
9.7% Toxicity Ecotoxicity 12.1 CTUe<br />
Human toxicity, cancer 1.17E-09 CTUh<br />
Human toxicity, non-cancer 1.29E-08 CTUh<br />
9.6% Impacts of land use Agricultural land occupation 56.9 m2a<br />
Urban land occupation 1.55 m2a<br />
Natural land transformation 0.00978 m2a<br />
7.8% Ozone depl<strong>et</strong>ion Ozone depl<strong>et</strong>ion 3.48E-06 kg CFC-11 eq<br />
7.0% Ionis<strong>in</strong>g radiation Ionis<strong>in</strong>g radiation 17.1 kg U235 eq<br />
6.7% M<strong>in</strong>eral resource depl<strong>et</strong>ion M<strong>et</strong>al depl<strong>et</strong>ion 1.29 kg Fe eq<br />
6.3% Fossil fuel depl<strong>et</strong>ion Fossil depl<strong>et</strong>ion 3.54 kg oil eq<br />
5.5% Acidification Terrestrial acidification 0.177 kg SO2 eq<br />
5.4% Eutrophication Freshwater eutrophication 0.00218 kg P eq<br />
Mar<strong>in</strong>e eutrophication 0.0411 kg N eq<br />
3. Results<br />
The results reported <strong>in</strong> this paper are based on best available data from a range of <strong>LCA</strong> and <strong>in</strong>dustry<br />
sources, compiled to a common m<strong>et</strong>hodology which <strong>in</strong>cludes reasonable adaptation to Chilean conditions.<br />
The underp<strong>in</strong>n<strong>in</strong>g PC<strong>LCA</strong> studies are <strong>in</strong>tended to be submitted for public comment, and the <strong>in</strong>ternationally<br />
sourced life cycle data to be further improved with Chilean specific production data.<br />
The results for the n<strong>in</strong>e product categories, with two scenarios for each category, are expressed <strong>in</strong> the<br />
Daily Eco-Impact Indicator per impact category and life cycle stage. These results are not <strong>in</strong>tended to be<br />
used for product differentiation <strong>in</strong> terms of environmental preference; the purpose is to illustrate how d<strong>et</strong>ailed<br />
results can be expressed us<strong>in</strong>g an equal s<strong>in</strong>gle score m<strong>et</strong>ric.<br />
3.1 Results by Impact Category<br />
Figure 8: Impacts per weighted environmental impact category<br />
Fig. 1 shows the results per weighted environmental impact category. The results confirm the common<br />
perception that greenhouse gas emissions, fossil fuel and water depl<strong>et</strong>ion are three key environmental concerns<br />
<strong>in</strong> the food life cycle. Across all product categories and scenarios:<br />
• Climate change impacts make up b<strong>et</strong>ween 17-35% (average 28%) of the overall impact. The highest<br />
relative impacts (>30%) <strong>in</strong> this category are <strong>in</strong> scenarios modelled for apple, grape, blueberry and conventional<br />
chicken meat life cycles.<br />
439
PARALLEL SESSION 5A: FOOD LABELLING 8 th Int. Conference on <strong>LCA</strong> <strong>in</strong> the<br />
Agri-<strong>Food</strong> Sector, 1-4 Oct <strong>2012</strong><br />
• Fossil fuel depl<strong>et</strong>ion makes up b<strong>et</strong>ween 6-20% (average 14%) of the overall impact. The highest relative<br />
impacts (>15%) <strong>in</strong> this category are <strong>in</strong> scenarios modelled for apple, grape, blueberry, pasta from<br />
local grown wheat and bottled beer life cycles.<br />
• Water depl<strong>et</strong>ion makes up b<strong>et</strong>ween 1-30% (average 12%) of the overall impact. The highest relative<br />
impacts (>15%) <strong>in</strong> this category are <strong>in</strong> scenarios modelled for milk from cows fed with flood-irrigated<br />
alfalfa, grapes <strong>in</strong> plastic bags, avocado and beer life cycles.<br />
However on average lower range impacts:<br />
• Eutrophication has a >20% impact for pasta, milk from cows fed with pivot-irrigated alfalfa and organic<br />
chicken meat.<br />
• Toxicity impacts have a >20% impact for milk.<br />
The least significant environmental impact categories, with less than 10% contribution across all assessments,<br />
are ozone depl<strong>et</strong>ion, ionis<strong>in</strong>g radiation, m<strong>in</strong>eral depl<strong>et</strong>ion and impacts of land use. The relatively low<br />
impacts from land use are perhaps surpris<strong>in</strong>g consider<strong>in</strong>g the significant use of land resources for agricultural<br />
production.<br />
3.2 Results by Life Cycle Stage<br />
440<br />
Fig. 2 shows the results by life cycle stage.<br />
Figure 9. Weighted impacts per life cycle stage<br />
The results show an emphasis of impact <strong>in</strong> the earlier life cycle stages with:<br />
• Raw materials and agriculture mak<strong>in</strong>g up 26-69% (average 49%) of the overall impacts. The highest<br />
relative impacts (>55%) <strong>in</strong> this stage are <strong>in</strong> scenarios modelled for carton-packaged w<strong>in</strong>e, pasta from<br />
imported wheat, milk, chicken meat and blueberry life cycles.<br />
• Production mak<strong>in</strong>g up 4-63% (average 23%) of the overall impact. The highest relative impacts<br />
(>30%) <strong>in</strong> this stage are <strong>in</strong> scenarios modelled for avocado, apple, and grapes life cycles, all <strong>in</strong>clud<strong>in</strong>g<br />
chilled pack<strong>in</strong>ghouses.<br />
• Packag<strong>in</strong>g materials mak<strong>in</strong>g up 0-39% (average 13%) of the overall impact. The highest relative impacts<br />
(>25%) <strong>in</strong> this stage are <strong>in</strong> scenarios modelled for beer, w<strong>in</strong>e <strong>in</strong> bottles and blueberries transported<br />
locally.<br />
Post-manufacturer’s gate makes up an average of 15%, with the notable exception of pasta from local<br />
wheat where the use stage makes up 29% of the overall impact, primarily from cook<strong>in</strong>g.
PARALLEL SESSION 5A: FOOD LABELLING 8 th Int. Conference on <strong>LCA</strong> <strong>in</strong> the<br />
Agri-<strong>Food</strong> Sector, 1-4 Oct <strong>2012</strong><br />
3.2 Benchmark<strong>in</strong>g<br />
Although not presented here, the characterised global warm<strong>in</strong>g potential impact results (i.e. climate<br />
change) are benchmarked with available <strong>in</strong>ternational and national research <strong>in</strong> each PC<strong>LCA</strong>. The global<br />
warm<strong>in</strong>g potential impacts were consistently comparable with the other studies. This is not surpris<strong>in</strong>g s<strong>in</strong>ce<br />
the underly<strong>in</strong>g LCI data to a significant degree was adapted from the benchmark studies, as described <strong>in</strong> the<br />
paper. Only with <strong>in</strong>digenous data from <strong>in</strong>dustry can we develop a more confident product profile appropriate<br />
for Chile.<br />
4. Discussion<br />
The objective of identify<strong>in</strong>g and reduc<strong>in</strong>g environmental impacts, and not merely transferr<strong>in</strong>g impacts<br />
across media or stages of the product life cycle, is best served by consider<strong>in</strong>g the whole product life cycle<br />
when s<strong>et</strong>t<strong>in</strong>g product environmental criteria. That said, we cannot l<strong>et</strong> lack of data or m<strong>et</strong>hods hold back progress.<br />
The spirit <strong>in</strong> which the work was progressed was to take a pragmatic and practical approach to overcome<br />
gaps, and to provide a start<strong>in</strong>g po<strong>in</strong>t for improvement, rather than hold back <strong>in</strong> the absence of confirmed<br />
models and data. In this spirit the team developed provisional normalisation and weight<strong>in</strong>g factors <strong>in</strong><br />
order to help <strong>in</strong>terpr<strong>et</strong> the results. The assessments rely on unconfirmed characterisation models for regional<br />
impacts <strong>in</strong> Chile and the background data was adapted from almost exclusively non-South American process<br />
<strong>in</strong>formation.<br />
An anticipated concern for the Chilean <strong>in</strong>dustry and stakeholders is that life cycle data and product characteristics<br />
are used correctly and appropriately <strong>in</strong> communication and use. This especially <strong>in</strong>cludes any tools,<br />
m<strong>et</strong>hods, ecoprofiles and ecolabels that draw from the participat<strong>in</strong>g companies’ data. For this reason, a regional<br />
hub of TSC is be<strong>in</strong>g established to provide appropriate regional adaptations and stakeholder engagement.<br />
The r<strong>et</strong>ailer and Chilean government are also fund<strong>in</strong>g targ<strong>et</strong>ed producer <strong>in</strong>itiatives to catalyse the use<br />
of <strong>LCA</strong>-based tools and m<strong>et</strong>hods by r<strong>et</strong>ail suppliers.<br />
It is the authors’ view that the goal should <strong>in</strong>clude a wide consensus on a consistent level play<strong>in</strong>g field<br />
m<strong>et</strong>hodology. Consistency specifically <strong>in</strong> terms of LCI and allocation but also LCIA, is crucial to enable a<br />
mean<strong>in</strong>gful comparison b<strong>et</strong>ween products. Solv<strong>in</strong>g m<strong>et</strong>hodological problems to encompass the breadth of<br />
issues for products sold <strong>in</strong> r<strong>et</strong>ail stores must provide an approach that is similarly consistent and applicable<br />
across a large range of sectors. This is also important <strong>in</strong> order to avoid the possible mis<strong>in</strong>terpr<strong>et</strong>ation or even<br />
misuse of the results themselves.<br />
5. Conclusion<br />
The <strong>LCA</strong> reported here has shed light on what the ma<strong>in</strong> environmental hotspots <strong>in</strong> the life cycle are. A<br />
consistent and level play<strong>in</strong>g field m<strong>et</strong>hodology and active engagement from Chilean stakeholders must be<br />
established for the food sector <strong>in</strong> order for <strong>LCA</strong> to provide mean<strong>in</strong>gful and reliable <strong>in</strong>put <strong>in</strong>to decisionmak<strong>in</strong>g.<br />
6. References<br />
Ahlmén, K., Andersson, K., Strömberg, K., & Widheden, A., 2001, <strong>LCA</strong> Kyckl<strong>in</strong>g, by CIT Ekologik and MiljöledarnaCiconia for<br />
SvenskFågel.<br />
Australian Life-Cycle Inventory Database Initiative (AusLCI), 2009, Guidel<strong>in</strong>es for Data Development for an Australian Life-Cycle<br />
Inventory Database, Draft Standard, 29 June 2009.<br />
Barilla, GERF, & Life Cycle Eng<strong>in</strong>eer<strong>in</strong>g, 2009, Environmental Product Declaration of Durum Wheat Semol<strong>in</strong>a Pasta Produced <strong>in</strong><br />
Italy.<br />
Bevilacqua <strong>et</strong> al., 2007, Life cycle assessment of pasta production <strong>in</strong> Italy, Journal of <strong>Food</strong> Quality, 30, 932-952.<br />
Boggia, A., Paolotti, L., & Castell<strong>in</strong>i, C., March 2010, Environmental impact evaluation of conventional, organic and organic-plus<br />
poultry production systems us<strong>in</strong>g life cycle assessment, World's Poultry Science Journal, 66.<br />
Bosco, A., Di Bene, C., Galli, M., Remor<strong>in</strong>i, D., Massai, R., & Bonari, E., 2011, Greenhouse gas emissions <strong>in</strong> the agricultural phase<br />
of w<strong>in</strong>e production <strong>in</strong> the Maremma rural district <strong>in</strong> Tuscany, Italy, Italian Journal of Agronomy 2011, 6:e15.<br />
Build<strong>in</strong>g Products Innovation Council (BPIC), 2010, M<strong>et</strong>hodology Guidel<strong>in</strong>es for the Materials and Build<strong>in</strong>g Products Life Cycle<br />
Inventory, http://www.bpic.asn.au/LCIM<strong>et</strong>hodology.htm [last viewed 3 March 2011].<br />
Cordella, M., Tugnoli, A., Spadoni, G., Santarelli, F., & Zangrado, T., 2008, <strong>LCA</strong> of an Italian lager beer, <strong>LCA</strong> Journal, Spr<strong>in</strong>ger<br />
Verlag.<br />
Frankl<strong>in</strong> Associates, 2006, Life Cycle Inventory of Conta<strong>in</strong>er Systems for W<strong>in</strong>e, prepared for T<strong>et</strong>ra Pak Inc.<br />
Fundación Chile, 2007, Ficha Técnica Ecónomica Para el Cultivo de Alfalfa tipo, Dormancia Media.<br />
Gazulla, C., Raugei, M., & Fullana-i-Palmer, P., 2009, Tak<strong>in</strong>g a life-cycle look at Crianza w<strong>in</strong>e production <strong>in</strong> Spa<strong>in</strong>: Where are the<br />
bottlenecks?, Int J <strong>LCA</strong>, 15 (4), 330-337<br />
441
PARALLEL SESSION 5A: FOOD LABELLING 8 th Int. Conference on <strong>LCA</strong> <strong>in</strong> the<br />
Agri-<strong>Food</strong> Sector, 1-4 Oct <strong>2012</strong><br />
Goedkoop M.J., Heijungs R, Huijbregts M., De Schryver A.;Struijs J., Van Zelm R, 2009, ReCiPe 2008, A life cycle impact assessment<br />
m<strong>et</strong>hod which comprises harmonised category <strong>in</strong>dicators at the midpo<strong>in</strong>t and the endpo<strong>in</strong>t level, First edition Report I:<br />
Characterisation, 6 January 2009, http://www.lcia-recipe.n<strong>et</strong> [last viewed 13 January <strong>2012</strong>].<br />
Hospido, A., Moreira, M.T., & Feijoo, G., 2003, Simplified life cycle assessment of Galician milk production, International Dairy<br />
Journal, 13(10), 783-796.<br />
Instituto de Investigaciones Agropecuarias (INIA) & Deuman Ltda, 2010, Huella de Carbono en Productos de Exportación Agropecuarios<br />
de Chile, Fundación Para La Innovación Agraria, Santiago, Chile.<br />
International EPD Consortium, 2010, Carlsberg Italia, Environmental Product Declaration, Italia.<br />
<strong>LCA</strong> <strong>Food</strong>, 2003, Poultry Farm Production, http://www.lcafood.dk/processes/agriculture/poultryfarms.htm [last viewed 1 December<br />
2010].<br />
ISO, 2006, ISO14044:2006 Environmental management – Life cycle assessment – Requirements and guidel<strong>in</strong>es, Geneva, Switzerland.<br />
Milà i Canals, L., 2003, Contributions to <strong>LCA</strong> M<strong>et</strong>hodology for Agricultural Systems: Site-Dependency and Soil Degradation Impact<br />
Assessment, PhD thesis <strong>in</strong> Environmental Sciences, Autonomous University of Barcelona, Spa<strong>in</strong>,<br />
http://tdx.cat/handle/10803/3155 [last viewed 8 July 2011].<br />
Pell<strong>et</strong>ier, N., 2008, Environmental performance <strong>in</strong> the US broiler poultry sector: Life cycle energy use and greenhouse gas, ozone<br />
depl<strong>et</strong><strong>in</strong>g, acidify<strong>in</strong>g and eutrophy<strong>in</strong>g emissions, Agricultural Systems, 98(2): 67-73.<br />
Ritz, C.W., Fairchild, B.D., & Lacy, M.P., 2004, Implications of ammonia production and emissions from commercial poultry facilities:<br />
A review, J ApplPoult Res., 13, 684-692.<br />
Ru<strong>in</strong>i, L., & Mar<strong>in</strong>o, M., 2008, <strong>LCA</strong> of Semol<strong>in</strong>a Dry Pasta Produced by Barilla.<br />
Rural Industries Research and Development Corporation (RIRDC), 2011, Environmental Assessment of Chicken Meat Production<br />
Us<strong>in</strong>g Life Cycle Assessment, RIRDC Project No PRJ-004596, Draft F<strong>in</strong>al report April 2011, Australian Government.<br />
Talve, S., 2001, Life cycle assessment of a basic beer, <strong>LCA</strong> Journal, ecomed Journals, Germany.<br />
USDA, Choose My Plate; http://www.choosemyplate.gov/food-groups/ (Accessed February 9, <strong>2012</strong>).<br />
Williams A.G., Audsley E., & Sandars D.L., 2006, D<strong>et</strong>erm<strong>in</strong><strong>in</strong>g the Environmental Burdens and Resource Use <strong>in</strong> the Production of<br />
Agricultural and Horticultural Commodities, Ma<strong>in</strong> Report, Defra Research Project IS0205, Bedford, Cranfield University and<br />
Defra.<br />
WRAP, 2007, The Life-Cycle Emissions of W<strong>in</strong>e Imported to the UK,<br />
http://www.wfa.org.au/entw<strong>in</strong>e_website/files/resources/The_Life_Cycle_Emissions_of_W<strong>in</strong>e_Imported_to_the_UK_F<strong>in</strong>al_Repo<br />
rt.pdf [last viewed 15 November 2011].<br />
442
PARALLEL SESSION 5A: FOOD LABELLING 8 th Int. Conference on <strong>LCA</strong> <strong>in</strong> the<br />
Agri-<strong>Food</strong> Sector, 1-4 Oct <strong>2012</strong><br />
Implementation by a large-scale r<strong>et</strong>ailer of a multi-criteria<br />
environmental labell<strong>in</strong>g for food products: the Cas<strong>in</strong>o Environmental<br />
Index<br />
Marion Sarteel * , Frédéric Croison, Bérénice Harfouf-Ponthus, Olivier Jan 1 , Eric Labouze<br />
1 BIO Intelligence Service, <strong>France</strong><br />
Correspond<strong>in</strong>g author. E-mail: marion.sarteel@biois.com<br />
ABSTRACT<br />
In 2011, BIO IS and Cas<strong>in</strong>o, with the participation of suppliers, developed and tested an environmental labell<strong>in</strong>g m<strong>et</strong>hodology called<br />
“the Environmental Index”, based on <strong>LCA</strong> and communicated through a s<strong>in</strong>gle-score. GHG emissions, water consumption and eutrophication<br />
are quantified through <strong>LCA</strong> m<strong>et</strong>hodology, weighted and aggregated through PRIOR® m<strong>et</strong>hod. The score represents the<br />
environmental impact of 100g of product compared to the environmental impact of the average daily food consumption of a French<br />
person. This score, similar to on-pack nutritional <strong>in</strong>formation, provides a benchmark on more than 160 products and helps consumers<br />
<strong>in</strong>to more responsible purchas<strong>in</strong>g habits. For manufacturers, the data collection is easily handled but time spent can be important. The<br />
m<strong>et</strong>hodology chosen is flexible for <strong>in</strong>tegration of future upgrades without hav<strong>in</strong>g to change the format of the Environmental Index, to<br />
which consumers become familiarised. Non<strong>et</strong>heless, the aggregation m<strong>et</strong>hod may be updated, extended to the wider European context,<br />
and improved with biodiversity <strong>in</strong>formation.<br />
Keywords: environmental labell<strong>in</strong>g, experimentation, consumable food products, Environmental Index, Cas<strong>in</strong>o, aggregation, <strong>LCA</strong><br />
1. Introduction<br />
S<strong>in</strong>ce 2006, BIO Intelligence Service has supported Cas<strong>in</strong>o, a major r<strong>et</strong>ailer, <strong>in</strong> its efforts to evaluate the<br />
environmental impact of its own-brand products <strong>in</strong> <strong>France</strong>. The “Carbon Index,” which has been displayed<br />
on-pack on more than 600 products, shows greenhouse gas emissions emitted <strong>in</strong> the production of 100 g of<br />
the f<strong>in</strong>ished product (Cas<strong>in</strong>o, <strong>2012</strong>). In 2011, BIO Intelligence Service and Cas<strong>in</strong>o contributed to environmental<br />
labell<strong>in</strong>g experimentation <strong>in</strong> <strong>France</strong> and developed a multi-criteria environmental labell<strong>in</strong>g m<strong>et</strong>hodology<br />
based on Life Cycle Assessments (<strong>LCA</strong>). First designed and tested with seven partners (suppliers and<br />
NGOs), the m<strong>et</strong>hodology and its result, a s<strong>in</strong>gle-score called the “Environmental Index,” is progressively<br />
be<strong>in</strong>g implemented on all Cas<strong>in</strong>o-branded food products.<br />
The goal of the study is to make simplified <strong>LCA</strong> and environmental analysis simple and accessible for <strong>in</strong>dustries,<br />
manufacturers and r<strong>et</strong>ailers. With low implementation costs and good quality results, the study<br />
demonstrates the feasibility of a multi-criteria environmental labell<strong>in</strong>g. The study also demonstrates that it is<br />
possible to communicate environmental <strong>in</strong>formation to consumers, thanks to a s<strong>in</strong>gle <strong>in</strong>dicator, which is<br />
visible and easily understood by customers.<br />
The study stems from an active collaboration b<strong>et</strong>ween r<strong>et</strong>ailers, food manufacturers and BIO IS as an environmental<br />
labell<strong>in</strong>g consultancy. The partners are:<br />
Alter Eco<br />
BIO Intelligence Service<br />
Environmental NGO (confidential)<br />
Groupe Cas<strong>in</strong>o – EMC Distribution<br />
Fruité SAS<br />
Glon Sanders Hold<strong>in</strong>g<br />
MerAlliance<br />
Monoprix<br />
Sa<strong>in</strong>t Amand<br />
St Michel<br />
A technical partnership was also organised with an environmental organisation which monitored every<br />
stage of the study’s development.<br />
2. M<strong>et</strong>hods<br />
2.1. General m<strong>et</strong>hodological framework<br />
The quantification of the environmental impacts of food products relies on <strong>LCA</strong> m<strong>et</strong>hodology, recommendations<br />
of ADEME-AFNOR platform (2011) and the draft “<strong>Food</strong> product PCR”.<br />
443
PARALLEL SESSION 5A: FOOD LABELLING 8 th Int. Conference on <strong>LCA</strong> <strong>in</strong> the<br />
Agri-<strong>Food</strong> Sector, 1-4 Oct <strong>2012</strong><br />
The functional unit is: “100g or 100ml of consumable food product”. All the stages of the lifecycle recommended<br />
<strong>in</strong> BPX30-323 are accounted for <strong>in</strong> the m<strong>et</strong>hodology of this study:<br />
raw material production<br />
packag<strong>in</strong>g production<br />
production and packag<strong>in</strong>g stages<br />
transport of raw materials, packag<strong>in</strong>g, f<strong>in</strong>ished products<br />
distribution of products<br />
flows related to transport and energy <strong>in</strong>frastructures<br />
use of the products on customer premises<br />
end of lifecycle of f<strong>in</strong>ished product and packag<strong>in</strong>g<br />
Three <strong>in</strong>dicators were selected as <strong>in</strong>puts to the calculation of the label: GHG emissions (g CO2 eq), raw<br />
water consumption (L) and freshwater eutrophication (g PO4 --- eq). These <strong>in</strong>dicators were selected accord<strong>in</strong>g<br />
to criteria on relevance, m<strong>et</strong>hodological feasibility (quantification) and availability of Life Cycle Inventories,<br />
d<strong>et</strong>erm<strong>in</strong>ed by the ADEME-AFNOR work<strong>in</strong>g group on food and feed products (“Work<strong>in</strong>g group 1”). Furthermore,<br />
despite several proposals to account for biodiversity criteria, impacts on biodiversity could not be<br />
accounted for <strong>in</strong> this study for feasibility, data quality and relevance reasons. Should the Environmental Index<br />
be widely deployed, an additional study will be needed to work on biodiversity <strong>in</strong>dicators.<br />
Respond<strong>in</strong>g to the BPX 30-323 requirements, suppliers provided primary data by fill<strong>in</strong>g out a questionnaire<br />
<strong>in</strong> Excel form. Two to six weeks are necessary for suppliers to collect all the <strong>in</strong>formation necessary to<br />
calculate the impact of the product.<br />
Table 1. Data collected among suppliers<br />
Life cycle step Data collected<br />
Production of Recipe: <strong>in</strong>gredients and quantity<br />
<strong>in</strong>gredients Loss of raw materials<br />
Production of Materials and weight for primary, secondary and tertiary packag-<br />
packag<strong>in</strong>g<br />
<strong>in</strong>g per consumer sales unit<br />
Number of consumer sales units per secondary and tertiary packag<strong>in</strong>g<br />
Transformation Total quantity of production <strong>in</strong> the factory over a year, for all<br />
products references<br />
Total energy and water consumed <strong>in</strong> one year <strong>in</strong> the factory<br />
Other products consumed (refrigerant leakage, <strong>et</strong>c.)<br />
Quantity and composition of wastewater<br />
R<strong>et</strong>ail Conservation m<strong>et</strong>hod dur<strong>in</strong>g transport and r<strong>et</strong>ail<strong>in</strong>g<br />
Transport Transport of <strong>in</strong>gredient from the field to the supplier factory:<br />
distance, mode of transportation and conservation m<strong>et</strong>hod<br />
Transport of packag<strong>in</strong>g from the field to the supplier factory:<br />
distance and mode of transportation<br />
Transport of the f<strong>in</strong>ished product from the supplier factory to<br />
Cas<strong>in</strong>o warehouses: distance, mode of transportation, quantity of<br />
consumer sales unit delivered of each warehouse and conservation<br />
m<strong>et</strong>hod<br />
Use Conservation m<strong>et</strong>hod and typical cook<strong>in</strong>g practices (especially<br />
heat<strong>in</strong>g)<br />
End of life -<br />
Secondary data are extracted ma<strong>in</strong>ly from the EcoInvent database, except for agriculture data. The latter<br />
are derived from scientific studies or calculated by BIO IS through a simplified <strong>LCA</strong> (without peer review).<br />
More than 30 <strong>LCA</strong>s of animal products, veg<strong>et</strong>ables and fruits were conducted with<strong>in</strong> this study. Data used<br />
for the <strong>LCA</strong>s are from public scientific literature, m<strong>et</strong>hodological ADEME-AFNOR guides, CORPEN<br />
(2006), Proj<strong>et</strong> CASDAR (2009), federations of producers, technical <strong>in</strong>stitutes and som<strong>et</strong>imes producers.<br />
444
PARALLEL SESSION 5A: FOOD LABELLING 8 th Int. Conference on <strong>LCA</strong> <strong>in</strong> the<br />
Agri-<strong>Food</strong> Sector, 1-4 Oct <strong>2012</strong><br />
2.2 Calculat<strong>in</strong>g the aggregate environmental label<br />
Although not a common practice for <strong>LCA</strong>s (ISO 14044, 2006), data aggregation is the selected m<strong>et</strong>hodology<br />
<strong>in</strong> this case because the environmental label is <strong>in</strong>tended for the general public. Display of environmental<br />
<strong>in</strong>formation based on multiple criteria can affect customers or even cancel out the potential benefits of an<br />
environmental labell<strong>in</strong>g scheme for products by allow<strong>in</strong>g consumers to select b<strong>et</strong>ween different environmental<br />
impact categories. In order to facilitate consumer <strong>in</strong>terpr<strong>et</strong>ation of the environmental performance of<br />
a product and help customers <strong>in</strong> their decision-mak<strong>in</strong>g process, <strong>LCA</strong>s result<strong>in</strong>g <strong>in</strong> weight<strong>in</strong>g-aggregation<br />
m<strong>et</strong>hods can be used.<br />
The three <strong>LCA</strong> <strong>in</strong>dicators are compared to the environmental impacts of the average French consumer<br />
and then aggregated <strong>in</strong>to a s<strong>in</strong>gle <strong>in</strong>dicator, so that the environmental label can be readily understood by customers.<br />
2.2.2 Normalisation of the <strong>in</strong>dicators<br />
To make it easily accessible for customers, each <strong>in</strong>dicator is first normalised so that it displays the environmental<br />
impact of 100 g of product compared with the environmental impact of total daily food consumption<br />
of a French consumer.<br />
The three reference <strong>in</strong>dicators are calculated for total French food consumption. They are calculated per<br />
year and then brought down to a per day basis for one French person. The GHG emissions of the global food<br />
consumption, <strong>in</strong>clud<strong>in</strong>g cook<strong>in</strong>g impacts as well as their production, transport, distribution and end of life<br />
cycle, are the results of a research project led by BIO IS on the environmental impact of French food consumption<br />
(Oud<strong>et</strong>, 2011). Global water consumption is based on the water footpr<strong>in</strong>t of households, at a<br />
macro-economical level. It takes <strong>in</strong>to account direct and <strong>in</strong>direct water consumption (as irrigation, cool<strong>in</strong>g of<br />
nuclear <strong>in</strong>stallations, <strong>et</strong>c.). Eutrophication is evaluated by the quantity of fertilisers (N, P) used <strong>in</strong> <strong>France</strong> for<br />
food products. (The sources for global water footpr<strong>in</strong>t and global eutrophication are confidential.)<br />
The environmental label is meant to provide consumers with a level of <strong>in</strong>formation similar to the nutritional<br />
labell<strong>in</strong>g on food products. The nutrition label which is calculated per 100g of product (or <strong>in</strong> some<br />
cases, per portion) provides <strong>in</strong>formation on the nutritional value, contribut<strong>in</strong>g to b<strong>et</strong>ter <strong>in</strong>formed food<br />
choices.<br />
The analogy with the nutrition label is relevant: to help customers opt for healthy/susta<strong>in</strong>able foods.<br />
This pr<strong>in</strong>ciple is mirrored for the Environmental Index as it aims at propos<strong>in</strong>g clear and objective <strong>in</strong>formation,<br />
enabl<strong>in</strong>g customers to form a choice that considers the impacts of global daily food consumption. The<br />
<strong>in</strong>formation expressed <strong>in</strong> percentage form reflects an impact and gives the size of this impact. Customers can<br />
evaluate their purchases accord<strong>in</strong>g to the latter and their desire to have a susta<strong>in</strong>able shopp<strong>in</strong>g approach.<br />
2.2.1 Aggregation m<strong>et</strong>hod chosen<br />
Once normalised, the three <strong>in</strong>dicators are comb<strong>in</strong>ed us<strong>in</strong>g specific weights def<strong>in</strong>ed <strong>in</strong> the PRIOR®<br />
m<strong>et</strong>hod (Labouze, 2006). The aggregation m<strong>et</strong>hod was elaborated by BIO IS and recognised by the ADEME<br />
and the French M<strong>in</strong>istry of Environment (MEDDTL) but never officially published. It consists <strong>in</strong> normalis<strong>in</strong>g<br />
results (per habitant equivalent, but here with the criteria d<strong>et</strong>ailed above) and then apply<strong>in</strong>g weight<strong>in</strong>g<br />
coefficients elaborated with a panel of experts consider<strong>in</strong>g the French context. The output of this operation is<br />
a score without dimension.<br />
Six aggregation m<strong>et</strong>hods were studied and tested dur<strong>in</strong>g the project: m<strong>et</strong>hods based on the op<strong>in</strong>ion of an<br />
expert panel (PRIOR®, Eco-Indicator 99 and “third” m<strong>et</strong>hod), mon<strong>et</strong>isation m<strong>et</strong>hods (Damage cost and Ecotax<br />
2002) and End po<strong>in</strong>t m<strong>et</strong>hod Indicators calculation (Recipe). Although each one has its strong and weak<br />
po<strong>in</strong>ts, the PRIOR® m<strong>et</strong>hod was chosen. This choice was based on the acceptable degree of subjectivity, the<br />
importance allocated to the national and/or <strong>in</strong>ternational recognition of the m<strong>et</strong>hod, implementation feasibility<br />
(availability of data especially for the three <strong>in</strong>dicators) and customer understand<strong>in</strong>g.<br />
3. Results<br />
3.1 An environmental label designed for customers<br />
Currently, the Environmental Index is available for more than 160 product references. The environmental<br />
label is displayed on-pack, for use as a real decision factor for purchas<strong>in</strong>g. Accord<strong>in</strong>g to the consortium, a<br />
s<strong>in</strong>gle score display placed directly on product packag<strong>in</strong>g is a relevant and effective way for an environ-<br />
445
PARALLEL SESSION 5A: FOOD LABELLING 8 th Int. Conference on <strong>LCA</strong> <strong>in</strong> the<br />
Agri-<strong>Food</strong> Sector, 1-4 Oct <strong>2012</strong><br />
mental criterion to be considered at the time of purchase. This transmission mode of <strong>in</strong>formation seems to be<br />
preferred by consumers as it has been acclaimed by 86% of them (Cas<strong>in</strong>o-IFOP, <strong>2012</strong>). On-pack labell<strong>in</strong>g<br />
would also appear to be the best transmission mode for each company to manage its <strong>in</strong>formation flows and<br />
be responsible for mak<strong>in</strong>g this available.<br />
Figure 1. Illustration of Environmental Index for grape juice<br />
S<strong>in</strong>ce results are presented as a percentage of the daily impact of food consumption by a French customer,<br />
people can truly draw a comparison b<strong>et</strong>ween their own <strong>in</strong>dividual impacts and that of the average consumer.<br />
Therefore, this <strong>in</strong>dicator makes it possible for people to choose their items depend<strong>in</strong>g on their desire to purchase<br />
susta<strong>in</strong>ably.<br />
The leaves of the label, as shown below, range from dark green to orange, so that consumers can at a<br />
glance identify the category of impact of the given product. The percentage then provides more d<strong>et</strong>ailed <strong>in</strong>formation.<br />
446<br />
Figure 2. Display on front packag<strong>in</strong>g<br />
Extensive <strong>in</strong>formation is available on a dedicated website for customers <strong>in</strong>terested <strong>in</strong> learn<strong>in</strong>g more about<br />
environmental labell<strong>in</strong>g. On “www.<strong>in</strong>dice-environnemental.fr”, all <strong>LCA</strong> <strong>in</strong>formation is made available (results<br />
for each <strong>in</strong>dicator and per life-cycle stage) as well as advice on recycl<strong>in</strong>g best practices. A web l<strong>in</strong>k is<br />
displayed on packag<strong>in</strong>g as well as a 2D barcode for Smartphone users, which is l<strong>in</strong>ked to the mobile version.
PARALLEL SESSION 5A: FOOD LABELLING 8 th Int. Conference on <strong>LCA</strong> <strong>in</strong> the<br />
Agri-<strong>Food</strong> Sector, 1-4 Oct <strong>2012</strong><br />
Table 2. D<strong>et</strong>ailed results for 100 g of grape juice<br />
Life cycle steps GHG emissions (g eq. CO2) Water consumption (L) Wate pollution (g eq. PO4 3-<br />
Production of <strong>in</strong>gredients 68 0.54 0.47<br />
Production of packag<strong>in</strong>g 88 0.17 0.02<br />
Transformation 4.0 0.20 0.002<br />
R<strong>et</strong>ail 9.3 0.67 0.02<br />
Transport 37 0.14 0.04<br />
Use 4.3 0.25 0.01<br />
End of life 6.5 0.10 0.03<br />
TOTAL 137 2.1 0.59<br />
Aggregation of multiple criteria provides customers with simple, easy-to-understand <strong>in</strong>formation. The label<br />
displayed on the product must be quickly understood so that customers can really use it as a criterion for<br />
shopp<strong>in</strong>g. It also can be used as a decision-mak<strong>in</strong>g tool to prioritize and grade the environmental stakes both<br />
by eco-design manufacturers and policy-makers.<br />
Consumers, especially those unaware of environmental issues, clearly ask for simplicity: 61% of them<br />
prefer a scale without figures and 48% prefer a unique score (Cas<strong>in</strong>o-IFOP, <strong>2012</strong>).<br />
The results of the survey led by Cas<strong>in</strong>o on customers’ perception of the Environmental Index [8] <strong>in</strong>dicate<br />
that the Environmental Index is not easy to understand at a first glance and requires a certa<strong>in</strong> amount of effort<br />
on the part of customers. Non<strong>et</strong>heless, the score seems to be clearer than <strong>LCA</strong> <strong>in</strong>dicators as 57% of customers<br />
preferred the unique score versus 24% for the separated <strong>in</strong>dicators. Moreover, for young people, 76%<br />
of the customers d<strong>et</strong>erm<strong>in</strong>ed correctly b<strong>et</strong>ween two products the one which has the lowest impact with the<br />
Environmental Index whereas only 21% d<strong>et</strong>erm<strong>in</strong>ed correctly with separated <strong>in</strong>dicators (21% do not know<br />
and 37% have a wrong answer). F<strong>in</strong>ally, it is <strong>in</strong>terest<strong>in</strong>g to notice that even if the Environmental Index is not<br />
known y<strong>et</strong>, the old label, the Carbon Index, is currently known by 35% of the consumers.<br />
3.2 High <strong>in</strong>volvement by suppliers<br />
The <strong>LCA</strong> m<strong>et</strong>hodology was adapted to b<strong>et</strong>ter fit environmental labell<strong>in</strong>g cost and efficiency constra<strong>in</strong>ts.<br />
Indeed, the m<strong>et</strong>hodology has been established with suppliers, who, as data collectors for <strong>LCA</strong> calculations,<br />
know the k<strong>in</strong>d of data they can provide at an acceptable cost. Data collection is easily handled by manufacturers,<br />
especially for those who have already participated to the Carbon Index. Non<strong>et</strong>heless, time spent on<br />
data collection seems to be important as several departments with<strong>in</strong> a company and a supplier’s own supplier<br />
can be <strong>in</strong>volved <strong>in</strong> the process.<br />
The implication of manufacturers <strong>in</strong> the calculation of the Environmental <strong>in</strong>dex is very important and<br />
positive as it can serve as a way for companies to manage their own <strong>in</strong>formation flows and to be responsible<br />
for the release of this <strong>in</strong>formation. Because lots of data are collected from suppliers, the calculation of impact<br />
will likely be highly representative of the actual product that is to be labelled. The <strong>in</strong>itiative may thus be the<br />
first step for s<strong>et</strong>t<strong>in</strong>g up an eco-design approach on manufactured products.<br />
The evaluation of these po<strong>in</strong>ts will be conducted with partners dur<strong>in</strong>g the analysis of the project feedback<br />
<strong>in</strong> June <strong>2012</strong>.<br />
3.3 A flexible m<strong>et</strong>hodology for a unique format<br />
The m<strong>et</strong>hodology chosen, specifically for aggregation, will allow an <strong>in</strong>terest<strong>in</strong>g degree of upgrad<strong>in</strong>g<br />
without hav<strong>in</strong>g to change the format of the Environmental Index, to which consumers are becom<strong>in</strong>g familiarised.<br />
It can be adapted to any geographic context by modulat<strong>in</strong>g the references used for the normalisation<br />
and to non-food products by choos<strong>in</strong>g the relevant <strong>in</strong>dicators. The addition or change of environmental criteria<br />
or any m<strong>et</strong>hodological change due to future ADEME-AFNOR recommendations can also be implemented<br />
without impact<strong>in</strong>g the format of the Environmental Index.<br />
4. Discussion<br />
Reference data for the normalisation m<strong>et</strong>hod may be homogenised and further specified. A public study<br />
that assesses the impact of food consumption <strong>in</strong> <strong>France</strong> for those three <strong>in</strong>dicators <strong>in</strong> the same scope may be<br />
necessary.<br />
447
PARALLEL SESSION 5A: FOOD LABELLING 8 th Int. Conference on <strong>LCA</strong> <strong>in</strong> the<br />
Agri-<strong>Food</strong> Sector, 1-4 Oct <strong>2012</strong><br />
The aggregation m<strong>et</strong>hod was selected among five other m<strong>et</strong>hods. The m<strong>et</strong>hod is robust, elaborated by<br />
BIO IS with a panel of experts and recognized by ADEME and the French M<strong>in</strong>istry of Environment<br />
(MEDDTL). Non<strong>et</strong>heless, it may be subsequently updated, for example:<br />
Each <strong>in</strong>dicator may be weighed <strong>in</strong> light of the social, cultural and scientific priorities of <strong>2012</strong> as<br />
the PRIOR® m<strong>et</strong>hod was developed <strong>in</strong> 2006.<br />
Water consumption may be weighed, as there is no specific weight<strong>in</strong>g coefficient for it, the coefficient<br />
of non renewable natural resources is currently used <strong>in</strong>stead, pend<strong>in</strong>g further precision of<br />
the m<strong>et</strong>hod.<br />
The global m<strong>et</strong>hod may be extended to the broader European context as the current m<strong>et</strong>hod is<br />
adapted to French context only. The m<strong>et</strong>hod will also be improved with the <strong>in</strong>clusion of biodiversity<br />
<strong>in</strong>formation as soon as a consensual calculation m<strong>et</strong>hodology is available.<br />
F<strong>in</strong>ally, support <strong>in</strong>formation around environmental labell<strong>in</strong>g, <strong>in</strong>dicators and the Environmental<br />
Index should be prepared to improve the level of understand<strong>in</strong>g of the approach.<br />
It took several years for customers to be familiar with nutrition labell<strong>in</strong>g. Now they seem to be seek<strong>in</strong>g<br />
this k<strong>in</strong>d of <strong>in</strong>formation. The same trend will likely happen with environmental <strong>in</strong>formation.<br />
5. Conclusion<br />
The Environmental Index study enabled the test<strong>in</strong>g of a m<strong>et</strong>hodology for environmental labell<strong>in</strong>g that can<br />
be expressed with a s<strong>in</strong>gle and simple score, with the participation of various actors of the agro-<strong>in</strong>dustry<br />
sector.<br />
With the aim of provid<strong>in</strong>g clear and objective <strong>in</strong>formation, this study is <strong>in</strong>tended to streaml<strong>in</strong>e environmental<br />
display <strong>in</strong>formation to help consumers make susta<strong>in</strong>able purchas<strong>in</strong>g choices. Indeed this approach<br />
makes it possible for products from the same or different categories to be differentiated accord<strong>in</strong>g to environmental<br />
performance. This new approach needs non<strong>et</strong>heless pedagogy efforts from professionals <strong>in</strong>volved<br />
<strong>in</strong> environmental labell<strong>in</strong>g <strong>in</strong> order to <strong>in</strong>crease the level of understand<strong>in</strong>g of consumers. The m<strong>et</strong>hodology<br />
chosen is flexible for <strong>in</strong>tegrat<strong>in</strong>g future upgrades without hav<strong>in</strong>g to change the format of the Environmental<br />
Index, to which consumers are becom<strong>in</strong>g familiarised. This study may also be the first step toward s<strong>et</strong>t<strong>in</strong>g up<br />
eco-design approaches on food products. In this way, it may efficiently promote the reduction of environmental<br />
impacts due to food consumption.<br />
6. References<br />
ADEME-AFNOR, 2011. BPX30-323: référentiel de bonnes pratiques sur l’affichage environnemental des produits de grande consummation.<br />
Cas<strong>in</strong>o, <strong>2012</strong>. L’<strong>in</strong>dice carbone Cas<strong>in</strong>o. http://www.produits-cas<strong>in</strong>o.fr/developpement-durable/dd_<strong>in</strong>dice-carbone-<strong>in</strong>dice.html<br />
Cas<strong>in</strong>o-IFOP, <strong>2012</strong>. Perception par les consommateurs de l’environnement, l’affichage environnemental <strong>et</strong> l’Indice Environnemental.<br />
Enquête réalisée auprès de 969 clients du Groupe Cas<strong>in</strong>o, currently unpublished.<br />
CORPEN, 2006. Guide des émissions d’ammoniac <strong>et</strong> gaz azotés à eff<strong>et</strong> de serre en agriculture.<br />
Labouze E., 2006. PRIOR®, un outil de priorisation des enjeux environnementaux - Guide pratique dest<strong>in</strong>é aux acteurs de l'écoconception.<br />
ISO 14044, 2006. Environmental management — Life cycle assessment — Requirements and guidel<strong>in</strong>es.<br />
Oud<strong>et</strong> N., 2011. Environmental assessment of conventional vs organic food consumption <strong>in</strong> <strong>France</strong>.<br />
Proj<strong>et</strong> CASDAR, 2009. Guide méthodologique pour l’estimation des impacts des activités agricoles sur l’eff<strong>et</strong> de serre.<br />
448
PARALLEL SESSION 5A: FOOD LABELLING 8 th Int. Conference on <strong>LCA</strong> <strong>in</strong> the<br />
Agri-<strong>Food</strong> Sector, 1-4 Oct <strong>2012</strong><br />
Fateful and faithful: the success factors of eco-labell<strong>in</strong>g<br />
PE INTERNATIONAL AG, Le<strong>in</strong>felden-Echterd<strong>in</strong>gen, Germany<br />
Correspond<strong>in</strong>g author. E-mail: f.dsouza@pe-<strong>in</strong>ternational.com<br />
Flora D’Souza * , Alexander Liedke, Sab<strong>in</strong>e Deiml<strong>in</strong>g<br />
ABSTRACT<br />
Eco-labell<strong>in</strong>g schemes are on the rise – customers and environmental experts alike are confused with the boom<strong>in</strong>g “<strong>in</strong>dustry”. The<br />
difference b<strong>et</strong>ween the two groups is that the customers’ decision for or aga<strong>in</strong>st a label is the fateful one: it decides the ultimate success<br />
or failure of the label. At the same time the judgment of an environmental expert – the one faithful to some aspect of susta<strong>in</strong>ability<br />
– carries the responsibility of steer<strong>in</strong>g private and public op<strong>in</strong>ion <strong>in</strong> the right direction. The titular word game is meant to illustrate<br />
the core of the challenge: different stakeholder groups have very different needs and <strong>in</strong>fluence regard<strong>in</strong>g value and success of ecolabell<strong>in</strong>g<br />
<strong>in</strong>itiatives. But why label food at all? And more importantly, how? Is it sufficient to declare the quality <strong>in</strong> terms of taste and<br />
nutritional value or do we need to know about the sourc<strong>in</strong>g of <strong>in</strong>gredients and use of pesticides, fertilisers? Does a full Life cycle<br />
Assessment (<strong>LCA</strong>) have added value compared to type I declarations? Or to put it <strong>in</strong> a s<strong>in</strong>gle, practical question: what makes the<br />
TüV or CarbonTrust labels successful, the EU-Bio-label popular over many other labels that spr<strong>in</strong>g up then die off with<strong>in</strong> years of the<br />
launch? These are the questions for which this semi-theor<strong>et</strong>ical paper seeks answers to.<br />
The authors s<strong>et</strong> out to explore the success factors and discovered that stakeholder engagement is <strong>in</strong> fact the make-or-break factor. The<br />
diverg<strong>in</strong>g <strong>in</strong>terests must be harmonised and the key to that lies <strong>in</strong> ask<strong>in</strong>g the right questions (Table 1). In addition to evaluat<strong>in</strong>g some<br />
good examples from the multitude of exist<strong>in</strong>g labels and active stakeholder groups, the present paper discusses a stepwise protocol on<br />
“how to create a successful label” us<strong>in</strong>g the case study of the EU-funded Life+ project “HAproW<strong>in</strong>e” (EU - LIFE08 ENV/E/000143)<br />
aimed at develop<strong>in</strong>g an eco-label for w<strong>in</strong>e produced <strong>in</strong> the Spanish region Castilla y León.<br />
The steps can be summarised as follows:<br />
(1) Prepare a small-scale pilot project<br />
(2) Engage the stakeholder groups: survey the <strong>in</strong>terests of representatives of consumers, r<strong>et</strong>ailers, producers, and governmental<br />
or other authorities who are <strong>in</strong>terested <strong>in</strong> manag<strong>in</strong>g, verify<strong>in</strong>g or promot<strong>in</strong>g the aspect of susta<strong>in</strong>ability targ<strong>et</strong>ed by the label<br />
(3) Def<strong>in</strong>e the objective of the label: which <strong>in</strong>formation should it carry <strong>in</strong> order to satisfy the <strong>in</strong>terests and needs of the stakeholder<br />
groups?<br />
(4) Def<strong>in</strong>e the requirements of award<strong>in</strong>g the label (quality criteria, award system, review/verification system, validity and organisational<br />
structure)<br />
(5) Involve stakeholders <strong>in</strong> milestone decisions as checkpo<strong>in</strong>t: is the label <strong>in</strong> fact address<strong>in</strong>g their <strong>in</strong>terests?<br />
(6) Evaluate outcomes of the pilot project based on the percentage of labels awarded, the satisfaction level of the stakeholder<br />
groups <strong>in</strong>volved, the practicability of the award<strong>in</strong>g scheme, the mean<strong>in</strong>gfulness of the label<br />
(7) Roll out label with help of stakeholders <strong>in</strong>volved <strong>in</strong> pilot<br />
Through the evaluation of some key exist<strong>in</strong>g examples and the case study of develop<strong>in</strong>g a new label <strong>in</strong> the food <strong>in</strong>dustry based on<br />
<strong>LCA</strong>, the paper identifies underly<strong>in</strong>g factors of success and failure.<br />
Table 1. Eco-label success factors from the perspective of different stakeholder groups.<br />
Stakeholder<br />
group<br />
Highest priority questions Solutions<br />
Producer Does the label help me sell my Label may be required to sell <strong>in</strong> certa<strong>in</strong> r<strong>et</strong>ailers, or<br />
product?<br />
it could enable cost reduction or higher pric<strong>in</strong>g<br />
R<strong>et</strong>ailer Does the label ensure that I can Label may enable reduc<strong>in</strong>g the r<strong>et</strong>ailer’s Scope III<br />
me<strong>et</strong> my susta<strong>in</strong>ability targ<strong>et</strong>s? emissions and can be documented quantitatively as<br />
Can I document achievements? well qualitatively <strong>in</strong> different report<strong>in</strong>g schemes<br />
(CSR, CDP, GRI...)<br />
Consumer What does the label tell me and Labels must convey simple <strong>in</strong>formation, be it quali-<br />
how can I f<strong>in</strong>d the one most attative (
PARALLEL SESSION 5A: FOOD LABELLING 8 th Int. Conference on <strong>LCA</strong> <strong>in</strong> the<br />
Agri-<strong>Food</strong> Sector, 1-4 Oct <strong>2012</strong><br />
References<br />
Díez Vázquez, J. À. <strong>et</strong> al., 2010-<strong>2012</strong>. HAproWINE (EU - LIFE08 ENV/E/000143) Integrated waste management and life cycle<br />
assessment <strong>in</strong> the w<strong>in</strong>e <strong>in</strong>dustry. http://www.haprow<strong>in</strong>e.eu/<br />
Kwasniewski, N. <strong>2012</strong>. "Öko-Test" und Co. Welche Lebensmittelsiegel wirklich taugen. Spiegel Onl<strong>in</strong>e available onl<strong>in</strong>e at<br />
http://www.spiegel.de/wirtschaft/service/0,1518,813556,00.html<br />
J Sa<strong>in</strong>sbury. 2011. Corporate Social Responsibility Report. http://www.j-sa<strong>in</strong>sbury.co.uk/<br />
Tesco. 2010. Corporate Responsibility Report. http://www.tilles.co.uk/companies/tesco/reports.html<br />
Marks & Spencer. 2006. Corporate Social Responsibility Report. http://corporate.marksandspencer.com/<br />
450
PARALLEL SESSION 5A: FOOD LABELLING 8 th Int. Conference on <strong>LCA</strong> <strong>in</strong> the<br />
Agri-<strong>Food</strong> Sector, 1-4 Oct <strong>2012</strong><br />
Carbon footpr<strong>in</strong>t<strong>in</strong>g and labell<strong>in</strong>g of agri-food products: practical<br />
issues for the development of Product Category Rules<br />
Rattanawan Mungkung 1,* , Shabbir H. Gheewala 2,3<br />
1 Centre of Excellence on enVironmental strategy for GREEN bus<strong>in</strong>ess (VGREEN) and Department of Environmental Science,<br />
Faculty of Science, Kas<strong>et</strong>sart University, Bangkok, Thailand<br />
2 The Jo<strong>in</strong>t Graduate School for Energy and Environment (JGSEE), K<strong>in</strong>g Mongkut’s University of Technology Thonburi, Bangkok,<br />
Thailand<br />
3 Center for Energy Technology and Environment, M<strong>in</strong>istry of Education, Thailand<br />
Correspond<strong>in</strong>g author. E-mail: fscirwm@ku.ac.th<br />
ABSTRACT<br />
Carbon Footpr<strong>in</strong>t has emerged as an approach to estimate greenhouse gas (GHG) emissions throughout the product’s life cycle. The<br />
carbon footpr<strong>in</strong>t <strong>in</strong>formation is also encouraged to be provided to consumers via Carbon Label as an <strong>in</strong>dicator of the climatefriendl<strong>in</strong>ess<br />
to take <strong>in</strong>to account <strong>in</strong> their purchas<strong>in</strong>g decisions. The carbon footpr<strong>in</strong>t and label strategy is expected to stimulate a mark<strong>et</strong><br />
demand for lower carbon products to move towards the reduction of GHG emissions at both production and consumption. Agrifood<br />
is identified as one of the ma<strong>in</strong> <strong>in</strong>dustrial sectors contribut<strong>in</strong>g significantly to GHG emissions. Thus, they are targ<strong>et</strong>ed and given<br />
priority <strong>in</strong> several countries, <strong>in</strong>clud<strong>in</strong>g Thailand. Implement<strong>in</strong>g carbon footpr<strong>in</strong>t<strong>in</strong>g to put carbon labels is <strong>in</strong>tended to raise awareness<br />
of consumers on the carbon footpr<strong>in</strong>t attached to their purchas<strong>in</strong>g choices for climate change mitigation. However, it is most critical<br />
that the carbon footpr<strong>in</strong>t<strong>in</strong>g m<strong>et</strong>hodology is standardized <strong>in</strong>ternationally to be able to compare the carbon footpr<strong>in</strong>t values b<strong>et</strong>ween<br />
products. It must be emphasized that though carbon footpr<strong>in</strong>ts are not <strong>in</strong>tended <strong>in</strong> pr<strong>in</strong>ciple for comparison b<strong>et</strong>ween “apples and<br />
oranges”; <strong>in</strong> practice such comparison by the consumers is difficult to control. Based on a number of carbon footpr<strong>in</strong>t<strong>in</strong>g case studies<br />
conducted <strong>in</strong> Thailand <strong>in</strong> 2008-2011 (e.g. rice, tapioca, swe<strong>et</strong> corn, baby corn, asparagus, p<strong>in</strong>eapple, chicken, shrimp, tilapia, <strong>et</strong>c.),<br />
some major practical issues were raised when develop<strong>in</strong>g the Product Category Rules (PCR). These issues are discussed <strong>in</strong> the paper<br />
along with the solutions that have been arrived at <strong>in</strong> Thailand for the first few PCRs that have been developed to date. Issues of system<br />
boundaries, product group<strong>in</strong>g, allocation and data quality are elaborated along with suggestions even for the type of carbon label<br />
based on stakeholder consultation.<br />
Keywords: agri-food products, carbon footpr<strong>in</strong>t<strong>in</strong>g, Environmental Product Declaration, Product Category Rules<br />
1. Introduction<br />
1.1. Introduction to carbon footpr<strong>in</strong>t<br />
“Carbon Footpr<strong>in</strong>t” has emerged as a tool to assess greenhouse gas (GHG) emissions throughout the<br />
product’s life cycle, aim<strong>in</strong>g to identify the hot spots and stimulate emission reduction. The carbon footpr<strong>in</strong>t<br />
<strong>in</strong>formation is also encouraged to be provided to consumers via Carbon Label as an <strong>in</strong>dicator of the climatefriendl<strong>in</strong>ess<br />
to take <strong>in</strong>to account <strong>in</strong> their purchas<strong>in</strong>g decisions. The carbon footpr<strong>in</strong>t and label strategy is expected<br />
to stimulate a mark<strong>et</strong> demand for lower carbon products to move towards the reduction of GHG emissions<br />
at both production and consumption. The concept of carbon footpr<strong>in</strong>t and carbon label is well accepted,<br />
lead<strong>in</strong>g to the development of ISO 14067 which is to be officially launched <strong>in</strong> 2013. Hav<strong>in</strong>g recognised the<br />
significance of global warm<strong>in</strong>g and climate change impacts, several countries <strong>in</strong>clud<strong>in</strong>g Thailand have<br />
adopted carbon footpr<strong>in</strong>t<strong>in</strong>g and labell<strong>in</strong>g schemes. Agri-food is identified as one of the ma<strong>in</strong> <strong>in</strong>dustrial sectors<br />
contribut<strong>in</strong>g significantly to GHG emissions.<br />
1.2. Carbon footpr<strong>in</strong>t and label <strong>in</strong> Thailand<br />
Thailand is very well aware of the development and implementation of Carbon Footpr<strong>in</strong>t<strong>in</strong>g and Carbon<br />
Labell<strong>in</strong>g for climate change mitigation as well as to anticipate trade measures. <strong>Food</strong> has been the focus on<br />
this particular issue, due ma<strong>in</strong>ly to its contribution <strong>in</strong> GHG emissions at the household level. Also it is the<br />
ma<strong>in</strong> product for all consumers who should be conv<strong>in</strong>ced to change their consumption behaviour towards<br />
lower emissions. Initiated <strong>in</strong> 2008, carbon footpr<strong>in</strong>t projects on chicken (Chicken snack and Steamed diced<br />
oven chicken), tuna (Canned tuna <strong>in</strong> sunflower oil) and rice (Jasm<strong>in</strong>e rice and Rice vermicelli/noodle) were<br />
conducted by Kas<strong>et</strong>sart University (KU) and the Jo<strong>in</strong>t Graduate School for Energy and Environment<br />
(JGSEE) (Mungkung <strong>et</strong> al., <strong>2012</strong>). Both projects were aimed to familiarise with the PAS 2050: 2008 m<strong>et</strong>hodology<br />
which was available at that po<strong>in</strong>t of time and identify the local knowledge gaps.<br />
In 2009, a national pilot project to promote the implementation of product carbon footpr<strong>in</strong>t was <strong>in</strong>itiated<br />
by the Thailand Greenhouse Gas Management Organisation (Public Organisation) (TGO) and National<br />
M<strong>et</strong>al and Materials Technology Centre (MTEC), Thailand. The project was targ<strong>et</strong>ed at the implementation<br />
of product carbon footpr<strong>in</strong>t<strong>in</strong>g and labell<strong>in</strong>g lead<strong>in</strong>g to development the national guidel<strong>in</strong>es on product car-<br />
451
PARALLEL SESSION 5A: FOOD LABELLING 8 th Int. Conference on <strong>LCA</strong> <strong>in</strong> the<br />
Agri-<strong>Food</strong> Sector, 1-4 Oct <strong>2012</strong><br />
bon footpr<strong>in</strong>t as well as the national carbon footpr<strong>in</strong>t labell<strong>in</strong>g scheme which was launched officially <strong>in</strong> December,<br />
2009. Interest<strong>in</strong>gly, food companies such as chicken, tuna, p<strong>in</strong>eapple, rice, p<strong>et</strong> food, and animal feed<br />
jo<strong>in</strong>ed the project because of their awareness on global warm<strong>in</strong>g issues and also because they would like to<br />
prepare themselves for report<strong>in</strong>g, reduc<strong>in</strong>g GHG emissions, and labell<strong>in</strong>g the carbon footpr<strong>in</strong>t <strong>in</strong>formation.<br />
More studies were conducted <strong>in</strong> 2011 by KU and JGSEE, cover<strong>in</strong>g shrimp, asparagus, baby corn, swe<strong>et</strong> corn,<br />
swe<strong>et</strong> chili sauce, and coconut milk <strong>in</strong>clud<strong>in</strong>g the development of “FOODpr<strong>in</strong>t” as a tool to facilitate the<br />
<strong>in</strong>dustry collect<strong>in</strong>g the data and calculat<strong>in</strong>g the carbon footpr<strong>in</strong>t value based on the collaboration from 40<br />
food companies: fruits and veg<strong>et</strong>ables (i.e. rice, tapioca starch, p<strong>in</strong>eapple, fruit cocktail, <strong>et</strong>c.), livestock (i.e.<br />
chicken, pork, milk, <strong>et</strong>c.), fisheries (i.e. tuna, mackerel, <strong>et</strong>c.), aquaculture (i.e. shrimp, tilapia, <strong>et</strong>c.), food<br />
<strong>in</strong>gredients (i.e. sugar, palm oil, <strong>et</strong>c.), dr<strong>in</strong>ks (i.e. coffee, aloe vera juice, <strong>et</strong>c.) and ready-to-eat meals (i.e.<br />
cereal, <strong>in</strong>stant fried rice, <strong>et</strong>c.) (Gheewala and Mungkung, <strong>2012</strong>).<br />
The national guidel<strong>in</strong>e of product carbon footpr<strong>in</strong>t (Available at<br />
http://www.tgo.or.th/english/<strong>in</strong>dex.php?option=com_content&view=article&id=194:the-national-guidel<strong>in</strong>ecarbon-footpr<strong>in</strong>t<strong>in</strong>g-of-product&catid=51:publication&Itemid=68,<br />
<strong>in</strong> English) was developed from the practical<br />
experiences ga<strong>in</strong>ed from 24 pilot companies, which <strong>in</strong>cluded: food, packag<strong>in</strong>g, textile, electrical and<br />
electronic equipment, automobile, and build<strong>in</strong>g materials. The key references were: ISO 14040/44, PAS<br />
2050:2008 (Publicly Available Specification: Specification for the assessment of life cycle greenhouse gas<br />
emissions of goods and services) and TS Q0010 (Japanese Technical Specification: General pr<strong>in</strong>ciples for<br />
the assessment of carbon footpr<strong>in</strong>t of product). The pr<strong>in</strong>ciples of carbon footpr<strong>in</strong>t assessment are rooted <strong>in</strong><br />
the life cycle approach and the ma<strong>in</strong> m<strong>et</strong>hodological issues are applicable for all k<strong>in</strong>ds of products. The carbon<br />
footpr<strong>in</strong>t labell<strong>in</strong>g is based on the m<strong>et</strong>hodology described <strong>in</strong> the national guidel<strong>in</strong>e on product carbon<br />
footpr<strong>in</strong>t and expressed as carbon score, XXX g or kg CO2e (three significant digits). To date (March <strong>2012</strong>),<br />
there are more than 480 products be<strong>in</strong>g labelled from 117 companies; food products are more than half of the<br />
total products [Available at http://thaicarbonlabel.tgo.or.th/carbonfootpr<strong>in</strong>t/<strong>in</strong>dex.php?page=2].<br />
1.3. Development of PCRs for agri-food products<br />
Different characteristics of products have been recognised thus lead<strong>in</strong>g to the need for development of<br />
“Product Category Rules” (PCRs) as additional requirements for carbon footpr<strong>in</strong>t implementation. The practices<br />
of PCR development <strong>in</strong> Thailand are at two levels: (i) by the first company who calculated the carbon<br />
footpr<strong>in</strong>t and applied for verification for the carbon footpr<strong>in</strong>t label approved by the national technical committee<br />
on product carbon footpr<strong>in</strong>t (PCR, company level), (ii) by TGO with the stakeholder consultation<br />
me<strong>et</strong><strong>in</strong>g and approved by the national technical committee on product carbon footpr<strong>in</strong>t (PCR, national level).<br />
Until now, there are 74 PCRs, at the company level (40 of these are concern<strong>in</strong>g food products) and 3 PCRs at<br />
the national level (textiles divided <strong>in</strong>to yarn and fabric, cloth<strong>in</strong>g, non-cloth<strong>in</strong>g; food which are milled rice<br />
and chicken meat). It was discussed if PCRs should be developed for each sector or specific product; this had<br />
led to the analysis of the related issues of PCR development and contents <strong>in</strong> this study.<br />
2. M<strong>et</strong>hods<br />
To identify the issues related to the PCR development and contents for agri-food products, the practical<br />
experiences <strong>in</strong> apply<strong>in</strong>g both PAS 2050 and implement<strong>in</strong>g the national guidel<strong>in</strong>e on product carbon footpr<strong>in</strong>t<br />
were gathered. The analysis is then used to provide a s<strong>et</strong> of recommendations for further development of<br />
PCRs <strong>in</strong> agri-food products.<br />
3. Results and Discussion<br />
The results from the analysis of issues that should be taken <strong>in</strong>to account and proposed solutions are discussed<br />
<strong>in</strong> the sections below.<br />
3.1. Approach <strong>in</strong> develop<strong>in</strong>g PCRs<br />
There are two approaches <strong>in</strong> develop<strong>in</strong>g PCRs: sector-based or <strong>in</strong>dividual product-based. We started from<br />
the development of PCR based on each specific product (<strong>in</strong>dividual product), which was drafted and proposed<br />
by the pioneer<strong>in</strong>g companies conduct<strong>in</strong>g the carbon footpr<strong>in</strong>t<strong>in</strong>g and apply<strong>in</strong>g for the carbon footpr<strong>in</strong>t<br />
label. However, the local experts were concerned that the development of PCR at <strong>in</strong>dividual level would be<br />
time-consum<strong>in</strong>g and will not be able to respond to the bus<strong>in</strong>ess operations and decisions. On the other hand,<br />
some experts felt that some key products should be developed <strong>in</strong>dividually as there are some very specific<br />
issues such as rice from different rice farm<strong>in</strong>g systems <strong>in</strong> each region hav<strong>in</strong>g different emission factors. It<br />
452
PARALLEL SESSION 5A: FOOD LABELLING 8 th Int. Conference on <strong>LCA</strong> <strong>in</strong> the<br />
Agri-<strong>Food</strong> Sector, 1-4 Oct <strong>2012</strong><br />
should be noted here that some products do not y<strong>et</strong> have many companies implement<strong>in</strong>g the carbon footpr<strong>in</strong>t<br />
label so the stakeholder consultation process could not take place. In addition, the companies apply<strong>in</strong>g carbon<br />
footpr<strong>in</strong>t based on the PCRs previously developed by the pioneer<strong>in</strong>g companies do not have any disagreement<br />
issues y<strong>et</strong>, so these can still be used for a while.<br />
3.2. Contents of PCRs<br />
3.2.1. Scope of PCRs<br />
At the beg<strong>in</strong>n<strong>in</strong>g, rice and chicken were selected for develop<strong>in</strong>g the national PCRs to test the approach<br />
used <strong>in</strong> <strong>in</strong>dividual product-based PCRs. Rice was of special <strong>in</strong>terest as it is a ma<strong>in</strong> product for Thailand and<br />
the data sources of emission factors from rice fields affect the results significantly. Chicken was another<br />
product selected as it is ma<strong>in</strong>ly exported to EU countries which are active on carbon footpr<strong>in</strong>t<strong>in</strong>g and labell<strong>in</strong>g.<br />
Moreover, the manufacturers of these two products have been proactive <strong>in</strong> adopt<strong>in</strong>g carbon footpr<strong>in</strong>t<strong>in</strong>g.<br />
Later on, the scope of PCRs of agri-food products was discussed and it was found that each sector has its<br />
own characteristics and should not be considered at the sub-sectorial rather than sectorial level such as Fruit<br />
& Veg<strong>et</strong>ables, Livestock, and Aquatic products. With<strong>in</strong> each sub-sector, both non-processed and processed<br />
products should be considered as the processed products would require the raw materials such as fresh fruits<br />
and veg<strong>et</strong>ables so it is best to deal with the PCR issues tog<strong>et</strong>her. It should be noted here that it is generally<br />
agreed that processed food products with multiple <strong>in</strong>gredients (i.e. veg<strong>et</strong>able, meat, coconut milk, <strong>et</strong>c.)<br />
should be considered <strong>in</strong> a separate PCR but can refer to the related parts <strong>in</strong> PCRs of Fruit & Veg<strong>et</strong>ables,<br />
Livestock, and Aquatic products as required. Meat, milk and egg are considered livestock products, whereas<br />
products from fisheries and aquaculture (from fresh, brackish and sea water) activities are reflected <strong>in</strong><br />
aquatic products.<br />
3.2.2 System boundary<br />
It is generally accepted that the system boundary should cover all life cycle stages <strong>in</strong>clud<strong>in</strong>g at the po<strong>in</strong>t<br />
of sale (e.g. chilled storage), pre-consumption (e.g. household storage), consumption (e.g. cook<strong>in</strong>g), and<br />
post-consumption (e.g. food and packag<strong>in</strong>g waste disposal). This is not so for the case of food <strong>in</strong>gredients as<br />
they are only a composition of other food products <strong>in</strong> the forms of dish or meal (Mungkung <strong>et</strong> al., 2010a). It<br />
is also important that the assumptions for po<strong>in</strong>t of sale, pre-consumption, consumption and post-consumption<br />
are on the same basis for the same food products. The assumption at po<strong>in</strong>t of sale is based on the turn-over<br />
rate <strong>in</strong> the real situation. The storage prior to cook<strong>in</strong>g or pre-consumption is def<strong>in</strong>ed based on a standard<br />
scenario. As of now, the use profile is def<strong>in</strong>ed accord<strong>in</strong>g to the <strong>in</strong>structions given by producer on the labels<br />
as there is no such data available <strong>in</strong> ISO 14025 as well as the Thai Green Labell<strong>in</strong>g scheme (Ecolabel Type<br />
1). A standard scenario is also applied for the f<strong>in</strong>al waste disposal (assum<strong>in</strong>g there is no food waste, and<br />
packag<strong>in</strong>g waste is totally landfilled). It is worth mention<strong>in</strong>g here that emissions from the office, prototype,<br />
research and development, quality assurance and control, consumer’s travell<strong>in</strong>g are not <strong>in</strong>cluded.<br />
In more d<strong>et</strong>ails, these activities should be <strong>in</strong>cluded: land preparation (prior the crop production), seed<br />
preparation (such as soak<strong>in</strong>g <strong>in</strong> water, acclimatisation <strong>in</strong> pond, <strong>et</strong>c.), chemicals (such as fertiliser, hormones,<br />
herbicides, v<strong>et</strong>er<strong>in</strong>ary drugs, <strong>et</strong>c.), feed, substrate materials, soil cover<strong>in</strong>g materials, packag<strong>in</strong>g and consumables<br />
for ma<strong>in</strong>tenance of capital goods. The activities that should be excluded are: <strong>in</strong>frastructure, equipment,<br />
and mach<strong>in</strong>es. Direct land use change is <strong>in</strong>cluded, but at the beg<strong>in</strong>n<strong>in</strong>g only for crop production (not all land<br />
use changes) and only 20 years back to the date of implement<strong>in</strong>g the carbon footpr<strong>in</strong>t<strong>in</strong>g. Though it is understood<br />
that the effects of land use change on GHG emissions is enormous, the <strong>in</strong>dustry still feels that develop<strong>in</strong>g<br />
countries will have a major problem due to the lack of support<strong>in</strong>g data.<br />
3.2.3. Product description<br />
The <strong>in</strong>formation of product name, brand name, and quality rank<strong>in</strong>g accord<strong>in</strong>g to the national standard def<strong>in</strong>ed<br />
<strong>in</strong> the Thailand Agriculture Standard (TAS) documents is required <strong>in</strong> describ<strong>in</strong>g the product. All auxiliaries<br />
<strong>in</strong>cluded <strong>in</strong> the f<strong>in</strong>ished product be<strong>in</strong>g sold must also be considered. A practical issue raised by the<br />
<strong>in</strong>dustry is related to the number of agri-food products which can be classified <strong>in</strong>to some thousands at the<br />
SKU (Stock-Keep<strong>in</strong>g Unit) level. The <strong>in</strong>dustry echoed that the associated costs (for consultancy service,<br />
verification and license) could be a barrier especially for SMEs (Small and Medium Enterprises). In this<br />
connection, to promote the adoption of carbon footpr<strong>in</strong>t label, product group<strong>in</strong>g is allowed for the sake of<br />
cost reduction for the license (<strong>in</strong>dividual carbon footpr<strong>in</strong>t value is still applied for each product across the<br />
whole product group), as follows:<br />
453
PARALLEL SESSION 5A: FOOD LABELLING 8 th Int. Conference on <strong>LCA</strong> <strong>in</strong> the<br />
Agri-<strong>Food</strong> Sector, 1-4 Oct <strong>2012</strong><br />
Table 1. Example of product groups<br />
Feature Non-processed food Processed food<br />
Same product, different tastes - Sterilised full-cream milk (choco- - Chicken snack <strong>in</strong> 110,<br />
late, p<strong>in</strong>eapple, lychee, lemon taste) 250, 500 grams<br />
Same product, different sizes - Canned sliced p<strong>in</strong>eapple <strong>in</strong> 8, 16, - Instant noodles <strong>in</strong> 55, 85,<br />
20 ounces’ pack<br />
210 grams’ pack<br />
Same product, with at least 90% of<br />
- Instant noodles <strong>in</strong> differ-<br />
the total weight be<strong>in</strong>g the same and<br />
ent flavours (tom yum<br />
the rest of the <strong>in</strong>gredients will not<br />
kung, m<strong>in</strong>ced pork, roasted<br />
cause a difference <strong>in</strong> the total carbon<br />
footpr<strong>in</strong>t value of more than 5%<br />
duck, <strong>et</strong>c.)<br />
3.2.4. Functional unit<br />
It is generally agreed at the conceptual level that the unit of analysis should not be the sold unit but reflect<strong>in</strong>g<br />
the functional unit of product. The discussion on the function of food has not y<strong>et</strong> been s<strong>et</strong>tled; there<br />
is not y<strong>et</strong> a common consensus on which unit would be the best choice to facilitate the product comparison.<br />
The nutrition level received a wide debate, especially the edible prote<strong>in</strong> from different types of meat which<br />
could favour one product over another. For <strong>in</strong>stance, the carbon footpr<strong>in</strong>t of tilapia will be much lower than<br />
other meat sources if the functional unit is based on the content of edible prote<strong>in</strong> (Table 2). More importantly,<br />
whereas the whole fish is eaten <strong>in</strong> Asian countries, <strong>in</strong> Europe, people prefer hav<strong>in</strong>g only the fill<strong>et</strong>s; the<br />
functional unit based on whole fish and fill<strong>et</strong> cannot be compared <strong>in</strong> this case. For livestock, the proposed<br />
unit is the standard unit <strong>in</strong> terms of volume or mass, e.g. meat <strong>in</strong> 1 kg, milk <strong>in</strong> 1 litre and egg is per egg accord<strong>in</strong>g<br />
to their size and weight based on the national standard.<br />
Table 2. Comparison of different meats with tilapia, at the farm gate, based on different functional unit<br />
Aquatic products<br />
Carbon footpr<strong>in</strong>t value Carbon footpr<strong>in</strong>t value<br />
(Reference)<br />
(kg CO2e/250 g of live weight) (kg CO2e/100 g of prote<strong>in</strong>)<br />
Thai tilapia<br />
(Tessa and Mungkung, 2011)<br />
0.55 0.92<br />
French trout<br />
(Papatryphon <strong>et</strong> al., 2003)<br />
1.13 2.20<br />
Canadian salmon<br />
(Pell<strong>et</strong>ier <strong>et</strong> al., 2009)<br />
0.82 1.65<br />
Norwegian salmon<br />
(Ell<strong>in</strong>gsen <strong>et</strong> al., 2009)<br />
0.75 1.51<br />
3.2.5. Data collection<br />
The focus of companies was around the issues of data collection, such as the primary and secondary data<br />
requirements (i.e. which ones should be collected directly and which ones sourced from literature). The difficulties<br />
<strong>in</strong> data collection <strong>in</strong> the field vary due to different levels of data record<strong>in</strong>g systems <strong>in</strong> place. The companies<br />
with proper data record<strong>in</strong>g systems see this as an advantage; while those with poor data record<strong>in</strong>g<br />
systems see this as the way out to easily substitute with the secondary data. The quality of primary and secondary<br />
data was discussed at length, as the <strong>in</strong>dustry is concerned about this. It can happen that the secondary<br />
data has b<strong>et</strong>ter quality than primary data or vice versa. This is particularly of concern among Thai food companies<br />
as the food database is be<strong>in</strong>g developed and it is <strong>in</strong> a very early stage of development; as a result, several<br />
substitute data are used when there is no related database; this could be a disadvantage as compared to<br />
the countries where the databases are well developed.<br />
454
PARALLEL SESSION 5A: FOOD LABELLING 8 th Int. Conference on <strong>LCA</strong> <strong>in</strong> the<br />
Agri-<strong>Food</strong> Sector, 1-4 Oct <strong>2012</strong><br />
Table 3. Stepwise sampl<strong>in</strong>g rule<br />
Data type Agri-food products<br />
Primary data (if it is the direct<br />
activity of implement<strong>in</strong>g<br />
company)<br />
Secondary data (if it is the<br />
<strong>in</strong>direct activity of implement<strong>in</strong>g<br />
company)<br />
Fruit & Veg<strong>et</strong>ables Livestock Aquatic<br />
(1) Number of farms cover<strong>in</strong>g at least 50% of the raw materials used for<br />
annual production;<br />
(2) If the number of farms is huge and (1) is not practicable, then sampl<strong>in</strong>g<br />
based on square root of the total number of farms can be used (with the<br />
justification after analys<strong>in</strong>g the variation among farms);<br />
(1) Identify the sources of raw materials cover<strong>in</strong>g<br />
at least 50% of the raw materials used for annual<br />
production;<br />
(2) Apply the <strong>in</strong>puts and outputs based on a typical<br />
practice <strong>in</strong> a particular area at the prov<strong>in</strong>cial<br />
level) <strong>in</strong>clud<strong>in</strong>g yield suggested by the Department<br />
of Agriculture; an adjusted yield (the average<br />
yield from previous 3 years) should be used if<br />
the yield is affected by unusual seasonal factors<br />
at the time of implement<strong>in</strong>g the carbon footpr<strong>in</strong>t<br />
(1) Obta<strong>in</strong> from the<br />
national databases,<br />
which were sourced<br />
from the literature<br />
(Thailand context)<br />
The duration of data collection is generally acceptable to be based on annual production for fruits and<br />
veg<strong>et</strong>ables, or over the life span of animal produc<strong>in</strong>g milk or eggs (but if they are predisposed before reach<strong>in</strong>g<br />
its life span then the data collection should be f<strong>in</strong>ished by then). But if the yield is fluctuat<strong>in</strong>g more than<br />
10%, then it is reasonable to use the data over 3 years of production to capture the variation to achieve good<br />
representative data.<br />
3.2.6. Allocation m<strong>et</strong>hod<br />
For the allocation of carbon footpr<strong>in</strong>t b<strong>et</strong>ween co-products, physical causality as recommended by<br />
ISO14046:2006 was found to be the most appropriate. Thus, as shown <strong>in</strong> Table 4, for most cases, allocation<br />
by mass has been selected. Only for certa<strong>in</strong> cases of by-products which might almost have been considered<br />
waste but have been def<strong>in</strong>ed now as co-products as some economic value could be obta<strong>in</strong>ed by sell<strong>in</strong>g them,<br />
economic allocation is proposed.<br />
Table 4. Example of discussed allocation m<strong>et</strong>hods<br />
Agri-food product Level Product & Co-products Allocation m<strong>et</strong>hod<br />
Fruit & veg<strong>et</strong>able Farm<strong>in</strong>g Different quality levels/grades Mass<br />
Process<strong>in</strong>g Body, core and shells Economic (if used as the<br />
raw material for another<br />
product system)<br />
Livestock Farm<strong>in</strong>g Different sizes of chicken Mass (whole body)<br />
Slaughter<strong>in</strong>g Different portions or parts of chicken Mass (with bone)<br />
meat<br />
Body and offal-skel<strong>et</strong>on-blood-feathers Economic<br />
Process<strong>in</strong>g Used cook<strong>in</strong>g oil (used for biodiesel) Carbon footpr<strong>in</strong>t value = 0<br />
Aquatic Farm<strong>in</strong>g Different sizes of fish Mass (whole body)<br />
Process<strong>in</strong>g Fill<strong>et</strong> and bone-sk<strong>in</strong> Economic<br />
Body and head-shell Economic<br />
3.2.7. Materiality and cut-off rules<br />
Materiality is def<strong>in</strong>ed based on a value of 1% of the total carbon footpr<strong>in</strong>t. Items contribut<strong>in</strong>g lesser than<br />
1% of the total carbon footpr<strong>in</strong>t can be cut off, but the cut-off must not be higher than 5% of the total carbon<br />
footpr<strong>in</strong>t. This is consistent with other national standards such as PAS 2050 (UK) and TS Q0010 (Japan).<br />
3.2.8. Display of carbon footpr<strong>in</strong>t label<br />
The companies proposed an idea to have a logo of the carbon footpr<strong>in</strong>t label without display<strong>in</strong>g a figure,<br />
but hav<strong>in</strong>g a commitment to reduce the value when extend<strong>in</strong>g the license. This implies that the verifier and<br />
455
PARALLEL SESSION 5A: FOOD LABELLING 8 th Int. Conference on <strong>LCA</strong> <strong>in</strong> the<br />
Agri-<strong>Food</strong> Sector, 1-4 Oct <strong>2012</strong><br />
the authority body must ensure that the carbon footpr<strong>in</strong>t calculation is done accord<strong>in</strong>g to the national guidel<strong>in</strong>e<br />
and the carbon footpr<strong>in</strong>t value reduces from the previous time.<br />
3.2.9. Period of license<br />
It is generally agreed to have the carbon footpr<strong>in</strong>t label valid for 2 years. As a consequence, it has been<br />
decided to update the databases once every two years accord<strong>in</strong>gly.<br />
4. Outlook<br />
It is agreed <strong>in</strong> pr<strong>in</strong>ciple that PCRs are necessary for def<strong>in</strong><strong>in</strong>g the additional requirements for specific<br />
products or group of products to facilitate the product comparison. However, it should be discussed at the<br />
<strong>in</strong>ternational level wh<strong>et</strong>her these should be sector-based or <strong>in</strong>dividual product-based. There is a great concern<br />
over the standardisation of PCRs at global scale as some countries might have developed their own PCRs,<br />
for <strong>in</strong>stance, the UK (i.e. Supplementary requirement of horticultural products), Japan (PCR of veg<strong>et</strong>ables<br />
and fruits) and Thailand (PCR of Fruit & Veg<strong>et</strong>ables, PCR of Livestock products and PCR of Aquatic products)<br />
<strong>in</strong> their own systems which could be a barrier <strong>in</strong> compar<strong>in</strong>g b<strong>et</strong>ween products from two countries. It is<br />
foreseen that some common pr<strong>in</strong>ciples can be <strong>in</strong> agreement while some issues will still need more discussion<br />
for standardisation. Limitations of available food databases or related literature particularly <strong>in</strong> develop<strong>in</strong>g<br />
countries <strong>in</strong>clud<strong>in</strong>g Thailand will become one of the ma<strong>in</strong> difficulties. Apart from that, it is noticeable that<br />
various schemes: carbon score, carbon emission rate, low carbon emission level, or carbon neutral have been<br />
applied; this can be confus<strong>in</strong>g to consumers regard<strong>in</strong>g the conveyed message and understand<strong>in</strong>g on the contributions<br />
to GHG reduction by each scheme. Carbon footpr<strong>in</strong>t<strong>in</strong>g and labell<strong>in</strong>g should be appreciated by<br />
both manufacturers and consumers, thus the ease of adopt<strong>in</strong>g the m<strong>et</strong>hodologies and the simple message to<br />
deliver via carbon footpr<strong>in</strong>t labell<strong>in</strong>g should be the core elements.<br />
5. References<br />
Ell<strong>in</strong>gsen, H., Olaussen, J.O., Utne, I.B., 2009. Environmental analysis of the Norwegian fishery and aquaculture <strong>in</strong>dustry – A prelim<strong>in</strong>ary<br />
study focus<strong>in</strong>g on farmed salmon. Mar Policy. 33, 479–488.<br />
Gheewala, S.H., Mungkung, R., <strong>2012</strong>. <strong>Food</strong> and Climate Change: FOODpr<strong>in</strong>t as a tool to support GHG reduction <strong>in</strong> the Thai agrifood<br />
sector. Poster presented at the 8th International Conference on <strong>LCA</strong> <strong>in</strong> the Agri-<strong>Food</strong> Sector, Rennes, <strong>France</strong>, 2-4 October<br />
<strong>2012</strong>.<br />
Mungkung, R., Gheewala, S.H., Kanyarushoki, C., Hospido, A., van der Werf, H., Poovarodom, N., Bonn<strong>et</strong>, S., Aub<strong>in</strong>, J., Moreira,<br />
M.T., Feijoo, G. 2010. Product carbon footpr<strong>in</strong>t<strong>in</strong>g <strong>in</strong> Thailand: A step towards susta<strong>in</strong>able consumption and production?, Environmental<br />
Development 3, 100-108.<br />
Mungkung, R., Gheewala, S., Poovarodom, N., Towprayoon, S. 2010a. Carbon Footpr<strong>in</strong>t and Label for Rice Products [<strong>in</strong> Thai].<br />
S.P.M. Pr<strong>in</strong>t<strong>in</strong>g Co., Ltd., Bangkok, Thailand. 83 p.<br />
Mungkung R., Gheewala, S., Bonn<strong>et</strong>, S., Hospido, A., Kanyarushoki, C., van der Werf, H. and Poovarodom, N. 2010b. Carbon Footpr<strong>in</strong>t<strong>in</strong>g<br />
and Labell<strong>in</strong>g: Experiences from the Thai food <strong>in</strong>dustry Available onl<strong>in</strong>e: http://www.thaicarbonlabel.sci.ku.ac.th/<br />
Papatryphon, E., P<strong>et</strong>it, J., Van der Werf, H.M.G., Kaushik, S.J., 2003. Life cycle assessment of trout farm<strong>in</strong>g <strong>in</strong> <strong>France</strong>: A farm level<br />
approach. Proceed<strong>in</strong>gs from the 4th International Conference, October 6-8, 2003, Bygholm, Denmark.<br />
Pell<strong>et</strong>ier, N., Tyedmers, P., Sonesson, U., Scholz, A., Ziegler, F., Flysjo, A., Kruse, S., Canc<strong>in</strong>o, B., Silverman, H., 2009. Not All<br />
Salmon Are Created Equal: Life Cycle Assessment (<strong>LCA</strong>) of Global Salmon Farm<strong>in</strong>g Systems. Environ Sci Technol. 43, 8730-<br />
8736.<br />
Tessa, J., Mungkung, R., 2011. Carbon footpr<strong>in</strong>t<strong>in</strong>g of tilapia from monoculture <strong>in</strong> cage and polyculture <strong>in</strong> pond. Proceed<strong>in</strong>gs 5th<br />
SWU conference, 17-18 March 2011, Bangkok, Thailand.<br />
456
PARALLEL SESSION 5B: METHODOLOGICAL CHALLENGES FOR CROP PRODUCTION SYSTEMS 8 th Int. Conference on<br />
<strong>LCA</strong> <strong>in</strong> the<br />
Agri-<strong>Food</strong> Sector, 1-4 Oct <strong>2012</strong><br />
Characteris<strong>in</strong>g pesticide residues and related health impacts <strong>in</strong> LCIA<br />
Parallel session 5b: M<strong>et</strong>hodological Challenges for Crop Production Systems<br />
Ronnie Juraske 1 , P<strong>et</strong>er Fantke 2 , Assumpció Antón 3 , Eva Sevigné Itoiz 3 , Olivier Jolli<strong>et</strong> 4,5<br />
1 ETH Zurich, Schafmattstrasse 6, CH-8093 Zurich, Switzerland<br />
2 University of Stuttgart, Hessbrühlstrasse 49a, 70565 Stuttgart, Germany<br />
3 Institute of Agriculture and <strong>Food</strong> Research and Technology, 08348 Cabrils, Barcelona, Spa<strong>in</strong><br />
4 University of Michigan, 109 S. Observatory, Ann Arbor, Michigan 48109-2029, United States<br />
5 Quantis, EPFL Science Park (PSE-D), CH-1015 Lausanne, Switzerland<br />
Correspond<strong>in</strong>g author. E-mail: juraske@ifu.baug.<strong>et</strong>hz.ch<br />
ABSTRACT<br />
Multiple pathways contribute to the exposure of the general population to pesticides, such as <strong>in</strong>halation and <strong>in</strong>gestion <strong>in</strong>take of applied<br />
fractions undergo<strong>in</strong>g w<strong>in</strong>d-drift, runoff, and leach<strong>in</strong>g, but the most important pathway be<strong>in</strong>g consumption of fractions directly<br />
reach<strong>in</strong>g the treated food crops. However, health impacts of pesticides from food consumption are still poorly represented <strong>in</strong> exist<strong>in</strong>g<br />
Life Cycle Impact Assessment (LCIA) approaches. In addition, pesticide uptake and translocation mechanisms vary considerably<br />
b<strong>et</strong>ween crop species and may demonstrate significant differences <strong>in</strong> related health impacts as discussed <strong>in</strong> Fantke <strong>et</strong> al., (2011a).<br />
Therefore, assess<strong>in</strong>g pesticide residues <strong>in</strong> multiple crops plays an important role <strong>in</strong> the evaluation of current agricultural practice. In<br />
light of this, a new dynamic plant uptake model – dynamiCROP – was designed to assess the dynamics of pesticide residues <strong>in</strong> different<br />
crops and to characterise the related human <strong>in</strong>take of these residues via consumption of harvested crop components.<br />
The model, which is fully described <strong>in</strong> Fantke <strong>et</strong> al., (2011b), is based on a flexible s<strong>et</strong> of <strong>in</strong>terconnected compartments (Fig. 1) and is<br />
customised to wheat, paddy rice, tomato, apple, l<strong>et</strong>tuce, and potato, thereby account<strong>in</strong>g for the major mass fraction of worldwide<br />
human plant-based di<strong>et</strong>. Modelled residues are evaluated aga<strong>in</strong>st residues measured <strong>in</strong> experimental studies, such as Itoiz <strong>et</strong> al., <strong>2012</strong><br />
for l<strong>et</strong>tuce. Furthermore, the function<strong>in</strong>g of the underly<strong>in</strong>g dynamical system was analysed to estimate the model <strong>in</strong>put uncerta<strong>in</strong>ty<br />
and to param<strong>et</strong>erise the complex system for use <strong>in</strong> spatial or nested multimedia assessment models currently applied <strong>in</strong> LCIA (Fantke<br />
<strong>et</strong> al., <strong>2012</strong>). The param<strong>et</strong>erised crop-specific models are adequate to assess pesticide residues <strong>in</strong> crops and enable the user to calculate<br />
these residues by provid<strong>in</strong>g only a very small s<strong>et</strong> of <strong>in</strong>put data.<br />
F<strong>in</strong>ally, human <strong>in</strong>take fractions (Fig. 2) are connected to effect <strong>in</strong>formation for characteris<strong>in</strong>g human health impacts. When comb<strong>in</strong>ed<br />
with substance-specific pesticide application statistics, absolute impacts per considered land use area can be estimated and compared<br />
to other <strong>LCA</strong> endpo<strong>in</strong>ts. Human <strong>in</strong>take fractions, effect and characterisation factors (CFs) are provided for use <strong>in</strong> LCIA for 726<br />
substance-crop comb<strong>in</strong>ations. CFs were calculated for 121 pesticides applied to the six crops and were 1 to 5 orders of magnitude<br />
higher than factors estimated from fractions lost via w<strong>in</strong>d-drift, runoff and leach<strong>in</strong>g. Human health impacts vary up to 9 orders of<br />
magnitude b<strong>et</strong>ween crops and 10 orders b<strong>et</strong>ween pesticides. Ma<strong>in</strong> aspects <strong>in</strong>fluenc<strong>in</strong>g the fate behaviour of pesticides were identified<br />
as half-life <strong>in</strong> plants and on plant surfaces, residence time <strong>in</strong> soil as well as time b<strong>et</strong>ween pesticide application and harvest.<br />
Figure 1. Graphical representation of model s<strong>et</strong>up consist<strong>in</strong>g of environmental compartments and processes<br />
with<strong>in</strong>/b<strong>et</strong>ween compartments.<br />
457
PARALLEL SESSION 5B: METHODOLOGICAL CHALLENGES FOR CROP PRODUCTION SYSTEMS8 th Int. Conference on <strong>LCA</strong> <strong>in</strong> the<br />
Agri-<strong>Food</strong> Sector, 1-4 Oct <strong>2012</strong><br />
Figure 2. Intake fractions from consumption of pesticide residues for 121 substances applied to 6 food crops<br />
at different times to harvest ∆t and from fractions undergo<strong>in</strong>g w<strong>in</strong>d-drift, runoff and leach<strong>in</strong>g under steady<br />
state conditions as calculated with USEtox (www.us<strong>et</strong>ox.org).<br />
References<br />
Fantke P, Charles R, de Alencastro LF, Friedrich R, Jolli<strong>et</strong> O. 2011b. Plant uptake of pesticides and human health: Dynamic model<strong>in</strong>g<br />
of residues <strong>in</strong> wheat and <strong>in</strong>gestion <strong>in</strong>take. Chemosphere 85: 1639-1647.<br />
Fantke P, Juraske R, Antón A, Friedrich R, Jolli<strong>et</strong> O. 2011a. Dynamic multicrop model to characterise impacts of pesticides <strong>in</strong> food.<br />
Environ. Sci. Technol. 45: 8842-8849.<br />
Fantke, P., Wieland, P., Wannaz, C., Friedrich, R., Jolli<strong>et</strong>, O., <strong>2012</strong>. Dynamics of pesticide uptake <strong>in</strong>to plants: From system function<strong>in</strong>g<br />
to parsimonious model<strong>in</strong>g. Environ. Modell. Softw. (submitted)<br />
Itoiz, E.S., Fantke, P., Juraske, R., Koun<strong>in</strong>a, A., Vallejo, A.A., <strong>2012</strong>. Deposition and residues of azoxystrob<strong>in</strong> and imidacloprid on<br />
greenhouse l<strong>et</strong>tuce with implications for human consumption. Chemosphere. (submitted)<br />
458
PARALLEL SESSION 5B: METHODOLOGICAL CHALLENGES FOR CROP PRODUCTION SYSTEMS 8 th Int. Conference on<br />
<strong>LCA</strong> <strong>in</strong> the<br />
Agri-<strong>Food</strong> Sector, 1-4 Oct <strong>2012</strong><br />
Bridg<strong>in</strong>g the gap b<strong>et</strong>ween LCI and LCIA for toxicological assessments<br />
of pesticides used <strong>in</strong> crop production: application to banana grow<strong>in</strong>g<br />
Rosalie van Zelm 1 , Pyrene Larrey-Lassalle 2,* , Philippe Roux 2<br />
1<br />
Department of Environmental Science, Institute for Water and W<strong>et</strong>land Research, Radboud University Nijmegen, P.O. Box 9010,<br />
6500 GL Nijmegen, The N<strong>et</strong>herlands<br />
2<br />
Cemagref/Irstea, Research Unit: Information & Technologies for Agro-processes, 361 rue JF Br<strong>et</strong>on, 34196 Montpellier, <strong>France</strong><br />
Correspond<strong>in</strong>g author. E-mail: p.larrey-lassalle@irstea.fr<br />
ABSTRACT<br />
In Life Cycle Assessment (<strong>LCA</strong>), the Life Cycle Inventory (LCI) provides emission data for the various environmental compartments<br />
and subsequently Life Cycle Impact Assessment (LCIA) d<strong>et</strong>erm<strong>in</strong>es the f<strong>in</strong>al distribution, fate and effects of substances such as<br />
pesticides. Given the overlap b<strong>et</strong>ween the Technosphere (the studied anthropogenic system) and the Ecosphere (the natural environment)<br />
<strong>in</strong> agricultural case studies, it is, difficult to establish what LCI needs to capture with respect to degradation and partition<strong>in</strong>g of<br />
the pesticides <strong>in</strong> air, water and soil at the local scale. While evaluat<strong>in</strong>g the partition<strong>in</strong>g of the emitted substances, <strong>LCA</strong> practitioners<br />
must keep <strong>in</strong> m<strong>in</strong>d that human toxicity and ecotoxicity models used <strong>in</strong> LCIA also <strong>in</strong>clude <strong>in</strong>ter compartment transfers, fate, and<br />
degradation mechanisms at larger temporal and spatial scales such as long-range transmission of air pollutants at regional, cont<strong>in</strong>ental,<br />
and global scale (Fig. 1).<br />
Up to now, <strong>LCA</strong> practitioners have been us<strong>in</strong>g several hypotheses to build agricultural <strong>in</strong>ventories. For example, the application of a<br />
regional or global scale model of substance transfers <strong>in</strong> the LCI phase (<strong>in</strong>duc<strong>in</strong>g an overlapp<strong>in</strong>g with LCIA models), or the application<br />
of a simplified approach assum<strong>in</strong>g that pesticide emissions are entirely emitted to the soil compartment, or 85% is emitted to<br />
soil, 5% to crops and 10% to air (Audsley <strong>et</strong> al., 1997; Margni <strong>et</strong> al., 2002) are commonly used. To date, no clear dist<strong>in</strong>ction nor<br />
guidance are provided on how to comb<strong>in</strong>e LCI and LCIA models with respect to toxicological assessments of pesticides applied <strong>in</strong><br />
agriculture.<br />
This paper aims to provide guidance to b<strong>et</strong>ter def<strong>in</strong>e the boundaries <strong>in</strong> space and time b<strong>et</strong>ween what should be <strong>in</strong>cluded <strong>in</strong> LCI and<br />
where LCIA takes over. A literature review was undertaken on available m<strong>et</strong>hods and models for both LCI (e.g. Birkved and<br />
Hauschild, 2006) and LCIA (e.g. Rosenbaum <strong>et</strong> al., 2008) with a special focus on toxicological assessments of pesticides used <strong>in</strong><br />
crop production. The relevant biophysical phenomena are identified (Fig. 2) and guidel<strong>in</strong>es are proposed to overcome the gaps b<strong>et</strong>ween<br />
LCI and LCIA as well as to harmonise further comparisons of agricultural <strong>LCA</strong> results.<br />
To complement these recommendations a case study on bananas is presented to i) characterise the current gap b<strong>et</strong>ween LCI and<br />
LCIA, and ii) demonstrate the application of the proposed solution to the current <strong>LCA</strong> approach. From this case study, it is clear that<br />
impact assessment results for both human health and ecosystems are strongly <strong>in</strong>fluenced by the LCI hypotheses. The LCI hypotheses<br />
<strong>in</strong>volv<strong>in</strong>g either <strong>in</strong>adequate model scales, or a too simplistic LCI, or non-equilibrated balances lead to an underestimation of up to a<br />
factor of 5.<br />
Figure 1. Overview of the 4 <strong>LCA</strong> phases of pesticides used <strong>in</strong> agricultural crop production highlight<strong>in</strong>g an<br />
overlapp<strong>in</strong>g b<strong>et</strong>ween LCI & LCIA.<br />
459
PARALLEL SESSION 5B: METHODOLOGICAL CHALLENGES FOR CROP PRODUCTION SYSTEMS8 th Int. Conference on <strong>LCA</strong> <strong>in</strong> the<br />
Agri-<strong>Food</strong> Sector, 1-4 Oct <strong>2012</strong><br />
Figure 2. Proposed system boundary for LCI and associated mechanisms from pesticide spray<strong>in</strong>g to emissions<br />
<strong>in</strong> air, soil and water.<br />
References<br />
Audsley, E., Alber, S., Clift, R., Cowell, S., Cr<strong>et</strong>taz, P., Gaillard, G., Hausheer, J., Jolli<strong>et</strong>, O., Kleijn, R.,<br />
Mortensen, B., Pearce, D., Roger, E., Teulon, H., Weidema, B., Van Zeijts, H., 1997. Harmonisation of<br />
environmental life cycle assessment for agriculture. F<strong>in</strong>al Report Concerted Action AIR3-CT94-2028,<br />
European Commission DG VI Agriculture<br />
Birkved, M., Hauschild, M.Z., 2006. PestLCI - A model for estimat<strong>in</strong>g field emissions of pesticides <strong>in</strong> agricultural<br />
<strong>LCA</strong>. Ecol. Model. 198, 433-451.<br />
Margni, M., Rossier, D., Cr<strong>et</strong>taz, P., Jolli<strong>et</strong>, O., 2002. Life cycle impact assessment of pesticides on human<br />
health and ecosystems. Agr. Ecosyst. Environ. 93, 379-392.<br />
Rosenbaum, R.K., Bachmann, T.M., Swirsky Gold, L., Huijbregts M.A.J., Jolli<strong>et</strong>, O., Juraske, R., Koehler,<br />
A., Larsen, H.F., Macleod, M., Margni, M., McKone, T.E., Pay<strong>et</strong>, J., Schuhmacher, M., Van de Meent, D.,<br />
Hauschild, M.Z., 2008. USEtox—The UNEP-SETAC toxicity model: recommended characterisation factors<br />
for human toxicity and freshwater ecotoxicity <strong>in</strong> Life Cycle Impact Assessment. Int. J. <strong>LCA</strong> 13, 532-<br />
546.<br />
460
PARALLEL SESSION 5B: METHODOLOGICAL CHALLENGES FOR CROP PRODUCTION SYSTEMS 8 th Int. Conference on<br />
<strong>LCA</strong> <strong>in</strong> the<br />
Agri-<strong>Food</strong> Sector, 1-4 Oct <strong>2012</strong><br />
Allocation challenges <strong>in</strong> agricultural life cycle assessments and the<br />
Cereal Unit allocation procedure as a potential solution<br />
Gerhard Brankatschk * , Matthias F<strong>in</strong>kbe<strong>in</strong>er<br />
Technische Universität Berl<strong>in</strong>, Germany<br />
Correspond<strong>in</strong>g author. E-mail: Gerhard.Brankatschk@tu-berl<strong>in</strong>.de<br />
ABSTRACT<br />
For agricultural life cycle assessments (<strong>LCA</strong>) several different allocation approaches are currently used. This leads to a broad range<br />
of uncerta<strong>in</strong>ty <strong>in</strong> <strong>LCA</strong> results (Curran, 2008; Gnansounou <strong>et</strong> al., 2009; Kim and Dale, 2002; S<strong>in</strong>gh <strong>et</strong> al., 2010). ISO 14040 and<br />
14044 give guidance on how to deal with allocation situations, but they offer a hierarchy of choices rather than a particular m<strong>et</strong>hod<br />
(F<strong>in</strong>kbe<strong>in</strong>er <strong>et</strong> al., 2006; ISO, 2006a, b). Specific requirements for an agricultural allocation m<strong>et</strong>hod were def<strong>in</strong>ed and used to test<br />
different allocation approaches. The Cereal Unit was identified as a promis<strong>in</strong>g denom<strong>in</strong>ator for an agricultural allocation procedure.<br />
Its calculation is ma<strong>in</strong>ly based on nutritive properties for animal feed<strong>in</strong>g. It can be applied to all agricultural products. A new allocation<br />
approach for agricultural <strong>LCA</strong>s, based on the Cereal Unit, is suggested. This approach could help to solve agricultural allocation<br />
problems and might lead to more robust <strong>LCA</strong> results for services and products orig<strong>in</strong>ated from agricultural raw materials.<br />
Keywords: life cycle assessment, m<strong>et</strong>hodology, allocation, agriculture, by-product<br />
1. Introduction<br />
In recent years the need for the quantification of the environmental impact of products and services has<br />
grown rapidly. This is expressed by <strong>in</strong>creased communication and public awareness about environmental<br />
footpr<strong>in</strong>ts, such as product carbon footpr<strong>in</strong>ts (F<strong>in</strong>kbe<strong>in</strong>er, 2009), <strong>in</strong> addition to full <strong>LCA</strong>s. One risk<br />
associated with this positive development is the fact that most consumers and policy makers are not fully<br />
aware of the uncerta<strong>in</strong>ty of <strong>LCA</strong> results related to m<strong>et</strong>hodological choices. Driven by the carbon footpr<strong>in</strong>t<br />
discussion, <strong>LCA</strong> <strong>in</strong> agriculture has ga<strong>in</strong>ed <strong>in</strong>creas<strong>in</strong>g <strong>in</strong>terest. There are several m<strong>et</strong>hodological<br />
particularities and challenges for agricultural <strong>LCA</strong>s. Here we focus on the issue of co-product allocation<br />
from agricultural systems.<br />
1.1. Different allocation m<strong>et</strong>hods as a source of uncerta<strong>in</strong>ty <strong>in</strong> agricultural <strong>LCA</strong>s and the need for a new allocation<br />
approach<br />
Different approaches for co-product allocation are one major reason for the uncerta<strong>in</strong>ty <strong>in</strong> <strong>LCA</strong> results<br />
related to m<strong>et</strong>hodological choices (Curran, 2008; Gnansounou <strong>et</strong> al., 2009; Kim and Dale, 2002; S<strong>in</strong>gh <strong>et</strong> al.,<br />
2010) To solve the allocation problem, various strategies have been developed, but none is compl<strong>et</strong>ely<br />
satisfy<strong>in</strong>g (Klöpffer and Grahl, 2009).<br />
Agricultural <strong>LCA</strong>s are particularly error-prone, because allocation often takes place several times. The<br />
errors <strong>in</strong>troduced by each allocation step propagate. Us<strong>in</strong>g different allocation m<strong>et</strong>hods, Luo <strong>et</strong> al., (2009)<br />
compare environmental effects of gasol<strong>in</strong>e with those of bio<strong>et</strong>hanol. The outcome is fundamentally affected<br />
by the choice of the allocation m<strong>et</strong>hod: the results were even <strong>in</strong>verted by chang<strong>in</strong>g the allocation m<strong>et</strong>hod<br />
from economic to mass or energy allocation. Lundie <strong>et</strong> al., (2007) state that “more effort needs to be <strong>in</strong>vested<br />
<strong>in</strong> develop<strong>in</strong>g allocation procedures appropriate to specific <strong>in</strong>dustry sectors; if possible, physico-chemical<br />
ones”.<br />
Another aspect of the allocation problem is the phenomenon of ignor<strong>in</strong>g or double-count<strong>in</strong>g of<br />
environmental burden. This systematic error might occur if the allocation approaches for two (or more)<br />
<strong>LCA</strong>s, conta<strong>in</strong><strong>in</strong>g co-products that are grown <strong>in</strong> the same agricultural system, are not aligned to each other.<br />
As a consequence, the sum of the sub-systems’ burdens is not equal to the total environmental burden of<br />
their common production process. This might not happen if both sub-systems are considered <strong>in</strong> one study,<br />
because ISO 14040 and 14044 requires us<strong>in</strong>g the same allocation approach <strong>in</strong> one study (ISO, 2006a, b). But<br />
often, <strong>LCA</strong>s are performed for each sub-product separately. Therefore this effect is likely to occur.<br />
An agricultural example for this phenomenon is the l<strong>in</strong>k b<strong>et</strong>ween dairy and biodiesel production.<br />
Rapeseed meal is used as animal feed and rapeseed oil as raw material for biodiesel. Both are obta<strong>in</strong>ed from<br />
the same raw material – rape seeds. If this l<strong>in</strong>k is ignored dur<strong>in</strong>g the calculation of dairy <strong>LCA</strong> (rapeseed<br />
meal) and biodiesel <strong>LCA</strong> (rapeseed oil), it is likely that different allocation m<strong>et</strong>hods are be<strong>in</strong>g used. Fig. 1<br />
shows this phenomenon <strong>in</strong> quantitative terms. Due to the use of different allocation approaches <strong>in</strong> separate<br />
assessments – here mass and economic allocation – the sum of the environmental burdens for oil and meal is<br />
461
PARALLEL SESSION 5B: METHODOLOGICAL CHALLENGES FOR CROP PRODUCTION SYSTEMS8 th Int. Conference on <strong>LCA</strong> <strong>in</strong> the<br />
Agri-<strong>Food</strong> Sector, 1-4 Oct <strong>2012</strong><br />
not equal to the total environmental burden of the seeds. In the first example (Fig. 1, left side), 37% of the<br />
total environmental burden is be<strong>in</strong>g ignored by the assessments.<br />
Figure 1. Left: Un<strong>in</strong>tended ignorance of environmental burden due to different allocation approaches for byproducts<br />
from the same agricultural system; Right: Un<strong>in</strong>tended double-count<strong>in</strong>g of environmental burden<br />
due to different allocation approaches for by-products from the same agricultural system. Grey and black<br />
areas represent environmental burden. Dotted l<strong>in</strong>es <strong>in</strong>dicate <strong>in</strong>itial environmental burden (100%) and<br />
overhang<strong>in</strong>g bars represent double-counted environmental burden.<br />
The opposite effect can also be observed (Fig. 1, right side). Here the <strong>LCA</strong> practitioner might end up with<br />
an environmental burden sum for oil and meal of 117% <strong>in</strong>stead of the 100% from the seeds, i.e. 17% of the<br />
burden is double-counted. That means the sum of environmental burden of one agricultural system cannot be<br />
calculated by add<strong>in</strong>g up the environmental burdens of the sub-systems when different allocation m<strong>et</strong>hods are<br />
used. For the general <strong>in</strong>terpr<strong>et</strong>ation of agricultural <strong>LCA</strong>s this aspect carefully needs to be considered. In<br />
terms of a contribution for solv<strong>in</strong>g the allocation problem for agricultural purposes, <strong>in</strong> the next chapters a<br />
new allocation approach is described.<br />
2. M<strong>et</strong>hods<br />
2.1. The Cereal Unit and its use as new allocation approach<br />
In the past, different estimation approaches for agricultural productivity were discussed. A simple sum of<br />
the masses of all agricultural products was recognized to be an <strong>in</strong>appropriate solution, because different levels<br />
of efforts for the production, various functionalities of the products and fulfilment of services would be<br />
neglected. To make agricultural productivity b<strong>et</strong>ter comparable and measurable, it was realised that a<br />
weighted sum rather than a sum of masses is necessary (Becker, 1988). For this aggregation step, one common<br />
denom<strong>in</strong>ator with a conversion key is necessary. Amongst others, the Cereal Unit is one such common<br />
denom<strong>in</strong>ator for the aggregation of agricultural data. The Cereal Unit was developed by German agricultural<br />
authorities decades ago <strong>in</strong> the field of agricultural statistics and is cont<strong>in</strong>uously updated (Becker, 1988;<br />
BMELV, <strong>2012</strong>; Klapp, 2011; Mönk<strong>in</strong>g <strong>et</strong> al., 2010). Us<strong>in</strong>g this Cereal Unit as common denom<strong>in</strong>ator, all<br />
agricultural products and by-products can be brought to the same level and thereby become comparable. We<br />
suggest us<strong>in</strong>g this Cereal Unit as a basis for allocation <strong>in</strong> agricultural Life Cycle Assessments.<br />
The calculation of the Cereal Unit is ma<strong>in</strong>ly based on the feed<strong>in</strong>g value of agricultural products. Calculation<br />
example: For barley the animal specific m<strong>et</strong>abolisable energies [MJ ME / kg fresh weight] (a common<br />
param<strong>et</strong>er <strong>in</strong> animal feed<strong>in</strong>g; cattle: 11.30; pigs: 12.63; <strong>et</strong>c.) are be<strong>in</strong>g weighted, us<strong>in</strong>g the share of actual<br />
feed<strong>in</strong>g practices of barley (here for German conditions; cattle: 5%; pigs: 94.5%; <strong>et</strong>c.). Result is the specifically<br />
aggregated m<strong>et</strong>abolisable energy content of 12.56 MJ ME / kg barley. This value was def<strong>in</strong>ed as<br />
1 Cereal Unit (therefore formerly also called barley unit). The specifically aggregated m<strong>et</strong>abolisable energy<br />
contents for other products are compared with the value of barley. This comparison leads to the crop specific<br />
Cereal Unit. For wheat the specifically aggregated m<strong>et</strong>abolisable energy content is 13.06 ME MJ / kg wheat<br />
– therefore 1 kg wheat equals 1.04 Cereal Units.<br />
462
PARALLEL SESSION 5B: METHODOLOGICAL CHALLENGES FOR CROP PRODUCTION SYSTEMS 8 th Int. Conference on<br />
<strong>LCA</strong> <strong>in</strong> the<br />
Agri-<strong>Food</strong> Sector, 1-4 Oct <strong>2012</strong><br />
For the sake of practicability the Cereal Unit is based on fresh weight. Because the storability of agricultural<br />
products is affected by the moisture content, each agricultural product is traded <strong>in</strong> the mark<strong>et</strong> with a<br />
specific moisture content or dry matter content, i.e. fresh cereals: 88% dry matter.<br />
For agricultural products that are not feasible or not <strong>in</strong>tended for animal nutrition (e.g. fruits or animal<br />
products) Cereal Unit conversion factors can be calculated via auxiliary calculations. E.g. the Cereal Unit for<br />
animal products is the quotient from fodder energy to produce 1 kilogram of product [<strong>in</strong> Megajoule m<strong>et</strong>abolisable<br />
energy] and the animal specific energy content of barley [<strong>in</strong> Megajoule m<strong>et</strong>abolisable energy] (Mönk<strong>in</strong>g<br />
<strong>et</strong> al., 2010). In consequence, for all agricultural products, Cereal Unit conversion factors theor<strong>et</strong>ically<br />
can be calculated (Table 1).<br />
Table 1. Cereal Unit conversion factors for selected agricultural products and by-products <strong>in</strong> Germany;<br />
Sources: (BMELV, <strong>2012</strong>; Mönk<strong>in</strong>g <strong>et</strong> al., 2010)<br />
Field crops and by-products<br />
(basis: fresh weight)<br />
Cereal Unit conversion factor<br />
Barley 1.00<br />
Malt sprouts 0.74<br />
Malt spent gra<strong>in</strong>s / brewers' spent gra<strong>in</strong>s / draff 0.75<br />
Beer yeast 0.91<br />
Wheat 1.04<br />
Distillery spent wash from wheat 0.06<br />
Rye 1.00<br />
Cereal straw 0.43<br />
Maize corn 1.08<br />
Maize starch 1.07<br />
Maize gluten 1.22<br />
Maize gluten feed 0.82<br />
Soybeans 1.15<br />
Soybean oil 2.81<br />
Soybean meal 0.96<br />
Rape seeds 1.30<br />
Rapeseed oil 2.74<br />
Rapeseed meal 0.77<br />
Sugar be<strong>et</strong> 0.23<br />
Sugar be<strong>et</strong> leaves 0.13<br />
Cassava / manioc 1.03<br />
Potato 0.22<br />
Grass, fresh 0.16<br />
Grass silage 0.27<br />
Grass hay 0.61<br />
Cherries, swe<strong>et</strong> 2.73<br />
Blueberries 3.42<br />
Strawberries 1.16<br />
Broccoli 0.87<br />
Cabbage 0.18<br />
L<strong>et</strong>tuce 0.46<br />
Asparagus 1.71<br />
Cattle, total, live weight 5.98<br />
Calf, at birth, live weight 4.52<br />
Dairy cow, live weight 6.30<br />
Milk, unskimmed, for human nutrition 0.80<br />
Lay<strong>in</strong>g hen 4.60<br />
Eggs 2.28<br />
Sheep, live weight 9.10<br />
Wool, raw 1.90<br />
463
PARALLEL SESSION 5B: METHODOLOGICAL CHALLENGES FOR CROP PRODUCTION SYSTEMS8 th Int. Conference on <strong>LCA</strong> <strong>in</strong> the<br />
Agri-<strong>Food</strong> Sector, 1-4 Oct <strong>2012</strong><br />
3. Results<br />
3.1. Case study for the Cereal Unit as allocation procedure<br />
A comparison of allocation approaches was elaborated for selected agricultural products from cereal-,<br />
sugar- and oilseed-sector (Figure 2). For example, the environmental burden of a barley plant is allocated to<br />
barley gra<strong>in</strong> and straw as follows: when mass allocation is applied, 56% is allocated to the gra<strong>in</strong> and 44% to<br />
the straw; when energy allocation is used, 55% is allocated to the gra<strong>in</strong> and 45% to the straw; when economic<br />
allocation is used 95% is allocated to the gra<strong>in</strong> and 5% to the straw; when the Cereal Unit allocation is<br />
applied 77% is allocated to the gra<strong>in</strong> and 23% to the straw. The results of Cereal Unit allocation are well<br />
b<strong>et</strong>ween the outcomes of mass-, energy- and economic allocation.<br />
Figure 2. Comparison of mass-, energy-, economic- and Cereal Unit allocation for selected agricultural products;<br />
the sizes of bars <strong>in</strong>dicate the allocation ratio b<strong>et</strong>ween the environmental burden of the first product and<br />
the total environmental burden<br />
4. Discussion<br />
Usually the users of agricultural <strong>LCA</strong> results typically deal with different agricultural products. For the<br />
sake of credible results, it is their aim to treat all products and by-products as fairly and as adequately as<br />
possible. This aim could be achieved by a reliable allocation solution for all agricultural processes. This is<br />
crucial to improve the credibility of <strong>LCA</strong> results <strong>in</strong> agriculture. The way of allocat<strong>in</strong>g environmental burden<br />
<strong>in</strong> agricultural <strong>LCA</strong>s or with<strong>in</strong> <strong>LCA</strong>s for products derived thereof, is crucial for the results, because allocation<br />
steps often take place several times. Errors <strong>in</strong>troduced by each allocation step propagate. This emphasises<br />
the necessary accuracy of allocation approaches for conv<strong>in</strong>c<strong>in</strong>g <strong>LCA</strong> results.<br />
Cereal Unit conversion factors already are available for a large number of agricultural crops and their byproducts<br />
(BMELV, <strong>2012</strong>; Mönk<strong>in</strong>g <strong>et</strong> al., 2010). A suitable allocation m<strong>et</strong>hod both for products and byproducts<br />
allows <strong>LCA</strong> practitioners to use the same allocation m<strong>et</strong>hod with<strong>in</strong> <strong>in</strong>dependent <strong>LCA</strong>s – even if the<br />
practitioners do not know each other. For that reason the Cereal Unit allocation approach is suitable regardless<br />
of the product’s f<strong>in</strong>al use. The suitability of the Cereal Unit for all products and by-products helps to<br />
avoid the use of different allocation m<strong>et</strong>hods with<strong>in</strong> one product system and therefore avoids an un<strong>in</strong>tended<br />
ignorance or double count<strong>in</strong>g of environmental burden.<br />
Agricultural production <strong>in</strong>cludes both veg<strong>et</strong>able and animal production. In many product systems animal<br />
and veg<strong>et</strong>able production are <strong>in</strong>terl<strong>in</strong>ked. Because the Cereal Unit is valid for veg<strong>et</strong>able and animal products,<br />
it allows <strong>LCA</strong> modellers b<strong>et</strong>ter to depict agricultural reality. An artificial split b<strong>et</strong>ween of crop and livestock<br />
farm<strong>in</strong>g becomes no longer necessary.<br />
If Cereal Unit conversion factors are not y<strong>et</strong> available for a particular product, they can be developed<br />
based on the published calculation m<strong>et</strong>hod (BMELV, <strong>2012</strong>; Mönk<strong>in</strong>g <strong>et</strong> al., 2010). In a strict sense, the exist<strong>in</strong>g<br />
factors are valid for Germany only, because livestock composition and feed consumption of the region<br />
464
PARALLEL SESSION 5B: METHODOLOGICAL CHALLENGES FOR CROP PRODUCTION SYSTEMS 8 th Int. Conference on<br />
<strong>LCA</strong> <strong>in</strong> the<br />
Agri-<strong>Food</strong> Sector, 1-4 Oct <strong>2012</strong><br />
are part of the calculation of Cereal Unit conversion factor. Further conversion factors for the European and<br />
worldwide context could be developed us<strong>in</strong>g the published calculation m<strong>et</strong>hod. This step seems to be necessary<br />
for the application of the Cereal Unit <strong>in</strong> other regions.<br />
Due to the use of the Cereal Unit <strong>in</strong> agricultural statistics for decades, good balanced allocation results b<strong>et</strong>ween<br />
different products and the acceptance for this m<strong>et</strong>hod with<strong>in</strong> the agricultural sector is expected to be<br />
high. Because the Cereal Unit comb<strong>in</strong>es different aspects and param<strong>et</strong>ers it seems to be a promis<strong>in</strong>g compromise<br />
to reflect the <strong>in</strong>tention of different users of agricultural products.<br />
Decreas<strong>in</strong>g the arbitrar<strong>in</strong>ess of <strong>LCA</strong> practitioners’ choice of allocation m<strong>et</strong>hod <strong>in</strong>creases the reliability of<br />
agricultural <strong>LCA</strong>s. Improved accountability, predictability and credibility of agricultural <strong>LCA</strong>s are the basis<br />
for new, effective strategies for Susta<strong>in</strong>able Consumption and Production (SCP) for products based on agricultural<br />
raw materials.<br />
When it comes to the allocation of environmental burden <strong>in</strong> agricultural <strong>LCA</strong>s it seems useful to th<strong>in</strong>k<br />
about the biggest user of agricultural area and agricultural products. Eighty percent of global agricultural<br />
land is be<strong>in</strong>g used to feed livestock (FAO, 2009), and the Cereal Unit reflects its needs.<br />
5. Conclusion<br />
While the Cereal Unit allocation approach from a theor<strong>et</strong>ical po<strong>in</strong>t of view has a large potential, broad<br />
experience of its practical application is not y<strong>et</strong> available. To test the proposed approach and either reconfirm<br />
its suitability or identify practical drawbacks, <strong>LCA</strong> practitioners are <strong>in</strong>vited to use the Cereal Unit allocation<br />
<strong>in</strong> their published results.<br />
Application of the Cereal Unit allocation might reduce the variability and potential bias <strong>in</strong> <strong>LCA</strong> results <strong>in</strong><br />
this sector. If the Cereal Unit allocation approach is established as a universal approach for agricultural processes,<br />
it will support the use of <strong>LCA</strong>s by provid<strong>in</strong>g decision makers with more robust recommendations and<br />
to achieve the aim of SCP.<br />
6. References<br />
Becker, J.W., 1988. Aggregation <strong>in</strong> landwirtschaftlichen Gesamtrechnungen über physische Maßstäbe - Futtergerstene<strong>in</strong>heiten als<br />
Generalnenner - [Aggregation <strong>in</strong> agricultural accounts us<strong>in</strong>g physical standards - feed barley units as a common denom<strong>in</strong>ator -],<br />
Fachbereich Agrarwissenschaften. Justus-Liebig-Universität Gießen, Gießen, p. 366.<br />
BMELV, <strong>2012</strong>. Statistisches Jahrbuch über Ernährung, Landwirtschaft und Forsten der Bundesrepublik Deutschland 2011 [Statistical<br />
Yearbook on <strong>Food</strong>, Agriculture and Forestry of the Federal Republic of Germany 2011]. Landwirtschaftsverlag Münster Hiltrup.<br />
Curran, M.A., 2008. Development of life cycle assessment m<strong>et</strong>hodology: a focus on co-product allocation. Erasmus University Rotterdam,<br />
p. 204.<br />
FAO, 2009. The state of food and agriculture 2009: livestock <strong>in</strong> the balance. <strong>Food</strong> and Agriculture Organization of the United Nations<br />
(FAO), Rome.<br />
F<strong>in</strong>kbe<strong>in</strong>er, M., 2009. Carbon footpr<strong>in</strong>t<strong>in</strong>g-opportunities and threats. Int. J. Life Cycle Assess. 14, 91-94.<br />
F<strong>in</strong>kbe<strong>in</strong>er, M., Inaba, A., Tan, R.B.H., Christiansen, K., Klüppel, H.J., 2006. The new <strong>in</strong>ternational standards for life cycle assessment:<br />
ISO 14040 and ISO 14044. Int. J. Life Cycle Assess. 11, 80-85.<br />
Gnansounou, E., Dauriat, A., Villegas, J., Panichelli, L., 2009. Life cycle assessment of biofuels: Energy and greenhouse gas balances.<br />
Bioresource Technology 100, 4919-4930.<br />
ISO, 2006a. 14044 Environmental Management – Life Cycle Assessment – Requirements and Guidel<strong>in</strong>es. International Organization<br />
for Standardization (ISO), Geneva.<br />
ISO, 2006b. ISO 14040 Environmental Management – Life Cycle Assessment – Pr<strong>in</strong>ciples and Framework. International Organization<br />
for Standardization (ISO), Geneva.<br />
Kim, S., Dale, B.E., 2002. Allocation procedure <strong>in</strong> <strong>et</strong>hanol production system from corn gra<strong>in</strong> - I. System expansion. Int. J. Life<br />
Cycle Assess. 7, 237-243.<br />
Klapp, C., 2011. G<strong>et</strong>reide- und Viehe<strong>in</strong>heitenschlüssel als Bewertungsmaßstäbe <strong>in</strong> der Landwirtschaft: <strong>in</strong>ternationaler Vergleich und<br />
Konsequenzen alternativer Viehbewertungen [Gra<strong>in</strong> and livestock units as assessment measures <strong>in</strong> agriculture: <strong>in</strong>ternational<br />
comparison and implications of alternative livestock reviews] Cuvillier, Gött<strong>in</strong>gen.<br />
Klöpffer, W., Grahl, B., 2009. Ökobilanz (<strong>LCA</strong>): e<strong>in</strong> Leitfaden für Ausbildung und Beruf. Wiley-VCH-Verl., We<strong>in</strong>heim<br />
Lundie, S., Ciroth, A., Huppes, G., 2007. Inventory m<strong>et</strong>hods <strong>in</strong> <strong>LCA</strong>: towards consistency and improvement - F<strong>in</strong>al Report, UNEP-<br />
SETAC Life Cycle Initiative. Life Cycle Inventory (LCI) Programme Task Force 3: M<strong>et</strong>hodological Consistency, p. 135.<br />
Luo, L., van der Vo<strong>et</strong>, E., Huppes, G., de Haes, H.A.U., 2009. Allocation issues <strong>in</strong> <strong>LCA</strong> m<strong>et</strong>hodology: a case study of corn stoverbased<br />
fuel <strong>et</strong>hanol. Int. J. Life Cycle Assess. 14, 529-539.<br />
Mönk<strong>in</strong>g, S.S., Klapp, C., Abel, H., Theuvsen, L., 2010. Überarbeitung des G<strong>et</strong>reide- und Viehe<strong>in</strong>heitenschlüssels - Endbericht zum<br />
BMELV-Forschungsprojekt 06HS030 [Revision of cereal unit and livestock unit - F<strong>in</strong>al report on research project 06HS030<br />
BMELV]. Georg-August-Universität Gött<strong>in</strong>gen Fakultät für Agrarwissenschaften Forschungs- und Studienzentrum für Landwirtschaft<br />
und Umwelt, Gött<strong>in</strong>gen, p. 537.<br />
S<strong>in</strong>gh, A., Pant, D., Korres, N.E., Nizami, A.-S., Prasad, S., Murphy, J.D., 2010. Key issues <strong>in</strong> life cycle assessment of <strong>et</strong>hanol production<br />
from lignocellulosic biomass: Challenges and perspectives. Bioresource Technology 101, 5003-5012.<br />
465
PARALLEL SESSION 5B: METHODOLOGICAL CHALLENGES FOR CROP PRODUCTION SYSTEMS8 th Int. Conference on <strong>LCA</strong> <strong>in</strong> the<br />
Agri-<strong>Food</strong> Sector, 1-4 Oct <strong>2012</strong><br />
466<br />
<strong>LCA</strong> applied to pea-wheat <strong>in</strong>tercrops: the significance of allocation<br />
Christophe Naud<strong>in</strong> 1* , Hayo van der Werf 2,3 , Marie-Hélène Jeuffroy 4 , Guénaëlle Corre-Hellou 1<br />
1 LUNAM Université, Groupe ESA, UR LEVA - SFR 4207 QUASAV, 55 rue Rabelais, 49007 Angers cedex 01, <strong>France</strong><br />
2 INRA, UMR1069 Sol, Agro and hydroSystem, 35000 Rennes, <strong>France</strong><br />
3 Agrocampus Ouest, 35000 Rennes, <strong>France</strong><br />
4 UMR Agronomie INRA-AgroParisTech, Bâtiment EGER, 78850 Thiverval-Grignon, <strong>France</strong><br />
Correspond<strong>in</strong>g author. E-mail: c.naud<strong>in</strong>@groupe-esa.com<br />
ABSTRACT<br />
Cereal-legume <strong>in</strong>tercrops (ICs) are a promis<strong>in</strong>g way to comb<strong>in</strong>e high productivity and several ecological benefits <strong>in</strong> temperate agroecosystems.<br />
This study aims to apply <strong>LCA</strong> to ICs by (i) test<strong>in</strong>g several m<strong>et</strong>hods of allocation, or system expansion; (ii) <strong>in</strong> order to<br />
assess the environmental impacts of the co-products.<br />
Agronomic performances of w<strong>in</strong>ter pea-wheat IC, sole-cropped (SC) pea and wheat were assessed <strong>in</strong> field experiments <strong>in</strong> <strong>France</strong>.<br />
<strong>LCA</strong> was carried out from sow<strong>in</strong>g to harvest, <strong>in</strong>clud<strong>in</strong>g gra<strong>in</strong> sort<strong>in</strong>g. Functional unit is 1 kg of wheat gra<strong>in</strong> (bread mak<strong>in</strong>g quality).<br />
ICs allowed produc<strong>in</strong>g wheat with lower impacts than SC wheat (at least -20%). Allocation m<strong>et</strong>hod strongly affected results and<br />
system expansion was shown to be <strong>in</strong>appropriate, as it did not take <strong>in</strong>to account benefits from <strong>in</strong>terspecific complementarity. Then<br />
we redef<strong>in</strong>ed our functional unit to assess impacts of ICs from those of SCs (equivalence of area, or of production). ICs always decreased<br />
impacts compared to SCs (from -13% to -54%).<br />
Keywords: system expansion; cereal; legumes; environmental impacts<br />
1. Introduction<br />
Dur<strong>in</strong>g recent decades, it has become obvious that the design of cropp<strong>in</strong>g systems has to take <strong>in</strong>to account<br />
the environmental impacts of agricultural practices (Altieri, 1989) <strong>in</strong> order to limit the use of non-renewable<br />
natural resources and chemical <strong>in</strong>puts and to improve their efficiency (Tilman <strong>et</strong> al., 2002).<br />
Intercropp<strong>in</strong>g is the simultaneous grow<strong>in</strong>g of two or more species <strong>in</strong> the same field, with variations <strong>in</strong> the<br />
species used, the densities of each species and their spatial arrangements (Willey, 1979). Apart from its frequent<br />
use <strong>in</strong> pastures, this practice is not very widespread <strong>in</strong> temperate agroecosystems. However cereallegume<br />
<strong>in</strong>tercrops are ga<strong>in</strong><strong>in</strong>g <strong>in</strong>terest <strong>in</strong> Europe due to the <strong>in</strong>creas<strong>in</strong>g awareness of environmental damage<br />
aris<strong>in</strong>g from the <strong>in</strong>tensive use of fertilisers and pesticides and the <strong>in</strong>creas<strong>in</strong>g cost of these <strong>in</strong>puts (Anil <strong>et</strong> al.,<br />
1998). Moreover, <strong>in</strong>tercrops are ma<strong>in</strong>ly widespread <strong>in</strong> organic farm<strong>in</strong>g but may have <strong>in</strong>terest<strong>in</strong>g potential<br />
uses <strong>in</strong> conventional farm<strong>in</strong>g systems, <strong>in</strong> particular for the development of low-<strong>in</strong>put multi-use crops.<br />
Intercropp<strong>in</strong>g is known to <strong>in</strong>crease yields, yield stability and gra<strong>in</strong> N concentration of the cereal, and to decrease<br />
weed pressure and N leach<strong>in</strong>g. Indeed, cereal-legume <strong>in</strong>tercropp<strong>in</strong>g has been demonstrated to be an<br />
<strong>in</strong>terest<strong>in</strong>g way to improve the nitrogen efficiency of agroecosystems (Hauggaard-Nielsen <strong>et</strong> al., 2009) and<br />
limit losses to the environment. These advantages are assumed to be ma<strong>in</strong>ly l<strong>in</strong>ked to the complementary<br />
use, <strong>in</strong> time and space, of N sources by the different components of the <strong>in</strong>tercrop (Corre-Hellou <strong>et</strong> al., 2006;<br />
Jensen, 1996; Naud<strong>in</strong> <strong>et</strong> al., 2010). Thus <strong>in</strong>tercrops can contribute to the development of cropp<strong>in</strong>g systems<br />
which comb<strong>in</strong>e high productivity and several ecological benefits. However, few studies have attempted to<br />
assess environmental benefits based on multicriteria approaches (Pelzer <strong>et</strong> al., <strong>2012</strong>), and, to our knowledge,<br />
none us<strong>in</strong>g life cycle assessment (<strong>LCA</strong>).<br />
<strong>LCA</strong> is a m<strong>et</strong>hod to assess impacts of a product consider<strong>in</strong>g all stages of its life cycle. This m<strong>et</strong>hodology,<br />
so called “from cradle to grave”, assesses resource use and emissions to the environment, from the extraction<br />
of resources, through each step of the production process, <strong>in</strong>clud<strong>in</strong>g product parts and recycl<strong>in</strong>g or f<strong>in</strong>al disposal<br />
(Gu<strong>in</strong>ée <strong>et</strong> al., 2002). In the case of product systems yield<strong>in</strong>g several co-products, impacts have to be<br />
allocated among the co-products. This is the case for cereal-legume IC, and the estimated impacts of the coproducts<br />
may well be dependent on the choice of the impact allocation m<strong>et</strong>hod (Ekval and F<strong>in</strong>nveden, 2001;<br />
Heijungs and Gu<strong>in</strong>ée, 2007).<br />
The aim of this study was to apply <strong>LCA</strong> to ICs by (i) test<strong>in</strong>g several m<strong>et</strong>hods of impact allocation (mass,<br />
economic, based on N yield <strong>in</strong> gra<strong>in</strong>s) or avoided allocation by system expansion (ii) <strong>in</strong> order to assess the<br />
environmental impacts of the co-products.<br />
2. M<strong>et</strong>hods<br />
2.1. General design of experiments<br />
Field experiments were carried out <strong>in</strong> <strong>France</strong> <strong>in</strong> 2007–2008 at La Jaillière (see Exp B <strong>in</strong> Naud<strong>in</strong> <strong>et</strong> al.,<br />
2010) at the experimental station of ARVALIS Institut du Végétal, <strong>in</strong> western <strong>France</strong> (47°26’N, 0°58’W).
PARALLEL SESSION 5B: METHODOLOGICAL CHALLENGES FOR CROP PRODUCTION SYSTEMS 8 th Int. Conference on<br />
<strong>LCA</strong> <strong>in</strong> the<br />
Agri-<strong>Food</strong> Sector, 1-4 Oct <strong>2012</strong><br />
W<strong>in</strong>ter field pea (Pisum sativum L.) cv. Lucy, and w<strong>in</strong>ter wheat (Triticum aestivum L.) cv. Cézanne, were<br />
sown as sole crops at 80 and 260 pl m −2 , respectively. W<strong>in</strong>ter pea-wheat <strong>in</strong>tercrops (IC) were grown <strong>in</strong> a<br />
substitutive design, each species be<strong>in</strong>g sown at half its sole crop density, both species be<strong>in</strong>g mixed with<strong>in</strong> the<br />
rows. All the experiments were arranged <strong>in</strong> randomized compl<strong>et</strong>e block designs with three replicates. The<br />
soil was a clayey sandy loam (27.7% clay, 42.1% silt, 27.8% sand).<br />
2.2. Crop management and analytical m<strong>et</strong>hods<br />
In all experiments, pests were controlled with pesticides when required. No irrigation was provided. Inorganic<br />
soil N, measured <strong>in</strong> February (end of w<strong>in</strong>ter), varied from 55 to 60 kg N ha −1 <strong>in</strong> the 0–90 cm soil layer.<br />
N was applied as NH4NO3 as liquid fertiliser (Table 1). The fertiliser was enriched with 15 N (δ 15 N= 200‰) <strong>in</strong><br />
order to follow the dynamics of the amount of nitrogen derived from air (Ndfa) and accumulated <strong>in</strong> pea<br />
shoots. Pea sole crops were always grown without applied N. For other d<strong>et</strong>ails on m<strong>et</strong>hods concern<strong>in</strong>g field<br />
experiment, see Naud<strong>in</strong> <strong>et</strong> al., (2010).<br />
Table 1. Treatments, N fertilisation, mean gra<strong>in</strong> yields and mean LER.<br />
Crop<br />
design<br />
Treatments Treatments <strong>in</strong><br />
Naud<strong>in</strong> <strong>et</strong> al. (2010)<br />
Time of<br />
N-fertilization<br />
Rate of<br />
N-fertilization<br />
(kg N ha -1 )<br />
Wheat GY<br />
(g.m - ²)<br />
Pea GY<br />
(g.m - ²)<br />
LERw LERp LER<br />
SC P100 N0 B-Psc N0 — 0 — 397 (±51) — — —<br />
SC W100 N B-Wsc N 07/03; 20/03; 14/05 80; 70; 40 857 (±36) — — — —<br />
IC P50W50 N0 B-IC N0 — 0 275 (±48) 417 (±60) 0.32 (±0.05) 1.11(±0.26) 1.43 (±0.22)<br />
IC P50W50 N B-IC4 07/03 45 413 (±60) 335 (±31) 0.48 (±0.06) 0.89 (±0.18) 1.37 (±0.12)<br />
W100: wheat sole crop. P100: pea sole crop. P50W50: substitutive <strong>in</strong>tercrops of pea and wheat (“50” <strong>in</strong>dicates half of the recommended plant density<br />
when sole cropped). Crops are N-fertilised (“N”: 190 kg N ha -1 on sole cropped wheat, and 45 kg N ha -1 at the beg<strong>in</strong>n<strong>in</strong>g of stem elongation on Nfertilised<br />
<strong>in</strong>tercrops), or not (“N0”). LERw: partial land equivalent ratio for wheat. LERp: partial land equivalent ratio for pea. Values for gra<strong>in</strong> yields<br />
are means (n=3)±SE (Standard Errors)<br />
2.3. <strong>LCA</strong><br />
2.3.1. Evaluation m<strong>et</strong>hodology.<br />
Potential impacts were estimated accord<strong>in</strong>g to <strong>LCA</strong> m<strong>et</strong>hodology, from soil tillage for sow<strong>in</strong>g to harvest<br />
(<strong>in</strong>clud<strong>in</strong>g the gra<strong>in</strong> sort<strong>in</strong>g process). The functional unit is 1 kg of wheat gra<strong>in</strong> of bread mak<strong>in</strong>g quality.<br />
Direct emissions were estimated based on the field experiment and International Panel on Climate Change<br />
(IPCC) 2006 recommendations. Indirect emissions were estimated with the help of the Eco<strong>in</strong>vent 2007 database,<br />
version 2.0 (Nemecek and Kägi, 2007). The production of seed for sow<strong>in</strong>g was taken <strong>in</strong>to account: we<br />
assumed that <strong>in</strong>puts required for seed production were similar to those required for the correspond<strong>in</strong>g crop.<br />
2.3.2. Calculation of emissions.<br />
Emissions to air were estimated for NH3, N2O and NOx. Emission factors for NH3 volatilisation follow<strong>in</strong>g<br />
application of m<strong>in</strong>eral fertiliser were based on Nemecek and Kägi (2007). Emission factors for N2O were<br />
based on IPCC (2006), and emissions of NOx were estimated accord<strong>in</strong>g to Nemecek and Kägi (2007) at 21%<br />
of emissions of N2O. Losses of NO3 - to groundwater were estimated from experimental measurements.<br />
Phosphate emissions to water were estimated accord<strong>in</strong>g to Nemecek and Kägi (2007) consider<strong>in</strong>g leach<strong>in</strong>g to<br />
groundwater and run-off to surface water for soluble phosphate, as well as erosion of soil particles conta<strong>in</strong><strong>in</strong>g<br />
phosphorus.<br />
2.3.3. Characterisation factors.<br />
The follow<strong>in</strong>g impact categories were considered: climate change (CC) (correspond<strong>in</strong>g to greenhouse gas<br />
emissions, kg CO2 eq.), eutrophication (EU) (g PO4<br />
467<br />
3- eq.), and cumulative energy demand (CED) (MJ eq.).<br />
The <strong>in</strong>dicator result for each impact category was d<strong>et</strong>erm<strong>in</strong>ed by multiply<strong>in</strong>g the aggregated resources used<br />
and the aggregated emissions of each <strong>in</strong>dividual substance with a characterisation factor for each impact<br />
category to which it may potentially contribute.<br />
Climate change and eutrophication were calculated us<strong>in</strong>g the CML2 ‘basel<strong>in</strong>e’ and ‘all categories’ 2001<br />
characterisation m<strong>et</strong>hods as implemented <strong>in</strong> the Eco<strong>in</strong>vent v2.0 database. Cumulative energy demand (CED)<br />
was calculated accord<strong>in</strong>g to its version 1.05 as implemented <strong>in</strong> the Eco<strong>in</strong>vent v2.0 database. For climate<br />
change, we updated values of characterisation factors (Forster <strong>et</strong> al., 2007) for biogenic m<strong>et</strong>hane (new value<br />
25 kg CO2 eq.) and nitrous oxide (new value 298 kg CO2 eq.). A description of the CML 2001 and CED<br />
m<strong>et</strong>hods can be found <strong>in</strong> Frischknecht <strong>et</strong> al., (2007).
PARALLEL SESSION 5B: METHODOLOGICAL CHALLENGES FOR CROP PRODUCTION SYSTEMS8 th Int. Conference on <strong>LCA</strong> <strong>in</strong> the<br />
Agri-<strong>Food</strong> Sector, 1-4 Oct <strong>2012</strong><br />
2.3.3. M<strong>et</strong>hods for allocations and system expansion<br />
Economic allocation was calculated based on mean official price from 2000-2010 (Agreste database:<br />
www.agreste.agriculture.gouv.fr). Mean official price for wheat and pea was of 129 euros ton -1 , and<br />
150 euros ton -1 , respectively.<br />
System expansion was carried out by replac<strong>in</strong>g impacts attributed to <strong>in</strong>tercropped pea by the respective<br />
impacts estimated for sole cropped pea.<br />
2.4. Calculations<br />
The Land Equivalent Ratio (LER) for gra<strong>in</strong> yield for pea–wheat <strong>in</strong>tercrops was calculated accord<strong>in</strong>g to De<br />
Wit and Van den Bergh (1965). The LER is the sum of the partial LER values for wheat (LERw) and pea<br />
(LERp):<br />
468<br />
GY GY<br />
LER <br />
GY GY<br />
WIC PIC<br />
LERw LERp <br />
Eq.1<br />
WSC<br />
PSC<br />
where GYWIC and GYPIC are yields of wheat and pea <strong>in</strong> the <strong>in</strong>tercrops, respectively, and GYWSC and GYPSC<br />
are the yields of wheat and pea <strong>in</strong> sole crops, respectively. LER values above 1 <strong>in</strong>dicate a benefit of <strong>in</strong>tercropp<strong>in</strong>g<br />
over sole cropp<strong>in</strong>g.<br />
Nitrogen leach<strong>in</strong>g was estimated based on experimental measurements us<strong>in</strong>g mass balance as follows:<br />
Nleach<strong>in</strong>g = Nsoil S– Nsoil W – Nabv - Ndfa Eq.2<br />
where:<br />
Nleach<strong>in</strong>g is the estimated quantity of leached N<br />
Nsoil S is the N soil content observed at sow<strong>in</strong>g (0–90cm soil layer)<br />
Nsoil W is the N soil content observed <strong>in</strong> February after the leach<strong>in</strong>g period (0–90cm soil layer)<br />
Nabv is the amount of N observed <strong>in</strong> the aboveground canopy<br />
Ndfa is the amount of N derived from air<br />
3. Results<br />
3.1. Estimated impacts related to wheat gra<strong>in</strong> production<br />
Estimated impacts per kg of sole cropped wheat (W100 N) were of 0.37 kg CO2 eq., 1.17 g PO4 3- eq., and<br />
2.18 MJ eq., concern<strong>in</strong>g climate change (CC), eutrophication (EU), and cumulative energy demand (CED),<br />
respectively (fig.1). Concern<strong>in</strong>g the un-fertilised <strong>in</strong>tercrop (P50W50 N0), mass allocations of impacts among<br />
co-products brought about impacts of 0.15 kg CO2 eq., 0.71 g PO4 3- eq., and 1.31 MJ eq., for CC, EU, and<br />
CED, respectively. N-fertilisation of the <strong>in</strong>tercrop <strong>in</strong>creased environmental impacts by 36%, 32%, and 17%<br />
for CC, EU, and CED, respectively (fig.1).<br />
M<strong>et</strong>hods for co-product allocation affected impacts. Concern<strong>in</strong>g the un-fertilised <strong>in</strong>tercrop, economic allocation<br />
impacts were 0.14 kg CO2 eq., 0.64 g PO4 3- eq., and 1.19 MJ eq., for CC, EU, and CED, respectively.<br />
Allocation based on the N content of gra<strong>in</strong>s resulted <strong>in</strong> lower impacts than for economic allocation:<br />
0.10 kg CO2 eq., 0.48 g PO4 3- eq., and 0.90 MJ eq., for CC, EU, and CED, respectively (fig.1).<br />
System expansion resulted <strong>in</strong> the lowest values for all impacts. In case of un-fertilised <strong>in</strong>tercrops, this<br />
m<strong>et</strong>hod always yielded negative impacts (-0.10 kg CO2 eq., -0.68 g PO4 3- eq., and -0.88 MJ eq., for CC, EU,<br />
and CED, respectively) (Fig.1).
PARALLEL SESSION 5B: METHODOLOGICAL CHALLENGES FOR CROP PRODUCTION SYSTEMS 8 th Int. Conference on<br />
<strong>LCA</strong> <strong>in</strong> the<br />
Agri-<strong>Food</strong> Sector, 1-4 Oct <strong>2012</strong><br />
kg CO 2 eq ; or g PO 4 3- eq; or MJ eq<br />
2.5<br />
1.5<br />
0.5<br />
-0.5<br />
-1.5<br />
-2.5<br />
Climate Change<br />
(kg CO 2 eq)<br />
W100 N P50W50 N0 P50W50 N W100 N P50W50 N0 P50W50 N W100 N P50W50 N0 P50W50 N<br />
Figure 1. Potential impacts per kg of wheat gra<strong>in</strong>s (bread mak<strong>in</strong>g quality) from sole cropp<strong>in</strong>g, and accord<strong>in</strong>g<br />
to different propositions for allocation of impacts among gra<strong>in</strong>s of wheat and pea <strong>in</strong> <strong>in</strong>tercrop yield. W100:<br />
wheat sole crop. P50W50: substitutive <strong>in</strong>tercrops of pea and wheat (“50” <strong>in</strong>dicates half of the recommended<br />
plant density when sole cropped). Crops are N-fertilised (“N”: 190 kg N ha -1 on sole cropped wheat, and<br />
45 kg N ha -1 at the beg<strong>in</strong>n<strong>in</strong>g of stem elongation on N-fertilised <strong>in</strong>tercrops), or not (“N0”). MASS: mass<br />
allocation. ECO: economic allocation. NITRO: allocation accord<strong>in</strong>g to the quantity of Nitrogen <strong>in</strong> wheat and<br />
pea gra<strong>in</strong>s. SYST: avoided allocation by system expansion. Values are means (n=3) ±SE (Standard Errors).<br />
3.3. Estimated impacts related to ICs gra<strong>in</strong> production<br />
Eutrophication<br />
(g PO 4 3- eq)<br />
Two comparisons were made: i) equivalence of area: impacts of IC cropped on 1 ha, compared to 1 ha of<br />
a comb<strong>in</strong>ation of SCs accord<strong>in</strong>g to relative sown densities <strong>in</strong> IC; ii) equivalence of production: impacts of IC<br />
cropped on 1 ha, compared to a comb<strong>in</strong>ation of SCs produc<strong>in</strong>g the same quantity of wheat and pea gra<strong>in</strong>s as<br />
<strong>in</strong> IC (fig. 2). These comparisons took <strong>in</strong>to account gra<strong>in</strong> yield and LER (table 1) to perform comparison on<br />
the basis of equivalence of cropped area, and equivalence of production, respectively.<br />
Comparison on the basis of equivalence of cropped area showed that, relative to sole crops, impacts of<br />
un-fertilised <strong>in</strong>tercrops were reduced by 52%, 41%, and 36%, for CC, EU, and CED, respectively. Comparison<br />
on the basis of equivalence of production shown that, relative to sole crops, impacts of un-fertilised<br />
<strong>in</strong>tercrops were reduced by 54%, 49%, and 46%, for CC, EU, and CED, respectively. N-fertilisation <strong>in</strong>creased<br />
impacts relative to un-fertilised <strong>in</strong>tercrops, but impacts were less than those of sole crops, whatever the way<br />
of comparison (Fig. 2).<br />
MASS<br />
ECO<br />
NITRO<br />
SYST<br />
No allocation (sole crop)<br />
Total Cumulative Energy Demand<br />
(MJ eq)<br />
469
PARALLEL SESSION 5B: METHODOLOGICAL CHALLENGES FOR CROP PRODUCTION SYSTEMS8 th Int. Conference on <strong>LCA</strong> <strong>in</strong> the<br />
Agri-<strong>Food</strong> Sector, 1-4 Oct <strong>2012</strong><br />
Figure 2. Potential impacts of 1 ha of pea-wheat <strong>in</strong>tercrops relative to comb<strong>in</strong>ations of respective sole crops<br />
on a basis of equivalence of cropped area or of equivalence of production (<strong>in</strong>clud<strong>in</strong>g impacts of the gra<strong>in</strong><br />
sort<strong>in</strong>g process). W100: wheat sole crop. P100: pea sole crop. P50W50: substitutive <strong>in</strong>tercrops of pea and<br />
wheat (“50” <strong>in</strong>dicates half of the recommended plant density when sole cropped). IC: <strong>in</strong>tercrop. SC: sole<br />
crop. Crops are N-fertilised (“N”: 190 kg N ha -1 on sole cropped wheat, and 45 kg N ha -1 at the beg<strong>in</strong>n<strong>in</strong>g of<br />
stem elongation on N-fertilised <strong>in</strong>tercrops), or not (“N0”). Values are means (n=3)±SE (Standard Errors).<br />
4. Discussion<br />
Concern<strong>in</strong>g sole cropped wheat, estimated impacts for CC and CED were <strong>in</strong> accordance with previous results<br />
(Mosnier <strong>et</strong> al., 2011). Our estimated impacts for EU were lower than those exhibited by Mosnier <strong>et</strong> al.,<br />
(2011) (1.17 and 3.8 g PO4 3- eq., respectively). Mosnier <strong>et</strong> al., (2011) calculated mean values for <strong>France</strong>.<br />
Therefore, differences may result from the specific soil N dynamics <strong>in</strong> our experiments.<br />
ICs allowed produc<strong>in</strong>g wheat with lower impacts than sole cropped wheat, whatever the allocation<br />
m<strong>et</strong>hod (reduction was at least -20%; fig. 1). However, allocation m<strong>et</strong>hod strongly affected results. The system<br />
expansion m<strong>et</strong>hod did produce surpris<strong>in</strong>g results, as shown by negative impacts for wheat from unfertilised<br />
ICs. In our study, data used for system expansion was solid, as we estimated impacts for IC pea<br />
from the impacts associated with the production of the same quantity and quality of SC pea gra<strong>in</strong>s. Indeed,<br />
previous results have shown that sole cropped pea gra<strong>in</strong>s are of the same quality than those from <strong>in</strong>tercrops<br />
(Naud<strong>in</strong> <strong>et</strong> al., 2010). In fact, <strong>in</strong>consistent results may be expla<strong>in</strong>ed by <strong>in</strong>terspecific complementarity which<br />
allows a b<strong>et</strong>ter efficiency <strong>in</strong> resource use but was not taken <strong>in</strong>to account <strong>in</strong> the system expansion approach.<br />
Our proposition was to avoid allocations or system expansion by assess<strong>in</strong>g impacts of ICs from those of SCs.<br />
Indeed, wheat and pea gra<strong>in</strong>s from ICs are of the same quality as those from sole cropp<strong>in</strong>g (Naud<strong>in</strong> <strong>et</strong> al.,<br />
2010), and <strong>in</strong>troduction of ICs <strong>in</strong> cropp<strong>in</strong>g systems is to be considered as a substitution for a comb<strong>in</strong>ation of<br />
both SC wheat and SC pea. Two comparisons were proposed: i) equivalence of area; and ii) equivalence of<br />
production (Fig. 2). The orig<strong>in</strong>ality of this proposition is the <strong>in</strong>troduction <strong>in</strong> <strong>LCA</strong> of approaches l<strong>in</strong>ked with<br />
two <strong>in</strong>dicators currently used for assess<strong>in</strong>g the performances of a multispecific canopy: n<strong>et</strong> biodiversity effect<br />
(Loreau and Hector, 2001), and LER (de Wit and Van den Bergh, 1965). Indeed, the n<strong>et</strong> biodiversity<br />
effect analyses production of biomass on the basis of an equivalence of area, and the LER on the basis of<br />
equivalence of production.<br />
Us<strong>in</strong>g these ways of comparison, results showed that ICs always decreased impacts compared to SCs<br />
(from -13% to -54%). F<strong>in</strong>ally, our proposition <strong>in</strong>volves redef<strong>in</strong><strong>in</strong>g our functional unit and estimat<strong>in</strong>g impacts<br />
for a mix of wheat and pea gra<strong>in</strong>s (<strong>in</strong>clud<strong>in</strong>g gra<strong>in</strong> sort<strong>in</strong>g).<br />
5. Acknowledgment<br />
We gratefully acknowledge the technical staff of LEVA (Laboratoire d’Ecophysiologie Végétale <strong>et</strong><br />
Agroécologie), and of the experimental station of La Jaillière (ARVALIS Institut du Végétal) for their excellent<br />
technical assistance. This work was jo<strong>in</strong>tly founded by ADEME (Agence de l’Environnement <strong>et</strong> de la<br />
Maîtrise de l’Énergie), CASDAR n° 431 and n° 8058 (Compte d’Affectation Spéciale pour le Développement<br />
Agricole <strong>et</strong> Rural), Conseil Général of Ma<strong>in</strong>e-<strong>et</strong>-Loire, UNIP (Union National Interprofessionnel des<br />
plantes riches en Proté<strong>in</strong>es), and FESIA (DIVeRE research program).<br />
470<br />
20<br />
18<br />
16<br />
14<br />
12<br />
10<br />
8<br />
6<br />
4<br />
2<br />
0<br />
Climate Change (t CO CO2 2 eq)<br />
3-<br />
Eutrophication (kg PO4--- PO4 eq) eq)<br />
Total Cumulative Energy Demand (GJ eq)<br />
Equivalence<br />
of cropped area<br />
P50W50 N0 P50W50 N Mean of SCs (P50W50 N0)eq (P50W50 N)eq<br />
(IC on 1ha) (IC on 1ha) (0.5ha of W100 N<br />
+ 0.5ha of P100 N0)<br />
Equivalence of production<br />
compared to IC<br />
(comb<strong>in</strong>ation of SCs;<br />
0.32ha of W100 N<br />
+ 1.11ha of P100 N0)<br />
(comb<strong>in</strong>ation of SCs;<br />
0.48ha of W100 N<br />
+ 0.89ha of P100 N0)
PARALLEL SESSION 5B: METHODOLOGICAL CHALLENGES FOR CROP PRODUCTION SYSTEMS 8 th Int. Conference on<br />
<strong>LCA</strong> <strong>in</strong> the<br />
Agri-<strong>Food</strong> Sector, 1-4 Oct <strong>2012</strong><br />
6. References<br />
Altieri, M.A., 1989. Agroecology: a new research and development paradigm for world agriculture. Agr. Ecosyst. Environ. 27, 37-<br />
46.<br />
Anil, L., Park, J., Phipps, R.H., Miller, F.A., 1998. Temperate <strong>in</strong>tercropp<strong>in</strong>g of cereals for forage: a review of the potential for growth<br />
and utilization with particular reference to the UK. Grass and Forage Science 53, 301-317.<br />
Corre-Hellou, G., Fustec, J., Crozat, Y., 2006. Interspecific comp<strong>et</strong>ition for Soil N and its <strong>in</strong>teraction with N2 fixation, leaf expansion<br />
and crop growth <strong>in</strong> pea-barley <strong>in</strong>tercrops. Plant and Soil 282, 195-208.<br />
De Wit, C.T., Van den Bergh, J.P., 1965. Comp<strong>et</strong>ition b<strong>et</strong>ween herbage plants. N<strong>et</strong>herlands Journal of Agricultural Science 13, 212-<br />
221.<br />
Ekvall, T., F<strong>in</strong>nveden, G., 2001. Allocation <strong>in</strong> ISO 14041 - a critical review. Journal of Cleaner Production 9, 197-208.<br />
Forster, P., Ramaswamy, V., Artaxo, P., Berntsen, T., B<strong>et</strong>ts, R., Fahey, D.W., Haywood, J., Lean, J., Lowe, D.C., Myhre, G.,<br />
Nganga, J., Pr<strong>in</strong>n, R., Raga, G., SchulzMand van Dorland, R. 2007. Changes <strong>in</strong> atmospheric constituents and <strong>in</strong> radiative forc<strong>in</strong>g.<br />
In Climate Change 2007: the physical science basis. Contribution of Work<strong>in</strong>g Group I to the Fourth Assessment Report of the Intergovernmental<br />
Panel on Climate Change, (ed. S. Solomon, D. Q<strong>in</strong>, M. Mann<strong>in</strong>g, Z. Chen, M. Marquis, K.B. Averyt, M. Tignor<br />
and H.L. Miller), pp. 129–234. Cambridge University Press, Cambridge, UK and New York, NY, USA.<br />
Frischknecht R., Jungbluth N., Althaus H.J., Bauer C., Doka G., Dones R., Hischier R., Hellweg S., Humbert S., Köllner .T, Loer<strong>in</strong>cik<br />
Y., Margni M., Nemecek T., 2007. Implementation of life cycle impacts assessment m<strong>et</strong>hods. Eco<strong>in</strong>vent report no. 3, v2.0.<br />
Swiss Centre for Life Cycle Inventories, Dubendorf, Switzerland.<br />
Gu<strong>in</strong>ée, J.B., Gorrée, M., Heijungs, R., Huppes, G., Kleijn, R., de Kon<strong>in</strong>g, A., <strong>et</strong> al., 2002. Life cycle assessment. An operational<br />
guide to the ISO standards. Leiden, The N<strong>et</strong>herlands: Centre of Environmental Science, Leiden University.<br />
Hauggaard-Nielsen, H., Good<strong>in</strong>g, M., Ambus, P., Corre-Hellou, G., Crozat, Y., Dahlmann, C., Dib<strong>et</strong>, A., von Fragste<strong>in</strong>, P., Pristeri,<br />
A., Monti, M., Jensen, E.S., 2009. Pea-barley <strong>in</strong>tercropp<strong>in</strong>g for efficient symbiotic N2-fixation, soil N acquisition and use of<br />
other nutrients <strong>in</strong> European organic cropp<strong>in</strong>g systems. Field Crops Research, 8.<br />
Heijungs, R., Gu<strong>in</strong>ée, J.B., 2007. Allocation and ‘what-if’ scenarios <strong>in</strong> life cycle assessment of waste management systems. Waste<br />
Management 27, 997-1005.<br />
Intergovernmental Panel on Climate Change (IPCC) 2006. 2006 IPCC guidel<strong>in</strong>es for national greenhouse gas <strong>in</strong>ventories (ed. HS<br />
Eggleston, L Buendia, K Miwa, T Ngara and K Tanabe), IGES, Japan.<br />
Jensen, E.S., 1996. Gra<strong>in</strong> yield, symbiotic N2 fixation and <strong>in</strong>terspecific comp<strong>et</strong>ition for <strong>in</strong>organic N <strong>in</strong> pea-barley <strong>in</strong>tercrops. Plant<br />
and Soil 182, 25-38.<br />
Loreau, M., Hector, A., 2001. Partition<strong>in</strong>g selection and complementarity <strong>in</strong> biodiversity experiments. Nature 412, 72-76.<br />
Mosnier, E., van der Werf, H.M.G., Boissy, J., Dourmad, J.-Y., 2011. Evaluation of the environmental implications of the <strong>in</strong>corporation<br />
of feed-use am<strong>in</strong>o acids <strong>in</strong> the manufactur<strong>in</strong>g of pig and broiler feeds us<strong>in</strong>g Life Cycle Assessment. animal 5, 1972-1983.<br />
Naud<strong>in</strong>, C., Corre-Hellou, G., P<strong>in</strong>eau, S., Crozat, Y., Jeuffroy, M.-H., 2010. The effect of various dynamics of N availability on<br />
w<strong>in</strong>ter pea-wheat <strong>in</strong>tercrops: crop growth, N partition<strong>in</strong>g and symbiotic N2 fixation. Field Crops Research. 119, 2-11.<br />
Nemecek T., Kägi T., 2007. Life cycle <strong>in</strong>ventories of Swiss and European agricultural production systems. F<strong>in</strong>al report Eco<strong>in</strong>vent<br />
report v2.0, no. 15, Agroscope Reckenholz-Taenikon Research Station ART. Swiss Centre for Life Cycle Inventories, Zurich and<br />
Dübendorf, Switzerland.<br />
Pelzer, E., Bazot, M., Makowski, D., Corre-Hellou, G., Naud<strong>in</strong>, C., Al Rifaï, M., Baranger, E., Bedoussac, L., Biarnès, V.,<br />
Boucheny, P., Carrouée, B., Dorvillez, D., Foissy, D., Gaillard, B., Guichard, L., Mansard, M.-C., Omon, B., Prieur, L., Yvergniaux,<br />
M., Justes, E., M.-H., J., <strong>2012</strong>. Pea–wheat <strong>in</strong>tercrops <strong>in</strong> low-<strong>in</strong>put conditions comb<strong>in</strong>e high economic performances and low<br />
environmental impacts. European Journal of Agronomy 40, 39-53.<br />
Tilman, D., Cassman, K.G., Matsons, P.A., Naylor, R., Polasky, S., 2002. Agricultural susta<strong>in</strong>ability and <strong>in</strong>tensive production practices.<br />
Nature 418, 671-677.<br />
Willey, R.W., 1979. Intercropp<strong>in</strong>g - Its importance and research needs. Part 1. Comp<strong>et</strong>ition and Yield advantages. Field Crops Abstract.<br />
32, 1-10.<br />
471
PARALLEL SESSION 5B: METHODOLOGICAL CHALLENGES FOR CROP PRODUCTION SYSTEMS8 th Int. Conference on <strong>LCA</strong> <strong>in</strong> the<br />
Agri-<strong>Food</strong> Sector, 1-4 Oct <strong>2012</strong><br />
472<br />
Life cycle assessment at the regional scale: <strong>in</strong>novative <strong>in</strong>sights based<br />
on the systems approach used for uncerta<strong>in</strong>ty characterisation<br />
Ludiv<strong>in</strong>e Pradeleix 1,* , Véronique Bellon Maurel 2 , Philippe Roux 2 , Olivier Philippon 3 , Sami Bouarfa 1<br />
1 Cemagref/Irstea, Jo<strong>in</strong>t Research Unit: G-eau, 361 rue JF Br<strong>et</strong>on, 34196 Montpellier, <strong>France</strong><br />
2 Cemagref/Irstea, Research Unit: Information & technologies for agro-processes, ELSA pole, 361 rue JF Br<strong>et</strong>on, 34196 Montpellier,<br />
<strong>France</strong><br />
3 Montpellier SupAgro, Irc (Institut des Régions Chaudes), 1001 avenue Agropolis, 34093, Montpellier, <strong>France</strong><br />
Correspond<strong>in</strong>g author. E-mail: ludiv<strong>in</strong>e.pradeleix@irstea.fr<br />
ABSTRACT<br />
Rapidly <strong>in</strong>creas<strong>in</strong>g population growth and food requirements call for <strong>in</strong>creases <strong>in</strong> agricultural production, especially <strong>in</strong> irrigated<br />
areas. Environmental impacts aris<strong>in</strong>g from farm<strong>in</strong>g <strong>in</strong>tensification <strong>in</strong> groundwater irrigated areas worldwide are manifold and the<br />
Life Cycle Assessment (<strong>LCA</strong>) is very relevant for assess<strong>in</strong>g these impacts. But a regional <strong>LCA</strong> can not be done by transferr<strong>in</strong>g the<br />
“standard” product-oriented m<strong>et</strong>hodology to this meso-scale, especially <strong>in</strong> a context of data scarcity. Our objective is to propose a<br />
m<strong>et</strong>hodology to build a regional-scale Life Cycle Inventory (LCI) that would account for farm<strong>in</strong>g system diversity, avoid double<br />
count<strong>in</strong>g and make clear allocation rules with<strong>in</strong> this multi product system. We propose to base this m<strong>et</strong>hodology on the Agrarian<br />
System Diagnosis (ASD). This approach leads to a typology of farm<strong>in</strong>g systems which reflects the different agricultural exploitation<br />
modes exist<strong>in</strong>g on a regional scale. Enquiries are then carried out <strong>in</strong> farms representative of each type <strong>in</strong> order to build the <strong>in</strong>ventory,<br />
which leads to a reduction of the uncerta<strong>in</strong>ty. This approach was applied on a case study located <strong>in</strong> Tunisia. N<strong>in</strong>e exist<strong>in</strong>g farm<strong>in</strong>g<br />
system arch<strong>et</strong>ypes and their ma<strong>in</strong> agricultural practices were identified and l<strong>in</strong>ked to their natural and socio-economic conditions.<br />
This typology goes beyond the farm<strong>in</strong>g system structure to describe its function<strong>in</strong>g and dynamics. Be<strong>in</strong>g a valuable approach for<br />
build<strong>in</strong>g a regional LCI, the agrarian system diagnosis could also be useful when assess<strong>in</strong>g the environmental impacts of agricultural<br />
products at farm and crop scale. Indeed, this m<strong>et</strong>hod allows us to build a typology of realistic situations <strong>in</strong>stead of a virtual average<br />
system, and to support b<strong>et</strong>ter allocation for multi product systems.<br />
Keywords: variability, LCI, irrigation, agrarian system diagnosis<br />
1. Introduction<br />
Rapidly <strong>in</strong>creas<strong>in</strong>g population growth and food requirements call for an <strong>in</strong>crease <strong>in</strong> agricultural production,<br />
out of 40% is provided by irrigated areas. The International Water Management Institute has called for<br />
“more crop per drop” (Molden, 2007). And drip irrigation is endorsed as it is less water <strong>in</strong>tensive par area<br />
than surface irrigation. But eventually this technique led to manifold <strong>in</strong>direct environmental impacts such as<br />
cropland extension, global <strong>in</strong>put <strong>in</strong>tensification and groundwater overexploitation due to <strong>in</strong>dividually managed<br />
tube wells . It is therefore essential to develop tools <strong>in</strong> order to assess the impact of various agricultural<br />
plann<strong>in</strong>g scenarios <strong>in</strong> irrigated areas.<br />
Life Cycle Assessment could be a candidate tool. As public water management and decision mak<strong>in</strong>g is<br />
carried out, Life Cycle Assessment (<strong>LCA</strong>) should be applied at regional scale, which is still a m<strong>et</strong>hodological<br />
challenge (Gu<strong>in</strong>ée <strong>et</strong> al., 2011). In spite of be<strong>in</strong>g product oriented, several authors underl<strong>in</strong>e <strong>LCA</strong> relevancy<br />
at regional scale, namely for a farm<strong>in</strong>g region, def<strong>in</strong>ed as a s<strong>et</strong> of farms <strong>in</strong> a given geographical area (Aub<strong>in</strong>,<br />
<strong>et</strong> al., 2011; Payraudeau and Van der Werf, 2005).<br />
Account<strong>in</strong>g for the variability of farm<strong>in</strong>g systems and management practices is one of the ma<strong>in</strong> challenges <strong>in</strong><br />
agricultural <strong>LCA</strong> (Nemecek <strong>et</strong> al., 2010). Unlike the case described by Payraudeau <strong>et</strong> al., (2005), the farm<br />
population <strong>in</strong> an irrigated area is too large to be surveyed one by one. Review<strong>in</strong>g 70 <strong>LCA</strong> studies conducted<br />
<strong>in</strong> tropical and semi-arid locations, Bass<strong>et</strong>-Mens <strong>et</strong> al., (2010), highlighted the failure to account for farm<strong>in</strong>g<br />
system diversity and the lack of specific data and data collection m<strong>et</strong>hods. Build<strong>in</strong>g up farm typologies is a<br />
way of deal<strong>in</strong>g with the great variability of flows related to agricultural practices (Dalgaard <strong>et</strong> al., 2006).<br />
Some studies already performed <strong>LCA</strong> at regional scale. At this scale, statistics e.g. the Farm Accounts Data<br />
N<strong>et</strong>work (FADN) were used for build<strong>in</strong>g farm typologies (Dalgaard <strong>et</strong> al., 2006, Mishima <strong>et</strong> al., 2005),<br />
ma<strong>in</strong>ly because they are <strong>in</strong> l<strong>in</strong>e with <strong>LCA</strong> for be<strong>in</strong>g product oriented (Weidema and Meeusen 2000). Non<strong>et</strong>heless,<br />
this approach cannot be widely applied: on the one hand, very few countries <strong>in</strong> the world offer agricultural<br />
statistics device and on the other hand these statistics are based on economic <strong>in</strong>puts and outputs (I/O)<br />
and thus present several drawbacks for <strong>LCA</strong> purposes. Agriculture is poorly described by I/O because it is<br />
ma<strong>in</strong>ly dependent on many self produced resources (Haas, <strong>et</strong> al., 2000) and also because data are expressed<br />
<strong>in</strong> mon<strong>et</strong>ary units; a large uncerta<strong>in</strong>ty (Huijbregts, 1998) is then l<strong>in</strong>ked with major environmental impact<strong>in</strong>g<br />
flows such as fertilisers and chemicals. Moreover, the European Commission, (2010) mentioned that when<br />
perform<strong>in</strong>g a <strong>LCA</strong>, data related to the foreground system, i.e. field scale agricultural production, should be<br />
<strong>in</strong>ventory specific.<br />
Fac<strong>in</strong>g a double challenge of data scarcity <strong>in</strong> the context of Southern countries and high variability of
PARALLEL SESSION 5B: METHODOLOGICAL CHALLENGES FOR CROP PRODUCTION SYSTEMS 8 th Int. Conference on<br />
<strong>LCA</strong> <strong>in</strong> the<br />
Agri-<strong>Food</strong> Sector, 1-4 Oct <strong>2012</strong><br />
crop management practices <strong>in</strong> irrigated areas, we propose a new m<strong>et</strong>hodological framework to model activity<br />
data and build a regional model of agriculture, with the objective of reduc<strong>in</strong>g the uncerta<strong>in</strong>ty. In this paper,<br />
we propose to adapt the m<strong>et</strong>hodology of agrarian system diagnosis for modell<strong>in</strong>g farm<strong>in</strong>g systems to create<br />
as accurate as possible Life Cycle Inventories. This m<strong>et</strong>hodological framework enables us to characterise the<br />
uncerta<strong>in</strong>ty l<strong>in</strong>ked to the “real world variability” and to imprecision also called epistemic uncerta<strong>in</strong>ty (Huijbregts,<br />
1998). Prelim<strong>in</strong>ary results of the agrarian system diagnosis conducted <strong>in</strong> Tunisia are presented. F<strong>in</strong>ally<br />
relative pros and cons of this m<strong>et</strong>hodological framework for conduct<strong>in</strong>g a regional <strong>LCA</strong> are discussed.<br />
2. Material and M<strong>et</strong>hods<br />
2.1 Adapt<strong>in</strong>g the m<strong>et</strong>hodology of Agrarian System Diagnosis for build<strong>in</strong>g a Life Cycle Inventory at regional<br />
scale<br />
Below is a brief description of the several steps of the Agrarian System Diagnosis (ASD) hereafter designated<br />
“diagnosis” and of adaptations made for <strong>LCA</strong> purposes (right column). This framework for build<strong>in</strong>g<br />
LC <strong>in</strong>ventory should allow us to reduce the global uncerta<strong>in</strong>ty <strong>in</strong> the <strong>LCA</strong>; this demonstration is part of the<br />
results.<br />
Table 1. Proposed m<strong>et</strong>hodology for adapt<strong>in</strong>g the Agrarian System Diagnosis (ASD) to Life Cycle Assessment.<br />
Step<br />
n°<br />
Major Steps of Agrarian Systems Diagnosis Orig<strong>in</strong>al Agrarian Systems<br />
Diagnosis<br />
0 Choice of a pilot zone<br />
Study of available <strong>in</strong>formation sources: Maps,<br />
previous studies (soil, slope, climate, water<br />
resources)<br />
1a Landscape analysis / identification of agro ecological<br />
units (soil, slope) and pre-types of cropp<strong>in</strong>g<br />
and livestock systems<br />
1b Historical analysis / <strong>in</strong>terviews<br />
Climate hazards frequency<br />
2 Surveys of cropp<strong>in</strong>g and livestock systems (diversity,<br />
vari<strong>et</strong>ies, soil fertility management,<br />
animal feed<strong>in</strong>g calendar…)<br />
3a Sampl<strong>in</strong>g design of farms to be surveyed for<br />
each farm<strong>in</strong>g system pre-type (steps 1 &2).<br />
Sampl<strong>in</strong>g criteria: maximise diversity, farms<br />
chosen accord<strong>in</strong>g to criteria expla<strong>in</strong><strong>in</strong>g diversity.<br />
3b In depth <strong>in</strong>terviews of Farm<strong>in</strong>g Systems: technoeconomic<br />
characterisation: cross-check<strong>in</strong>g of<br />
qualitative and quantitative <strong>in</strong>formation, iterative<br />
process, systems triangulation procedure<br />
Selection criteria: Most of knowledge<br />
Identify cultivation dynamics,<br />
spatial distribution<br />
For captur<strong>in</strong>g past differentiation<br />
processes.<br />
Focus on spatial distribution, crop<br />
sequences, crop-animal <strong>in</strong>teractions<br />
Farms illustrat<strong>in</strong>g differentiation<br />
processes<br />
Focus on Practices and Economy<br />
Focus on farm strategy, opportunities<br />
and bottlenecks l<strong>in</strong>ked to<br />
capital, labour force, <strong>et</strong>c.<br />
4 Extrapolation to the whole area Based on local knowledge about<br />
the representation of each type <strong>in</strong><br />
the whole area.<br />
Agrarian Systems Diagnosis<br />
<strong>LCA</strong> oriented<br />
Selection criteria: Worst case<br />
with regard to potential environmental<br />
impacts<br />
Identify vulnerable areas with<br />
regard to major impacts<br />
Identify <strong>in</strong>novative systems<br />
Foresee potential evolutions<br />
Investigate co-product dest<strong>in</strong>ation,<br />
material flows b<strong>et</strong>ween<br />
farms<br />
Focus on potential environmental<br />
impacts drivers (contrasted<br />
yields, fertilisers and<br />
agrochemicals).<br />
Select farms with most records.<br />
Focus on <strong>in</strong>put/output quantification<br />
(e.g. fertilisers & agrochemicals),<br />
<strong>in</strong>clud<strong>in</strong>g <strong>in</strong>ternal<br />
flows<br />
Only necessary for “snapshot”<br />
<strong>LCA</strong>, not for agricultural plann<strong>in</strong>g<br />
scenarios.<br />
We propose to mobilise the Agrarian System Diagnosis (ASD), hereafter designated “diagnosis”, to<br />
model the agricultural region for <strong>LCA</strong> purposes. ASD was <strong>in</strong>itially designed for targ<strong>et</strong><strong>in</strong>g farm diversity <strong>in</strong><br />
development projects. For be<strong>in</strong>g systems oriented, ASD aims at understand<strong>in</strong>g the diversity and complexity<br />
of regional agricultural production modes at different scales and then model them <strong>in</strong>to a farm<strong>in</strong>g systems<br />
typology. Farm<strong>in</strong>g systems all tog<strong>et</strong>her are <strong>in</strong>terconnected and compose the agrarian system at the regional<br />
scale (Coch<strong>et</strong>, 2011). Each farm<strong>in</strong>g system is modelled as functionally representative of a s<strong>et</strong> of comparable<br />
production units. These units carry out a given comb<strong>in</strong>ation of cropp<strong>in</strong>g systems (crop rotation and associated<br />
cultivation practices) and livestock systems and rely on comparable resources and socio-economics<br />
constra<strong>in</strong>ts (Coch<strong>et</strong> and Devienne, 2006; Moreau <strong>et</strong> al., <strong>2012</strong>).<br />
473
PARALLEL SESSION 5B: METHODOLOGICAL CHALLENGES FOR CROP PRODUCTION SYSTEMS8 th Int. Conference on <strong>LCA</strong> <strong>in</strong> the<br />
Agri-<strong>Food</strong> Sector, 1-4 Oct <strong>2012</strong><br />
The modell<strong>in</strong>g process is progressive but not l<strong>in</strong>ear, and iterative with several feedback procedures.<br />
Table 1 is a brief description of the several steps of the ASD and of some adaptations made for <strong>LCA</strong> purposes.<br />
Start<strong>in</strong>g from a global standpo<strong>in</strong>t by analys<strong>in</strong>g landscape h<strong>et</strong>erogeneity on maps (# 0) and <strong>in</strong> the field<br />
(#1a), several hypothesis about spatial distribution of cropp<strong>in</strong>g systems are formulated. Then, assumptions<br />
are checked dur<strong>in</strong>g field surveys (#2) and cropp<strong>in</strong>g systems are modelled; other hypothesis on their comb<strong>in</strong>ation<br />
are made <strong>in</strong>to a pre-typology of farm<strong>in</strong>g systems. For each pre type, a s<strong>et</strong> of representative farms is sampled<br />
(#3a) and <strong>in</strong> depth <strong>in</strong>terviewed (#3b). F<strong>in</strong>ally, an arch<strong>et</strong>ype is designed, whose agricultural practices and<br />
economical values are modelled for a “normal year”, i.e. exceptional events are not modelled (#1b). The<br />
arch<strong>et</strong>ype is modelled for be<strong>in</strong>g for the most probable case accord<strong>in</strong>g to the farm structure, its objective,<br />
opportunities and constra<strong>in</strong>ts. This approach is system-oriented: it uses triangulation for ensur<strong>in</strong>g data reliability,<br />
cross check<strong>in</strong>g structural, functional and historical <strong>in</strong>formation about farm<strong>in</strong>g systems. In the same<br />
ve<strong>in</strong>, discipl<strong>in</strong>ary viewpo<strong>in</strong>ts and scales of analysis enrich data consistency. F<strong>in</strong>ally, technical and economic<br />
thresholds are calculated for each farm<strong>in</strong>g system for outliers identification. A restitution to surveyed people<br />
and local expert allows us check<strong>in</strong>g data compl<strong>et</strong>eness and validat<strong>in</strong>g their reliability.<br />
2.2 Characteristics of the irrigated pla<strong>in</strong> of Kairouan, Tunisia<br />
Located <strong>in</strong> central Tunisia, <strong>in</strong> semi arid to arid climate, area under study is an alluvial pla<strong>in</strong> of 30 000 ha<br />
and comprises around 2 000 farms. Agriculture has much evolved with drip irrigation <strong>in</strong>troduction, from<br />
sheep herd<strong>in</strong>g and ra<strong>in</strong> fed cereals and low density olive groves to irrigated veg<strong>et</strong>ables, fruit orchards and<br />
high density olive groves. Groundwater provides irrigation water and is overexploited. Non<strong>et</strong>heless, economic<br />
profitability of irrigated crops led people to drill unauthorised boreholes. A pilot area of 6 000 ha out<br />
of 30 000 ha was selected for be<strong>in</strong>g a hotspot <strong>in</strong> terms of water exploitation and <strong>in</strong>tensification of agricultural<br />
management practices, i.e. several crop cycles per year and numerous <strong>in</strong>tercropp<strong>in</strong>g. Data were collected by<br />
two students dur<strong>in</strong>g a three month stay.<br />
3. Results<br />
Hereafter, we demonstrate how the new framework based on ASD for LCI can support the characterisation<br />
of uncerta<strong>in</strong>ty sources <strong>in</strong> a regional <strong>LCA</strong> and public decision mak<strong>in</strong>g for land plann<strong>in</strong>g options. Uncerta<strong>in</strong>ty<br />
sources are manifold when aim<strong>in</strong>g at modell<strong>in</strong>g the Life Cycle Inventory of an agricultural region.<br />
They are usually separated <strong>in</strong>to variability of the “real world” and uncerta<strong>in</strong>ty (Huijbregts, 1998).<br />
3.1 M<strong>et</strong>hodological output: the Agrarian System Diagnosis as a m<strong>et</strong>hodology to characterise uncerta<strong>in</strong>ty <strong>in</strong><br />
agricultural Life Cycle Inventories<br />
Figure 1 describes the sources of uncerta<strong>in</strong>ty <strong>in</strong> LCI of agricultural systems and the solutions proposed to<br />
characterise them via the ASD framework<br />
In the upper part of the figure, uncerta<strong>in</strong>ty sources found at the regional scale are listed, <strong>in</strong> l<strong>in</strong>e with uncerta<strong>in</strong>ty<br />
classification proposed by Huijbregts (1998). In the lower part the way the Agrarian System Diagnosis<br />
contributes to characterise each uncerta<strong>in</strong>ty source is expla<strong>in</strong>ed. In the very bottom part we describe<br />
how regional <strong>LCA</strong> outcomes can support public land plann<strong>in</strong>g decision mak<strong>in</strong>g.The Variability b<strong>et</strong>ween<br />
Sources and Objects (VBSO) stands for the “differences <strong>in</strong> <strong>in</strong>puts and emissions of comparable processes <strong>in</strong><br />
a product system”; param<strong>et</strong>er uncerta<strong>in</strong>ty is caused by <strong>in</strong>accurate, unrepresentative, <strong>in</strong>compl<strong>et</strong>e data e.g.<br />
chemicals specifications; uncerta<strong>in</strong>ty due to choices orig<strong>in</strong>ates from choices made regard<strong>in</strong>g allocation,<br />
Functional Unit, and the LCIA stage that is out of our scope; model uncerta<strong>in</strong>ty also occurs dur<strong>in</strong>g the LCIA<br />
stage.<br />
Five out of the six categories of uncerta<strong>in</strong>ty sources are addressed by the ASD. Only model uncerta<strong>in</strong>ty is<br />
totally beyond our study scope.<br />
As expla<strong>in</strong>ed above, uncerta<strong>in</strong>ty related to variability of farm<strong>in</strong>g systems and management practices is<br />
addressed by build<strong>in</strong>g a functional typology of farm<strong>in</strong>g systems and cropp<strong>in</strong>g / livestock systems based on<br />
practices modell<strong>in</strong>g. Practices are contextualised and different from standard technical guidel<strong>in</strong>es.<br />
The typology allows account<strong>in</strong>g for VBSO❶ and spatial variability over the studied region. Then, a sample<br />
s<strong>et</strong> of farms is <strong>in</strong>-depth <strong>in</strong>terviewed for each identified type. Intra type variability (VBSO❷) should be less<br />
than <strong>in</strong>ter-type variability (VBSO❶). If not, a new type should be designed by splitt<strong>in</strong>g the type with high<br />
variability. Exceptional values due to temporal variability (e.g. climate hazards) for <strong>in</strong>stance and look<strong>in</strong>g<br />
<strong>in</strong>consistent with regard to the function<strong>in</strong>g identified are discarded. The arch<strong>et</strong>ype built at farm scale is<br />
drawn after param<strong>et</strong>er uncerta<strong>in</strong>ty has been reduced and allocations have been made clear; This is done re-<br />
474
PARALLEL SESSION 5B: METHODOLOGICAL CHALLENGES FOR CROP PRODUCTION SYSTEMS 8 th Int. Conference on<br />
<strong>LCA</strong> <strong>in</strong> the<br />
Agri-<strong>Food</strong> Sector, 1-4 Oct <strong>2012</strong><br />
spectively by runn<strong>in</strong>g several procedures of data consistency check<strong>in</strong>g (cf. part 2.2) and by survey<strong>in</strong>g the<br />
whole farm<strong>in</strong>g system and <strong>in</strong>terconnections b<strong>et</strong>ween farms.<br />
Figure 1. Sources of uncerta<strong>in</strong>ty <strong>in</strong> LCI of agricultural systems and solutions proposed to characterise them<br />
with<strong>in</strong> the Agrarian System Diagnosis (ASD) framework<br />
3.2 Prelim<strong>in</strong>ary results<br />
N<strong>in</strong>e arch<strong>et</strong>ypes of farm<strong>in</strong>g systems and sub systems (cropp<strong>in</strong>g and livestock systems) were modelled <strong>in</strong><br />
the pilot area, illustrat<strong>in</strong>g a high variability. A large range of cultivated species, crop sequences and associated<br />
crop management practices were identified. This is usual <strong>in</strong> irrigated areas because ra<strong>in</strong>fall is no more a<br />
limit<strong>in</strong>g factor for grow<strong>in</strong>g crops. Olive groves, a crop shared by most of farm<strong>in</strong>g systems, is part of very<br />
diverse cropp<strong>in</strong>g systems. Indeed, density, irrigation management and <strong>in</strong>tercropp<strong>in</strong>g vary among olive-grove<br />
based cropp<strong>in</strong>g systems. Veg<strong>et</strong>ables <strong>in</strong>tercropp<strong>in</strong>g is widespread, mostly dur<strong>in</strong>g unproductive stage of perennial<br />
crops. The smaller the cultivated area is, the more crops are <strong>in</strong>tercropped. The level of <strong>in</strong>tensification<br />
regard<strong>in</strong>g crop <strong>in</strong>puts and water quantities vary from a factor one to five. Land productivity is high <strong>in</strong> case of<br />
several crop cycles per year or overlapp<strong>in</strong>g crop cycles. These results illustrate the degree of complexity of<br />
cropp<strong>in</strong>g systems <strong>in</strong> irrigated areas, especially <strong>in</strong> case of <strong>in</strong>tercropp<strong>in</strong>g, and the need for hav<strong>in</strong>g a typologybased<br />
<strong>in</strong>ventory.<br />
Indeed, the m<strong>et</strong>hodology proposed for arch<strong>et</strong>ype modell<strong>in</strong>g enable us to design the typology, accord<strong>in</strong>g to<br />
uncerta<strong>in</strong>ty source and also accord<strong>in</strong>g to its magnitude <strong>in</strong> case of "Variability B<strong>et</strong>ween Sources and Objects".<br />
4. Discussion<br />
The objectives of a farm<strong>in</strong>g system typology for <strong>LCA</strong> purposes were: “to lower data variability, thereby<br />
allow<strong>in</strong>g a b<strong>et</strong>ter selection of representative farms for d<strong>et</strong>ailed research; b<strong>et</strong>ter d<strong>et</strong>erm<strong>in</strong>e the marg<strong>in</strong>al effects<br />
of a studied change.” (L<strong>in</strong>deijer and Weidema, 2000).<br />
The m<strong>et</strong>hodological framework we propose, namely the ASD-based <strong>LCA</strong> is a powerful m<strong>et</strong>hod for <strong>LCA</strong>oriented<br />
data collection that accounts for farm<strong>in</strong>g systems and practices variability and provide <strong>LCA</strong> spe-<br />
475
PARALLEL SESSION 5B: METHODOLOGICAL CHALLENGES FOR CROP PRODUCTION SYSTEMS8 th Int. Conference on <strong>LCA</strong> <strong>in</strong> the<br />
Agri-<strong>Food</strong> Sector, 1-4 Oct <strong>2012</strong><br />
cific activity data “for a marg<strong>in</strong>al supplementary effort.” ASD is of higher <strong>in</strong>terest s<strong>in</strong>ce farm<strong>in</strong>g systems and<br />
sub systems modell<strong>in</strong>g are based on <strong>in</strong> depth analysis of agricultural practices that are to be turned <strong>in</strong>to LCI<br />
data. Consistency of each type is ensured by calculations of technical and economical thresholds. The consistency<br />
of activity data is also enhanced by collect<strong>in</strong>g data at different scales, cross<strong>in</strong>g field observations and<br />
farm and literature surveys.<br />
The farm arch<strong>et</strong>ype that is modelled is neither a virtual farm average (Bass<strong>et</strong>-Mens <strong>et</strong> al., 2009; Dalgaard<br />
<strong>et</strong> al., 2006) nor a s<strong>in</strong>gle farm chosen by experts for be<strong>in</strong>g representative (Haas <strong>et</strong> al., 2005). On the contrary,<br />
regard<strong>in</strong>g temporal variability, the farm arch<strong>et</strong>ype is built for a “normal year” whereas statistics or farm account<strong>in</strong>g<br />
data would refer to a s<strong>in</strong>gle year. Thus, yields were “modelled” to represent a normal year, <strong>in</strong>stead<br />
of be<strong>in</strong>g averaged. For example, due to climate hazards yields of pepper ranged from 1.6 to 3.2t/ha; the<br />
“modelled” yield was 3t/ha and the average one 2.5t/ha, i.e. there is a 25% difference which would change<br />
significantly the <strong>LCA</strong> outcomes, especially if impacts are expressed per mass unit.<br />
Param<strong>et</strong>er uncerta<strong>in</strong>ty can be large if used data are not specific. In ASD-based <strong>LCA</strong> we are able to calibrate<br />
our own data collection to <strong>LCA</strong> requirements and <strong>in</strong>clude critical flows expected to heavily impact<br />
conversely to statistics and FADN data (Dalgaard <strong>et</strong> al., 2006). Indeed, fertilisers elements, agrochemicals<br />
properties and d<strong>et</strong>ails about <strong>in</strong>tercropp<strong>in</strong>g are crucially lack<strong>in</strong>g <strong>in</strong>to these generic databases. Extension services<br />
acknowledge that some values, such as cultivated areas <strong>in</strong> <strong>in</strong>tercropp<strong>in</strong>g systems, can be registered<br />
twice <strong>in</strong> local statistics (personal comm.); this may be highly mislead<strong>in</strong>g s<strong>in</strong>ce this practice is widespread on<br />
our field study.<br />
ASD allows us to identify <strong>in</strong>novative cropp<strong>in</strong>g systems and current tendencies even if <strong>in</strong> m<strong>in</strong>ority, conversely<br />
to statistics already outdated when published. The holistic standpo<strong>in</strong>t provides important <strong>in</strong>sights<br />
regard<strong>in</strong>g allocation rules. Indeed, statistics prevent the <strong>LCA</strong> practitioner from design<strong>in</strong>g allocation rules<br />
among the numerous products of the farm, especially mixed ones which are highly represented <strong>in</strong> our study<br />
area. Efole Ewoukem <strong>et</strong> al., (<strong>2012</strong>) highlighted that mixed up farm<strong>in</strong>g systems tend to make the most of their<br />
limited resources and allocate biomass among several productions, thus mak<strong>in</strong>g allocation rules more complex.<br />
Other limitations of the statistic approach for build<strong>in</strong>g farm<strong>in</strong>g systems typology is that farm function<strong>in</strong>g<br />
cannot be described (Dalgaard, 2000), by-products and near-to-zero values are overlooked (L<strong>in</strong>deijer and<br />
Weidema, 2000), and data could be too much aggregated (Coch<strong>et</strong> and Devienne, 2006).<br />
5. Conclusion<br />
ASD demonstrated its ability to help us design<strong>in</strong>g and characteris<strong>in</strong>g typical farm<strong>in</strong>g systems and their<br />
crop and livestock components, <strong>in</strong> qualitative and quantitative terms. This m<strong>et</strong>hod of typology is particularly<br />
relevant when data are scarce and key criteria for classify<strong>in</strong>g the population of farms cannot be taken from<br />
statistics nor from expert knowledge (Dalgaard <strong>et</strong> al., 2006; Haas <strong>et</strong> al., 2005). The agrarian system approach<br />
decreases uncerta<strong>in</strong>ty l<strong>in</strong>ked to the <strong>in</strong>herent variability of “real agriculture” (i.e. farm<strong>in</strong>g systems and management<br />
practices). Unlike statistics that process data and deduce mathematical correlations b<strong>et</strong>ween variables,<br />
this approach make causalities clear with<strong>in</strong> the frame of each farm<strong>in</strong>g system function<strong>in</strong>g.<br />
Moreover, by reveal<strong>in</strong>g material and energy <strong>in</strong>terconnection flows b<strong>et</strong>ween farms or with<strong>in</strong> a farm, it allows<br />
for clearer burden allocation rules among the different product systems. Double count<strong>in</strong>g could also be<br />
avoided through the ASD holistic standpo<strong>in</strong>t. Indeed, farm<strong>in</strong>g systems that are diversified are likely to support<br />
<strong>in</strong>terconnection flows and thus would particularly benefit from this approach.<br />
In addition, this work supports the identification of each farm<strong>in</strong>g system’s room for manoeuvre to mitigate<br />
their environmental impact, with<strong>in</strong> agro-ecological and technical values that def<strong>in</strong>e their range of existence.<br />
Based on this m<strong>et</strong>hodology and the typology, our next objective is to compl<strong>et</strong>e the characterisation of<br />
farm<strong>in</strong>g systems arch<strong>et</strong>ypes, conduct <strong>LCA</strong> and lastly assess alternative land plann<strong>in</strong>g scenarios for agriculture<br />
based on the diagnosis outputs.<br />
6. References<br />
Aub<strong>in</strong>, B., Donnars, C., Supkova, M., Le Perchec, S. <strong>et</strong> Dor<strong>in</strong>, B., 2011. Méthodes D’évaluation. Panorama Critique. <strong>in</strong> duALIne -<br />
Durabilité De L’alimentation Face à De Nouveaux Enjeux. Questions à La Recherche, (Coords.), , <strong>in</strong>: N. Esnouf, C., Russel, M.<br />
<strong>et</strong> Bricas (ed.) Pour Une Alimentation Durable. Réflexion Stratégique duALIne. Paris, pp. 164–184.<br />
Bass<strong>et</strong>-Mens, C., Benoist, A., Bessou, C., Tran, T., Perr<strong>et</strong>, S., Vayssières, J. and Wassenaar, T., 2010.Is <strong>LCA</strong>-based Eco-labell<strong>in</strong>g<br />
Reasonable ? The Issue of Tropical <strong>Food</strong> Products, <strong>in</strong> Lcafood2010.uniba.it.<br />
Bass<strong>et</strong>-Mens, C., Kelliher, F. M., Ledgard, S. and Cox, N., 2009. Uncerta<strong>in</strong>ty of Global Warm<strong>in</strong>g Potential for Milk Production on a<br />
New Zealand Farm and Implications for Decision Mak<strong>in</strong>g. The International Journal of Life Cycle Assessment 14, (7) 630–638.<br />
Coch<strong>et</strong>, H., 2011. L’agriculture Comparée, Quae, Paris.<br />
476
8 th Int. Conference on <strong>LCA</strong> <strong>in</strong> the<br />
Agri-<strong>Food</strong> Sector, 1-4 Oct <strong>2012</strong><br />
Coch<strong>et</strong>, H. and Devienne, S., 2006. Fonctionnement Et Performances Économiques Des Systèmes De Production Agricole : Une<br />
Démarche à l ’échelle Régionale. Cahiers Agricultures 15, 578–583.<br />
Dalgaard, R., Halberg, N., Kristensen, I. S. and Larsen, I., 2006. Modell<strong>in</strong>g Representative and Coherent Danish Farm Types Based<br />
on Farm Accountancy Data for Use <strong>in</strong> Environmental Assessments. Agriculture, Ecosystems & Environment 117, (4) 223–237.<br />
Dalgaard, T., 2000. Farm Types – How Can They Be Used to Structure, Model, and Generalise Farm Data? , <strong>in</strong>: B. P. Weidema and<br />
M. J. . Meeusen (eds) Agricultural Data for Life Cycle Assessment.Vol. 2. The Hague, pp. 98–114.<br />
Efole Ewoukem, T., Aub<strong>in</strong>, J., Mikolasek, O., Corson, M. S., Tomedi Eyango, M., Tchoumboue, J., Van der Werf, H. M. G. and<br />
Ombredane, D., <strong>2012</strong>. Environmental Impacts of Farms Integrat<strong>in</strong>g Aquaculture and Agriculture <strong>in</strong> Cameroon. Journal of Cleaner<br />
Production 28, 208–214.<br />
European Commission, 2010. ILCD Handbook - General Guide for Life Cycle Assessment-d<strong>et</strong>ailed Guidance, Ispra, Italy.<br />
Gu<strong>in</strong>ée, J. B., Heijungs, R., Huppes, G., Zamagni, A., Masoni, P., Buonamici, R., Ekvall, T. and Rydberg, T., 2011. Life Cycle Assessment:<br />
Past, Present, and Future. Environmental science & technology 45, (1) 90–6.<br />
Haas, G., Geier, U., Frieben, B. and Köpke, U., 2005. Estimation of Environmental Impact of Conversion to Organic Agriculture <strong>in</strong><br />
Hamburg Us<strong>in</strong>g the Life-Cycle-Assessment M<strong>et</strong>hod, .<br />
Haas, G., W<strong>et</strong>terich, F. and Geier, U., 2000. Life Cycle Assessment Framework <strong>in</strong> Agriculture on the Farm Level. International<br />
Journal of Life Cycle Assessment 5, (6) 345–348.<br />
Huijbregts, M. A. J., 1998. Application of Uncerta<strong>in</strong>ty and Variability <strong>in</strong> <strong>LCA</strong>. Part I: A General Framework for the Analysis of<br />
Uncerta<strong>in</strong>ty and Variability <strong>in</strong> Life Cycle Assessment. International Journal of Life Cycle Assessment 3, (5) 273–280.<br />
L<strong>in</strong>deijer, E. and Weidema, B. P., 2000. Conclusions of the Work<strong>in</strong>g Group on Farm Typologies , <strong>in</strong>: B. P. Weidema and M. J. .<br />
Meeusen (eds) Agricultural Data for Life Cycle Assessment.Vol. 2. The Hague, pp. 145–146.<br />
Meeusen, M. J. . and Weidema, B. P., 2000.Agricultural Data for Life Cycle Assessments, <strong>in</strong> European Invitational Expert Sem<strong>in</strong>ar<br />
on Life Cycle Assessment of <strong>Food</strong> Products.<br />
Mishima, S., Taniguchi, S. and Komada, M., 2005. Adaptation of Life Cycle Assessment (<strong>LCA</strong>) to Agricultural Production on a<br />
Regional Scale <strong>in</strong> Japan. Ecology 81, 671–678.<br />
Molden, D., 2007. Water for <strong>Food</strong>, Water for Life: A Comprehensive Assessment of Water Management <strong>in</strong> Agriculture., London.<br />
Moreau, P., Ruiz, L., Mabon, F., Raimbault, T., Durand, P., Delaby, L., Devienne, S. and Vertès, F., <strong>2012</strong>. Reconcil<strong>in</strong>g Technical,<br />
Economic and Environmental Efficiency of Farm<strong>in</strong>g Systems <strong>in</strong> Vulnerable Areas. Agriculture, Ecosystems and Environment<br />
147, (1) 89-99.<br />
Nemecek, T., Knuchel, R. F., Alig, M. and Gaillard, G., 2010.The Advantages of Generic <strong>LCA</strong> Tools for Agriculture : Examples<br />
SA<strong>LCA</strong>crop and SA<strong>LCA</strong>farm, <strong>in</strong> Life Cycle Assessment <strong>in</strong> the Agri-food Sector.<br />
Payraudeau, S., Van Der Werf, H. M. G. and Vertès, F., 2005. Evaluation of an Operational M<strong>et</strong>hod for the Estimation of Emissions<br />
of Nitrogen Compounds for a Group of Farms. International Journal of Agricultural Resources, Governance and Ecology 5, 224-<br />
246.<br />
Payraudeau, S. and Van der Werf, H. M., 2005. Environmental Impact Assessment for a Farm<strong>in</strong>g Region: a Review of M<strong>et</strong>hods.<br />
Agriculture, Ecosystems & Environment 107, (1) 1-19.<br />
477
PARALLEL SESSION 6A: TOOLS AND DATABASES 8 th Int. Conference on <strong>LCA</strong> <strong>in</strong> the<br />
Parallel session 6a: Tools and Databases<br />
478<br />
Agri-<strong>Food</strong> Sector, 1-4 Oct <strong>2012</strong><br />
Generic model for calculat<strong>in</strong>g carbon footpr<strong>in</strong>t of milk - applied to<br />
Denmark and Sweden<br />
1 2.-0 <strong>LCA</strong> consultants, Skibbrogade 5, 1, 9000 Aalborg, Denmark<br />
2 Arla <strong>Food</strong>s, Sønderhøj 14, 8260 Viby J, Denmark<br />
Correspond<strong>in</strong>g author. E-mail: rad@lca-n<strong>et</strong>.com<br />
Randi Dalgaard 1,* , Anna Flysjö 2 , Jannick Schmidt 1<br />
ABSTRACT<br />
The aim of the study is to develop a tool, which can be used for calculation of carbon footpr<strong>in</strong>t/<strong>LCA</strong> of milk both at a farm level and<br />
at a national level. The functional unit is ‘1 kg energy corrected milk (ECM) at farm gate’ and the applied m<strong>et</strong>hodology is life cycle<br />
assessment (<strong>LCA</strong>). The model <strong>in</strong>cludes switches that enables for, with<strong>in</strong> the same scope, transform<strong>in</strong>g the results to comply with 1)<br />
consequential <strong>LCA</strong>, 2) allocation/average modell<strong>in</strong>g (or ‘attributional <strong>LCA</strong>’), 3) IDF (2010) guide to standard <strong>LCA</strong> m<strong>et</strong>hodology for<br />
the dairy <strong>in</strong>dustry, and 4) PAS2050 (Carbon Trust <strong>et</strong> al., 2010). Results are presented for average Danish and Swedish milk produced<br />
<strong>in</strong> 2005us<strong>in</strong>g the four different ‘switches’.<br />
Keywords: milk, farm<strong>in</strong>g system, <strong>LCA</strong> m<strong>et</strong>hodology, system expansion, carbon footpr<strong>in</strong>t, attributional and consequential <strong>LCA</strong><br />
1. Introduction<br />
Dairy production – from farm to r<strong>et</strong>ail – represents 2.7% (±26%) of global anthropogenic greenhouse gas<br />
(GHG) emissions, where about 80-90% occurs before farm gate (Gerber <strong>et</strong> al., 2010). The dairy company<br />
Arla <strong>Food</strong>s is one of many companies committed to reduce GHG emissions <strong>in</strong> the whole value cha<strong>in</strong>. One<br />
action is to develop a tool to assess the carbon footpr<strong>in</strong>t at farm level.<br />
The aim of the study is to establish a generic model, which can be used for calculation of carbon footpr<strong>in</strong>t/<strong>LCA</strong><br />
of milk. The model has certa<strong>in</strong> facilities, which makes it useful for carbon footpr<strong>in</strong>t calculations<br />
both at farm level and country level. The functional unit is ‘1 kg energy corrected milk (ECM) at farm gate’.<br />
Indirect land use (ILUC) is <strong>in</strong>cluded <strong>in</strong> the modell<strong>in</strong>g and N balances are established for all cattle and crops.<br />
The model is applicable to any country for crops and animal systems.<br />
2. M<strong>et</strong>hods<br />
The Arla model is established as a param<strong>et</strong>erized agricultural model. Farm specific param<strong>et</strong>ers e.g. milk<br />
yield, weight and ages of cattle, purchased feed and fertiliser, land use, crop yields, hous<strong>in</strong>g systems, crop<br />
residue fate, diesel use <strong>et</strong>c. can be entered <strong>in</strong> the model by the farmers or their advisors. The enter<strong>in</strong>g of some<br />
of the param<strong>et</strong>ers is mandatory, while the model suggests default values for param<strong>et</strong>ers that are less easily<br />
obta<strong>in</strong>able. The model consists of a cattle system, a plant cultivation system, a food <strong>in</strong>dustry system and<br />
some general activities (e.g. energy, transport) as described below.<br />
The cattle system is divided <strong>in</strong>to a dairy system and a beef system and <strong>in</strong>cludes both the adults (dairy and<br />
suckler cows respectively) and their offspr<strong>in</strong>g. The <strong>in</strong>put of feed to the cattle system is calculated from the<br />
cattle’s milk yield, weight and ages and based on IPCC (2006) and Kristensen (2011). M<strong>et</strong>hane emitted from<br />
enteric fermentation and m<strong>et</strong>hane and nitrous oxide from manure management are calculated accord<strong>in</strong>g to<br />
IPCC (2006). Brazil is identified as the marg<strong>in</strong>al supplier of beef to the world mark<strong>et</strong> and an LCI of Brazilian<br />
beef is established on basis of production data from Cederberg <strong>et</strong> al., (2009), but by us<strong>in</strong>g the same<br />
m<strong>et</strong>hodologies as for the Danish and Swedish cattle systems.<br />
The plant cultivation system conta<strong>in</strong>s 34 different crop activities (barley, wheat, soybeans, corn, permanent<br />
grass <strong>et</strong>c. <strong>in</strong> different countries) and the crop yields are based on the farm specific data entered or<br />
FAOSTAT (<strong>2012</strong>). GHG emissions from the plant cultivation system is calculated accord<strong>in</strong>g to IPCC (2006)<br />
and the fraction of removed crop residues from fields cultivated <strong>in</strong> Denmark and Sweden is based on Danish<br />
data from Statistics Denmark (<strong>2012</strong>). Crop residues removed from fields cultivated <strong>in</strong> other countries are<br />
assumed to be negligible. Fertilisation levels for calculat<strong>in</strong>g the Danish and Swedish basel<strong>in</strong>e are primarily<br />
based on Plantedirektorat<strong>et</strong> (2004) and Flysjö <strong>et</strong> al., (2008).<br />
The food <strong>in</strong>dustry system produces food, but a significant share of the outputs from the food <strong>in</strong>dustry is<br />
used as animal feed; soybean meal, rapeseed meal, molasses, be<strong>et</strong> pulp, wheat bran <strong>et</strong>c. The <strong>in</strong>ventory of the<br />
food <strong>in</strong>dustry system is generally based on literature data. The soybean meal system is ma<strong>in</strong>ly based on Dalgaard<br />
<strong>et</strong> al., (2008) and the rapeseed oil and palm oil systems are ma<strong>in</strong>ly based on Schmidt (2010).<br />
ILUC (<strong>in</strong>direct land use changes) are caused by occupation of land ma<strong>in</strong>ly <strong>in</strong> the crop/pasture stage. The<br />
applied <strong>in</strong>ventory data are obta<strong>in</strong>ed from the ILUC-project version 3 (Schmidt <strong>et</strong> al., <strong>2012</strong>).
PARALLEL SESSION 6A: TOOLS AND DATABASES 8 th Int. Conference on <strong>LCA</strong> <strong>in</strong> the<br />
Agri-<strong>Food</strong> Sector, 1-4 Oct <strong>2012</strong><br />
Nitrogen balances are established for both cattle-, plant cultivation- and food <strong>in</strong>dustry systems and it is<br />
thereby secured that all nitrogen is accounted for, hence all nitrogen <strong>in</strong>puts to the systems will leave as products<br />
(e.g. milk, meat, manure, crops residues) or emissions (e.g. nitrate, ammonia).<br />
The applied m<strong>et</strong>hodology <strong>in</strong> the present paper is consequential <strong>LCA</strong> (Weidema <strong>et</strong> al., 2009) and thereby<br />
follows the <strong>in</strong>ternational standards on life cycle assessment: ISO 14040 and 14044 and the <strong>in</strong>ternational<br />
standard on carbon footpr<strong>in</strong>ts on products: ISO 14067-1. (The default m<strong>et</strong>hod to be used with<strong>in</strong> Arla foods is<br />
IDF (2010), which is the m<strong>et</strong>hod developed by the dairy <strong>in</strong>dustry.) System expansion is used <strong>in</strong> all multiple<br />
output processes. For example milk production results <strong>in</strong> co-production of beef, hence an equal amount of<br />
beef production <strong>in</strong> Brazil is avoided and the saved emissions from this beef production are deducted from the<br />
environmental impact of milk production. Coproduction of soybean oil tog<strong>et</strong>her with the d<strong>et</strong>erm<strong>in</strong><strong>in</strong>g product<br />
soybean meal is another example of system expansion.<br />
Consequential<br />
(substitution)<br />
Dairy cow<br />
milk<br />
newborn heifer<br />
newborn bull<br />
meat,live weight<br />
dead animal<br />
manure<br />
Attributional<br />
(economic allocation)<br />
PAS2050<br />
(allocation)<br />
IDF<br />
(allocation)<br />
Rais<strong>in</strong>g heifer for<br />
milk production<br />
Rais<strong>in</strong>g newborn<br />
bull for meat<br />
production<br />
bull calf<br />
dead animal<br />
manure<br />
manure<br />
meat, live weight<br />
dead animal<br />
Rais<strong>in</strong>g bull calf<br />
for meat<br />
production<br />
meat, live weight<br />
dead animal<br />
manure<br />
Figure 1. Dairy system with the boundaries for substitution/allocation.<br />
Treatment<br />
Treatment<br />
Destruction<br />
The model also <strong>in</strong>cludes switches that enables for, with<strong>in</strong> the same scope, transform<strong>in</strong>g the results to<br />
comply with allocation/average modell<strong>in</strong>g, IDF (2010) guide to standard <strong>LCA</strong> m<strong>et</strong>hodology for the dairy<br />
<strong>in</strong>dustry and PAS2050 (Carbon Trust <strong>et</strong> al., 2010). When these switches are turned on, allocation and average<br />
mark<strong>et</strong> mixes are used for the calculations. The system boundaries applied for the different standards are<br />
presented <strong>in</strong> Figure 1, where the dairy system is used as an example. The dairy system produces milk, meat,<br />
energy (from destruction of dead animals), nutrients conta<strong>in</strong>ed <strong>in</strong> the manure and dead cattle for destruction.<br />
In the consequential modell<strong>in</strong>g all the activities are <strong>in</strong>cluded. When the allocation/average switch is turned<br />
the GHG emissions are economic allocated b<strong>et</strong>ween milk, meat, energy (from destruction of animals) and the<br />
nutrients <strong>in</strong> the manure. When the IDF switch is turned on, the GHG emissions are allocated b<strong>et</strong>ween milk<br />
and meat. But opposed to the allocation/average and PAS2050 switches, the rais<strong>in</strong>g of bull calves for meat<br />
production is not part of the milk system, i.e. the export of small bulls for further rais<strong>in</strong>g for meat production<br />
are excluded from the <strong>in</strong>ventory. Allocation b<strong>et</strong>ween milk and meat is based on a m<strong>et</strong>hod us<strong>in</strong>g relationship<br />
b<strong>et</strong>ween the energy content <strong>in</strong> the feed ration and milk and meat production. When PAS2050 is turned on<br />
Treatment<br />
Fertiliser<br />
Burn<strong>in</strong>g fuel<br />
Cattle meat<br />
fuel<br />
Manure<br />
treatment<br />
nutrients<br />
Treatment<br />
Treatment<br />
Utilisation of fuel<br />
energy<br />
Treatment<br />
479
PARALLEL SESSION 6A: TOOLS AND DATABASES 8 th Int. Conference on <strong>LCA</strong> <strong>in</strong> the<br />
Agri-<strong>Food</strong> Sector, 1-4 Oct <strong>2012</strong><br />
GHG emissions are economic allocated b<strong>et</strong>ween milk and meat, and the allocation to nutrients (from manure)<br />
and energy (from destruction of animals) is zero.<br />
Note that the same unallocated <strong>in</strong>ventory data are used for all four switches and only the system boundaries<br />
are changed. This implies that the farm specific data can be entered <strong>in</strong> the model, and then the results can<br />
easily be presented accord<strong>in</strong>g to the desired standards mentioned above. Similarly, the results for the Danish<br />
and Swedish basel<strong>in</strong>e can be transformed to be compliant to attributional modell<strong>in</strong>g, IDF or PAS2050 guidel<strong>in</strong>es.<br />
3. Results<br />
The result for Danish basel<strong>in</strong>e milk produced <strong>in</strong> 2005 is presented <strong>in</strong> Table 1. The table is divided <strong>in</strong>to<br />
three major parts: 1) direct emissions of CH4 and N2O from the animals and their manure (from hous<strong>in</strong>g and<br />
storage). 2) upstream emissions from the production of feed, land use changes, utilisation of manure as organic<br />
fertiliser, fuels and their combustion <strong>et</strong>c. Note that services and capital goods are <strong>in</strong>cluded <strong>in</strong> these<br />
figures. 3) Avoided emissions related to the substituted beef production caused by the supply of meat from<br />
the dairy system.<br />
Table 1. GHG-emissions for 1 kg ECM, Danish basel<strong>in</strong>e 2005. Switch: Consequential (ISO14044). Unit: kg<br />
CO2-eq per kg ECM.<br />
Denmark basel<strong>in</strong>e Dairy cow Rais<strong>in</strong>g<br />
480<br />
heifer<br />
Rais<strong>in</strong>g newborn<br />
bull<br />
Rais<strong>in</strong>g<br />
bull<br />
Total Total<br />
Direct emissions<br />
CH4, enteric fermentation 0.414 0.094 0.00138 0.0380 0.548<br />
CH4, manure handl<strong>in</strong>g and storage 0.0697 0.00838 0.000347 0.00764 0.0860<br />
N2O direct 0.0312 0.00605 0.000274 0.00459 0.0422<br />
N2O <strong>in</strong>direct 0.00524 0.000731 0.0000216 0.000474 0.00647 0.682<br />
Emissions outside the animal activities (<strong>in</strong>cl. capital goods and services)<br />
Feed <strong>in</strong>puts, excl. ILUC 0.170 0.0388 0.000568 0.0156 0.225<br />
ILUC related to feed 1.47 0.336 0.00492 0.135 1.95<br />
Manure land appl. <strong>in</strong>cl. subst. m<strong>in</strong>eral fert. -0.0353 -0.00125 -0.0000160 -0.00165 -0.0382<br />
Fuels <strong>in</strong>cl. Combustion 0.00994 0.00229 0.000255 0.00175 0.0142<br />
Electricity 0.0369 0 0 0 0.0369<br />
Transport 0.0138 0.00315 0.0000461 0.00127 0.0183<br />
Destruction of fallen cattle <strong>in</strong>cl. subst. energy -0.00314 -0.000530 -0.000269 -0.000414 -0.00435<br />
Farm, capital goods 0.0113 0.0113 0.000580 0.00397 0.0271<br />
Farm, services 0.0149 0.0150 0.000767 0.00525 0.0359 2.26<br />
Substituted beef system (<strong>in</strong>cl. capital goods and services)<br />
Direct emissions (CH4 and N2O) -0.399<br />
Feed <strong>in</strong>puts, excl. ILUC -0.0324<br />
ILUC related to feed -1.20<br />
Other -0.245 -1.88<br />
Total 1.06<br />
Results with lower degree of compl<strong>et</strong>eness<br />
Total (result without ILUC) 0.316<br />
Total (result without ILUC and services) 0.254<br />
Total (result without ILUC, services and capital goods) 0.199<br />
It appears from Table 1, that the most important contributions are ILUC (sum of ILUC from several<br />
crops/grass), avoided beef (sum of contributions from several activities with<strong>in</strong> the beef system), direct emissions<br />
from the animal activities (where enteric fermentation is the most important), and the production of<br />
feedstuff (sum of all feedstuff <strong>in</strong>cl. upstream activities such as diesel for traction, farm capital goods and<br />
services, and production of fertiliser and pesticides).<br />
Transport of materials (ma<strong>in</strong>ly feed) to the dairy farms, burn<strong>in</strong>g of diesel for traction <strong>et</strong>c., and electricity<br />
do not contribute significantly to the overall result. Also the <strong>in</strong>puts of capital goods and services to the milk<br />
system are not major contributors to the overall result. It appears that the land application of manure has a<br />
negative contribution. This is because the avoided emissions from the substituted production of m<strong>in</strong>eral fertilisers<br />
are larger than the direct emissions related to the application of the manure on crops. Also the destruction<br />
of animals is associated with a negative contribution because the by-products from the activity substitutes<br />
energy that alternatively would have been produced by the burn<strong>in</strong>g of fossil fuels.<br />
In the lower part of Table 1, the results are shown with lower degrees of compl<strong>et</strong>eness. The results without<br />
ILUC are significantly lower than when <strong>in</strong>clud<strong>in</strong>g ILUC. The results without capital goods and services<br />
show, that the overall result is only affected with approximately 0.117 kg CO2-eq. by the <strong>in</strong>clusion/exclusion<br />
of capital goods and services.
PARALLEL SESSION 6A: TOOLS AND DATABASES 8 th Int. Conference on <strong>LCA</strong> <strong>in</strong> the<br />
Agri-<strong>Food</strong> Sector, 1-4 Oct <strong>2012</strong><br />
The contribution from ILUC <strong>in</strong>cludes contributions from transformation of land not <strong>in</strong> use (primary and<br />
secondary forest) to arable land and from <strong>in</strong>tensification of land already <strong>in</strong> use. The major contribution is the<br />
one from <strong>in</strong>tensification, where the emissions from additional fertiliser application are the most significant<br />
source of the GHG-emissions.<br />
The GHG emission per kg Swedish ECM is 1.15 kg CO2-eq and is thereby 8% higher than the Danish<br />
milk (Figure 2, first column). The overall results, i.e. the relative magnitude of different contribut<strong>in</strong>g activities,<br />
for Swedish milk are not significantly different from the ones for Danish milk <strong>in</strong> Table 1. The underly<strong>in</strong>g<br />
reasons for the difference b<strong>et</strong>ween Danish and Swedish milk are described <strong>in</strong> the follow<strong>in</strong>g. The direct<br />
emissions are higher for Sweden, because the activity ‘Rais<strong>in</strong>g bull’ contributes more <strong>in</strong> Sweden. The reason<br />
for this is that these animals are kept for longer time and grown bigger before they are slaughtered <strong>in</strong> Sweden<br />
than <strong>in</strong> Denmark. The contributions from activities outside the animal activities are higher for Sweden, and<br />
this is also because the bulls grow bigger before they are slaughtered and thereby consume more feed.<br />
Furthermore, the Swedish cows eat relatively less maize ensilage and gra<strong>in</strong> crops and more permanent<br />
grass, which results <strong>in</strong> higher GHG-emissions. However, carbon sequestration is not <strong>in</strong>cluded <strong>in</strong> the model<br />
and <strong>in</strong>clud<strong>in</strong>g that could result <strong>in</strong> a lower CF for permanent grass (Doreau and Dollé, 2011). The avoided<br />
emissions <strong>in</strong> Sweden are higher than <strong>in</strong> Denmark, which aga<strong>in</strong> is related to the higher meat output from the<br />
Swedish milk system.<br />
Fig. 2 shows the GHG emissions per kg Danish and Swedish milk by use of the different switches as expla<strong>in</strong>ed<br />
previously. The result for ‘Attributional’ (average/allocation) is not significantly different from the<br />
result based on consequential modell<strong>in</strong>g (<strong>in</strong>clud<strong>in</strong>g ILUC). But it should be noted, that these ‘similar’ results<br />
are more a matter of <strong>in</strong>cident than an <strong>in</strong>dication that similar results can be expected when us<strong>in</strong>g consequential<br />
and attributional modell<strong>in</strong>g assumptions. The most important deviation from consequential modelled<br />
results are that economic allocation is used, which implies that only 82% of the emissions and <strong>in</strong>puts are<br />
ascribed to the milk, and there is no subsituted beef system. Also, ‘ILUC related to feed’ is much lower, because<br />
attributional modell<strong>in</strong>g of ILUC considers all <strong>in</strong>puts to the mark<strong>et</strong> for land (land tenure) as flexible and<br />
a mark<strong>et</strong> average mix is applied. There is no substituted beef system.<br />
The modell<strong>in</strong>g assumptions <strong>in</strong> the IDF and PAS2050 switch mode are to a large extent similar to the average/allocation<br />
attributional switch mode and the results exclud<strong>in</strong>g ILUC are rather similar. However, <strong>in</strong>clud<strong>in</strong>g<br />
emissions from ILUC drastically <strong>in</strong>crease the CF for milk us<strong>in</strong>g IDF and PAS2050. The reason for<br />
the high total results for the IDF and PAS2050 switch mode is the contribution from land use changes <strong>in</strong> soy<br />
cultivation <strong>in</strong> Brazil (and m<strong>in</strong>or contributions from oil palm <strong>in</strong> Malaysia). It should be noticed that the way<br />
land use changes are modelled <strong>in</strong> PAS2050 are direct land use changes (DLUC) and by apply<strong>in</strong>g a 20 year<br />
historical amortisation period. This approach is substantially different from the modell<strong>in</strong>g of ILUC which is<br />
applied <strong>in</strong> the switch modes for ISO14040/44 consequential and average/allocation attributional. DLUC here<br />
only considers impacts from cultivated fields that have been transformed with<strong>in</strong> the recent 20 years. The<br />
results when us<strong>in</strong>g the IDF switch mode are slightly higher than the ones of PAS2050. The reason for this is<br />
a higher degree of compl<strong>et</strong>eness, i.e. capital goods and services are <strong>in</strong>cluded.<br />
kg CO2e per kg ECM<br />
2.0<br />
1.5<br />
1.0<br />
0.5<br />
0.0<br />
DK SE DK SE DK SE DK SE<br />
Consequential Attributional IDF PAS2050<br />
Figure 2. GHG emissions from 1 kg ECM for the Danish and Swedish basel<strong>in</strong>e by use of the different<br />
switches.<br />
ILUC<br />
CF excl. ILUC<br />
481
PARALLEL SESSION 6A: TOOLS AND DATABASES 8 th Int. Conference on <strong>LCA</strong> <strong>in</strong> the<br />
Agri-<strong>Food</strong> Sector, 1-4 Oct <strong>2012</strong><br />
4. Discussion<br />
Sensitivity analyses are performed on region of substituted beef system (Denmark and Sweden versus<br />
Brazil), crop yields (reduced by 25%) and milk yield (reduced by 10%). The carbon footpr<strong>in</strong>t of Danish and<br />
Swedish milk <strong>in</strong>creased by 28-31% if Danish and Swedish beef systems are used as substituted beef system.<br />
This is because these systems are more efficient compared to the Brazilian beef system. However, the beef<br />
mark<strong>et</strong> is global, so there is no reason to belief that the Danish and Swedish beef mark<strong>et</strong> are affected when<br />
extra beef is produced by the dairy cows. The effects of decreas<strong>in</strong>g the crop and milks are limited.<br />
For the national basel<strong>in</strong>es, the most important assumptions relate to the identification of substituted beef<br />
system, the animal turnover, the feed composition and land use changes. The collected data on animal turnover<br />
and feed composition <strong>in</strong> Denmark and Sweden are regarded as be<strong>in</strong>g related to a low degree of uncerta<strong>in</strong>ty.<br />
The switch mode and the exclusion of land use changes obviously affect the results significantly as shown<br />
<strong>in</strong> the results.<br />
5. Conclusion<br />
The Arla model which is documented <strong>in</strong> the current study is prepared for the calculation of farm specific<br />
carbon footpr<strong>in</strong>t as well as Danish and Swedish national basel<strong>in</strong>es for milk at the farm gate.<br />
The model is characterised by be<strong>in</strong>g param<strong>et</strong>erised, so that <strong>in</strong> pr<strong>in</strong>ciple any country or any specific milk<br />
farm carbon footpr<strong>in</strong>t can be calculated – just by enter<strong>in</strong>g the relevant <strong>in</strong>put param<strong>et</strong>ers. Of course there are<br />
some limitations <strong>in</strong> data which are entered as background data <strong>in</strong> the model, e.g. a milk farm <strong>in</strong> a country<br />
outside EU obviously uses feed <strong>in</strong>puts with other orig<strong>in</strong>s (countries) and maybe also types of feed that is not<br />
<strong>in</strong>cluded <strong>in</strong> the model. Currently, the model is prepared for country and farm specific carbon footpr<strong>in</strong>ts for<br />
Danish and Swedish milk farms and background data are based on year 2005.<br />
Further, the model enables for apply<strong>in</strong>g different modell<strong>in</strong>g assumptions or carbon footpr<strong>in</strong>t standards:<br />
Consequential (ISO 14040/44); Attributional (average/allocation); IDF guidel<strong>in</strong>e and PAS 2050. No additional<br />
data are required for switch<strong>in</strong>g b<strong>et</strong>ween the mentioned standards. It is also possible to operate with<br />
different levels of compl<strong>et</strong>eness <strong>in</strong> the results by switch<strong>in</strong>g on and off capital goods, services and land use<br />
changes.<br />
The GHG emissions are slightly higher for Swedish milk than for Danish milk. The major contributions<br />
to the overall result <strong>in</strong>clude enteric fermentation (m<strong>et</strong>hane emissions from the cattle) and the cultivation and<br />
production of feed <strong>in</strong>puts. A major part of the impact related to the feed <strong>in</strong>puts is associated to land use<br />
changes. However, carbon sequestration is not <strong>in</strong>cluded <strong>in</strong> the current model, and <strong>in</strong>clud<strong>in</strong>g this might<br />
change the results (i.e. the CF could be lower for permanent pasture, which stands for a relatively higher<br />
share of the feed <strong>in</strong> Sweden compared to Denmark). F<strong>in</strong>ally, the results are highly dependent on the choice<br />
of modell<strong>in</strong>g switch mode.<br />
6. References<br />
Carbon Trust, Dairy UK and DairyCo, 2010. Guidel<strong>in</strong>es for the Carbon Footpr<strong>in</strong>t<strong>in</strong>g of Dairy Products <strong>in</strong> the UK. Carbon Trust,<br />
Dairy UK and DairyCo<br />
Cederberg, C., Sonesson, U., Henriksson, M., Sund, V., Davis, J., 2009. Life cycle <strong>in</strong>ventory of greenhouse gas emissions and use of<br />
land and energy <strong>in</strong> Brazilian beef production. SIK Report No 792. ISBN 978-91-7290-283-1.<br />
Dalgaard, R., Schmidt, J.H., <strong>2012</strong>. National and farm level carbon footpr<strong>in</strong>t of milk - Life cycle <strong>in</strong>ventory for Danish and Swedish<br />
milk 2005 at farm gate. Arla <strong>Food</strong>s, Aarhus, Denmark<br />
Dalgaard, R., Schmidt, J., Halberg, N., Christensen, P., Thrane, M., Pengue, W.A., 2008. <strong>LCA</strong> of soybean meal. Int J <strong>LCA</strong> (3) 240-<br />
254.<br />
Doreau, M., Dollé, J-B. 2011. Strategies for reduc<strong>in</strong>g greenhouse gas emissions <strong>in</strong> dairy production. A European perspective. Conference<br />
Proceed<strong>in</strong>gs. Eastern Nutrition Conference, Montreal, Canada, 12-13 April 2011, 57-77.<br />
FAOSTAT, <strong>2012</strong>. FAOSTAT, <strong>Food</strong> and agriculture organization of the United Nations. http://faostat.fao.org/ (Accessed January<br />
<strong>2012</strong>)<br />
Flysjö, A., Cederberg, C., Strid, I., 2008. <strong>LCA</strong>-databas för konventionella fodermedel –miljöpåverkan i samband med produktion.<br />
SIK Report No 772. ISBN 978-91-7290-265-7. In Swedish.<br />
Gerber, P., Vell<strong>in</strong>ga, T., Opio, C., Henderson, B., Ste<strong>in</strong>feld, H., 2010. Greenhouse Gas Emissions from the Dairy Sector, A Life<br />
Cycle Assessment. FAO, <strong>Food</strong> and Agriculture Organization of the United Nations, Animal Production and Health Division,<br />
Rome, Italy.<br />
IDF, 2010. A common carbon footpr<strong>in</strong>t approach for dairy – The IDF guide to standard life cycle assessment m<strong>et</strong>hodology for the<br />
dairy sector. Bull<strong>et</strong><strong>in</strong> of the International Dairy Federation 445/2010<br />
Kristensen, T., 2011. Notat: Tilpasn<strong>in</strong>g af funktion til estimer<strong>in</strong>g af foderbehov afhængig af ydelsesniveau hos malkekøerne (English:<br />
Note: Adaption of the function for establish<strong>in</strong>g feed <strong>in</strong>take as a function of milk yield for dairy cows). Department of Ecology<br />
and Environment, Aarhus University, Denmark<br />
Plantedirektorat<strong>et</strong>, 2004. Vejledn<strong>in</strong>g og skemaer. Gødn<strong>in</strong>gsplanlægn<strong>in</strong>g, gødn<strong>in</strong>gsregnskab, plantedække, harmoniregler, ændr<strong>in</strong>ger i<br />
ejer- og brugerforhold. 2004/2005. M<strong>in</strong>isteri<strong>et</strong> for Fødevarer, Landbrug og Fiskeri. In Danish.<br />
482
PARALLEL SESSION 6A: TOOLS AND DATABASES 8 th Int. Conference on <strong>LCA</strong> <strong>in</strong> the<br />
Agri-<strong>Food</strong> Sector, 1-4 Oct <strong>2012</strong><br />
Schmidt, J.H., Re<strong>in</strong>hard, J., Weidema, B.P., <strong>2012</strong>. Modell<strong>in</strong>g of <strong>in</strong>direct land use changes <strong>in</strong> <strong>LCA</strong>, report v3. 2.-0 <strong>LCA</strong> consultants,<br />
Aalborg, http://www.lca-n<strong>et</strong>.com/projects/iluc_model/<br />
Schmidt, J.H., Dalgaard, R., <strong>2012</strong>. National and farm level carbon footpr<strong>in</strong>t of milk. M<strong>et</strong>hodology and results for Danish and Swedish<br />
milk 2005 at farm gate. Arla <strong>Food</strong>s, Aarhus, Denmark<br />
Schmidt, J.H., 2010. Comparative Life Cycle Assessment of Rapeseed Oil and Palm Oil. International Journal of Life Cycle Assessment<br />
15:183–197<br />
Statistics Denmark, <strong>2012</strong>, http://www.dst.dk/ (Accessed January <strong>2012</strong>)<br />
Weidema, B.P., Ekvall, T., Heijungs, R., 2009. Guidel<strong>in</strong>es for applications of deepened and broadened <strong>LCA</strong>. Deliverable D18 of<br />
work package 5 of the CA<strong>LCA</strong>S project. http://fr1.estis.n<strong>et</strong>/<strong>in</strong>cludes/file.asp?site=calcas&file=7F2938F9-09CD-409F-9D70-<br />
767169EC8AA9<br />
483
PARALLEL SESSION 6A: TOOLS AND DATABASES 8 th Int. Conference on <strong>LCA</strong> <strong>in</strong> the<br />
Agri-<strong>Food</strong> Sector, 1-4 Oct <strong>2012</strong><br />
484<br />
LCI-datas<strong>et</strong> gap bridg<strong>in</strong>g strategies <strong>in</strong> the program Agri-BALYSE<br />
P<strong>et</strong>er Koch 1,* , Gérard Gaillard 1 , Thibault Salou 2,3 Anne Paillier 4<br />
1<br />
Agroscope Reckenholz-Tänikon Research Station ART, CH-8046 Zürich, Switzerland<br />
2<br />
INRA, UMR1069, Soil Agro and hydroSystem, F-35000 Rennes, <strong>France</strong><br />
3<br />
Agrocampus Ouest, Soil Agro and hydroSystem, F-35000 Rennes, <strong>France</strong><br />
4<br />
ADEME, F-49004, <strong>France</strong><br />
*<br />
Correspond<strong>in</strong>g author. E-mail: p<strong>et</strong>er.koch@art.adm<strong>in</strong>.ch<br />
ABSTRACT<br />
The situation is well known and each <strong>LCA</strong>-practitioner has to deal with it: Once the system model is designed and the unit processes<br />
as well as their <strong>in</strong>- and outputs are identified, they should be assigned to the appropriate life cycle <strong>in</strong>ventory (LCI) <strong>in</strong> an exist<strong>in</strong>g<br />
database (e.g. eco<strong>in</strong>vent). The question is only: what is appropriate? Is it appropriate to assign a “6-row self propelled tanker harvester<br />
with a 20 tons tank” used to harvest sugar be<strong>et</strong>s <strong>in</strong> <strong>France</strong> e.g. to the exist<strong>in</strong>g eco<strong>in</strong>vent LCI-datas<strong>et</strong> “harvest<strong>in</strong>g, by compl<strong>et</strong>e<br />
harvester, be<strong>et</strong>s, CH” know<strong>in</strong>g that this process uses a 1-row harvest<strong>in</strong>g mach<strong>in</strong>e? The number of agricultural activities and <strong>in</strong>puts<br />
used <strong>in</strong> “real world” agricultural practice applied <strong>in</strong> <strong>France</strong> exceeds the number of available and accurate LCI-datas<strong>et</strong>s by far (see<br />
table 1). While this issue may be of m<strong>in</strong>or concern for a one-product <strong>LCA</strong> study, it will become a very important question when<br />
creat<strong>in</strong>g a multi-product LCI-database with the aim of comparison: How to deal with these “upstream-datas<strong>et</strong> gaps”? How to ensure<br />
comparable quality of the result<strong>in</strong>g <strong>LCA</strong>’s? Recently, Milà i Canals <strong>et</strong> al., (2011) suggested four different strategies to bridge data<br />
gaps (scaled, direct and averaged proxies as well as extrapolated data). In the framework of its program, Agri-BALYSE adopted this<br />
approach to state a clear strategy to face upstream-datas<strong>et</strong> gaps.<br />
The program Agri-BALYSE is an <strong>in</strong>itiative launched by the French authorities <strong>in</strong> order to develop a public LCI-database of agricultural<br />
products <strong>in</strong> <strong>France</strong> (<strong>in</strong>clud<strong>in</strong>g a small panel of imported tropical products) by the end of <strong>2012</strong>. The program is managed by a<br />
consortium consist<strong>in</strong>g of fourteen partners (ADEME, INRA, ART, CIRAD and ARVALIS, CETIOM, UNIP, IFV, ITB, CTIFL,<br />
ASTREDHOR, IFIP, ITAVI, Institut d’Elevage). As data collection is not performed centrally, the fourteen partners have developed<br />
several tools that ensure the comparability and consistency of the data: A data collection tool, an accompany<strong>in</strong>g data collection guide<br />
as well as a framework of data process<strong>in</strong>g tools <strong>in</strong> order to calculate the LCI data (see figure 1). An important step <strong>in</strong> this phase is the<br />
assignment of the raw data to the exist<strong>in</strong>g LCI-datas<strong>et</strong>s.<br />
Accord<strong>in</strong>g to the ILCD Handbook (2010), m<strong>et</strong>hodological consistency is a “shall-criterion” when select<strong>in</strong>g secondary data s<strong>et</strong>s.<br />
Hence, the program Agri-BALYSE absta<strong>in</strong>ed from us<strong>in</strong>g datas<strong>et</strong>s from several LCI-databases. Focuss<strong>in</strong>g on a s<strong>in</strong>gle LCI-database,<br />
the gap-bridg<strong>in</strong>g-strategies proposed by Milà i Canals <strong>et</strong> al., (2011) are a suitable resort. Agri-BALYSE def<strong>in</strong>ed for each category of<br />
agricultural <strong>in</strong>put category a specific strategy to treat <strong>in</strong>puts with miss<strong>in</strong>g LCI-datas<strong>et</strong>s (see table 1). For fertilisers, Agri-BALYSE<br />
uses the average proxy approach by creat<strong>in</strong>g a proxy-LCI datas<strong>et</strong> reflect<strong>in</strong>g an “average French fertiliser” based on the fertiliser<br />
consumption 2005-2009 (differentiated by N-, P- and K-fertilisers), whereas for active <strong>in</strong>gredients direct proxies are applied on the<br />
basis of their chemical structure. Agricultural mach<strong>in</strong>es as well as processes are extrapolated by adopt<strong>in</strong>g the available data s<strong>et</strong>s with<br />
their ma<strong>in</strong> activity param<strong>et</strong>ers (life time and weight for mach<strong>in</strong>es; energy consumption and work<strong>in</strong>g time for processes).<br />
Data collection tool provid<strong>in</strong>g raw data<br />
Assess<strong>in</strong>g <strong>in</strong>puts to LCI production datas<strong>et</strong><br />
Datas<strong>et</strong> available<br />
M<strong>et</strong>a-Data<br />
Datas<strong>et</strong> not available<br />
supply ... full new <strong>in</strong>ventory<br />
extrapolation<br />
averaged proxy<br />
direct proxy<br />
Add<strong>in</strong>g support processes<br />
i.e. transports from po<strong>in</strong>t of sale to consumer, based on average<br />
transport models by <strong>in</strong>put category<br />
Add<strong>in</strong>g data quality <strong>in</strong>formation<br />
Based on <strong>in</strong>formation about data sources<br />
Calculat<strong>in</strong>g direct emissions based on models<br />
Apply exist<strong>in</strong>g models<br />
e.g. N 2O IPCC 2006 Tier 2<br />
Adopt exist<strong>in</strong>g models<br />
e.g. Erosion RUSLE<br />
Figure 1. Assess<strong>in</strong>g <strong>in</strong>puts to exist<strong>in</strong>g LCI-datas<strong>et</strong>s is an important step when convert<strong>in</strong>g raw data to LCI-data.<br />
The figure shows all parts of the data process<strong>in</strong>g phase <strong>in</strong> the framework of the program Agri-BALYSE: LCIdatas<strong>et</strong><br />
assess<strong>in</strong>g as well as add<strong>in</strong>g of support process, quality <strong>in</strong>formation, m<strong>et</strong>a-data and direct emissions.<br />
Inventory data
PARALLEL SESSION 6A: TOOLS AND DATABASES 8 th Int. Conference on <strong>LCA</strong> <strong>in</strong> the<br />
Agri-<strong>Food</strong> Sector, 1-4 Oct <strong>2012</strong><br />
Table 1. Number of available <strong>in</strong>puts per <strong>in</strong>put category <strong>in</strong> the data collection tool of Agri-BALYSE<br />
No. of <strong>in</strong>puts No. of LCI datas<strong>et</strong>s<br />
Input category<br />
(real word) <strong>in</strong> eco<strong>in</strong>vent V2.2 Gap bridg<strong>in</strong>g strategy and number of additional <strong>in</strong>ventories (LCI)<br />
Active <strong>in</strong>gredients 236 94 Direct proxies (no new LCI)<br />
Agricultural processes 276 39 New <strong>in</strong>ventories (by extrapolation) and standardisation ( ca. 70 LCI),<br />
Build<strong>in</strong>gs and facilities 58 18 New <strong>in</strong>ventories (+58 LCI)<br />
Feedstuffs 164 19 New <strong>in</strong>ventories (+ 63 LCI), direct proxies<br />
Fertilisers 119 25 Averaged proxies (+ 3 LCI)<br />
Mach<strong>in</strong>es 200 6 New <strong>in</strong>ventories (by extrapolation) and standardisation ( 14 LCI),<br />
Seeds 48 28 New <strong>in</strong>ventories (by extrapolation ca. 10) , direct proxies<br />
References<br />
Milà i Canals L, Azapagic A, Doka G, Jefferies D, K<strong>in</strong>g H, Mutel C, Nemecek T, Roches A, Sim S, Stichnothe H, Thoma G, Williams<br />
A, 2011. Approaches for address<strong>in</strong>g Life Cycle Assessment data gaps for bio-based products. J Ind Ecol 15(5) 707-725.<br />
European Commission Jo<strong>in</strong>t Research Centre, 2010. ILCD Handbook: General Guide for Life Cycle Assessment - D<strong>et</strong>ailed guidance,<br />
1 st edition, European Union, p. 247.<br />
485
PARALLEL SESSION 6A: TOOLS AND DATABASES 8 th Int. Conference on <strong>LCA</strong> <strong>in</strong> the<br />
Agri-<strong>Food</strong> Sector, 1-4 Oct <strong>2012</strong><br />
486<br />
Cradle to gate life cycle <strong>in</strong>ventory and impact assessment of<br />
glyphosate<br />
Evan Griff<strong>in</strong>g 1,* , Kiyotada Hayashi 2 , Michael Overcash 1<br />
1 Environmental Clarity LLC, Montgomery Village, MD, USA<br />
2 National Agriculture and <strong>Food</strong> Research Organization, 3-1-1 Kannondai, Tsukuba, Ibaraki, 305-8666 Japan<br />
* Correspond<strong>in</strong>g author. E-mail: egriff<strong>in</strong>g@environmentalclarity.com<br />
ABSTRACT<br />
Glyphosate is the active <strong>in</strong>gredient <strong>in</strong> the popular broad-spectrum herbicide Roundup. The cradle to gate life cycle <strong>in</strong>ventory of<br />
glyphosate was modelled with the design-based m<strong>et</strong>hod. Industrial literature, patents, and <strong>in</strong>put from agricultural chemists were used<br />
to select a representative chemistry and develop d<strong>et</strong>ailed models of each manufactur<strong>in</strong>g process <strong>in</strong> the supply cha<strong>in</strong>. The results were<br />
analysed us<strong>in</strong>g an energy analysis, and the global warm<strong>in</strong>g potential was calculated. The cumulative energy demand of 181 MJ<br />
HHV/kg glyphosate is compared to other life cycle <strong>in</strong>ventory results. Process efficiencies and energy hot spots <strong>in</strong> the supply cha<strong>in</strong><br />
are described.<br />
Keywords: life cycle <strong>in</strong>ventory, herbicide, pesticide, design-based<br />
1. Introduction<br />
Agricultural production requires application of large numbers of herbicides and pesticides. Total herbicide<br />
use <strong>in</strong> the United States (US) <strong>in</strong> 2006 was 226,000 m<strong>et</strong>ric tonnes. Of this, 37% was glyphosate, a broad<br />
spectrum herbicide mark<strong>et</strong>ed by Monsanto as Roundup (USEPA, 2011). As of 2006, US use of herbicides as<br />
a percentage of global use was 40% by mark<strong>et</strong> price and 25% by mass. Glyphosate was developed as an agricultural<br />
product <strong>in</strong> the 1970s. Patent protection <strong>in</strong> the US expired <strong>in</strong> 2000. As of 1998, non-Monsanto<br />
producers represented 40,000 tonnes / yr capacity (Woodburn, 2000). By 2009, capacity <strong>in</strong> Ch<strong>in</strong>a had grown<br />
to 655,000 tonnes/yr (R & M, 2011). Global Industry Analysts predicts glyphosate production to reach 1.35<br />
million m<strong>et</strong>ric tonnes by 2017.<br />
Commercial glyphosate formulations are typically salts, which are more soluble <strong>in</strong> water. Common salts<br />
are isopropylammonium, monoammonium, diammonium, and potassium (Green, S. and Pohanish, 2007;<br />
BCPC, 2010). In this article, we present results for glyphosate as a solid. In addition, select results for the<br />
potassium salt of glyphosate are given as an example of a commercial formulation.<br />
Commercial production routes were summarized by Bryant (2003). The Monsanto routes and Ch<strong>in</strong>ese<br />
chlorac<strong>et</strong>ic acid route described by Bryant all go through im<strong>in</strong>odiac<strong>et</strong>ic acid (IDA) and phosphonom<strong>et</strong>hyl<br />
im<strong>in</strong>odiac<strong>et</strong>ic acid (PMIDA). The primary production route for IDA <strong>in</strong> world production, which is used <strong>in</strong><br />
the new Monsanto route, <strong>in</strong>volves di<strong>et</strong>hylam<strong>in</strong>e.<br />
In the chloroac<strong>et</strong>ic acid route given by Bryant, chloroac<strong>et</strong>ic acid is reacted with hydraz<strong>in</strong>e (NH2NH2) to<br />
form an <strong>in</strong>termediate that is converted to IDA. In another variation, chloroac<strong>et</strong>ic acid can be reacted with<br />
ammonia to produce glyc<strong>in</strong>e, which is a start<strong>in</strong>g material <strong>in</strong> a route specified by Unger (1996). Although the<br />
glyc<strong>in</strong>e route has not been used commercially outside of Ch<strong>in</strong>a (Bryant, 2003), it appears to be the favoured<br />
route <strong>in</strong> Ch<strong>in</strong>a (Y<strong>in</strong>, 2011).<br />
Other life cycle <strong>in</strong>ventory data on glyphosate production are available from Eco<strong>in</strong>vent. The current version<br />
2.2 (2010) shows production from the glyc<strong>in</strong>e route (Sutter, 2010) start<strong>in</strong>g with ac<strong>et</strong>ic anhydride, formaldehyde,<br />
ammonia, sodium hydroxide, chlor<strong>in</strong>e, and phosphorus trichloride. Earlier versions were based<br />
on data from Green and were given only <strong>in</strong> cradle to gate form. Results from this study are compared to the<br />
eco<strong>in</strong>vent data.<br />
2. M<strong>et</strong>hods<br />
Industrial literature, patents, and <strong>in</strong>put from agricultural chemists were used to select a representative<br />
production route. Several routes for glyphosate were provided by Unger (1996) and Bryant (2003). The<br />
newer Monsanto route was selected as representative.<br />
To provide compl<strong>et</strong>e transparency, production of each chemical was divided <strong>in</strong>to gate-to-gate (gtg) processes<br />
that <strong>in</strong>clude a small number of primary chemical reactions. Each gtg was modelled us<strong>in</strong>g standard<br />
process eng<strong>in</strong>eer<strong>in</strong>g m<strong>et</strong>hods as outl<strong>in</strong>ed by Overcash (1995 and Jimenez, <strong>et</strong>. al. (2000). Reports were generated<br />
on a gate-to-gate level and <strong>in</strong>clude (1) all necessary chemistries, with reaction and overall process<br />
yields, (2) process descriptions and literature reviews, (3) d<strong>et</strong>ailed process flow diagrams <strong>in</strong>clud<strong>in</strong>g all material<br />
flows <strong>in</strong>to and out of the process and process temperatures and pressures, (4) mass flow tables (5) energy<br />
flows at the unit process level.
PARALLEL SESSION 6A: TOOLS AND DATABASES 8 th Int. Conference on <strong>LCA</strong> <strong>in</strong> the<br />
Agri-<strong>Food</strong> Sector, 1-4 Oct <strong>2012</strong><br />
3. Results<br />
The chemical supply cha<strong>in</strong> for glyphosate is shown <strong>in</strong> Fig. 1. Each block represents one gtg. A chemical<br />
name with a bold font <strong>in</strong>dicates multi-output processes. The three gtgs with a grey background, glyphosate,<br />
PMIDA, and DSIDA may be run as an <strong>in</strong>tegrated glyphosate process. However, PMIDA and DSIDA are<br />
available as commercial products, and thus these were created as separate gtgs.<br />
The disodium salt of im<strong>in</strong>odiac<strong>et</strong>ic acid (DSIDA) is produced from di<strong>et</strong>hanol am<strong>in</strong>e and sodium hydroxide<br />
(Rxn. 1). The hydrogen formed is assumed to be combusted for potential heat recovery, lead<strong>in</strong>g to a n<strong>et</strong><br />
negative energy consumption <strong>in</strong> this gtg. DSIDA, phosphorus trichloride, formaldehyde, sodium hydroxide,<br />
and water are converted <strong>in</strong>to phosphonom<strong>et</strong>hyl im<strong>in</strong>odiac<strong>et</strong>ic acid (PMIDA) and sodium chloride <strong>in</strong> a separate<br />
gtg. The overall reaction takes place <strong>in</strong> several steps and variations on the order of reactions are described<br />
<strong>in</strong> the patent literature (US 4,724,103; US 5,527,953; US 5,312,972; EP 599,598; US 5,527,953; US<br />
5,688,994; US 6,515,168; WO 00/22888). Large quantities of NaCl are formed <strong>in</strong> the n<strong>et</strong> reaction (Rxn. 2),<br />
and the NaCl is considered to be a chemical emission to wastewater. In the f<strong>in</strong>al step, PMIDA is oxidized by<br />
sparg<strong>in</strong>g oxygen through a series of reactors with a dilute aqueous solution of PMIDA (Rxn. 3). Carbon<br />
dioxide is a direct by-product <strong>in</strong> this reaction. Additionally, 20% of the formaldehyde by-product is assumed<br />
to be oxidized to CO2 and water. The rema<strong>in</strong>der of the formaldehyde exits <strong>in</strong> a dilute aqueous waste stream.<br />
C4H11NO2+2NaOH HN(CH2COONa)2+ 4H2 Rxn. 1<br />
+NaOH + H2<br />
Di<strong>et</strong>hanolam<strong>in</strong>e + sodium hydroxide DSIDA (disodium salt of im<strong>in</strong>odiac<strong>et</strong>ic acid) + hydrogen<br />
PCl3 + H2CO + HN(CH2COONa)2+ H2O +NaOH C5H10NO7P + 3NaCl Rxn. 2<br />
+ + +H2O + NaOH + NaCl<br />
phosphorus trichloride + formaldehyde + DSIDA + water + sodium hydroxide PMIDA + sodium chloride<br />
C5H10O7NP + ½ O2 C4H8NO4 + CO2 + H2CO Rxn. 3<br />
+ O2 + CO2 +<br />
PMIDA + oxygen glyphosate + carbon dioxide + formaldehyde<br />
The mass yields and stoichiom<strong>et</strong>ric yields for each of these three gtgs are shown <strong>in</strong> Table 1. The<br />
stoichiom<strong>et</strong>ric yields were about 93% from each of the primary <strong>in</strong>puts (di<strong>et</strong>hanol am<strong>in</strong>e to DSIDA to<br />
PMIDA to glyphosate). The stoichiom<strong>et</strong>ric yield from di<strong>et</strong>hanol am<strong>in</strong>e is 80%. The mass yields, which are<br />
calculated as the total product divided by the total reactant (to each gtg) from Fig. 1, are relatively low (50 –<br />
90%). This is due <strong>in</strong> part to the reaction stoichiom<strong>et</strong>ry, which produces a number of reaction byproducts that<br />
are treated as waste. The overall yield from <strong>et</strong>hylene oxide <strong>in</strong> this chemistry is < 50%, because two <strong>et</strong>hylene<br />
oxides are used per molecule of PMIDA. One of these <strong>et</strong>hylene oxide groups is oxidized to CO2 and formaldehyde<br />
<strong>in</strong> the glyphosate gtg as discussed <strong>in</strong> US 7,750,180.<br />
Table 1. Yields for glyphosate gtgs. Apparent mass yields are from Figure 1. The other yield values are<br />
stoichiom<strong>et</strong>ric, and refer to overall process yield based on <strong>in</strong>puts to the process.<br />
Gtg Mass yield Yield I1 Yield I2 Yield I3 Inputs correspond<strong>in</strong>g to yield data<br />
Glyphosate a 61% 93% 47% I1 = PMIDA, I2 = oxygen<br />
PMIDA 47% 93% 71% 84% I1 = DSIDA, I2 = formamide, I3 = PCl3<br />
DSIDA 86% 92% 88% I1 = di<strong>et</strong>hanol am<strong>in</strong>e, I2 = sodium hydroxide<br />
a The mass yield for DSIDA excludes the oxygen <strong>in</strong>put, which is used to recover heat from hydrogen.<br />
487
PARALLEL SESSION 6A: TOOLS AND DATABASES 8 th glyphosate Oxygen Air (untreated)<br />
Int. Conference on <strong>LCA</strong> <strong>in</strong> the<br />
Agri-<strong>Food</strong> Sector, 1-4 Oct <strong>2012</strong><br />
1,000 199 199<br />
DSIDA <strong>in</strong> 37pct<br />
Natural gas<br />
PMIDA sol di<strong>et</strong>hanol am<strong>in</strong>e Ammonia Natural gas (unprocessed)<br />
1,422 1,186 765 169 34.9<br />
nitrogen from<br />
35.6<br />
air Air (untreated)<br />
65.1 65.1<br />
oxygen from air Air (untreated)<br />
28.9 28.9<br />
Water for rxn Water (untreated)<br />
45.2 45.2<br />
Ethylene oxide Ethylene Naphtha<br />
oil (<strong>in</strong><br />
ground)<br />
603 452 461 467<br />
Oxygen Air (untreated)<br />
442 443<br />
oxygen from air Air (untreated)<br />
497 497<br />
sodium chloride <strong>in</strong> salt rock, <strong>in</strong><br />
Sodium hydroxide br<strong>in</strong>e 26 wtpct ground<br />
612 495 495<br />
Water for rxn Water (untreated)<br />
145 145<br />
Formaldehyde M<strong>et</strong>hanol Natural gas<br />
Natural gas<br />
(unprocessed)<br />
263 330 170 173<br />
oxygen from air Air (untreated)<br />
170 170<br />
Water for rxn Water (untreated)<br />
303 303<br />
oxygen from air Air (untreated)<br />
186 186<br />
Phosphorus<br />
sodium chloride <strong>in</strong> salt rock, <strong>in</strong><br />
trichloride Chlor<strong>in</strong>e<br />
br<strong>in</strong>e 26 wtpct ground<br />
1,024 808 654 654<br />
Water for rxn Water (untreated)<br />
191 191<br />
phosphorus, white coke, m<strong>et</strong>allurgical coal mass coal (<strong>in</strong> ground)<br />
235 22.1 25.7 25.7<br />
oxygen Air<br />
Sulfuric acid Sulfur trioxide from air (untreated)<br />
0.115 0.0934 0.0580 0.0580<br />
oil (<strong>in</strong><br />
Sulfur ground)<br />
0.0403 0.0415<br />
Water for Water<br />
rxn (untreated)<br />
3.52E-03<br />
Water<br />
3.52E-03<br />
Water for rxn (untreated)<br />
phosphate ore, <strong>in</strong><br />
0.0234 0.0234<br />
Phosphate rock ground<br />
157 547<br />
Silica silica (untreated)<br />
62.3 62.3<br />
Sodium sodium chloride <strong>in</strong><br />
hydroxide br<strong>in</strong>e 26 wtpct salt rock, <strong>in</strong> ground<br />
242 196 196<br />
Water for rxn Water (untreated)<br />
57.2 57.2<br />
Water for rxn Water (untreated)<br />
264 264<br />
Figure 1. Supply cha<strong>in</strong> for production of glyphosate from commodity chemicals<br />
Process energy consumption <strong>in</strong>cludes all <strong>in</strong>puts of heat and electricity. This <strong>in</strong>cludes heat <strong>in</strong>puts from<br />
steam, Dowtherm, direct combustion of fuel, electricity or other sources. Dur<strong>in</strong>g cradle-to-gate (ctg) production<br />
of electricity, steam, <strong>et</strong>c., fuels are combusted, result<strong>in</strong>g <strong>in</strong> an <strong>in</strong>ventory of energy emissions and fuel<br />
consumption. The ctg energy value of the fuels used (fuels <strong>in</strong> mak<strong>in</strong>g energy plus precombustion fuel to<br />
deliver fuel to po<strong>in</strong>t of energy production) is the natural resource energy (nre). The sum of the nre and the<br />
energy value of the feedstocks used to build the glyphosate molecule (right-most components <strong>in</strong> Fig. 1) is<br />
comparable to the cumulative energy demand <strong>LCA</strong> m<strong>et</strong>ric.<br />
The process and natural resource energies are good proxies for the environmental impact <strong>in</strong>herent <strong>in</strong> production<br />
of materials. Table 2 shows the mass of each product used to produced 1000 kg of glyphosate. For<br />
each material, the mass of byproducts and the allocation param<strong>et</strong>er are shown. For example, for each kg of<br />
ammonia produced 1.18 kg of CO2 are produced. For mass allocation, the gtg energies, <strong>in</strong>puts, and emissions<br />
are multiplied by 1 / 2.18 = 0.459. For each kg of ammonia produced, 12.6 MJ of process energy are<br />
used. Of this, 12.6*.459 = 5.8 MJ are allocated to ammonia. In the supply cha<strong>in</strong> for 1000 glyphosate, 169<br />
kg of ammonia are used. Thus, 976 MJ of process energy are used.<br />
488
PARALLEL SESSION 6A: TOOLS AND DATABASES 8 th Int. Conference on <strong>LCA</strong> <strong>in</strong> the<br />
Agri-<strong>Food</strong> Sector, 1-4 Oct <strong>2012</strong><br />
At the gtg level, other processes with significant energy use and significant byproduct formation are di<strong>et</strong>hanolam<strong>in</strong>e,<br />
<strong>et</strong>hylene, white phosphorus, chlor<strong>in</strong>e, and sodium hydroxide. In this rollup, chlor<strong>in</strong>e and sodium<br />
hydroxide are used <strong>in</strong> quantities similar to their production rates, and so, the impact of allocation<br />
choice is m<strong>in</strong>or. The <strong>et</strong>hylene and di<strong>et</strong>hanol am<strong>in</strong>e gtgs each produce products with similar utility and<br />
chemical properties. White phosphorus has a fairly small energy contribution, however, the allocation to<br />
lower value products is high. Thus, the phosphorus allocation may be important <strong>in</strong> the result.<br />
The total process energy is 88.1 MJ/kg glyphosate. Process energies are scaled to account for cradle to<br />
gate delivery of fuel and aga<strong>in</strong> scaled to account for energy generation efficiencies. The total high heat value<br />
(HHV) of fuels used ctg is 148 MJ/kg glyphosate. Us<strong>in</strong>g this presentation, it is very easy to apply alternative<br />
energy production models and update these data as energy supplies change.<br />
The process and natural resource energies for glyphosate production are summarized <strong>in</strong> Fig. 2.<br />
In this view, energies for commodity chemicals are shown as ctg values. The energy profile dom<strong>in</strong>ated by<br />
the glyphosate gtg, which uses 63 MJ of the total 88 MJ of process energy/kg glyphosate. We can learn<br />
more about the energy use, potential variability b<strong>et</strong>ween manufacturers, and potential for improvement by<br />
look<strong>in</strong>g more closely at the glyphosate gtg. The full glyphosate gtg report conta<strong>in</strong>s a d<strong>et</strong>ailed description of<br />
the process, a process flow diagram, and Tables d<strong>et</strong>ail<strong>in</strong>g mass and energy flows at the unit operation level.<br />
This document can be obta<strong>in</strong>ed by contact<strong>in</strong>g the article authors. The glyphosate process takes place <strong>in</strong> a<br />
dilute aqueous solution, and about 80% of the energy use <strong>in</strong> the glyphosate gtg is for evaporation of the water.<br />
Based on most of the patent data (US 6,921,84; US 7,799,571; US 5,962,729; US 3,969,398), the water<br />
use ratio (kg water/kg PMIDA) was 10:1 to 50:1. In our gtg model, the water use was 36 kg/kg PMIDA.<br />
Evaporation of water is an energy <strong>in</strong>tensive process, and this energy can be reduced dramatically by us<strong>in</strong>g<br />
multi-effect evaporators. These units split the evaporation <strong>in</strong>to multiple stages and utilise the steam from<br />
each stage as an energy supply for successive stages. An economic tradeoff b<strong>et</strong>ween capital cost and operat<strong>in</strong>g<br />
(energy) costs favours more evaporation steps <strong>in</strong> larger processes. In the glyphosate model, a s<strong>in</strong>gle effect<br />
evaporator was used. Thus some <strong>in</strong>dustrial plants may achieve significantly lower energy use by <strong>in</strong>creas<strong>in</strong>g<br />
reactor concentrations and us<strong>in</strong>g multiple effect evaporators.<br />
Feedstock use of fossil fuels can be seen <strong>in</strong> Fig. 1. Natural gas is used to make formaldehyde and ammonia,<br />
p<strong>et</strong>roleum is used to make <strong>et</strong>hylene oxide, and coal is used to make m<strong>et</strong>allurgical coke for phosphorus<br />
production. Us<strong>in</strong>g high heat values of 29 MJ/kg for coal, 54 MJ/kg for gas, and 45 MJ/kg for oil, the total<br />
feedstock energy is 33,000 MJ/Mt glyphosate. Thus, the cumulative energy demand is 181,000 MJ/Mt glyphosate.<br />
Two allocation choices <strong>in</strong> the glyphosate supply cha<strong>in</strong> are <strong>in</strong> the ammonia gtg, which produces CO2, and<br />
the white phosphorus gtg, which produces slag and fuel gas. We tested the impact of these allocation<br />
choices by s<strong>et</strong>t<strong>in</strong>g the allocation to ammonia and phosphorus to 1. Thus, no <strong>in</strong>ventories were allocated to<br />
CO2, slag, or fuel gases. In that case, the process energy, nre, and cumulative energy demands were 97, 187,<br />
and 235 MJ/kg glyphosate.<br />
Table 2. Cradle to gate energies for 1000 kg glyphosate.<br />
Chemicals Mass By-products<br />
Allocation<br />
factor<br />
Energy with allocation, MJ/1000kg glyphosate<br />
Dow-<br />
Direct use Trans- Potential Total n<strong>et</strong><br />
kg / 1000 kg glyphosate kg / kg chemical Electricity therm Steam of fuel port* recovery energy<br />
glyphosate 1,000 1.00 500 0 7.72E+04 0 440 -1.48E+04 6.33E+04<br />
Oxygen<br />
0.0553 kg Argon; 3.26 kg<br />
641 Nitrogen; 0.231 403 0 0 0 0 -2.88 401<br />
PMIDA 1,422 1.00 25.1 0 2,172 0 626 -745 2,079<br />
DSIDA <strong>in</strong> 37pct sol 1,186<br />
1.25 kg Ethanol Am<strong>in</strong>e;<br />
0.235 kg Tri<strong>et</strong>hanol am<strong>in</strong>e;<br />
0.0141 kg tri<strong>et</strong>hanol am<strong>in</strong>e, 85<br />
1.00 340 0 1,570 0 0 -7,323 -5,413<br />
di<strong>et</strong>hanol am<strong>in</strong>e 765 wt pct; 0.400 149 0 3,094 0 337 -1,043 2,536<br />
Ammonia 169 1.18 kg CO2;<br />
3.00E-03 kg Butane; 0.0400<br />
kg Ethane; 7.00E-03 kg LPG<br />
condensate; 0.0100 kg<br />
0.459 126 0 738 642 74.5 -606 976<br />
Natural gas 205 Propane; 0.943 0 0 0 698 0 0 698<br />
nitrogen from air 65.1 0.358 kg oxygen from air; 0.736 0 0 0 0 0 0 0<br />
oxygen from air 882 2.79 kg nitrogen from air; 0.264 0 0 0 0 0 0 0<br />
Water for rxn 1,005 1.00 0.809 0 0 0 0 0 0.809<br />
Ethylene oxide 603<br />
0.480 kg C4 stream; 0.0881<br />
kg fuel oil; 0.0484 kg<br />
Hydrogen; 0.569 kg CH4;<br />
0.634 kg Propylene; 1.03 kg<br />
1.00 1,169 0 22.5 0 265 -3,426 -1,970<br />
Ethylene 452 pyrolysis gas;<br />
1.55 kg heavy gas oil, from<br />
distillation; 0.644 kg<br />
kerosene, from distillation;<br />
0.542 kg light gas oil, from<br />
distillation; 0.711 kg residum,<br />
0.260 643 0 1,070 5,237 199 -1,280 5,869<br />
489
PARALLEL SESSION 6A: TOOLS AND DATABASES 8 th di<strong>et</strong>hanol am<strong>in</strong>e 765 wt pct; 0.400 149 0 3,094 0 337 -1,043 2,536<br />
Ammonia 169 1.18 kg CO2;<br />
3.00E-03 kg Butane; 0.0400<br />
kg Ethane; 7.00E-03 kg LPG<br />
0.459 126 0 738 642 74.5 -606 976<br />
condensate; 0.0100 kg<br />
Natural gas 205 Propane;<br />
nitrogen from air 65.1 0.358 kg oxygen from air;<br />
0.943<br />
0.736<br />
0<br />
0<br />
0<br />
0<br />
0<br />
0<br />
698<br />
0<br />
0 Int. Conference 0 698 on <strong>LCA</strong> <strong>in</strong> the<br />
0 Agri-<strong>Food</strong> 0 Sector, 0 1-4 Oct <strong>2012</strong><br />
oxygen from air 882 2.79 kg nitrogen from air; Alloca- 0.264 0 0 0 0 0 0 0<br />
Water for rxn 1,005 tion 1.00 0.809 0 0 0 0 0 0.809<br />
Chemicals Ethylene oxide Mass603 By-products<br />
0.480 kg C4 stream; 0.0881<br />
factor 1.00 Energy 1,169 with allocation, 0 MJ/1000kg 22.5 glyphosate 0 265 -3,426 -1,970<br />
kg fuel oil; 0.0484 kg<br />
Dow-<br />
Direct use Trans- Potential Total n<strong>et</strong><br />
kg / 1000 kg glyphosate kg Hydrogen; / kg chemical 0.569 kg CH4;<br />
Electricity therm Steam of fuel port* recovery energy<br />
glyphosate 1,000 0.634 kg Propylene; 1.03 kg 1.00 500 0 7.72E+04 0 440 -1.48E+04 6.33E+04<br />
Ethylene 452 pyrolysis 0.0553 kg gas; Argon; 3.26 kg 0.260 643 0 1,070 5,237 199 -1,280 5,869<br />
Oxygen 641 Nitrogen; 1.55 kg heavy gas oil, from 0.231 403 0 0 0 0 -2.88 401<br />
PMIDA 1,422 distillation; 0.644 kg<br />
1.00 25.1 0 2,172 0 626 -745 2,079<br />
DSIDA <strong>in</strong> 37pct sol 1,186 kerosene, from distillation;<br />
0.542 1.25 kg kg Ethanol light gas Am<strong>in</strong>e; oil, from<br />
0.235 distillation; kg Tri<strong>et</strong>hanol 0.711 kg am<strong>in</strong>e; residum,<br />
1.00 340 0 1,570 0 0 -7,323 -5,413<br />
Naphtha 461 0.0141 from distillation; kg tri<strong>et</strong>hanol am<strong>in</strong>e, 85 0.225 110 0 51.7 910 0 0 1,072<br />
di<strong>et</strong>hanol am<strong>in</strong>e 765 wt 0.886 pct; kg Chlor<strong>in</strong>e; 0.0252 0.400 149 0 3,094 0 337 -1,043 2,536<br />
Ammonia Sodium hydroxide 169 854 kg 1.18 Hydrogen; kg CO2; 0.459 0.523 4,045 126 0 2,740 738 6420 74.5 376 -46.3 -606 7,114 976<br />
sodium chloride <strong>in</strong> br<strong>in</strong>e<br />
3.00E-03 kg Butane; 0.0400<br />
26 wtpct 1,345 kg Ethane; 7.00E-03 kg LPG 1.00 19.2 0 1,212 0 0 0 1,232<br />
Formaldehyde 263 condensate; 0.0100 kg<br />
1.00 202 0 1,459 0 116 -1,176 600<br />
Natural M<strong>et</strong>hanol gas 205 330 Propane; 0.0103 kg Dim<strong>et</strong>hyl <strong>et</strong>her; 0.943 0.990 4150 0 6940 7,280 698 1450 -6,9350 1,600 698<br />
nitrogen Phosphorus from trichloride air 1,024 65.1 0.358 kg oxygen from air; 0.736 1.00 6.980 0 0 0 4500 0 457 0<br />
oxygen from air 882 2.79 0.0285 kg kg nitrogen Hydrogen; from air; 1.13 0.264 0 0 0 0 0 0 0<br />
Water Chlor<strong>in</strong>e for rxn 1,005 808 kg Sodium hydroxide; 0.464 1.00 0.809 3,826 0 2,5920 0 3550 -43.80 0.809 6,729<br />
Ethylene oxide 603 1.000 kg CO; 1.41 kg Dust;<br />
0.192 0.480 kg Ferrophosphorus;<br />
C4 stream; 0.0881<br />
1.00 1,169 0 22.5 0 265 -3,426 -1,970<br />
phosphorus, white 235 kg 8.10 fuel kg oil; Slag; 0.0484 kg<br />
Hydrogen; 7.92E-04 kg 0.569 Ammonia; kg CH4;<br />
0.0855 1,172 0 0 0 103 -599 677<br />
0.634 7.25E-03 kg Propylene; kg Ammonium 1.03 kg<br />
Ethylene 452 pyrolysis sulfate; 0.0133 gas; kg Benzene;<br />
0.0533 1.55 kg kg heavy coal gas tar from oil, from<br />
distillation; cok<strong>in</strong>g; 0.0703 0.644 kg kg coke oven<br />
0.260 643 0 1,070 5,237 199 -1,280 5,869<br />
coke, m<strong>et</strong>allurgical 22.1 kerosene, gas; from distillation; 0.873 0.620 0 0.0758 0.120 9.72 0 10.5<br />
coal mass 25.7 0.542 kg light gas oil, from 1.00 5.61 0 0 23.0 11.3 0 39.9<br />
Sulfuric acid 0.115 distillation; 0.711 kg residum, 1.00 8.68E-06 0 0.0829 0 0.0506 -0.0366 0.0970<br />
Naphtha 461 from 0.989 distillation; kg Sulfur dioxide; 0.225 110 0 51.7 910 0 0 1,072<br />
Sulfur trioxide 0.0934 0.506 0.886 kg Sulfuric Chlor<strong>in</strong>e; acid; 0.0252 0.401 0.0474 0 0.0178 0.0523 0.0411 -0.384 -0.226<br />
Sodium Sulfur hydroxide 0.0403 854 kg already Hydrogen; allocated 0.523 0.200 4,0450 0 2,7400 0.1970 0.0177 376 -46.30 7,114 0.215<br />
sodium Phosphate chloride rock <strong>in</strong> br<strong>in</strong>e 157 1.00 34.0 0 0 4.73 69.0 0 108<br />
26 Silica wtpct 1,345 62.3 1.00 19.20 0 1,2120 0 27.40 0 1,232 27.4<br />
Formaldehyde Total process energy 263 1.00 1.32E+04 202 0 9.46E+04 1,459 1.48E+040 3,604 116 -3.81E+04 -1,176 8.81E+04 600<br />
M<strong>et</strong>hanol Multiply<strong>in</strong>g by pre-combustion factor 330 to 0.0103 account kg for Dim<strong>et</strong>hyl energy <strong>et</strong>her; 0.990 415 0 694 7,280 145 -6,935 1,600<br />
Phosphorus consumed prior trichloride to po<strong>in</strong>t of use. 1,024 1.00 1.45E+04 6.98 0 1.09E+050 1.70E+040 4,325 450 -4.38E+040 1.01E+05 457<br />
Natural resource energy, HHV 0.0285 kg Hydrogen; 1.13<br />
4.54E+04 0 1.36E+05 1.70E+04 4,325 -5.47E+04 1.48E+05<br />
Chlor<strong>in</strong>e Precombustion factors, MJ fuel 808 extracted kg Sodium per hydroxide; MJ delivered (The 0.464 3,826 0 2,592<br />
excess is consumed <strong>in</strong> delivery) 1.000 kg CO; 1.41 kg Dust;<br />
1.1a 1.15b 1.15b<br />
Natural resource energy, MJ HHV 0.192 fuel kg per Ferrophosphorus;<br />
MJ energy to process.<br />
3.13 1.25 1.25<br />
phosphorus,<br />
a. half coal, half<br />
white<br />
nuclear with no<br />
235<br />
delivery<br />
8.10 kg Slag; 0.0855 1,172 0 0<br />
b. half oil, half natural gas<br />
7.92E-04 kg Ammonia;<br />
7.25E-03 kg Ammonium<br />
Table 2 (cont<strong>in</strong>ued). Cradle-to-gate sulfate; energies 0.0133 kg Benzene; for 1000 kg glyphosate.<br />
0.0533 kg coal tar from<br />
0<br />
1.20<br />
1.00<br />
0<br />
355<br />
1.15b<br />
1.00<br />
103<br />
-43.8<br />
1.15b<br />
1.25<br />
-599<br />
6,729<br />
677<br />
coke, m<strong>et</strong>allurgical<br />
coal mass<br />
Sulfuric acid<br />
cok<strong>in</strong>g; 0.0703 kg coke oven<br />
Energy use, design basis, abbreviated supply cha<strong>in</strong>. Total<br />
22.1 gas; process energy = 88,100 MJ/1000 0.873 kg. 0.620 Total nre = 148,000 0 0.0758 MJ/kg.<br />
25.7 1.00 5.61 0 0<br />
Process energy Natural resource value of process energy<br />
0.115 1.00 8.68E-06 0 0.0829<br />
100,000<br />
0.989 kg Sulfur dioxide;<br />
0.120 9.72<br />
23.0 11.3<br />
0 0.0506<br />
0<br />
0<br />
-0.0366<br />
10.5<br />
39.9<br />
0.0970<br />
Sulfur trioxide 0.0934 0.506 kg Sulfuric acid; 0.401 0.0474 0 0.0178 0.0523 0.0411 -0.384 -0.226<br />
Sulfur<br />
Phosphate rock<br />
80,000 0.0403 already allocated<br />
157<br />
0.200<br />
1.00<br />
0<br />
34.0<br />
0<br />
0<br />
0<br />
0<br />
0.197 0.0177<br />
4.73 69.0<br />
0<br />
0<br />
0.215<br />
108<br />
Silica 62.3 1.00 0 0 0 0 27.4 0 27.4<br />
Total process energy 60,000<br />
1.32E+04 0 9.46E+04 1.48E+04 3,604 -3.81E+04 8.81E+04<br />
Multiply<strong>in</strong>g by pre-combustion factor to account for energy<br />
consumed prior to po<strong>in</strong>t of use.<br />
40,000<br />
Natural resource energy, HHV<br />
Precombustion factors, MJ fuel extracted per MJ delivered (The<br />
1.45E+04<br />
4.54E+04<br />
0 1.09E+05 1.70E+04<br />
0 1.36E+05 1.70E+04<br />
4,325 -4.38E+04 1.01E+05<br />
4,325 -5.47E+04 1.48E+05<br />
excess is consumed <strong>in</strong> delivery) 20,000<br />
1.1a 1.15b 1.15b 1.20 1.15b 1.15b<br />
Natural resource energy, MJ HHV fuel per MJ energy to process.<br />
a. half coal, half nuclear with no delivery<br />
3.13 1.25 1.25 1.00 1.00 1.25<br />
b. half oil, half natural gas 0<br />
Energy, MJ per 1000 kg glyphosate<br />
-20,000<br />
Figure 2. Cradle-to-gate energy profile for glyphosate production<br />
Global warm<strong>in</strong>g potentials <strong>in</strong> particular are typically dom<strong>in</strong>ated by energy use. In the glyphosate supply<br />
cha<strong>in</strong>, process emissions of CO2 (no other GHG chemicals were formed from this chemical tree) are from the<br />
glyphosate gtg (oxidation of organic), <strong>et</strong>hylene oxide (over oxidation of <strong>et</strong>hylene), ammonia (coproduct),<br />
490
PARALLEL SESSION 6A: TOOLS AND DATABASES 8 th Int. Conference on <strong>LCA</strong> <strong>in</strong> the<br />
Agri-<strong>Food</strong> Sector, 1-4 Oct <strong>2012</strong><br />
m<strong>et</strong>alurgical coke production. Us<strong>in</strong>g a US electrical grid and exclud<strong>in</strong>g the ammonia coproduct CO2, these<br />
process emissions are 0.6 kg CO2/kg glyphosate, which corresponds to 6% of the total CO2e emissions (10.3<br />
kg CO2e/kg glyphosate). Thus the transformation to gobal warm<strong>in</strong>g potential impact assessment had little<br />
effect, but <strong>in</strong>volves more variability).<br />
4. Discussion and Conclusions<br />
Glyphosate production was modelled us<strong>in</strong>g the Monsanto route from di<strong>et</strong>hanolam<strong>in</strong>e. Cradle to gate energy<br />
analysis shows cumulative energy demands (all manufactur<strong>in</strong>g plus energy equivalent of the fossil resources<br />
used to build the glyphosate molecule) of 181 MJ HHV/kg us<strong>in</strong>g mass allocation for all processes.<br />
When zero burdens were allocation to the CO2, slag and fuel gas byproducts of ammonia and phosphorus,<br />
the cumulative energy demand was 235 MJ HHV/kg. This compares to cumulative energy demands of 406<br />
and 226 MJ LHV/kg, for the eco<strong>in</strong>vent models 2.1 (Green, 1987) and 2.2 (Sutter, 2010). The more recent<br />
eco<strong>in</strong>vent model is based on a different chemistry start<strong>in</strong>g from glyc<strong>in</strong>e. Despite the similar <strong>in</strong> cumulative<br />
energy demand result, there are some significant differences b<strong>et</strong>ween the model presented here, and that <strong>in</strong><br />
eco<strong>in</strong>vent. However, the results produced by the design m<strong>et</strong>hod for this paper are fast, <strong>in</strong>expensive, and<br />
provide extreme transparency.<br />
In glyphosate production, the cradle-to-gate process emissions of CO2 were 6% of the global warm<strong>in</strong>g<br />
impact. A more d<strong>et</strong>ailed life cycle <strong>in</strong>ventory and impact assessment can be obta<strong>in</strong>ed from the authors. The<br />
d<strong>et</strong>ailed analysis and documentation produced on this project represents an important change <strong>in</strong> our understand<strong>in</strong>g<br />
of the life cycle of glyphosate, cyhalofop-butyl, dazom<strong>et</strong>, and chloropicr<strong>in</strong>. In the case of glyphosate,<br />
this new datas<strong>et</strong> models an important commercial production route, <strong>in</strong>cludes the chemical emissions<br />
from reaction by-products, and achieves a level of transparency that other LCI data suppliers should strive<br />
for.<br />
5. References<br />
BCPC, 2010. The Pesticide Manual, 14th edition, see www.pesticidemanual.com for d<strong>et</strong>ails.<br />
Bryant, R.B., 2003. Specialty Chemicals Magaz<strong>in</strong>e,http://www.agranova.co.uk/pdf/RJB_ChemSpec2003.pdf<br />
Green, M. B., 1987. Energy <strong>in</strong> pesticide manufacture, distribution and use. In: Helsel Z.R. (ed.) Energy <strong>in</strong> Plant Nutrition and Pest<br />
Control, Energy <strong>in</strong> World Agriculture Vol. 2: 165-177.<br />
Green, M., A. McCulloch, 2007. Energy considerations <strong>in</strong> the use of herbicides, J.Sci. Fd Agric, 27:95-100<br />
Jimenez-Gonzalez, C. ,Overcash, M., 2000. Energy sub-modules applied <strong>in</strong> life cycle <strong>in</strong>ventory of processes, J. Clean Products and<br />
Processes, 2, 57-66.<br />
Overcash, M., Overcash, M. Evolv<strong>in</strong>g concepts <strong>in</strong> life cycle analyses, chapter <strong>in</strong> Cleaner Technologies and Cleaner Products for<br />
Susta<strong>in</strong>able Development, NATO ASI Series, Spr<strong>in</strong>ger-Verlag, New York, NY, p 455-470, 1995.<br />
Sutter, J., 2010. Life cycle <strong>in</strong>ventories of pesticides, Swiss Centre for Life Cycle Inventories, St. Gallen<br />
Unger, T.A., 1996. Pesticide synthesis handbook, Noyes, New Jersey.<br />
USEPA, 2011. Pesticides Industry Sales and Usage, 2006 and 2007 Mark<strong>et</strong> Estimates, Prepared by Grube, A., Donaldson, D., Kiely,<br />
T., and Wu, L., United States Environmental Protection Agency.<br />
Green, S, and Pohanish, R.P. (2005) Sittig’s Handbook of Pesticides and Agricultural Chemicals, William Andrew Publish<strong>in</strong>g.<br />
R & M (2001) Research and Mark<strong>et</strong>s report accessed onl<strong>in</strong>e<br />
http://www.researchandmark<strong>et</strong>s.com/report<strong>in</strong>fo.asp?report_id=1082203&t=d&cat_id=<br />
Woodburn, A.T. (2000) “Glyphosate: production, pric<strong>in</strong>g and use worldwide,” Pest Management Science 56, pp 309-312.<br />
Y<strong>in</strong>, G. (2011). Glyphosate: There Is No Substitute, url:<br />
http://www.farmchemicals<strong>in</strong>ternational.com/cropprotection/productfocus/?storyid=2997<br />
491
PARALLEL SESSION 6A: TOOLS AND DATABASES 8 th Int. Conference on <strong>LCA</strong> <strong>in</strong> the<br />
Agri-<strong>Food</strong> Sector, 1-4 Oct <strong>2012</strong><br />
492<br />
GHG assessment for agriculture and forestry sectors: review of<br />
landscape calculators<br />
V<strong>in</strong>cent Colomb 1,* , Louis Bockel 2 , Jean-Luc Chotte 1 , Sarah Mart<strong>in</strong> 3 , Marianne T<strong>in</strong>lot, Ophélie<br />
Touchemoul<strong>in</strong>, Martial Bernoux 1,*<br />
1<br />
IRD, UMR Eco&Sols (Montpellier SupAgro, CIRAD, INRA, IRD), 2 Place Viala, 34060 Montpellier Cedex 2, <strong>France</strong>.<br />
2<br />
FAO, Policy and Programme Development Support Division, Policy Assistance Support Service (TCSP), via delle terme di Caracalla,<br />
00153 Rome, Italy<br />
3<br />
ADEME, Service Agriculture <strong>et</strong> Forêts, 20 avenue du Grésillé - BP 90406 - 49004 Angers cedex 1, <strong>France</strong><br />
<br />
Correspond<strong>in</strong>g authors. E-mail: v<strong>in</strong>cent.colomb@ird.fr; martial.bernoux@ird.fr;<br />
ABSTRACT<br />
In parallel to IPCC work, many GHG calculators have been developed to assess agriculture and forestry practices. All these tools<br />
provide results <strong>in</strong> tonne eqCO2/ha or eqCO2/product. A review has been carried out to highlight their m<strong>et</strong>hodological differences,<br />
propose a typology, and discuss ma<strong>in</strong>s issues when work<strong>in</strong>g at landscape scale. Calculators were tested and questionnaires sent to the<br />
tool developers. It appears that some tools are now available for “every situation, <strong>in</strong> each part of the world”, although the most suitable<br />
tool is not always easy to identify. All tools are able to identify GHG “hotspots”, with exception of land use changes and soil<br />
management that are often poorly accounted. Uncerta<strong>in</strong>ties rema<strong>in</strong> very high, limit<strong>in</strong>g possibilities for economic reward/taxes for<br />
carbon actions. At last, perim<strong>et</strong>er and m<strong>et</strong>hodological differences impede straight comparison b<strong>et</strong>ween studies done by different<br />
tools, and restra<strong>in</strong> managers, policy makers and non-expert users to ga<strong>in</strong> reference values.<br />
Keywords: greenhouse gas emissions, tools, landscape assessment,<br />
Full report available on FAO-EXACT website: http://www.fao.org/tc/exact/review-of-available-ghg-tools-<strong>in</strong>-agriculture/en/<br />
1. Introduction<br />
Climate change has probably been the most studied impact category amongst <strong>LCA</strong>. It is also the criterion<br />
that is most likely to be adopted on short term for food labell<strong>in</strong>g and implementation of green taxes. As <strong>in</strong>ternational<br />
negotiations and state regulations on climate change goes on, policy makers and project managers<br />
are demand<strong>in</strong>g for tools to move towards green economy. Land based activities, ma<strong>in</strong>ly agriculture and forestry,<br />
can be both sources and s<strong>in</strong>ks of greenhouse gases (GHG). In most countries, they represent significant<br />
share of total GHG emissions, around 30% at global level. In parallel to IPCC work and progress on m<strong>et</strong>hodological<br />
issues, many GHG calculators have been developed recently to assess agriculture and forestry<br />
practices. The aim of this review is to provide users with helpful <strong>in</strong>formation for choos<strong>in</strong>g the most suitable<br />
tool for his need, and to highlight major m<strong>et</strong>hodological differences b<strong>et</strong>ween the tools. This review is complementary<br />
to other comparative studies of GHG tools for agriculture (C-AGG, 2010; Driver <strong>et</strong> al., 2010;<br />
Denef <strong>et</strong> al., <strong>2012</strong>; Milne <strong>et</strong> al., <strong>2012</strong>) with either a different focus (e.g. small holders) or stick<strong>in</strong>g to <strong>in</strong>dividual<br />
tool descriptions.<br />
2. M<strong>et</strong>hods<br />
This study focuses on calculators with a territorial/landscape approach. Generally landscape scale starts<br />
above farm scale, and implies multiple stakeholders. However, if specific landscape tools are not available,<br />
territories can always be described as a large regional/national farm. Therefore this study also <strong>in</strong>cludes tools<br />
work<strong>in</strong>g at farm scale.<br />
A large range of calculators has been identified through <strong>in</strong>tern<strong>et</strong> research and cross referenc<strong>in</strong>g. From this<br />
extended list, only multi-activity assessment tools were selected (i.e. <strong>in</strong>clud<strong>in</strong>g at least both crop and livestock<br />
production), correspond<strong>in</strong>g to 18 tools. Product specific tools, such as bioenergy tools were not <strong>in</strong>cluded.<br />
Only tools <strong>in</strong> French, English and Spanish have been <strong>in</strong>cluded. These farm/landscape tools have been<br />
tested and compared on several criteria regard<strong>in</strong>g practical and m<strong>et</strong>hodological aspects. Based on this work,<br />
a pre-filled questionnaire has been sent to each tool developer for compl<strong>et</strong><strong>in</strong>g and validat<strong>in</strong>g the analysis.<br />
The analysis has been done based on the experience of GHG assessment by EX-ACT team, specialised on<br />
develop<strong>in</strong>g countries project assessment and ADEME team, with deep knowledge of French territorial GHG<br />
assessment.<br />
3. Results<br />
GHG calculation can be implemented for different reasons, depend<strong>in</strong>g on stakeholders and local context. For<br />
GHG landscape assessment, specific tools designed for landscape approaches should be used (Table 1).<br />
However, if these tools are not available for the study area, farm tools can be used, simulat<strong>in</strong>g a “re-
PARALLEL SESSION 6A: TOOLS AND DATABASES 8 th Int. Conference on <strong>LCA</strong> <strong>in</strong> the<br />
Agri-<strong>Food</strong> Sector, 1-4 Oct <strong>2012</strong><br />
gional/national” farm. This attempt to classify each tool is not strict and some tools can correspond to several<br />
categories.<br />
Rais<strong>in</strong>g awareness: s<strong>et</strong> of tools usually for farmers and farm<strong>in</strong>g consultants. The aim is to <strong>in</strong>form<br />
them about climate change issue and the role of agriculture. The tool must be very simple (no tra<strong>in</strong><strong>in</strong>g<br />
required); user friendly and identify hotspots. Usually there are free onl<strong>in</strong>e tools. Tools follow<br />
typical Tiers 1 approach and have a large uncerta<strong>in</strong>ty. Most of them exclude soil carbon and land use<br />
change (LUC).<br />
Report<strong>in</strong>g: These tools are based on a landscape or farm approach, and must be able to take <strong>in</strong>to account<br />
the diversity of management practices <strong>in</strong> each area. They are us<strong>in</strong>g Tiers 1 or Tiers 2 approach.<br />
The aim is to analyse specifically the current situation, to make comparisons b<strong>et</strong>ween countries or<br />
farms based on a common basis and elaborate adapted policy <strong>in</strong> the future.<br />
o Landscape tools: Assessment of GHG emissions demanded by official <strong>in</strong>stitutes. Tools must<br />
avoid double count<strong>in</strong>g and correspond to official standards. They have large uncerta<strong>in</strong>ty on<br />
results due to uncerta<strong>in</strong>ty on both activity data and emission factors. These tools have to use<br />
average data, they can be quite time consum<strong>in</strong>g, especially for data collection.<br />
o Farm tools: For farmers, know<strong>in</strong>g <strong>in</strong> d<strong>et</strong>ail the current situation is a first step to implement<br />
reduction strategy, even if these tools are not really built to assess changes.<br />
Project evaluation<br />
Tools for project evaluation compare a basel<strong>in</strong>e to a “with project” situation. They can be split <strong>in</strong> b<strong>et</strong>ween<br />
two sub categories, depend<strong>in</strong>g if they are carbon mark<strong>et</strong> oriented<br />
o Focus on carbon credit<strong>in</strong>g schemes: Mostly <strong>in</strong> countries where agriculture is subjected to<br />
carbon credits.<br />
o Not focus on carbon credit<strong>in</strong>g schemes: usually account for all possible mitigation options,<br />
and especially carbon storage. However the tools must be cost efficient and user friendly.<br />
They aim at provid<strong>in</strong>g <strong>in</strong>formation for project managers, stakeholders and donors.<br />
Mark<strong>et</strong> and product oriented tools. These tools provide GHG results per product. The aim is to compare<br />
different product rather than assess<strong>in</strong>g a territory. This avoids omissions of GHG emissions dur<strong>in</strong>g<br />
leakage and <strong>in</strong>direct LUC. Usually these tools will <strong>in</strong>clude process and transport.<br />
Table 3 Tool typology based on f<strong>in</strong>al aim<br />
Objective of the user Tools and geographic zone of application<br />
Rais<strong>in</strong>g awareness Carbon Calculator for New Zealand Agriculture and Horticulture<br />
(NZ), Cplan v0 (UK); Farm<strong>in</strong>g Enterprise GHG Calculator(AUS);<br />
US cropland GHG calculator (USA).<br />
Report<strong>in</strong>g Landscape tools ALU (World); Climagri (FR), FullCam* (AUS)<br />
Farm tools Diaterre(FR); CALM (UK); CFF Carbon Calculator (UK); IFSC<br />
(USA)<br />
Project evaluation Focus on ECTS Farmgas (AUS), Carbon Farm<strong>in</strong>g tool (NZ); Forest tools: TARAM<br />
schemes (world), CO2 fix (world)<br />
Not focus on EX-ACT (World);US AID FCC (Develop<strong>in</strong>g countries), CBP<br />
ECTS schemes: (World), Holos(CAN), CAR livestock tools(USA)<br />
Mark<strong>et</strong> and product oriented tools Cool farm tool (World); Diaterre (FR), <strong>LCA</strong> tools and associated<br />
database (SimaPro, eco<strong>in</strong>vent, <strong>LCA</strong> food <strong>et</strong>c: data ma<strong>in</strong>ly for developed<br />
countries.)<br />
AUS: Australia; CAN: Canada; FR: <strong>France</strong>, NZ: New Zealand; UK: United K<strong>in</strong>gdom; USA: United States of America;<br />
FullCam: tool used by Australia for its national account<strong>in</strong>g. Only evaluate carbon and N2O fluxes, not CH4. High accuracy level<br />
obta<strong>in</strong>ed coupl<strong>in</strong>g extensive datas<strong>et</strong> and bio-physical process models.<br />
Based on this classification, user can follow the follow<strong>in</strong>g process to identify the most suitable tool for its<br />
use. An important po<strong>in</strong>t when choos<strong>in</strong>g a tool is to select one <strong>in</strong>clud<strong>in</strong>g all major sources <strong>in</strong> the study area.<br />
For more d<strong>et</strong>ails on the perim<strong>et</strong>er please refer to the full report (Colomb <strong>et</strong> al., <strong>2012</strong>)<br />
Choos<strong>in</strong>g one carbon tool: a 4-step process<br />
1.Def<strong>in</strong>e your aim for do<strong>in</strong>g carbon evaluation and identify appropriate s<strong>et</strong> of tools<br />
2.Def<strong>in</strong>e geographical area and select the tool(s) that is/are available for this context<br />
3.Check that the perim<strong>et</strong>er (forest, soil, LUC <strong>et</strong>c.) of your chosen tool is adapted to your aim, if the local tool<br />
is not adapted, you will have to choose more global tools.<br />
493
PARALLEL SESSION 6A: TOOLS AND DATABASES 8 th Int. Conference on <strong>LCA</strong> <strong>in</strong> the<br />
Agri-<strong>Food</strong> Sector, 1-4 Oct <strong>2012</strong><br />
4.Check your time and skill availability<br />
Figure 1. Tool selection process<br />
4. Discussion<br />
Environmental assessment at landscape scale implies several challenges (UNEP, <strong>2012</strong>). Up scal<strong>in</strong>g implies<br />
a change <strong>in</strong> data availability. At plot scale and farm scale, technical data are easily available and can be<br />
provided directly by farmers. At regional scale, data <strong>in</strong>ventory often needs to be obta<strong>in</strong>ed from statistical<br />
data base or expert knowledge, <strong>in</strong>creas<strong>in</strong>g uncerta<strong>in</strong>ties. However uncerta<strong>in</strong>ty on activity data is not correlated<br />
<strong>in</strong> a l<strong>in</strong>ear way with scale. Indeed, it is easier to g<strong>et</strong> reliable data for adm<strong>in</strong>istrative regions such as state<br />
or counties, rather than for a watershed. Increas<strong>in</strong>g scale can also reduce uncerta<strong>in</strong>ty with some local h<strong>et</strong>erogeneity<br />
(ex: soil, management practices, micro-climate) g<strong>et</strong>t<strong>in</strong>g balanced by work<strong>in</strong>g on medium rather than<br />
small scale (Post <strong>et</strong> al., 2001). In addition of these uncerta<strong>in</strong>ties on activity data, there are uncerta<strong>in</strong>ties due<br />
to year to year variability (climate and <strong>in</strong>duced management practice variation) and uncerta<strong>in</strong>ty on emission<br />
factors themself. Only uncerta<strong>in</strong>ties for the emission factors are som<strong>et</strong>ime mentioned by calculators.<br />
A major challenge with landscape assessment is how to consider pedo-climatic and management h<strong>et</strong>erogeneity.<br />
Indeed GHG emission and carbon stock<strong>in</strong>g processes can be quite site specific, and depend strongly<br />
on mangement practices (ex: soil N2O emissions). Moreover, good account<strong>in</strong>g of soil emission is crucial for<br />
agriculture calculators consider<strong>in</strong>g that N2O account for 40% of agriculture emission on global scale, and soil<br />
carbon storage/destock<strong>in</strong>g is the highest carbon s<strong>in</strong>k potential, with the ability to store or release the equivalent<br />
of several years of global emissions (Baumert <strong>et</strong> al., 2005; Powlson <strong>et</strong> al., 2011). For soil related emissions,<br />
calculators either use biophysical models, such as the soil organic matter dynamic models Roth-C or<br />
Century (Cerri <strong>et</strong> al., 2004), or average emission factors provided by IPCC or national studies (IPCC 2006).<br />
The use of bio-physical models allows more accurate estimations than IPCC average factors (once the model<br />
has been properly calibrated). However, these models work at field scale and need to be l<strong>in</strong>ked with spatially<br />
explicit datas<strong>et</strong> (“soil maps”) to work at landscape scale, these datas<strong>et</strong> not be<strong>in</strong>g available <strong>in</strong> most situations.<br />
In the future, proxy (NIRS) or remote sens<strong>in</strong>g (satellites image analyses) technologies might enable for<br />
cheap direct measurement of the carbon stock changes or GHG emissions at large scale.<br />
Account<strong>in</strong>g for time dynamic is also important, especially consider<strong>in</strong>g LUC and carbon storage. Project<br />
manager do<strong>in</strong>g GHG assesment should keep <strong>in</strong> m<strong>in</strong>d that landscape are under constant changes. Therefore<br />
494<br />
1.Aim<br />
Rais<strong>in</strong>g Awarness, Report<strong>in</strong>g, Project evaluation,<br />
Product/mark<strong>et</strong> oriented<br />
2.Geographical perim<strong>et</strong>er<br />
Temperate/tropical/subtropical/semiarid/boreal<br />
3.Activity perim<strong>et</strong>er<br />
crop/livestock/greenhouses/<br />
forest/fuel <strong>et</strong>c.<br />
4.Time & skills<br />
availablility
PARALLEL SESSION 6A: TOOLS AND DATABASES 8 th Int. Conference on <strong>LCA</strong> <strong>in</strong> the<br />
Agri-<strong>Food</strong> Sector, 1-4 Oct <strong>2012</strong><br />
more and more tools now suggest to evaluate a <strong>in</strong>itial situation, a “bus<strong>in</strong>ess as usual” scenario and a “with<br />
project” scenario (Bernoux <strong>et</strong> al., 2010).<br />
At landscape scale, management choices (chang<strong>in</strong>g, <strong>in</strong>creas<strong>in</strong>g or decreas<strong>in</strong>g production) can <strong>in</strong>duce<br />
changes on other territories (leakage), consider<strong>in</strong>g that food demand is not flexible. However, LUC depends<br />
not only on offer-demand balance, but also on many socio-economic param<strong>et</strong>ers. Production <strong>in</strong>crease can be<br />
obta<strong>in</strong>ed either by <strong>in</strong>crease of yields (no LUC <strong>in</strong>duced, but management changes <strong>in</strong>duced) or by extension of<br />
cultivated land. On the ground, the drivers for LUC can be more land tenure issues, production capacities<br />
and state regulations rather than global or even local food demand. Therefore it is really difficult to establish<br />
clear consequential relationship b<strong>et</strong>ween changes <strong>in</strong> one territory and changes <strong>in</strong> other ones. Such LUC,<br />
called <strong>in</strong>direct is calculated either by economical modell<strong>in</strong>g or consequential assessment (hypothesis based<br />
on expert knowledge). Although it is clear that there are some <strong>in</strong>teractions b<strong>et</strong>ween distant territories, quantifications<br />
is really difficult and one major challenge for environmental assessment (Plev<strong>in</strong> <strong>et</strong> al., 2010; De<br />
Cara <strong>et</strong> al., <strong>2012</strong>). So far only direct LUC is som<strong>et</strong>ime accounted <strong>in</strong> the calculators.<br />
One major po<strong>in</strong>t raised by this study is the lack of homogeneity concern<strong>in</strong>g account<strong>in</strong>g perim<strong>et</strong>ers. Indeed<br />
every GHG calculator account for different sources. Some <strong>in</strong>clude energy, some <strong>in</strong>frastructures and transport,<br />
some <strong>in</strong>clude emissions from N <strong>in</strong>puts by plant residues, some soil carbon dynamics <strong>et</strong>c. This impedes<br />
any direct comparison of results b<strong>et</strong>ween studies done by different tools. For a b<strong>et</strong>ter <strong>in</strong>terpr<strong>et</strong>ation of results,<br />
users need to have references and standard <strong>in</strong> m<strong>in</strong>d, seldom provided by user guides.<br />
Results units are key criteria <strong>in</strong> the calculator structure, and strongly <strong>in</strong>fluence results <strong>in</strong>terpr<strong>et</strong>ation. Results<br />
can be expressed <strong>in</strong> tonne equivalent CO2 (Teq CO2)/year, TeqCO2/project (several years),<br />
TeqCO2/year/ha, TeqCO2/kg product. Results might also be expressed <strong>in</strong> n<strong>et</strong> value (Emission – Storage); or<br />
provide both values. The most suitable unit depends on the aim of the project assessed, and the type of agriculture<br />
concerned. Indeed, <strong>in</strong>dustrial agriculture is clearly mark<strong>et</strong> oriented, has high productivity level and<br />
provides a considerable share of total food for humans. Its ma<strong>in</strong> challenge is to develop b<strong>et</strong>ter efficiency and<br />
reduce the carbon footpr<strong>in</strong>t per kg of product, especially consider<strong>in</strong>g that GHG emissions are global, with no<br />
local threshold on toxicity or decontam<strong>in</strong>ation potential. Thus results should always be related somehow to<br />
productivity level, mean<strong>in</strong>g eqCO2/kg product, eqCO2/kg Dry matter; eqCO2/calorie; eqCO2/prote<strong>in</strong>s <strong>et</strong>c.<br />
Several tools are develop<strong>in</strong>g this approach: <strong>LCA</strong> tools; calculators with GES per kg of product, Climagri®<br />
with a “Territory Feed<strong>in</strong>g potential <strong>in</strong>dicator” <strong>et</strong>c. These m<strong>et</strong>hodologies require either allocation rules or very<br />
general productivity <strong>in</strong>dicators (ex: dry matter, calories, prote<strong>in</strong>s) for territories with more than one output<br />
(Schau and F<strong>et</strong>, 2008; Cherub<strong>in</strong>i <strong>et</strong> al., 2009). Not consider<strong>in</strong>g productivity levels <strong>in</strong> these cases <strong>in</strong>duce a<br />
strong risk of leakage. On the opposite, <strong>in</strong> project oriented towards rural development, agriculture productivity<br />
is not an issue at global scale but rather a local socio-economical issue. The aim is to maximize population<br />
welfare and improve population life conditions. The eqCO2/kg product is less suitable. Indicators should<br />
be more oriented towards socio-economy criteria, such as eqCO2/$; eqCO2/job created; eqCO2/HDI po<strong>in</strong>t<br />
(Human development <strong>in</strong>dex) <strong>et</strong>c… These <strong>in</strong>dicators would be a good way to promote low carbon development<br />
path for “low <strong>in</strong>come countries”. No such approach has been identified so far. At the moment for small<br />
holders and develop<strong>in</strong>g countries, calculators are more oriented toward carbon credits and possibility to g<strong>et</strong><br />
mon<strong>et</strong>ary benefits from reduction emissions compare to basel<strong>in</strong>e.<br />
The l<strong>in</strong>k b<strong>et</strong>ween GHG assessment and economic param<strong>et</strong>er is often poor <strong>in</strong> calculators, which restra<strong>in</strong><br />
action plan feasibility evaluation. However there has been some attempt to use carbon tools with economic<br />
tools. For <strong>in</strong>stance, EX-ACT has been used with Marg<strong>in</strong> Abatement Cost Curves (MACC), provid<strong>in</strong>g <strong>in</strong>formation<br />
on the cost of carbon sequestration depend<strong>in</strong>g on chosen options. Such studies can show that which<br />
actions are profitable for the economy, which have a reasonable cost and which are unsuitable. It also enables<br />
cross-sectorial comparison for mitigation project. Such economic approaches <strong>in</strong>dicate that carbon storage<br />
and reduction of deforestation are amongst the most efficient way to fight aga<strong>in</strong>st climate change (Smith<br />
<strong>et</strong> al., 2008). Studies <strong>in</strong>dicate the potential of GHG emission for different carbon prices, show<strong>in</strong>g the possible<br />
effect of a carbon tax or carbon mark<strong>et</strong> (Smith <strong>et</strong> al., 2008).<br />
At last, carbon calculators are environmental assessment tools focused only on one criterion. For the<br />
analyses and solution proposed, special care for trade off must be considered (C-AGG, 2010). Some solutions<br />
that reduce carbon footpr<strong>in</strong>t might worsen biodiversity (ex: large biofuel plantations), <strong>in</strong>crease water<br />
consumption or <strong>in</strong>duce health risk (ex: growth hormone). Develop<strong>in</strong>g susta<strong>in</strong>able agriculture and forestry<br />
activities implies management practices that improve overall environmental footpr<strong>in</strong>t of products. More<br />
global m<strong>et</strong>hods that can be comb<strong>in</strong>ed with carbon account<strong>in</strong>g are currently developed, such as “landscape”<br />
<strong>LCA</strong> or impact assessment analyses.<br />
495
PARALLEL SESSION 6A: TOOLS AND DATABASES 8 th Int. Conference on <strong>LCA</strong> <strong>in</strong> the<br />
Agri-<strong>Food</strong> Sector, 1-4 Oct <strong>2012</strong><br />
5. Conclusion<br />
After this large review of carbon calculators, it appears that all tested calculators are account<strong>in</strong>g for ma<strong>in</strong><br />
GHG sources and emissions and should be able to identify hotspots (with special care for area subjected to<br />
LUC). However there is a lack of homogeneity <strong>in</strong> m<strong>et</strong>hodologies, therefore it is impossible to do straight<br />
comparisons b<strong>et</strong>ween studies done us<strong>in</strong>g different tools. Indeed all calculators refer to IPCC but this does not<br />
ensure homogenous approach as IPCC provide a general framework <strong>in</strong>clud<strong>in</strong>g many m<strong>et</strong>hodologies with<br />
different levels of d<strong>et</strong>ails. Comparative studies are som<strong>et</strong>ime available and confirm the ability of tested tool<br />
to provide coherent order of magnitudes (FAO, 2010; Soil Association Producer Support, undated). While<br />
<strong>in</strong>terpr<strong>et</strong><strong>in</strong>g results, it is a necessity to check for the perim<strong>et</strong>er accounted and while compar<strong>in</strong>g project keep<br />
<strong>in</strong> m<strong>in</strong>d uncerta<strong>in</strong>ties.<br />
Some tools are now available for most activities to be assessed <strong>in</strong> every part of the world. The accuracy<br />
level is still restricted but active research is on-go<strong>in</strong>g and most calculator developers are frequently updat<strong>in</strong>g<br />
their tools. The trend is for tools to enlarge their perim<strong>et</strong>ers (<strong>in</strong>clud<strong>in</strong>g more management options, more land<br />
types) and their geographical suitability. Improv<strong>in</strong>g accuracy implies more d<strong>et</strong>ailed <strong>in</strong>put data, and more<br />
time demand<strong>in</strong>g studies. Thus a balance must be found b<strong>et</strong>ween efficiency and accuracy. The recent proliferation<br />
of tools testifies of this research for appropriate balance. It is not expected that one tool becomes<br />
dom<strong>in</strong>ant as each tool is dedicated to different situation. However there is some “comp<strong>et</strong>ition” b<strong>et</strong>ween tools<br />
with similar aim and geographical coverage. It might br<strong>in</strong>g some confusion for non-specialist and we hope<br />
that this study will br<strong>in</strong>g some clarity.<br />
6. References<br />
Baumert, K. A., Herzog, T., and Persh<strong>in</strong>g, J. (2005). "Navigat<strong>in</strong>g the numbers: Greenhouse gas data and <strong>in</strong>ternational climate policy,"<br />
World Resources Inst.<br />
Bernoux, M., Branca, G., Carro, A., Lipper, L., Smith, G., and Bockel, L. (2010). Ex-ante greenhouse gas balance of agriculture and<br />
forestry development programs. Scientia Agricola 67, 31-40.<br />
C-AGG (2010). Carbon and Agriculture: G<strong>et</strong>t<strong>in</strong>g Measurable Results.http://www.c-agg.org/docs/CAGMR_compl<strong>et</strong>e.pdf<br />
Cherub<strong>in</strong>i, F., Bird, N. D., Cowie, A., Jungmeier, G., Schlamad<strong>in</strong>ger, B., and Woess-Gallasch, S. (2009). Energy-and greenhouse<br />
gas-based <strong>LCA</strong> of biofuel and bioenergy systems: Key issues, ranges and recommendations. Resources, Conservation and Recycl<strong>in</strong>g<br />
53, 434-447.<br />
Colomb, V., Bernoux, M., Bispo, A., Bockel, L., Chotte, J.-l., Mart<strong>in</strong>, S., Mart<strong>in</strong>-phipps, C., Mouss<strong>et</strong>, J., T<strong>in</strong>lot, M., and Touchemoul<strong>in</strong>,<br />
O. (<strong>2012</strong>). "Mitigation of Climate Change by Agriculture and Forestry Sectors: Review of landscape based calculators."http://www.fao.org/tc/exact/ex-act-home/en/<br />
De Cara, S., Goussebaïle, A., Grateau, R., Levert, F., Quemener, J., Vermont, B., Bureau, J. C., Gabrielle, B., Goh<strong>in</strong>, A., and Bispo,<br />
A. (<strong>2012</strong>). Revue critique des <strong>et</strong>udes evaluant l’eff<strong>et</strong> des changements d’affectation des sols sur les bilans environnementaux des<br />
biocarburants.<br />
Denef, K., Paustian, K., Archibeque, S., Biggar, S., and Pape, D. (<strong>2012</strong>). Report of Greenhouse Gas Account<strong>in</strong>g Tools for Agriculture<br />
and Forestry Sectors. Interim report to USDA under Contract No. GS23F8182H.<br />
Driver, K., Haugen-Kozyra, K., and Janzen, R. (2010). Agriculture Sector Greenhouse Gas Practices and Quantification Review.<br />
FAO (2010). Compar<strong>in</strong>g results of Carbon balance appraisal us<strong>in</strong>g on-go<strong>in</strong>g Bio-Carbon fund projects.<br />
<strong>2012</strong>.http://www.fao.org/tc/exact/validation-des-resultats/proj<strong>et</strong>s-du-fond-biocarbon/en/<br />
Milne, E., Neufeldt, H., Smalligan, M., Rosenstock, T., Mal<strong>in</strong>, D., Easter, M., Bernoux, M., Ogle, S., Casarim, F., Pearson, T., Bird,<br />
N., Steglich, E., Ostwald, M., Deneuf, K., and Paustian, K. (<strong>2012</strong>). "M<strong>et</strong>hods for the quantification of n<strong>et</strong> emissions at the landscape<br />
level for develop<strong>in</strong>g countries <strong>in</strong> smallholder contexts.,"<br />
Plev<strong>in</strong>, R. J., Jones, A. D., Torn, M. S., and Gibbs, H. K. (2010). Greenhouse gas emissions from biofuels’ <strong>in</strong>direct land use change<br />
are uncerta<strong>in</strong> but may be much greater than previously estimated. Environmental Science & Technology.<br />
Post, W. M., Izaurralde, R. C., Mann, L. K., and Bliss, N. (2001). Monitor<strong>in</strong>g and verify<strong>in</strong>g changes of organic carbon <strong>in</strong> soil. Climatic<br />
change 51, 73-99.<br />
Powlson, D., Whitmore, A., and Gould<strong>in</strong>g, K. (2011). Soil carbon sequestration to mitigate climate change: a critical re‐exam<strong>in</strong>ation<br />
to identify the true and the false. European Journal of Soil Science 62, 42-55.<br />
Schau, E., and F<strong>et</strong>, A. (2008). <strong>LCA</strong> studies of food products as background for environmental product declarations. The International<br />
Journal of Life Cycle Assessment 13, 255-264.<br />
Smith, P., Mart<strong>in</strong>o, D., Cai, Z., Gwary, D., Janzen, H., Kumar, P., McCarl, B., Ogle, S., O'Mara, F., and Rice, C. (2008). Greenhouse<br />
gas mitigation <strong>in</strong> agriculture. Philosophical Transactions of the Royal Soci<strong>et</strong>y B: Biological Sciences 363, 789-813.<br />
Soil Association Producer Support (undated). Carbon footpr<strong>in</strong>t calculators – a case study comparison review.http://www.swarmhub.co.uk/downloads/pdf/carbon_project/footpr<strong>in</strong>t_calculators.pdf<br />
UNEP (<strong>2012</strong>). "UNEP Year Book: Emerg<strong>in</strong>g issues <strong>in</strong> our global environement. http://www.unep.org/yearbook/<strong>2012</strong>.<br />
496
PARALLEL SESSION 6A: TOOLS AND DATABASES 8 th Int. Conference on <strong>LCA</strong> <strong>in</strong> the<br />
Agri-<strong>Food</strong> Sector, 1-4 Oct <strong>2012</strong><br />
Management and reduction of on-farm GHG emissions us<strong>in</strong>g the<br />
‘Cool Farm Tool’: a case study on field tomato production<br />
Emma Keller 1,2,* , Jaqi Lee 1 , Roland Clift 1 , Llorenç Milà i Canals 2 , Henry K<strong>in</strong>g 2 , Jon Hillier 3<br />
1 University of Surrey, Centre of Environmental Strategy (CES), Guildford, GU2 7XH, UK<br />
2 Unilever, Saf<strong>et</strong>y and Environmental Assurance (SEAC), Colworth Science Park, Sharnbrook, MK44 1LQ, UK<br />
3 University of Aberdeen, Institute of Biological and Environmental Sciences, School of Biological Sciences, Cruickshank Build<strong>in</strong>g,<br />
St Machar Drive, Aberdeen AB24 3UU, UK<br />
Correspond<strong>in</strong>g author. E-mail: e.keller@surrey.ac.uk<br />
ABSTRACT<br />
Globally, agriculture and land use change accounts for approximately 10-12% of GHG emissions (Smith <strong>et</strong> al., 2007) but also presents<br />
significant potential for mitigation (Smith <strong>et</strong> al., 2008). It has thus become a political focal po<strong>in</strong>t for emissions reduction. If this<br />
is to be realised, attention must be paid to the basic unit of agriculture, the farm. Effectively manag<strong>in</strong>g GHG emissions at the farm<br />
level can be achieved through the deployment of well documented good agricultural practices (GAPs) and resource optimisation.<br />
Quantify<strong>in</strong>g and measur<strong>in</strong>g farm level GHG impacts however, can provide additional <strong>in</strong>sights and opportunities for reduction which<br />
farmers typically lack.<br />
The Cool Farm Tool, developed by Hillier <strong>et</strong> al., (2011), is a multi-crop, globally applicable, farm-scale GHG calculator with high<br />
management sensitivity relevant for the farmer’s specific system. It <strong>in</strong>tegrates a number of globally d<strong>et</strong>erm<strong>in</strong>ed empirical models<br />
(Hillier <strong>et</strong> al., 2011) and requires <strong>in</strong>formation <strong>in</strong>puts easily accessible to farmers (e.g. fertiliser application, tillage practices), enabl<strong>in</strong>g<br />
them to measure their own farm GHG impact and explore different emission reduction scenarios. It therefore provides decision support<br />
to encourage low carbon farm<strong>in</strong>g and offers a low-cost (it’s open source) and robust means of measur<strong>in</strong>g on-farm GHG emissions<br />
quickly and with <strong>in</strong>stant results. The tool has recently been deployed at scale through the ‘Cool Farm<strong>in</strong>g Options’ project<br />
hosted by the Susta<strong>in</strong>able <strong>Food</strong> Lab (2011). In this project a number of companies from around the world have been us<strong>in</strong>g the tool<br />
with<strong>in</strong> a diverse range of food supply cha<strong>in</strong>s and <strong>in</strong> do<strong>in</strong>g so, have begun to build up a multi-crop and multi-regional data repository.<br />
This paper presents a case study of the application of the Cool Farm Tool <strong>in</strong> its first year with field tomato growers from several<br />
farms supply<strong>in</strong>g <strong>in</strong>to a global supply cha<strong>in</strong>. It describes the emissions profiles of these farms and illustrates the variability <strong>in</strong>herent<br />
among farm<strong>in</strong>g systems globally as a function of variability <strong>in</strong> management practices, climate, geography, soil properties and technology<br />
used. In addition these GHG figures are compared to current published literature sources and modelled data (Nemecek <strong>et</strong> al.,<br />
<strong>2012</strong>) to demonstrate the potential of the Cool Farm Tool as a data provider at a territorial or regional level. F<strong>in</strong>ally some conclusions<br />
and potential future developments for the tool m<strong>et</strong>hodology and use are presented.<br />
References<br />
Hillier, J., Walter, C., Mal<strong>in</strong>, D., Garcia-Suarez, T., Milà i Canals, L. & Smith, P., 2011. A farm-focused calculator for emissions<br />
from crop and livestock production. Environmental Modell<strong>in</strong>g & Software, 26, 1070-1078.<br />
Nemecek, T, J., Weiler, K., Plassmann, K., Schn<strong>et</strong>zer, J., Gaillard, G., Jefferies, D., Garcia-Suarez, T., K<strong>in</strong>g, H., Milà i Canals, L.,<br />
<strong>2012</strong>. Estimation of the variability <strong>in</strong> global warm<strong>in</strong>g potential of a worldwide crop production us<strong>in</strong>g a modular extrapolation approach.<br />
Journal of Cleaner Production. (Submitted).<br />
Smith, P., D. Mart<strong>in</strong>o, Z. Cai, D. Gwary, H. Janzen, P. Kumar, B. McCarl, S. Ogle, F. O’Mara, C. Rice, B. Scholes, O. Sirotenko.,<br />
2007. Agriculture, <strong>in</strong>: [B. M<strong>et</strong>z, O.R. Davidson, P.R. Bosch, R. Dave, L.A. Meyer (Eds.)], Climate Change 2007: Mitigation.<br />
Contribution of Work<strong>in</strong>g Group III to the Fourth Assessment Report of the Intergovernmental Panel on Climate Change., Cambridge<br />
University Press, Cambridge, United K<strong>in</strong>gdom and New York, NY, US.<br />
Smith, P., D. Mart<strong>in</strong>o, Z. Cai, D. Gwary, H. Janzen, P. Kumar, B. McCarl, S. Ogle, F. O’Mara, C. Rice, B. Scholes, O. Sirotenko,<br />
Howden, M., McAllister, T., Pan, G., Romanenkov, V., Schneider, U., Towprayoon, S., Wattenbach, M. & Smith, J. U., 2008.<br />
Greenhouse gas mitigation <strong>in</strong> agriculture, Philosophical Transactions of the Royal Soci<strong>et</strong>y, 363, 789-813.<br />
Susta<strong>in</strong>able <strong>Food</strong> Lab, 2011. Cool farm<strong>in</strong>g options. [Onl<strong>in</strong>e] Available from: http://www.susta<strong>in</strong>ablefoodlab.org/projects/climate<br />
(Accessed: 10/02/12).<br />
497
PARALLEL SESSION 6A: TOOLS AND DATABASES 8 th Int. Conference on <strong>LCA</strong> <strong>in</strong> the<br />
Agri-<strong>Food</strong> Sector, 1-4 Oct <strong>2012</strong><br />
PalmGHG, the RSPO greenhouse gas calculator for oil palm products<br />
C. Bessou 1 , L. Chase 2 , I. Henson 3 , A.F.N. Abdul-Manan 4 , L. Milà i Canals 5 , F. Agus 6 , M. Sharma 7<br />
1 CIRAD, UPR Perennial Crops, Av. de l’Agropolis, TA B-34/02, F-34398 Montpellier Cedex 5, <strong>France</strong><br />
2 Independent Consultant <strong>in</strong> Tropical Agriculture, High Trees, Mart<strong>in</strong>eau Drive, Dork<strong>in</strong>g, Surrey RH4 2PL, UK<br />
3 Independent Consultant <strong>in</strong> Tropical Agriculture, 7 Richmond Dale, Clifton, Bristol BS8 2UB, UK.<br />
4 Shell Global Solutions Sdn. Bhd. (342714-T), Level 20, Tower 2, P<strong>et</strong>ronas Tw<strong>in</strong> Towers, 50088 Kuala Lumpur, Malaysia<br />
5 Saf<strong>et</strong>y and Environmental Assurance Centre, Unilever R&D, Colworth Science Park, Sharnbrook, Bedfordshire, MK44 1LQ, UK<br />
6 Indonesian Forestry Research Center<br />
7 Asian Agri Group, R&D Centre, PO Box 35, Kebun Bahilang' Teb<strong>in</strong>g T<strong>in</strong>ggi Deli 20600, North Sumatera, Indonesia<br />
Correspond<strong>in</strong>g author. E-mail: cecile.bessou@cirad.fr<br />
ABSTRACT<br />
The Roundtable on Susta<strong>in</strong>able Palm Oil (RSPO) is a non-profit association promot<strong>in</strong>g susta<strong>in</strong>able palm oil through a voluntary<br />
certification scheme. Two successive science-based work<strong>in</strong>g groups on greenhouse gas (GHG) have been active <strong>in</strong> RSPO b<strong>et</strong>ween<br />
2009-2011, with the aim of identify<strong>in</strong>g ways lead<strong>in</strong>g to mean<strong>in</strong>gful and verifiable reduction of GHG emissions. One of the outputs is<br />
PalmGHG, a GHG calculator us<strong>in</strong>g the <strong>LCA</strong> approach to quantify the major sources of emission and sequestration for a mill and its<br />
supply base. A pilot study was carried out <strong>in</strong> 2011 on n<strong>in</strong>e RSPO companies. Results gave an average of 1.03 t CO2e/t crude palm<br />
oil, with a wide range of -0.07 to +2.46 t CO2e/t CPO. Previous land use and area under peat were the ma<strong>in</strong> causes of the variation.<br />
Further modifications to PalmGHG are be<strong>in</strong>g made, notably to amend default values and upgrade it to a user-friendly software.<br />
Keywords: palm oil, biodiesel, GHG, calculator, RSPO, PalmGHG<br />
1. Introduction<br />
Nowadays, palm oil is the most used veg<strong>et</strong>able oil worldwide, represent<strong>in</strong>g more than 30% of total produced<br />
veg<strong>et</strong>able oils by mass (Omont, 2010). About 10 to 15% of global production is certified by RSPO<br />
(USDA, 2011; RSPO, 2011). RSPO is a non-profit association registered <strong>in</strong> 2004. It promotes the production<br />
and consumption of susta<strong>in</strong>able palm oil through a voluntary certification scheme. For the growers, this<br />
scheme relies on the compliance with 39 pr<strong>in</strong>ciples and criteria (P&Cs) of susta<strong>in</strong>ability that were def<strong>in</strong>ed by<br />
consensus <strong>in</strong> 2007. Dur<strong>in</strong>g 2009-2011, the RSPO Executive Board (EB) has commissioned a science-based<br />
work<strong>in</strong>g group on greenhouse gas (GHG WG) with the aim of identify<strong>in</strong>g ways lead<strong>in</strong>g to mean<strong>in</strong>gful and<br />
verifiable reduction of GHG emissions. One of the outputs is PalmGHG, a greenhouse gas calculator that<br />
allows producers calculate the GHG balances of oil palm products. PalmGHG was developed by the GHG<br />
WG as an excel spreadshe<strong>et</strong> us<strong>in</strong>g the <strong>LCA</strong> approach and based on a previous tool by Chase & Henson<br />
(2010). PalmGHG quantifies the major sources of emission and sequestration for a palm oil mill and its supply<br />
base, and is compatible with standard <strong>in</strong>ternational GHG account<strong>in</strong>g m<strong>et</strong>hodologies. It allows for identification<br />
of pr<strong>in</strong>cipal emission sources for management purposes; regular report<strong>in</strong>g, and monitor<strong>in</strong>g. This<br />
paper presents the scientific background of PalmGHG B<strong>et</strong>a version (of April <strong>2012</strong>) calculation as well as<br />
results from a pilot study carried out <strong>in</strong> 2011 on n<strong>in</strong>e RSPO companies.<br />
2. M<strong>et</strong>hods<br />
2.1. PalmGHG approach and boundaries<br />
The PalmGHG calculator provides an estimate of the n<strong>et</strong> GHG emissions produced dur<strong>in</strong>g the palm oil<br />
and palm biodiesel production cha<strong>in</strong>s. Follow<strong>in</strong>g the IPCC guidel<strong>in</strong>es (2006), the GHGs considered are CO2,<br />
N2O, and CH4, with 100-year timeframe conversion factors of N2O and CH4 <strong>in</strong>to CO2 equivalents (CO2e)<br />
(IPCC, 2007). The conversion factor for biogenic CH4 is calculated from the ratio of the molecular weights<br />
of CO2 and CH4 to account for the released CO2 orig<strong>in</strong>at<strong>in</strong>g from photosynthesis fixation; i.e. a global warm<strong>in</strong>g<br />
potential of 22.25 kg CO2e/kg CH4 (Wicke <strong>et</strong> al., 2008). The calculator is based on an attributional <strong>LCA</strong><br />
approach, i.e. the impacts are those l<strong>in</strong>ked to the production unit without consider<strong>in</strong>g marg<strong>in</strong>al impacts on<br />
other productions or any feedback mechanisms, and without <strong>in</strong>clud<strong>in</strong>g <strong>in</strong>direct land use changes.<br />
The emission sources <strong>in</strong>cluded <strong>in</strong> the calculator are: i) Land clear<strong>in</strong>g; ii) Manufacture and transport of fertilisers;<br />
iii) N2O and CO2 result<strong>in</strong>g from the field application of fertilisers and mill by-products; iv) Fossil<br />
fuel used <strong>in</strong> the field, ma<strong>in</strong>ly for harvest<strong>in</strong>g and collection of Fresh Fruit Bunches (FFB); v) Fossil fuel used<br />
at the mill; vi) CH4 produced from palm oil mill effluent (POME); and vii) N2O and CO2 result<strong>in</strong>g from the<br />
cultivation of peat soils. In addition, the follow<strong>in</strong>g GHG sequestration and credits are also considered: i) CO2<br />
fixed by oil palm trees, ground cover and plantation litter; ii) CO2 fixed by biomass <strong>in</strong> conservation areas<br />
(m<strong>et</strong>hodology still under development); iii) GHG avoided by the sell<strong>in</strong>g of mill energy by-products (electricity<br />
sold to the grid; palm kernel shell sold to <strong>in</strong>dustrial furnaces; <strong>et</strong>c.). These ten elements account for the<br />
498
PARALLEL SESSION 6A: TOOLS AND DATABASES 8 th Int. Conference on <strong>LCA</strong> <strong>in</strong> the<br />
Agri-<strong>Food</strong> Sector, 1-4 Oct <strong>2012</strong><br />
bulk of the GHG emission and sequestration occurr<strong>in</strong>g dur<strong>in</strong>g the oil palm crop cycle (Chase and Henson,<br />
2010). Items that are not <strong>in</strong>cluded <strong>in</strong> the budg<strong>et</strong> are the nursery stage, pesticide treatments, fuel used for land<br />
clear<strong>in</strong>g, emissions embedded <strong>in</strong> <strong>in</strong>frastructures and mach<strong>in</strong>es, and the sequestration of carbon <strong>in</strong> palm products<br />
and co-products. These items are generally negligible GHG sources (Schmidt, 2007; European Commission,<br />
2009; Choo <strong>et</strong> al., 2011). Carbon sequestered <strong>in</strong> palm products and co-products is short-lived, while the<br />
other emissions are small when annualised over the crop cycle. Changes <strong>in</strong> soil organic matter <strong>in</strong> m<strong>in</strong>eral<br />
soils might be significant <strong>in</strong> the long term but were not considered due to a lack of consensual and harmonised<br />
reliable data.<br />
In the first step, n<strong>et</strong> emissions are calculated as tonnes of CO2e per hectare. From the yield <strong>in</strong> FFB and the<br />
extraction rates <strong>in</strong> the mill, results are then calculated per tonne of Crude Palm Oil (CPO) and per tonne of<br />
Palm Kernel (PK). Allocation of the n<strong>et</strong> emissions of CO2e b<strong>et</strong>ween CPO and PK, then subsequently b<strong>et</strong>ween<br />
Palm Kernel Oil (PKO) and Palm Kernel Expeller (PKE), is carried out accord<strong>in</strong>g to either the relative<br />
masses of these co-products or to their relative energy contents. Mass allocation ratios are s<strong>et</strong>up as default <strong>in</strong><br />
PalmGHG. F<strong>in</strong>ally, the n<strong>et</strong> emissions of CO2e are calculated per Mega Joules (MJ) of palm biodiesel <strong>in</strong>clud<strong>in</strong>g<br />
emissions from ref<strong>in</strong>ery and further biofuel steps accord<strong>in</strong>g to the m<strong>et</strong>hodology and default coefficients<br />
provided by the European Renewable Energy Directive (European Commission, 2009). Biodiesel results are<br />
given as GHG emission sav<strong>in</strong>gs compared to the diesel fossil equivalent.<br />
Provision is made for separate budg<strong>et</strong>s for a mill's own crop (usually produced on estates) and an outgrower<br />
crop (such as produced by smallholders). PalmGHG uses the annualised emission and sequestration<br />
data to estimate the n<strong>et</strong> GHG balance for the palm products from both own and out-grower crops at an <strong>in</strong>dividual<br />
mill. Emissions from the biomass cleared at the beg<strong>in</strong>n<strong>in</strong>g of the crop cycle are averaged over the<br />
cycle. Emissions from the other sources are averaged over the three years up to and <strong>in</strong>clud<strong>in</strong>g the report<strong>in</strong>g<br />
date, thus simplify<strong>in</strong>g data collection and smooth<strong>in</strong>g out short-term annual fluctuations.<br />
2.2. Land clear<strong>in</strong>g and crop sequestration<br />
The approach used to evaluate the contribution of land clear<strong>in</strong>g to GHG emissions <strong>in</strong> PalmGHG is to average<br />
the emissions over a full crop cycle. The calculator estimates the total emissions occurr<strong>in</strong>g each year of<br />
new plant<strong>in</strong>g, adds them all up, and f<strong>in</strong>ally divides by the number of years <strong>in</strong> the average crop cycle (the<br />
default is 25 years or 20 years <strong>in</strong> the case of biodiesel calculation) to obta<strong>in</strong> an average emission per ha per<br />
year. The crop cycle length is def<strong>in</strong>ed by users and can differ b<strong>et</strong>ween “own crops” and “out-growers”. It<br />
also differs b<strong>et</strong>ween crops on m<strong>in</strong>eral soils and those on peat soil, which are often shorter due to accentuated<br />
sensitivity to pest and diseases (W<strong>et</strong>lands International, 2010).<br />
Previous land uses and their respective carbon stocks were def<strong>in</strong>ed <strong>in</strong> consultation with the scientific<br />
panel of RSPO GHG WG who performed a thorough review of literature data and satellite images to identify<br />
land use changes associated with oil palm plantations <strong>in</strong> Indonesia and Malaysia. Considered carbon stocks<br />
<strong>in</strong>clude above- and below-ground biomass. Carbon stock values for eight previous land uses apart from oil<br />
palm stands are currently available <strong>in</strong> PalmGHG (logged forest, secondary regrowth forest, shrub, grassland,<br />
food crops, coconut, rubber, cocoa under shade). Further previous land uses should be implemented soon.<br />
However, with<strong>in</strong> the framework of RSPO P&Cs, land use change after 2005 from primary forest to palm<br />
plantation will not be allowed. Emissions aris<strong>in</strong>g from land clear<strong>in</strong>g are calculated based on measured carbon<br />
contents or <strong>in</strong> their absence an assumed carbon content of 45% <strong>in</strong> the biomass of the previous land use.<br />
Data for carbon sequestration <strong>in</strong> the veg<strong>et</strong>ation stand can be obta<strong>in</strong>ed from different sources. Field measurements<br />
may often be the most relevant data, should they be available and representative of a whole plantation<br />
cycle. Where the resources for obta<strong>in</strong><strong>in</strong>g these measurements are not available, modelled data may be<br />
used <strong>in</strong>stead. Data from OPRODSIM and OPCABSIM models (Henson, 2005, 2009) are used as defaults <strong>in</strong><br />
PalmGHG to calculate oil palm carbon stock depend<strong>in</strong>g on the crop cycle length. These models produce<br />
annual values of stand<strong>in</strong>g biomass for the oil palms (above and below-ground), ground cover, frond piles and<br />
other litter. Field observations revealed that biomass growth and yields are generally lower <strong>in</strong> the case of outgrowers<br />
(Chase & Henson, 2010). To reflect this difference, contrast<strong>in</strong>g simulation scenarios of crop sequestration<br />
are used as default estimates for mill own crops and out-growers: a ‘vigorous growth’ simulation is<br />
used for own crops, and an ‘average growth’ simulation is used for out-growers.<br />
2.3 Emissions due to fertiliser use and field operations<br />
Emissions due to fertilisers contribute significantly to total agricultural GHG emissions and so affect the<br />
f<strong>in</strong>al GHG balance of palm oil (Yusoff <strong>et</strong> Hansen, 2007; Pleanjai <strong>et</strong> al., 2009a; Arvidsson <strong>et</strong> al., 2011; Choo<br />
499
PARALLEL SESSION 6A: TOOLS AND DATABASES 8 th Int. Conference on <strong>LCA</strong> <strong>in</strong> the<br />
Agri-<strong>Food</strong> Sector, 1-4 Oct <strong>2012</strong><br />
<strong>et</strong> al., 2011). Therefore, they have been accorded special attention <strong>in</strong> PalmGHG. Provision is given for n<strong>in</strong>e<br />
widely used synth<strong>et</strong>ic fertilisers and two organic ones (Empty Fruit Bunches (EFB) and POME).<br />
For synth<strong>et</strong>ic fertilisers, emissions consist of i) <strong>in</strong>direct upstream emissions due to their manufacture and<br />
transport from production sites to the mill; ii) direct field emissions l<strong>in</strong>ked to physical and microbial processes<br />
<strong>in</strong> the soil, and iii) <strong>in</strong>direct field emissions follow<strong>in</strong>g re-deposition of previous direct field emissions.<br />
Emissions dur<strong>in</strong>g fertiliser production vary with the type of product from 44 to 2,380 kg CO2e/t fertiliser<br />
(Jensson and Kongshau, 2003). N2O direct and <strong>in</strong>direct field emissions, as well as CO2 emissions from urea<br />
application, are calculated accord<strong>in</strong>g to IPCC Tier 1 (IPCC, 2006).<br />
Emissions due to EFB and POME production are already accounted for <strong>in</strong>tr<strong>in</strong>sically with<strong>in</strong> the supply<br />
cha<strong>in</strong> assessment. The amounts of EFB and POME are calculated us<strong>in</strong>g the follow<strong>in</strong>g factors:<br />
0.5 t POME/t FFB (Yacob <strong>et</strong> al., 2006), and 0.22 t EFB/t FFB (Gurmit, 1995). Direct and <strong>in</strong>direct field N2O<br />
emissions are calculated accord<strong>in</strong>g to IPCC Tier 1 based on their N content of 0.32% for EFB and 0.045%<br />
for POME (Gurmit, 1995). The amounts of EFB and POME, as well as their N contents can be substituted<br />
us<strong>in</strong>g on-site measurements if these are available.<br />
Emissions due to field operations arise from fossil fuel consumed for transport and other field operations,<br />
based on the emission factor 3.13 kg CO2e/L diesel (JEC, 2007). Total field fuel used encompasses the fuel<br />
used for the transport of workers (when managed by the mill) and materials, <strong>in</strong>clud<strong>in</strong>g the transport and<br />
spread<strong>in</strong>g of fertilisers, the transport of FFB from the grow<strong>in</strong>g areas to the mill, and ma<strong>in</strong>tenance of field<br />
<strong>in</strong>frastructure. Data on fuel use is usually not disaggregated at mill level.<br />
2.4 Emissions due to peat cultivation<br />
Emissions from peat cultivation <strong>in</strong>clude CO2 emissions due to the oxidation of organic carbon and associated<br />
N2O emissions. Both <strong>in</strong>volve enhanced microbial activity. RSPO GHG WG <strong>in</strong>tensively reviewed the<br />
impacts of peat cultivation on GHG emissions and identified best management practices for oil palm cultivation<br />
on peat soils. In their f<strong>in</strong>d<strong>in</strong>gs, the authors put emphasis on the importance of manag<strong>in</strong>g the water table<br />
depth to limit CO2 emissions from peat land. CO2 emissions due to peat cultivation are hence calculated us<strong>in</strong>g<br />
the equation (Eq. 1) accord<strong>in</strong>g to RSPO GHG WG (F. Agus, pers. com. <strong>2012</strong>). Peat CO2 emissions will<br />
vary depend<strong>in</strong>g on water table management and this is allowed for <strong>in</strong> PalmGHG.<br />
500<br />
Peat CO2 emission (t CO2/ha/year) = 0.7 x 0.91 x Dra<strong>in</strong>age depth (cm) Eq. 1<br />
For N2O emissions from peat soils, data relat<strong>in</strong>g emissions to dra<strong>in</strong>age depth are presently <strong>in</strong>adequate.<br />
Therefore, the IPCC Tier 1 emission factor is used as a default, i.e. 16 kg N-N2O/ha/yr (IPCC, 2006). Research<br />
is still ongo<strong>in</strong>g to b<strong>et</strong>ter d<strong>et</strong>erm<strong>in</strong>e the magnitude of peat emissions and how they are affected by and<br />
related to factors such as dra<strong>in</strong>age depth, peat subsidence and plantation age.<br />
2.5 Emissions due to oil extraction and transesterification<br />
At the mill level, two ma<strong>in</strong> sources of GHG emissions are recorded, fossil fuel consumption and CH4<br />
emission from POME. Fuel emissions are calculated us<strong>in</strong>g the conversion factor of 3.13 kg CO2e/L diesel<br />
(JEC, 2007). Diesel use is usually limited and mostly use to start the mach<strong>in</strong>es (Pleanjai <strong>et</strong> al., 2009a).<br />
CH4 emissions from POME vary accord<strong>in</strong>g to the type of treatment. The amount of CH4 produced per<br />
unit of POME is 12.36 kg CH4/t POME (Yacob <strong>et</strong> al., 2005). This is the amount released by untreated<br />
POME, but options are provided for the capture of CH4 which is then either flared or used as a fuel to generate<br />
electricity. Calculations of CH4 production and amounts and losses dur<strong>in</strong>g digestion, flar<strong>in</strong>g, or electricity<br />
production are based on factors from Schmidt (2007) and the Environment Agency (2002). When CH4 is<br />
flared and converted to CO2 these emissions are not accounted for because of their biogenic orig<strong>in</strong>, except<br />
for a small fraction of CH4 that escapes conversion. When CH4 is used to generate electricity then the<br />
amount of substituted electricity is calculated based on an energy content of 45.1 MJ/kg CH4 (JEC, 2007).<br />
The correspond<strong>in</strong>g emissions avoided by the use of the electricity are calculated us<strong>in</strong>g the average emission<br />
factor for Indonesia and Malaysia (RFA, 2008). A further option is given to the user <strong>in</strong> case excess palm<br />
kernel shell is sold as substitute for coal <strong>in</strong> <strong>in</strong>dustrial furnaces (pers. com. L. Milà i Canals, 2011).<br />
The GHG calculation <strong>in</strong> PalmGHG was compl<strong>et</strong>ed with excel spreadshe<strong>et</strong>s from the BioGrace calculator<br />
<strong>in</strong> order to enable GHG calculation up to palm biodiesel output (BioGrace, 2010). The user does not need to<br />
provide further data apart from field and mill data.
PARALLEL SESSION 6A: TOOLS AND DATABASES 8 th Int. Conference on <strong>LCA</strong> <strong>in</strong> the<br />
Agri-<strong>Food</strong> Sector, 1-4 Oct <strong>2012</strong><br />
3. Results of PalmGHG pilot<br />
3.1. The pilot process<br />
A pilot study was carried out <strong>in</strong> 2011 on n<strong>in</strong>e RSPO companies, to d<strong>et</strong>erm<strong>in</strong>e the ease of use, and suitability<br />
of PalmGHG as a management tool. In June 2011, a prelim<strong>in</strong>ary questionnaire was sent to correspondents<br />
from the pilot companies. This questionnaire was the start<strong>in</strong>g po<strong>in</strong>t of correspondences b<strong>et</strong>ween these companies<br />
and the authors, who were responsible for guid<strong>in</strong>g company correspondents with the use of<br />
PalmGHG. Mail exchanges, as well as field visit, allowed for the compilation of <strong>in</strong>put data and calculation of<br />
GHG balances.<br />
3.2. Pilot results<br />
Results from eight mills are presented <strong>in</strong> this paper (Table 1). The average GHG balance is<br />
1.03 t CO2e/t CPO, with a wide range from -0.07 to +2.46t CO2e/t CPO. Previous land use and the percentage<br />
of the area under peat were the ma<strong>in</strong> causes of the variation. Ma<strong>in</strong> emission hot spots are land clear<strong>in</strong>g,<br />
peat cultivation, and CH4 from POME. Emissions from N-fertiliser production and N-related field emissions<br />
also are an important source of GHG. For the mill C1 (Table 1), ma<strong>in</strong> contributors for the mill’s own crop<br />
plantations are peat emissions (43%), CH4 from POME (28%), land clear<strong>in</strong>g emissions (14%) and N2O field<br />
emissions (8%). For the same mill, ma<strong>in</strong> contributors for the out-grower plantations are CH4 from POME<br />
(52%), land clear<strong>in</strong>g emissions (26%), and N2O field emissions (12%). In this case, the absence of peat area<br />
<strong>in</strong> out-grower’s plantation makes a clear difference b<strong>et</strong>ween two cropp<strong>in</strong>g systems supply<strong>in</strong>g the same mill.<br />
Table 1. Pilot mills, their ma<strong>in</strong> characteristics and GHG balances assessed with PalmGHG<br />
Mills Mean yield<br />
t FFB/ha<br />
Out-growers<br />
<strong>in</strong>cluded<br />
Peat soil proportions<br />
(own-growers only)<br />
Previous land uses t CO2e/t CPO<br />
A1 23 no 0% Shrub 0.05<br />
A2 24 no 0% Shrub -0.07<br />
B 26 no 0% Cocoa, oil palm 0.79<br />
C1 23 yes 25% Grassland, shrub 0.73<br />
C2 19 yes 80% Grassland, shrub 2.46<br />
F 19 no 0% Logged forest, oil palm 1.85<br />
G 26 yes 0% Range from logged forest to food crops 1.15<br />
H 17 yes 0% Logged forest 1.35<br />
Figure 1. Scenario test<strong>in</strong>g with PalmGHG: Base case (1) = mixed previous land uses, peat 3%, no POME<br />
treatment, OER 20%, mill ‘s own crop mean yield 20.2 t FFB/ha, out-growers’ mean yield 14.2 t FFB/ha<br />
PalmGHG readily allows manipulation of <strong>in</strong>put data to test management <strong>in</strong>terventions. Results of scenario<br />
test<strong>in</strong>g are given for a s<strong>et</strong> of dummy data for a base case (scenario 1 <strong>in</strong> Figure 1). The results show that<br />
high emissions result from clear<strong>in</strong>g logged forest and peat cultivation, and conversely that very low (negative)<br />
emissions result from clear<strong>in</strong>g low biomass land such as grass land. Fertiliser emissions are a non<br />
501
PARALLEL SESSION 6A: TOOLS AND DATABASES 8 th Int. Conference on <strong>LCA</strong> <strong>in</strong> the<br />
Agri-<strong>Food</strong> Sector, 1-4 Oct <strong>2012</strong><br />
negligible contributor especially <strong>in</strong> scenario 3, where n<strong>et</strong> sequestration (sequestration less land clear<strong>in</strong>g<br />
emissions) is high, or <strong>in</strong> scenarios 5 and 6, where n<strong>et</strong> sequestration is almost null and CH4 is captured. The<br />
contribution of mill fuel is negligible and not visible on the graph. N<strong>et</strong> emissions below 0.5 t CO2e/t CPO<br />
can be obta<strong>in</strong>ed from a mature <strong>in</strong>dustry that is replant<strong>in</strong>g palms and captur<strong>in</strong>g and generat<strong>in</strong>g electricity from<br />
captured CH4 (Fig. 1). This was highlighted <strong>in</strong> the recommendations to the RSPO EB.<br />
4. Discussion<br />
GHG balances calculated with PalmGHG are with<strong>in</strong> the range of those found <strong>in</strong> the literature. However,<br />
depend<strong>in</strong>g on the system boundaries and particularly on assumptions regard<strong>in</strong>g land clear<strong>in</strong>g and peat emissions,<br />
GHG balances greatly vary around 2.3 t CO2e/t CPO (Schmidt, 2007), 0.6-1 t CO2e/t CPO (Siangjaeo<br />
<strong>et</strong> al., 2011), or 2.8-19.8 t CO2e/t CPO (Reijnders <strong>et</strong> Huijbregts, 2008). Carbon stocks and peat emissions are<br />
notably very sensitive param<strong>et</strong>ers. Research efforts are still needed to b<strong>et</strong>ter quantify carbon stocks and the<br />
impacts of agricultural practices on these stocks, especially <strong>in</strong> the case of peat cultivation. PalmGHG should<br />
be updated regularly to <strong>in</strong>troduce newly harmonised carbon stocks for diverse land uses with added impacts<br />
on soil organic contents, and to b<strong>et</strong>ter model the emissions due to peat cultivation or restoration. This is of<br />
paramount importance <strong>in</strong> Southeast Asia where peat land area accounts for 57% of total tropical peat area,<br />
i.e. 10-14% of global peat carbon pool, mostly located <strong>in</strong> Indonesia and Malaysia (Page <strong>et</strong> al., 2011).<br />
Integrat<strong>in</strong>g the spatial and temporal dimensions of the palm perennial crop cycle with<strong>in</strong> a snapshot assessment<br />
is not immediate. In PalmGHG, this difficulty is somehow by-passed by embrac<strong>in</strong>g data from several<br />
plantations units from mill’s own crop and out-growers at several ages. Despite large considered areas,<br />
ages of oil palms may however not be evenly distributed <strong>in</strong>duc<strong>in</strong>g some bias by displac<strong>in</strong>g age distribution.<br />
In particular, plantation with short turn-over may displace the distribution towards young palm trees that<br />
sequester carbon more quickly.<br />
Across the published studies, the relative importance of the diverse contributors is <strong>in</strong> agreement. Land<br />
clear<strong>in</strong>g is the most important contributor tog<strong>et</strong>her with peat emissions (Germer and Sauerborn, 2008; Reijnders<br />
and Huijbregts, 2008; Wicke <strong>et</strong> al., 2008). Some studies that do not directly address this issue still<br />
mention the primary importance of this contributor (Yusoff <strong>et</strong> Hansen, 2007; Pleanjai <strong>et</strong> al., 2009; Stichnothe<br />
<strong>et</strong> Schuchardt, 2011). In all studies also CH4 from POME emissions and fertiliser production and use are<br />
important contributors (Choo <strong>et</strong> al., 2011; Pleanjai <strong>et</strong> al., 2009; Siangjaeo <strong>et</strong> al., 2011), although their relative<br />
total importance depends on wh<strong>et</strong>her land use change and peat emissions are <strong>in</strong>cluded or not. As shown <strong>in</strong><br />
PalmGHG scenario test<strong>in</strong>g, it is often emphasised that CH4 capture can allow for significant GHG reductions,<br />
b<strong>et</strong>ween 30 to 50% (Vijaya <strong>et</strong> al., 2008; Chuchuoy <strong>et</strong> al., 2009).A wide range of studies focused on<br />
treatment and uses of residues and co-products (Yacob <strong>et</strong> al., 2005; Chavalparit <strong>et</strong> al., 2006; Vijaya <strong>et</strong> al.,<br />
2008; Stichnothe <strong>et</strong> Schuchardt, 2011). However, emphasis should be put on the high costs and limited options<br />
<strong>in</strong> the field to actually implement the technologies to harness the best benefits from residues, notably<br />
when grid connection is not possible. Such technologies can be implemented through clean development<br />
mechanisms provided that attention is paid to avoid double-count<strong>in</strong>g of GHG sav<strong>in</strong>gs, such as credits for<br />
coal substitution by shells both at the palm oil mill and cement factory for <strong>in</strong>stance. Moreover, research effort<br />
is also needed notably to b<strong>et</strong>ter assess fertilis<strong>in</strong>g efficiency of land filled residues and environmental<br />
emissions of down-stream processes related to residues treatment and transport.<br />
The GHG balance only is one potential impact on the environment. PalmGHG is a very useful tool that<br />
can help demonstrate potentials for GHG sav<strong>in</strong>gs at the plantation and mill levels. Tog<strong>et</strong>her with the other<br />
RSPO P&Cs that def<strong>in</strong>e a broader view for susta<strong>in</strong>ability criteria, it can help improve oil palm production<br />
towards susta<strong>in</strong>ability. However, more compl<strong>et</strong>e <strong>LCA</strong> must also be considered to quantify other impacts<br />
such as eutrophication or toxicities for <strong>in</strong>stance. In this case, other stages of palm oil production might also<br />
play an important role such as pesticides for ecosystem toxicity or boiler emissions for human toxicity<br />
(Schmidt, 2007; Choo <strong>et</strong> al., 2011; Bessou <strong>et</strong> al., <strong>2012</strong>). Compared to other veg<strong>et</strong>able oils, palm oil usually<br />
performs b<strong>et</strong>ter due to high yields (5-17 t CO2e/t Rapeseed oil In Schmidt, 2007; 39-88 g CO2e/MJ Palm<br />
M<strong>et</strong>hyl Ester compared to 62 and 124-159 g CO2e/MJ of Rapeseed M<strong>et</strong>hyl Ester and Jatropha M<strong>et</strong>hyl Ester;<br />
respectively In Thamsiriroj and Murphy, 2009; Achten <strong>et</strong> al., 2010a,b), but comparison on a unique criterion<br />
may <strong>in</strong>duced trade-offs <strong>in</strong> environmental impacts. In particular, consideration of impacts on soil fertility and<br />
biodiversity is paramount. In this case, a more comprehensive <strong>LCA</strong> approach is needed, such as <strong>in</strong> Milà i<br />
Canals <strong>et</strong> al., (<strong>2012</strong>), to allow for a sound and harmonised comparison b<strong>et</strong>ween agricultural products consider<strong>in</strong>g<br />
land transformation and land occupation compared to restored veg<strong>et</strong>ation stands or other common reference<br />
land uses.<br />
502
PARALLEL SESSION 6A: TOOLS AND DATABASES 8 th Int. Conference on <strong>LCA</strong> <strong>in</strong> the<br />
Agri-<strong>Food</strong> Sector, 1-4 Oct <strong>2012</strong><br />
5. Conclusion<br />
PalmGHG is a comprehensive GHG calculator representative of the state of the art <strong>in</strong> terms of available<br />
data and <strong>in</strong>ternational m<strong>et</strong>hodologies for GHG account<strong>in</strong>g. Emphasis has been placed on <strong>in</strong>formation directly<br />
relevant to palm oil production that should be easily available at the mill level. However, default data are<br />
also provided for data which might not be available. Flexibility is also an important feature of PalmGHG,<br />
with options that allow for alternative calculations and m<strong>et</strong>hodology; the ma<strong>in</strong> example be<strong>in</strong>g assessment of<br />
n<strong>et</strong> emissions per MJ for palm oil biodiesel.<br />
Dur<strong>in</strong>g pilot test<strong>in</strong>g it was shown that PalmGHG can identify GHG emission ‘hot spots’, and so help to<br />
def<strong>in</strong>e GHG reduction strategies. Feedback from the pilot companies highlighted problems <strong>in</strong> collect<strong>in</strong>g data,<br />
especially those for for three consequent years. It should however, be noted that difficulties related to data<br />
record<strong>in</strong>g should progressively dim<strong>in</strong>ish once the monitor<strong>in</strong>g of GHG emissions becomes rout<strong>in</strong>e. On the<br />
other hand, difficulties encountered when collect<strong>in</strong>g data for out-growers are not so easily resolved and <strong>in</strong>dicate<br />
a need for a specific strategy to help out-growers record and collect data on a rout<strong>in</strong>e basis.<br />
The results of the pilot and scenario test<strong>in</strong>g provided an important <strong>in</strong>formation basis to design some of the<br />
recommendations to RSPO EB and communicate to a large audience on the work of RSPO GHG WG and<br />
the use of PalmGHG. Further recommendations of the GHG WG to RSPO EB refer e.g. to the characteristics<br />
that should be m<strong>et</strong> by new plantations <strong>in</strong> order to ensure low GHG emissions.<br />
Further modifications to PalmGHG are still be<strong>in</strong>g made, notably to amend default values. Moreover,<br />
PalmGHG needs reprogramm<strong>in</strong>g to make it more user-friendly. The current spreadshe<strong>et</strong> is rather complex<br />
and not easy to follow. Software would allow users to quickly generate results, but at the same time provide<br />
means to readily change default param<strong>et</strong>ers and undertake tests of alternative scenarios.<br />
6. Acknowledgements<br />
The authors are very grateful to all who participated <strong>in</strong> the second RSPO GHG WG for their contributions<br />
and to the companies who took part <strong>in</strong> the pilot phase. We are also grateful to members of the RSPO EB for<br />
their cont<strong>in</strong>u<strong>in</strong>g support; particular thanks are due to Dr Simon Lord for propos<strong>in</strong>g the adoption of the<br />
GWAPP model and to Dr Timothy Killeen for guid<strong>in</strong>g the development of PalmGHG.<br />
7. References<br />
Achten, W. M. J., Almeida, J., Fobel<strong>et</strong>s, V., Bolle, E., Mathijs, E., S<strong>in</strong>gh, V. P., Tewari, D. N., Verchot, L. V., Muys, B., 2010a. Life<br />
cycle assessment of Jatropha biodiesel as transportation fuel <strong>in</strong> rural India. Appl. Energ. 87, (12) 3652-3660.<br />
Achten, W. M. J., Vandenbempt, P., Almeida, J., Mathijs, E., Muys, B., 2010b. Life Cycle Assessment of a Palm Oil System with<br />
Simultaneous Production of Biodiesel and Cook<strong>in</strong>g Oil <strong>in</strong> Cameroon. Environ. Sci. Technol. 44, (12) 4809-4815.<br />
Arvidsson, R., Persson, S., Fröl<strong>in</strong>g, M., Svanström, M., 2011. Life cycle assessment of hydrotreated veg<strong>et</strong>able oil from rape, oil palm<br />
and Jatropha. J. Cleaner Prod. 19, (2-3) 129-137.<br />
Bessou, C., Vélu, A., Caliman, J.P. <strong>2012</strong>. <strong>LCA</strong> of Palm Oil <strong>in</strong> Sumatra, Comparison of Cropp<strong>in</strong>g Systems. ICOPE Conference, 22-24<br />
February <strong>2012</strong>, Nusa Dua, Bali, Indonesia<br />
BioGrace, 2010. European Project on “Harmonised Calculations of Biofuel Greenhouse Gas Emissions <strong>in</strong> Europe”; Project coord<strong>in</strong>ator:<br />
John Neeft - Agentschap NL (Agency NL) (formerly SenterNovem).<br />
http://www.biograce.n<strong>et</strong>./content/ghgcalculationtools/overview<br />
Chase, L.D.C. Henson, I.E., 2010. A d<strong>et</strong>ailed greenhouse gas budg<strong>et</strong> for palm oil production. Int. J. Agric. Susta<strong>in</strong>. 8(3), 199-214.<br />
Chavalparit, O., Rulkens, W. H., Mol, A. P. J., Khaodhair, S., 2006. Options for Environmental Susta<strong>in</strong>ability of the Crude Palm Oil<br />
Industry <strong>in</strong> Thailand through enhancement of Industrial Ecosystems. Environ. Dev. Susta<strong>in</strong>. 8, (2) 271-287.<br />
Choo, Y. M., Muhamad, H., Hashim, Z., Subramaniam, V., Puah, C. W., Tan, Y., 2011. D<strong>et</strong>erm<strong>in</strong>ation of GHG contributions by<br />
subsystems <strong>in</strong> the oil palm supply cha<strong>in</strong> us<strong>in</strong>g the <strong>LCA</strong> approach. Int. J. Life Cycle Assess. 16, 669-681.<br />
Chuchuoy, K., Paengjuntuek, W., Usubharatana, P., Phungrassami, H., 2009. Prelim<strong>in</strong>ary Study of Thailand Carbon Reduction Label:<br />
A Case Study of Crude Palm Oil Production. Eur. J. Sci. Res. 34, (2) 252–259.<br />
Environment Agency, 2002. Guidance on Landfill Gas Flar<strong>in</strong>g. Bristol: Environment Agency.<br />
European Commission, 2009. Directive 2009/28/EC of the European parliament and of the council of 23 April 2009 on the promotion<br />
of the use of energy from renewable sources. Official Journal of the European Union, June 5th<br />
Germer, J., Sauerborn, J., 2008. Estimation of the impact of oil palm plantation establishment on greenhouse gas balance. Environ.<br />
Dev. Susta<strong>in</strong>. 10, (6) 697-716.<br />
Gurmit S., 1995. Management and utilisation of oil palm by-products. The Planter. (71), 361-386.<br />
Henson I.E., 2005. OPRODSIM, a versatile, mechanistic simulation model of oil palm dry matter production and yield. In: Proceed<strong>in</strong>gs<br />
of PIPOC 2005 International Palm Oil Congress, Agriculture, Biotechnology and Susta<strong>in</strong>ability Conference, 801-832. Kuala<br />
Lumpur: Malaysian Palm Oil Board.<br />
Henson I.E., 2009. Modell<strong>in</strong>g carbon sequestration and greenhouse gas emissions associated with oil palm cultivation and land-use<br />
change <strong>in</strong> Malaysia. A re-evaluation and a computer model. MPOB Technology, 31, 116 pp.<br />
IPCC, 2006. Guidel<strong>in</strong>es for National Greenhouse Gas Inventories. Vol 4 Agriculture, Forestry and Other Land Use. WMO/UNEP.<br />
http://www.ipcc-nggip.iges.or.jp/public/2006gl/<strong>in</strong>dex.html.<br />
IPCC, 2007. Fourth Assessment Report. Climate Change 2007 - Synthesis Report. WMO/UNEP. http://www.ipcc.ch/ipccreports/ar4syr.htm.<br />
503
PARALLEL SESSION 6A: TOOLS AND DATABASES 8 th Int. Conference on <strong>LCA</strong> <strong>in</strong> the<br />
Agri-<strong>Food</strong> Sector, 1-4 Oct <strong>2012</strong><br />
JEC, 2007. Well-to-wheels analysis of future automotive fuels and powertra<strong>in</strong>s <strong>in</strong> the European context. Well-to-tank Report Version<br />
2c, Appendix 1 and 2. JRC, EUCAR, CONCAWE. http://ies.jrc.ec.europa.eu/WTW.<br />
Milà i Canals, L., Rigarlsford, G., Sim, S., <strong>2012</strong>. Land use impact assessment of margar<strong>in</strong>e. Int. J. Life Cycle Assess.<br />
Omont H., 2010. Contributions de la production d'huile de palme au développement durable. Problématique générale, controverses.<br />
Ol. Corps Gras Li. 17 (6), 362-367.<br />
Page, S., Rieley, J. O., Banks, C. J., 2011. Global and regional importance of the tropical peatland carbon pool. Global Change Biology<br />
17, (2) 798-818.<br />
Pleanjai, S., Gheewala, S. H., Garivait, S., 2009. Greenhouse gas emissions from the production and use of palm m<strong>et</strong>hyl ester <strong>in</strong><br />
Thailand. Int. J. Glob. Warm<strong>in</strong>g. 1, (4) 418–431.<br />
Reijnders, L., Huijbregts, M. A. J., 2008. Palm oil and the emission of carbon-based greenhouse gases. J. Cleaner Prod. 16, (4) 477-<br />
482.<br />
RFA (2008) Carbon and Susta<strong>in</strong>ability Report<strong>in</strong>g With<strong>in</strong> the Renewable Transport Fuel Obligation. Technical Guidance Part 2 Carbon<br />
Report<strong>in</strong>g – Default Values and Fuel Cha<strong>in</strong>s. London: Renewable Fuels Agency.<br />
http://www.renewablefuelsagency.org/_db/_documents/RFA_ C&S_ Technical_Guidance_Part _2 _v1_200809194658.pdf<br />
RSPO, 2011. updated data on the webpage, visited on 10/02/<strong>2012</strong>: www.rspo.org<br />
Siangjaeo, S., Gheewala, S. H., Unnanon, K., Chidthaisong, A., 2011. Implications of land use change on the life cycle greenhouse<br />
gas emissions from palm biodiesel production <strong>in</strong> Thailand. Energ. Sust. Dev. 15, (1) 1-7.<br />
Stichnothe, H., Schuchardt, F., 2011. Life cycle assessment of two palm oil production systems. Biomass Bioenerg. 35, (9) 3976-<br />
3984.<br />
Thamsiriroj, T., Murphy, J. D., 2009. Is it b<strong>et</strong>ter to import palm oil from Thailand to produce biodiesel <strong>in</strong> Ireland than to produce<br />
biodiesel from <strong>in</strong>digenous Irish rape seed? Appl. Energ. 86, (5) 595-604.<br />
USDA, 2011. USDA report of Feb. 2011<br />
Vijaya, S., Ma, A. N., Choo, Y. M. <strong>et</strong> Nik, M. N. S., 2008. Life cycle <strong>in</strong>ventory of the production of crude palm oil - A gate to gate<br />
case study of 12 palm oil mills. J. Oil Palm Research. 20, 484-494.<br />
W<strong>et</strong>lands International, 2010. A quick scan of peatlands <strong>in</strong> Malaysia. W<strong>et</strong>lands International-Malaysia: P<strong>et</strong>al<strong>in</strong>g Jaya, Malaysia. 74<br />
pp.<br />
Wicke, B., Dornburg, V., Jung<strong>in</strong>ger, M., Faaij, A., 2008. Different palm oil production systems for energy purposes and their greenhouse<br />
gas implications. Biomass Bioenerg. 32, (12) 1322-1337.<br />
Yacob, S., Hassan, M. A., Shirai, Y., Wakisaka, M., Subash, S., 2005. Basel<strong>in</strong>e study of m<strong>et</strong>hane emission from open digest<strong>in</strong>g tanks<br />
of palm oil mill effluent treatment. Chemosphere 59. (11) 1575-1581.<br />
Yusoff, S. <strong>et</strong> Hansen, S., 2007. Feasibility Study of Perform<strong>in</strong>g a Life Cycle Assessment on Crude Palm Oil Production <strong>in</strong> Malaysia<br />
(9 pp). Int. J. Life Cycle Assess. 12, (1) 50-58.<br />
504
PARALLEL SESSION 6B: FISHIERIES, SOIL, AND EMERGY METHODS 8 th Int. Conference on <strong>LCA</strong> <strong>in</strong> the<br />
Agri-<strong>Food</strong> Sector, 1-4 Oct <strong>2012</strong><br />
Review and future perspectives <strong>in</strong> the environmental assessment of<br />
seafood production systems<br />
Parallel session 6b: Fishieries, Soil, and Emergy M<strong>et</strong>hods<br />
Ian Vázquez-Rowe 1,2,* , Almudena Hospido 1 , María Teresa Moreira 1 , Gumers<strong>in</strong>do Feijoo 1<br />
1 Department of Chemical Eng<strong>in</strong>eer<strong>in</strong>g, School of Eng<strong>in</strong>eer<strong>in</strong>g, University of Santiago de Compostela. 15782 – Santiago de Compos-<br />
tela, Spa<strong>in</strong>.<br />
2 CRP Henri Tudor/CRTE, 66 rue de Luxembourg, Esch-sur-Alz<strong>et</strong>te, Luxembourg (current adress).<br />
Correspond<strong>in</strong>g author. E-mail: ian.vazquez@tudor.lu<br />
ABSTRACT<br />
A s<strong>et</strong> of 29 published articles or reports were analysed with the aim of d<strong>et</strong>erm<strong>in</strong><strong>in</strong>g current trends <strong>in</strong> the use of Life Cycle Assessment<br />
(<strong>LCA</strong>) <strong>in</strong> the fish<strong>in</strong>g sector <strong>in</strong> terms of novel m<strong>et</strong>hodological <strong>in</strong>novations and the treatment of assumptions when elaborat<strong>in</strong>g<br />
<strong>LCA</strong>s l<strong>in</strong>ked to this production sector. Results showed an <strong>in</strong>creas<strong>in</strong>g use of <strong>LCA</strong>s <strong>in</strong> the seafood sector <strong>in</strong> recent years, but variable<br />
levels of m<strong>et</strong>hodological development. Based on the evaluation, a simple guidel<strong>in</strong>e to s<strong>et</strong> common denom<strong>in</strong>ators <strong>in</strong> future <strong>LCA</strong><br />
studies are proposed <strong>in</strong> terms of goal and scope, life cycle <strong>in</strong>ventory or impact category selection. F<strong>in</strong>ally, <strong>in</strong>novative issues that<br />
could turn <strong>LCA</strong> <strong>in</strong>to a more <strong>in</strong>tegrative m<strong>et</strong>hodology with<strong>in</strong> fish<strong>in</strong>g systems, <strong>in</strong> order to enhance its usefulness <strong>in</strong> policy support, are<br />
briefly discussed.<br />
Keywords: carbon footpr<strong>in</strong>t, fisheries, food systems, <strong>LCA</strong>, seafood<br />
1. Introduction<br />
Environmental impacts l<strong>in</strong>ked to seafood production systems have centred numerous studies <strong>in</strong> recent<br />
decades due to <strong>in</strong>creas<strong>in</strong>g fragility regard<strong>in</strong>g the state of world fisheries (Worm <strong>et</strong> al., 2009). In this context,<br />
Life Cycle Assessment (<strong>LCA</strong>) has arisen as a useful environmental management m<strong>et</strong>hodology, the only one<br />
that is standardized at an <strong>in</strong>ternational level, to quantify resource use and emissions <strong>in</strong> a broad s<strong>et</strong> of primary<br />
and <strong>in</strong>dustrial sectors, <strong>in</strong>clud<strong>in</strong>g seafood extraction (fish<strong>in</strong>g) or production (aquaculture) and their associated<br />
<strong>in</strong>dustrial processes (Pell<strong>et</strong>ier <strong>et</strong> al., 2007).<br />
Nevertheless, despite the usefulness of <strong>LCA</strong> <strong>in</strong> the fish<strong>in</strong>g sector, it still lacks the comprehensiveness required<br />
to evaluate certa<strong>in</strong> environmental impacts l<strong>in</strong>ked to fish<strong>in</strong>g systems, such as direct impacts on fish<strong>in</strong>g<br />
stocks (Pell<strong>et</strong>ier <strong>et</strong> al., 2007).<br />
Therefore, the ma<strong>in</strong> aim of this study is to analyse the milestones that have been developed <strong>in</strong> fisheries<br />
<strong>LCA</strong> <strong>in</strong> the last few years, compris<strong>in</strong>g discussion concern<strong>in</strong>g m<strong>et</strong>hodological developments, functional unit<br />
(FU) choice, impact category selection, allocation or life cycle <strong>in</strong>ventory (LCI). Moreover, based on the previous<br />
analysis, a simple and straightforward guidel<strong>in</strong>e is proposed to be used as a common denom<strong>in</strong>ator <strong>in</strong><br />
future <strong>LCA</strong> studies. F<strong>in</strong>ally, future perspectives regard<strong>in</strong>g m<strong>et</strong>hodological <strong>in</strong>novations <strong>in</strong> <strong>LCA</strong> are discussed.<br />
2. M<strong>et</strong>hods<br />
A s<strong>et</strong> of 29 <strong>LCA</strong> and carbon footpr<strong>in</strong>t (CF) studies were obta<strong>in</strong>ed from scientific journals, scientific reports,<br />
and chapters from books or contributions to congresses. The selected publications were divided <strong>in</strong>to<br />
the follow<strong>in</strong>g subdivisions: (i) fishery <strong>LCA</strong> studies; (ii) seafood process<strong>in</strong>g <strong>LCA</strong> studies; (iii) food meal<br />
<strong>LCA</strong>s that <strong>in</strong>clude products of mar<strong>in</strong>e orig<strong>in</strong>; and (iv) seafood carbon footpr<strong>in</strong>t (CF) studies. For more <strong>in</strong>formation<br />
on the particular studies revised please check Vazquez <strong>et</strong> al., <strong>2012</strong>c.<br />
3. State-of-the-art of fishery <strong>LCA</strong> studies<br />
3.1. Worldwide fishery <strong>LCA</strong> studies<br />
These studies constitute the largest, h<strong>et</strong>erogeneous and prolific group of case studies <strong>in</strong>cluded <strong>in</strong> this review.<br />
In contrast with pioneer<strong>in</strong>g studies <strong>in</strong> Scand<strong>in</strong>avian countries, ma<strong>in</strong>ly for cod fisheries (Eyjolfsdottir <strong>et</strong><br />
al., 2003; Ziegler <strong>et</strong> al., 2003), recent studies show deep diversification of evaluated species, gears and fisheries.<br />
However, most studies are still concentrated <strong>in</strong> fish<strong>in</strong>g fle<strong>et</strong>s belong<strong>in</strong>g to <strong>in</strong>dustrialised nations with<br />
important seafood land<strong>in</strong>gs, such as Norway, Spa<strong>in</strong> or Canada.<br />
Concern<strong>in</strong>g fish<strong>in</strong>g gears, studies relat<strong>in</strong>g to trawls and purse se<strong>in</strong>es have cont<strong>in</strong>ued to be performed<br />
(Ramos <strong>et</strong> al., 2011; Ziegler <strong>et</strong> al., 2011), but novel gears such as long l<strong>in</strong>es(Svanes <strong>et</strong> al., 2011a; Vázquez-<br />
Rowe <strong>et</strong> al., 2011) and creels have also been analysed from a life cycle perspective. Artisanal fle<strong>et</strong>s and<br />
gears, however, despite their relevance on a global scale due to the number of vessels and workers <strong>in</strong>volved<br />
<strong>in</strong> the subsector, have rarely been exam<strong>in</strong>ed (Ziegler <strong>et</strong> al., 2011).<br />
505
PARALLEL SESSION 6B: FISHIERIES, SOIL, AND EMERGY METHODS 8 th Int. Conference on <strong>LCA</strong> <strong>in</strong> the<br />
Agri-<strong>Food</strong> Sector, 1-4 Oct <strong>2012</strong><br />
F<strong>in</strong>ally, species analysis has also seen proliferation <strong>in</strong> recent years, s<strong>in</strong>ce small pelagic fish, such as<br />
mackerel or pilchard (Ramos <strong>et</strong> al., 2011a; Vázquez-Rowe <strong>et</strong> al., 2010b), crustaceans, such as shrimps or<br />
lobster (Ziegler and Valent<strong>in</strong>sson, 2008; Ziegler <strong>et</strong> al., 2011), cephalopods (Vázquez-Rowe <strong>et</strong> al., <strong>2012</strong>a) or<br />
gadoids other than cod, such as hake or pollock (Sund, 2009; Vázquez-Rowe <strong>et</strong> al., 2011), have been evaluated<br />
us<strong>in</strong>g <strong>LCA</strong> m<strong>et</strong>hodology.<br />
3.2. Seafood process<strong>in</strong>g<br />
There is a limited number of research articles l<strong>in</strong>ked to this phase of the life cycle of seafood products.<br />
Moreover, the degree of complexity of f<strong>in</strong>al products, as consumed <strong>in</strong> households can be very varied. Consequently,<br />
based on these two issues, available studies can be still considered pioneer<strong>in</strong>g projects. In the first<br />
place, fresh fish consumption supply cha<strong>in</strong>s have been assessed by Vázquez-Rowe <strong>et</strong> al., (2011), show<strong>in</strong>g the<br />
low relative impacts of the on land phases. Secondly, frozen seafood products were <strong>in</strong>itially exam<strong>in</strong>ed for<br />
Danish seafood products (cod, shrimps…), but recent studies also <strong>in</strong>clude analysis of frozen cod <strong>in</strong> Scand<strong>in</strong>avian<br />
countries and Canada (Fulton, 2010; Ziegler <strong>et</strong> al., 2003) and frozen cephalopods (Vázquez-Rowe <strong>et</strong><br />
al., <strong>2012</strong>a). Thirdly, the cann<strong>in</strong>g <strong>in</strong>dustry l<strong>in</strong>ked to the seafood sector has been assessed by Hospido <strong>et</strong> al.,<br />
(2006), which highlighted the high energy demand of the cann<strong>in</strong>g factory, as well as the elevated environmental<br />
burdens l<strong>in</strong>ked to t<strong>in</strong>plate transport and production. F<strong>in</strong>ally, the elaboration of complex multi<strong>in</strong>gredient<br />
breaded seafood products has been assessed by Thrane (2004) and Fikseaun<strong>et</strong> (2007). These two<br />
studies noted the importance of catch<strong>in</strong>g low energy-<strong>in</strong>tensive fish and on optimiz<strong>in</strong>g the fish content of<br />
these products <strong>in</strong> order to lower their environmental burdens.<br />
3.3. <strong>Food</strong> meal <strong>LCA</strong>s<br />
Despite of the reduced number of seafood <strong>LCA</strong> studies currently available <strong>in</strong> the literature, a s<strong>et</strong> of publications<br />
deal<strong>in</strong>g with the environmental impacts of di<strong>et</strong>s and meals have recently <strong>in</strong>cluded seafood products<br />
arriv<strong>in</strong>g from capture fisheries. In the first place, Muñoz <strong>et</strong> al., (2010), when analys<strong>in</strong>g the environmental<br />
profile of the average Spanish di<strong>et</strong>, <strong>in</strong>cluded available seafood products that were at the time <strong>in</strong> the literature.<br />
Nilsson and Sonesson (2010), <strong>in</strong> a study of similar characteristics for the Swedish di<strong>et</strong>, d<strong>et</strong>ected that 0.17<br />
million tonnes of CO2eq./year would be avoided if Swedes were to consume 14% fish, that is, the recommended<br />
annual amount. F<strong>in</strong>ally, other studies, such as Zufía and Arana (2008) and Esp<strong>in</strong>osa-Orias and Azapagic<br />
(2010) performed specific environmental impact studies of different specific meals.<br />
3.4. Carbon footpr<strong>in</strong>t<strong>in</strong>g<br />
The use of CF m<strong>et</strong>hodology <strong>in</strong> fisheries <strong>LCA</strong> was developed <strong>in</strong>itially by W<strong>in</strong>ther <strong>et</strong> al., (2009), through<br />
the analysis of 14 different iconic Norwegian seafood products that are exported to other nations. Iribarren <strong>et</strong><br />
al., (2010; 2011) evaluated the CF of the Galician fish<strong>in</strong>g sector, provid<strong>in</strong>g extraction CF values for over 50<br />
commonly landed fish species. While the former used mass allocation to report the results; the Galician study<br />
selected an economic perspective follow<strong>in</strong>g the PAS2050 specifications. The relevance of these CF studies,<br />
however, must be understood <strong>in</strong> a wide framework, <strong>in</strong> which GHG emissions may not constitute the ma<strong>in</strong><br />
environmental burden. Nevertheless, the use of CF as a s<strong>in</strong>gle <strong>in</strong>dicator to reach consumers and stakeholders<br />
has already been proved <strong>in</strong> other production sectors. F<strong>in</strong>ally, it is important to highlight the fact that certa<strong>in</strong><br />
fishery management decisions have been proved to cause important changes <strong>in</strong> terms of GHG emissions <strong>in</strong><br />
fisheries (Driscoll and Tyedmers, 2010).<br />
4. Key m<strong>et</strong>hodological issues <strong>in</strong> fisheries <strong>LCA</strong>s<br />
An overwhelm<strong>in</strong>g majority of the evaluated publications assume the general ISO guidel<strong>in</strong>es to compute<br />
<strong>LCA</strong> <strong>in</strong> fisheries and food products (ISO, 2006). Nevertheless, important differences regard<strong>in</strong>g the <strong>LCA</strong><br />
approach can be seen depend<strong>in</strong>g on the nature of the analysed fisheries or the consumption of seafood trends<br />
b<strong>et</strong>ween nations.<br />
4.1. M<strong>et</strong>hodological assumptions <strong>in</strong> <strong>LCA</strong><br />
A wide range of variance can be seen when assess<strong>in</strong>g fishery and seafood case studies, depend<strong>in</strong>g on the<br />
assumptions that are taken <strong>in</strong>to consideration:<br />
506
PARALLEL SESSION 6B: FISHIERIES, SOIL, AND EMERGY METHODS 8 th Int. Conference on <strong>LCA</strong> <strong>in</strong> the<br />
Agri-<strong>Food</strong> Sector, 1-4 Oct <strong>2012</strong><br />
Attributional or consequential <strong>LCA</strong> perspective. All, but one of the assessed studies have adopted a<br />
descriptive, and therefore, current state-of-the-art approach, us<strong>in</strong>g the attributional perspective. The<br />
use of consequential assessment by Thrane (2004) was aimed to d<strong>et</strong>ect the environmental changes<br />
l<strong>in</strong>ked to certa<strong>in</strong> predicted decisions. While the m<strong>in</strong>imal use of consequential <strong>LCA</strong> <strong>in</strong> fish<strong>in</strong>g systems<br />
may be l<strong>in</strong>ked to the lack of data availability regard<strong>in</strong>g marg<strong>in</strong>al production systems, its use comb<strong>in</strong>ed<br />
with stock prediction techniques may constitute an important milestone <strong>in</strong> policy mak<strong>in</strong>g.<br />
Functional unit and system boundaries. The selection of the functional unit (FU) shows great differences<br />
b<strong>et</strong>ween studies, suggest<strong>in</strong>g that the nature of the project is the ma<strong>in</strong> factor that <strong>in</strong>fluences the<br />
reference unit. Nevertheless, two different tendencies were observed. On the one hand, those studies<br />
that limited their system boundaries to the fish<strong>in</strong>g stage used FUs that refer to bulk land<strong>in</strong>gs at port<br />
(Hospido and Tyedmers, 2005) or <strong>in</strong>termediate supply cha<strong>in</strong> packag<strong>in</strong>g units (Ziegler <strong>et</strong> al., 2011).<br />
On the other hand, studies that focused on the entire supply cha<strong>in</strong> presented highly specific FUs,<br />
l<strong>in</strong>ked to f<strong>in</strong>al package presentations (Zufía and Arana, 2008) or to standard consumption portions<br />
(Vázquez-Rowe <strong>et</strong> al., 2011).<br />
Allocation procedure. Allocation constitutes a key feature <strong>in</strong> fisheries <strong>LCA</strong>, affect<strong>in</strong>g ma<strong>in</strong>ly the<br />
fish<strong>in</strong>g stage due to the multispecies characteristics of many fisheries. Furthermore, debate around<br />
allocation has gradually <strong>in</strong>creased given its strong <strong>in</strong>fluence on f<strong>in</strong>al results (Pell<strong>et</strong>ier and Tyedmers,<br />
2011). Despite the extended use of either mass or economic allocation <strong>in</strong> the majority of evaluated<br />
studies, recent studies show <strong>in</strong>creas<strong>in</strong>gly critical visions regard<strong>in</strong>g these two options. For <strong>in</strong>stance,<br />
several studies have shown their disagreement with the fact that us<strong>in</strong>g an economic allocation creates<br />
a situation <strong>in</strong> which low value species show reduced environmental burdens with respect to other<br />
species <strong>in</strong> a unique biophysical system (Pell<strong>et</strong>ier and Tyedmers, 2011). As a result, some recent studies<br />
propose new allocation perspectives, such as energy content (Svanes <strong>et</strong> al., 2011b). Nevertheless,<br />
the use of multiple allocation approaches <strong>in</strong> different studies may lead to atomisation; therefore, the<br />
need for well-discussed allocation explanations is needed to guarantee reproducibility and transparency<br />
(Ayer <strong>et</strong> al., 2007).<br />
Assessment m<strong>et</strong>hods and impact categories selection. The greater proportion of evaluated case studies<br />
used the CML Basel<strong>in</strong>e 2000 assessment m<strong>et</strong>hod (Frischknecht <strong>et</strong> al., 2007), constitut<strong>in</strong>g a midpo<strong>in</strong>t<br />
approach to the results. Concern<strong>in</strong>g the selection of impact categories, an <strong>in</strong>crease <strong>in</strong> the number<br />
of utilised categories has been identified, <strong>in</strong>clud<strong>in</strong>g ozone layer depl<strong>et</strong>ion or toxicity categories<br />
and newly developed fishery-specific categories (non-standardized).<br />
Result <strong>in</strong>terpr<strong>et</strong>ation. The majority of the publications evaluated limit the result report<strong>in</strong>g to the <strong>in</strong>ventory<br />
data and the characterisation phase (Sund, 2009; Vázquez-Rowe <strong>et</strong> al., <strong>2012</strong>a; Ziegler <strong>et</strong> al.,<br />
2011). Regard<strong>in</strong>g sensitivity analysis, its use has not been an extended practice <strong>in</strong> most publications.<br />
4.2. M<strong>et</strong>hodological advances<br />
A selection of outstand<strong>in</strong>g m<strong>et</strong>hodological <strong>in</strong>novations <strong>in</strong> the field of fisheries <strong>LCA</strong> is listed below:<br />
New impact categories. Innovations regard<strong>in</strong>g the <strong>in</strong>troduction of novel fishery-specific impact categories<br />
have been limited. More specifically, three different biological issues l<strong>in</strong>ked to fisheries have<br />
been developed. In the first place, the computation of seafloor damage was <strong>in</strong>corporated by Ziegler<br />
<strong>et</strong> al., (2003) and has ga<strong>in</strong>ed acceptance ever s<strong>in</strong>ce. Secondly, the calculation of n<strong>et</strong> primary productivity<br />
<strong>in</strong> <strong>LCA</strong> studies was <strong>in</strong>troduced <strong>in</strong> aquaculture studies. However, recent studies have <strong>in</strong>troduced<br />
the so called biotic resource use (BRU) <strong>in</strong>dicator (Fulton, 2010; Parker, 2011). F<strong>in</strong>ally, discards,<br />
which were <strong>in</strong>itially <strong>in</strong>cluded <strong>in</strong> terms of total mass discarded per FU have recently been computed<br />
<strong>in</strong> a global discard <strong>in</strong>dex – GDI (Vázquez-Rowe <strong>et</strong> al., <strong>2012</strong>b).<br />
<strong>LCA</strong>+DEA. The jo<strong>in</strong>t use of <strong>LCA</strong> with data envelopment analysis (DEA), as proposed by Vázquez-<br />
Rowe <strong>et</strong> al., (2010a) aims at reduc<strong>in</strong>g the effect of <strong>in</strong>creased standard deviations, as well as provid<strong>in</strong>g<br />
additional <strong>in</strong>formation for result <strong>in</strong>terpr<strong>et</strong>ation. Moreover, the ma<strong>in</strong> <strong>in</strong>novative issue l<strong>in</strong>ked to the<br />
<strong>LCA</strong>+DEA m<strong>et</strong>hod is the <strong>in</strong>clusion of an operational dimension <strong>in</strong> environmental management. In<br />
fact, <strong>LCA</strong>+DEA was computed for a s<strong>et</strong> of different fish<strong>in</strong>g fle<strong>et</strong>s to quantify the environmental burdens<br />
concern<strong>in</strong>g operational <strong>in</strong>efficiency <strong>in</strong> order to def<strong>in</strong>e targ<strong>et</strong> performance values for <strong>in</strong>efficient<br />
vessels.<br />
507
PARALLEL SESSION 6B: FISHIERIES, SOIL, AND EMERGY METHODS 8 th Int. Conference on <strong>LCA</strong> <strong>in</strong> the<br />
Agri-<strong>Food</strong> Sector, 1-4 Oct <strong>2012</strong><br />
508<br />
Timel<strong>in</strong>e analysis. This approach <strong>in</strong> fishery <strong>LCA</strong> acknowledges the existence of strong fluctuations<br />
<strong>in</strong> the environmental burdens <strong>in</strong> pelagic fisheries. In fact, Ramos <strong>et</strong> al., (2011) proved the existence<br />
of sharp variations dur<strong>in</strong>g an 8-year period for the Cantabrian Atlantic mackerel fishery.<br />
5. Best practices <strong>in</strong> fish<strong>in</strong>g production systems<br />
A s<strong>et</strong> of common ground fundamentals can be seen found <strong>in</strong> fisheries <strong>LCA</strong>, regardless of the m<strong>et</strong>hodological<br />
and non-m<strong>et</strong>hodological assumption of each specific case study. Therefore, a best practices protocol<br />
is proposed <strong>in</strong> order to provide a basic <strong>in</strong>ventory guidel<strong>in</strong>e for future studies, as well as a mechanism to<br />
guarantee data compl<strong>et</strong>eness when assess<strong>in</strong>g fisheries, transparency and reproducibility. Nevertheless, the<br />
suggested protocol only analyses the fish extraction stage due to the complex supply cha<strong>in</strong>s exist<strong>in</strong>g once<br />
fish is landed, the varied process<strong>in</strong>g techniques that may be used or the limited amount of life cycle studies<br />
concern<strong>in</strong>g fish process<strong>in</strong>g.<br />
5.1. Recommendations for goal and scope<br />
Goal and scope decisions are highly dependent on the approach the authors selected based on the specific<br />
context of the study. However, it should be highlighted that when an allocation m<strong>et</strong>hod is needed, the <strong>in</strong>troduction<br />
of new biophysical allocation m<strong>et</strong>hods, other than mass allocation, may constitute <strong>in</strong>terest<strong>in</strong>g milestones<br />
<strong>in</strong> the near future (Pell<strong>et</strong>ier and Tyedmers, 2011).<br />
5.2. Recommendations for LCI<br />
In order to carry out the environmental assessment a given fishery, the follow<strong>in</strong>g life cycle <strong>in</strong>ventory<br />
(LCI) items, based on data r<strong>et</strong>rieved from the evaluated studies, should allow <strong>LCA</strong> practitioners to develop a<br />
comprehensive <strong>LCA</strong> study:<br />
Table 1. M<strong>in</strong>imum required <strong>in</strong>ventory items to perform an <strong>in</strong>tegrated <strong>LCA</strong> study for extractive fisheries.<br />
Item Characteristics<br />
Diesel production and consumption Further research on fuel breakdown needed to understand consumption patterns <strong>in</strong> vessels.<br />
Gear production and use More research should be put <strong>in</strong>to gear loss and ghost fish<strong>in</strong>g.<br />
Anti-foul<strong>in</strong>g and boat pa<strong>in</strong>t Future research should d<strong>et</strong>erm<strong>in</strong>e new sources of potential burdens <strong>in</strong> this subsystem.<br />
Cool<strong>in</strong>g agents Recently highlighted as an important source of ozone layer and climate change emissions.<br />
Ice production Deeper analysis l<strong>in</strong>ked to fuel use and ice production.<br />
On-board process<strong>in</strong>g Packag<strong>in</strong>g resources, offal waste and fuel use l<strong>in</strong>ked to process<strong>in</strong>g must be explored.<br />
Vessel construction To date, very simplistic approach. Shi dock system could be analysed <strong>in</strong> future studies.<br />
Seafloor damage Currently, based on land covered. Future perspectives: direct impact and quality.<br />
Bait Further analysis must be done concern<strong>in</strong>g the l<strong>in</strong>k b<strong>et</strong>ween fle<strong>et</strong>s regard<strong>in</strong>g bait.<br />
Captures and land<strong>in</strong>gs Comprehensive data regard<strong>in</strong>g catches, <strong>in</strong>clud<strong>in</strong>g the landed, discarded, offal and slipped<br />
fractions would help improve data quality.<br />
LIFE CYCLE<br />
INVENTORY (LCI)<br />
Operational <strong>in</strong>puts of the vessel<br />
Seafloor impacts<br />
Captures and land<strong>in</strong>gs<br />
On board process<strong>in</strong>g of seafood<br />
LIFE CYCLE INTERPRETATION:<br />
Characterization results <strong>in</strong>terpr<strong>et</strong>ation<br />
Sensitivity analysis for seafood products<br />
<strong>LCA</strong>+DEA analysis for multiple vessel fle<strong>et</strong>s<br />
GOAL AND SCOPE:<br />
Function of the product system<br />
Functional unit<br />
Global Warm<strong>in</strong>g Potential (GWP)<br />
Abiotic depl<strong>et</strong>ion potential (ADP)<br />
Acidification potential (AP)<br />
LIFE CYCLE IMPACT<br />
ASSESSMENT (LCIA)<br />
System boundaries<br />
Allocation: economic or biophysical<br />
Eutrophication potential (EP)<br />
Ozone layer depl<strong>et</strong>ion Potential (ODP) Mar<strong>in</strong>e ecotoxocity potential (METP)<br />
Biotic Resource Use (BRU)<br />
Global Discard Index (GDI) and other FSI<br />
Figure 1. M<strong>in</strong>imum requirements l<strong>in</strong>ked to <strong>LCA</strong> implementation <strong>in</strong> fish<strong>in</strong>g systems. Source: Vázquez-Rowe<br />
<strong>et</strong> al., <strong>2012</strong>c.
PARALLEL SESSION 6B: FISHIERIES, SOIL, AND EMERGY METHODS 8 th Int. Conference on <strong>LCA</strong> <strong>in</strong> the<br />
Agri-<strong>Food</strong> Sector, 1-4 Oct <strong>2012</strong><br />
5.3. Recommendations for LCIA<br />
The full use of the <strong>in</strong>ventory data items <strong>in</strong>cluded <strong>in</strong> Figure 1 permits a comprehensive assessment of all<br />
major impact categories used to date <strong>in</strong> the available bibliography. Nevertheless, it must be noted that <strong>in</strong><br />
recent years two different perspectives have developed <strong>in</strong> fisheries <strong>LCA</strong>: those publications that focus entirely<br />
on the report<strong>in</strong>g of the CF value of seafood and those that adopt an <strong>in</strong>tegrated perspective, comb<strong>in</strong><strong>in</strong>g<br />
the commonly used <strong>LCA</strong> impact categories <strong>in</strong> fisheries <strong>LCA</strong> with newly developed fishery-specific impact<br />
categories. In fact, certa<strong>in</strong> recommendations suggested by prior fishery <strong>LCA</strong> reviews (Pell<strong>et</strong>ier <strong>et</strong> al., 2007)<br />
have been accomplished, but others rema<strong>in</strong> largely unanswered. For <strong>in</strong>stance, the use of BRU, as recommended<br />
<strong>in</strong> this publication, has had a limited implementation, and the <strong>in</strong>troduction of new <strong>in</strong>dicators l<strong>in</strong>ked<br />
to the biological implications of fisheries has been discr<strong>et</strong>e. Moreover, to date no studies <strong>in</strong> the field of seafood<br />
<strong>LCA</strong> have contributed to the expansion of <strong>LCA</strong> to Life Cycle Susta<strong>in</strong>ability Assessment (LCSA), and<br />
only a small s<strong>et</strong> of studies has considered the <strong>in</strong>troduction of operational and economic dimension <strong>in</strong> comb<strong>in</strong>ation<br />
with other m<strong>et</strong>hodologies (Vázquez-Rowe <strong>et</strong> al., 2010a).<br />
Regard<strong>in</strong>g the selection of impact categories, these can be <strong>in</strong>cluded or removed from studies based on the<br />
<strong>in</strong>itial objectives of the study, without the need of perform<strong>in</strong>g any assumptions. Hence, Figure 1, <strong>in</strong> an attempt<br />
to <strong>in</strong>tegrate the different patterns observed <strong>in</strong> impact category selection, <strong>in</strong>cludes a series of recommended<br />
impact categories and <strong>in</strong>dicators that should be <strong>in</strong>cluded <strong>in</strong> fishery <strong>LCA</strong> studies, with the aim of<br />
guarantee<strong>in</strong>g quality and transparency <strong>in</strong> future studies, as well as creat<strong>in</strong>g some m<strong>in</strong>imum foundations for<br />
future development <strong>in</strong> this specific field.<br />
6. Conclusions<br />
The race to <strong>in</strong>clude fishery-specific impacts on the ecosystem <strong>in</strong> <strong>LCA</strong> has <strong>in</strong>volved a sharp <strong>in</strong>crease <strong>in</strong><br />
seafood <strong>LCA</strong> publications. However, the level of pioneer<strong>in</strong>g <strong>in</strong> this sector <strong>in</strong> terms of <strong>LCA</strong> still rema<strong>in</strong>s<br />
high, imped<strong>in</strong>g a clear analysis <strong>in</strong> terms of current trends. However, based on the <strong>in</strong>ventoried publications,<br />
the ma<strong>in</strong> highlights and developments <strong>in</strong> this field have been specified and discussed. F<strong>in</strong>ally, the implementation<br />
of the best practices suggested <strong>in</strong> this paper should help the def<strong>in</strong>ition of more concr<strong>et</strong>e developments<br />
<strong>in</strong> the field of fisheries <strong>LCA</strong> <strong>in</strong> the near future.<br />
7. References<br />
Ayer, N., Tyedmers, P., <strong>et</strong> al., 2007. Co-product allocation <strong>in</strong> life cycle assessments of seafood production systems: Review of problems<br />
and strategies. Int. J. Life Cycle Ass. 12, 480-487.<br />
Driscoll, J., Tyedmers, P., 2010. Fuel use and greenhouse gas emission implications of fisheries management: the case of the New<br />
England Atlantic herr<strong>in</strong>g fishery. Mar. Policy 34, 353-359.<br />
Esp<strong>in</strong>oza-Orias, N., Azapagic, A., 2010. Carbon footpr<strong>in</strong>t of school meals. VII International Conference on Life Cycle Assessment <strong>in</strong><br />
the agri-food sector. Bari, Italy, September 22 nd -24 th 2010.<br />
Eyjolfsdottir, H.R., Jonsdottir, H., <strong>et</strong> al., 2003. Environmental effects of fish on the consumers dish. Life cycle assessment of Icelandic<br />
frozen cod products. Icelandic Fisheries Laboratories. Report 06-03.<br />
Fikseaun<strong>et</strong>, T.K., 2007. Alternative fish f<strong>in</strong>ger production cha<strong>in</strong>s – life cycle analysis. Mar<strong>in</strong>e Systems M. Sc. Thesis, Norwegian<br />
University of Science and Technology.<br />
Frichknecht, R., Jungbluth, N., <strong>et</strong> al., 2007. Implementation of Life Cycle Impact Assessment M<strong>et</strong>hods: Data v2.0 eco<strong>in</strong>vent report<br />
No. 3. Swiss Centre for Life Cycle Inventories, Dübendorf, Switzerland.<br />
Fulton, S., 2010. Fish and fuel: life cycle greenhouse gas emissions associated with Icelandic cod., Alaskan pollock and Alaskan p<strong>in</strong>k<br />
salmon fill<strong>et</strong>s delivered to the UK. M. Sc. Thesis Dalhousie University.<br />
Hospido, A., Tyedmers, P., 2005. Life cycle environmental impacts of tuna fisheries. Fish. Res. 76, 174-186.<br />
Hospido, A., Vázquez, M.E., <strong>et</strong> al., 2006. Environmental assessment of canned tuna manufacture with a life-cycle perspective. Resour.<br />
Conserv. Recy. 47, 56-72.<br />
Iribarren, D., Vázquez-Rowe, I., <strong>et</strong> al., 2010. Estimation of the carbon footpr<strong>in</strong>t of the Galician fish<strong>in</strong>g activity (NW Spa<strong>in</strong>). Sci.<br />
Total Environ. 408, 5265-5272.<br />
Iribarren, D., Vázquez-Rowe, I., <strong>et</strong> al., 2011. Updat<strong>in</strong>g the carbon footpr<strong>in</strong>t of the Galician fish<strong>in</strong>g activity (NW Spa<strong>in</strong>). Sci Total<br />
Environ. 409, 1609-1611.<br />
ISO, 2006. ISO 14040. Environmental management – Life Cycle Assessment – Pr<strong>in</strong>ciples and Framework. International Organization<br />
for Standardization.<br />
Muñoz, I., Milá i Canals, Ll., <strong>et</strong> al., 2010. Life cycle assessment of the average Spanish di<strong>et</strong> <strong>in</strong>clud<strong>in</strong>g human excr<strong>et</strong>ion. Int. J. Life<br />
Cycle Ass. 15, 794-805.<br />
Nilsson, K., Sonesson, U., 2010. Chang<strong>in</strong>g di<strong>et</strong>s – What is the <strong>in</strong>fluence on greenhouse gas (GHG) emissions of different consumption<br />
patterns? VII International Conference on Life Cycle Assessment <strong>in</strong> the agri-food sector. Bari, Italy, September 22 nd -24 th<br />
2010.<br />
Parker, R., 2011. Measur<strong>in</strong>g and characteriz<strong>in</strong>g the ecological footpr<strong>in</strong>t and life cycle environmental costa of Antartic krill (Euphasia<br />
superba) products. M. Sc thesis, Dalhousie Univeristy.<br />
Pell<strong>et</strong>ier, N., Ayer, N., <strong>et</strong> al., 2007. Impact categories for Life Cycle Assessment research of seafood production systems: review and<br />
prospectus. Int. J. Life Cycle Ass. 12, 414-421.<br />
509
PARALLEL SESSION 6B: FISHIERIES, SOIL, AND EMERGY METHODS 8 th Int. Conference on <strong>LCA</strong> <strong>in</strong> the<br />
Agri-<strong>Food</strong> Sector, 1-4 Oct <strong>2012</strong><br />
Pell<strong>et</strong>ier, N., Tyedmers, P., 2011. An ecological critique of the use of mark<strong>et</strong> <strong>in</strong>formation <strong>in</strong> life cycle assessment research. J. Ind.<br />
Ecol. 14, 342-354.<br />
Ramos, S., Vázquez-Rowe, <strong>et</strong> al., 2011. Environmental assessment of the Atlantic mackerel (Scomber scombrus) season <strong>in</strong> the<br />
Basque Country. Increas<strong>in</strong>g the timel<strong>in</strong>e delimitation <strong>in</strong> fishery <strong>LCA</strong> studies. Int. J. Life Cycle Ass. 16, 599-610.<br />
Sund, V., 2009. Environmental assessment of Northeast arctic co (Gadus morhua) caught by long-l<strong>in</strong>es and Alaska pollock (Theragra<br />
chalcogramma) caught by pelagic trawls. Carbon footpr<strong>in</strong>t<strong>in</strong>g and analysis of biological susta<strong>in</strong>ability of two frozen seafood<br />
products<br />
Svanes, E., Vold, M., <strong>et</strong> al., 2011a. Environmental assessment of cod (Gadus morhua) from autol<strong>in</strong>e fisheries. Int. J. Life Cycle Ass.<br />
16, 611-624.<br />
Svanes, E., Vold, M., <strong>et</strong> al., 2011b. Effect of different allocation m<strong>et</strong>hods on <strong>LCA</strong> results of products from wild-caught fish and on<br />
the use of such results. Int. J. Life Cycle Ass. 16, 512-521.<br />
Thrane, M., 2004. Environmental impacts from Danish fish products. Hot spots<br />
Vázquez-Rowe, I., Iribarren, <strong>et</strong> al., 2010a. Comb<strong>in</strong>ed application of life cycle assessment and data envelopment analysis as a m<strong>et</strong>hodological<br />
approach for the assessment of fisheries. Int. J. Life Cycle Ass. 15, 272-283.<br />
Vázquez-Rowe, I., Moreira, M.T., <strong>et</strong> al., 2010b. Life cycle assessment of horse mackerel fisheries <strong>in</strong> Galicia (NW Spa<strong>in</strong>): Comparative<br />
analysis of two major fish<strong>in</strong>g m<strong>et</strong>hods. Fish. Res. 106, 517-527.<br />
Vázquez-Rowe, I., Moreira, M.T., <strong>et</strong> al., 2011. Life cycle assessment of fresh hake fill<strong>et</strong>s captured by the Galician fle<strong>et</strong> <strong>in</strong> the Northern<br />
Stock. Fish. Res. 110,128-135.<br />
Vázquez-Rowe, I., Moreira, M.T., <strong>2012</strong>a. Environmental assessment of frozen common octopus (Octopus vulgaris) captured by<br />
Spanish fish<strong>in</strong>g vessels <strong>in</strong> the Mauritanian EEZ. Mar. Policy 36, 180-188<br />
Vázquez-Rowe, I., Moreira, M.T., <strong>et</strong> al., <strong>2012</strong>b. Inclusion of discard assessment <strong>in</strong>dicators <strong>in</strong> fisheries <strong>LCA</strong> studies. Expand<strong>in</strong>g the<br />
use of fishery-specific impact categories. Int. J. Life Cycle Ass. 17, 535-549.<br />
Vázquez-Rowe, I., Hospido, A., <strong>et</strong> al., <strong>2012</strong>c. Review: Best practices <strong>in</strong> Life Cycle Assessment implementation <strong>in</strong> fisheries. Improv<strong>in</strong>g<br />
and broaden<strong>in</strong>g environmental assessment for seafood production systems Technol., doi= 10.1016/j.tifs.<strong>2012</strong>.07.003.<br />
W<strong>in</strong>ther, U., Ziegler, F., <strong>et</strong> al., 2009. Carbon footpr<strong>in</strong>t and energy use of Norwegian seafood products. SINTEF Fisheries and Aquaculture<br />
Report SFH80 A096068, Trondheim, Norway.<br />
Worm, B., Hilborn, R., <strong>et</strong> al., 2009. Rebuid<strong>in</strong>g global fisheries. Science 325, 578-585.<br />
Ziegler, F., Nilsson, P., <strong>et</strong> al., 2003. Life cycle assessment of frozen cod fill<strong>et</strong>s <strong>in</strong>clud<strong>in</strong>g fishery-specific environmental impacts. Int.<br />
J. Life Cycle Ass. 8, 39-47.<br />
Ziegler, F., Valent<strong>in</strong>sson, D., 2008. Environmental life cycle assessment of Norway lobster (Nephrops norvegicus) caught along the<br />
Swedish west coast by creels and conventional trawls – <strong>LCA</strong> m<strong>et</strong>hodology with case study. Int. J. Life Cycle Ass. 13, 487-497.<br />
Ziegler, F., Emanuelsson, A., <strong>et</strong> al., 2011. Extended life cycle assessment of Southern p<strong>in</strong>k shrimp products orig<strong>in</strong>at<strong>in</strong>g <strong>in</strong> Senegalese<br />
artisanal and <strong>in</strong>dustrial fisheries for export to Europe. J. Ind. Ecol. 15, 527-538.<br />
Zufía, J., Arana, L., 2008. Life cycle assessment to eco-design food products: <strong>in</strong>dustrial cooked dish case study. J. Clean. Prod. 16,<br />
1915-1921.<br />
510
PARALLEL SESSION 6B: FISHIERIES, SOIL, AND EMERGY METHODS 8 th Int. Conference on <strong>LCA</strong> <strong>in</strong> the<br />
Agri-<strong>Food</strong> Sector, 1-4 Oct <strong>2012</strong><br />
Overfish<strong>in</strong>g, overfishedness and wasted potential yield: new impact<br />
categories for biotic resources <strong>in</strong> <strong>LCA</strong><br />
Andreas Emanuelsson 1,2,* , Friederike Ziegler 1 , Leif Pihl 2 , Mattias Sköld 3 , Ulf Sonesson 1<br />
1SIK – The Swedish Institute for <strong>Food</strong> and Biotechnology, Department of Susta<strong>in</strong>able <strong>Food</strong> Production, 402<br />
29 Gothenburg, Sweden<br />
2University of Gothenburg, Department of Biological and Environmental Science, 451 78 Fiskebäckskil,<br />
Sweden<br />
3Swedish University of Agricultural Sciences, Department of Aquatic Resources, Institute of Mar<strong>in</strong>e Research<br />
453 30 Lysekil, Sweden<br />
Correspond<strong>in</strong>g author. E-mail: ae@sik.se<br />
ABSTRACT<br />
Overfish<strong>in</strong>g is one of the largest environmental challenges that mank<strong>in</strong>d face, s<strong>in</strong>ce it’s the largest driver for mar<strong>in</strong>e biodiversity loss<br />
on plan<strong>et</strong> that to two thirds consist of oceans and directly limits a biotic resource of high nutritional and cultural value. Y<strong>et</strong> it has not<br />
been directly <strong>in</strong>corporated <strong>in</strong> <strong>LCA</strong> m<strong>et</strong>hodology which restricts a holistic scope of any Seafood <strong>LCA</strong>. We propose Wasted Potential<br />
Yield as a midpo<strong>in</strong>t impact category to fill this gap, complemented with two sub impact categories expla<strong>in</strong><strong>in</strong>g the ma<strong>in</strong> contribut<strong>in</strong>g<br />
mechanisms: F-Overfish<strong>in</strong>g and B-Overfishedness. Characterisation m<strong>et</strong>hods relate to the Maximum Susta<strong>in</strong>able Yield concept that<br />
has been re<strong>in</strong>stated as a management goal for the European Union with full implantation deadl<strong>in</strong>e to 2015, after the ratification of<br />
Johannesburg Plan of Implementations and the United Nations Convention on the Law of the Sea. Characterisation factors were<br />
obta<strong>in</strong>ed for 43 European commercial stocks regard<strong>in</strong>g 13 species b<strong>et</strong>ween 2000-2010, which covered approximately half of European<br />
catches and 7% of the global catches, i.e. most of the commercially important stocks <strong>in</strong> the North East Atlantic. Due to typically<br />
high variation <strong>in</strong> fishery production system, we stress the need for both database aggregated characterisation factors and rout<strong>in</strong>es for<br />
cont<strong>in</strong>uous data collection by the <strong>LCA</strong> practitioner to m<strong>in</strong>imize spatial and temporal error of representativeness.<br />
Keywords: fisheries, impact assessment, seafood <strong>LCA</strong>, maximum susta<strong>in</strong>able yield, overfish<strong>in</strong>g<br />
1. Background<br />
Global mar<strong>in</strong>e fish catches have stabilised around 80 million tons per year dur<strong>in</strong>g the last decade (FAO<br />
<strong>2012</strong>), although the global effort spent to catch fish has steadily <strong>in</strong>creased s<strong>in</strong>ce the seventies (Anticamara <strong>et</strong><br />
al., 2011). Fish<strong>in</strong>g fle<strong>et</strong>s have expanded towards deeper and more remote fish<strong>in</strong>g locations (Swartz <strong>et</strong> al.,<br />
2010) and the marg<strong>in</strong>s of profitability have steadily decreased (FAO 2008). This has been widely <strong>in</strong>terpr<strong>et</strong>ed<br />
as the result of overfish<strong>in</strong>g fish stocks, that are spatially or temporally separated <strong>in</strong> their reproduction and<br />
depend on their own stock size and structure for and growth (Pauly <strong>et</strong> al., 2002; Myers and Worm 2003;<br />
Mullon <strong>et</strong> al., 2005; Worm <strong>et</strong> al., 2009; Froese and Proelß 2010; FAO <strong>2012</strong>). Contrary to earlier beliefs<br />
many fish stocks do not quickly recover when fish<strong>in</strong>g pressure decreased once depl<strong>et</strong>ed or degraded<br />
(Hutch<strong>in</strong>gs and Reynolds 2004). One of the reasons is that high fish<strong>in</strong>g pressure typically alters the age<br />
structure with<strong>in</strong> the stock leav<strong>in</strong>g younger <strong>in</strong>dividuals that are less efficient <strong>in</strong> reproduc<strong>in</strong>g (Jenn<strong>in</strong>gs <strong>et</strong> al.,<br />
2001). As fisheries exploit the top predators of the ecosystem, the entire ecosystem will be impacted by trophic<br />
cascade effects (Frank <strong>et</strong> al., 2005). Both coastal and offshore fish<strong>in</strong>g pressure has been shown to <strong>in</strong>duce<br />
trophical shifts, from which a restoration to previous state is unlikely even if fish<strong>in</strong>g pressure decreased<br />
(Scheffer <strong>et</strong> al., 2001; Jackson <strong>et</strong> al., 2001). The present ext<strong>in</strong>ction rate and loss of biodiversity has been<br />
considered the worst exceed<strong>in</strong>g of plan<strong>et</strong>ary boundaries by humans (Rockstrom <strong>et</strong> al., 2009) and the Millennium<br />
Ecosystem Assessment established overfish<strong>in</strong>g as the dom<strong>in</strong>ant direct driver for losses <strong>in</strong> mar<strong>in</strong>e ecosystems<br />
(<strong>in</strong> contrast to habitat change for most terrestrial system) (MEA 2005), thus the pursuit of a few<br />
commercial stocks <strong>in</strong>directly effect the rest of the ecosystem. But overfish<strong>in</strong>g is also directly limit<strong>in</strong>g a biotic<br />
resources that today accounts for 17% of the animal prote<strong>in</strong> <strong>in</strong>take worldwide, with high nutritional and economical<br />
values that are crucial for many low <strong>in</strong>come and food deficient countries (FAO <strong>2012</strong>). Fish as a<br />
product can also replace potential mark<strong>et</strong> shares of other environmentally costly food supplies such as beef<br />
(W<strong>in</strong>ther <strong>et</strong> al., 2009). In economic terms the global fishery systems are sub-optimized, leav<strong>in</strong>g many fisheries<br />
with low profitability due to low stock sizes and overcapacity. If the stocks restored to larger biomasses<br />
and then exploited with equal<strong>in</strong>g catches the global profits has been estimated to <strong>in</strong>crease with 50 billion $<br />
annually equal<strong>in</strong>g more than half of the value of exist<strong>in</strong>g land<strong>in</strong>gs (FAO 2008). However, such global generalisations<br />
are crude, but probably also underestimated rather than overestimated (Holt 2009).<br />
Life Cycle Assessment (<strong>LCA</strong>) is an acknowledged and standardized m<strong>et</strong>hod to assess potential impacts or<br />
damage related to a product or process (ISO 2006a, 2006b). The European Union has concluded that it provides<br />
the best framework for assess<strong>in</strong>g the potential environmental impacts of products currently available<br />
(EC 2003). One of the benefits is the ability to compare and relate products with either potential impacts <strong>in</strong><br />
511
PARALLEL SESSION 6B: FISHIERIES, SOIL, AND EMERGY METHODS 8 th Int. Conference on <strong>LCA</strong> <strong>in</strong> the<br />
Agri-<strong>Food</strong> Sector, 1-4 Oct <strong>2012</strong><br />
terms of midpo<strong>in</strong>t impacts or endpo<strong>in</strong>t damage categories. Endpo<strong>in</strong>t categories have higher model uncerta<strong>in</strong>ty<br />
but also higher explanatory value, and they targ<strong>et</strong> def<strong>in</strong>ed safeguard objects of Natural ecosystems,<br />
Natural resources or Human health, (F<strong>in</strong>nveden <strong>et</strong> al., 2009). The theor<strong>et</strong>ical impact pathways implies that<br />
overfish<strong>in</strong>g is presently damag<strong>in</strong>g two out of three safeguard objects which are mandatory to check and address<br />
<strong>in</strong>terpr<strong>et</strong>ation of accord<strong>in</strong>g to the new ILCD standard (ILCD 2010). Clearly, overfish<strong>in</strong>g is a scientifically<br />
underp<strong>in</strong>ned and relevant environmental aspect of fishery systems from a natural ecosystem and resource<br />
perspective, which is stressed by an <strong>in</strong>creas<strong>in</strong>g <strong>in</strong>ternational focus. Y<strong>et</strong>, no seafood <strong>LCA</strong> has accounted<br />
for overfish<strong>in</strong>g as a quantitative impact category with resolution sufficient to match fishery management<br />
needs, seafood guide criteria’s or exist<strong>in</strong>g susta<strong>in</strong>able seafood labell<strong>in</strong>g frameworks, which all require<br />
(as m<strong>in</strong>imum) s<strong>in</strong>gle stock exploitation boundaries to address overfish<strong>in</strong>g.<br />
2. Theory<br />
The Maximum Susta<strong>in</strong>able Yield (MSY) concept has been re<strong>in</strong>stated as a management goal for the European<br />
Union (EC 2006) and the ratification of the Johannesburg summit agenda has given a deadl<strong>in</strong>e until<br />
2015 to restore all stocks to levels capable of produc<strong>in</strong>g maximum susta<strong>in</strong>able yield (JPOI 2002). Transition<br />
towards an MSY based management has also been implemented <strong>in</strong> the advice given by ICES, the International<br />
Council for Exploration of the Seas, to the European Commission and ultimately Council of Fisheries<br />
m<strong>in</strong>isters, that annually s<strong>et</strong> the total allowable fish<strong>in</strong>g quotas for all major European fisheries. Stock summary<br />
outputs from these assessments are easily accessible on an annual basis, which are based on models<br />
us<strong>in</strong>g year class track<strong>in</strong>g time series of commercial land<strong>in</strong>g and mult<strong>in</strong>ational stock surveys. Total biomass<br />
(TB) and spawn<strong>in</strong>g stock biomass (SSB), typically the mature part of the stock, are two of the m<strong>et</strong>adata<br />
given by the assessments. Aggregated fish<strong>in</strong>g mortality (F) is another, and the primary regulat<strong>in</strong>g <strong>in</strong>dicator<br />
that measures the annual fraction of harvested spawn<strong>in</strong>g stock biomass. When F is s<strong>et</strong> to a calculated FMSY<br />
(i.e. vary<strong>in</strong>g quotas but constant mortality from fisheries), the fish stocks will over time lead to MSY, the<br />
maximum long-term susta<strong>in</strong>able catches, as the biomass oscillates around BMSY (Fig. 1). In European assessments<br />
the F and B refers to SSB, and hereafter <strong>in</strong> this work, but other assessments could also refer to TB.<br />
Figure 1. With <strong>in</strong>creased fish<strong>in</strong>g pressure F, the spawn<strong>in</strong>g stock biomass will decl<strong>in</strong>e (dotted l<strong>in</strong>e) render<strong>in</strong>g<br />
<strong>in</strong>creased long term yields (filled l<strong>in</strong>e) until F = FMSY after which the long term yields will start to decrease.<br />
The correspond<strong>in</strong>g biomass at FMSY will fluctuate around BMSY imply<strong>in</strong>g land<strong>in</strong>gs at MSY. Used with k<strong>in</strong>d<br />
permission from International Council for Exploration of the Seas.<br />
However, ICES only provides BTRIGGER a safeguard limit above which recruitment (successful reproduction)<br />
should not be impaired. But first when the theor<strong>et</strong>ical BMSY values have been computed can a recovery time<br />
until full capacity is restored be established. This could motivate even higher decreases <strong>in</strong> F <strong>in</strong> some cases,<br />
as for example stopp<strong>in</strong>g all fish<strong>in</strong>g until stocks have recovered to their full potential of provid<strong>in</strong>g MSY<br />
catches. When BMSY values was assessed for all European stocks <strong>in</strong> 2010, the conclusion was that with current<br />
fish<strong>in</strong>g pressure would have missed to restore 91% of the stocks for the management plan by 2015<br />
(Froese and Proelß 2010).<br />
3. M<strong>et</strong>hods<br />
To quantify pathways towards potential damage targ<strong>et</strong><strong>in</strong>g natural ecosystem and natural resources we propose<br />
three mid-po<strong>in</strong>t impact categories related to the MSY approach. Primarily we def<strong>in</strong>ed the impact category<br />
of Wasted Potential Yield (WPY), which represent the long-term damage to the biotic resource and<br />
512
PARALLEL SESSION 6B: FISHIERIES, SOIL, AND EMERGY METHODS 8 th Int. Conference on <strong>LCA</strong> <strong>in</strong> the<br />
Agri-<strong>Food</strong> Sector, 1-4 Oct <strong>2012</strong><br />
<strong>in</strong>directly the surround<strong>in</strong>g ecosystem, <strong>in</strong> units of mass that could have been used if an optimal harvest strategy<br />
was chosen. Note that even at WPY=0 will any fishery impose theor<strong>et</strong>ical damage to the ecosystem. For<br />
management purpose and m<strong>in</strong>imisation of model uncerta<strong>in</strong>ty, we subdivided WPY <strong>in</strong>to two “sub impact<br />
categories”: F-Overfish<strong>in</strong>g (current rate of on-go<strong>in</strong>g overexploitation, for clarity added with an “F” for fish<strong>in</strong>g<br />
mortality) and B-Overfishedness (current state of stock, for clarity added with a ”B” for biomass). Both<br />
complement<strong>in</strong>g categories are expressed <strong>in</strong> relation to their correspond<strong>in</strong>g optimal value <strong>in</strong> a MSY framework<br />
(Table 1).<br />
Table 1: Proposed impact category def<strong>in</strong>itions (bold), characterisation model def<strong>in</strong>ition and units. Strictly the<br />
true unit is kg for all categories, but a complement<strong>in</strong>g qualifier has been noted <strong>in</strong> brack<strong>et</strong>s.<br />
IC Type Impact Category Characterisation model Unit (qualifier)<br />
Midpo<strong>in</strong>t F-Overfish<strong>in</strong>g (FO) F/FMSY-1 kg (excess FMSY equiv.)<br />
Midpo<strong>in</strong>t B-Overfishedness (BO) BMSY/Baverage5y-1 kg (lost BMSY equiv.)<br />
Midpo<strong>in</strong>t Wasted Potential Yield<br />
(WPY)<br />
Schaeffer, Baverage5y, FOPTIMAL (<br />
0 while B
PARALLEL SESSION 6B: FISHIERIES, SOIL, AND EMERGY METHODS 8 th Int. Conference on <strong>LCA</strong> <strong>in</strong> the<br />
Agri-<strong>Food</strong> Sector, 1-4 Oct <strong>2012</strong><br />
2011). M<strong>et</strong>a data was selected for stock assessments b<strong>et</strong>ween 1995-2010 regard<strong>in</strong>g 42 out of 54 major European<br />
stocks for which complement<strong>in</strong>g BMSY values could be found (Froese and Proelß 2010). The FMSY and<br />
BMSY reference values are consensus values, i.e. averages values based on three modell<strong>in</strong>g approaches; 1) a<br />
demographic yield per recruit analysis 2) a surplus production analysis and 3) a stock recruitment analysis<br />
with correspond<strong>in</strong>g confidence <strong>in</strong>tervals (Froese and Proelß 2010). They are <strong>in</strong>tended by the authors to be<br />
updated every five years with the orig<strong>in</strong>al assessment based on time series data up until 2008 (Froese <strong>et</strong> al.,<br />
2011). Projection calculations were performed <strong>in</strong> the free statistical comput<strong>in</strong>g software R (www.rproject.org).<br />
4. Results<br />
All characterisation factors showed varied b<strong>et</strong>ween stocks and years although 2010 are considered the ma<strong>in</strong><br />
datas<strong>et</strong>. For an overview the stocks dur<strong>in</strong>g 2010 could be aggregated <strong>in</strong>to species generalised factors, se fig.<br />
1. However, the variation with<strong>in</strong> species groups is considerable: with a coefficient of variation (CV) of 1.2<br />
for WPY and 1.0 for both F-Overfish<strong>in</strong>g and B-Overfishedness, regard<strong>in</strong>g all species groups with 3 or more<br />
stocks represented.<br />
Figure 1. Characterisation of 2010 values of F-Overfish<strong>in</strong>g (black), B-Overfishedness (grey) and Wasted<br />
Potential Yield (dotted) ranked accord<strong>in</strong>g to their common mass based <strong>in</strong>dicator. Brack<strong>et</strong>s <strong>in</strong>dicate number<br />
of stocks <strong>in</strong>cluded. Y-axis measures lost catch <strong>in</strong> kg. Fish illustrations: FAO<br />
Cod stocks were <strong>in</strong> worst shape <strong>in</strong> terms of wasted potential yield followed by plaice and whit<strong>in</strong>g stocks,<br />
which are all demersal (ground dwell<strong>in</strong>g) species relatively far up <strong>in</strong> the trophic cha<strong>in</strong>. The five best placed<br />
species <strong>in</strong> relation to biotic resource use were all pelagic species of typically smaller body mass and mean<br />
trophic level. Horse mackerel (one stock) placed midrange but negative F-Overfish<strong>in</strong>g and B-Overfishedness<br />
suggested that this score relates to under exploitation, all other species groups are subjects of missed yield<br />
due to overexploitations <strong>in</strong> various extents.<br />
5. Discussion<br />
A Schaeffer projection of an aggregated stock biomass is not the state of the art projection of fish stock used<br />
today to s<strong>et</strong> exploitation quotas, even though it’s still frequently used to describe the ma<strong>in</strong> pr<strong>in</strong>cipals of exploitation<br />
dynamics (Jenn<strong>in</strong>gs <strong>et</strong> al., 2001). But it has been shown a useful tool for characteris<strong>in</strong>g the importance<br />
of m<strong>et</strong>adata r<strong>et</strong>rieved from state of the art stock assessments, comb<strong>in</strong><strong>in</strong>g measurements of present exploitation<br />
rate and the present state of biomass with MSY limits. We judge that it is sufficiently accurate for<br />
general comparison b<strong>et</strong>ween stocks and years <strong>in</strong> an <strong>LCA</strong>’s context for broad picture management. A central<br />
limitation is that only the largest and most commercially important stocks will have sufficient data documentation,<br />
render<strong>in</strong>g it practically useless for bycatches; however other compl<strong>et</strong><strong>in</strong>g m<strong>et</strong>hods for assess<strong>in</strong>g bycatch<br />
exist and could <strong>in</strong> future be compl<strong>et</strong>ed with vulnerability <strong>in</strong>dices.<br />
514
PARALLEL SESSION 6B: FISHIERIES, SOIL, AND EMERGY METHODS 8 th Int. Conference on <strong>LCA</strong> <strong>in</strong> the<br />
Agri-<strong>Food</strong> Sector, 1-4 Oct <strong>2012</strong><br />
In a sensitivity analysis the time perspective was tested and characterisation factors (CF) generated up to 500<br />
projection years. With longer time span (T) used for projections, the higher were badly managed stocks are<br />
relatively contribut<strong>in</strong>g <strong>in</strong> WPY and the higher the average WPY became for all stocks. Most stocks stabilise<br />
asymptotically with T approach<strong>in</strong>g large values. Exceptions are heavily exploited stocks which <strong>in</strong>stead <strong>in</strong>crease<br />
rapidly but asymptotically approached a constant <strong>in</strong>crease rate. However with a longer projections<br />
(typically >100years) it is unrealistic that a constant fish<strong>in</strong>g mortality could be susta<strong>in</strong>ed, unlikely that the<br />
reference values would still be updated, and cause large error propagations. With a too short T, restoration of<br />
overexploited stocks will not be the optimal scenario and <strong>in</strong>stead favoured by the (unwanted) scenario of<br />
“kill<strong>in</strong>g all fish one year, leav<strong>in</strong>g none to the next”. This forces a subjectively chosen T with<strong>in</strong> the projection<br />
range where CFs has not stabilised, which <strong>in</strong>directly becomes a matter of weigh<strong>in</strong>g the importance of heavily<br />
exploited stocks risk of depl<strong>et</strong>ion. For good and bad, the time dependency actually mimics the dilemma of<br />
fishery management; balanc<strong>in</strong>g the uncerta<strong>in</strong>ty of future catches aga<strong>in</strong>st short time yields which may jeopardize<br />
the long term revenue. One solution could be to formulate Hierachist, Individualist and Egalitarian<br />
view perspectives by a convenient s<strong>et</strong> of projections.<br />
Decreased model- and <strong>in</strong>put data uncerta<strong>in</strong>ty can be achieved by us<strong>in</strong>g the sub impact categories of Foverfish<strong>in</strong>g<br />
and B-overfishedness. F/FMSY based F-Overfish<strong>in</strong>g is however the best choice based on <strong>in</strong>put<br />
param<strong>et</strong>er uncerta<strong>in</strong>ty s<strong>in</strong>ce the BMSY assessment comes with a broader confidence <strong>in</strong>terval <strong>in</strong> the orig<strong>in</strong>al<br />
assessments, and the temporal variation is smallest for F. Furthermore, susta<strong>in</strong>ability of fishery or biotic resource<br />
depl<strong>et</strong>ion potential will <strong>in</strong>dependent of measurement m<strong>et</strong>hod always have high temporal variation due<br />
to the fluctuat<strong>in</strong>g nature of the stocks, random environmental factors and political decisions <strong>in</strong>fluenc<strong>in</strong>g the<br />
exploitation rates. Spatial variation is also substantial with<strong>in</strong> each species group. For database purpose the<br />
stock entries could be aggregated <strong>in</strong>to optimally sized groups that m<strong>in</strong>imize the representation bias, a practical<br />
reason for this is that <strong>in</strong>sufficient traceability legislations often renders it impossible to known the orig<strong>in</strong><br />
of a fish product down to the relevant stock level. However, the undisputable best resolution would be<br />
achieved if the <strong>LCA</strong> practitioner collected stock summary data <strong>in</strong> the same way as other <strong>in</strong>ventory data (F,<br />
SSB and limit values) for the actual stock of concern.<br />
By this m<strong>et</strong>hodology, overfish<strong>in</strong>g can be described as midpo<strong>in</strong>t categories, but relat<strong>in</strong>g to damage of natural<br />
biotic resources lays closest <strong>in</strong> term of future endpo<strong>in</strong>t assessments, s<strong>in</strong>ce Wasted Potential Catch is a mass<br />
unit that could be translated <strong>in</strong>to economical terms and compared with abiotic resource depl<strong>et</strong>ion. Natural<br />
ecosystem damage could be compared <strong>in</strong> terms of prist<strong>in</strong>e state for similar stocks, s<strong>in</strong>ce a Schaeffer model<br />
also <strong>in</strong>dicates the carry<strong>in</strong>g capacity (the unfished population) as 2Bmsy correspond<strong>in</strong>g to natural ecosystem.<br />
However relative importance <strong>in</strong> the ecosystem should then also be <strong>in</strong>cluded for <strong>in</strong>clusion of both mar<strong>in</strong>e and<br />
terrestrial fauna.<br />
6. Conclusion<br />
With the <strong>in</strong>clusion of biological impact categories, <strong>LCA</strong>´s are concluded to be a useful complementary tool<br />
for fisheries managers, seafood <strong>in</strong>dustry or seafood labell<strong>in</strong>g/consumer guides where quantitative overfish<strong>in</strong>g<br />
<strong>in</strong>dices has been the miss<strong>in</strong>g part of the toolbox. We suggest Wasted Potential Yield and/or F-Overfish<strong>in</strong>g B-<br />
Overfishedness as impact categories depend<strong>in</strong>g on the scope of the study, and conclude them to me<strong>et</strong> demands<br />
of applicability, relevancy and scientific soundness. Without directly address<strong>in</strong>g and quantify<strong>in</strong>g the<br />
biological effects of targ<strong>et</strong> stock, <strong>in</strong>ternationally acknowledged broadly as overfish<strong>in</strong>g, any future seafood<br />
<strong>LCA</strong> could be mis<strong>in</strong>terpr<strong>et</strong>ed or even deliberately misused as a biased proxy for total “environmental” damage.<br />
7. References<br />
Anticamara, J.A., Watson R., Gelchu A., Pauly D. 2011. Global fish<strong>in</strong>g effort (1950–2010): Trends, gaps, and implications. Fisheries<br />
Research 107 (1–3):131-136.<br />
EC 2003. COM(2003) 302 Integrated Product Policy - Build<strong>in</strong>g on Environmental Life-Cycle Th<strong>in</strong>k<strong>in</strong>g. Comisssion of the European<br />
Communities, Brussels.<br />
EC 2006. Implement<strong>in</strong>g susta<strong>in</strong>ability <strong>in</strong> EU fisheries through maximum susta<strong>in</strong>able yield Communication from the Commission to<br />
the Council and the European Parliament. Brussels.<br />
FAO 2008. The sunken billions the economic justification for fisheries reform. World Bank and <strong>Food</strong> and Agriculture Organization,<br />
Wash<strong>in</strong>gton DC.<br />
FAO <strong>2012</strong>. The state of world fisheries and aquaculture (SOFIA). Rome.<br />
F<strong>in</strong>nveden, G., Hauschild M.Z., Ekvall T., Gu<strong>in</strong>ée J., Heijungs R., Hellweg S., Koehler A., Penn<strong>in</strong>gton D., Suh S. 2009. Recent<br />
developments <strong>in</strong> Life Cycle Assessment. Journal of Environmental Management 91 (1):1-21.<br />
Frank, K.T., P<strong>et</strong>rie B., Choi J.S., Legg<strong>et</strong>t W.C. 2005. Trophic Cascades <strong>in</strong> a Formerly Cod-Dom<strong>in</strong>ated Ecosystem. Science 308<br />
(5728):1621-1623.<br />
515
PARALLEL SESSION 6B: FISHIERIES, SOIL, AND EMERGY METHODS 8 th Int. Conference on <strong>LCA</strong> <strong>in</strong> the<br />
Agri-<strong>Food</strong> Sector, 1-4 Oct <strong>2012</strong><br />
Froese, R., Branch T.A., Proelß A., Quaas M., Sa<strong>in</strong>sbury K., Zimmermann C. 2011. Generic harvest control rules for European fisheries.<br />
Fish and Fisheries 12 (3):340-351.<br />
Froese, R., Proelß A. 2010. Rebuild<strong>in</strong>g fish stocks no later than 2015: will Europe me<strong>et</strong> the deadl<strong>in</strong>e? Fish and Fisheries 11 (2):194-<br />
202.<br />
Holt, S. 2009. Sunken Billions - But how many? Fisheries Research 97 (1-2):3-10.<br />
Hutch<strong>in</strong>gs, J.A., Reynolds J.D. 2004. Mar<strong>in</strong>e fish population collapses: Consequences for recovery and ext<strong>in</strong>ction risk. Bioscience 54<br />
(4):297-309.<br />
ICES 2011. ICES Stock Summary database. ICES - The International Council of exporation of the Sea.<br />
http://ices.dk/datacentre/StdGraphDB.asp. 2011<br />
ILCD 2010. International Reference Life Cycle Data System (ICLD) Handbook - General guide to Life Cycle Assessments - D<strong>et</strong>ailed<br />
guidance. First edition edn. Jo<strong>in</strong>t Research Centre of the European Commission.<br />
ISO 2006a. ISO14040 - Environmental management - Life cycle assessment - Pr<strong>in</strong>cipals and Framework. International Organization<br />
for Standardization, Geneva, Switzerland.<br />
ISO 2006b. ISO14044 - Environmental management - Life cycle assessment - Requirements and Guidel<strong>in</strong>es. International Organization<br />
for Standardization, Geneva, Switzerland.<br />
Jackson, J.B.C., Kirby M.X., Berger W.H., Bjorndal K.A., Botsford L.W., Bourque B.J., Bradbury R.H., Cooke R., Erlandson J.,<br />
Estes J.A., Hughes T.P., Kidwell S., Lange C.B., Lenihan H.S., Pandolfi J.M., P<strong>et</strong>erson C.H., Steneck R.S., Tegner M.J., Warner<br />
R.R. 2001. Historical overfish<strong>in</strong>g and the recent collapse of coastal ecosystems. Science 293 (5530):629-638.<br />
Jenn<strong>in</strong>gs, S., Kaiser M., Reynolds J.D. 2001. Mar<strong>in</strong>e Fisheries Ecology. Wiley-Blackwell.<br />
JPOI 2002. Johannesburg Plan of Implementation: adopted by the United Nations World Summit on Susta<strong>in</strong>able Development <strong>in</strong><br />
Johannesburg, South Africa, on 4 September 2002. Directorate: Susta<strong>in</strong>able Development Coord<strong>in</strong>ation, Department of Environmental<br />
Affairs and Tourism.<br />
MEA 2005. Ecosystems and Human Well-be<strong>in</strong>g: Biodiversity Synthesis. Millennium Ecosystem Assessment (MEA), Wash<strong>in</strong>gton<br />
DC.<br />
Mullon, C., Freon P., Cury P. 2005. The dynamics of collapse <strong>in</strong> world fisheries. Fish and Fisheries 6 (2):111-120.<br />
Myers, R.A., Worm B. 2003. Rapid worldwide depl<strong>et</strong>ion of predatory fish communities. Nature 423 (6937):280-283.<br />
Pauly, D., Christensen V., Guen<strong>et</strong>te S., Pitcher T.J., Sumaila U.R., Walters C.J., Watson R., Zeller D. 2002. Towards susta<strong>in</strong>ability <strong>in</strong><br />
world fisheries. Nature 418 (6898):689-695.<br />
Rockstrom, J., Steffen W., Noone K., Persson A., Chap<strong>in</strong> F.S., Lamb<strong>in</strong> E.F., Lenton T.M., Scheffer M., Folke C., Schellnhuber H.J.,<br />
Nykvist B., de Wit C.A., Hughes T., van der Leeuw S., Rodhe H., Sorl<strong>in</strong> S., Snyder P.K., Costanza R., Sved<strong>in</strong> U., Falkenmark<br />
M., Karlberg L., Corell R.W., Fabry V.J., Hansen J., Walker B., Liverman D., Richardson K., Crutzen P., Foley J.A. 2009. A safe<br />
operat<strong>in</strong>g space for humanity. Nature 461 (7263):472-475.<br />
Schaefer, M. 1954. Some aspects of the dynamics of populations important to the management of the commercial Mar<strong>in</strong>e fisheries.<br />
Bull<strong>et</strong><strong>in</strong> of the Inter-American Tropical Tuna Commission 1(2): 27-56.<br />
Scheffer, M., Carpenter S., Foley J.A., Folke C., Walker B. 2001. Catastrophic shifts <strong>in</strong> ecosystems. Nature 413 (6856):591-596.<br />
Swartz, W., Sala E., Tracey S., Watson R., Pauly D. 2010. The Spatial Expansion and Ecological Footpr<strong>in</strong>t of Fisheries (1950 to<br />
Present). PLoS One 5 (12):e15143.<br />
W<strong>in</strong>ther, U., Ziegler F., Skontorp Hognes E., Emanuelsson A., Sund V., Ell<strong>in</strong>gsen H. 2009. Carbon footpr<strong>in</strong>t and energy use of Norwegian<br />
seafood products. .<br />
Worm, B., Hilborn R., Baum J.K., Branch T.A., Collie J.S., Costello C., Fogarty M.J., Fulton E.A., Hutch<strong>in</strong>gs J.A., Jenn<strong>in</strong>gs S.,<br />
Jensen O.P., Lotze H.K., Mace P.M., McClanahan T.R., M<strong>in</strong>to C., Palumbi S.R., Parma A.M., Ricard D., Rosenberg A.A., Watson<br />
R., Zeller D. 2009. Rebuild<strong>in</strong>g Global Fisheries. Science 325 (5940):578-585.<br />
516
PARALLEL SESSION 6B: FISHIERIES, SOIL, AND EMERGY METHODS 8 th Int. Conference on <strong>LCA</strong> <strong>in</strong> the<br />
Agri-<strong>Food</strong> Sector, 1-4 Oct <strong>2012</strong><br />
Biotic resources extraction impact assessment <strong>in</strong> <strong>LCA</strong> of fisheries<br />
Juli<strong>et</strong>te Langlois 1,2* , Pierre Fréon 3 , Jean-Philippe Delgenes 2 , Jean-Philippe Steyer 2 , Arnaud Hélias 1,2<br />
1 Montpellier SupAgro, 2 place Pierre Viala, F-34060 Montpellier cedex 2, <strong>France</strong><br />
2 INRA, UR50, LBE, Laboratoire de Biotechnologie <strong>et</strong> de l’Environnement, Avenue des Etangs, F-11000 Narbonne, <strong>France</strong><br />
3 IRD EME R212, Av. J. Monn<strong>et</strong>, F-34203, Sète, <strong>France</strong><br />
Correspond<strong>in</strong>g author. E-mail: langlois@supagro.<strong>in</strong>ra.fr<br />
ABSTRACT<br />
Because direct environmental impacts of fisheries can hardly be assessed us<strong>in</strong>g conventional m<strong>et</strong>hods of Life Cycle Assessment<br />
(<strong>LCA</strong>), we suggest build<strong>in</strong>g a new m<strong>et</strong>hodological framework to account for most of them. We propose a regionalized m<strong>et</strong>hod of<br />
calculation for characterisation factors dedicated to an uptake of biomass through fish<strong>in</strong>g activities (biotic resources extraction impact<br />
assessment). These characterisation factors are proposed for the assessment of impacts on biotic resources depl<strong>et</strong>ion and on life support<br />
functions of mar<strong>in</strong>e ecosystems. The m<strong>et</strong>hod is applied on two examples of fisheries, to demonstrate that it is relevant for comparisons<br />
b<strong>et</strong>ween different fisheries, exploit<strong>in</strong>g different fish species. A discussion on the compatibility of this m<strong>et</strong>hod with other<br />
frameworks is then performed.<br />
Keywords: biotic resources extraction, fisheries, n<strong>et</strong> primary production, maximum susta<strong>in</strong>able yield<br />
1. Introduction<br />
Life Cycle Assessment (<strong>LCA</strong>) tends to be exhaustive for the impacts it assesses, but as identified by<br />
Pell<strong>et</strong>ier <strong>et</strong> al., (2007), there is a need of improvement to assess impacts of seafood products. In seafood <strong>LCA</strong><br />
case studies, most authors deemed necessary to add non-conventional <strong>in</strong>dicators (1) to take <strong>in</strong>to account fish<br />
removal from their ecosystem and allow comparisons b<strong>et</strong>ween terrestrial and aquatic food products, (2) to<br />
assess depl<strong>et</strong>ion of fish stocks and perturbation of the ecosystem by imbalanced exploitation b<strong>et</strong>ween trophic<br />
levels, (3) to assess seafloor damage. To this aim, they used respectively (1) <strong>in</strong>dicators of n<strong>et</strong> primary<br />
production use, (2) small-size ratio of targ<strong>et</strong> catch, discard ratio, by-catch ratio and fish<strong>in</strong>g-<strong>in</strong>-balance <strong>in</strong>dex,<br />
(3) area of seafloor trawled. In order to harmonize these different proposals, Langlois <strong>et</strong> al., (2011) suggested<br />
the creation of a new impact category, called “sea use” by analogy with “land use”, which could allow the<br />
assessment of mar<strong>in</strong>e ecosystems transformation and occupation impacts. They suggested keep<strong>in</strong>g the most<br />
consensual framework of terrestrial land use (Mila i Canals <strong>et</strong> al., 2007), i.e. def<strong>in</strong><strong>in</strong>g a quality <strong>in</strong>dex whose<br />
values could be compared from a use to another and vary<strong>in</strong>g accord<strong>in</strong>g to time to reach a new steady state<br />
after a certa<strong>in</strong> time of restoration. They quoted the possibility to use an <strong>in</strong>dicator express<strong>in</strong>g the life support<br />
capability of mar<strong>in</strong>e ecosystems.<br />
In the case of biomass removal through fish<strong>in</strong>g activities, impacts are especially strong. First, one or more<br />
specific stocks of wild species can be depl<strong>et</strong>ed by direct biomass removal and their future use by human as a<br />
natural resource can be altered (impacts on Biotic Natural Resources (BNR)). Secondly, the total biomass<br />
available for the ecosystem function<strong>in</strong>g is also decreased by this removal as well as the function<strong>in</strong>g of the<br />
whole ecosystem (impacts on Life Support Functions (LSF)). The biodiversity loss due to fish<strong>in</strong>g is also<br />
severe, especially the alpha biodiversity for benthic species due to trawls dredg<strong>in</strong>g the seabed, with about<br />
75% of the shelf areas trawled worldwide every year (Kaiser <strong>et</strong> al., 2002), as well as for commercial species<br />
and by-catches, due to a high <strong>in</strong>tensity of direct capture (FAO, 2010).<br />
In mar<strong>in</strong>e ecosystems, ecosystem production and biodiversity tend to display correlations (Libralato <strong>et</strong> al.,<br />
2008) and assess<strong>in</strong>g LSF constitute a challeng<strong>in</strong>g issue <strong>in</strong> the present context of worldwide overfish<strong>in</strong>g.<br />
Thus, the present study focuses only on the impact assessment of BNR extractions and ecosystem LSF<br />
alteration due to fish<strong>in</strong>g activity; the impacts of fish<strong>in</strong>g on biodiversity loss were not considered here. As<br />
underl<strong>in</strong>ed by Udo de Haes <strong>et</strong> al., (2002), both BNR and LSF have to be assessed. These authors expla<strong>in</strong> <strong>in</strong><br />
d<strong>et</strong>ail that it does not consist <strong>in</strong> double count<strong>in</strong>g because two different areas of protection are considered<br />
(natural resources and ecosystem quality respectively). This work d<strong>et</strong>ails and discusses m<strong>et</strong>hods for<br />
characterisation factors calculations for these two impact pathways. The m<strong>et</strong>hod is presented <strong>in</strong> the section 2<br />
and illustrated with an example of fishery <strong>in</strong> the section 3. Section 4 opens the way to a discussion on the<br />
relevance of the proposed m<strong>et</strong>hods and on their compatibility with other exist<strong>in</strong>g assessment m<strong>et</strong>hods.<br />
2. M<strong>et</strong>hods<br />
Two m<strong>et</strong>hods of impact assessment are proposed and d<strong>et</strong>ailed for BNR and LSF <strong>in</strong> part 2.1 and 2.2<br />
respectively. One of the constra<strong>in</strong>ts considered <strong>in</strong> this study was to provide some results <strong>in</strong> comparable units.<br />
517
PARALLEL SESSION 6B: FISHIERIES, SOIL, AND EMERGY METHODS 8 th Int. Conference on <strong>LCA</strong> <strong>in</strong> the<br />
Agri-<strong>Food</strong> Sector, 1-4 Oct <strong>2012</strong><br />
2.1. Fish<strong>in</strong>g activities and biotic resources extraction impact assessment<br />
The goal of biotic resources extraction impact assessment is to characterise to what extent the current biotic<br />
extractions worsen the possibilities for human soci<strong>et</strong>y to cover future needs, due to stock reductions as<br />
stated by Udo de Haes <strong>et</strong> al., (2002). One commonly used reference for fish stock status assessment is the<br />
maximum susta<strong>in</strong>able yield (MSY). This is the highest yield <strong>in</strong> fish production that can be susta<strong>in</strong>ed <strong>in</strong> the<br />
long term (Graham, 1935; Schaefer, 1954). It results from the assumptions that current catches at time t (Ct)<br />
can be <strong>in</strong>creased up to a certa<strong>in</strong> level by <strong>in</strong>creas<strong>in</strong>g the fish<strong>in</strong>g effort (E) because they are compensated by an<br />
equivalent fish production. Above the MSY level and its correspond<strong>in</strong>g EMSY level, the renewal of the resource<br />
(reproduction and body growth) cannot keep pace with the removal caused by fish<strong>in</strong>g. In this case<br />
further <strong>in</strong>creases <strong>in</strong> exploitation leads to a reduction <strong>in</strong> yields (Fig. 1). The MSY can either be calculated<br />
through different stock assessment m<strong>et</strong>hods or can be estimated empirically (Hilborn and Walters, 1992).<br />
Rough stock assessments are performed by FAO but the most <strong>in</strong>terest<strong>in</strong>g database is the RAM Legacy Stock<br />
Assessment Database, <strong>in</strong>clud<strong>in</strong>g biological reference po<strong>in</strong>ts for over 200 stocks (Ricard <strong>et</strong> al., 2011).<br />
Figure 1. Trends <strong>in</strong> catches evolution accord<strong>in</strong>g to fish<strong>in</strong>g effort (<strong>in</strong> cases of equilibrium states).<br />
We suggest an impact assessment of BNR depl<strong>et</strong>ion correspond<strong>in</strong>g to the uptake of a mass (m) of a given<br />
mar<strong>in</strong>e species us<strong>in</strong>g the MSY related po<strong>in</strong>ts. This allows a differentiation b<strong>et</strong>ween different fish species, <strong>in</strong><br />
relation with the size of their stock and the proportion that can be susta<strong>in</strong>ably removed. The environmental<br />
impact on biotic natural resources (IBNR,1) is thus calculated us<strong>in</strong>g the follow<strong>in</strong>g formula:<br />
m<br />
I = Eq. 1<br />
MSY<br />
BNR,1<br />
Catch Ct<br />
(Mt.yr -1 )<br />
MSY<br />
Thus, impacts of biotic extraction resources are here expressed <strong>in</strong> potential time of regeneration, i.e. <strong>in</strong><br />
time required to restore an uptake of a particular species assum<strong>in</strong>g equilibrium conditions. This equation is<br />
valid to assess impacts of biotic extractions as long as stocks are not overexploited (underexploited, moderately<br />
exploited or fully exploited, follow<strong>in</strong>g the typology provided by FAO), i.e. that their catch never exceeded<br />
the MSY value. These cases appear on the left side of the graph <strong>in</strong> Figure 1. Nevertheless, FAO estimates<br />
that 32% of the stocks are not <strong>in</strong> this case, be<strong>in</strong>g either (1) overexploited, (2) depl<strong>et</strong>ed or (3) recover<strong>in</strong>g<br />
from depl<strong>et</strong>ion (FAO, 2010). This corresponds to cases where Ct is respectively (1) higher than the MSY<br />
value, (2) smaller but decreas<strong>in</strong>g because of previous overexploitation or (3) smaller and <strong>in</strong>creas<strong>in</strong>g. These<br />
cases appear on the right side of Fig. 1.<br />
IBNR should express that the uptake of one functional unit from an overexploited stock is worse than the<br />
uptake of the same unit from a stock species hav<strong>in</strong>g the same MSY value and be<strong>in</strong>g susta<strong>in</strong>ably exploited.<br />
Thus it appears important to multiply IBNR,1 by a factor depend<strong>in</strong>g on the gap b<strong>et</strong>ween current catches and<br />
MSY <strong>in</strong> the case of overexploited or recover<strong>in</strong>g stocks. This factor should vary from 1 to <strong>in</strong>f<strong>in</strong>ite for values<br />
of Ct vary<strong>in</strong>g from MSY to zero (when the stock is severely depl<strong>et</strong>ed). One of the easiest possibilities for this<br />
factor is the ratio MSY over Ct. Thus IBNR,2 would become:<br />
m MSY m<br />
Eq. 2<br />
I BNR,2=<br />
MSY Ct Ct<br />
0<br />
Susta<strong>in</strong>able fish<strong>in</strong>g<br />
I =<br />
MSY<br />
I m<br />
BNR,2=<br />
C<br />
BNR,1 m<br />
E MSY<br />
Overfish<strong>in</strong>g, depl<strong>et</strong>ion or recover<strong>in</strong>g<br />
Classical trend due to<br />
overexploitation, followed by<br />
progressive recover<strong>in</strong>g<br />
Fish<strong>in</strong>g<br />
effort E<br />
In the particular case of a recent and unsteady overexploitation, where Ct is higher than MSY (Fig. 1;<br />
dashed l<strong>in</strong>e), we estimated that the impacts should be kept at IBNR,1, to avoid m<strong>in</strong>imiz<strong>in</strong>g IBNR and to avoid the<br />
assessment of a transient state.<br />
518<br />
t
PARALLEL SESSION 6B: FISHIERIES, SOIL, AND EMERGY METHODS 8 th Int. Conference on <strong>LCA</strong> <strong>in</strong> the<br />
Agri-<strong>Food</strong> Sector, 1-4 Oct <strong>2012</strong><br />
2.2. Fish<strong>in</strong>g activities and life support functions assessment<br />
The consensual framework of land use (Mila i Canals <strong>et</strong> al., 2007) has been developed <strong>in</strong> a context of<br />
<strong>in</strong>tense agricultural and urban occupation as well as habitat transformation. Thus, param<strong>et</strong>ers as time<br />
occupation or restoration and area used or transformed were particularly important for this impact<br />
assessment. In the case of mar<strong>in</strong>e activities were there is seldom cont<strong>in</strong>uous occupation and often slow<br />
habitat transformation, one of the major issues is to assess the quantity of biomass the ecosystem is deprived<br />
of (for fish<strong>in</strong>g activities as well as for other uses, see <strong>in</strong> the discussion section). A quality <strong>in</strong>dex related to the<br />
alteration of biomass production capability of the ecosystem could be expressed <strong>in</strong> free N<strong>et</strong> Production<br />
(fNP). The fNP is the amount of biomass produced rema<strong>in</strong><strong>in</strong>g <strong>in</strong> the ecosystem and usable for its own<br />
function<strong>in</strong>g after humans have removed a part of it from the ocean. To account for the trophic level of the<br />
biomass removed, we can use equivalence with the correspond<strong>in</strong>g quantity of primary production that was<br />
necessary to produce it. Thus the quality <strong>in</strong>dex could be expressed <strong>in</strong> free N<strong>et</strong> Primary Production equivalent<br />
(fNPPeq), be<strong>in</strong>g the N<strong>et</strong> Primary Production equivalent (NPPeq) produced by the ecosystem m<strong>in</strong>us the Human<br />
Appropriation of N<strong>et</strong> Primary Production equivalent (HANPPeq). Both of them are expressed <strong>in</strong> kilogram of<br />
organic carbon per m² and per year. To fit the framework of (Mila i Canals <strong>et</strong> al., 2007), the impacts on LSF<br />
<strong>in</strong> mar<strong>in</strong>e ecosystems (ILSF) would be the volume def<strong>in</strong>ed on Fig.2, expressed <strong>in</strong> kg of carbon (equivalent to<br />
primary carbon which was necessary for its production). For fish<strong>in</strong>g activities, this quantity of carbon the<br />
ecosystem is deprived of, directly corresponds to the NPPuse, <strong>in</strong>dicator (<strong>in</strong> kg Ceq) used <strong>in</strong> some <strong>LCA</strong> studies<br />
to quantify the impacts of seafood products, as described by Papatryphon <strong>et</strong> al., (2004).<br />
Figure 2. Graphical presentation of sea use impacts on LSF, <strong>in</strong>spired from (Mila i Canals <strong>et</strong> al., 2007).<br />
The equivalences b<strong>et</strong>ween fish masses and primary carbon required to susta<strong>in</strong> its production can be<br />
calculated, consider<strong>in</strong>g trophic levels (TL) of the uptake and the transfer efficiency b<strong>et</strong>ween two trophic<br />
levels (TE). Updated values of TL are available per species <strong>in</strong> the fishbase database (Froese and Pauly, <strong>2012</strong>)<br />
and updated TE values provided by Libralato <strong>et</strong> al., (2008) accord<strong>in</strong>g to the types of ecosystems (i.e. oceanic<br />
systems, upwell<strong>in</strong>g systems, tropical shelves, non-tropical shelves, coastal and coral systems). Based on<br />
these two param<strong>et</strong>ers and a conservative 1:9 ratio of carbon to w<strong>et</strong> weight, NPPuse for a biomass uptake (m)<br />
<strong>in</strong> kg of w<strong>et</strong> weight can be calculated <strong>in</strong> kg of carbon as proposed by Pauly and Christensen (1995):<br />
m<br />
NPP use=<br />
TE<br />
9<br />
fNPP<br />
(kg C.m -2 .yr -1 )<br />
fNPP <strong>in</strong>itial<br />
fNPP reference<br />
fNPP use<br />
(V)<br />
t 1 t 2 t 3<br />
t occupation<br />
t restoration<br />
permanent<br />
impact<br />
TL-1<br />
Eq. 3<br />
This assessment has to be regionalised beyond the regionalisation of TE because the impacts are highly<br />
depend<strong>in</strong>g on the area where it takes place. Moreover, the value of NPPuse allows quantify<strong>in</strong>g how much<br />
carbon the ecosystem is deprived of, but it does not provide any <strong>in</strong>formation about the relative importance of<br />
this uptake relative to the total value of free biomass rema<strong>in</strong><strong>in</strong>g with<strong>in</strong> the ecosystem. Thus, this “classical”<br />
way to assess occupation and transformation impacts can be improved, by add<strong>in</strong>g a factor express<strong>in</strong>g the<br />
scarcity of the biotic resource <strong>in</strong> the ecosystem. This was suggested by Weidema and L<strong>in</strong>deijer (2001) and<br />
used by Michelsen (2007) for land use impact assessment. The goal of the factor is to express that for the<br />
same amount of biomass removed from the sea, if it is fished <strong>in</strong> an ecosystem where biomass is scarce, the<br />
impacts on ecosystem are worse than if biomass is fished <strong>in</strong> a fertile one. Two param<strong>et</strong>ers play a role to<br />
d<strong>et</strong>erm<strong>in</strong>e the scarcity of the resource: the ecosystem size (Aecozone) and its productivity (NPPmean,ecozone). We<br />
def<strong>in</strong>ed NPPecozone as the total amount of NPP produced <strong>in</strong> a given ecozone for a year:<br />
time<br />
<br />
t3<br />
Impact = (V) = (fNPP - fNPP (t))×Adt<br />
t1<br />
reference use<br />
519
PARALLEL SESSION 6B: FISHIERIES, SOIL, AND EMERGY METHODS 8 th Int. Conference on <strong>LCA</strong> <strong>in</strong> the<br />
Agri-<strong>Food</strong> Sector, 1-4 Oct <strong>2012</strong><br />
NPPecozone Aecozone NPPmean<br />
, ecozone<br />
Eq. 4<br />
Apart from <strong>LCA</strong>, this param<strong>et</strong>er was also <strong>in</strong>troduced for fish<strong>in</strong>g activities impact assessment by Halpern<br />
<strong>et</strong> al., (2008) and Libralato <strong>et</strong> al., (2008). For the calculation of the impacts due to sea use on life support<br />
functions (ILSF), we suggest the <strong>in</strong>troduction of this factor.<br />
520<br />
NPP<br />
use<br />
I LSF=<br />
NPPecozone<br />
Thus ILSF expressed the time required to regenerate the amount of biomass removed from the sea. The<br />
classification of the zones is based on the Mar<strong>in</strong>e Ecoregions Of the World, developed by Spald<strong>in</strong>g <strong>et</strong> al.,<br />
(2007) and recommended for land use impact assessment by Koellner <strong>et</strong> al., (<strong>2012</strong>). World maps of NPP<br />
values for year 2010 are also available (Oregon State University, 2010). These two types of data were<br />
merged <strong>in</strong> a Geographical Information System software to compute NPPecozone, also us<strong>in</strong>g the 200m-isobath<br />
(British Oceanographic Data Centre, 2003) and the coastl<strong>in</strong>es (Wessel, <strong>2012</strong>).<br />
3. Results<br />
The m<strong>et</strong>hods developed <strong>in</strong> the previous section were applied to two simple case-studies of fisheries. The<br />
first one is the fish<strong>in</strong>g of 1 kg of Atlantic cod and the second one of 1 kg of herr<strong>in</strong>g. They are both fished<br />
along the coastal area of the USA (Gulf of Ma<strong>in</strong>e). Data used for this assessment as well as the result<strong>in</strong>g<br />
Characterisation Factors (CF) and impacts are d<strong>et</strong>ailed <strong>in</strong> Table 1.<br />
Table 1. Data used for characterisation factors calculation and results obta<strong>in</strong>ed.<br />
Type of data [unit] Fishery 1 Fishery 2<br />
Inventory data m [kg ww] a 1 1<br />
Ecozone Gulf of Ma<strong>in</strong>e Gulf of Ma<strong>in</strong>e<br />
Data used for Characterisation<br />
Factors (CF) calculation<br />
Species Atlantic herr<strong>in</strong>g Atlantic cod<br />
Stock status (2004) Recover<strong>in</strong>g from depl<strong>et</strong>ion Depl<strong>et</strong>ed<br />
Catch [kg ww.yr -1 ] a 114 090 b 4 950 c<br />
MSY d [kg ww.yr -1 ] a 194 000 31 159<br />
TL 3 3.8<br />
TE (%) 14 14<br />
NPPuse [kg Ceq] 22 180<br />
Aecozone [m²] 136 E9 136 E9<br />
NPPecozone [kg C.yr -1 ] 6.8 E10 6.8 E10<br />
CF CFBNR [yr.kg ww -1 ] a 8.8 E-15 2.0 E-13<br />
CFLSF [yr.kg C -1 ] 3.2 E-10 2.6 E-9<br />
Impact IBNR [yr] 8.8 E-15 2.0 E-13<br />
ILSF [yr] 3.2 E-10 2.6 E-9<br />
a ww: w<strong>et</strong> weight<br />
b Average values from 2001 to 2005<br />
c Average values from 2003 to 2007<br />
d Informative data (not used for these particular assessments).<br />
Both <strong>in</strong> the case of biotic natural resources extraction impacts and of life support functions, impacts of<br />
Atlantic cod fish<strong>in</strong>g are higher than for Atlantic herr<strong>in</strong>g. This is due to a previous severe depl<strong>et</strong>ion of the cod<br />
stock, a relatively small value of its MSY and its higher trophic compared to herr<strong>in</strong>g.<br />
4. Discussion<br />
The MSY-related biological reference po<strong>in</strong>ts have been widely debated, first because they are based on<br />
equilibrium conditions or steady states periods not always observed and on the assumption that production <strong>in</strong><br />
the ecosystem can reach a stable and unique maximum (Lark<strong>in</strong>, 1977). Furthermore, s<strong>in</strong>gle species stock<br />
assessment m<strong>et</strong>hods do not seem accurate for a susta<strong>in</strong>able management of mar<strong>in</strong>e resources and an ecosystem-based<br />
management is preferred (Botsford <strong>et</strong> al., 1997). However, these reference po<strong>in</strong>ts are still the most<br />
commonly used to compare multiple stocks, even if not used by all management agencies (Ricard <strong>et</strong> al.,<br />
2011). The biomass reference po<strong>in</strong>t BMSY is the <strong>in</strong>ternationally agreed and legally b<strong>in</strong>d<strong>in</strong>g reference po<strong>in</strong>t for<br />
managed fisheries <strong>in</strong> the United Nations Convention on the Law of the Sea and the United Nations Fish<br />
Stock Agreement and provides a useful basis for compar<strong>in</strong>g stocks (Ricard <strong>et</strong> al., 2011). The expression of<br />
IBNR,2 as the <strong>in</strong>verse of current yearly catches can appear as a loss of the <strong>in</strong>formation due to the exclusion of<br />
MSY. Non<strong>et</strong>heless, s<strong>in</strong>ce this assessment is applied for the <strong>in</strong>terval MSY-ext<strong>in</strong>ction of the stock, and Ct is<br />
Eq. 5
PARALLEL SESSION 6B: FISHIERIES, SOIL, AND EMERGY METHODS 8 th Int. Conference on <strong>LCA</strong> <strong>in</strong> the<br />
Agri-<strong>Food</strong> Sector, 1-4 Oct <strong>2012</strong><br />
bounded to MSY, MSY is still <strong>in</strong>directly taken <strong>in</strong>to account <strong>in</strong> this assessment. Furthermore it would be difficult<br />
to provide a more precise and simple assessment because the impacts <strong>in</strong>duced by fish<strong>in</strong>g on overexploited<br />
stocks are hardly predictable. Thus, it is hard to assess these impacts us<strong>in</strong>g any simple <strong>in</strong>dicator, except<br />
for stocks where <strong>in</strong>formation about the current stock biomass (Bt) and the stock biomass at MSY (BMSY)<br />
would be available. In these cases, the gap b<strong>et</strong>ween Bt and BMSY could provide a relevant <strong>in</strong>formation on the<br />
severity of the impact.<br />
NPPuse allows the assessment of impacts due to biomass removal for the biomass landed as well as for the<br />
discards, with<strong>in</strong> the same impact category. It should be noted that the calculation of oceanic NPP at a global<br />
scale us<strong>in</strong>g remote sens<strong>in</strong>g and global models is not very accurate: a factor two exists for result<strong>in</strong>g NPP values,<br />
depend<strong>in</strong>g on the m<strong>et</strong>hods used for the calculation (Carr <strong>et</strong> al., 2006). It is ma<strong>in</strong>ly due to the <strong>in</strong>tegration<br />
of the vertical dimension of the sea. This assessment is especially uncerta<strong>in</strong> <strong>in</strong> coastal areas, due to a high<br />
level of sediments <strong>in</strong> the water column, and <strong>in</strong> some deep oceanic waters where a chlorophyll deep maximum<br />
layer is observed. Moreover, the <strong>in</strong>dicator NPPuse also presents some limits: it does not allow the recognition<br />
of an imbalance <strong>in</strong>duced by fish<strong>in</strong>g activities. The new impact category we propose encourages the<br />
catches <strong>in</strong> lower trophic level. This could be d<strong>et</strong>rimental if this practice would become excessive.<br />
To allow a good consistency b<strong>et</strong>ween the different impact categories, BNR and LSF impact assessment<br />
must fit exist<strong>in</strong>g frameworks. For BNR, the framework is neither well def<strong>in</strong>ed nor consensual y<strong>et</strong>, as no<br />
operational m<strong>et</strong>hods has been developed <strong>in</strong> <strong>LCA</strong>. Udo de Haes <strong>et</strong> al., (2002) reviewed some suggestions for<br />
the operationalisation of BNR assessment, us<strong>in</strong>g the balance of exploited biomass for every species, accord<strong>in</strong>g<br />
to its worldwide use and natural replenishment (<strong>in</strong> kg per year). This balance of overexploited biomass is<br />
bounded on zero if the use is smaller than the replenishment. It is then divided by the worldwide stock of this<br />
species or its squared value accord<strong>in</strong>g to the authors. The result<strong>in</strong>g ratio (Q) is the <strong>in</strong>verse of the time required<br />
to destroy the stock for this species. Udo de Haes <strong>et</strong> al., (2002) suggested the use of the Red list database<br />
edited by the International Union for Conservation of Nature. It provides a level of endangerment of the<br />
species, which can be converted to coarse values of (Q), but this m<strong>et</strong>hod of calculation does not allow a precise<br />
differentiation b<strong>et</strong>ween species (especially for those used below their rate of replenishment). One of the<br />
major advantages of our m<strong>et</strong>hod is that it sidesteps these limitations.<br />
Regard<strong>in</strong>g the applicability of the framework developed for LSF impact assessment to other mar<strong>in</strong>e activities,<br />
fNPP appears particularly relevant as quality <strong>in</strong>dex: <strong>in</strong> the case of shad<strong>in</strong>g impacts due to constructions,<br />
or <strong>in</strong> the case of seafloor destruction due to constructions or destructive fish<strong>in</strong>g, fNPP is also decreased.<br />
Thus, both <strong>in</strong>dicator and m<strong>et</strong>hodology would be relevant (Langlois <strong>et</strong> al., <strong>in</strong> preparation). Moreover,<br />
ILSF is compatible with terrestrial land use impact assessment, as the same types of data are also available for<br />
terrestrial ecosystems (availability for values of NPPuse or ∆fNPPeq by type of use, biogeographical classifications<br />
and maps of NPP).<br />
5. Conclusion<br />
Thanks to these two new impact categories, both impacts on production capability (ILSF) and stock status<br />
(IBNR) can be assessed us<strong>in</strong>g the same unit (time), which could quite easily be extended to other impact pathways<br />
l<strong>in</strong>ked with land or sea use. Data required for the IBNR calculation were easily available, and this would<br />
be the case for most exploited stocks. The same advantage can be underl<strong>in</strong>ed for ILSF. Thus, the m<strong>et</strong>hodology<br />
proposed for biomass removal from the ocean seems promiss<strong>in</strong>g.<br />
Alterations of habitat by biodiversity damage have been excluded, as well as damage of benthic habitats<br />
due to trawls. This should constitute the next step of m<strong>et</strong>hodological improvement for this impact assessment.<br />
6. Acknowledgements<br />
This work benefited from the support of the French National Research Agency, (W<strong>in</strong>SeaFuel project). J.<br />
Langlois and A. Hélias are members of the ELSA research group (Environmental Life Cycle and Susta<strong>in</strong>ability<br />
Assessment, http://www.elsa- lca.org/); they thank all the members of ELSA for their precious advice.<br />
The authors also thank N. Devaux, E. Crochel<strong>et</strong> and B. Mallavan for their advice <strong>in</strong> GIS data treatment.<br />
7. References<br />
Botsford, L. W., Castilla, J. C. and P<strong>et</strong>erson, C. H., 1997. The Management of Fisheries and Mar<strong>in</strong>e Ecosystems. Science 277 (5325),<br />
509–515.<br />
British Oceanographic Data Centre, 2003. GEBCO Digital Atlas, (consulted May <strong>2012</strong><br />
http://www.bodc.ac.uk/projects/<strong>in</strong>ternational/gebco/)<br />
Carr, M.-E., Friedrichs, M. A. M., Schmeltz, M., Noguchi Aita, M., Anto<strong>in</strong>e, D., Arrigo, K. R., Asanuma, I., <strong>et</strong> al., 2006. A Comparison<br />
of Global Estimates of Mar<strong>in</strong>e Primary Production from Ocean Color. Deep-Sea Res Pt II 53 (5-7), 741–770.<br />
521
PARALLEL SESSION 6B: FISHIERIES, SOIL, AND EMERGY METHODS 8 th Int. Conference on <strong>LCA</strong> <strong>in</strong> the<br />
Agri-<strong>Food</strong> Sector, 1-4 Oct <strong>2012</strong><br />
FAO, 2010. Part 1: World review of fisheries and aquaculture , <strong>in</strong>: FAO (Eds), State of World Fisheries and Aquaculture, 2010.<br />
Rome, pp. 3–89.<br />
Froese, R. and Pauly, D., <strong>2012</strong>. Fishbase. World Wide Web electronic publication<br />
Graham, M., 1935. Modern Theory of Exploit<strong>in</strong>g a Fishery, and Application to North Sea Trawl<strong>in</strong>g. ICES Journal of Mar<strong>in</strong>e Science<br />
10 (3), 264–274.<br />
Halpern, B. S., Walbridge, S., Selkoe, K. A., Kappel, C. V., Micheli, F., D’Agrosa, C., Bruno, J. F., <strong>et</strong> al., 2008. A Global Map of<br />
Human Impact on Mar<strong>in</strong>e Ecosystems. Science 319 (5865), 948–952.<br />
Hilborn, R. and Walters, C. J., 1992. Quantitative Fisheries Stock Assessment: Choice, Dynamics and Uncerta<strong>in</strong>ty. Rev Fish Biol<br />
Fisher 2 (2), 177–178.<br />
Kaiser, M. J., Collie, J. S., Hall, S. J., Jenn<strong>in</strong>gs, S. and Po<strong>in</strong>er, I. R., 2002. Modification of Mar<strong>in</strong>e Habitats by Trawl<strong>in</strong>g Activities:<br />
Prognosis and Solutions. Fish and Fisheries 3 (2), 114–136.<br />
Koellner, T., de Baan, L., Beck, T., Brandao, M., Civit, B., Goedkoop, M., Margni, M., i Canals, L., Müller-Wenk, R., Weidema, B.<br />
and Wittstock, B., <strong>2012</strong>. Pr<strong>in</strong>ciples for Life Cycle Inventories of Land Use on a Global Scale. Int J Life Cycle Assess 1–13.<br />
Langlois, J., Hélias, A., Delgenes, J. P. and Steyer, J. P., 2011. Review on Land Use Considerations <strong>in</strong> Life Cycle Assessment:<br />
M<strong>et</strong>hodological Perspectives for Mar<strong>in</strong>e Ecosystems, <strong>in</strong>: F<strong>in</strong>kbe<strong>in</strong>er, M. (Eds), Towards Life Cycle Susta<strong>in</strong>ability Management.<br />
Spr<strong>in</strong>ger, Berl<strong>in</strong>, pp. 85–96.<br />
Lark<strong>in</strong>, P. A., 1977. An Epitaph for the Concept of Maximum Susta<strong>in</strong>ed Yield. T Am Fish Soc 106 (1), 1–11.<br />
Libralato, Coll, M., Tudela, S., Palomera, I. and Pranovi, F., 2008. Novel Index for Quantification of Ecosystem Effects of Fish<strong>in</strong>g as<br />
Removal of Secondary Production. Mar<strong>in</strong>e Ecology Progress Series 355, 107–129.<br />
Michelsen, O., 2007. Assessment of Land Use Impact on Biodiversity. Int J Life Cycle Assess 13 (1), 22–31.<br />
Mila i Canals, L., Bauer, C., Depestele, J., Dubreuil, A., Knuchel, R., Gaillard, G., Michelsen, O., Müller-Wenk, R. and Rydgren, B.,<br />
2007. Key Elements <strong>in</strong> a Framework for Land Use Impact Assessment With<strong>in</strong> <strong>LCA</strong>. Int J Life Cycle Assess 12, (1) 5–15.<br />
Oregon State University, 2010. Ocean Productivity, (consulted February <strong>2012</strong><br />
http://www.science.oregonstate.edu/ocean.productivity/custom.php)<br />
Papatryphon, E., P<strong>et</strong>it, J., Kaushik, S. J. and van der Werf, H. M. G., 2004. Environmental Impact Assessment of Salmonid Feeds<br />
Us<strong>in</strong>g Life Cycle Assessment (<strong>LCA</strong>). AMBIO: A Journal of the Human Environment 33 (6), 316–323.<br />
Pauly, D. and Christensen, V., 1995. Primary Production Required to Susta<strong>in</strong> Global Fisheries. Nature 374 (6519), 255–257.<br />
Pell<strong>et</strong>ier, N. L., Ayer, N. W., Tyedmers, P. H., Kruse, S. A., Flysjo, A., Robillard, G., Ziegler, F., Scholz, A. J. and Sonesson, U.,<br />
2007. Impact Categories for Life Cycle Assessment Research of Seafood Production Systems: Review and Prospectus. Int J Life<br />
Cycle Assess 12, 414–421.<br />
Ricard, D., M<strong>in</strong>to, C., Jensen, O. P. and Baum, J. K., 2011. Exam<strong>in</strong><strong>in</strong>g the Knowledge Base and Status of Commercially Exploited<br />
Mar<strong>in</strong>e Species with the RAM Legacy Stock Assessment Database. Fish and Fisheries (<strong>in</strong> press).<br />
Schaefer, M. B., 1954. Some Aspects of the Dynamics of Populations Important to the Management of the Commercial Mar<strong>in</strong>e<br />
Fisheries. Bull. IATTC 1 (2), 27–56.<br />
Spald<strong>in</strong>g, M. D., Fox, H. E., Allen, G. R., Davidson, N., Ferdana, Z. A., F<strong>in</strong>layson, M., Halpern, B. S., <strong>et</strong> al., 2007. Mar<strong>in</strong>e Ecoregions<br />
of the World: a Bioregionalization of Coastal and Shelf Areas. BioScience 57 (7), 573–583.<br />
Udo de Haes, H. A., F<strong>in</strong>nveden, G., Goedkoop, M., Hauschild, M., Hertwich, E., Hofst<strong>et</strong>ter, P., Jolli<strong>et</strong>, O., <strong>et</strong> al., 2002. Life cycle<br />
impact assessment: Striv<strong>in</strong>g towards best practice, SETAC Press, Pensacola.<br />
Weidema, B. P. and L<strong>in</strong>deijer, E., 2001. Physical Impacts of Land Use <strong>in</strong> Product Life Cycle Assessment, Technical University of<br />
Denmark.<br />
Wessel, P., <strong>2012</strong>. GSHHS Coastl<strong>in</strong>es, SOEST Univesity of Hawai’i, Honolulu (consulted February <strong>2012</strong>,<br />
http://www.soest.hawaii.edu/pwessel/gshhs/<strong>in</strong>dex.html).<br />
522
PARALLEL SESSION 6B: FISHIERIES, SOIL, AND EMERGY METHODS 8 th Int. Conference on <strong>LCA</strong> <strong>in</strong> the<br />
Agri-<strong>Food</strong> Sector, 1-4 Oct <strong>2012</strong><br />
Regionalised m<strong>et</strong>hod to assess soil erosion <strong>in</strong> <strong>LCA</strong><br />
Montse Núñez 1,2,* , Assumpció Antón 1,3 , Pere Muñoz 1 , Joan Rieradevall 4<br />
1 IRTA, Sostenipra. Centre de Cabrils 08348 Cabrils, Barcelona, Spa<strong>in</strong><br />
2 INRA-LBE, Avenue des Etangs 11000 Narbonne, <strong>France</strong><br />
3 Departament d’Eng<strong>in</strong>yeria Química, Universitat Rovira i Virgili 43003 Tarragona, Spa<strong>in</strong><br />
4 ICTA, Sostenipra. Universitat Autònoma de Barcelona 08193, Bellaterra, Barcelona, Spa<strong>in</strong><br />
Correspond<strong>in</strong>g author. E-mail: montse.nunez@supagro.<strong>in</strong>ra.fr<br />
ABSTRACT<br />
One of the most relevant and endangered ecosystem services worldwide due to land use change and <strong>in</strong>appropriate land use practices<br />
is the capacity of ecosystems to stabilize soils by prevent<strong>in</strong>g soil erosion. This research was meant to develop a m<strong>et</strong>hod to <strong>in</strong>clude the<br />
assessment of soil erosion <strong>in</strong> <strong>LCA</strong> on a global scale. The m<strong>et</strong>hod deals with land occupation impacts. As soil erosion depends on<br />
local conditions, characterisation factors were regionalised on a 5 arc-m<strong>in</strong>utes grid-cell level resolution. Two endpo<strong>in</strong>t <strong>in</strong>dicators<br />
cover<strong>in</strong>g the areas of protection damage to resources and damage to ecosystem quality were proposed. The m<strong>et</strong>hod was applied to the<br />
agricultural stage of five agricultural crop rotations. Further research efforts should aim at apply<strong>in</strong>g the m<strong>et</strong>hod beyond the agricultural<br />
stage and to identify a feasible and relevant spatial scale at which to aggregate characterisation factors to cope with data gaps on<br />
location of processes.<br />
Keywords: ecosystem services, land use, soil erosion, spatial differentiation, USLE<br />
1. Introduction<br />
Ecosystem services (ES) are resources and processes that are supplied by natural ecosystems. Despite<br />
their fundamental role <strong>in</strong> susta<strong>in</strong><strong>in</strong>g ecosystem function<strong>in</strong>g and human activities, they have been traditionally<br />
disregarded <strong>in</strong> life cycle oriented m<strong>et</strong>hods such as life cycle assessment (<strong>LCA</strong>), a m<strong>et</strong>hod that is meant to<br />
encourage environmental susta<strong>in</strong>ability. This oversight can lead to improper decisions. One of the most relevant<br />
and endangered ES worldwide due to land use change and unsusta<strong>in</strong>able land use management practices<br />
is the capacity of ecosystems to stabilise soils and to prevent soil sediment accumulation downstream. Soil<br />
erosion leads to a reduction of soil quality, as usually a large amount of nutrients is lost tog<strong>et</strong>her with the<br />
topsoil. Nutrient impoverished soils are less capable to provide ecosystem services. D<strong>et</strong>ached soil nutrients,<br />
such as phosphorous, organic matter and heavy m<strong>et</strong>als lead to pollution of water courses and lost particles to<br />
contam<strong>in</strong>ation of the air. Annually, humans cause de loss of 50 to 75 billion m<strong>et</strong>rics of soil (Harvey and Pimentel,<br />
1996). Agricultural lands account for 75% of the soil erosion worldwide, though it also occurs <strong>in</strong><br />
other human-modified ecosystems, such as dur<strong>in</strong>g the construction of roads and build<strong>in</strong>gs. Several m<strong>et</strong>hods<br />
deal with the issue of erosion <strong>in</strong> <strong>LCA</strong>. Cowell and Clift (2000) proposed a non-spatially-explicit <strong>in</strong>dicator,<br />
thus one generic characterisation factor (CF), for assessment of soil depl<strong>et</strong>ion, the static reserve life (years).<br />
The LANCA® calculation tool (Beck <strong>et</strong> al., 2010), based on Baitz (2002)’s m<strong>et</strong>hod, allows assess<strong>in</strong>g soil<br />
loss for specific cases of land use that can be used with<strong>in</strong> life cycle <strong>in</strong>ventory (LCI) databases. Saad <strong>et</strong> al.,<br />
(2011) adopted the LANCA® modell<strong>in</strong>g approach to derive CFs of land occupation and land transformation<br />
for Canada at different spatial scales. Van Zelm <strong>et</strong> al., (2011) proposed CFs for erosion due to agricultural<br />
land occupation for the world at the country level. The m<strong>et</strong>hods by Saad <strong>et</strong> al., (2011) and Van Zelm <strong>et</strong> al.,<br />
(2011) are spatially-resolved, that is, CFs <strong>in</strong>clude site-specific geospatial <strong>in</strong>formation, because land use impacts<br />
are highly <strong>in</strong>fluenced by local conditions regard<strong>in</strong>g climate, soil properties and landscape. So far, even<br />
though some proposals already exist for <strong>LCA</strong> to <strong>in</strong>tegrate soil erosion, approaches are still <strong>in</strong> its <strong>in</strong>fancy and<br />
the discussion on its characterisation is far from be<strong>in</strong>g s<strong>et</strong>tled.<br />
The objective of this research was to go one step further towards the <strong>in</strong>tegration of ES <strong>in</strong> <strong>LCA</strong> by develop<strong>in</strong>g<br />
a regionalised m<strong>et</strong>hod for the world to <strong>in</strong>clude land occupation impacts of any type of human activity<br />
on the erosion regulation ES. To show the applicability of the m<strong>et</strong>hod, erosion and environmental impacts<br />
from grow<strong>in</strong>g agricultural rotations with food and energy crops <strong>in</strong> Spa<strong>in</strong> were assessed.<br />
2. M<strong>et</strong>hod<br />
Two endpo<strong>in</strong>t <strong>in</strong>dicators cover<strong>in</strong>g the areas of protection (AoP) damage to resources and damage to ecosystem<br />
quality were def<strong>in</strong>ed. CFs for the two modelled impact pathways were regionalised on a 5 arcm<strong>in</strong>utes<br />
(approximately 10*10 km 2 ) resolution grid, without further aggregation on broader scales.<br />
523
PARALLEL SESSION 6B: FISHIERIES, SOIL, AND EMERGY METHODS 8 th Int. Conference on <strong>LCA</strong> <strong>in</strong> the<br />
Agri-<strong>Food</strong> Sector, 1-4 Oct <strong>2012</strong><br />
2.1. Resource-depl<strong>et</strong>ion impact pathway<br />
The modelled cause-effect cha<strong>in</strong> follows this pathway: land occupation leads to soil erosion and this leads<br />
to loss of topsoil reserves, which eventually leads to soil resource depl<strong>et</strong>ion. Current soil losses reduce soil<br />
availability as a future resource.<br />
We proposed to calculate soil losses <strong>in</strong> the LCI with the universal soil loss equation (USLE, Wischmeier<br />
and Smith, 1978), although other estimation models may also be applied. The endpo<strong>in</strong>t life cycle impact<br />
assessment (LCIA) model <strong>in</strong>forms of the decrease <strong>in</strong> local soil stock as response to soil loss mass due to land<br />
occupation. We differentiated twenty-one soil-depth classes follow<strong>in</strong>g the FAO’s soil-depth map of the<br />
world (FAO/UNESCO, 2007), from very shallow soils (0.05 m deep) to very deep soils (2.25 m deep). For<br />
every soil-depth class we derived a CF. Larger CFs have been assigned to th<strong>in</strong>ner soils as, from a resource<br />
perspective, they are more vulnerable than thicker soils. F<strong>in</strong>al damage is expressed as surplus (solar) energy<br />
needed to rebuild the stock of soil loss on the used area dur<strong>in</strong>g the time of occupation. A global (solar) energy<br />
quality value for all soil types and locations was used (23.9 MJ g -1 soil loss, Odum, 1996), as more specific<br />
values are not presently available. Further d<strong>et</strong>ails on the proposed <strong>in</strong>dicator are reported <strong>in</strong> Núñez <strong>et</strong> al.,<br />
(<strong>2012</strong>a).<br />
2.2 Ecosystem-quality impact pathway<br />
The modelled cause-effect cha<strong>in</strong> follows this pathway: land occupation leads to soil erosion and to the<br />
loss of soil organic carbon (SOC), this reduces biomass productivity, which eventually affects overall biodiversity<br />
and ecosystem quality.<br />
The endpo<strong>in</strong>t <strong>in</strong>dicator for damage to ecosystem quality can be divided <strong>in</strong> a fate step, l<strong>in</strong>k<strong>in</strong>g SOC loss to<br />
soil loss (SOCloss = soilloss *%SOC), and an effect step, l<strong>in</strong>k<strong>in</strong>g ecosystem biomass productivity drop to SOC<br />
loss (%NPPloss = aSOCloss + b). Previous <strong>LCA</strong> m<strong>et</strong>hods proposed soil organic matter content (Milà i Canals <strong>et</strong><br />
al., 2007) and ecosystem biomass productivity (Cowell, 1998; L<strong>in</strong>deijer, 2000; Pfister <strong>et</strong> al., 2011) as <strong>in</strong>dicators<br />
for life support functions of land. The LANCA® operational tool (Beck <strong>et</strong> al., 2011) also <strong>in</strong>cludes the<br />
biotic production of the ecosystem as an <strong>in</strong>dicator for land use impacts. In our approach, we comb<strong>in</strong>ed both<br />
<strong>in</strong>dicators: ecosystem biomass production is modeled as a function of soil quality, which is <strong>in</strong>dicated by the<br />
SOC of the soil lost. We assessed ecosystem biomass productivity as a function of the n<strong>et</strong> primary production<br />
of the potential natural veg<strong>et</strong>ation (NPP0). F<strong>in</strong>al damage expresses the n<strong>et</strong> primary production depl<strong>et</strong>ion<br />
(NPPD) as a response to soil loss mass due to the occupation of an area dur<strong>in</strong>g a time period. For an occupation<br />
of 1 m 2 and 1 year, NPPD ranges from 0 to 1(percentage expressed as a decimal). Larger CFs have been<br />
assigned to the most productive soils, as NPP is a scarce resource on earth. Further d<strong>et</strong>ails on the proposed<br />
<strong>in</strong>dicator are reported <strong>in</strong> Núñez <strong>et</strong> al., (<strong>2012</strong>a).<br />
2.3 Case study on food and energy crops<br />
The m<strong>et</strong>hod was applied to the agricultural stage of five three-year crop rotation systems with food and energy<br />
crops <strong>in</strong> Spa<strong>in</strong>. Spa<strong>in</strong> was selected as a representative case study because it is a highly diverse country<br />
<strong>in</strong> climate, soil and topography, where water erosion is one of the ma<strong>in</strong> causes of land degradation. Of the<br />
analysed rotations, three were traditional ra<strong>in</strong>fed rotations of annual crops grown <strong>in</strong> the Mediterranean region:<br />
i) w<strong>in</strong>ter barley-w<strong>in</strong>ter wheat-rye, ii) w<strong>in</strong>ter barley-w<strong>in</strong>ter wheat-pea, and iii) w<strong>in</strong>ter barley-w<strong>in</strong>ter<br />
wheat-unseeded fallow. Another was a ra<strong>in</strong>fed rotation where a bioenergy crop was <strong>in</strong>troduced: iv) w<strong>in</strong>ter<br />
barley-w<strong>in</strong>ter wheat-oilseed rape; and f<strong>in</strong>ally, a deficit-irrigated short rotation coppice of a perennial crop,<br />
poplar, cultivated <strong>in</strong> three years rotation cycles dur<strong>in</strong>g twelve-fifteen years: v) poplar-poplar-poplar. Results<br />
of the assessment are useful to validate the applicability of the m<strong>et</strong>hod and to compare the environmental<br />
costs of food and energy-crop rotations on the soil erosion regulation ES. The analysis <strong>in</strong>cludes 120 agricultural<br />
plots located throughout the country. The impact assessment was performed for the occupation of one<br />
square m<strong>et</strong>re dur<strong>in</strong>g one year (1m 2 y), tak<strong>in</strong>g the annual average value of soil and SOC loss dur<strong>in</strong>g the three<br />
years of the rotation.<br />
524
PARALLEL SESSION 6B: FISHIERIES, SOIL, AND EMERGY METHODS 8 th Int. Conference on <strong>LCA</strong> <strong>in</strong> the<br />
Agri-<strong>Food</strong> Sector, 1-4 Oct <strong>2012</strong><br />
3. Results<br />
3.1 Characterisation factors<br />
Fig. 1 shows the regionalised CFs for (a) the resource-depl<strong>et</strong>ion impact pathway and (b) the ecosystemquality<br />
impact pathway. As stated previously, for resource depl<strong>et</strong>ion, larger CFs were for th<strong>in</strong>ner soils, and<br />
for ecosystem quality, larger CFs were for soils with higher biomass productivities.<br />
a<br />
Resource depl<strong>et</strong>ion [MJse g -1 b<br />
6 soil loss] 24 0 Ecosystem quality [decimal % NPP lost] 1<br />
Figure 1. Characterisation factors for (a) resource depl<strong>et</strong>ion and (b) ecosystem quality.<br />
3.2 Case study on food and energy crops<br />
At the LCI level, soil erosion of three of the crops grown <strong>in</strong> the evaluated rotations as well as of the unseeded<br />
fallow reference system are depicted <strong>in</strong> Fig. 2. Results are shown group<strong>in</strong>g the analysed plots on the<br />
ten ma<strong>in</strong> water-bas<strong>in</strong>s <strong>in</strong> Spa<strong>in</strong> and on the country scale. It can be seen how soil loss varies as a function of<br />
location for the same crop, hence the importance of <strong>in</strong>clud<strong>in</strong>g geospatial <strong>in</strong>formation as accurately as possible<br />
<strong>in</strong> the <strong>in</strong>ventory step.<br />
Figure 2. Soil erosion (t ha -1 y -1 ) on the 120 studied plots grouped on the water-bas<strong>in</strong> and arithm<strong>et</strong>ic average<br />
±standard deviation on the country level. The reported soil losses were calculated for a whole year (crop +<br />
crop residues + rough fallow before next seed<strong>in</strong>g).<br />
Results at the LCIA stage for the five crop rotations evaluated are shown <strong>in</strong> table 1. As <strong>in</strong> the <strong>in</strong>ventory,<br />
damage to resources and to ecosystem quality varies greatly b<strong>et</strong>ween water-bas<strong>in</strong>s for one and the same crop<br />
rotation, with a coefficient of variation higher than 60% <strong>in</strong> almost all cases (except for the poplar rotation,<br />
CV is 35%). Accord<strong>in</strong>g to the presented results, the most appropriate comb<strong>in</strong>ation of rotation and location<br />
was the poplar energy-crop short rotation forestry grown <strong>in</strong> the North of the country (Duero water bas<strong>in</strong> <strong>in</strong><br />
table 1). Other water bas<strong>in</strong>s, such as the Guadiana (Central Spa<strong>in</strong>, results not shown here) scored very close<br />
to the Duero water bas<strong>in</strong>.<br />
525
PARALLEL SESSION 6B: FISHIERIES, SOIL, AND EMERGY METHODS 8 th Int. Conference on <strong>LCA</strong> <strong>in</strong> the<br />
Agri-<strong>Food</strong> Sector, 1-4 Oct <strong>2012</strong><br />
Table 1. Damage to resources and to ecosystem quality (LCIA) of the five crop rotation systems on five important<br />
watersheds <strong>in</strong> Spa<strong>in</strong> and arithm<strong>et</strong>ic country average. Results are per m 2 and year of land occupation.<br />
Ebro Duero Tajo Segura Guadalquivir Country average<br />
± SD<br />
Resources [MJse]<br />
B-W-R a 6366 4125 9028 5778 9943 10410 ± 6290<br />
B-W-P b 6612 4394 9293 5777 9841 10585 ± 6444<br />
B-W-F c 10285 6978 14450 8948 15608 16198 ± 9652<br />
B-W-OR (*)d 6000 3606 8691 5576 9156 9729 ± 5941<br />
PP (*) -PP (*) -PP (*)e 1334 746 1602 975 1585 1776 ± 1142<br />
Ecosystem quality [NPPD, decimal% of NPP lost]<br />
B-W-R a 0.03 0.02 0.04 0.02 0.05 0.047 ± 0.028<br />
B-W-P b 0.04 0.02 0.04 0.02 0.05 0.048 ± 0.028<br />
B-W-F c 0.05 0.03 0.06 0.03 0.07 0.070 ± 0.043<br />
B-W-OR (*)d 0.03 0.02 0.04 0.02 0.05 0.045 ± 0.027<br />
PP (*) -PP (*) -PP (*)e 0.02 0.01 0.01 0.01 0.02 0.017 ± 0.006<br />
a w<strong>in</strong>ter barley – w<strong>in</strong>ter wheat – rye<br />
b w<strong>in</strong>ter barley – w<strong>in</strong>ter wheat – pea<br />
c w<strong>in</strong>ter barley – w<strong>in</strong>ter wheat – unseeded fallow<br />
d w<strong>in</strong>ter barley – w<strong>in</strong>ter wheat – oilseed rape<br />
e poplar – poplar – poplar<br />
Asterisks <strong>in</strong>dicate crops for energy use.<br />
4. Discussion<br />
4.1 Soil-erosion impact assessment model<br />
Two endpo<strong>in</strong>t <strong>in</strong>dicators for the AoP soil resources and ecosystem quality were proposed <strong>in</strong> order to <strong>in</strong>clude<br />
<strong>in</strong> <strong>LCA</strong> impacts of land occupation on the soil erosion regulation ES. Compared to previous m<strong>et</strong>hods,<br />
the added value of this research is that we provide CFs for the world which can be applied to assess land<br />
occupation impacts of any type of human activity. Land transformation impacts were not addressed. Due to<br />
the complex l<strong>in</strong>k b<strong>et</strong>ween soil loss and human health damage, this impact pathway was excluded from the<br />
assessment. CFs were regionalised on the grid-cell level without aggregat<strong>in</strong>g them on broader adm<strong>in</strong>istrative<br />
or ecological scales. Y<strong>et</strong>, a relevant and feasible scale of aggregation should be found <strong>in</strong> order to deal with<br />
data gaps on location of processes, especially <strong>in</strong> the background system. However, this is a complex issue,<br />
due to the huge variability of soils even at the landscape scale. Variability and uncerta<strong>in</strong>ty of location of<br />
processes (e.g., plastic and fertiliser production of the background system) should also be assessed.<br />
4.2 Case study on food and energy crops<br />
A great variability of soil losses was recorded <strong>in</strong> the <strong>in</strong>ventory step, depend<strong>in</strong>g on climatic and edaphic<br />
conditions. The same trend was found <strong>in</strong> the impact assessment step, as the regionalised model developed<br />
<strong>in</strong>cludes <strong>in</strong>formation on the sensitivity of the receiv<strong>in</strong>g ecosystem to impacts of land use. It is therefore very<br />
important that land-use impact models <strong>in</strong>clude geospatial <strong>in</strong>formation <strong>in</strong> both the LCI and LCIA phases.<br />
The results of the case study show that the poplar energy-crop rotation system <strong>in</strong> Spa<strong>in</strong> can potentially reduce<br />
erosion rates and environmental impacts per area-time unit compared to traditional cereal and legume<br />
crop rotations. The use of other functional units (e.g., kg, MJ) might have led to different results. However,<br />
the selection of non-area-based functional units when crops and rotations with different functions are be<strong>in</strong>g<br />
compared is an unresolved issue <strong>in</strong> <strong>LCA</strong> (Núñez <strong>et</strong> al., <strong>2012</strong>b). In relation to the recommended locations to<br />
cultivate the analysed crop rotations to reduce soil erosion impacts, results <strong>in</strong>dicate a trend. However, these<br />
results should be <strong>in</strong>terpr<strong>et</strong>ed with caution. They are valid for the analysed plots, but each specific case should<br />
be studied separately, as soil erosion depends on plot level factors. Only the agricultural stage was <strong>in</strong>cluded<br />
<strong>in</strong> the assessment, thus the soil erosion model here developed should be applied to the overall life cycle (i.e.,<br />
from the production of seed to the use of the crop or to the f<strong>in</strong>al waste management) to perform a proper<br />
<strong>LCA</strong> study. The extension of the system boundary beyond the agricultural stage would be facilitated if unit<br />
processes of LCI datas<strong>et</strong>s had <strong>in</strong>formation on the amount of soil loss. To this end, the LANCA® tool can be<br />
used, as already implemented <strong>in</strong> <strong>in</strong>ventory flows of the GaBi software. However, we may consider the obta<strong>in</strong>ed<br />
results for the agricultural stage to be representative of the total soil losses dur<strong>in</strong>g the compl<strong>et</strong>e life<br />
cycles of crops, as agriculture is by far the land use activity with higher soil erosion rates.<br />
5. Conclusion<br />
We developed a globally applicable, spatially differentiated m<strong>et</strong>hod to account for land occupation impacts<br />
<strong>in</strong> <strong>LCA</strong>, focus<strong>in</strong>g on the aspect of soil erosion. LCI data needed was s<strong>et</strong> up, CFs developed on a grid-<br />
526
PARALLEL SESSION 6B: FISHIERIES, SOIL, AND EMERGY METHODS 8 th Int. Conference on <strong>LCA</strong> <strong>in</strong> the<br />
Agri-<strong>Food</strong> Sector, 1-4 Oct <strong>2012</strong><br />
cell level resolution, and LCIA models for the AoP soil resources and ecosystem quality proposed. The<br />
m<strong>et</strong>hod aims to contribute to a b<strong>et</strong>ter land use impact assessment of agricultural and forestry production systems.<br />
It was successfully applied to the agricultural stage of produc<strong>in</strong>g different food and energy crops. Further<br />
research should focus on test<strong>in</strong>g the applicability of the m<strong>et</strong>hod across the overall life cycle of a product<br />
and to d<strong>et</strong>erm<strong>in</strong>e the most relevant and feasible scale at which to aggregate CFs to deal with data gaps on<br />
location of processes. A site-generic CF, which is useful for processes of unknown location, may be derived<br />
aggregat<strong>in</strong>g all CFs on the grid-cell level. The freshwater ecoregions regionalisation approach, as suggested<br />
<strong>in</strong> Koellner <strong>et</strong> al., (<strong>2012</strong>), might be an option of aggregation to be studied <strong>in</strong> further work.<br />
6. References<br />
Baitz, M., 2002. Die Bedeutung der funktionsbasierten Charakterisierung von Flächen-Inanspruchnahmen <strong>in</strong><br />
<strong>in</strong>dustriellen Prozessk<strong>et</strong>tenanalysen: E<strong>in</strong> Beitrag zur ganzheitlichen Bilanzierung. Dissertation. Berichte aus der Umwelttechnik.<br />
Aachen: Institut für Kunststoffprüfung und Kunststoffkunde, Universität Stuttgart: Shaker Verlag.<br />
Beck, T., Bos, U., Wittstock, B., Baitz, M., Fischer, M., Sedlbauer, K., 2010. LANCA® Land use <strong>in</strong>dicator value calculation <strong>in</strong> life<br />
cycle assessment – m<strong>et</strong>hod report. University of Stuttgart.<br />
Cowell, S.J., 1998. Environmental life cycle assessment of agricultural systems: <strong>in</strong>tegration <strong>in</strong>to decision-mak<strong>in</strong>g. PhD thesis. University<br />
of Surrey, Guildford, Surrey, UK.<br />
Cowell, S.J., Clift, R., 2000. A m<strong>et</strong>hodology for assess<strong>in</strong>g soil quantity and quality <strong>in</strong> life cycle assessment. J. Ind. Ecol. 8, 321-331.<br />
FAO/UNESCO, 2007. Effective soil depth raster map. http://www.fao.org/geon<strong>et</strong>work/srv/en/ma<strong>in</strong>.home.<br />
Harvey, C.A., Pimentel, D., 1996. Effects of soil and wood depl<strong>et</strong>ion on biodiversity. Biodivers. Conserv. 5, 1121-1130.<br />
Koëllner, T., Baan, L., Beck, T., Brandao, M., Civit, B., Goedkoop, M., Margni, M., Milà i Canals, L., Müller-Wenk, R., Weidema,<br />
B., Wittstock, B., <strong>2012</strong>. Pr<strong>in</strong>ciples for life cycle <strong>in</strong>ventories of land use on a global scale. Int. J. Life Cycle Assess.<br />
doi:10.1007/s11367-012-0392-0.<br />
L<strong>in</strong>deijer, E., 2000. Review of land use impact m<strong>et</strong>hodologies. J. Cleaner Prod. 8, 273-281.<br />
Milà i Canals, L., Romanyà, J., Cowell, S.J., 2007. M<strong>et</strong>hod for assess<strong>in</strong>g impacts on life support functions (LSF) related to the use of<br />
fertile land <strong>in</strong> life cycle assessment (<strong>LCA</strong>). J. Cleaner Prod. 15, 1426-1440.<br />
Núñez, M., Antón, A., Muñoz, P., Rieradevall, J., <strong>2012</strong>a. Inclusion of soil erosion impacts <strong>in</strong> life cycle assessment on a global scale:<br />
application to energy crops <strong>in</strong> Spa<strong>in</strong>. Int. J. Life Cycle Assess. Accepted for publication.<br />
Núñez, M., Pfister, S., Antón, A., Muñoz, P., Hellweg, S., Koehler, A., Rieradevall, J., <strong>2012</strong>b. Assess<strong>in</strong>g the environmental impacts<br />
of wáter consumption by energy crops grown <strong>in</strong> Spa<strong>in</strong>. J. Ind. Ecol. doi: 10.1111/j.1530-9290.2011.0049.x.<br />
Odum, H.T., 1996. Environmental account<strong>in</strong>g: emergy and environmental decision mak<strong>in</strong>g. John Wiley and Sons, New York, United<br />
States.<br />
Pfister, S., Bayer, P., Koehler, A., Hellweg, S., 2011. Environmental impacts of water use <strong>in</strong> global crop production: hotspots and<br />
trade-offs with land use. Environ. Sci. Technol. 45, 5761-5768.<br />
Saad, R., Margni, M., Koellner, T., Wittstock, B., Deschênes, L., 2011. Assessment of land use impacts on soil ecological functions:<br />
development of spatially differentiated characterization factors with<strong>in</strong> a Canadian context. Int. J. Life Cycle Assess. 16, 198-211.<br />
Van Zelm, R., van der Velde, M., Núñez, M., Huijbregts, M.A.J., 2011. Spatially explicit characterization factors for impacts of<br />
agriculture on ecosystems services. 21 st SETAC Europe Annual Me<strong>et</strong><strong>in</strong>g, 15-19 May 2011, Milano, Italy.<br />
Wischmeier, W.H., Smith, D.D., 1978. Predict<strong>in</strong>g ra<strong>in</strong>fall erosion losses – A guide to conservation plann<strong>in</strong>g, Agricultural Handbook<br />
no. 537, Department of Agriculture, United States.<br />
527
PARALLEL SESSION 6B: FISHIERIES, SOIL, AND EMERGY METHODS 8 th Int. Conference on <strong>LCA</strong> <strong>in</strong> the<br />
Agri-<strong>Food</strong> Sector, 1-4 Oct <strong>2012</strong><br />
528<br />
The effect of crop management on soil organic matter <strong>in</strong> the carbon<br />
footpr<strong>in</strong>t of agricultural products<br />
Simona Bosco * , Claudia Di Bene, Enrico Bonari<br />
Institute of Life Sciences – Scuola Superiore S. Anna, Piazza Martiri della Libertà, 33 - 56127 Pisa, Italy<br />
Correspond<strong>in</strong>g author. E-mail: s.bosco@sssup.it<br />
ABSTRACT<br />
The agricultural sector has an important role <strong>in</strong> greenhouse gas (GHG) mitigation, s<strong>in</strong>ce cropland soils can also act as s<strong>in</strong>ks. Attention<br />
has already been drawn to the value of soil quality and soil organic matter (SOM) <strong>in</strong> the life-cycle of agricultural products. Nevertheless,<br />
many life-cycle assessment studies of food and non-food products do not take <strong>in</strong>to account changes <strong>in</strong> SOM <strong>in</strong> arable land.<br />
A simpler one-compartment SOM model is needed to be <strong>in</strong>tegrated <strong>in</strong>to the <strong>LCA</strong> study. Recently, many authors have adopted the<br />
Hén<strong>in</strong>-Dupuis SOM model for cropp<strong>in</strong>g system and orchard studies under different climate conditions, and it has proved useful for<br />
less-d<strong>et</strong>ailed modell<strong>in</strong>g at sites where <strong>in</strong>put requirements for runn<strong>in</strong>g the more complex models are not readily available. The model<br />
was applied to w<strong>in</strong>e production consider<strong>in</strong>g four scenarios with decreas<strong>in</strong>g levels of OM <strong>in</strong>puts. This SOM balance m<strong>et</strong>hod was<br />
sensitive to changes <strong>in</strong> management practices.<br />
Keywords: crop management, Hén<strong>in</strong>-Dupuis model, soil organic matter, organic matter <strong>in</strong>put, tillage <strong>in</strong>tensity.<br />
1. Introduction<br />
The role of agriculture <strong>in</strong> climate mitigation centres on a conservative soil management designed to both<br />
protect soil quality and guarantee GHG emissions reduction (Smith <strong>et</strong> al., 2008). It is well-established that<br />
deep tillage, over-fertilisation, excessive use of pesticides and irrigation, and the removal of crop residues<br />
can dramatically affect soil quality (Lal 2004).<br />
As Nemecek and Erz<strong>in</strong>ger (2005) have <strong>in</strong>dicated, farms are characterised by high variability <strong>in</strong> both natural<br />
and management factors, and by difficult-to-measure emissions. Attention has already been drawn to the<br />
crucial role of soil quality and soil organic matter (SOM) <strong>in</strong> the life-cycle of agricultural products (Cowell<br />
and Clift 1997, 2000; Milà i Canals <strong>et</strong> al., 2007 ). Nevertheless, many life-cycle assessment studies of food<br />
and non-food products do not take <strong>in</strong>to account changes <strong>in</strong> SOM <strong>in</strong> arable cropland (Brentrup <strong>et</strong> al., 2004;<br />
Milà i Canals <strong>et</strong> al., 2006; Mourad <strong>et</strong> al., 2006; Hillier <strong>et</strong> al., 2009; Roy <strong>et</strong> al., 2009; Gazulla <strong>et</strong> al., 2010;<br />
Muñoz <strong>et</strong> al., 2010; Bosco <strong>et</strong> al., 2011). This rema<strong>in</strong>s som<strong>et</strong>h<strong>in</strong>g of an unresolved issue <strong>in</strong> <strong>LCA</strong>, due to the<br />
spatial and temporal variations, and local environmental uniqueness of soil quality (Reap <strong>et</strong> al., 2008). Neither<br />
PAS2050 or GHG Protocol Standard consider until today soil emissions except <strong>in</strong> <strong>in</strong>stances of land-use<br />
changes (BSI, 2011; WRI/WBCSD, 2004). To date, few studies have <strong>in</strong>corporated soil <strong>in</strong>to an <strong>LCA</strong> study<br />
(Beck <strong>et</strong> al., 2010; Mila i Canals <strong>et</strong> al., 2007; Meisterl<strong>in</strong>g <strong>et</strong> al., 2009; Brandão <strong>et</strong> al., 2011; Nemecek <strong>et</strong> al.,<br />
2011; Ponsioen and Blonk 2011; Saad <strong>et</strong> al., 2011) and no common m<strong>et</strong>hodology for its estimation and <strong>LCA</strong><br />
<strong>in</strong>clusion exists.<br />
Soil quality and SOM changes are entirely site-specific, as they are strongly <strong>in</strong>fluenced by management<br />
practices and soil and climate conditions. Many process-oriented SOM models are available for chart<strong>in</strong>g its<br />
evolution on a daily, monthly or annual basis and they have already been <strong>in</strong>corporated <strong>in</strong>to <strong>LCA</strong> analyses<br />
(Milà i Canals <strong>et</strong> al., 2007; Hillier <strong>et</strong> al., 2009). However, the huge amount of data required (m<strong>et</strong>eorological<br />
data, crop phenological data, and chemical and physical soil characteristics) to run these models and to establish<br />
the life cycle <strong>in</strong>ventory (LCI) could limit widespread use of this approach.<br />
A simpler one-compartment SOM model would be more easily <strong>in</strong>tegrated <strong>in</strong>to the <strong>LCA</strong> study. Recently,<br />
many authors have adopted the Hén<strong>in</strong>-Dupuis SOM model for cropp<strong>in</strong>g system and orchard studies under<br />
different climate conditions, and it has proved useful for less-d<strong>et</strong>ailed modell<strong>in</strong>g at sites where <strong>in</strong>put requirements<br />
for runn<strong>in</strong>g the more complex models are not readily available (Sofo <strong>et</strong> al., 2005; Bayer <strong>et</strong> al.,<br />
2006; Bockstaller <strong>et</strong> al., 2008; Bech<strong>in</strong>i <strong>et</strong> al., 2011; Di Bene <strong>et</strong> al., 2011).<br />
In this paper we proposed a new m<strong>et</strong>hod for soil <strong>in</strong>clusion <strong>in</strong> agriculture <strong>LCA</strong>, <strong>in</strong>tegrat<strong>in</strong>g the Hén<strong>in</strong>-<br />
Dupuis SOM model <strong>in</strong>to a carbon footpr<strong>in</strong>t (CF) analysis. Sample results were reported <strong>in</strong> a case study on<br />
w<strong>in</strong>e to test the impact of different management practices on the overall result. W<strong>in</strong>e was chosen as a case<br />
study because it is a widely-studied food product and because of its importance with<strong>in</strong> <strong>in</strong>ternational and Italian<br />
food mark<strong>et</strong>s.
PARALLEL SESSION 6B: FISHIERIES, SOIL, AND EMERGY METHODS 8 th Int. Conference on <strong>LCA</strong> <strong>in</strong> the<br />
Agri-<strong>Food</strong> Sector, 1-4 Oct <strong>2012</strong><br />
2. M<strong>et</strong>hods<br />
2.1. Soil organic matter model<br />
The soil organic matter model, based on the first-order k<strong>in</strong><strong>et</strong>ics model developed by Hén<strong>in</strong> and Dupuis<br />
(1945), evaluates the effect of agricultural practices on the evolution of the SOM pool and it is described by<br />
the follow<strong>in</strong>g equation:<br />
SOMt = SOM0e -k 2 t + k1OMI/k2 (1 - e -k 2 t ) Eq. 1<br />
where SOMt is the SOM pool (Mg ha -1 ) at time t; SOM0 is the <strong>in</strong>itial SOM pool (Mg ha -1 ) at time t = 0; k2 is<br />
the m<strong>in</strong>eralisation coefficient correspond<strong>in</strong>g to the annual rate of SOM loss by m<strong>in</strong>eralisation; k1 is the humification<br />
coefficient and refers to the annual rate of OM <strong>in</strong>puts <strong>in</strong>corporated <strong>in</strong> SOM; and OMI is the annual<br />
OM <strong>in</strong>puts (Mg ha -1 ). A d<strong>et</strong>ailed view of the model structure is given <strong>in</strong> Fig. 1.<br />
The first component of equation 1, SOM0e -k 2 t , represents the fraction of SOM0 still <strong>in</strong> the soil at time t. The<br />
second component, k1 OMI/k2 (1 - e -k 2 t ), is the fraction of the SOM pool deriv<strong>in</strong>g from the humification of<br />
organic material <strong>in</strong>puts.<br />
The soil organic matter pool was calculated accord<strong>in</strong>g to the follow<strong>in</strong>g equation:<br />
SOM pool = (SOMc×BD×d×A)/100 Eq. 2<br />
where SOM pool is organic matter stock (Mg ha -1 ); SOMc is soil organic matter concentration (g kg -1 ), as<br />
d<strong>et</strong>erm<strong>in</strong>ed us<strong>in</strong>g the modified Walkley–Black w<strong>et</strong> combustion m<strong>et</strong>hod (Nelson and Sommers, 1982); BD is<br />
the soil bulk density (g cm -3 ), measured by the Culley m<strong>et</strong>hod (1993); d is the soil sampl<strong>in</strong>g depth (0.30 m);<br />
and A is the area be<strong>in</strong>g considered (1 ha = 10,000 m 2 ).<br />
The m<strong>in</strong>eralisation coefficient (k2) is affected by climate conditions (air temperature) and soil characteristics<br />
(texture and lime content). As <strong>in</strong> Boiff<strong>in</strong> <strong>et</strong> al., (1986) and Bockstaller and Girard<strong>in</strong> (2003), k2 was calculated<br />
as follows:<br />
k2 = 1200×fθ [(c + 200) × (l + 200)] Eq. 3<br />
where fθ is a temperature factor given by fθ = 0.2 (T-5), where T is the average annual air temperature (°C), c<br />
is clay content (g kg -1 ), and l is limestone content (g kg -1 ). As proposed by Mary and Guérif (1994) and Bech<strong>in</strong>i<br />
<strong>et</strong> al., (2011), a dimensionless correction factor of the m<strong>in</strong>eralisation coefficient (P) was used for the<br />
<strong>in</strong>clusion of farm soil management. P was calculated as:<br />
P=pr×fr×I×Ts Eq. 4<br />
where pr refers to maximum crop plough depth (D), where pr = 0.0333*D; fr is a coefficient consider<strong>in</strong>g crop<br />
management (for example, frequency of plough<strong>in</strong>g, frequency of residue <strong>in</strong>corporation, manure) as proposed<br />
by Mary and Guérif (1994); I is the m<strong>in</strong>eralisation weight factor (1.25 and 1.00 for irrigated and nonirrigated<br />
crops, respectively); and Ts is the tillage factor (1 where the soil is ploughed at least once every four<br />
years, 0.5 for non-tillage management, and 0.8 for <strong>in</strong>termediate cases).<br />
Figure 1. The Hén<strong>in</strong>-Dupuis soil organic matter balance.<br />
The Hén<strong>in</strong>-Dupuis model was <strong>in</strong>tegrated <strong>in</strong>to and run us<strong>in</strong>g the GaBi5 software by creat<strong>in</strong>g a param<strong>et</strong>erised<br />
process for each v<strong>in</strong>eyard sub-phase (plant<strong>in</strong>g, pre-production and production) (GaBi, <strong>2012</strong>). Thus,<br />
SOM changes were evaluated for each sub-phase, and the results were allocated on the basis of the temporal<br />
length of each sub-phase <strong>in</strong> years <strong>in</strong> relation to overall v<strong>in</strong>eyard lifespan. The results obta<strong>in</strong>ed, expressed <strong>in</strong><br />
529
PARALLEL SESSION 6B: FISHIERIES, SOIL, AND EMERGY METHODS 8 th Int. Conference on <strong>LCA</strong> <strong>in</strong> the<br />
Agri-<strong>Food</strong> Sector, 1-4 Oct <strong>2012</strong><br />
Mg SOM ha -1 , were converted <strong>in</strong>to Mg CO2 ha -1 us<strong>in</strong>g a SOM/SOC ratio of 1.724 (van Bemmelen factor, <strong>in</strong><br />
Nelson and Sommers, 1982) and a C/CO2 molecular weight ratio of 3.66 (44 CO2/12 C g mole -1 ).<br />
Case study<br />
The study area was the hilly <strong>in</strong>land region <strong>in</strong> Southern Tuscany, Italy. Climate is typically Mediterranean,<br />
characterised by two ma<strong>in</strong> ra<strong>in</strong>y seasons <strong>in</strong> the autumn and the spr<strong>in</strong>g, a total annual ra<strong>in</strong>fall of around<br />
800 mm, and an average temperature of 14.5° C. Soils are quite variable with a texture rang<strong>in</strong>g from silt<br />
loam to clay. The ma<strong>in</strong> physical and chemical characteristics of the soil on the case study v<strong>in</strong>eyard are reported<br />
<strong>in</strong> Table 1.<br />
Table 1. Soil param<strong>et</strong>er on the case study v<strong>in</strong>eyard needed to run the model.<br />
Soil param<strong>et</strong>er Unit Value<br />
Sand (g/kg) 200<br />
Silt (g/kg) 485<br />
Clay (g/kg) 315<br />
Limestone (g/kg) 0.00<br />
Bulk density (g/cm 3 ) 1.30<br />
Soil organic matter (g/kg) 1.19<br />
The functional unit (FU) used for the study was one 0.75 L bottle of w<strong>in</strong>e, and all data refers to the year<br />
2009. The system boundary was divided <strong>in</strong>to two ma<strong>in</strong> phases, the v<strong>in</strong>eyard and the w<strong>in</strong>ery, and seven subphases,<br />
<strong>in</strong>clud<strong>in</strong>g v<strong>in</strong>eyard plant<strong>in</strong>g (1 year), pre-production sub-phase (3 years), production sub-phase (27<br />
years), v<strong>in</strong>ification, bottl<strong>in</strong>g, packag<strong>in</strong>g and distribution.<br />
Data on v<strong>in</strong>eyard soil management, such as manure distribution, use of prun<strong>in</strong>g residues and <strong>in</strong>ter-row<br />
v<strong>in</strong>eyard grass cover or grass<strong>in</strong>g was collected us<strong>in</strong>g specific questionnaires, while data relat<strong>in</strong>g to the physical<br />
and chemical characteristics of the soil was provided by farmer <strong>in</strong> the form of soil samples collected at<br />
the v<strong>in</strong>eyard plant<strong>in</strong>g stage. CO2 emissions/removal caused by carbon stock changes <strong>in</strong> v<strong>in</strong>e biomass were<br />
not <strong>in</strong>cluded, s<strong>in</strong>ce its carbon pool is considerably smaller than that of soil, less than 1% (Keightley 2011),<br />
and the correspond<strong>in</strong>g v<strong>in</strong>e biomass C pool is removed at the end of the v<strong>in</strong>eyard production period. Direct<br />
and <strong>in</strong>direct N2O soil emissions from synth<strong>et</strong>ic and organic fertilisers were calculated us<strong>in</strong>g the IPCC m<strong>et</strong>hodology<br />
and emissions factors (IPCC, 2006).<br />
For this study, GWP impact was evaluated by consider<strong>in</strong>g the CO2, CH4 and N2O emissions associated<br />
with energy and material <strong>in</strong>puts dur<strong>in</strong>g each sub-phase of the production cha<strong>in</strong>. Biogenic emissions were not<br />
considered.<br />
The basel<strong>in</strong>e situation and four scenarios have been elaborated to assess the effect of crop management,<br />
consider<strong>in</strong>g a decreas<strong>in</strong>g levels of organic matter <strong>in</strong>puts, as follow:<br />
S1: manure distribution at v<strong>in</strong>eyard plant<strong>in</strong>g; <strong>in</strong>ter-row grass<strong>in</strong>g with cover crops; <strong>in</strong>corporation of<br />
prun<strong>in</strong>g residues <strong>in</strong>to the soil;<br />
S2: no manure distribution; <strong>in</strong>ter-row grass<strong>in</strong>g with cover crops; <strong>in</strong>corporation of prun<strong>in</strong>g residues<br />
<strong>in</strong>to the soil;<br />
S3: manure at v<strong>in</strong>eyard plant<strong>in</strong>g; tillage for weed control; prun<strong>in</strong>g residues removed;<br />
S4: no manure distribution; tillage for weed control; prun<strong>in</strong>g residues removed.<br />
The values used <strong>in</strong> the scenarios are reported <strong>in</strong> Table 2.<br />
Table 2. Values used <strong>in</strong> the basel<strong>in</strong>e and <strong>in</strong> the scenarios to simulate the effect of v<strong>in</strong>eyard management.<br />
Treatment Unit Basel<strong>in</strong>e S1 S2 S3 S4<br />
Manure at plant<strong>in</strong>g Mg f.m. ha -1 20 65 0 65 0<br />
Incorporation of prun<strong>in</strong>g residues Mg d.m. ha -1 0 3.02 3.02 0 0<br />
Inter-row grass<strong>in</strong>g with cover crops Mg d.m. ha -1 0 4.5 4.5 0 0<br />
3. Results<br />
Table 3 shows the SOM pool evolution dur<strong>in</strong>g the v<strong>in</strong>eyard’s lifespan, from the v<strong>in</strong>eyard plant<strong>in</strong>g to the<br />
last productive year. For each sub-phase, the organic <strong>in</strong>puts and the organic outputs are reported, as well as<br />
the <strong>in</strong>termediate SOM balance.<br />
530
PARALLEL SESSION 6B: FISHIERIES, SOIL, AND EMERGY METHODS 8 th Int. Conference on <strong>LCA</strong> <strong>in</strong> the<br />
Agri-<strong>Food</strong> Sector, 1-4 Oct <strong>2012</strong><br />
Table 3. SOM pool evolution (Mg ha -1 year -1 ) <strong>in</strong> the basel<strong>in</strong>e scenario dur<strong>in</strong>g the v<strong>in</strong>eyard lifespan (SOMvp:<br />
SOM the end of v<strong>in</strong>eyard plant<strong>in</strong>g; SOMpp: SOM at the end of pre-production period; SOMp: at the end of<br />
production period)<br />
SOM V<strong>in</strong>eyard plant<strong>in</strong>g Pre-production Production<br />
before<br />
plant<strong>in</strong>g<br />
OMI OMo SOMvp OMI OMo SOMpp OMI OMo SOMp<br />
46.41 1.56 2.59 45.38 0.40 0.58 45.20 0.48 0.58 45.10<br />
The scenarios were established to evaluate the effects of different v<strong>in</strong>eyard management techniques, us<strong>in</strong>g<br />
manure distribution, residue management and <strong>in</strong>ter-row grass<strong>in</strong>g as variables. The scenario results,<br />
showed <strong>in</strong> Fig. 2, have been expressed <strong>in</strong> kg CO2eq for FU and presented <strong>in</strong> two sections, with the v<strong>in</strong>eyard<br />
and w<strong>in</strong>ery phases be<strong>in</strong>g treated as separate.<br />
kg CO2eq /FU<br />
0.800<br />
0.600<br />
0.400<br />
0.200<br />
0.000<br />
-0.200<br />
-0.400<br />
-0.600<br />
Basel<strong>in</strong>e S1 S2 S3 S4<br />
V<strong>in</strong>eyard phase 0.156 -0.392 -0.366 0.130 0.168<br />
W<strong>in</strong>ery phase 0.543 0.543 0.543 0.543 0.543<br />
Figure 2. Soil effect <strong>in</strong> the selected scenarios on total carbon footpr<strong>in</strong>t, showed <strong>in</strong> v<strong>in</strong>eyard phase and w<strong>in</strong>ery<br />
phase.<br />
4. Discussion<br />
The GWP of a 0.75 L bottle of red w<strong>in</strong>e, was equal to 0.699 kg CO2eq, which is comparable to results<br />
obta<strong>in</strong>ed <strong>in</strong> previous studies on w<strong>in</strong>e CF (Notarnicola <strong>et</strong> al., 2003; Po<strong>in</strong>t 2009; Gazulla <strong>et</strong> al., 2010).<br />
Here, the full SOM balance allowed us to evaluate v<strong>in</strong>eyard management factors, such as fertilisation, grass<strong>in</strong>g,<br />
tillage <strong>in</strong>tensity and residue management and, consequently, to understand the importance of soil account<strong>in</strong>g<br />
<strong>in</strong> the CF of agricultural systems. The model used <strong>in</strong> this study revealed the positive impact of<br />
cover crops on SOM content, as an alternative to the use of <strong>in</strong>ter-row harrow<strong>in</strong>g for weed control, as reported<br />
by Parat <strong>et</strong> al., (2002) and Steenwerth and Bel<strong>in</strong>a (2008). Our results, rang<strong>in</strong>g from -160 to 18 g C m -2 yr -1<br />
for the S1 and S4, respectively, were comparable to the value of -15 g C m -2 yr -1 observed <strong>in</strong> a long-term<br />
study (30 years) conducted <strong>in</strong> a Californian-Mediterranean climate (Kroodsma and Field 2006).<br />
Furthermore, this model for SOM change estimation needs a M<strong>in</strong>imum Data S<strong>et</strong> (MDS) for agricultural<br />
product CFs that accounts for soil carbon, thus establish<strong>in</strong>g a standard for <strong>in</strong>ventory. This MDS <strong>in</strong>cludes the<br />
follow<strong>in</strong>g: physical and chemical soil characteristics (clay, SOM and limestone contents), climate param<strong>et</strong>ers<br />
(average annual temperature), organic matter <strong>in</strong>puts and management practices.<br />
5. Conclusion<br />
In the context of the scientific debate on soil quality and SOM account<strong>in</strong>g, the approach proposed <strong>in</strong> this<br />
study can be regarded as a simplified m<strong>et</strong>hodology among other exist<strong>in</strong>g m<strong>et</strong>hodologies. Our results highlighted<br />
the need to consider soil <strong>in</strong> agricultural product CFs, <strong>in</strong>deed soil constitutes a major C pool <strong>in</strong> cropland,<br />
mean<strong>in</strong>g there is scope for large amounts of C to be ga<strong>in</strong>ed or lost from soils as a consequence of management<br />
practices. The m<strong>et</strong>hod outl<strong>in</strong>ed <strong>in</strong> this study, based on the SOM balance, considered both OM <strong>in</strong>put<br />
<strong>in</strong>to the soil and organic output lost <strong>in</strong> the form of natural and agriculture-<strong>in</strong>duced m<strong>in</strong>eralisation. This simple<br />
and robust model was sensitive to changes <strong>in</strong> management practices.<br />
531
PARALLEL SESSION 6B: FISHIERIES, SOIL, AND EMERGY METHODS 8 th Int. Conference on <strong>LCA</strong> <strong>in</strong> the<br />
Agri-<strong>Food</strong> Sector, 1-4 Oct <strong>2012</strong><br />
Organic and conservation agriculture focus their attention to soil fertility and SOM content ma<strong>in</strong>tenance.<br />
Nevertheless, the application of the carbon footpr<strong>in</strong>t to these systems does not take <strong>in</strong>to account all of the cobenefits<br />
that comes from hav<strong>in</strong>g such systems. In this way, <strong>in</strong>corporat<strong>in</strong>g soil <strong>in</strong>to the analysis can lead to the<br />
improved comparison of organic and conventional systems, highlight<strong>in</strong>g the positive role of organic farm<strong>in</strong>g<br />
<strong>in</strong> the conservation of soil quality.<br />
6. References<br />
Bayer, C., Lovato, T., Dieckow, J., Zanatta, J., Mielniczuk, J., 2006. A m<strong>et</strong>hod for estimat<strong>in</strong>g coefficients of soil organic matter<br />
dynamics based on long-term experiments. Soil Till. Res. 91, 217-226.<br />
Bech<strong>in</strong>i, L., Castoldi, N., Ste<strong>in</strong>, A. 2011. Sensitivity to <strong>in</strong>formation upscal<strong>in</strong>g of agro-ecological assessments: Application to soil<br />
organic carbon management. Agr. Syst. 104, 480-490.<br />
Beck T., Bos U., Wittstock B., Baitz M., Fischer M., Sedlbauer K., 2010. LANCA Land Use Indicator Value Calculation <strong>in</strong> Life<br />
Cycle Assessment, p. 73, Fraunhofer IRB Verlag.<br />
Bockstaller, C., Girard<strong>in</strong>, P. 2003. Mode de Calcul des Indicateurs Agrienvironmentaux de la M<strong>et</strong>hode INDIGO. Version 1.61 du<br />
Logiciel. Unpublished INRA Internal Technical Report. Colmar, <strong>France</strong>.<br />
Bockstaller, C., Guichard, L., Makowski, D., Avel<strong>in</strong>e, A., Girard<strong>in</strong>, P., Plantureux, S. 2008. Agri-environmental <strong>in</strong>dicators to assess<br />
cropp<strong>in</strong>g and farm<strong>in</strong>g systems. A review. Agron. Susta<strong>in</strong>. Dev. 28, 139-149.<br />
Boiff<strong>in</strong>, J., Keli Zagbahi, J., Sebillotte, M. 1986. Systèmes de culture <strong>et</strong> statut organique des sols dans le Noyonnais: application du<br />
modèle de Hén<strong>in</strong>–Dupuis. Agronomie. 6, 437–446.<br />
Bosco, S., Di Bene, C., Galli, M., Remor<strong>in</strong>i, D., Massai, R., Bonari, E. 2011. Greenhouse gas emissions <strong>in</strong> the agricultural phase of<br />
w<strong>in</strong>e production <strong>in</strong> the Maremma rural district <strong>in</strong> Tuscany, Italy. Ita. J. Agron. 6, 93-100.<br />
Brandão, M., Milà i Canals, L., Clift, R., 2011. Soil organic carbon changes <strong>in</strong> the cultivation of energy crops: Implications for GHG<br />
balances and soil quality for use <strong>in</strong> <strong>LCA</strong>. Biomass Bioenerg. 35, 2323-2336.<br />
Brentrup, F., Kusters, J., Kuhlmann, H., Lammel, J. 2004. Environmental impact assessment of agricultural production systems us<strong>in</strong>g<br />
the life cycle assessment m<strong>et</strong>hodology: I. Theor<strong>et</strong>ical concept of a <strong>LCA</strong> m<strong>et</strong>hod tailored to crop production. Eur. J. Agron. 20,<br />
265-279.<br />
BSI (2011) PAS 2050:2011 - Specification for the assessment of the life cycle greenhouse gas emissions of goods and services. BSI<br />
British Standards, London.<br />
Cowell, S.J., Clift, R., 2000. A m<strong>et</strong>hodology for assess<strong>in</strong>g soil quantity and quality <strong>in</strong> life cycle assessment. J. Clean. Prod. 8, 321-<br />
331.<br />
Cowell, S.J., Clift, R. 1997. Impact assessment for <strong>LCA</strong>s <strong>in</strong>volv<strong>in</strong>g agricultural production Int. J. Life Cycle. Ass. 2, 99-103.<br />
Culley, J.L.B. 1993. Density and compressibility. In: M.R. Carter (Ed.), Soil Sampl<strong>in</strong>g and M<strong>et</strong>hods of Analysis, Louis Publisher,<br />
CRC, Boca Raton, FL, pp. 529–539.<br />
Di Bene, C., Tavar<strong>in</strong>i, S., Mazzonc<strong>in</strong>i, M., Angel<strong>in</strong>i, L.G., 2011. Changes <strong>in</strong> soil chemical param<strong>et</strong>ers and organic matter balance<br />
after 13 years of ramie [Boehmeria nivea (L.) Gaud.] cultivation <strong>in</strong> the Mediterranean region. Eur. J. Agron. 35, 154-163.<br />
GaBi5 (<strong>2012</strong>). GaBi 5 software. http://gabi-software.com<br />
Gazulla C., Raugei M., Fullana-i-Palmer P., 2010. Tak<strong>in</strong>g a life cycle look at crianza w<strong>in</strong>e production <strong>in</strong> Spa<strong>in</strong>: where are the bottlenecks?<br />
Int. J. <strong>LCA</strong> 15, 330-337.<br />
Hén<strong>in</strong>, S., Dupuis, M., 1945. Essai de bilan de la matière organique du sol. Ann. Agron. 15, 17–19.<br />
Hillier, J., Whittaker, C., Dailey, G., Aylott, M., Casella, E., Richter, G., Riche, A., Murphy, R., Taylor, G., Smith, P. 2009. Greenhouse<br />
gas emissions from four bioenergy crops <strong>in</strong> England and Wales: Integrat<strong>in</strong>g spatial estimates of yield and soil carbon balance<br />
<strong>in</strong> life cycle analyses. GCB Bioenergy 1, 267-281.<br />
IPCC, 2006. Prepared by the National Greenhouse Gas Inventories Programme. In: Eggleston HS, Buendia L, Miwa K, Ngara T,<br />
Tanabe K. (eds): IPCC guidel<strong>in</strong>es for national greenhouse gas <strong>in</strong>ventories. IGES, Japan.<br />
Lal, R. 2004. Soil carbon sequestration impacts on global climate change and food security. Science 304, 1623-1627.<br />
Mary, B., Guérif, J. 1994. Intérêts <strong>et</strong> limites des modèles de prevision de l’évolution des matières organiques <strong>et</strong> de l’azote dans le sol.<br />
Cah. Agric. 3, 247–257.<br />
Meisterl<strong>in</strong>g, K., Samaras, C., Schweizer, V. 2009. Decisions to reduce greenhouse gases from agriculture and product transport: <strong>LCA</strong><br />
case study of organic and conventional wheat. J. Clean. Prod. 17, 222-230.<br />
Milà I Canals, L., Burnip, G.M., Cowell, S.J. 2006. Evaluation of the environmental impacts of apple production us<strong>in</strong>g Life Cycle<br />
Assessment (<strong>LCA</strong>): Case study <strong>in</strong> New Zealand. Agr. Ecosyst. Environ. 114, 226-238.<br />
Milà i Canals, L., Romanya, J., Cowell, S., 2007. M<strong>et</strong>hod for assess<strong>in</strong>g impacts on life support functions (LSF) related to the use of<br />
“fertile land” <strong>in</strong> Life Cycle Assessment (<strong>LCA</strong>). J. Clean. Prod. 15, 1426-1440.<br />
Mourad, A.L., Coltro, L., Oliveira, P.A.P.L.V., Kl<strong>et</strong>ecke, R.M., Badd<strong>in</strong>i, J.P.O. 2007. A simple m<strong>et</strong>hodology for elaborat<strong>in</strong>g the life<br />
cycle <strong>in</strong>ventory of agricultural products. Int. J. <strong>LCA</strong> 12, 408-413.<br />
Muñoz, I., Campra, P., Fernández-Alba, A.R. 2010. Includ<strong>in</strong>g CO2-emission equivalence of changes <strong>in</strong> land surface albedo <strong>in</strong> life<br />
cycle assessment. M<strong>et</strong>hodology and case study on greenhouse agriculture. Int. J <strong>LCA</strong> 15, 672-681.<br />
Nelson, D.W., Sommers. L.E. 1982. Total carbon, organic carbon and organic matter, <strong>in</strong>: Page, A.L., Miller, R.H., Keeney, D.R.<br />
(Eds.), M<strong>et</strong>hods of Soil Analysis, Part 2, Chemical and microbiological properties, Second edition. Agronomy Monograph 9,<br />
American Soci<strong>et</strong>y of Agronomy, Madison, WI, pp. 539-579.<br />
Nemecek, T., Erz<strong>in</strong>ger, S. 2005. Modell<strong>in</strong>g Representative Life Cycle Inventories for Swiss Arable Crops. Int. J. <strong>LCA</strong> 10, 1-9.<br />
Nemecek, T., Dubois, D., Huguen<strong>in</strong>-Elie, O., Gaillard, G. 2011. Life cycle assessment of Swiss farm<strong>in</strong>g systems: I. Integrated and<br />
organic farm<strong>in</strong>g. Agr. Syst. 104, 217-232.<br />
Notarnicola B, Tassielli G, Nicol<strong>et</strong>ti M (2003). <strong>LCA</strong> of w<strong>in</strong>e production. In: Mattsonn B., Sonesson U. (eds): Environmentallyfriendly<br />
food process<strong>in</strong>g, pp. 306-326, Woodhead-Publish<strong>in</strong>g and CRC Press, Cambridge-England, Boca Raton-USA.<br />
Parat, C., Chaussod, R., Leveque, J., Douss<strong>et</strong>, S., Andreux, F. 2002. The relationship b<strong>et</strong>ween copper accumulation <strong>in</strong> v<strong>in</strong>eyard<br />
calcareous soils and soil organic matter and iron. Eur. J. Soil Sci. 53, 663-669.<br />
532
PARALLEL SESSION 6B: FISHIERIES, SOIL, AND EMERGY METHODS 8 th Int. Conference on <strong>LCA</strong> <strong>in</strong> the<br />
Agri-<strong>Food</strong> Sector, 1-4 Oct <strong>2012</strong><br />
Po<strong>in</strong>t E.V. 2008. Life cycle environmental impacts of w<strong>in</strong>e production and consumption <strong>in</strong> Nova Scotia. MSc Thesis, Dalhousie<br />
University Halifax, Nova Scotia, Canada.<br />
Ponsioen, T.C., Blonk, T.J. <strong>2012</strong>. Calculat<strong>in</strong>g land use change <strong>in</strong> carbon footpr<strong>in</strong>ts of agricultural products as an impact of current<br />
land use. J. Clean. Prod. 28, 120-126.<br />
Reap, J., Roman, F., Duncan, S., Bras, B. 2008. A survey of unresolved problems <strong>in</strong> life cycle assessment. Int. J. <strong>LCA</strong> 13, 374-388.<br />
Roy, P., Nei, D., Orikasa, T., Xu, Q., Okadome, H., Nakamura, N., Shi<strong>in</strong>a, T. 2009. A review of life cycle assessment (<strong>LCA</strong>) on<br />
some food products. J. <strong>Food</strong> Eng. 90, 1-10.<br />
Saad R., Margni M., Koellner T., Wittstock B. and Deschênes L. 2011. Assessment of land use impacts on soil ecological functions:<br />
development of spatially differentiated characterization factors with<strong>in</strong> a Canadian context. Int. J. <strong>LCA</strong>, 16, 198-211.<br />
Smith, P., Mart<strong>in</strong>o, D., Cai, Z., Gwary, D., Janzen, H., Kumar, P., McCarl, B., Ogle, S., O'Mara, F., Rice, C., Scholes, B., Sirotenko,<br />
O., Howden, M., McAllister, T., Pan, G., Romanenkov, V., Schneider, U., Towprayoon, S., Wattenbach, M., Smith, J. 2008.<br />
Greenhouse gas mitigation <strong>in</strong> agriculture. Philos. T. Roy. Soc. B. 363, 789-813.<br />
Sofo, A., Nuzzo, V., Palese, A.M., Xiloyannis, C., Celano, G., Zukowskyj, P., Dichio, B. 2005. N<strong>et</strong> CO2 storage <strong>in</strong> Mediterranean<br />
olive and peach orchards. Sci. Hortic. 107, 17-24.<br />
Steenwerth, K., Bel<strong>in</strong>a, K.M. 2008. Cover crops enhance soil organic matter, carbon dynamics and microbiological function <strong>in</strong> a<br />
v<strong>in</strong>eyard agroecosystem. Appl. Soil Ecol. 40, 359-369.<br />
WRI/WBCSD, 2004. The Greenhouse Gas Protocol; a Report<strong>in</strong>g and Account<strong>in</strong>g Standard. World Resources Institute and World<br />
Bus<strong>in</strong>ess Council for Susta<strong>in</strong>able Development.<br />
533
PARALLEL SESSION 6B: FISHIERIES, SOIL, AND EMERGY METHODS 8 th Int. Conference on <strong>LCA</strong> <strong>in</strong> the<br />
Agri-<strong>Food</strong> Sector, 1-4 Oct <strong>2012</strong><br />
534<br />
Life cycle assessment and eMergy application to the comparison<br />
b<strong>et</strong>ween organic and conventional productions<br />
Elena Neri 1,* , <strong>France</strong>sca Ross<strong>et</strong>ti 1 , Bened<strong>et</strong>to Rugani 2 , Federico M. Pulselli 3 , Valent<strong>in</strong>a Niccolucci 3 , Simone<br />
Bastianoni 1 , Nadia March<strong>et</strong>t<strong>in</strong>i 3<br />
1 Ecodynamics Group, Dipartimento di Chimica, Università degli Studi di Siena, via A. Moro, 2 – 53100 Siena - Italy<br />
2 Public Research Centre Henri Tudor (CRPHT) / Resource Centre for Environmental Technologies (CRTE) - 66, rue de Luxembourg,<br />
P.B. 144, L-4002, Esch-sur-Alz<strong>et</strong>te, Luxembourg<br />
3 Ecodynamics Group, Dipartimento di Chimica, Università degli Studi di Siena, via della Diana, 2A – 53100 Siena, Italy<br />
* Correspond<strong>in</strong>g author. E-mail: elena.neri@unisi.it<br />
ABSTRACT<br />
The present study proposes the parallel application of <strong>LCA</strong> and EMergy Evaluation (EME) to compare w<strong>in</strong>e and olive oil production<br />
systems accord<strong>in</strong>g to different agricultural management practices: conventional vs. organic. The purpose is to contribute to the research<br />
question on wh<strong>et</strong>her and how organic products constitute effectively a b<strong>et</strong>ter choice both for consumers and producers <strong>in</strong><br />
terms of environmental load<strong>in</strong>gs. The parallel application of EME and <strong>LCA</strong> represents a strategic tool for a comprehensive <strong>in</strong>terpr<strong>et</strong>ation<br />
of the issue under discussion. <strong>LCA</strong> outl<strong>in</strong>es that major impacts, for both w<strong>in</strong>e managements, are related to the packag<strong>in</strong>g phase<br />
(average 50%), while the most d<strong>et</strong>rimental phase <strong>in</strong> both olive oil productions is represented by the agricultural phase (average 60%).<br />
In both case conventional productions show higher impact values. EME outl<strong>in</strong>es much larger <strong>in</strong>tensive use of resources to produce a<br />
bottle of conventional w<strong>in</strong>e and olive oil, highlight<strong>in</strong>g the importance of local resources valorization and renewability of different<br />
production managements<br />
Keywords: <strong>LCA</strong>, eMergy, conventional agriculture, organic agriculture, olive oil, w<strong>in</strong>e.<br />
1. Introduction<br />
Organic productions aim at provid<strong>in</strong>g consumers with fresh and genu<strong>in</strong>e products obta<strong>in</strong>ed through traditional<br />
agricultural managements, which usually avoid the use of synth<strong>et</strong>ic fertilisers and rely on a wise consumption<br />
of resources and on the respect of natural cycles and pest controls, on crop rotations and green<br />
manure applications. However, discussions upon the different level of environmental susta<strong>in</strong>ability b<strong>et</strong>ween<br />
organic and conventional farms are still open. Can the management of a farm, by means of organic practices,<br />
actually guarantee its susta<strong>in</strong>ability? The parallel application of two environmental account<strong>in</strong>g m<strong>et</strong>hodologies,<br />
i.e. <strong>LCA</strong> and EMergy Evaluation (EME), may represent a valid approach to obta<strong>in</strong> comprehensive outcomes<br />
and answers upon that issue, s<strong>in</strong>ce <strong>LCA</strong> and EME have complementary features when assess<strong>in</strong>g the<br />
overall environmental impacts of the whole production cha<strong>in</strong> (Rugani <strong>et</strong> al., 2009). The aim of this paper is<br />
to apply <strong>LCA</strong> and EME to w<strong>in</strong>e and olive oil from Tuscany (Italy), which are typical products of this region.<br />
Two types of agro-<strong>in</strong>dustrial productive managements, i.e. organic and conventional, are compared for these<br />
products <strong>in</strong> order to evaluate the differences <strong>in</strong> terms of environmental performance. Indeed, the proposed<br />
approach fits arguably <strong>in</strong> the current grow<strong>in</strong>g <strong>in</strong>terest towards the improvement of environmental performances<br />
of agri-food products such as w<strong>in</strong>e and olive oil, as recent studies demonstrate. Concern<strong>in</strong>g olive oil<br />
productions several works approach the energ<strong>et</strong>ic and resource-oriented question (Guzman <strong>et</strong> al., 2008;<br />
Avraamides <strong>et</strong> al., 2008; De Gennaro <strong>et</strong> al., <strong>2012</strong>). Otherwise Salomone <strong>et</strong> al., (<strong>2012</strong>) highlighted that, <strong>in</strong><br />
order to understand and properly manage local food-supply cha<strong>in</strong>s <strong>in</strong> a susta<strong>in</strong>able manner, more specific<br />
cha<strong>in</strong>-focused and regional-focused <strong>LCA</strong> studies <strong>in</strong> the olive oil <strong>in</strong>dustry are needed. Concern<strong>in</strong>g w<strong>in</strong>e productions,<br />
the <strong>in</strong>troduction of the life cycle th<strong>in</strong>k<strong>in</strong>g is becom<strong>in</strong>g more and more common, as the grow<strong>in</strong>g<br />
number of works shows (e.g. Notarnicola <strong>et</strong> al., 2003; Ardente <strong>et</strong> al., 2006; P<strong>et</strong>ti <strong>et</strong> al., 2006; Po<strong>in</strong>t <strong>et</strong> al.,<br />
<strong>2012</strong>, Rugani <strong>et</strong> al., 2009; Vázquez-Rowe, <strong>2012</strong>).<br />
2. M<strong>et</strong>hods<br />
2.1 <strong>LCA</strong> and eMergy<br />
For the two farms of w<strong>in</strong>e and olive oil production, the <strong>LCA</strong> was conducted from cradle to gate (where<br />
gate is the bottl<strong>in</strong>g phase). The functional units were 1 L of bottled w<strong>in</strong>e and 1 kg of bottled oil. LCI data<br />
were elaborated by means of the software SimaPro 7.3 and us<strong>in</strong>g the Eco<strong>in</strong>vent database as background datas<strong>et</strong>,<br />
while the LCIA characterisation phase was d<strong>et</strong>erm<strong>in</strong>ed us<strong>in</strong>g the CML 2 Basel<strong>in</strong>e M<strong>et</strong>hod 2001 (Gu<strong>in</strong>ée<br />
<strong>et</strong> al., 2002). In order to be consistent with the aim of the present work, only impact categories strictly connected<br />
with the evaluation of environment impacts of the two productive processes were selected: Acidification<br />
(AP), Eutrophication (EP), Global Warm<strong>in</strong>g (GWP100), and Photochemical Oxidation (POP) potentials.<br />
The other m<strong>et</strong>hod used for the compared analysis was eMergy, that is “...the quantity of solar energy neces-
PARALLEL SESSION 6B: FISHIERIES, SOIL, AND EMERGY METHODS 8 th Int. Conference on <strong>LCA</strong> <strong>in</strong> the<br />
Agri-<strong>Food</strong> Sector, 1-4 Oct <strong>2012</strong><br />
sary directly or <strong>in</strong>directly to obta<strong>in</strong> a certa<strong>in</strong> good or service.” (Odum, 1996). In eMergy, the term Unit<br />
Emergy Value (UEV) (i.e. usually named trasformity,<strong>in</strong> seJ/J, or specific eMergy, <strong>in</strong> seJ/g), def<strong>in</strong>es the<br />
eMergy necessary to obta<strong>in</strong> one unit of product or service (Odum, 1996), represent<strong>in</strong>g the coefficient through<br />
which different types of energy are converted to solar energy. Every biotic and abiotic resource <strong>in</strong> the geobiosphere<br />
can be evaluated <strong>in</strong> eMergy terms and can be accounted for with<strong>in</strong> the system’s output. Emergy<br />
can be considered as an “energy memory”, i.e. a memory of all solar energy necessary to support a def<strong>in</strong>ed<br />
system, consider<strong>in</strong>g the environmental work required previously for the production. In eMergy every life<br />
cycle <strong>in</strong>put to the system is multiplied by the correspond<strong>in</strong>g UEV and the result<strong>in</strong>g eMergy flows are added<br />
to obta<strong>in</strong> the total eMergy flow of the output. This last value is divided by the product of the considered<br />
process (i.e. annual quantity of olive oil and w<strong>in</strong>e per hectare here) to obta<strong>in</strong> its UEV, which <strong>in</strong> the classical<br />
eMergy m<strong>et</strong>hod is considered as an environmental performance’s <strong>in</strong>dex for comparison of products: the<br />
higher the UEV, the higher is the equivalent solar energy demand per unit of product and thus lower is the<br />
life-cycle resource consumption’s efficiency to generate that product. This study refers to the 9.26E+24 sej/J<br />
basel<strong>in</strong>e (Campbell, 2000).<br />
2.3 Case studies: w<strong>in</strong>e and olive oil productions<br />
The selected farms are all located <strong>in</strong> the centre of Tuscany. The organic w<strong>in</strong>e farm (hereafter OW) had a<br />
v<strong>in</strong>eyard of 10 ha and an average production of 3500L/ha per year (Chianti Colli Senesi w<strong>in</strong>e). The conventional<br />
w<strong>in</strong>ery (hereafter CW) presented a semi-<strong>in</strong>dustrial management that covered an area of 120 ha and<br />
produced about 2200 L/ha of w<strong>in</strong>e per year (Nobile di Montepulciano CGOD w<strong>in</strong>e). CW presented a lower<br />
yield <strong>in</strong> w<strong>in</strong>e production because of a rigorous selection of grapes; <strong>in</strong> fact, <strong>in</strong> order to improve the quality of<br />
the f<strong>in</strong>al product, only half of all the grapes harvested by CW are generally suitable for w<strong>in</strong>e production. The<br />
two farms were selected because of the same price of the w<strong>in</strong>e bottle at the mark<strong>et</strong>. For both farms the production<br />
cha<strong>in</strong> can be divided <strong>in</strong> three phases: plant<strong>in</strong>g and production (Phase 1), w<strong>in</strong>e-mak<strong>in</strong>g and storage<br />
(Phase 2) and bottl<strong>in</strong>g (Phase 3). Concern<strong>in</strong>g olive oil production, the organic farm (hereafter OO) extended<br />
for 4 ha, while the annual average yield of olives was 1500 kg/ha with annual production of 250 kg of oil.<br />
With regard to the conventional farm (hereafter CO), olive cultivation extended for 20 ha, whereas the conduction<br />
was directed towards an <strong>in</strong>tensive production management, characterised by hard mechanisation and<br />
chemicals use. The annual mean production was 3820 kg/ha of olives, which are processed <strong>in</strong> 483 kg of oil<br />
per year (Protected Geographical Indication, PGI, quality). Similarly to w<strong>in</strong>e, these two farms were also selected<br />
because of the same price of one olive oil bottle at mark<strong>et</strong>. However, the olive oil production was divided<br />
<strong>in</strong>to two phases: agricultural phase (Phase 1) and oil mill phase, <strong>in</strong>clud<strong>in</strong>g bottl<strong>in</strong>g phase (Phase 2).<br />
Inventory data (the same used for <strong>LCA</strong> and EME) for both w<strong>in</strong>e and olive oil productions are showed <strong>in</strong> the<br />
third and fourth columns, respectively, of the correspond<strong>in</strong>g eMergy tables (see Tables 2 and 4).<br />
3. Results<br />
3.1. W<strong>in</strong>e <strong>LCA</strong> results<br />
The comparison of the impacts characterisation of the two w<strong>in</strong>e life cycles (Table 1) shows mean<strong>in</strong>gful<br />
differences, highlight<strong>in</strong>g that major values are connected to CW. The major departures were found for the<br />
packag<strong>in</strong>g phase for both managements (average 50% for the 4 impact categories), with the higher values<br />
recorded by the CW. Concern<strong>in</strong>g phase 1 (plant<strong>in</strong>g and production) and 2 (storage), the higher values are<br />
related to OW.<br />
Table 1. LCIA of conventional (CW) and organic (OW) w<strong>in</strong>e productions. Data reported for functional unit<br />
(1 L bottled w<strong>in</strong>e).<br />
Impact category unit conventional w<strong>in</strong>e (CW) organic w<strong>in</strong>e (OW)<br />
AP kg SO2 eq. 6,00E-03 4,00E-03<br />
EP kg PO4 eq. 9,80E-04 6,40E-04<br />
GWP100 kg CO2 eq. 7,30E-01 4,80E-01<br />
POP kg C2H4 eq. 2,40E-04 1,50E-04<br />
535
PARALLEL SESSION 6B: FISHIERIES, SOIL, AND EMERGY METHODS 8 th Int. Conference on <strong>LCA</strong> <strong>in</strong> the<br />
Agri-<strong>Food</strong> Sector, 1-4 Oct <strong>2012</strong><br />
3.2 W<strong>in</strong>e eMergy results<br />
The EME output of the annual production was 9.25E+15 seJ/ha and 9.64E+15 seJ/ha for CW and OW,<br />
respectively (Table 2). However, the UEV (per bottle of w<strong>in</strong>e) of the CW is almost twice the UEV of the<br />
OW (i.e. 4.22E+12 seJ/bottle and 2.75E+12 seJ/bottle, respectively). In Table 2 <strong>in</strong>ventory data (columns 3,<br />
4) and f<strong>in</strong>al calculation results are shown, divided for local resources, agricultural phase, process<strong>in</strong>g phase<br />
and human labour.<br />
Table 2. Emergy flows and UEVs for conventional (CW) and organic (OW) w<strong>in</strong>e productions. Square<br />
brack<strong>et</strong>=references for UEV; Type of <strong>in</strong>put: R= local renewable resources, N= local non-renewable<br />
resources, F=non-local purchased <strong>in</strong>puts.<br />
3.3 Olive oil <strong>LCA</strong> results<br />
Table 3 shows the LCIA comparison b<strong>et</strong>ween the two production systems: likewise for w<strong>in</strong>e, the CO presents<br />
the higher impacts, while regard<strong>in</strong>g s<strong>in</strong>gle phases, the agricultural phase (phase 1) presents higher impact<br />
values both for OO and CO.<br />
Table 3. LCIA of organic and conventional olive oil productions. Data reported for functional unit (1 kg<br />
bottled olive oil).<br />
3.4 Olive oil eMergy results<br />
EME output is 2.50E+16 sej/ha/yr and 9.35E+15 sej/ha/yr as total eMergy flows and 5.18E+13 seJ/bottle<br />
and 3.74E+13 seJ/bottle as UEVs for CO and OO, respectively. In Table 4 <strong>in</strong>ventory data (columns 3, 4) and<br />
f<strong>in</strong>al calculation results are shown, divided by local resources, agricultural phase, process<strong>in</strong>g phase and human<br />
labour.<br />
536<br />
Emergy Fluxes (sej/ha/yr)<br />
Input Units Quantity/yr (CW) Quantity/yr (OW) Ref. UEV TYPE OF INPUT CONVENTIONAL WINE (CW) ORGANIC WINE (OW)<br />
LOCAL RESOURCES<br />
sunlight J 8,49E+11 8,49E+11 [1] R 8,49E+11 8,49E+11<br />
ra<strong>in</strong> g 1,67E+08 1,67E+08 [2] R 1,40E+13 1,40E+13<br />
geothermal heat J 7,16E+08 7,16E+08 [2] R 4,98E+12 4,98E+12<br />
loss of topsoil J 1,03E+08 1,03E+08 [3] N 7,45E+12 7,45E+12<br />
PHASE 1<br />
fertilizer g 1.21E+05 [3] F 1,98E+15<br />
diesel J 9,92E+09 1,75E+10 [5] F 6,53E+14 1,15E+15<br />
mach<strong>in</strong>ery g 7,74E+03 1,68E+04 [7] F 5,08E+13 1,03E+14<br />
wood g 6,02E+05 3,73E+05 [7] 50%R; 50%F 2,06E+10 1,28E+10<br />
pesticides g 1,04E+04 5,74E+04 [3] F 1,51E+14 8,32E+14<br />
concr<strong>et</strong>e g 3,57E+04 [12] F 6,35E+13<br />
PHASE 2<br />
water g 3,26E+05 9,72E+07 [8] F 5,70E+11 1,70E+14<br />
electricity J 8,67E+07 2,67E+08 [4] F 1,03E+13 3,17E+13<br />
chemicals g 5,71E+02 3,50E+01 [3] F 8,28E+12 1,30E+13<br />
mach<strong>in</strong>ery g 3,07E+04 3,89E+04 [7] F 2,01E+14 2,30E+14<br />
PHASE 3<br />
glass g 1,78E+06 1,87E+06 [10] F 5,49E+15 5,79E+15<br />
cork g 3,02E+04 4,83E+04 [10] F 4,49E+13 7,19E+13<br />
paper g 8,58E+03 1,37E+04 [11] F 4,25E+13 6,78E+13<br />
glue g 8,92E+02 1,43E+03 [10] F 8,83E+12 1,42E+13<br />
alum<strong>in</strong>ium g 4,49E+03 7,19E+03 [10] F 2,65E+13 4,25E+13<br />
mach<strong>in</strong>ery g 2,10E+03 6,13E+03 [7] F 1,38E+13 3,62E+13<br />
electricity J 1,89E+08 [4] F 2,25E+13<br />
diesel J 1,01E+09 [5] F 6,65E+13<br />
HUMAN LABOUR h 1,73E+02 3,16E+02 [6] 10%R; 90%F 5,10E+14 9,33E+14<br />
TOTAL 9,25E+15 9,64E+15<br />
WINE (sej/g) g 2,19E+06 3,50E+06 4,22E+09 2,75E+09<br />
WINE (sej/BOTTLE OF WINE) 4,22E+12 2,75E+12<br />
Impact category unit conventional oil (CO)organic oil (OO)<br />
AP kg SO2 eq. 2,10E-01 6,00E-02<br />
EP kg PO4 eq. 7,00E-01 1,00E-02<br />
GWP100 kg CO2 eq. 2,64E+01 9,64E+00<br />
POP kg C2H4 eq. 1,20E-02 2,00E-03<br />
Literature references for UEV<br />
[1] Odum H.T., 1996.<br />
[2] Odum H.T.,<strong>et</strong> al. 2000.<br />
[3] Brandt-Williams S. L., 2002.<br />
[4] Tiezzi E. <strong>et</strong> al., 2001.<br />
[5] Bastianoni S. <strong>et</strong> al., 2009<br />
[6] Pulselli, R.M., <strong>et</strong> al., 2008.<br />
[7] Brown M.T., Bardi E., 2001.<br />
[8] Pulselli F. M.,<strong>et</strong> al., 2011.<br />
[9] Campbell D.E. <strong>et</strong> al. 2002.<br />
[10] Buranakarn, V. 1998.<br />
[11] Tilley, D.R., 1999.<br />
[12] Pulselli, R.M., <strong>et</strong> al., 2007.
PARALLEL SESSION 6B: FISHIERIES, SOIL, AND EMERGY METHODS 8 th Int. Conference on <strong>LCA</strong> <strong>in</strong> the<br />
Agri-<strong>Food</strong> Sector, 1-4 Oct <strong>2012</strong><br />
Table 4. Emergy flows and UEVs for conventional and organic oil productions. Square brack<strong>et</strong>=references<br />
for UEV; Type of <strong>in</strong>put: R= local renewable resources, N= local non-renewable resources, F= non-local<br />
purchased <strong>in</strong>puts.<br />
Emergy Fluxes (sej/ha/yr)<br />
Input Units Quantity/yr (CO) Quantity/yr (OO) Ref. UEV TYPE OF INPUT CONVENTIONAL OIL (CO) ORGANIC OIL (OO)<br />
LOCAL RESOURCES<br />
sunlight J 5,25E+13 5,25E+13 [1] R 5,25E+13 5,25E+13<br />
ra<strong>in</strong> g 7,90E+09 7,90E+09 [2] R 6,64E+14 6,64E+14<br />
geothermal heat J 3,15E+10 3,06E+10 [2] R 2,19E+14 2,13E+14<br />
loss of topsoil J 2,77E+09 2,77E+09 [3] N 2,00E+14 2,00E+14<br />
PHASE 1<br />
diesel J 3,07E+09 3,74E+10 [5] F 2,02E+14 2,46E+15<br />
fertilizer g 3,80E+05 7,40E+02 [3] F 6,23E+15 1,75E+13<br />
mach<strong>in</strong>ery g 5,23E+04 8,85E+04 [7] F 3,43E+14 5,81E+14<br />
water g 1,65E+08 1,27E+08 [8] F 2,89E+14 2,22E+14<br />
plastc, tyre g 2,43E+04 8,97E+04 [9] F 6,59E+13 2,43E+14<br />
pesticides g 9,17E+05 2,00E+04 [3] F 1,33E+16 2,90E+14<br />
electricity J 8,25E+09 6,00E+09 [4] F 9,81E+14 7,13E+14<br />
PHASE 2<br />
mach<strong>in</strong>ery g 1,54E+04 3,00E+04 [7] F 8,98E+13 1,91E+14<br />
diesel J 4,78E+08 4,78E+08 [5] F 3,14E+13 3,14E+13<br />
water g 2,27E+06 1,18E+06 [8] F 3,97E+12 2,07E+12<br />
electricity J 9,35E+08 4,84E+08 [4] F 1,11E+14 5,75E+13<br />
plastc, tyre g 4,88E+03 2,38E+04 [9] F 1,32E+13 6,45E+13<br />
glass g 6,53E+05 3,37E+05 [10] F 2,02E+15 1,04E+15<br />
HUMAN LABOUR h 8,50E+01 7,95E+02 [6] 10%R 90%F 2,51E+14 2,35E+15<br />
TOTAL 2,50E+16 9,35E+15<br />
OIL (sej/g) g 4,83E+05 2,50E+05 5,18E+10 3,74E+10<br />
OIL (sej/BOTTLE OF OIL) 5,18E+13 3,74E+13<br />
4. Discussion<br />
4.1 <strong>LCA</strong>-EME of w<strong>in</strong>e productions<br />
Literature references for UEV<br />
[1] Odum H.T., 1996.<br />
[2] Odum H.T.,<strong>et</strong> al. 2000.<br />
[3] Brandt-Williams S. L., 2002.<br />
[4] Tiezzi E. <strong>et</strong> al., 2001.<br />
[5] Bastianoni S. <strong>et</strong> al., 2009<br />
[6] Pulselli, R.M., <strong>et</strong> al., 2008.<br />
[7] Brown M.T., Bardi E., 2001.<br />
[8] Pulselli F. M.,<strong>et</strong> al., 2011.<br />
[9] Campbell D.E. <strong>et</strong> al. 2002.<br />
[10] Buranakarn, V. 1998.<br />
[11] Tilley, D.R., 1999.<br />
[12] Pulselli, R.M., <strong>et</strong> al., 2007.<br />
In w<strong>in</strong>e productions, the packag<strong>in</strong>g phase (phase 3) presents major impacts both for the production systems<br />
analysed, due to the use of glass. Impact values related to CW are higher than those of the OW (Table<br />
1) pr<strong>in</strong>cipally because the conventional system considered <strong>in</strong> this work used heavy and non-recycled glass.<br />
In contrast, the organic farm, thanks to the use of a lighter type of glass for bottles, as imposed by the European<br />
guidel<strong>in</strong>es for organic productions, can reduce impacts related to this phase. These results are <strong>in</strong> accordance<br />
with Kavargiris <strong>et</strong> al., (2009) on the organic vs. conventional w<strong>in</strong>e. Inputs l<strong>in</strong>ked to phase 1 and 2 are<br />
higher <strong>in</strong> the organic farm. CW uses chemical pesticides, effective at lower doses but with higher impact<br />
values. On the contrary, OW uses conventional sulphur and copper based pesticides, which are less effective<br />
and have to be used <strong>in</strong> higher quantities. Moreover, the CW <strong>in</strong> this study uses modern mach<strong>in</strong>eries, while <strong>in</strong><br />
the OW case most of the work is done by hand, but the mechanisation, even if highly reduced, is quite old<br />
and less efficient.<br />
EME results highlight highest values for OW’s total eMergy flow, while CW presents highest value of<br />
UEV (Table 2). It means that CW has much larger <strong>in</strong>tensive use of resources per bottle of product. This difference<br />
is due to the lower w<strong>in</strong>e productivity of CW because of the rigorous selection of grapes. OW utilises<br />
more resources than CW: less efficient mach<strong>in</strong>eries, non-synth<strong>et</strong>ic chemicals and all what concerns storage<br />
and bottl<strong>in</strong>g phase (more materials are necessary to have a higher quantity of w<strong>in</strong>e). Furthermore, the total<br />
eMergy flow is higher for the organic production pr<strong>in</strong>cipally due to the higher annual human labour and consumption<br />
of diesel per hectare. Results related to eMergy flows grouped <strong>in</strong>to macro-categories (Fig. 1) highlight<br />
how <strong>in</strong>puts are split and their weight on total eMergy flow (see the caption of Fig.1 for characteristics<br />
of each group). The category “other materials” (materials for the bottl<strong>in</strong>g phase) represents the highest percent<br />
of total eMergy flow for CW and OW respectively. While CW presents “chemical and fertilisers” as the<br />
second higher macro-category, OW presents energy contributions (diesel and electricity consumption). The<br />
slightly higher value of “human labour” <strong>in</strong> OW is because most of the work is done by hand. “Natural resources”<br />
represent less than 1% of total flows for both the two farms (not shown <strong>in</strong> the figure below).<br />
537
PARALLEL SESSION 6B: FISHIERIES, SOIL, AND EMERGY METHODS 8 th Int. Conference on <strong>LCA</strong> <strong>in</strong> the<br />
Agri-<strong>Food</strong> Sector, 1-4 Oct <strong>2012</strong><br />
(a) CONVENTIONAL WINE (CW)<br />
other<br />
materials<br />
61%<br />
Figure 1. Emergy flows of conventional (a) and organic (b) w<strong>in</strong>e production grouped for macro-categories:<br />
chemicals and fertilisers= pesticides, fertilisers and chemicals for fermentation; human labour; natural resources=<br />
ra<strong>in</strong> and geo-heat; loss of topsoil; energy= diesel and electricity; other materials= glass, cork, paper,<br />
glue; water; mach<strong>in</strong>ery= steel, iron, alum<strong>in</strong>ium <strong>in</strong>volved <strong>in</strong> farm operations, transports and process<strong>in</strong>g.<br />
By summ<strong>in</strong>g different type of resources (R, N and F) (Table 2), both conventional and organic farms show<br />
the use of 1% renewable resources. Emergy flows are divided <strong>in</strong> four parts (Table 2). Results highlight highest<br />
values for “phase 3” both <strong>in</strong> CW (61.11%) and OW (63.13%), followed by “phase 1” (30.70% for CW<br />
and 22.30% for OW), “human labour”, “phase 2” and “local resources”. The “packag<strong>in</strong>g phase” (phase 3)<br />
has bigger relevance because of the higher materials use.<br />
4.2 <strong>LCA</strong>-EME of olive oil productions<br />
chemicals and<br />
fertilizers<br />
23%<br />
mach<strong>in</strong>ery<br />
3%<br />
human labour<br />
6%<br />
energy<br />
7%<br />
Concern<strong>in</strong>g <strong>LCA</strong> results of the olive oil productions, data demonstrate that the major impacts are associated<br />
to the conventional system (Table 3). Compar<strong>in</strong>g the systems by phases, both productions are characterised<br />
by higher values related to the agricultural phase. In OO, impacts connected to phase 1 are basically due<br />
to the higher fuel consumptions, which depend from old and less efficient mach<strong>in</strong>eries, while <strong>in</strong> CO the use<br />
of chemicals represents the major impact of phase 1. These data agree with literature results derived from<br />
olive oil <strong>LCA</strong> studies (e.g. Fiore <strong>et</strong> al., 2009). In the packag<strong>in</strong>g phase the glass is once more the ma<strong>in</strong> impact<br />
for both the systems; moreover, <strong>in</strong> our case studies, all farms use heavy glass bottles. Regard<strong>in</strong>g EME, the<br />
higher environmental performances are explicitly obta<strong>in</strong>ed by apply<strong>in</strong>g organic practices because of the<br />
lower use of chemicals, which extremely reduces the <strong>in</strong>direct contribution of solar energy provision (Table<br />
4). While CO presents an <strong>in</strong>tensive use of resources (e.g. fertiliser, pesticides, electricity). The difference<br />
b<strong>et</strong>ween CO and OO values is reduced <strong>in</strong> the UEVs because of the less oil yield (productivity) <strong>in</strong> organic<br />
farm (CO=483 kg/ha/yr vs. OO=250 kg/ha/yr). Fig. 2 shows all eMergy flows grouped <strong>in</strong>to macro-categories<br />
(see the caption of Fig.2 for characteristics of each group). In CO the higher contribution is related to<br />
“chemicals and fertilisers”, followed by “other materials” and “energy”. Other macro-categories have values<br />
lower than 5%. Instead, OO presents a less homogeneous distribution of macro-categories: “energy” and<br />
“human labour” represent ma<strong>in</strong> flows, followed by “mach<strong>in</strong>ery” and “other materials”. “Natural resources”<br />
consists of 10% of flows, a high percent <strong>in</strong> respect to CO. It is important to remark that mach<strong>in</strong>ery used <strong>in</strong><br />
organic farm are aged (and less efficient).<br />
other<br />
materials<br />
mach<strong>in</strong>ery 8%<br />
2%<br />
energy<br />
5%<br />
loss of topsoil<br />
1%<br />
natural<br />
resources<br />
4%<br />
human labour<br />
1%<br />
(a) CONVENTIONAL OIL (CO)<br />
water<br />
1%<br />
chemicals and<br />
fertilizers<br />
78%<br />
other<br />
materials<br />
11%<br />
mach<strong>in</strong>ery<br />
12%<br />
(b) ORGANIC WINE (OW)<br />
other<br />
materials<br />
63%<br />
Figure 2. Emergy flows of conventional (a) and organic (b) oil production grouped for macro-categories:<br />
chemicals and fertilisers= pesticides and fertilisers; human labour; natural resources= ra<strong>in</strong> and geo-heat; loss<br />
of topsoil; energy= diesel and electricity; other materials= glass; water; mach<strong>in</strong>ery= steel, iron, alum<strong>in</strong>ium,<br />
cast iron <strong>in</strong>volved <strong>in</strong> farm operations, transports and olive process<strong>in</strong>g.<br />
By summ<strong>in</strong>g different types of resource (R, N and F) (Table 4), the CO highlights the use of 4% renewable<br />
resources, while OO 12%. By gather<strong>in</strong>g eMergy flows <strong>in</strong> four parts (Table 4), the agricultural phase<br />
538<br />
water<br />
2%<br />
energy<br />
13%<br />
human<br />
labour<br />
25%<br />
water<br />
2%<br />
chemicals and<br />
fertilizers<br />
9%<br />
mach<strong>in</strong>ery<br />
4%<br />
(b) ORGANIC OIL (OO)<br />
energy<br />
35%<br />
chemicals and<br />
fertilizers<br />
3%<br />
human labour<br />
9%<br />
natural<br />
resources<br />
10%<br />
loss of topsoil<br />
2%
PARALLEL SESSION 6B: FISHIERIES, SOIL, AND EMERGY METHODS 8 th Int. Conference on <strong>LCA</strong> <strong>in</strong> the<br />
Agri-<strong>Food</strong> Sector, 1-4 Oct <strong>2012</strong><br />
(phase 1) becomes the highest <strong>in</strong> both the two case studies. Indeed, it represented 85.59% of CO total flow<br />
(due to a large use of fertilisers and pesticides) and 48.49% of OO total flow (due to the use of obsol<strong>et</strong>e and<br />
less efficient mach<strong>in</strong>eries that leaded to high consumption of e.g. diesel, electricity). “Phase 2”, “local resources”<br />
and “human labour” have m<strong>in</strong>or importance on total CO eMergy flow (9.07%, 4.33% and 1% respectively).<br />
On the contrary, “human labour” represents the 25.10% of OO total eMergy, followed by “phase<br />
2” (14.88%) and “local resources” (11.53%).<br />
5. Conclusion<br />
The approach <strong>in</strong>troduced <strong>in</strong> the present study fits <strong>in</strong> the current grow<strong>in</strong>g <strong>in</strong>terest towards the improvement<br />
of environmental performances of agri-food products. Currently, the promotion of susta<strong>in</strong>ability is ga<strong>in</strong><strong>in</strong>g<br />
further significance and companies are becom<strong>in</strong>g more and more sensitive to the environment safeguard<strong>in</strong>g<br />
(e.g. develop<strong>in</strong>g eco-friendly products). This trend calls for <strong>in</strong>tegrated approaches concern<strong>in</strong>g assessments<br />
more concentrated on the overall production systems <strong>in</strong>stead of assessments focused on the s<strong>in</strong>gle processes<br />
of the life cycle. Thus, the m<strong>in</strong>imisation of environmental impacts by the mere use of cleaner production<br />
technologies is no more sufficient. This study, through the parallel application of <strong>LCA</strong> and EME, provides a<br />
large overview about the environmental susta<strong>in</strong>ability of farm management choices. Outcomes from the<br />
analysis agree with current literature f<strong>in</strong>d<strong>in</strong>gs and the comb<strong>in</strong>ation of these two different approaches can lead<br />
to more comprehensive and significant results, suitable for policy recommendations and improvement decisions.<br />
The added value of this study consisted <strong>in</strong> identify<strong>in</strong>g, through <strong>LCA</strong> results, weak po<strong>in</strong>ts <strong>in</strong> environmental<br />
terms and which process phases were improvable for the eco-profile of the f<strong>in</strong>al product, <strong>in</strong> addition<br />
to the importance of local resources valorisation and renewability of different production managements, as<br />
highlighted by EME. This approach po<strong>in</strong>ts out that not always organic conductions mean best environmental<br />
performances, efficiency and higher susta<strong>in</strong>ability. Obviously, a deeper analysis is necessary to b<strong>et</strong>ter understand<br />
the organic vs. conventional topic, <strong>in</strong>clud<strong>in</strong>g socio-economic aspects <strong>in</strong> which EME can constitute a<br />
valid framework.<br />
6. References<br />
Ardente, F., Beccali G., Cellura, M. and Marvuglia, A., 2006. POEMS: A Case Study of an Italian W<strong>in</strong>e-Produc<strong>in</strong>g Firm. Environ.<br />
Manag., 38 (3), 350–364.<br />
Avraamides M., Fatta D., 2008. Resource consumption and emissions from olive oil production: a life cycle <strong>in</strong>ventory case study <strong>in</strong><br />
Cyprus. J Clean Prod 16, 809-821.<br />
Campbell, D.E., 2000. A revised solar trasformity for tidal energy received by the earth and dissipated globally: implications for<br />
emergy analysis. In: Brown, M.T. (Ed.), Emergy S<strong>in</strong>thesis; Theory and Application of the Emergy M<strong>et</strong>hodology. The Center for<br />
Environmental policy, Ga<strong>in</strong>sville, pp. 255-263.<br />
De Gennaro B., Notarnicola B., Rosselli L.,Tassielli G., <strong>2012</strong>. Innovative olive-grow<strong>in</strong>g models: an environmental and economic<br />
assessment. J Clean Prod 28, 70-80.<br />
Fiore M., Breedveld L., Arrivas Bajardi C., Giaimo L., Notaro A., 2009 Certificazione ambientale di prodotti agroalimentari. <strong>LCA</strong><br />
dell’olio d’oliva. ARS n. 122 - luglio / s<strong>et</strong>tembre 2009.<br />
Gu<strong>in</strong>ée, J.B., Gorrée, M., Heijungs, R., Huppes, G., Kleijn, R., Kon<strong>in</strong>g, A. de, Oers, L. van, Wegener Sleeswijk, A., Suh, S., Udo de<br />
Haes, H.A., Bruijn, H. de, Du<strong>in</strong>, R. van, Huijbregts, M.A.J., 2002. Handbook on life cycle assessment. Operational guide to the<br />
ISO standards. I: <strong>LCA</strong> <strong>in</strong> perspective. IIa: Guide. IIb: Operational annex. III: Scientific background. Kluwer Academic Publishers,<br />
Dordrecht.<br />
Guzman G.I., Alonso A.M., 2008. A comparison of energy use <strong>in</strong> conventional and organic olive oil production <strong>in</strong> Spa<strong>in</strong>. Agricultural<br />
System 98, 167-176.<br />
Kavargiris, S.E., Mamolos, A.P., Tsatsarelisb, C.A., Nikolaidou, A.E., Kalburtji, K.L., 2009. Energy resources utilization <strong>in</strong> organic<br />
and conventional v<strong>in</strong>eyards: Energy flow, greenhouse gas emissions and biofuel production. Biomass and Bioenergy 33, 1239–<br />
1250.<br />
Notarnicola B., Tassielli G., Nicol<strong>et</strong>ti G.M., 2003. <strong>LCA</strong> of w<strong>in</strong>e production. In B. Mattsonn, U. Sonesson (editors): Environmentallyfriendly<br />
food production, Cap. XVII, pg. 306-326. Woodhead-Publish<strong>in</strong>g, Cambridge, England and CRC Press Boca Raton,<br />
USA, ISBN 1 85573 677 2.<br />
Odum, H.T., 1996. Environmental Account<strong>in</strong>g: Emergy and Environmental Decision mak<strong>in</strong>g. Wiley & Sons, new York, USA.<br />
P<strong>et</strong>ti, L., Raggi, A., De Camillis, C., Matteucci, P., Sára, B., Pagliuca, G., 2006. Life cycle approach <strong>in</strong> an organic w<strong>in</strong>e-mak<strong>in</strong>g firm:<br />
an Italian case-study. Proceed<strong>in</strong>gs Fifth Australian Conference on Life Cycle Assessment, Melbourne, Australia.<br />
Po<strong>in</strong>t, E., Tyedmers, P., Naugler, C., <strong>2012</strong>. Life cycle environmental impacts of w<strong>in</strong>e production and consumption <strong>in</strong> Nova Scotia,<br />
Canada. J. Clean. Prod. 27, 11-20.<br />
Rugani, B., Niccolucci, V., Pulselli, R. M., Tiezzi, E., 2009. A cradle-to-gate Life Cycle Assessment <strong>in</strong>tegrated with EME: susta<strong>in</strong>ability<br />
analysis of an organic w<strong>in</strong>e production. In: Proceed<strong>in</strong>gs of the SETAC Europe 19th Annual Me<strong>et</strong><strong>in</strong>g, 31st May-4th June<br />
2009, Göteborg, Sweden, p. 274.<br />
Salomone R., Ioppolo G. <strong>2012</strong>. Environmental Impacts Of Olive Oil Production: A Life Cycle Assessment Case Study In The Prov<strong>in</strong>ce<br />
Of Mess<strong>in</strong>a (Sicily). J. Clean. Prod. 28, 88-100.<br />
Vázquez-Rowe, I., <strong>2012</strong>. Jo<strong>in</strong>t life cycle assessment and data envelopment analysis of grape production for v<strong>in</strong>ification <strong>in</strong> the Rías<br />
Baixas appellation (NW-Spa<strong>in</strong>). J. Clean. Prod. 27, 92-102.<br />
539
PARALLEL SESSION 6C: POULTRY AND PORK PRODUCTION SYSTEMS 8 th Int. Conference on <strong>LCA</strong> <strong>in</strong> the<br />
Parallel session 6c: Poultry and Pork Production Systems<br />
540<br />
Agri-<strong>Food</strong> Sector, 1-4 Oct <strong>2012</strong><br />
Assessment of digestibility improv<strong>in</strong>g enzymes potential to reduce<br />
greenhouse gas emissions <strong>in</strong> broiler production<br />
Anja Marie Bundgaard 1,* , Randi Dalgaard 2 , Mikkel Thrane 3 , Trakarn Prapaspongsa 1,4<br />
1 Aalborg University, Department of development and plann<strong>in</strong>g, Vestre Havnepromenade 9, 9000 Aalborg, Denmark<br />
2 2.-0 <strong>LCA</strong> consultants, Skibbrogade 5,1, 9000 Aalborg, Denmark<br />
3 Dupont Nutrition and Health, Danisco, Edw<strong>in</strong> Rahrs Vej 38, DK-8220 Brabrand, Denmark.<br />
4 Mahidol University, Department of civil and environmental eng<strong>in</strong>eer<strong>in</strong>g, 25/25 Puttamonthon, Nakorn Pathom, 73170, Thailand<br />
Correspond<strong>in</strong>g author. E-mail: anjamarieb@gmail.com<br />
ABSTRACT<br />
The objective of this study was to exam<strong>in</strong>e the potential of digestibility improv<strong>in</strong>g enzymes to reduce greenhouse gas (GHG) emissions<br />
<strong>in</strong> broiler production. The product exam<strong>in</strong>ed was a new enzyme called Axtra XAP, developed by DuPont, Danisco Animal<br />
Nutrition. Two scenarios were compared: one where Axtra XAP was not <strong>in</strong>cluded <strong>in</strong> the di<strong>et</strong> and one where Axtra XAP was <strong>in</strong>cluded<br />
<strong>in</strong> the di<strong>et</strong>. Axtra XAP facilitated higher <strong>in</strong>clusion rates of cheaper (and possibly more environmentally friendly) feed <strong>in</strong>gredients that<br />
have a lower nutritional value <strong>in</strong> the di<strong>et</strong>. Axtra XAP’s environmental improvement potential was documented through a Life Cycle<br />
Assessment (<strong>LCA</strong>) by apply<strong>in</strong>g a consequential approach <strong>in</strong>clud<strong>in</strong>g <strong>in</strong>direct land use changes (ILUC). The f<strong>in</strong>d<strong>in</strong>gs showed that<br />
Axtra XAP could reduce GHG emissions from broiler production by 5%. A sensitivity analysis was conducted to assess the robustness<br />
of the results and it showed that the result varied substantially. The most important param<strong>et</strong>ers were the <strong>in</strong>clusion or exclusion of<br />
ILUC and changes <strong>in</strong> the feed formulation.<br />
Keywords: broilers, enzymes, consequential <strong>LCA</strong>, livestock feed, greenhouse gas emissions<br />
1. Introduction<br />
<strong>Food</strong> production represents around 1/3 of all human <strong>in</strong>duced greenhouse gas (GHG) emissions (Foley <strong>et</strong><br />
al., 2011) and tog<strong>et</strong>her with the cont<strong>in</strong>uous growth <strong>in</strong> population and affluence level, this represents a major<br />
challenge for the earth’s ecosystems. The production of animal products for human consumption amounts to<br />
18% of the total anthropogenic GHG emissions (FAO, 2006). No s<strong>in</strong>gle solution exists which can address all<br />
environmental problems caused by the livestock sector, but the use of digestibility improv<strong>in</strong>g enzymes <strong>in</strong><br />
animal feed has the potential to be an important solution. When enzymes are used <strong>in</strong> animal feed, they help<br />
break down parts of the di<strong>et</strong> which the animal itself cannot break down <strong>in</strong> its digestive system. Therefore<br />
nutrients from the di<strong>et</strong> are released which previously were unavailable to the animal. In addition enzymes<br />
can help to remove the anti-nutrient effect of certa<strong>in</strong> components <strong>in</strong> the di<strong>et</strong>. The enzymes can provide an<br />
improved growth performance for a specific di<strong>et</strong>, or allow for a higher ratio of cheaper feed <strong>in</strong>gredients with<br />
a lower nutritional value, while achiev<strong>in</strong>g the same growth performance (Barl<strong>et</strong>ta, 2011). Previous studies<br />
have documented the considerable environmental advantages of apply<strong>in</strong>g enzymes, such as phytase and<br />
other digestibility improv<strong>in</strong>g enzymes, <strong>in</strong> animal feed (Nielsen and Wenzel, 2007; Nielsen at al., 2008). The<br />
objective of the present study was to exam<strong>in</strong>e the possible environmental improvement potential of digestibility<br />
improv<strong>in</strong>g enzymes used <strong>in</strong> complex broiler di<strong>et</strong>s. The study exam<strong>in</strong>ed a specific enzyme product,<br />
Axtra XAP, developed by DuPont, Danisco Animal Nutrition. The paper accounts for the ma<strong>in</strong> results of the<br />
study.<br />
2. M<strong>et</strong>hods<br />
The two feed formulations used <strong>in</strong> this study were formulated us<strong>in</strong>g a computer software tool that ensures<br />
the lowest feed cost while still provid<strong>in</strong>g the necessary nutrition for the animal. They are economically optimised<br />
accord<strong>in</strong>g to US feed prices <strong>in</strong> 2011. M<strong>et</strong>hane and nitrous oxide emissions caused by the broiler’s<br />
manure and the manures end-use as an organic fertiliser are calculated accord<strong>in</strong>g to IPCC (2006a; 2006b).<br />
Enteric fermentation from the broiler was omitted, as no standard exists for poultry <strong>in</strong> the guidel<strong>in</strong>es and<br />
because enteric fermentation from poultry is very limited. A consequential approach (Weidema, 2003) was<br />
applied and <strong>in</strong>direct land use changes (ILUC) were <strong>in</strong>cluded. The approach used to calculate the effect of<br />
ILUC was developed by Schmidt <strong>et</strong> al., (2011). The ma<strong>in</strong> pr<strong>in</strong>ciple <strong>in</strong> the model is that the current use of<br />
land reflects the current demand for land, and that changes <strong>in</strong> demand for land will result <strong>in</strong> changes <strong>in</strong> land<br />
use. The life cycle assessment (<strong>LCA</strong>) was modelled us<strong>in</strong>g the program SimaPro and it basically follows the<br />
ISO 14040 and 14044 standards.
PARALLEL SESSION 6C: POULTRY AND PORK PRODUCTION SYSTEMS 8 th Int. Conference on <strong>LCA</strong> <strong>in</strong> the<br />
Agri-<strong>Food</strong> Sector, 1-4 Oct <strong>2012</strong><br />
2.1. Goal and Scope<br />
Axtra XAP <strong>in</strong>creases the digestibility of the feed thereby <strong>in</strong>creas<strong>in</strong>g the broiler’s utilisation of the nutrients<br />
<strong>in</strong> the feed. When Axtra XAP is used <strong>in</strong> the feed formulation it is possible to <strong>in</strong>clude a higher amount of<br />
cheaper feed <strong>in</strong>gredients that have a lower nutritional value without compromis<strong>in</strong>g the growth of the broiler.<br />
The study strived to assess the changes <strong>in</strong> GHG emissions when a broiler was reared us<strong>in</strong>g a feed formulation<br />
without Axtra XAP compared to when a broiler was reared us<strong>in</strong>g a feed formulation with Axtra XAP.<br />
The functional unit applied <strong>in</strong> the study was the production of one kg live broiler, assum<strong>in</strong>g that the production<br />
of one kg live broiler meat required 1.8 kg feed. The two feed formulations represented US commercial<br />
examples <strong>in</strong> 2011. In terms of life cycle impact assessment, the study addresses GHG emissions based on the<br />
IPPC 2007 GWP 100a impact m<strong>et</strong>hod. As the nature of the <strong>LCA</strong> was comparative (compar<strong>in</strong>g two scenarios),<br />
identical life cycle stages and processes <strong>in</strong> the two scenarios were omitted. Axtra XAP facilitated an<br />
<strong>in</strong>crease <strong>in</strong> the digestibility of the feed, result<strong>in</strong>g <strong>in</strong> changes <strong>in</strong> the feed formulation and the manure emitted<br />
by the broiler. Changes <strong>in</strong> the manure resulted <strong>in</strong> changed m<strong>et</strong>hane and nitrogen oxide emissions from the<br />
manure and therefore changes <strong>in</strong> the end use of the manure.<br />
2.2. Feed formulations<br />
The effect of us<strong>in</strong>g Axtra XAP was analysed <strong>in</strong> eight feed trials made <strong>in</strong> collaboration with research <strong>in</strong>stitutions<br />
<strong>in</strong> different parts of the world (Danisco, no data). B<strong>et</strong>ween 144 and 1800 broilers were <strong>in</strong>cluded <strong>in</strong><br />
each feed trial. The results showed a reduction <strong>in</strong> the feed used to rear the same amount of broiler meat of<br />
3.8% to 8.7%, depend<strong>in</strong>g on the feed formulation. The results of the feed trials were <strong>in</strong>corporated <strong>in</strong>to the<br />
computer software used to formulate the two feed formulations. The feed formulations used <strong>in</strong> scenario one<br />
and scenario two are presented <strong>in</strong> table 1 and follow Dupont, Danisco Animal Nutrition’s recommendations<br />
for us<strong>in</strong>g the Axtra XAP product.<br />
Table 1. Feed formulations provided by DuPont, Danisco Animal Nutrition<br />
Raw materials Scenario one feed composition Scenario two feed composition<br />
without Axtra XAP (g)<br />
with Axtra XAP (g)<br />
Corn 1,171.8 1,162.9<br />
DDGS 180.0 216.0<br />
Phyzyme XP 0.4 0.4<br />
Soya bean meal 347.2 334.3<br />
Meat and bone meal 52.9 35.4<br />
L-Lys<strong>in</strong>e (HCL) 5.7 6.3<br />
DL-M<strong>et</strong>hion<strong>in</strong>e 4.2 4.2<br />
NaCL 6.0 7.0<br />
Limestone 15.2 19.9<br />
Dicalcium phosphate 1.4 5.1<br />
Vitam<strong>in</strong>s/ M<strong>in</strong>erals 1.8 1.8<br />
Axtra XAP 102 TPT 0 0.9<br />
Pig and poultry fats 11.9 4.5<br />
L-threon<strong>in</strong>e 1.5 1.3<br />
Total 1,800 1,800<br />
The improvement <strong>in</strong> digestibility and performance obta<strong>in</strong>ed by apply<strong>in</strong>g Axtra XAP was used to reduce<br />
the amount of corn, soybean meal, meat and bone meal, and pig and poultry fats <strong>in</strong> the di<strong>et</strong> and to <strong>in</strong>crease<br />
the amount of dried distillers gra<strong>in</strong>s with solubles (DDGS) <strong>in</strong> the feed. This provided an economic benefit of<br />
4.04 $ per ton of feed <strong>in</strong> scenario two compared to scenario one. A m<strong>in</strong>imum level of fat is required <strong>in</strong> the<br />
feed formulation to ensure pell<strong>et</strong> quality, therefore, it was not possible to apply the full Axtra XAP recommendations<br />
for energy reduction <strong>in</strong> the feed formulation. Hence, <strong>in</strong> scenario two there is an excess amount of<br />
energy provided by the enzyme (48 kcal per kg feed) compared to scenario one. The excess energy is not<br />
accounted for <strong>in</strong> the study and the <strong>LCA</strong> therefore represents a conservative estimate of Axtra XAP’s potential.<br />
3. Results<br />
3.1 Life Cycle Inventory<br />
Figure 1 provides an overview of the system boundary <strong>in</strong>clud<strong>in</strong>g marg<strong>in</strong>al mechanisms. Corn was not<br />
considered a constra<strong>in</strong>t product and it was modelled as corn produced <strong>in</strong> the US, based on data from Dal-<br />
541
PARALLEL SESSION 6C: POULTRY AND PORK PRODUCTION SYSTEMS 8 th Int. Conference on <strong>LCA</strong> <strong>in</strong> the<br />
Agri-<strong>Food</strong> Sector, 1-4 Oct <strong>2012</strong><br />
gaard (2011). In scenario two, the amount of corn <strong>in</strong> the di<strong>et</strong> was decreased, result<strong>in</strong>g <strong>in</strong> less demand for corn<br />
production compared to scenario one. Soybean meal was not considered a constra<strong>in</strong>t product either (Dalgaard,<br />
2008), and it was therefore modelled as soybean meal produced <strong>in</strong> Brazil (Dalgaard, 2011). In scenario<br />
two less soybean meal was needed <strong>in</strong> the feed formulation compared to scenario one, reduc<strong>in</strong>g the demand<br />
for soybean meal.<br />
542<br />
Barley<br />
Barley<br />
Production<br />
Supplement<br />
production<br />
Enzyme<br />
production<br />
Axtra XAP<br />
Fertiliser<br />
production<br />
Barley<br />
Ethanol<br />
production<br />
Supplements<br />
DDGs<br />
DDGs<br />
Animal feed<br />
production<br />
Meat and bone<br />
Broiler feed<br />
production<br />
Feed<br />
Pig and poultry fats<br />
Slaughter<strong>in</strong>g and<br />
render<strong>in</strong>g<br />
Meat and bone<br />
Broiler<br />
production<br />
Manure<br />
Feed<br />
Manure use<br />
Leach<strong>in</strong>g from field<br />
Pig and poultry fats<br />
Soy<br />
Soy<br />
Corn<br />
Soy<br />
Emission from<br />
stabels and<br />
manure storage<br />
Soy<br />
production<br />
Corn<br />
production<br />
Emissions from the<br />
field<br />
Figure 1. System boundary <strong>in</strong>clud<strong>in</strong>g marg<strong>in</strong>al mechanisms. The dotted and full l<strong>in</strong>es illustrate the changes<br />
<strong>in</strong> demand for different products b<strong>et</strong>ween scenario one and two. The dotted l<strong>in</strong>e illustrates a decrease <strong>in</strong> demand<br />
for the product and the full l<strong>in</strong>e illustrates an <strong>in</strong>crease <strong>in</strong> demand for the product <strong>in</strong> scenario two compared<br />
to scenario one.<br />
DDGS is a constra<strong>in</strong>t by-product from bio <strong>et</strong>hanol production. DDGS is predom<strong>in</strong>ately used <strong>in</strong> livestock<br />
feed (Saunders and Rosentrater, 2008). An <strong>in</strong>creased demand for DDGS will not lead to an <strong>in</strong>creased production<br />
of DDGS, as this is d<strong>et</strong>erm<strong>in</strong>ed by the demand for <strong>et</strong>hanol, <strong>in</strong>stead, it will result <strong>in</strong> an <strong>in</strong>creased production<br />
of the marg<strong>in</strong>al feed energy and the marg<strong>in</strong>al feed prote<strong>in</strong>. Accord<strong>in</strong>g to Weidema (2003), the marg<strong>in</strong>al<br />
feed prote<strong>in</strong> is soybean meal, and the marg<strong>in</strong>al feed energy is barley. Data on soybean meal and barley was<br />
based on Dalgaard (2011). In scenario two, an <strong>in</strong>creased ratio of DDGS was used <strong>in</strong> the feed formulation<br />
compared to scenario one, result<strong>in</strong>g <strong>in</strong> less DDGS available for other animal feed production, and thereby an<br />
<strong>in</strong>creased demand for barley and soybean meal. Meat and bone meal was also considered a constra<strong>in</strong>t byproduct.<br />
The majority of rendered prote<strong>in</strong> products <strong>in</strong> the US and Canada are used as animal feed (Jakanowski,<br />
2011). In scenario two, the amount of meat and bone meal was decreased <strong>in</strong> the feed formulation<br />
compared to scenario one. This will result <strong>in</strong> more meat and bone meal available for the rest of animal feed<br />
production, thereby decreas<strong>in</strong>g the demand for the marg<strong>in</strong>al feed energy and the marg<strong>in</strong>al feed prote<strong>in</strong>. In the<br />
feed formulations pig and poultry fat was used as the fat source, but it could be any other suitable source of<br />
fats and greases. Rendered fats and greases were also considered a constra<strong>in</strong>t by-product. Rendered fats and<br />
greases have several uses the ma<strong>in</strong> uses be<strong>in</strong>g as a feed <strong>in</strong>gredient, <strong>in</strong> the oleochemical <strong>in</strong>dustry and as a<br />
biofuel. The livestock <strong>in</strong>dustry is the largest user of rendered fats and greases, but the biodiesel production<br />
<strong>in</strong>dustry might be the fastest grow<strong>in</strong>g mark<strong>et</strong> for rendered fats and greases (NRA, 2011a; 2011b). In this<br />
study the livestock <strong>in</strong>dustry was used as the marg<strong>in</strong>al use of rendered fats and greases. In scenario two, less<br />
pig and poultry fats were needed compared to scenario one, mak<strong>in</strong>g more pig and poultry fat available for the<br />
rest of animal feed production, decreas<strong>in</strong>g the demand for the marg<strong>in</strong>al feed energy. In scenario two there
PARALLEL SESSION 6C: POULTRY AND PORK PRODUCTION SYSTEMS 8 th Int. Conference on <strong>LCA</strong> <strong>in</strong> the<br />
Agri-<strong>Food</strong> Sector, 1-4 Oct <strong>2012</strong><br />
was an <strong>in</strong>creased demand for both supplements and enzymes compared to scenario one. The supplements<br />
were modelled us<strong>in</strong>g eco<strong>in</strong>vent processes (Eco<strong>in</strong>vent, 2007). Phyzyme was modelled us<strong>in</strong>g a fixed GHG<br />
emissions rate of 5.0 kg CO2 per kg enzyme produced (Dalgaard, 2011). Axtra XAP was modelled based on<br />
production formulas and represents 90-100% of the actual <strong>in</strong>gredients and materials. Data for energy and<br />
material use from the production of Axtra XAP was from the enzyme factories’ production records. Data on<br />
the <strong>in</strong>gredient production was from Eco<strong>in</strong>vent (2007), <strong>LCA</strong> food database (2003), suppliers and literature.<br />
Transportation of raw materials was <strong>in</strong>cluded for the most important materials. The end-use of the manure<br />
was assumed to be as an organic fertiliser. The <strong>in</strong>creased digestibility of the feed <strong>in</strong>gredients, facilitated by<br />
Axtra XAP, resulted <strong>in</strong> less m<strong>et</strong>hane emissions from the manure <strong>in</strong> scenario two compared to scenario one<br />
from both the broiler sheds and the manure storage. The broiler’s <strong>in</strong>creased nitrogen r<strong>et</strong>ention <strong>in</strong> scenario<br />
two compared to scenario one, aga<strong>in</strong> as a result of the use of Axtra XAP, results <strong>in</strong> less nitrogen <strong>in</strong> the manure.<br />
This leaded to decreased nitrous oxide emissions from the sheds, the manure storage and from the<br />
fields. However, when the manure conta<strong>in</strong>ed less nitrogen it then substituted less marg<strong>in</strong>al nitrogen fertiliser.<br />
Thereby, the demand for the marg<strong>in</strong>al nitrogen fertiliser <strong>in</strong>creased. In the study, ammonium nitrate was assumed<br />
to be the marg<strong>in</strong>al nitrogen fertiliser, as it is the dom<strong>in</strong>ant nitrogen fertiliser <strong>in</strong> Europe (Sonesson <strong>et</strong><br />
al., 2009). Inorganic nitrogen fertiliser was modelled as ammonium nitrate. It was assumed that poultry manure<br />
offs<strong>et</strong>s the use of <strong>in</strong>organic nitrogen with 70% (FVM, 2011). Data used to model the processes was<br />
based on three databases; the eco<strong>in</strong>vent database (Eco<strong>in</strong>vent, 2007), the <strong>LCA</strong> food DK database (<strong>LCA</strong> food,<br />
2003) and Danisco’s database (Dalgaard, 2011). When us<strong>in</strong>g different databases, there will be unavoidable<br />
differences <strong>in</strong> the datas<strong>et</strong>s and m<strong>et</strong>hodological choices. However, the majority of all the feed <strong>in</strong>gredients<br />
were based on data from the Danisco database (97% of the total weight) result<strong>in</strong>g <strong>in</strong> data and m<strong>et</strong>hodological<br />
consistency.<br />
3.2 Results of the life cycle impact assessment<br />
The results are presented <strong>in</strong> Fig. 2. The results of the <strong>LCA</strong> are given as a difference b<strong>et</strong>ween scenario one<br />
and scenario two per FU, represent<strong>in</strong>g the changes <strong>in</strong>duced by Axtra XAP. The total reduction <strong>in</strong> GHG emission<br />
per FU when apply<strong>in</strong>g Axtra XAP amounts to 90.5 g CO2 eq. (dark blue column).<br />
Figure 2. Changes <strong>in</strong> GHG emission caused by the use of Axtra XAP <strong>in</strong> scenario two compared to scenario<br />
one. The negative value <strong>in</strong>dicates a decrease <strong>in</strong> GHG emissions and a positive value <strong>in</strong>dicates an <strong>in</strong>crease <strong>in</strong><br />
GHG emissions <strong>in</strong> scenario two compared to scenario one.<br />
The use of Axtra XAP <strong>in</strong> the feed formulation resulted <strong>in</strong> decreased GHG emissions from pig and poultry<br />
fat, meat and bone meal, soybean meal and corn, and <strong>in</strong>creased GHG emissions from DDGS and the supplements<br />
amount<strong>in</strong>g to a reduction <strong>in</strong> GHG emissions of 90.0 CO2 eq. per FU. The <strong>in</strong>creased GHG emissions<br />
from the supplements were ma<strong>in</strong>ly driven by the <strong>in</strong>creased level of dicalcium phosphate <strong>in</strong> scenario two. The<br />
use of Axtra XAP resulted <strong>in</strong> an <strong>in</strong>crease <strong>in</strong> GHG emissions of 0.85 g CO2 per FU (red column). GHG emissions<br />
from manure management and storage were reduced by 10.4 g CO2 eq. per FU (green column). GHG<br />
emissions from the use of the manure as a crop fertiliser were also reduced, as a consequence of the lower<br />
nitrogen content <strong>in</strong> the manure. However, when less organic nitrogen was emitted by the broiler to be used as<br />
543
PARALLEL SESSION 6C: POULTRY AND PORK PRODUCTION SYSTEMS 8 th Int. Conference on <strong>LCA</strong> <strong>in</strong> the<br />
Agri-<strong>Food</strong> Sector, 1-4 Oct <strong>2012</strong><br />
fertiliser then less <strong>in</strong>organic nitrogen fertiliser was displaced, result<strong>in</strong>g <strong>in</strong> an <strong>in</strong>crease <strong>in</strong> GHG emissions of<br />
9.1 g CO2 eq. per FU.<br />
3.3 Sensitivity analysis<br />
In the sensitivity analysis the effects from changes <strong>in</strong> the feed formulation, the exclusion of ILUC,<br />
changes <strong>in</strong> the marg<strong>in</strong>al use of rendered fats and greases and the impact from the production of soybean meal<br />
were exam<strong>in</strong>ed. The most significant param<strong>et</strong>ers proved to be changes <strong>in</strong> the feed formulations and the exclusion<br />
of ILUC. As mentioned earlier, it was not possible to apply the full benefits of Axtra XAP <strong>in</strong> scenario<br />
two. Therefore, two additional feed formulations were made, one without Axtra XAP and one with<br />
Axtra XAP, where no restrictions were made on the fat content, allow<strong>in</strong>g for the full benefits of Axtra XAP<br />
to be applied. Changes <strong>in</strong> the feed formulations resulted <strong>in</strong> almost a tripl<strong>in</strong>g (281%) of the sav<strong>in</strong>gs <strong>in</strong> GHG<br />
emissions <strong>in</strong>dicat<strong>in</strong>g that either the feed formulations were too conservative or there is a large unutilised<br />
potential for further improvement. The exclusion of ILUC resulted <strong>in</strong> a reduction <strong>in</strong> the sav<strong>in</strong>gs <strong>in</strong> GHG<br />
emissions of 93% compared to the reference scenario. It must be concluded that there are considerable uncerta<strong>in</strong>ties<br />
connected with both the m<strong>et</strong>hodological choices made and the data collection.<br />
4. Discussion<br />
To evaluate the sav<strong>in</strong>gs facilitated by Axtra XAP it was compared to the total GHG emissions from the<br />
production of broiler meat. In total four studies were exam<strong>in</strong>ed: <strong>LCA</strong> food (2003), Cederberg (2009), Williams<br />
<strong>et</strong> al., (2009) and Nielsen <strong>et</strong> al., (2011). The results from these studies varied considerably from approximately<br />
1.9 kg CO2 per kg bone free meat <strong>in</strong> Cederberg (2009) to approximately 3.4 kg CO2 per kg bone<br />
free meat <strong>in</strong> Williams <strong>et</strong> al., (2009), assess<strong>in</strong>g that the carcass weight made up 70% of live weight and bone<br />
free meat made up 77% of the carcass weight. To make a conservative estimate of Axtra XAP’s improvement<br />
potential the highest GHG emissions from the studies reviewed was used. The calculations showed that<br />
sav<strong>in</strong>gs <strong>in</strong> GHG emissions facilitated by Axtra XAP amounted to 4.9% per kg bone free broiler meat. In<br />
2010, the total production of chicken meat was 86,064 million ton (FAO, 2011), thus Axtra XAP could potentially<br />
facilitate sav<strong>in</strong>gs <strong>in</strong> GHG emissions of roughly 14 million ton CO2 eq. This assumed that all producers<br />
used the same feed formulation, applied Axtra XAP to their di<strong>et</strong>s and that digestibility improv<strong>in</strong>g<br />
enzymes were not already used <strong>in</strong> the di<strong>et</strong>s. The results should however be applied on a global scale with<br />
caution, as consequential modell<strong>in</strong>g accounts for marg<strong>in</strong>al changes, and does not represent what will happen<br />
on the mark<strong>et</strong> if all broiler producers changed their feed formulation. Additionally, the sav<strong>in</strong>gs <strong>in</strong> GHG<br />
emissions will depend on the prices of the raw <strong>in</strong>gredients, as the feed formulations are made <strong>in</strong>clud<strong>in</strong>g only<br />
consideration to the price and the nutritional value of the feed. As documented <strong>in</strong> the sensitivity analysis, the<br />
feed formulation was one of the most important param<strong>et</strong>ers when d<strong>et</strong>erm<strong>in</strong><strong>in</strong>g Axtra XAP’s potential. Thus,<br />
the sav<strong>in</strong>gs facilitated by Axtra XAP could potentially change considerably depend<strong>in</strong>g on the feed prices.<br />
Furthermore, Axtra XAP will reduce production cost and most likely reduce the price of broiler meat, potentially<br />
result<strong>in</strong>g <strong>in</strong> an <strong>in</strong>creas<strong>in</strong>g consumption of broiler meat (rebound effect).<br />
5. Conclusion<br />
Axtra XAP facilitated sav<strong>in</strong>gs <strong>in</strong> GHG emissions of 90.5 g CO2 eq. per FU. Compar<strong>in</strong>g the potential sav<strong>in</strong>gs<br />
<strong>in</strong> GHG emission documented <strong>in</strong> the present <strong>LCA</strong>, with the total greenhouse gas emissions from the<br />
production of one kg bone free broiler meat documented <strong>in</strong> Williams <strong>et</strong> al., (2009), showed that Axtra XAP<br />
had the potential to reduce the impact from broiler rear<strong>in</strong>g by 5% result<strong>in</strong>g <strong>in</strong> a global potential sav<strong>in</strong>g of 14<br />
million ton CO2 eq. each year. The results of the sensitivity analysis showed that the most significant param<strong>et</strong>ers<br />
were the <strong>in</strong>clusion or exclusion of ILUC and changes <strong>in</strong> the feed formulation. However, all sensitivity<br />
analysis resulted <strong>in</strong> a reduction <strong>in</strong> the GHG emissions when Axtra XAP was <strong>in</strong>cluded <strong>in</strong> the feed formulation<br />
compared to when it was not.<br />
6. References<br />
Barl<strong>et</strong>ta, A., 2011. Introduction: Current mark<strong>et</strong> and expected developments, <strong>in</strong> Bedford, M.R., Partridge G.G. (Eds), Enzymes <strong>in</strong><br />
Farm Animal Nutrition, 2nd Edition, pp. 1-11, CAB International, Bodm<strong>in</strong>, UK<br />
Cederberg, C., Sonesson, U., Henriksson, M., Sund, V., Davis J., 2009. Greenhouse gas emissions from Swedish production of milk<br />
and eggs 1990 and 2005. http://www.sik.se/archive/pdf-filer-katalog/sr793.pdf. (accessed 29.12.11)<br />
Dalgaard, R., Schmidt, J., Halberg, N., Christensen, P., Thrane, M. and Pengue, W.A., 2008. <strong>LCA</strong> of Soybean Meals. Int J <strong>LCA</strong> 13<br />
(3) 240-254.<br />
Dalgaard, R., 2011. Inventory of key feedstock. Developed by Randi Dalgaard, 2.0 <strong>LCA</strong> consultant, Denmark. Available on request<br />
(mthr@danisco.com)<br />
544
PARALLEL SESSION 6C: POULTRY AND PORK PRODUCTION SYSTEMS 8 th Int. Conference on <strong>LCA</strong> <strong>in</strong> the<br />
Agri-<strong>Food</strong> Sector, 1-4 Oct <strong>2012</strong><br />
Danisco, no data. Technical Report Axtra XAP: Axtra XAP significantly improved performance and AME of broiler feed corn/soy/<br />
ga<strong>in</strong> by-product based di<strong>et</strong>s. (<strong>in</strong>ternal document)<br />
Eco<strong>in</strong>vent, 2007. The lifecycle <strong>in</strong>ventory data v2.2 Swiss Centre for Life Cycle Inventories.<br />
FAO, 2006. Livestock’s long shadow: environmental issues and options, <strong>Food</strong> and Agriculture Organization of the United Nations.<br />
ftp://ftp.fao.org/docrep/fao/010/a0701e/a0701e.pdf. (Accessed 22.11.2011)<br />
FAO, 2011. <strong>Food</strong> and Agriculture Organization of the United Nations: FAPSTAT: Production: Livestock Primary.<br />
http://faostat.fao.org/site/569/DesktopDefault.aspx?PageID=569#ancor (accessed 22.12.11)<br />
Foley, J.A., Ramankutty, N., Brauman, K.A., Cassidy, E., Gerber, J.S., Johnston, M., Mueller, N.D., O’Connell, C., Ray, D.K., West,<br />
P.C., Balzer, C., Benn<strong>et</strong>t, E.M., Carpenter, S.R., Hill, J., Monfreda, C., Polasky, S., Rockström, J., Sheehan, J., Siebert, S., Tilman,<br />
D. and Zaks, D.P.M., 2011. Solutions for a Cultivated Plan<strong>et</strong>. Nature Volume: 478 (p 337–342).<br />
IPCC, 2006a. 2006 IPCC Guidel<strong>in</strong>es for National Greenhouse Gas Inventories. Volume 4. Agriculture, Forestry and other Land Use,<br />
Chapter 10. N2O Emissions from Livestock and Manure Management.<br />
IPCC, 2006b. 2006 IPCC Guidel<strong>in</strong>es for National Greenhouse Gas Inventories. Volume 4. Agriculture, Forestry and other Land Use,<br />
Chapter 11. N2O Emissions from Managed Soils and CO2 Emissions from Lime and Urea Application.<br />
Jekanowski, M., 2011. Survey Says: A Snapshot of Render<strong>in</strong>g. Render Magaz<strong>in</strong>e. April 2011, 58-61.<br />
<strong>LCA</strong> food, 2003. <strong>LCA</strong> food database. www.lcafood.dk. (accessed 28.12.11)<br />
FVM, 2011. M<strong>in</strong>isteri<strong>et</strong> for Fødevarer, Landbrug og Fiskeri Vejledn<strong>in</strong>g om Gødskn<strong>in</strong>gs- og Harmoniregler: Planperiode 1. august<br />
2011 til 31. juli <strong>2012</strong>. Plantedirektorat<strong>et</strong>. http://www.n<strong>et</strong>publikationer.dk/FVM/978-87-7083-418-6/<strong>in</strong>dex.htm (accessed<br />
18.12.11)<br />
Nielsen, P.H., Dalgaard, R., Korsbak, A., P<strong>et</strong>tersson, D., 2007. Environmental Assessment of Digestibility Improvement Factors<br />
Applied <strong>in</strong> Animal Production: Use of Ronozyme® WX CT Xylanase <strong>in</strong> Danish Pig Production. Int J <strong>LCA</strong> 13(1), pp. 49-56<br />
Nielsen, P.H., Wenzel, H., 2007. Environmental Assessment of Ronozyme®P5000 CT Phytase as an Alternative to Inorganic Phosphate<br />
Supplementation to Pig Feed Used <strong>in</strong> Intensive Pig Production. Int J <strong>LCA</strong> 12 (7), pp. 514-520<br />
Nielsen, N.I., Jørgensen, M., Bahrndorff, S., 2011. Greenhouse Gas Emissions from the Danish Broiler Production estimated via<br />
<strong>LCA</strong> M<strong>et</strong>hodology. The Danish <strong>Food</strong> Industry Agency.<br />
http://www.landbrugs<strong>in</strong>fo.dk/Fjerkrae/Sider/110628_vfc_engelsk_vfl_layout_web.pdf?List=%7Bfd90c3be-edf2-456f-bae3f22a04409221%7D&download=true<br />
(accessed 18.08.<strong>2012</strong>)<br />
NRA. 2011a. Economic impact: Statistics: Monthly U.S. Raw Material Usage for U.S. Biodiesel Production (2007-2009).<br />
http://ass<strong>et</strong>s.nationalrenderers.org/Monthly_US_Raw_Material_Useage_for_US_-Biodiesel_Production_2007_2009.pdf. (Accessed<br />
08.12.11)<br />
NRA (2011b) Economic impact: Statistics: US and EU Production of Biodiesel (2001-2009).<br />
http://nationalrenderers.org/ass<strong>et</strong>s/4d2db2f3dabe9d618f00005c/us_and_eu_production_of_biodiesel_20012009.pdf. (Accessed<br />
08.12.11)<br />
Schmidt, J.H., Re<strong>in</strong>hard, J., Weidema, B., (2011) Modell<strong>in</strong>g of <strong>in</strong>direct land use changes <strong>in</strong> <strong>LCA</strong>: Report v2I. Denmark, Aalborg. 2.0<br />
<strong>LCA</strong> consultants<br />
Saunders, J.A., Rosentrater, K.A., 2009. Survey of US fuel <strong>et</strong>hanol plants. Bioresource Technology 100, 3277-3284<br />
Sonesson, U., Cederberg, C., and Berglund M., 2009. Greenhouse gas emissions <strong>in</strong> animal feed production.<br />
http://www.klimatmarkn<strong>in</strong>gen.se/wp-content/uploads/2009/12/2009-2-feed.pdf. (accessed 23.11.11)<br />
Weidema, B., 2003. Mark<strong>et</strong> <strong>in</strong>formation <strong>in</strong> life cycle assessment. Danish Environmental Protection Agency: Danish M<strong>in</strong>istry of the<br />
Environment. http://www.norlca.org/resources/780.pdf. (accessed 08.12.11)<br />
Williams, A.G., Audsley, E. Sandars, D.L., 2009. A Lifecycle Approach to Reduc<strong>in</strong>g the Environmental Impact of Poultry Production.<br />
World Poultry Science Association (WPSA), 17 th European Symposium on Poultry Nutrition, August 2009 Ed<strong>in</strong>burgh, Scotland<br />
545
PARALLEL SESSION 6C: POULTRY AND PORK PRODUCTION SYSTEMS 8 th Int. Conference on <strong>LCA</strong> <strong>in</strong> the<br />
Agri-<strong>Food</strong> Sector, 1-4 Oct <strong>2012</strong><br />
546<br />
Comparison of two production scenarios of chickens consumed <strong>in</strong><br />
<strong>France</strong><br />
Vamilson Prudêncio da Silva Junior 1,* , Edivan Cherub<strong>in</strong>i 2 , Sebastião Roberto Soares 2<br />
1 Empresa de Pesquisa Agropecuária e Extensão Rural de Santa Catar<strong>in</strong>a, Florianópolis, Brazil.<br />
2 Universidade Federal de Santa Catar<strong>in</strong>a – CICLOG, Florianópolis, Brazil.<br />
Correspond<strong>in</strong>g author. E-mail: vamilson@epagri.sc.gov.br<br />
ABSTRACT<br />
The use of the Life Cycle Assessment - <strong>LCA</strong> - provides <strong>in</strong>terest<strong>in</strong>g comparisons b<strong>et</strong>ween different scenarios of produc<strong>in</strong>g a same<br />
product. In this study we <strong>in</strong>vestigate if imported chickens from Brazil, fed with locally produced gra<strong>in</strong>s cause less or more impact<br />
than chickens produced <strong>in</strong> <strong>France</strong>, us<strong>in</strong>g a feed part of which comes from Brazil. We assume that the chicken produced <strong>in</strong> <strong>France</strong><br />
(FR) was a standard <strong>in</strong>tensive system with a feed made with French <strong>in</strong>gredients (maize, wheat, and rapeseed) and with soybean from<br />
Brazil. For the Brazilian case (BR), we assumed standard <strong>in</strong>tensive systems, that chickens were fed ma<strong>in</strong>ly with maize and soybeans<br />
produced <strong>in</strong> the region <strong>in</strong> which the chickens were raised. As we have two scenarios that represent the Brazilian situation, we propose<br />
a scenario consist<strong>in</strong>g of 75% of South chicken (SO - considered representative for the three southern states) and 25% of Centre West<br />
chicken (CW), add<strong>in</strong>g to this scenario the transport distances. The <strong>LCA</strong> for the systems studied beg<strong>in</strong>s with the production of <strong>in</strong>puts<br />
and goods used to produce crops, pass<strong>in</strong>g through the phases of crop production, gra<strong>in</strong> dry<strong>in</strong>g and process<strong>in</strong>g, feed manufactur<strong>in</strong>g,<br />
production of chicks, chicken rear<strong>in</strong>g, slaughter, cool<strong>in</strong>g and packag<strong>in</strong>g of whole chicken, <strong>in</strong>clud<strong>in</strong>g all transport phases, up to the<br />
slaughterhouse gate, add<strong>in</strong>g the transport to <strong>France</strong>, for the Brazilian scenario. The production and ma<strong>in</strong>tenance of chicken houses<br />
and of slaughterhouse build<strong>in</strong>gs and mach<strong>in</strong>es were not <strong>in</strong>cluded. Functional unit was 1 ton of chicken cooled and packed delivered<br />
<strong>in</strong> <strong>France</strong>. The m<strong>et</strong>hod used for life cycle impact assessment was the CML 2 basel<strong>in</strong>e 2000 with modifications. From an environmental<br />
po<strong>in</strong>t of view, import<strong>in</strong>g chicken from Brazil rather than produc<strong>in</strong>g it <strong>in</strong> <strong>France</strong> with Brazilian soybeans, was b<strong>et</strong>ter with<br />
respect to climate change and land occupation, which are both global impacts. With respect to acidification, terrestrial ecotoxicity<br />
and energy demand chicken imported from Brazil had larger impacts than the chicken produced <strong>in</strong> <strong>France</strong>.<br />
Keywords: life cycle assessment, chicken production, Brazil, <strong>France</strong><br />
1. Introduction<br />
In recent decades the poultry <strong>in</strong>dustry has developed and modernized, both <strong>in</strong> Brazil and <strong>in</strong> <strong>France</strong>. Increased<br />
productivity due to technological improvements, new models of <strong>in</strong>tegration and changes <strong>in</strong> the mark<strong>et</strong><br />
favour<strong>in</strong>g the <strong>in</strong>crease <strong>in</strong> consumption of chicken meat, are factors that contributed to the growth of the<br />
sector <strong>in</strong> Brazil. Accord<strong>in</strong>g to the Brazilian Association of Chicken Producers and Exporters (ABEF, 2010),<br />
the total chicken production <strong>in</strong> Brazil <strong>in</strong>creased from 2 million tonnes <strong>in</strong> 1989 to 12.3 million <strong>in</strong> 2010. In<br />
2006, 2.7 million tons were exported (ABEF, 2010). In 2010, this number rose to 3.8 million tons. The Middle<br />
East, the European Union (EU) and Asia are the ma<strong>in</strong> dest<strong>in</strong>ations for Brazilian chicken. This significant<br />
<strong>in</strong>crease <strong>in</strong> the export of chickens has caused <strong>in</strong>ternational repercussions.<br />
Meanwhile, <strong>in</strong> Europe, accord<strong>in</strong>g to Jez <strong>et</strong> al., (2011), the rapid growth of consumption of cuts and especially<br />
processed products, for which the orig<strong>in</strong> of the raw material is not promoted, has favoured imports<br />
from new produc<strong>in</strong>g regions which are highly comp<strong>et</strong>itive on the global mark<strong>et</strong>, like Brazil among others. In<br />
response some countries which were not me<strong>et</strong><strong>in</strong>g domestic demand, such as Poland and Germany, <strong>in</strong>creased<br />
production, whereas the production of leaders such as <strong>France</strong> and the United K<strong>in</strong>gdom decreased.<br />
Accord<strong>in</strong>g to Magdela<strong>in</strong>e (2008), the poultry French <strong>in</strong>dustry reached its maximum production at the end<br />
of the 90s, and then started to decl<strong>in</strong>e. S<strong>in</strong>ce then, the current picture of French poultry was s<strong>et</strong>, characterised<br />
by a structural crisis that has resulted <strong>in</strong> a reduction <strong>in</strong> the volume of chicken produced by around 25%<br />
(equivalent to 550 tons of carcass). This decl<strong>in</strong>e <strong>in</strong> French production is primarily due to a loss of comp<strong>et</strong>itiveness<br />
<strong>in</strong> the light of the sharp reduction of exports extra and <strong>in</strong>tra European Union, and an <strong>in</strong>crease <strong>in</strong> imports.<br />
At the same time, domestic consumption, after reach<strong>in</strong>g a maximum <strong>in</strong> 2001, stabilised and the mark<strong>et</strong><br />
was heavily segmented allow<strong>in</strong>g an <strong>in</strong>crease of imported meat. Over the last ten years, poultry production <strong>in</strong><br />
<strong>France</strong>, which rema<strong>in</strong>s Europe's lead<strong>in</strong>g poultry-meat producer and exporter to non-EU countries, has decreased<br />
by 20% (Jez <strong>et</strong> al., 2011).<br />
The different characteristics of Brazil and <strong>France</strong> supply cha<strong>in</strong>s of poultry production lead to the establishment<br />
of different levels of environmental impacts. From the perspective of <strong>LCA</strong>, most of the environmental<br />
impacts of livestock production comes from the stage of feed production (raw materials), as already<br />
demonstrated by several authors (Carlsson-Kanyama, 1998; Cederberg and Mattsson, 2000; Bass<strong>et</strong>-Mens<br />
and van der Werf, 2005; Pell<strong>et</strong>ier, 2008; Thomassen <strong>et</strong> al., 2008; Williams <strong>et</strong> al., 2009), which draws attention<br />
to the orig<strong>in</strong> of the raw material. Part of the soybean used <strong>in</strong> feed for chickens <strong>in</strong> <strong>France</strong> comes from<br />
Brazil. So the impacts of soy production (<strong>in</strong>clud<strong>in</strong>g deforestation) should be considered as part of the impact<br />
of the chickens produced <strong>in</strong> <strong>France</strong>. Accord<strong>in</strong>g to Patentreger and Billon (2008), 74% of imports of soybeans
PARALLEL SESSION 6C: POULTRY AND PORK PRODUCTION SYSTEMS 8 th Int. Conference on <strong>LCA</strong> <strong>in</strong> the<br />
Agri-<strong>Food</strong> Sector, 1-4 Oct <strong>2012</strong><br />
<strong>in</strong> <strong>France</strong> are from Brazil. French soybean production covers only 3% of national consumption. So, <strong>in</strong> this<br />
paper, we try to answer the follow<strong>in</strong>g question: Do imported chickens from Brazil, fed with locally produced<br />
gra<strong>in</strong>s cause less (or more) impact than chickens produced <strong>in</strong> <strong>France</strong>, us<strong>in</strong>g a feed part of which comes from<br />
Brazil?<br />
2. M<strong>et</strong>hods<br />
We ran a comparison assum<strong>in</strong>g that the chicken produced <strong>in</strong> <strong>France</strong> (FR) was an <strong>in</strong>tensive system with a<br />
feed made with French <strong>in</strong>gredients (maize, wheat, and rapeseed) and with soybean from Brazil. To represent<br />
this system of standard <strong>in</strong>dustrial chicken <strong>in</strong> <strong>France</strong>, we chose the region of Br<strong>et</strong>agne, which concentrates<br />
among the largest quantities of animal production <strong>in</strong> Europe.<br />
For the Brazilian case (BR), chickens were fed ma<strong>in</strong>ly with maize and soybeans produced <strong>in</strong> the region <strong>in</strong><br />
which the chickens were raised. As Brazil is a huge country, we consider that there are two dist<strong>in</strong>ct systems.<br />
a) In the Center-West (CW) there is a typical large scale chicken production system. To simplify, we choose<br />
a specific site <strong>in</strong> Rio Verde, located <strong>in</strong> the Southwest of Goiás state. b) In the Southern Brazil (SO), we<br />
choose the West of Santa Catar<strong>in</strong>a state, a traditional region of <strong>in</strong>dustrial poultry production. The bureau of<br />
foreign trade of Brazil (SECEX, 2011) reported that 75% of exports of chicken come from the three southern<br />
states of the country. As we have these two scenarios that represent the Brazilian situation, we propose a<br />
scenario consist<strong>in</strong>g of 75% of SO chicken (considered representative for the three southern states) and 25%<br />
of CW chicken, add<strong>in</strong>g to this scenario the transport distances. Most stages of the life cycle were similar <strong>in</strong><br />
both cases, with the greatest differences be<strong>in</strong>g the transportation distances <strong>in</strong>volved. The distances considered<br />
were on average 1370 km from the Centre-West of Brazil to the port of Itajaí (Santa Catar<strong>in</strong>a state), and<br />
on average 500 km from the South of Brazil to the same port, <strong>in</strong> a refrigerated truck. Then, we considered<br />
more 9700 km of transoceanic ship to the port of Bordeaux, <strong>France</strong>, and thereafter, another 500 km of railway,<br />
to Br<strong>et</strong>agne. Table 1 shows the technical <strong>in</strong>dicators adopted for each studied system of poultry production.<br />
Table 1. Technical <strong>in</strong>dicators of poultry production systems <strong>in</strong> the West of <strong>France</strong> (FR - standard) and <strong>in</strong><br />
Brazil (BR).<br />
Indicator FR<br />
SO<br />
BR<br />
CW<br />
Rear<strong>in</strong>g time (days) 40 42 42<br />
F<strong>in</strong>al weight (kg) 1.92 2.48 2.40<br />
Density (animals/m²) 22.0 11.7 15.0<br />
Mortality (%) 4.1 4.4 4.2<br />
Feed conversion (kg/kg) 1.87 1.86 1.89<br />
No. of batches per year 6.0 6.4 6<br />
Carcass yield (%) 70 74.6 74.6<br />
From production site to Itajaí port – by truck (km) - 500 1370<br />
From Brazil (Itajaí) to <strong>France</strong> (Bordeaux) – by ship (km) - 9700 9700<br />
<strong>France</strong> <strong>in</strong>ternal transport – by tra<strong>in</strong> (km) 500 500 500<br />
Sources: FR system – Peltier & Kollen (2005); CW system - Carfantan (2007); SO system - Mart<strong>in</strong>s <strong>et</strong> al.,<br />
(2007).<br />
In our approach, we consider various scenarios for the production of maize and soybeans for animal feed<br />
<strong>in</strong> Brazil. For the CW scenario, we consider that a small part of the soybean area (and therefore also of the<br />
maize area, s<strong>in</strong>ce a field produces two crops with<strong>in</strong> a year, maize after soybeans) was deforested, i.e. the year<br />
preced<strong>in</strong>g the soybean or maize crop it was tropical ra<strong>in</strong>forest or Cerrado. The impacts associated with this<br />
deforestation are <strong>in</strong>cluded <strong>in</strong> the impacts of maize and soybeans from CW, where the CO2 is the ma<strong>in</strong> issue.<br />
Further <strong>in</strong>formation on how we estimated the impacts of deforestation and also on scenarios of feed <strong>in</strong>gredients<br />
production can be found <strong>in</strong> Prudêncio da Silva, 2011.<br />
The <strong>LCA</strong> for the systems studied beg<strong>in</strong>s with the production of <strong>in</strong>puts and goods used to produce crops,<br />
pass<strong>in</strong>g through the phases of crop production, gra<strong>in</strong> dry<strong>in</strong>g and process<strong>in</strong>g, feed manufactur<strong>in</strong>g, production<br />
of chicks, chicken rear<strong>in</strong>g, slaughter, cool<strong>in</strong>g and packag<strong>in</strong>g of whole chicken, <strong>in</strong>clud<strong>in</strong>g all transport phases,<br />
up to the slaughterhouse gate, add<strong>in</strong>g the transport to <strong>France</strong>, for the Brazilian scenario. The production and<br />
ma<strong>in</strong>tenance of chicken houses and of slaughterhouse build<strong>in</strong>gs and mach<strong>in</strong>es were not <strong>in</strong>cluded. Functional<br />
unit was 1 ton of chicken cooled and packed delivered <strong>in</strong> <strong>France</strong>. The m<strong>et</strong>hod used for life cycle impact as-<br />
547
PARALLEL SESSION 6C: POULTRY AND PORK PRODUCTION SYSTEMS 8 th Int. Conference on <strong>LCA</strong> <strong>in</strong> the<br />
Agri-<strong>Food</strong> Sector, 1-4 Oct <strong>2012</strong><br />
sessment was the CML 2 basel<strong>in</strong>e 2000 with modifications. We present results for the follow<strong>in</strong>g impact<br />
categories: acidification, eutrophication, climate change, terrestrial ecotoxicity, land occupation and total<br />
cumulative energy demand.<br />
3. Results<br />
The results showed that the stage of feed production <strong>in</strong>fluenced the potential impacts the most. Second<br />
stage was the chicken production, and the stage that contributes least to the environmental impacts was<br />
slaughter (<strong>in</strong>dustrialisation). Table 2 summarises the results of the comparison.<br />
Table 2. Contributions of the ma<strong>in</strong> life cycle stages for six impacts for 1 ton of chicken cooled and packaged<br />
produced <strong>in</strong> <strong>France</strong> (FR) and 1 ton of chicken cooled and packaged produced <strong>in</strong> Brazil (BR) and delivered <strong>in</strong><br />
<strong>France</strong>.<br />
Orig<strong>in</strong> of<br />
chicken<br />
<strong>France</strong><br />
(FR)<br />
Brazil<br />
(BR)<br />
(75% SO<br />
+<br />
25% CW)<br />
548<br />
Life cycle stage<br />
Acidification<br />
kg SO2eq<br />
Eutrophication<br />
kg PO4eq<br />
Climate<br />
change<br />
t CO2eq<br />
Terrestrial<br />
ecotoxicity<br />
kg 1,4DB<br />
eq<br />
Land occupation<br />
m²a * 1000<br />
Cumulative<br />
energy<br />
demand<br />
Slaughter 0.3 1.6 0.07 0.3 0.07 3.2<br />
Chicken production 27.8 6.6 0.80 1.3 0.23 6.0<br />
Feed production 12.4 12.8 2.30 7.0 3.52 20.8<br />
Total 40.5 21.0 3.17 8.6 3.82 30.0<br />
Slaughter 0.5 1.5 0.05 0.6 0.31 6.5<br />
Chicken production 20.1 4.7 0.59 1.7 0.11 7.3<br />
Feed production 24.3 14.1 1.51 7.0 3.14 17.5<br />
Transport Brazil-<br />
3.0 0.4 0.25 0.6 0.00 4.5<br />
<strong>France</strong> a<br />
Total 47.9 20.7 2.40 9.9 3.56 35.8<br />
Difference of total Brazil relative<br />
to FR – absolute and (%)<br />
7.4 (18) -0.3 (-1)<br />
-0.77 (-<br />
24)<br />
1.3 (15) 0.26 (-7) 5.8 (19)<br />
Transport Brazil-<strong>France</strong> relative<br />
to FR (%)<br />
7 2 8 7 0 15<br />
a<br />
Transport by refrigerated truck, ship and tra<strong>in</strong>, from Brazil slaughter gate to <strong>France</strong>. Other transport stages, like feed<br />
transport, chicken transport, <strong>in</strong>puts transport, <strong>et</strong>c. are <strong>in</strong>cluded <strong>in</strong> earlier stages.<br />
In Table 2, the penultimate l<strong>in</strong>e, we highlight how the Brazilian chicken delivered <strong>in</strong> Europe cause more<br />
(or less) impact than the chicken produced <strong>in</strong> <strong>France</strong>, accord<strong>in</strong>g to each impact category. In the last l<strong>in</strong>e, we<br />
highlight just the stage <strong>in</strong>ternational transport, i.e., how the transport of chicken from Brazil up to <strong>France</strong><br />
added on each impact category, related to chicken produced <strong>in</strong> <strong>France</strong>. This <strong>in</strong>ternational transport of chicken<br />
stage adds about 7-8% <strong>in</strong> potential of acidification, climate change and terrestrial ecotoxicity, and 15% of<br />
cumulative energy demand.<br />
4. Discussion<br />
Accord<strong>in</strong>g to our scenarios, for climate change and land occupation it is b<strong>et</strong>ter to produce chicken <strong>in</strong> Brazil<br />
and export it to <strong>France</strong> than to produce the same type of chicken <strong>in</strong> <strong>France</strong>. The <strong>in</strong>ternational transport<br />
stage contributed only 8% to GHG emissions, and therefore, when imported <strong>in</strong> <strong>France</strong>, the Brazilian chicken<br />
still had 24% less emissions than the French chicken (Table 2). Fig. 1 shows the ma<strong>in</strong>s contributions for<br />
climate change.<br />
GJ
PARALLEL SESSION 6C: POULTRY AND PORK PRODUCTION SYSTEMS 8 th Int. Conference on <strong>LCA</strong> <strong>in</strong> the<br />
Agri-<strong>Food</strong> Sector, 1-4 Oct <strong>2012</strong><br />
Figure 1. Contributions of the ma<strong>in</strong> life cycle stages for Climate Change for 1 ton of chicken cooled and<br />
packaged produced <strong>in</strong> <strong>France</strong> (FR) and <strong>in</strong> Brazil (BR) delivered <strong>in</strong> <strong>France</strong>.<br />
For the French chicken, about 33% of greenhouse gas emissions resulted from the use of soybean meal<br />
from Brazil, as well as 24% of energy demand. It is very likely that these values would be lower if other<br />
locally produced prote<strong>in</strong>-rich gra<strong>in</strong>s were used, <strong>in</strong> substitution of Brazilian soybeans, improv<strong>in</strong>g thus the<br />
environmental performance of the French chicken.<br />
An <strong>in</strong>terest<strong>in</strong>g effect occurred for energy demand. On average, the Brazilian chicken consumed almost<br />
the same energy per ton of chicken at the slaughterhouse gate regard<strong>in</strong>g French chicken, but due to energy<br />
demand for transportation to <strong>France</strong>, on delivery <strong>in</strong> <strong>France</strong> it required 15% more energy than the French<br />
chicken (Figure 2).<br />
Figure 2. Contributions of the ma<strong>in</strong> life cycle stages for Cumulative Energy Demand for 1 ton of chicken<br />
cooled and packaged produced <strong>in</strong> <strong>France</strong> (FR) and <strong>in</strong> Brazil (BR) delivered <strong>in</strong> <strong>France</strong>.<br />
Acidification was already higher for chicken production scenarios <strong>in</strong> Brazil, and transportation <strong>in</strong>creased<br />
acidification by 7%, reach<strong>in</strong>g 18% more acidify<strong>in</strong>g emissions than the French chicken on delivery <strong>in</strong> <strong>France</strong><br />
(Figure 3). A similar phenomenon occurred for terrestrial ecotoxicity.<br />
549
PARALLEL SESSION 6C: POULTRY AND PORK PRODUCTION SYSTEMS 8 th Int. Conference on <strong>LCA</strong> <strong>in</strong> the<br />
Agri-<strong>Food</strong> Sector, 1-4 Oct <strong>2012</strong><br />
Figure 3. Contributions of the ma<strong>in</strong> life cycle stages for Acidification for 1 ton of chicken cooled and packaged<br />
produced <strong>in</strong> <strong>France</strong> (FR) and <strong>in</strong> Brazil (BR) delivered <strong>in</strong> <strong>France</strong>.<br />
In the FR system, the most emissions (62%) of substances that contribute to the total acidification potential,<br />
come from ammonia emitted <strong>in</strong> the chicken house. In the BR system, the ammonia emission <strong>in</strong> chicken<br />
house is only 39% of the total acidification potential. But on the other hand, <strong>in</strong> Brazil the stage of feed production<br />
contributes over 44% of emissions of acidify<strong>in</strong>g substances, ma<strong>in</strong>ly because of the ammonia emitted<br />
due to the use of urea as a nitrogen fertiliser for maize production.<br />
From an environmental po<strong>in</strong>t of view, import<strong>in</strong>g chicken from Brazil rather than produc<strong>in</strong>g it <strong>in</strong> <strong>France</strong><br />
with Brazilian soybeans, was b<strong>et</strong>ter with respect to climate change and land occupation, which are both<br />
global impacts. With respect to acidification, terrestrial ecotoxicity and energy demand chicken imported<br />
from Brazil had larger impacts than the chicken produced <strong>in</strong> <strong>France</strong>. It is therefore not simple to answer this<br />
question. If one considers that climate change is the most important environmental issue, then the import of<br />
Brazilian chicken would seem preferable and stopp<strong>in</strong>g deforestation <strong>in</strong> Brazil would strongly reduce the climate<br />
change impact of both Brazilian and French chicken.<br />
5. Conclusion<br />
The gra<strong>in</strong> production stage is the largest contributor to the overall environmental impacts along the<br />
chicken meat supply production cha<strong>in</strong>. In general, recommendations that may improve the environmental<br />
performance of feed crop production will also reduce the impacts of chicken production.<br />
Import<strong>in</strong>g chicken from Brazil rather than produc<strong>in</strong>g it <strong>in</strong> <strong>France</strong> with Brazilian soybeans, was b<strong>et</strong>ter with<br />
respect to climate change and land occupation. With respect to acidification, terrestrial ecotoxicity and energy<br />
demand chicken imported from Brazil had larger impacts than the chicken produced <strong>in</strong> <strong>France</strong>. If one<br />
considers that climate change is the most important environmental issue, then the import of Brazilian chicken<br />
would seem preferable.<br />
6. References<br />
ABEF – Associação Brasileira de Exportatores de Frango, 2010. Estatísticas [onl<strong>in</strong>e] Available from: . 15<br />
jul 2011.<br />
Bass<strong>et</strong>-Mens C, van der Werf HMG., 2005. Scenario-based environmental assessment of farm<strong>in</strong>g systems: the case of pig production<br />
<strong>in</strong> <strong>France</strong>. Agriculture, Ecosystems & Environment 105: 127-144.<br />
Carfantan, J.-Y., 2007. Le poul<strong>et</strong>-voyageur. Dynamique <strong>et</strong> prospective de la filiere poul<strong>et</strong> bresilienne. Uberlândia, Brasil: Céleres.<br />
147 p.<br />
Carlsson-Kanyama A., 1998. Energy consumption and emissions of greenhouse gases <strong>in</strong> the life-cycle of potatoes, pork meat, rice<br />
and yellow peas. Department of Systems Ecology, University of Stockholm.<br />
Cederberg C, Mattsson B., 2000. Life cycle assessment of milk production - a comparison of conventional and organic farm<strong>in</strong>g.<br />
Journal of Cleaner Production 8: 49-60.<br />
Jez, C.; Beaumont, C.; Magdela<strong>in</strong>e, P., 2011. Poultry production <strong>in</strong> 2025: learn<strong>in</strong>g from future scenarios. World’s Poultry Science<br />
Journal, v. 67, n. 01, p. 105-114.<br />
Magdela<strong>in</strong>e, P., 2008. La situation des filières avicoles françaises. Rapport réalisé dans le cadre du proj<strong>et</strong> AVITER – ITAVI, Paris,<br />
75p.<br />
Mart<strong>in</strong>s, F. M.; Talam<strong>in</strong>i, D. J. D.; Souza, M. V. N. de., 2007. Coeficientes técnicos e custos agregados na cadeia produtiva do frango<br />
no Oeste Catar<strong>in</strong>ense. Concórdia, SC, Brazil: Embrapa Suínos e Aves. 50 p.<br />
Patentreger B, Billon A., 2008. L’impact de l’agriculture <strong>et</strong> de l’alimentation <strong>in</strong>dustrielles sur la forêt dans le monde - rôle de la<br />
<strong>France</strong>. WWF - <strong>France</strong>: Paris, <strong>France</strong>.<br />
Pell<strong>et</strong>ier N., 2008. Environmental performance <strong>in</strong> the US broiler poultry sector: Life cycle energy use and greenhouse gas, ozone<br />
depl<strong>et</strong><strong>in</strong>g, acidify<strong>in</strong>g and eutrophy<strong>in</strong>g emissions. Agricultural Systems 98: 67-73. DOI: doi: 10.1016/j.agsy.2008.03.007.<br />
550
PARALLEL SESSION 6C: POULTRY AND PORK PRODUCTION SYSTEMS 8 th Int. Conference on <strong>LCA</strong> <strong>in</strong> the<br />
Agri-<strong>Food</strong> Sector, 1-4 Oct <strong>2012</strong><br />
Peltier, J.-L.; Kollen, A., 2005. La filière avicole - Volaille standard (poul<strong>et</strong>, d<strong>in</strong>des, p<strong>in</strong>tades). Catalogue des Filières. <strong>France</strong>:<br />
Chambre d’Agriculture AIN. Available <strong>in</strong>: . 19 dec 2005.<br />
Prudêncio da Silva, V., 2011. Effects of <strong>in</strong>tensity and scale of production on environmental impacts of poultry meat production<br />
cha<strong>in</strong>s. Rennes, <strong>France</strong> / Florianópolis, Brazil: Agrocampus Ouest - Université Européenne de Br<strong>et</strong>agne / Universidade Federal<br />
de Santa Catar<strong>in</strong>a. Thesis. 192p.<br />
SECEX – Secr<strong>et</strong>aria Executiva do M<strong>in</strong>istério do Desenvolvimento, Indústria e Comércio Exterior - Bureau of foreign trade of Brazil,<br />
2011. Available <strong>in</strong>: . 10 jul 2011.<br />
Thomassen MA, van Calker KJ, Smits MCJ, Iepema GL, de Boer IJM., 2008. Life cycle assessment of conventional and organic<br />
milk production <strong>in</strong> the N<strong>et</strong>herlands. Agricultural Systems 96: 95-107.<br />
Williams AG, Audsley E, Sandars DL., 2009. A lifecycle approach to reduc<strong>in</strong>g the environmental impacts of poultry production.<br />
Presented at the 17th European Symposium on Poultry Nutrition. End<strong>in</strong>burg, UK. 23 August, 2009.<br />
551
PARALLEL SESSION 6C: POULTRY AND PORK PRODUCTION SYSTEMS 8 th Int. Conference on <strong>LCA</strong> <strong>in</strong> the<br />
Agri-<strong>Food</strong> Sector, 1-4 Oct <strong>2012</strong><br />
552<br />
Effect of <strong>et</strong>hics on <strong>in</strong>tegral ecological impact of organic eggs<br />
S.E.M. Dekker 1 , I.J.M. de Boer 2 , A.J.A. Aarn<strong>in</strong>k 3 , P.W.G., Groot Koerkamp 1<br />
1 Farm Technology Group, Wagen<strong>in</strong>gen University, P.O. box 17, 6700 AA, Wagen<strong>in</strong>gen, the N<strong>et</strong>herlands<br />
2 Animal Production Systems Group, Wagen<strong>in</strong>gen University, P.O. box 338, 6700 AH, Wagen<strong>in</strong>gen, the N<strong>et</strong>herlands<br />
3 Wagen<strong>in</strong>gen UR Livestock Research, P.O. box 65, 8200 AB, Lelystad, the N<strong>et</strong>herlands<br />
Correspond<strong>in</strong>g author. E-mail: sanne.dekker@wur.nl<br />
ABSTRACT<br />
Organic agriculture has a specific perspective on susta<strong>in</strong>ability, captured <strong>in</strong> their goal, def<strong>in</strong>ition and four pr<strong>in</strong>ciples of organic agriculture<br />
and result<strong>in</strong>g certification (IFOAM, <strong>2012</strong>). We refer to this perspective as the organic-<strong>et</strong>hical framework. For organic egg<br />
production, this framework implies three ma<strong>in</strong> requirements: (1) loose hen hous<strong>in</strong>g, (2) outdoor access, and (3) limited use of external<br />
resources, i.e. artificial fertilisers, pesticides, herbicides, gen<strong>et</strong>ically modified organisms, and medication. Our research objective<br />
was to assess the effect of these three requirements on the <strong>in</strong>tegral ecological impact of Dutch organic egg production. We approached<br />
this objective <strong>in</strong> three steps. In step 1 we compared life cycle assessment (<strong>LCA</strong>) results of egg production with and without<br />
an organic <strong>et</strong>hical framework. In step 2 we identified ma<strong>in</strong> ecological issues of current Dutch organic egg production by means of<br />
<strong>LCA</strong>. In step 3 we explored options to reduce <strong>in</strong>tegral ecological impact of Dutch organic egg production with<strong>in</strong> the boundaries of<br />
the organic <strong>et</strong>hical framework, i.e. replace s<strong>in</strong>gle-tiered with multi-tiered loose hen hous<strong>in</strong>g and replace imported with regional di<strong>et</strong><br />
<strong>in</strong>gredients.<br />
Comparison of battery cage with barn egg production shows that the requirement of loose hen hous<strong>in</strong>g results <strong>in</strong> a 12% to 176%<br />
higher impact for the ecological issues studied, except for phosphorus (P) deficit which was equal (Table 1). This higher impact is<br />
ma<strong>in</strong>ly expla<strong>in</strong>ed by a higher conversion of feed to eggs of loose housed hens (2.33 kg feed kg -1 egg) compared with hens <strong>in</strong> battery<br />
cages (1.99 kg feed kg -1 egg) (Dekker <strong>et</strong> al., 2011b). A second reason for the higher acidification potential of loose hen hous<strong>in</strong>g was<br />
that reduction of ammonia emission by dry<strong>in</strong>g and removal of manure <strong>in</strong> loose lay<strong>in</strong>g hen houses is problematic. Comparison of barn<br />
with free range egg production shows that the requirement of access to an outdoor run results <strong>in</strong> a relative small, i.e. 0% to 10%,<br />
<strong>in</strong>crease of the ecological impact (Table 1). Comparison of free range and organic egg production shows that the requirement of<br />
limited use of external resources results <strong>in</strong> a 10% lower global warm<strong>in</strong>g potential, a 15% lower energy use, a 93% lower fossil P use,<br />
a 108% lower nitrogen (N) surplus and a 114% lower P surplus, but a 82% higher land occupation, a 68% higher acidification potential,<br />
a 1767% higher N surplus and a 900% higher P deficit (Table 1). We found that differences <strong>in</strong> the ecological impact of egg<br />
production systems with and without limited use of external resources resulted ma<strong>in</strong>ly from differences <strong>in</strong> type and amount of fertilisation<br />
and conversion of feed to eggs. Multi-tiered hous<strong>in</strong>g to dry and remove manure (mitigation hous<strong>in</strong>g <strong>in</strong> Table 1; Dekker <strong>et</strong> al.,<br />
2011a) and production of di<strong>et</strong> <strong>in</strong>gredients and eggs <strong>in</strong> the same region to assure availability of manure and <strong>in</strong>crease yields (mitigation<br />
di<strong>et</strong> <strong>in</strong> Table 1; Dekker <strong>et</strong> al., <strong>2012</strong>b), have potential to reduce the ecological impact of organic egg production with<strong>in</strong> the <strong>et</strong>hical<br />
boundaries of organic egg production. If these mitigation options are applied we predict a lower energy use, fossil P use, N surplus<br />
and P surplus, but a higher global warm<strong>in</strong>g potential, land occupation, acidification potential, N deficit and P deficit for organic<br />
compared with battery cage egg production.<br />
We conclude that <strong>in</strong>creases of the ecological impact caused by the organic <strong>et</strong>hical framework ma<strong>in</strong>ly result from <strong>in</strong>efficient N and P<br />
management and <strong>in</strong>efficient conversion of feed to eggs. Issues <strong>in</strong> the current egg production cha<strong>in</strong> regard<strong>in</strong>g manure management<br />
are: (1) a lack of regionally available manure (Dekker <strong>et</strong> al., 2011b), (2) unbalanced application and N-P ratios of manure fertiliser,<br />
(3) high N-emissions from faeces <strong>in</strong> loose hous<strong>in</strong>g systems, and (4) loss of N and P from manure <strong>in</strong> the outdoor run (Dekker <strong>et</strong> al.,<br />
2011b; Dekker <strong>et</strong> al., <strong>2012</strong>a). The higher conversion of feed to eggs may be caused by: (1) a higher body mass of loose housed hens,<br />
(2) <strong>in</strong>creased freedom of movement, (3) prohibited use of external resources, caused by a worse am<strong>in</strong>o acid profile of the di<strong>et</strong>, (4)<br />
limited use of medication, and (5) a smaller number of hens per m 2 <strong>in</strong> the hen house, which generally results <strong>in</strong> a lower <strong>in</strong>door temperature<br />
(Van Knegsel and van Krimpen, 2008; Dekker <strong>et</strong> al., <strong>2012</strong>b; Dekker <strong>et</strong> al., 2011a). Research is required to d<strong>et</strong>erm<strong>in</strong>e<br />
wh<strong>et</strong>her <strong>in</strong>efficient N and P management and <strong>in</strong>efficient conversion of feed to eggs <strong>in</strong> organic egg production must be accepted as an<br />
implication of the organic <strong>et</strong>hical framework or can be further reduced with<strong>in</strong> the boundaries of the organic <strong>et</strong>hical framework.
PARALLEL SESSION 6C: POULTRY AND PORK PRODUCTION SYSTEMS 8 th Int. Conference on <strong>LCA</strong> <strong>in</strong> the<br />
Agri-<strong>Food</strong> Sector, 1-4 Oct <strong>2012</strong><br />
Table 1. Production characteristics and ecological impacts of exist<strong>in</strong>g egg production systems with and without<br />
three <strong>et</strong>hical requirements (i.e. loose hen hous<strong>in</strong>g, outdoor access, and limited use of external resources),<br />
mitigation hous<strong>in</strong>g (i.e. replace s<strong>in</strong>gle-tiered with multi-tiered hous<strong>in</strong>g), and di<strong>et</strong> (i.e. replace imported with<br />
regional di<strong>et</strong> <strong>in</strong>gredients <strong>in</strong> percent relative to battery cage egg production).<br />
Battery cage<br />
eggs a<br />
Barn<br />
eggs a<br />
Free range<br />
eggs a<br />
Organic<br />
eggs a<br />
Mitigation<br />
hous<strong>in</strong>g a<br />
Mitigation<br />
di<strong>et</strong> b<br />
Loose hen hous<strong>in</strong>g No Yes Yes Yes Yes Yes<br />
Outdoor access<br />
Limited use of external<br />
No No Yes Yes Yes Yes<br />
resources No No No Yes Yes Yes<br />
S<strong>in</strong>gle-tiered hous<strong>in</strong>g No Yes Yes Yes No No<br />
Multi-tiered hous<strong>in</strong>g No No No No Yes Yes<br />
Regional di<strong>et</strong> <strong>in</strong>gredients No No No No No Yes<br />
Global warm<strong>in</strong>g potential 100% 120% 123% 113% 114% 104%<br />
Energy use 100% 112% 115% 100% 98% 77%<br />
Land occupation 100% 115% 125% 207% 207% 141%<br />
Fossil P use 100% 115% 118% 25% 25% -<br />
Acidification potential 100% 276% 283% 351% 209% 207%<br />
N deficit 100% 133% 133% 1900% 1900% 1615%<br />
P deficit 100% 100% 100% 1000% 1000% 410%<br />
N surplus 100% 115% 122% 14% 14% 14%<br />
P surplus 100% 115% 124% 10% 10% 8%<br />
a b<br />
Dekker <strong>et</strong> al., 2011b; Dekker <strong>et</strong> al., <strong>2012</strong>b<br />
References<br />
Dekker, S.E.M., de Boer, I.J.M., Aarn<strong>in</strong>k, A.J.A., Groot Koerkamp, P.W.G., 2011a. Emissions of ammonia, nitrous oxide, and m<strong>et</strong>hane<br />
from aviaries with organic lay<strong>in</strong>g hen husbandry. Biosystems Eng<strong>in</strong>eer<strong>in</strong>g, 110: 123-133.<br />
Dekker, S.E.M., de Boer, I.J.M., Vermeij, I., Aarn<strong>in</strong>k, A.J.A., Groot Koerkamp, P.W.G., 2011b. Ecological and economic evaluation<br />
of Dutch egg production systems. Livestock Science, 139 (1-2): 109-121.<br />
Dekker, S.E.M., Aarn<strong>in</strong>k A.J.A., de Boer, I.J.M., Groot Koerkamp, P.W.G., <strong>2012</strong>a. Total loss and distribution of nitrogen and phosphorus<br />
<strong>in</strong> the outdoor run of lay<strong>in</strong>g hens. British Poultry Science, (<strong>in</strong> press).<br />
Dekker, S.E.M., de Boer, I.J.M., van Krimpen, M.M., Aarn<strong>in</strong>k, A.J.A., Groot Koerkamp, P.W.G., <strong>2012</strong>b. Effect of composition of<br />
concentrates on ecological impact of organic egg production. Livestock Science, (<strong>in</strong> press).<br />
IFOAM, <strong>2012</strong>. http://www.ifoam.org.IFOAM: International Federation of Organic Agricultural Movements.<br />
Van Knegsel, A.T.M., van Krimpen, M.M., 2008. Energy and prote<strong>in</strong> requirements of organic housed poultry (Energie- en eiwitbehoefte<br />
van biologisch gehouden pluimvee). Report 122. Wagen<strong>in</strong>gen UR Animal Sciences Group, Lelystad, N<strong>et</strong>herlands, 22 pp.<br />
553
PARALLEL SESSION 6C: POULTRY AND PORK PRODUCTION SYSTEMS 8 th Int. Conference on <strong>LCA</strong> <strong>in</strong> the<br />
Agri-<strong>Food</strong> Sector, 1-4 Oct <strong>2012</strong><br />
Environmental impacts of different pork and chicken meat production<br />
systems <strong>in</strong> Switzerland and selected import sources<br />
554<br />
Florian Grandl * , Mart<strong>in</strong>a Alig, Johanna Mieleitner, Thomas Nemecek, Gérard Gaillard<br />
Agroscope Reckenholz-Tänikon Research Station ART, CH-8046 Zurich, Switzerland<br />
Correspond<strong>in</strong>g author. E-mail: florian.grandl@art.adm<strong>in</strong>.ch<br />
ABSTRACT<br />
Three production systems <strong>in</strong> Switzerland were compared to selected imports for pork and chicken meat. The analysis was carried out<br />
at the level of the farm gate and at the r<strong>et</strong>ail store gate. Agricultural production was responsible for at least 75% of the environmental<br />
impacts <strong>in</strong> each analysed category, so it was more important how the animals were produced than where production occurs. In all<br />
production systems, feedstuffs were the dom<strong>in</strong>ant <strong>in</strong>puts. For pork, the differences b<strong>et</strong>ween conventional and label production were<br />
m<strong>in</strong>or, as the level of productivity rema<strong>in</strong>ed more or less the same. In chicken production, the differences were considerable. Fatten<strong>in</strong>g<br />
performance <strong>in</strong> label production was lower as slower grow<strong>in</strong>g stra<strong>in</strong>s are used. A reduction of environmental impacts by improved<br />
feed<strong>in</strong>g seems to be most promis<strong>in</strong>g. More <strong>in</strong>tensive production systems tend to have less environmental impacts. However,<br />
systems with improved animal welfare can produce with similar environmental impacts as long as the animal performance reaches<br />
the same level of productivity.<br />
Keywords: <strong>LCA</strong>, environmental impacts, meat production systems, pork, chicken<br />
1. Introduction<br />
Animal production faces many challenges today and consumer awareness of animal welfare and of the<br />
environmental impacts of animal production rises. However, there is a risk of a conflict of goals when only<br />
improv<strong>in</strong>g one of these aspects. So consumers, producers and policy makers need comprehensive <strong>in</strong>formation<br />
on the impacts of differently produced agricultural commodities <strong>in</strong> order to make a decision on what<br />
products to buy and to produce. In this study, we compared three different production systems (conventional,<br />
label production with improved animal welfare and organic) <strong>in</strong> Switzerland and selected import products<br />
both for pork and chicken meat. The aim was to analyse the environmental impacts of the meat production<br />
systems and to identify their major drivers as well as possible strategies meant for improv<strong>in</strong>g their environmental<br />
performance.<br />
2. Data and M<strong>et</strong>hods<br />
Data and design of model farms for Swiss pig production systems were derived from the project Life Cycle<br />
Assessment – Farm Accountancy Data N<strong>et</strong>work (<strong>LCA</strong>-FADN), where data from more than 100 farms<br />
have been collected (Hersener <strong>et</strong> al., 2011). For Swiss chicken production, production data were collected<br />
from a large Swiss chicken meat processor. The agricultural production of imported pork and chicken meat<br />
was modelled accord<strong>in</strong>g to literature, statistical and expert data from the particular countries (Alig <strong>et</strong> al.,<br />
<strong>2012</strong>). Agricultural production data for pig and chicken is shown <strong>in</strong> Table 1 and Table 2. For Switzerland,<br />
three different production systems were <strong>in</strong>vestigated: Swiss conventional production (CH conv.), production<br />
with improved animal welfare standards (CH label) and organic production (CH organic). Imported meat<br />
was assumed to be produced conventionally. In case of Brazilian chicken meat, two production systems are<br />
modelled <strong>in</strong> order to represent the regionally different situation <strong>in</strong> the ma<strong>in</strong> production areas <strong>in</strong> the south (BR<br />
S) and <strong>in</strong> the centre-west of Brazil (BR CW).<br />
Post-agricultural processes <strong>in</strong>cluded transport of animals, slaughter<strong>in</strong>g and meat process<strong>in</strong>g <strong>in</strong> Switzerland<br />
and/or the country of orig<strong>in</strong> and packag<strong>in</strong>g and transport of the meat pieces ready for sale at r<strong>et</strong>ail store.<br />
Data for slaughter and meat process<strong>in</strong>g and storage and transport were obta<strong>in</strong>ed from a Swiss meat processor<br />
and a Swiss r<strong>et</strong>ail company as well as from literature.<br />
<strong>LCA</strong>s were calculated with the m<strong>et</strong>hod SA<strong>LCA</strong> (Swiss Agricultural Life Cycle Assessment, Nemecek <strong>et</strong><br />
al., 2010). The analysis was carried out at two levels: at farm gate with the functional unit of 1 kg live weight<br />
(LW) and at the r<strong>et</strong>ail store gate, with the functional unit of 1 kg packed and cooled meat.<br />
The environmental impacts considered <strong>in</strong> this analysis are summarised <strong>in</strong> Table 3. The results are grouped<br />
<strong>in</strong>to three ma<strong>in</strong> categories (resource use management, nutrient management and toxicity) and cover relevant<br />
environmental impacts of agricultural production and food products. For more d<strong>et</strong>ails, see Nemecek <strong>et</strong> al.,<br />
(2010).
PARALLEL SESSION 6C: POULTRY AND PORK PRODUCTION SYSTEMS 8 th Int. Conference on <strong>LCA</strong> <strong>in</strong> the<br />
Agri-<strong>Food</strong> Sector, 1-4 Oct <strong>2012</strong><br />
Table 1. Agricultural production data for three pig production systems <strong>in</strong> Switzerland (CH conv., label, organic),<br />
Germany (DE) and Denmark (DK).<br />
CH DE DK<br />
conv. label organic<br />
Rate of turnover [number/year] 3.0 3.1 2.9 2.7 3.9<br />
Mortality [%] 1.29 1.12 1.12 3.0 4.3<br />
Live weight at start [kg LG] 24 24 24 25 30<br />
Live weight at slaughter [kg LG] 102 100 103 115 102<br />
Length of fatten<strong>in</strong>g period [d] 106 103 110 128 89<br />
Daily ga<strong>in</strong>s [g/d] 740 740 720 700 810<br />
Feed conversion ratio 1: [kg/kg] 2.87 3.04 2.85 3.00 2.76<br />
Live weight ga<strong>in</strong> per place unit [kg LW/year] 234 236 229 243 269<br />
Floor type partly partly partly fully slatted 50:50 partly /<br />
slatted slatted slatted<br />
fully slatted<br />
Outdoor run no yes yes no no<br />
Table 2. Agricultural production data for three chicken production systems <strong>in</strong> Switzerland (CH conv., label,<br />
organic) and <strong>France</strong> (FR) and Brazil (BR CW and BR S).<br />
CH FR BR<br />
conv. label organic CW S<br />
Length of fatten<strong>in</strong>g period [d] 35 56 21 + 42 a 40 42 42<br />
Rate of turnover [number/year] 8.69 5.79 7.45 6.0 6.0 6.4<br />
Break b<strong>et</strong>ween production cycles [d] 7 7 7 20.8 18.8 15.0<br />
Live weight at slaughter [kg LG] 1.92 1.85 1.75 1.92 2.40 2.48<br />
Daily ga<strong>in</strong>s [g/d] 54 32 27 47 56 58<br />
Feed conversion ratio 1: [kg/kg] 1.65 2.17 2.42 1.87 1.89 1.86<br />
Mortality [%] 3.05 2.50 3.50 4.1 4.2 4.4<br />
Outdoor run [m 2 per animal] - 2.00 2.05 - - -<br />
a A 21-day rear<strong>in</strong>g phase takes places <strong>in</strong> a second build<strong>in</strong>g parallel to fatten<strong>in</strong>g.<br />
Table 3. Considered environmental impacts (Nemecek <strong>et</strong> al., 2010).<br />
Category Environmental impact<br />
Resource use Demand for non-renewable energy resources (oil, coal and lignite, natural gas and uranium), us<strong>in</strong>g<br />
management the upper heat<strong>in</strong>g or gross calorific value for fossil fuels accord<strong>in</strong>g to Hischier <strong>et</strong> al., (2010).<br />
Global warm<strong>in</strong>g potential over 100 years (accord<strong>in</strong>g to IPCC, 2007).<br />
Ozone formation potential (so-called “summer smog” accord<strong>in</strong>g to the EDIP2003 m<strong>et</strong>hod,<br />
Hauschild und Pott<strong>in</strong>g, 2003).<br />
Use of phosphorus and potassium resources is based on life cycle <strong>in</strong>ventory (LCI) data<br />
Land comp<strong>et</strong>ition is based on LCI data accord<strong>in</strong>g to the CML01 m<strong>et</strong>hod (Gu<strong>in</strong>ée <strong>et</strong> al., 2001)<br />
Deforestation is calculated based on LCI data as the difference of area transformed from forest and<br />
area transformed to forest<br />
Total water use (blue) is calculated on LCI data<br />
Nutrient Eutrophication potential (impact of the losses of N and P to aquatic and terrestrial ecosystems, ac-<br />
management cord<strong>in</strong>g to the EDIP2003 m<strong>et</strong>hod, Hauschild und Pott<strong>in</strong>g, 2003).<br />
Acidification potential (impact of acidify<strong>in</strong>g substances released <strong>in</strong>to ecosystems, accord<strong>in</strong>g to the<br />
EDIP2003 m<strong>et</strong>hod, Hauschild und Pott<strong>in</strong>g, 2003).<br />
Toxicity Terrestrial and aquatic ecotoxicity potentials (accord<strong>in</strong>g to the CML01 m<strong>et</strong>hod, Gu<strong>in</strong>ée <strong>et</strong> al., 2001).<br />
Human toxicity potential (impact of toxic pollutants on human health, accord<strong>in</strong>g to the CML01<br />
m<strong>et</strong>hod, Gu<strong>in</strong>ée <strong>et</strong> al., 2001).<br />
3. Results<br />
When consider<strong>in</strong>g the whole supply cha<strong>in</strong> up to the r<strong>et</strong>ail store, agricultural production was found to be<br />
responsible for at least 75% of the environmental impacts <strong>in</strong> each analysed environmental impact category<br />
(Figure 1 and Figure 2). Post-agricultural processes were of noticeable <strong>in</strong>fluence only for the consumption of<br />
non renewable energy and to some extent for global warm<strong>in</strong>g potential, ozone formation and human toxicity.<br />
Most of the environmental impacts from post-agricultural processes orig<strong>in</strong>ated from slaughter<strong>in</strong>g and meat<br />
process<strong>in</strong>g and from transports <strong>in</strong> case of imported meat (see Mieleitner <strong>et</strong> al., (<strong>2012</strong>) for more d<strong>et</strong>ails).<br />
The major potential of environmental improvement lies <strong>in</strong> animal production. Therefore, the rest of the<br />
result section focuses only the agricultural processes and refers to the functional unit of 1 kg LW.<br />
Figure 1 and Figure 2 show the differences <strong>in</strong> environmental impacts b<strong>et</strong>ween the three Swiss production<br />
systems of pork and chicken meat, respectively (1 kg meat at the r<strong>et</strong>ail store). Both show substantial differences<br />
b<strong>et</strong>ween organic and conventional production <strong>in</strong> arable land comp<strong>et</strong>ition (e.g. <strong>in</strong> pig production:<br />
3.8 m 2 a per kg LW vs. 6.9 m 2 a per kg LW under conventional and organic conditions), nutrient management<br />
555
PARALLEL SESSION 6C: POULTRY AND PORK PRODUCTION SYSTEMS 8 th Int. Conference on <strong>LCA</strong> <strong>in</strong> the<br />
Agri-<strong>Food</strong> Sector, 1-4 Oct <strong>2012</strong><br />
and toxicity. These differences are expla<strong>in</strong>ed by the different cropp<strong>in</strong>g practise <strong>in</strong> organic and conventional<br />
agriculture. In organic agriculture, the abandonment of pesticides leads to lower toxic impacts and the application<br />
of organic <strong>in</strong>stead of m<strong>in</strong>eral fertilisers <strong>in</strong>creases ammonia emissions (e.g. <strong>in</strong> pig production: terr.<br />
eutrophication is 1.9 m 2 per kg LW <strong>in</strong> conventional production vs. 4.19 m 2 per kg LW under organic farm<strong>in</strong>g)<br />
but reduces the use of phosphorus and potassium resources compared to conventional farm<strong>in</strong>g. Lower<br />
yields per area <strong>in</strong> organic farm<strong>in</strong>g require a larger area for feed production.<br />
Figure 1. Relative environmental impacts for 1 kg of pork at farm gate and at the r<strong>et</strong>ail store for three production<br />
systems <strong>in</strong> Switzerland. 100% = conventional production <strong>in</strong> Switzerland.<br />
Figure 2. Relative environmental impacts for 1 kg of chicken meat at farm gate and at the r<strong>et</strong>ail store for<br />
three production systems <strong>in</strong> Switzerland. 100% = conventional production <strong>in</strong> Switzerland.<br />
Figure 2 also clearly <strong>in</strong>dicates the difference <strong>in</strong> efficiency of the chicken production systems. Animals <strong>in</strong><br />
label and organic production have a lower fatten<strong>in</strong>g performance (see Table 2), ma<strong>in</strong>ly due to the use of<br />
slower grow<strong>in</strong>g stra<strong>in</strong>s which are b<strong>et</strong>ter adapted to label production conditions. Compar<strong>in</strong>g conventional and<br />
label production at the farm level, label production has around 30% higher environmental impacts than conventional<br />
production (e.g. energy demand is 17.3 for conventional and 26.93 MJ-eq. per kg LW for organic<br />
chicken meat, respectively), which is more or less the same as difference <strong>in</strong> fatten<strong>in</strong>g performance. In pig<br />
production, the differences b<strong>et</strong>ween conventional production and production under improved animal welfare<br />
conditions are m<strong>in</strong>or, as the level of productivity (daily ga<strong>in</strong>s, feed conversion, <strong>et</strong>c.) rema<strong>in</strong>s more or less the<br />
556<br />
250%<br />
200%<br />
150%<br />
100%<br />
50%<br />
0%<br />
300%<br />
250%<br />
200%<br />
150%<br />
100%<br />
50% 50%<br />
0%<br />
Energy demand, non renewable<br />
Energy demand, non renewable<br />
Energy demand, non renewable<br />
Energy demand, non renewable<br />
conv. label organic<br />
post-agricultural processes<br />
Global warm<strong>in</strong>g potential<br />
Global warm<strong>in</strong>g potential<br />
Ozone formation (Veg<strong>et</strong>ation)<br />
Ozone formation (Veg<strong>et</strong>ation)<br />
Ozone formation (Human)<br />
Ozone formation (Human)<br />
Resources (phosphorus)<br />
Resources (phosphorus)<br />
Resources (phosphorus)<br />
Resources (phosphorus)<br />
Resources (potassium)<br />
Resources (potassium)<br />
Resources (potassium)<br />
Resources (potassium)<br />
Land comp<strong>et</strong>ition, arable<br />
Land comp<strong>et</strong>ition, arable<br />
Land comp<strong>et</strong>ition, arable<br />
Land comp<strong>et</strong>ition, arable<br />
Deforestation<br />
Deforestation<br />
Deforestation<br />
Deforestation<br />
Water use (blue water)<br />
Water use (blue water)<br />
Water use (blue water)<br />
Water use (blue water)<br />
Eutrophication terr.<br />
Eutrophication terr.<br />
Eutrophication terr.<br />
Eutrophication terr.<br />
Eutrophication aq. N<br />
Eutrophication aq. N<br />
Eutrophication aq. N<br />
Eutrophication aq. N<br />
Eutrophication aq. P<br />
Eutrophication aq. P<br />
Eutrophication aq. P<br />
Eutrophication aq. P<br />
Acidification<br />
Acidification<br />
Acidification<br />
Acidification<br />
Ecotox terr.<br />
Ecotox terr.<br />
Ecotox terr.<br />
Ecotox terr.<br />
Ecotox aq.<br />
Ecotox aq.<br />
Ecotox aq.<br />
Ecotox aq.<br />
Human tox<br />
Human tox<br />
Human tox<br />
Human tox
PARALLEL SESSION 6C: POULTRY AND PORK PRODUCTION SYSTEMS 8 th Int. Conference on <strong>LCA</strong> <strong>in</strong> the<br />
Agri-<strong>Food</strong> Sector, 1-4 Oct <strong>2012</strong><br />
same and hardly any further <strong>in</strong>puts are needed. There is only an <strong>in</strong>crease <strong>in</strong> eutrophication and acidification<br />
potential which results from higher ammonia emissions due to the straw bedd<strong>in</strong>g and the outdoor run.<br />
Both conventional pig and chicken production are relatively standardised production systems <strong>in</strong> developed<br />
countries. Animal gen<strong>et</strong>ics and production techniques and m<strong>et</strong>hods are similar and therefore differences<br />
<strong>in</strong> animal performance are rather small (see Table 1 and Table 2). Accord<strong>in</strong>gly, Figure 3 shows similar results<br />
<strong>in</strong> environmental performance for pig production <strong>in</strong> different countries. The same applies for chicken<br />
production, where production is even more standardised all over the world. A decisive factor the impact<br />
category deforestation is the production of soybean meal. So different shares of this feedstuff <strong>in</strong> di<strong>et</strong>s and the<br />
use of soybeans from non-deforested areas <strong>in</strong>fluences this category greatly and has also an effect on global<br />
warm<strong>in</strong>g potential due to CO2-emissions from deforested areas.<br />
200%<br />
150%<br />
100%<br />
50%<br />
0%<br />
Energy demand, non renewable<br />
Energy demand, non renewable<br />
Global warm<strong>in</strong>g potential<br />
Global warm<strong>in</strong>g potential<br />
Ozone formation (Veg<strong>et</strong>ation)<br />
Ozone formation (Veg<strong>et</strong>ation)<br />
Ozone formation (Human)<br />
Ozone formation (Human)<br />
Resources (phosphorus)<br />
Resources (phosphorus)<br />
Resources (potassium)<br />
Resources (potassium)<br />
Land comp<strong>et</strong>ition, arable<br />
Land comp<strong>et</strong>ition, arable<br />
Deforestation<br />
Deforestation<br />
Figure 3. Relative environmental impacts for 1 kg of pork at farm gate and at the r<strong>et</strong>ail store for conventional<br />
production <strong>in</strong> Switzerland (CH conv.), Germany (DE) and Denmark (DK). 100% = conventional production<br />
<strong>in</strong> Switzerland.<br />
Both <strong>in</strong> pork and <strong>in</strong> chicken production, feedstuffs are by far the most dom<strong>in</strong>ant <strong>in</strong>puts. Feedstuffs account<br />
for about 40% of the non-renewable energy consumption and global warm<strong>in</strong>g potential and for around<br />
two thirds of the human toxicity and ecotoxicity impacts of pork at the farm gate (Figure 4). In chicken production,<br />
where environmental impacts per kg LW are generally lower compared to pork, feedstuffs are even<br />
more important, account<strong>in</strong>g for more than 50% of the non-renewable energy consumption and more than<br />
70% of the global warm<strong>in</strong>g potential of 1 kg chicken (LW) (Figure 5).<br />
The environmental impacts of feedstuffs result ma<strong>in</strong>ly from crop production. So both the m<strong>et</strong>hod of production<br />
of feeds and the efficiency of feed conversion turned out to be decisive factors for environmental<br />
impacts per kg meat.<br />
Water use (blue water)<br />
Water use (blue water)<br />
Eutrophication terr.<br />
Eutrophication terr.<br />
CH (conv.) DE DK<br />
Eutrophication aq. N<br />
Eutrophication aq. N<br />
post-agricultural processes<br />
Eutrophication aq. P<br />
Eutrophication aq. P<br />
Acidification<br />
Acidification<br />
Ecotox terr.<br />
Ecotox terr.<br />
Ecotox aq.<br />
Ecotox aq.<br />
Human tox<br />
Human tox<br />
557
PARALLEL SESSION 6C: POULTRY AND PORK PRODUCTION SYSTEMS 8 th Int. Conference on <strong>LCA</strong> <strong>in</strong> the<br />
100%<br />
90%<br />
80%<br />
70%<br />
60%<br />
50%<br />
40%<br />
30%<br />
20%<br />
10%<br />
0%<br />
Energy demand, non renewable<br />
Global warm<strong>in</strong>g potential<br />
Ozone formation (Veg<strong>et</strong>ation)<br />
Ozone formation (Human)<br />
Resources (phosphorus)<br />
Resources (potassium)<br />
Agri-<strong>Food</strong> Sector, 1-4 Oct <strong>2012</strong><br />
Figure 4. Relative contribution of <strong>in</strong>puts to environmental impacts of 1 kg of pork (live weight, at farm gate)<br />
for Swiss conventional production.<br />
100%<br />
90%<br />
80%<br />
70%<br />
60%<br />
50%<br />
40%<br />
30%<br />
20%<br />
10%<br />
0%<br />
Energy demand, non renewable<br />
Global warm<strong>in</strong>g potential<br />
Ozone formation (Veg<strong>et</strong>ation)<br />
Ozone formation (Human)<br />
Resources (phosphorus)<br />
Resources (potassium)<br />
Land comp<strong>et</strong>ition, arable<br />
Deforestation<br />
Water use (blue water)<br />
Land comp<strong>et</strong>ition, arable<br />
Deforestation<br />
Water use (blue water)<br />
Eutrophication terr.<br />
Figure 5. Relative contribution of <strong>in</strong>puts to environmental impacts of 1 kg of chicken meat (live weight, at<br />
farm gate) for Swiss conventional production.<br />
4. Discussion<br />
Generally, the results of this study fitted well <strong>in</strong>to other analyses of meat production. Strid and Röös<br />
(2011) performed a literature review for pig production systems <strong>in</strong> Europe and found for the most environmental<br />
impact categories similar tendencies. However, most studies are restricted to only a few impact categories<br />
and the different calculation m<strong>et</strong>hods, system boundaries and functional units make sound comparisons<br />
often very difficult. This is especially the case for chicken meat production, where apart from live<br />
weight and slaughter weight various other functional units were used for the analyses (e.g. different steps of<br />
process<strong>in</strong>g, cooled or frozen products, whole animals or parts).<br />
The difference <strong>in</strong> fatten<strong>in</strong>g performance was comparatively small <strong>in</strong> pig production and higher <strong>in</strong> broiler<br />
production where aga<strong>in</strong> slower grow<strong>in</strong>g stra<strong>in</strong>s and moderate deficiencies <strong>in</strong> feed rations led to slower<br />
growth rates and less feed efficiency. Similar results were found by Prudêncio da Silva <strong>et</strong> al., (2010) who<br />
compared label and conventional chicken production <strong>in</strong> <strong>France</strong> and by Willams <strong>et</strong> al., (2006) for chicken<br />
production <strong>in</strong> the UK.<br />
5. Conclusion<br />
Both for pork and chicken meat, agricultural production dom<strong>in</strong>ated the environmental impacts of the<br />
whole meat production cha<strong>in</strong>. Therefore, it is much more relevant how animal production is done than where<br />
it takes place. Apart from various specific measures (e.g. improved manure management), generally the deci-<br />
558<br />
Eutrophication terr.<br />
Eutrophication aq. N<br />
Eutrophication aq. N<br />
Eutrophication aq. P<br />
Acidification<br />
Eutrophication aq. P<br />
Acidification<br />
Ecotox. terr.<br />
Ecotox. terr.<br />
Ecotox aq.<br />
Human tox<br />
Ecotox aq.<br />
Human tox<br />
other <strong>in</strong>puts<br />
<strong>in</strong>frastructure<br />
energy carriers<br />
on farm<br />
animal<br />
husbandry<br />
pigl<strong>et</strong><br />
production<br />
feedstuffs<br />
other <strong>in</strong>puts<br />
<strong>in</strong>frastructure<br />
energy carriers<br />
on farm<br />
animal<br />
husbandry<br />
purchase<br />
chicken<br />
feedstuffs
PARALLEL SESSION 6C: POULTRY AND PORK PRODUCTION SYSTEMS 8 th Int. Conference on <strong>LCA</strong> <strong>in</strong> the<br />
Agri-<strong>Food</strong> Sector, 1-4 Oct <strong>2012</strong><br />
sive factors for the environmental performance of meat production systems were found to be the overall efficiency<br />
of the production system and the whole complex of feed<strong>in</strong>g.<br />
For monogastric animals, a reduction of environmental impacts by improved feedstuff production and<br />
feed<strong>in</strong>g strategies seems to be most promis<strong>in</strong>g. The improvement (e.g. by optimis<strong>in</strong>g fertilisation and crop<br />
protection schemes and mach<strong>in</strong>ery usage) <strong>in</strong> the area of feedstuff production is rather a general challenge for<br />
crop production than for animal production. Y<strong>et</strong>, animal nutrition offers several start<strong>in</strong>g po<strong>in</strong>ts for reductions<br />
<strong>in</strong> environmental impacts from feed<strong>in</strong>g. Apart from further <strong>in</strong>creas<strong>in</strong>g the adaptation of di<strong>et</strong>s to the nutritional<br />
needs and therefore reduc<strong>in</strong>g excess supply, the <strong>in</strong>tegration of environmental aspects <strong>in</strong> di<strong>et</strong> plann<strong>in</strong>g<br />
has a great potential for reduc<strong>in</strong>g environmental impacts of di<strong>et</strong>s fed to animals.<br />
For pork and chicken meat, more <strong>in</strong>tensive production systems tend to have less environmental impacts<br />
per kg of produced meat because of a more efficient use of <strong>in</strong>puts, particularly feed. This was clearly shown<br />
<strong>in</strong> this study for chicken production. However, systems with improved animal welfare can produce with<br />
similar environmental impacts as long as animal performance reaches the same level of productivity as it was<br />
the case for pig production. To improve the overall performance of animal production systems it is vital to<br />
keep all aspects of susta<strong>in</strong>ability <strong>in</strong> m<strong>in</strong>d <strong>in</strong> order to avoid negative consequences of s<strong>in</strong>gle improvements of<br />
one aspect <strong>in</strong> another.<br />
6. Acknowledgement<br />
These research results were developed by ART with the support of COOP. The authors want to thank<br />
Vamilson Prudêncio da Silva for his permission to use data of French and Brazilian chicken production.<br />
7. References<br />
Alig, M., Grandl, F., Mieleitner, J., Nemecek, T. & Gaillard, G., <strong>2012</strong>. Ökobilanz von R<strong>in</strong>d-, Schwe<strong>in</strong>e- und Geflügelfleisch. Agroscope<br />
Reckenholz-Tänikon Research Station, Zurich.<br />
Gu<strong>in</strong>ée, J.B., Gorrée, M., Heijungs, R., Huppes, G., Kleijn, R., de Kon<strong>in</strong>g, A., van Oers, L., Wegener Sleeswijk, A., Suh, S., Udo de<br />
Haes, H.A., de Bruijn, H., van Du<strong>in</strong>, R., Huijbregts, M.A.J., L<strong>in</strong>deijer, E., Roorda, A.A.H. & Weidema, B.P., 2001. Life cycle assessment<br />
– An operational guide to the ISO standards. M<strong>in</strong>istry of Hous<strong>in</strong>g, Spatial Plann<strong>in</strong>g and Environment (VROM) and<br />
Centre of Environmental Science (CML), Den Haag and Leiden, N<strong>et</strong>herlands.<br />
Hauschild, M. & Pott<strong>in</strong>g, J., 2003. Spatial differentiation <strong>in</strong> Life Cycle impact assessment – The EDIP2003 m<strong>et</strong>hodology. Institute<br />
for Product Development, Technical University of Denmark.<br />
Hersener, J.-L., Baumgartner, D.U., Dux, D. (Eds.), 2011. Zentrale Auswertung von Ökobilanzen landwirtschaftlicher B<strong>et</strong>riebe (ZA-<br />
ÖB). Agroscope Reckenholz-Tänikon Research Station, Zurich/Ettenhausen.<br />
Hischier, R., Weidema, B., Althaus, H.-J., Bauer, C., Doka, G., Dones, R., Frischknecht, R., Hellweg, S., Humbert, S., Jungbluth, N.,<br />
Köllner, T., Loer<strong>in</strong>cik, Y., Margni, M. & Nemecek, T., 2010. Implementation of Life Cycle Impact Assessment M<strong>et</strong>hods. F<strong>in</strong>al<br />
report eco<strong>in</strong>vent v2.2 No. 3. Swiss Centre for Life Cycle Inventories, Dübendorf, Switzerland.<br />
IPCC, 2007: Contribution of Work<strong>in</strong>g Group I to the Fourth Assessment Report of the Intergovernmental Panel on Climate Change.<br />
Cambridge University Press, Cambridge, United K<strong>in</strong>gdom and New York, NY, USA.<br />
IPCC (2007): Contribution of Work<strong>in</strong>g Group I to the Fourth Assessment Report of the Intergovernmental Panel on Climate Change.<br />
Cambridge University Press, Cambridge, United K<strong>in</strong>gdom and New York, NY, USA, 996 p.<br />
Mieleitner, J., Alig, M., Grandl, F., Nemecek, T. & Gaillard, G., <strong>2012</strong>: Environmental impact of beef – role of slaughter<strong>in</strong>g, meat<br />
process<strong>in</strong>g and transport. Poster presented at the 8th Int. Conf. on <strong>LCA</strong> <strong>in</strong> the Agri-<strong>Food</strong> Sector, St. <strong>Malo</strong>, <strong>France</strong>.<br />
Nemecek, T., Freiermuth Knuchel, R., Alig, M. & Gaillard, G., 2010. The advantages of generic <strong>LCA</strong> tools for agriculture: examples<br />
SA<strong>LCA</strong>crop and SA<strong>LCA</strong>farm. In: 7th Int. Conf. on <strong>LCA</strong> <strong>in</strong> the Agri-<strong>Food</strong> Sector, Notarnicola, B. (eds.). Bari, Italy. 433-438.<br />
Prudêncio da Silva, V., van der Werf, H. & Soares, S., 2010. <strong>LCA</strong> of French and Brazilian broiler poultry production systems. In:<br />
Notarnicola, B., S<strong>et</strong>tanni, E., Tassielli und Giungato, P. (Eds.): Proceed<strong>in</strong>gs lcafood 2010, Bari, 475-480.<br />
Strid, I. & Röös, E., 2011. Environmental impact assessment of pig production systems <strong>in</strong> Europe – from land use to feed efficiency.<br />
In: KTBL (Ed.): Emissionen der Tierhaltung. KTBL-Schrift 491.<br />
Williams, A.G., Audsley, E. & Sandars, D.L., 2006. D<strong>et</strong>erm<strong>in</strong><strong>in</strong>g the environmental burdens and resource use <strong>in</strong> the production of<br />
agricultural and horticultural commodities. Ma<strong>in</strong> Report. Defra Research Project IS0205. Bedford: Cranfield University and Defra.<br />
559
PARALLEL SESSION 6C: POULTRY AND PORK PRODUCTION SYSTEMS 8 th Int. Conference on <strong>LCA</strong> <strong>in</strong> the<br />
Agri-<strong>Food</strong> Sector, 1-4 Oct <strong>2012</strong><br />
Evaluation of the environmental susta<strong>in</strong>ability of different European<br />
pig production systems us<strong>in</strong>g life cycle assessment<br />
J.Y. Dourmad 1,2, *, J. Ryschawy 1,2 , T. Trousson 1,2 , M. Bonneau 1,2 , J. Gonzalez 3 , H.W.J. Houwers 4 , M. Hviid 5 ,<br />
C. Zimmer 6 , T.L.T. Nguyen 7 , L. Morgensen 7<br />
1 INRA, UMR1348 Pegase, 35590 Sa<strong>in</strong>t-Gilles, <strong>France</strong>,<br />
2 Agrocampus Ouest, F-35000 Rennes, <strong>France</strong>,<br />
3 IRTA, F<strong>in</strong>ca Camps i Arm<strong>et</strong>, 17121 Monells, Girona, Spa<strong>in</strong>.,<br />
4 Wagen<strong>in</strong>gen UR Livestock Research, PO Box 65, 8200 AB Lelystad, The N<strong>et</strong>herlands,<br />
5 DMRI, Maglegaardsvej 2, DK-4000 Roskilde, Denmark,<br />
6 BESH, Haller Str. 20, 74549 Wolpertshausen, Germany,<br />
7 DJF, Univ. of Aarhus, 8830 Tjele, Denmark.<br />
Correspond<strong>in</strong>g author. E-mail: jean-yves.dourmad@rennes.<strong>in</strong>ra.fr<br />
ABSTRACT<br />
The environmental susta<strong>in</strong>ability of 15 European pig production systems has been evaluated with<strong>in</strong> the EU Q-PorkCha<strong>in</strong>s project,<br />
us<strong>in</strong>g life cycle assessment (<strong>LCA</strong>). One conventional and two differentiated systems were evaluated from each of five countries:<br />
Denmark, N<strong>et</strong>herlands, Spa<strong>in</strong>, <strong>France</strong> and Germany. The <strong>in</strong>formation needed for the calculations was obta<strong>in</strong>ed from an enquiry conducted<br />
on 5 to 10 farms from each system. The different systems were categorized among conventional (C), adapted conventional<br />
(AC), traditional (T) and organic (O). Compared to conventional, the differentiation was rather limited for AC systems with only<br />
some changes <strong>in</strong> order to improve meat quality, animal welfare or environmental impact. The difference was much more marked for<br />
the traditional systems with the use of fat slow-grow<strong>in</strong>g traditional breeds and generally the outdoor rais<strong>in</strong>g of the fatten<strong>in</strong>g pigs. The<br />
environmental impacts were calculated at farm gate, <strong>in</strong>clud<strong>in</strong>g the <strong>in</strong>puts, and expressed per kg live pig and per ha land use. For the<br />
conventional systems, the impact per kg live pig on climate change, acidification, eutrophication, energy use, and land occupation<br />
were 2.25 kg CO2-eq, 44.0 g SO2-eq, 18,5 g PO4-eq, 16.2 MJ and 4.13 m 2 , respectively. Compared to C, the correspond<strong>in</strong>g values<br />
were on average 13, 5, 0, 2 and 16% higher for AC; 54, 79, 23, 50 and 156% higher for T, and 4, -16, 29, 11 and 121% higher for O.<br />
Conversely, when expressed per ha of land use, the impacts were lower for T and O differentiated systems, by 10 to 60% on average,<br />
depend<strong>in</strong>g on the impact category. This was ma<strong>in</strong>ly due to larger land occupation per kg pig produced as well for feed production<br />
and for the outdoor rais<strong>in</strong>g of sows and/or fatten<strong>in</strong>g pigs. The use of litter bedd<strong>in</strong>g tended to <strong>in</strong>crease climate change impact per kg<br />
pig. The use of traditional local breeds, with reduced productivity and feed efficiency, resulted <strong>in</strong> higher impacts per kg pig produced,<br />
for all categories. Differentiated T systems with extensive outdoor rais<strong>in</strong>g of pigs resulted <strong>in</strong> markedly reduced impact per ha land<br />
use. Eutrophication potential per ha was substantially lower for O systems. Conventional systems were generally b<strong>et</strong>ter for global<br />
impacts, expressed per kg pig, whereas differentiated systems were b<strong>et</strong>ter for local impacts, expressed per ha land use.<br />
Keywords: pig production, systems, environment, Life Cycle Assessment<br />
1. Introduction<br />
World livestock production has major impacts on the environment, because of its emissions to the environment<br />
which affect air, water and soil quality, and the use of limited or non renewable resources (Ste<strong>in</strong>feld<br />
<strong>et</strong> al., 2006). In this context the EU pork production system is fac<strong>in</strong>g major challenges. There is <strong>in</strong>creas<strong>in</strong>g<br />
soci<strong>et</strong>al concern regard<strong>in</strong>g the currently prevail<strong>in</strong>g <strong>in</strong>tensive production systems (P<strong>et</strong>it and van der Werf,<br />
2003), ma<strong>in</strong>ly because of environmental and animal welfare shortcom<strong>in</strong>gs. Although, non conventional production<br />
systems are often believed to be more susta<strong>in</strong>able, their real benefits for the environment may be<br />
controversial (Bass<strong>et</strong>-Mens and van der Werf, 2005). An <strong>in</strong>ventory at farm level of pig production systems,<br />
ma<strong>in</strong>ly from EU countries, has recently been performed with<strong>in</strong> the Q-PorkCha<strong>in</strong>s EU project (Bonneau <strong>et</strong> al.,<br />
2011). This <strong>in</strong>ventory was used as a basis for select<strong>in</strong>g contrast<strong>in</strong>g systems that were evaluated <strong>in</strong> the present<br />
study. This evaluation was performed us<strong>in</strong>g a toolbox developed from the literature (Edwards <strong>et</strong> al., 2008)<br />
with life cycle assessment (<strong>LCA</strong>) as the m<strong>et</strong>hod for the evaluation of the environmental susta<strong>in</strong>ability.<br />
2. M<strong>et</strong>hods<br />
2.1. Goal def<strong>in</strong>ition, system description and collection of data<br />
Fifteen EU pig production systems were chosen among the 84 systems available <strong>in</strong> the <strong>in</strong>ventory of pig<br />
production systems (Bonneau <strong>et</strong> al., 2011). One conventional and two differentiated systems were evaluated<br />
from each of five countries: Denmark, N<strong>et</strong>herlands, Spa<strong>in</strong>, <strong>France</strong> and Germany. The different systems were<br />
categorized accord<strong>in</strong>g to the typology def<strong>in</strong>ed by Bonneau <strong>et</strong> al., (2011) among conventional (C, n=5),<br />
adapted conventional (AC, n=5), and differentiated, <strong>in</strong>clud<strong>in</strong>g traditional (T, n=3) and organic (O, n=2). The<br />
<strong>in</strong>formation needed for <strong>LCA</strong> calculations was obta<strong>in</strong>ed from an enquiry conducted on about 10 farms from<br />
each system. Data collected concerned: (i) animal performance, <strong>in</strong>clud<strong>in</strong>g sows productivity, mortality rates,<br />
pig growth and feed <strong>in</strong>take dur<strong>in</strong>g post-wean<strong>in</strong>g and fatten<strong>in</strong>g periods, slaughter characteristics, (ii) feed<br />
560
PARALLEL SESSION 6C: POULTRY AND PORK PRODUCTION SYSTEMS 8 th Int. Conference on <strong>LCA</strong> <strong>in</strong> the<br />
Agri-<strong>Food</strong> Sector, 1-4 Oct <strong>2012</strong><br />
composition <strong>in</strong>clud<strong>in</strong>g m<strong>et</strong>abolisable energy (ME), prote<strong>in</strong> and phosphorus contents, (iii) animal hous<strong>in</strong>g<br />
<strong>in</strong>clud<strong>in</strong>g type of hous<strong>in</strong>g (<strong>in</strong>door, outdoor, free range...), type of floor (litter bedd<strong>in</strong>g, compl<strong>et</strong>e of partially<br />
slatted floor...) and (iv) manure handl<strong>in</strong>g, <strong>in</strong>clud<strong>in</strong>g management <strong>in</strong> the build<strong>in</strong>g (liquid, solid, frequency of<br />
removal...) and dur<strong>in</strong>g storage (type and duration of storage), manure treatment (compost<strong>in</strong>g, anaerobic or<br />
aerobic digestion) and type and distance of spread<strong>in</strong>g. From the collected data, an "average" system was built<br />
for each production system. Performance and nutrient flows and emissions were calculated for each production<br />
stage, i.e. the sows and their pigl<strong>et</strong>s until wean<strong>in</strong>g, the post-wean<strong>in</strong>g pigl<strong>et</strong>s and the fatten<strong>in</strong>g pigs. In<br />
this way it was easy to aggregate the whole production systems, consider<strong>in</strong>g number of pigl<strong>et</strong>s weaned per<br />
sow per year, and mortality rates of pigs dur<strong>in</strong>g post wean<strong>in</strong>g and fatten<strong>in</strong>g periods.<br />
2.2. System boundaries and functional units<br />
This is a cradle-to-farm-gate study over the whole pig production system <strong>in</strong>clud<strong>in</strong>g the reproduc<strong>in</strong>g sows<br />
and their pigl<strong>et</strong>s until wean<strong>in</strong>g, the post-wean<strong>in</strong>g pigl<strong>et</strong>s and the fatten<strong>in</strong>g pigs. The def<strong>in</strong>ition of system and<br />
subsystem boundaries was ma<strong>in</strong>ly derived from Bass<strong>et</strong>-Mens and van der Werf (2005) and Nguyen <strong>et</strong> al.,<br />
(2010). The ma<strong>in</strong> sub-system is the pig unit which <strong>in</strong>cludes the production of pigl<strong>et</strong>s and their rais<strong>in</strong>g until<br />
slaughter weight. This unit is considered to be landless as assumed by Nguyen <strong>et</strong> al., (2010) but it <strong>in</strong>teracts<br />
with land use through the import of feed and the deposition/use of manure produced by the animals. The land<br />
used <strong>in</strong> case of outdoor pig rais<strong>in</strong>g is also considered with<strong>in</strong> the system. The studied system <strong>in</strong>cludes the<br />
production and delivery of feed produced off-farm, herd management, and emissions from the animals and<br />
manure storage. The environmental consequences of manure utilisation are evaluated us<strong>in</strong>g system expansion<br />
as described by Nguyen <strong>et</strong> al., (2010). The transport and slaughter of animals leav<strong>in</strong>g the system are not<br />
<strong>in</strong>cluded. V<strong>et</strong>er<strong>in</strong>ary medic<strong>in</strong>es and hygiene products are not <strong>in</strong>cluded because of lack of data <strong>in</strong> the enquiries.<br />
The functional units were 1 kg of live weight pig leav<strong>in</strong>g the pig unit, <strong>in</strong>clud<strong>in</strong>g culled sows and slaughter<br />
pigs, and 1 ha of land occupied for the production of feed and the rais<strong>in</strong>g of animals.<br />
2.3. Life cycle <strong>in</strong>ventory analysis<br />
The amount of compl<strong>et</strong>e feed used by the different categories of pigs was obta<strong>in</strong>ed from the enquiry, as<br />
well as their nutrient contents. However, no <strong>in</strong>formation was generally available on <strong>in</strong>gredients content. It is<br />
why these contents were estimated <strong>in</strong> a similar way as performed by Nguyen <strong>et</strong> al., (2010), assum<strong>in</strong>g that the<br />
compl<strong>et</strong>e feed resulted from a mixture of cereals (wheat, barley and maize), prote<strong>in</strong> rich <strong>in</strong>gredients (soybean<br />
meal, rapeseed meal and peas) and m<strong>in</strong>erals (phosphate and calcium carbonate). This calculation was performed<br />
for all di<strong>et</strong>s used by the different categories of pigs. A d<strong>et</strong>ailed description of the m<strong>et</strong>hodology used<br />
for the evaluation of impacts of production of non organic feed <strong>in</strong>gredients is given by Mosnier <strong>et</strong> al., (2011).<br />
Values for organic feed <strong>in</strong>gredients used <strong>in</strong> organic pig production systems were estimated from <strong>LCA</strong> food<br />
Database (2007).<br />
Emissions to air were estimated for NH3, N2O, NOx and CH4. Emission of CH4 from enteric fermentation<br />
and manure management were calculated from Rigolot <strong>et</strong> al., (2010a,b) and IPCC (2006). Direct N2O emissions<br />
from manure dur<strong>in</strong>g <strong>in</strong>-house and outdoor storage and dur<strong>in</strong>g field application were calculated from<br />
IPCC (2006) and emissions of NOx were estimated accord<strong>in</strong>g to Nemecek and Kägi (2007). NH3 emission<br />
dur<strong>in</strong>g <strong>in</strong>-house storage, outside storage and field application of manure were calculated from Rigolot <strong>et</strong> al.,<br />
(2010a,b) accord<strong>in</strong>g to type of effluent (slurry, solid manure) duration and type of storage and m<strong>et</strong>hod of<br />
spread<strong>in</strong>g. A description of the CML 2001 and CED m<strong>et</strong>hods can be found <strong>in</strong> Frischknecht <strong>et</strong> al., (2007).<br />
2.4. Life Cycle impact assessment<br />
The follow<strong>in</strong>g impact categories were considered: climate change (CC), eutrophication potential (EP),<br />
acidification potential (AP), cumulative energy demand (CED), and land occupation (LO). The <strong>in</strong>dicator<br />
result for each impact category was d<strong>et</strong>erm<strong>in</strong>ed by multiply<strong>in</strong>g the aggregated resources used and the aggregated<br />
emissions of each <strong>in</strong>dividual substance with a characterisation factor for each impact category to which<br />
it may potentially contribute. CC, EP, AP CED and LO were calculated us<strong>in</strong>g the CML2 “basel<strong>in</strong>e” and “all<br />
categories” 2001 characterisation m<strong>et</strong>hods as implemented <strong>in</strong> the Eco<strong>in</strong>vent v2.0 database. CC was calculated<br />
accord<strong>in</strong>g to the 100-year global warm<strong>in</strong>g potential factors expressed <strong>in</strong> kg CO2 equivalent (eq). EP<br />
was calculated us<strong>in</strong>g the generic EP factors <strong>in</strong> kg PO4 (Gu<strong>in</strong>ée <strong>et</strong> al., 2002). AP was calculated us<strong>in</strong>g the<br />
average European AP factors <strong>in</strong> kg SO2 eq (Gu<strong>in</strong>ée <strong>et</strong> al., 2002). Cumulative energy demand (CED, MJ) was<br />
561
PARALLEL SESSION 6C: POULTRY AND PORK PRODUCTION SYSTEMS 8 th Int. Conference on <strong>LCA</strong> <strong>in</strong> the<br />
Agri-<strong>Food</strong> Sector, 1-4 Oct <strong>2012</strong><br />
calculated accord<strong>in</strong>g to its version 1.05 as implemented <strong>in</strong> the Eco<strong>in</strong>vent v2.0 database. Land occupation<br />
(m 2 .yr) refers to on farm and off-farm area used for the production of feed or for the outdoor rais<strong>in</strong>g of pigs.<br />
3. Results<br />
3.1. Animal performance and system description<br />
On average there were 310 sows per farm with sows, and farms with fatten<strong>in</strong>g pigs produced on average<br />
3260 pigs per year (Table 1). The variability <strong>in</strong> average farm size per system (±270 sows, CV= 85% and<br />
±1960 fatten<strong>in</strong>g pigs, CV=60%) was high with large differences b<strong>et</strong>ween systems. Herd size was the highest<br />
for C and AC systems and the lowest for traditional systems, O systems be<strong>in</strong>g <strong>in</strong>termediate (Table 1). On<br />
average sows weaned 22.6 pigl<strong>et</strong>s per year. The highest performances were measured <strong>in</strong> C systems (26.9).<br />
Performances were slightly lower <strong>in</strong> AC systems (24.2) and the lowest <strong>in</strong> O and T systems (18.9 and 15.1,<br />
respectively). Consumption of feed per sows and per year was higher <strong>in</strong> T and O systems and this feed<br />
tended to be more concentrated <strong>in</strong> prote<strong>in</strong> and phosphorus, compared to C and AC systems.<br />
Feed conversion ratio dur<strong>in</strong>g the post wean<strong>in</strong>g period was 1.96 (±0.44) on average. It was the lowest for<br />
C systems and the highest for T ones (Table 1). Mortality rate (2.9% on average of systems) was markedly<br />
higher for T systems, with small differences among the others systems. Di<strong>et</strong>ary crude prote<strong>in</strong> content of postwean<strong>in</strong>g<br />
di<strong>et</strong>s, 174 g/kg on average of systems, was lower <strong>in</strong> T systems (162 g/kg) and higher <strong>in</strong> O systems<br />
(193 g/kg). Total di<strong>et</strong>ary phosphorus content was the highest <strong>in</strong> O systems with no marked difference among<br />
the other systems.<br />
Table 1. Description of the pig production systems: performance of sows, pigl<strong>et</strong>s and fatten<strong>in</strong>g pigs, and<br />
average composition of di<strong>et</strong>s.<br />
All systems Conven- Adapted Traditional Organic<br />
Average Std 1 tional conventional<br />
Number of systems 15 15 5 5 3 2<br />
Number of sows / farm 2 310 270 395 475 59 128<br />
Fatten<strong>in</strong>g pigs year -1 farm -1 3260 1960 4910 3570 510 2510<br />
Sows<br />
pigl<strong>et</strong>s weaned / year 22.6 5.7 26.9 24.2 15.1 18.9<br />
wean<strong>in</strong>g weight / kg 8.4 1.8 7.3 7.4 9.3 12.1<br />
feed per sow, kg/year 1390 312 1330 1340 1460 1590<br />
crude prote<strong>in</strong>, g/kg 138 14 134 134 137 158<br />
total P, g/kg 5.0 0.6 4.7 4.9 5.2 6.0<br />
Post-wean<strong>in</strong>g<br />
f<strong>in</strong>al weight, kg 27.7 4.2 28.1 27.8 25.4 29.7<br />
feed conversion ratio, kg/kg 1.96 0.44 1.67 1.90 2.42 2.20<br />
mortality rate,% 2.9% 3.8% 1.9% 1.8% 7.0% 2.1%<br />
crude prote<strong>in</strong>, g/kg 174 19 175 173 162 193<br />
total P, g/kg 5.6 0.5 5.5 5.6 5.5 6.4<br />
Fatten<strong>in</strong>g pigs<br />
slaughter weight, kg 122 16.2 113 124 140 109<br />
feed conversion ratio, kg/kg 3.44 1.37 2.74 3.18 5.29 3.03<br />
mortality rate,% 3.5% 1.5% 3.4% 2.9% 4.5% 3.5%<br />
crude prote<strong>in</strong>, g/kg 155 14 157 153 145 174<br />
total P, g/kg 4.7 0.475 4.7 4.5 4.8 5.1<br />
Live weight / sow, kg/year 2570 555 2930 2840 1900 1990<br />
1 Standard deviation, 2 average for farms with sows<br />
Average pig slaughter weight was 113 kg <strong>in</strong> C systems, rather close to O systems (109 kg). It was higher<br />
<strong>in</strong> AC and T systems, by 11 and 27 kg, respectively. Feed conversion ratio dur<strong>in</strong>g fatten<strong>in</strong>g period was 3.44<br />
(±1.37) on average. It was the lowest for C systems and the highest for T ones. Mortality rate (3.5% on average)<br />
was higher for T systems, with small differences among the others systems. Di<strong>et</strong>ary crude prote<strong>in</strong> content<br />
of fatten<strong>in</strong>g di<strong>et</strong>s, 155 g/kg on average of systems, was lower <strong>in</strong> T systems (145 g/kg) and higher <strong>in</strong> O<br />
systems (174 g/kg). Total di<strong>et</strong>ary phosphorus content was the highest <strong>in</strong> O and T systems with no marked<br />
difference b<strong>et</strong>ween C and AC. Live weight pig produced per sow per year amounted 2570 kg on average of<br />
systems. It was higher <strong>in</strong> C and AC systems (2880 kg) and lower <strong>in</strong> T and O systems (1950 kg).<br />
Conventional pigs were all housed <strong>in</strong>door, on slatted floor and their manure was handled as slurry, only a<br />
small percentage of the slurry be<strong>in</strong>g treated. In AC systems slatted floor was also the most frequent but <strong>in</strong><br />
562
PARALLEL SESSION 6C: POULTRY AND PORK PRODUCTION SYSTEMS 8 th Int. Conference on <strong>LCA</strong> <strong>in</strong> the<br />
Agri-<strong>Food</strong> Sector, 1-4 Oct <strong>2012</strong><br />
some cases sows and/or fatten<strong>in</strong>g pigs were raised on straw bedd<strong>in</strong>g with the production of solid manure. In<br />
O systems animals were raised outdoor or <strong>in</strong>door with outdoor access or <strong>in</strong> open build<strong>in</strong>gs. The use of slatted<br />
floor was the most frequent for fatten<strong>in</strong>g pigs. In T systems sows might be raised outdoor or <strong>in</strong>door, whereas<br />
fatten<strong>in</strong>g pigs were most often raised outdoor.<br />
3.2. Environmental impacts of pig production<br />
The environmental impacts of the different systems are presented per kg of pig produced and per ha of<br />
land occupied dur<strong>in</strong>g a year (Table 2). There were large differences b<strong>et</strong>ween systems for all impact categories<br />
expressed per kg pig produced. On average, CC, EP, AP, CE and LO amounted 2.61 (±27%; mean ±<br />
CV) kg eq CO2, 0.022 (±41%) kg eq PO4, 0.047 (±23%) kg eq SO2, 18.2 (±26%) MJ , and 6.60 (±56%) m 2<br />
per kg pig, respectively. There were substantial differences b<strong>et</strong>ween extremes values for all impacts (up to<br />
x4). On average, CC per kg pig was the lowest for C and the highest for T (+54% compared to C), AC and O<br />
systems be<strong>in</strong>g <strong>in</strong>termediate. EP per kg pig was similar for C and AC systems; it was higher for T systems<br />
(+79%) and lower O systems (-16%). In the same way, AC per kg pig was similar for C and AC systems,<br />
whereas higher values were calculated for T and O systems (+23 and +29%, respectively). Energy demand<br />
per kg pig was the lowest for C and AC systems and was higher for O (+11%) and T (+50%) systems.<br />
Marked differences were found for LO, b<strong>et</strong>ween C and AC systems, on one hand (4.5 m 2 /kg pig), and T and<br />
O systems, on the other hand (9.9 m 2 /kg pig).<br />
When expressed per ha of land occupied, there were also large differences b<strong>et</strong>ween systems for all impact<br />
categories (Table 2). On average, CC, EP, AP, CE and PP per ha, amounted 4680 (±26%) kg eq CO2,<br />
38.6 (±28%) kg eq PO4, 86.3 (±30%) kg eq SO2, 32.5 (±25%) TJ, and 1925 (±36%) kg pig per ha, respectively.<br />
There were marked differences b<strong>et</strong>ween extreme values for all impacts. On average, CC per ha was<br />
the lowest for O and the highest for C and AC (+100% compared to O), T systems be<strong>in</strong>g <strong>in</strong>termediate. Eutrophication<br />
potential per ha was substantially lower for O systems; it was the highest for C systems (+170%)<br />
followed by AC and T. Acidification potential per ha was similar for O and T systems, whereas higher values<br />
were obta<strong>in</strong>ed for C and AC systems (+70 and +45%, respectively). In the same way, CED per ha was<br />
the lowest for O and T systems, and was higher for C (+98%) and AC (+75%) systems. Substantial differences<br />
were found for pig produced per ha land occupation, b<strong>et</strong>ween C and AC systems, on one and (2300<br />
kg/ha), and T and O systems, on the other hand (1170 kg/ha).<br />
Table 2. Potential environmental impact expressed per kg pig produced or per ha of land use<br />
All systems Conven Adapted Traditional Organic<br />
Average Std 1 tional conventional<br />
Number of systems 15 15 5 5 3 2<br />
Impact per kg live weight<br />
Climate change, kg eq CO2 2.61 0.70 2.25 2.55 3.47 2.35<br />
Eutrophication, kg eq PO4 0.022 0.009 0.019 0.020 0.034 0.016<br />
Acidification, kg eq SO2 0.047 0.011 0.044 0.044 0.054 0.057<br />
Energy demand, MJ 18.2 4.6 16.2 16.5 24.3 18.1<br />
Land occupation, m 2 6.30 3.52 4.13 4.78 10.6 9.14<br />
Impact per ha land use<br />
Climate change, kg eq CO2 4680 1220 5470 5320 3670 2610<br />
Eutrophication, kg eq PO4 38.6 10.7 46.3 41.4 35.3 17.3<br />
Acidification, kg eq SO2 86.3 26.2 106.1 89.9 63.8 61.6<br />
Energy demand, MJ (x 1000) 32,5 8.0 39.4 34.8 25.7 19.98<br />
Pig produced, kg LW 1925 684 2429 2162 1229 1114<br />
1 Standard deviation<br />
4. Discussion<br />
Results on environmental impacts of pig production evaluated with <strong>LCA</strong> were recently reviewed by de<br />
Vries and de Boer (2010). For CC the values obta<strong>in</strong>ed <strong>in</strong> the present study (2.25 to 3.47 kg eq CO2 / kg pig)<br />
are with<strong>in</strong> the large range of values (2.3 to 5.0 kg eq CO2 / kg live pig) reviewed <strong>in</strong> that study. For conventional<br />
systems the observed average value (2.25 kg eq CO2) is close to those reported by Bass<strong>et</strong>-Mens and<br />
van der Werf (2005) and Nguyen <strong>et</strong> al., (2011): 2.3 and 2.2 kg eq CO2, respectively. The value obta<strong>in</strong>ed for<br />
O systems (2.4 kg eq CO2 / kg pig) is lower than those published for the same system by Halberg <strong>et</strong> al.,<br />
(2010; 2.8 to 3.3 kg eq CO2 / kg pig) and Bass<strong>et</strong>-Mens and van der Werf (2005; 4.0 kg eq CO2 / kg pig). The<br />
ma<strong>in</strong> reason for that difference is likely the higher animal performance <strong>in</strong> our study, both <strong>in</strong> terms of sow<br />
563
PARALLEL SESSION 6C: POULTRY AND PORK PRODUCTION SYSTEMS 8 th Int. Conference on <strong>LCA</strong> <strong>in</strong> the<br />
Agri-<strong>Food</strong> Sector, 1-4 Oct <strong>2012</strong><br />
productivity and feed efficiency, and the higher N2O emission <strong>in</strong> the study from Bass<strong>et</strong>-Mens and van der<br />
Werf (2005) due to the use of straw bedd<strong>in</strong>g. Traditional systems have higher CC impact per kg pig. This is<br />
ma<strong>in</strong>ly due to the lower feed efficiency <strong>in</strong> these systems, <strong>in</strong> connection with the rais<strong>in</strong>g of traditional breeds.<br />
This results <strong>in</strong> a higher CC impact due to the production of feed, only partially compensated by decreased<br />
CH4 emission due the outdoor rais<strong>in</strong>g of animals. AC systems have a slightly higher CC impact than C systems,<br />
ma<strong>in</strong>ly because reduced animal performance and the more frequent use of straw bedd<strong>in</strong>g with <strong>in</strong>creased<br />
N2O emission.<br />
For EP the values obta<strong>in</strong>ed <strong>in</strong> the present study (0.016 to 0.034 kg eq PO4 / kg pig) are also with<strong>in</strong> the<br />
range of values (0.012 to 0.038 kg eq PO4 / kg live pig) reviewed by de Vries and de Boer (2010). For C<br />
systems the observed average value (0.019 kg eq PO4) is close to those reported for similar systems by Bass<strong>et</strong>-Mens<br />
and van der Werf (2005) and Nguyen <strong>et</strong> al., (2011): 0.021 and 0.018 kg eq PO4, respectively. The<br />
value obta<strong>in</strong>ed for organic production (0.016 kg eq PO4 / kg pig) is lower than those published for this system<br />
by Bass<strong>et</strong>-Mens and van der Werf (2005; 0.022 kg eq PO4 / kg pig) and by Halberg <strong>et</strong> al., (2010; 0.025<br />
to 0.038 eq PO4 / kg pig), ma<strong>in</strong>ly because of higher animal performance <strong>in</strong> the present study. Among the<br />
evaluated systems, O systems have the lowest EP impact <strong>in</strong> connection with a much lower EP impact of feed<br />
<strong>in</strong> that system. For the same reason as for CC, T systems have the highest EP impact.<br />
For AP the values obta<strong>in</strong>ed <strong>in</strong> the present study (0.044 to 0.057 kg eq SO2 / kg pig) are also with<strong>in</strong> the<br />
large range of values (0.008 to 0.120 kg eq SO2 / kg live pig) reviewed by de Vries and de Boer (2010). For<br />
AC and AC systems the observed average value (0.044 kg eq SO2) is close to those reported for similar systems<br />
by Bass<strong>et</strong>-Mens and van der Werf (2005) and Nguyen <strong>et</strong> al., (2011): 0.044 and 0.043 kg eq SO2, respectively.<br />
The value obta<strong>in</strong>ed for organic production 0.057 kg eq SO2 / kg pig is higher than that published for<br />
this system by Bass<strong>et</strong>-Mens and van der Werf (2010; 0.037 kg eq SO2 / kg pig) and similar to those reported<br />
by Halberg <strong>et</strong> al., (2010; 0.050 to 0.061 eq SO2 / kg pig). This is ma<strong>in</strong>ly related to the production of solid<br />
manure with reduced NH3 emission <strong>in</strong> the study of Bass<strong>et</strong>-mens and van der Werf (2005).<br />
For CED the values obta<strong>in</strong>ed <strong>in</strong> the present study (16 to 24 MJ / kg pig) are with<strong>in</strong> the large range of values<br />
(10 to 25 MJ / kg live pig) reviewed by de Vries and de Boer (2010). For C and AC systems the observed<br />
average value (16.3 MJ) is close to thoses reported for similar systems by Bass<strong>et</strong>-Mens and van der Werf<br />
(2005) and Nguyen <strong>et</strong> al., (2011): 15.9 and 13.6 MJ, respectively. The observed value for organic production<br />
18.1 MJ / kg pig is slightly lower than that published (22.2 MJ / kg pig) for this system by Bass<strong>et</strong>-Mens and<br />
van der Werf (2005). In relation with the use of larger amounts of feed, T systems have the highest CED<br />
impact per kg pig.<br />
The values obta<strong>in</strong>ed for LO <strong>in</strong> the present study (4.1 to 10.6 m 2 / kg pig) are partly outside the range of<br />
values (4.2 to 6.9 m 2 / kg live pig) reviewed by de Vries and de Boer (2010). This is ma<strong>in</strong>ly related to T and<br />
O systems which obta<strong>in</strong>ed higher values for LO. For T systems the ma<strong>in</strong> reason is the outdoor rais<strong>in</strong>g of<br />
fatten<strong>in</strong>g pigs. In the case of O systems the larger LO is ma<strong>in</strong>ly related to the higher LO impact for feed production,<br />
due to reduced yield of organic crops. For C systems the observed value (4.13 m 2 / kg pig) is close<br />
to those reported for similar systems by Bass<strong>et</strong>-Mens and van der Werf (2005) and Nguyen <strong>et</strong> al., (2011): 5.4<br />
and 4.4 m 2 / kg pig, respectively. The value obta<strong>in</strong>ed for organic production, 9.1 m 2 / kg pig, is close to the<br />
values published for this system by Bass<strong>et</strong>-Mens and van der Werf (2010; 9.9 m 2 / kg pig) and Halberg <strong>et</strong> al.,<br />
(2010; 6.9 to 9.2 m 2 /kg pig).<br />
When impacts are expressed per ha of land used, the rank<strong>in</strong>g of systems is very different for most impacts.<br />
They are generally the lowest for O followed by T systems and the highest for C systems. The degree<br />
of <strong>in</strong>tensification <strong>in</strong>versely correlates with the environmental impact per kg pig, whereas the opposite is<br />
found when the impact is expressed per ha. The same effect of the functional unit on the results was reported<br />
by Bass<strong>et</strong>-Mens and van der Werf (2005). Our results clearly <strong>in</strong>dicate that the choice of the functional unit<br />
has a major effect on the rank<strong>in</strong>g of systems <strong>in</strong> terms of environmental impact <strong>in</strong> l<strong>in</strong>e with previous results<br />
(Bass<strong>et</strong>-Mens and van der Werf, 2005). The use of plural functional units is rather common <strong>in</strong> the application<br />
of <strong>LCA</strong> <strong>in</strong> agriculture, but still under debate. As suggested by different authors this refers to two essential<br />
functions of agriculture: the production of food and land occupation. It is why some authors have suggested<br />
to adapt the choice of the functional unit to the category of impact, i.e. the kg of product for global impacts<br />
and ha of land occupation for local impacts (de Boer, 2003)<br />
5. Conclusion<br />
The diversity <strong>in</strong> production systems considered <strong>in</strong> the present study results <strong>in</strong> very large variations <strong>in</strong> all environmental<br />
impacts. However, the results depend on the functional unit. The degree of <strong>in</strong>tensification <strong>in</strong>versely<br />
correlates with the environmental impact per kg pig, whereas the opposite is found when the impact<br />
is expressed per ha. Accord<strong>in</strong>g to the results from this study, <strong>LCA</strong> appears a suitable m<strong>et</strong>hodology for the<br />
564
PARALLEL SESSION 6C: POULTRY AND PORK PRODUCTION SYSTEMS 8 th Int. Conference on <strong>LCA</strong> <strong>in</strong> the<br />
Agri-<strong>Food</strong> Sector, 1-4 Oct <strong>2012</strong><br />
evaluation of the environmental susta<strong>in</strong>ability of pig production systems and can contribute to the overall<br />
assessment of susta<strong>in</strong>ability.<br />
6. Acknowledgements<br />
The authors gratefully acknowledge the European Community f<strong>in</strong>ancial participation under the 6th<br />
Framework Programme for Research, Technological Development and Demonstration Activities for the Integrated<br />
Project Q-PORKCHAINS (FOOD-CT- 2007-036245). The views expressed <strong>in</strong> this study are the<br />
sole responsibility of the authors and do not necessarily reflect the views of the European Commission. Neither<br />
the European Commission nor any person act<strong>in</strong>g on behalf of the Commission is responsible for the use<br />
that might be made of the <strong>in</strong>formation. The <strong>in</strong>formation <strong>in</strong> this study is provided as it is, and no guarantee is<br />
given that the <strong>in</strong>formation is fit for any particular purpose. The user, therefore, uses the <strong>in</strong>formation at its<br />
sole risk and liability.<br />
7. References<br />
Bass<strong>et</strong>-Mens, C., van der Werf, H.M.G., 2005. Scenario-based environmental assessment of farm<strong>in</strong>g systems: the case of pig production<br />
<strong>in</strong> <strong>France</strong>. Agric. Ecosys. Env., 105, 127-144.<br />
Bonneau, M., Anto<strong>in</strong>e-Ilari, E., Phatsara, C., Br<strong>in</strong>kmann, D., Hviid, M., Christiansen, M.G., Fàbrega, E., Rodríguez, P., Rydhmer, L.,<br />
Ent<strong>in</strong>g, I., de Greef, K.H., Edge, H., Dourmad, J.Y., Edwards, S., 2011. Diversity of pig production systems at farm level <strong>in</strong><br />
Europe. J. Cha<strong>in</strong> and N<strong>et</strong>work Sci., 11, 115-135<br />
de Boer IJM 2003. Environmental impact assessment of conventional and organic milk production. Livest. Prod. Sci., 80, 69-77.<br />
de Vries, M., de Boer, I.J.M., 2010. Compar<strong>in</strong>g environmental impacts for livestock products: A review of life cycle assessment.<br />
Livest. Sci., 128, 1-11.<br />
Edwards, S.A., Dourmad, JY., Edge, H.L., Fabrega, E., de Greef, K., Anto<strong>in</strong>e-Ilari, E., Phatsara, C., Rydhmer, L., Bonneau, M. 2008.<br />
Q-porkcha<strong>in</strong>s: tools for assess<strong>in</strong>g susta<strong>in</strong>ability of pigmeat production systems. Proc 59th Annual Me<strong>et</strong><strong>in</strong>g of the EAAP, Vilnius,<br />
Lithuania.<br />
Frischknecht, R., Jungbluth, N. Althaus, H.J., Bauer, C., Doka, G., Dones, R., Hischier, R., Hellweg, S., Humbert, S., Köllner, T.,<br />
Loer<strong>in</strong>cik, Y., Margni, M., Nemecek, T., 2007. Implementation of Life Cycle Impacts Assessment m<strong>et</strong>hods. Eco<strong>in</strong>vent report no.<br />
3, v2.0. Swiss Centre for Life Cycle Inventories, Dubendorf, Switzerland.<br />
Gu<strong>in</strong>ée, J.B., Gorrée, M., Heijungs, R., Huppes, G., Kleijn, R., de Kon<strong>in</strong>g, A., van Oers, L., Wegener Sleeswijk, A., Suh, S., Udo de<br />
Haes, H.A., de Bruijn, H., van Du<strong>in</strong>, R., Huijbregts, M.A.J., 2002. Life Cycle Assessment. An operational guide to the ISO Standards.<br />
Centre of environmental science, Leiden University, Leiden, The N<strong>et</strong>herlands.<br />
Halberg, N., Hermansen, J.E., Kristensen, I.S., Eriksen, J., Tvedegaard, N., P<strong>et</strong>ersen, B.M., 2010. Impact of organic pig production<br />
on CO2 emission, C sequestration and nitrate. Agr. Sust. Dev., 30, 721-731.<br />
IPCC 2006. 2006 IPCC Guidel<strong>in</strong>es for national greenhouse gas <strong>in</strong>ventories. Eggleston HS, Buendia L, Miwa K, Ngara T and Tanabe<br />
K (Eds). IGES, Japan.<br />
<strong>LCA</strong> <strong>Food</strong> database, 2007. Available onl<strong>in</strong>e: http://www.lcafood.dk/<br />
Mosnier, E., van der Werf, H.M.G., Boissy, J., Dourmad, J.Y., 2011. Evaluatio of the environmental implications of the <strong>in</strong>corporation<br />
of feed-use am<strong>in</strong>o acids <strong>in</strong> the manufactur<strong>in</strong>g of pig and broiler feed us<strong>in</strong>g Life cycle Assessment. Animal, 5, 1973-1983.<br />
Nemecek, T., Kägi, T., 2007. Life cycle <strong>in</strong>ventories of Swiss and European Agricultural production systems. F<strong>in</strong>al report Eco<strong>in</strong>vent<br />
report v 2.0., no. 15, Agroscope Reckenholz-Taenikon Research Station ART, Swiss Centre for life cycle <strong>in</strong>ventories, Zurich and<br />
Dübendorf, Switzerland.<br />
Nguyen, T.L.T., Hermansen, J.E., Mogensen, L., 2010. Fossil energy and GHG sav<strong>in</strong>g potentials of pig farm<strong>in</strong>g <strong>in</strong> the EU. Energy<br />
Policy, 38, 2561-2571.<br />
P<strong>et</strong>it, J., van der Werf, H.M.G., 2003. Perception of the environmental impacts of current and alternative modes of pig production by<br />
stakeholder groups. J. Env. Manag., 68, 377-386.<br />
Rigolot, C., Espagnol, S., Pomar, C., Dourmad, J.Y., 2010a. Modell<strong>in</strong>g of manure production by pigs and NH3, N2O and CH4 emissions.<br />
Part I: animal excr<strong>et</strong>ion and enteric CH4, effect of feed<strong>in</strong>g and performance. Animal, 4, 1401-1412.<br />
Rigolot, C., Espagnol, S., Rob<strong>in</strong>, P., Hassouna, M., Bél<strong>in</strong>e, F., Paillat, J.M., Dourmad, J.Y., 2010b. Modell<strong>in</strong>g of manure production<br />
by pigs and NH3, N2O and CH4 emissions. Part II: effect of animal hous<strong>in</strong>g, manure storage and treatment practices. Animal, 4,<br />
1413-1424.<br />
Ste<strong>in</strong>feld, H., Gerber, P., Wassenaar, T., Castel, V., Rosales, M., de Haan, C., 2006. Livestock’s long shadow. Environmental issues<br />
and options. Livestock, environment and development <strong>in</strong>itiative. United Nations <strong>Food</strong> and Agriculture Organization, Rome.<br />
565
PARALLEL SESSION 6C: POULTRY AND PORK PRODUCTION SYSTEMS 8 th Int. Conference on <strong>LCA</strong> <strong>in</strong> the<br />
Agri-<strong>Food</strong> Sector, 1-4 Oct <strong>2012</strong><br />
566<br />
Life cycle assessment of pig slurry treatment technologies<br />
M. ten Hoeve 1,* , S. Bruun 1 , L.S. Jensen 1 , N.J. Hutch<strong>in</strong>gs 2 , R. Jensen 2<br />
1 University of Copenhagen, Faculty of Life Sciences, Department of Agriculture and Ecology, Thorvaldsensvej 40, 1871 Frederiks-<br />
berg C, Denmark.<br />
2 Aarhus University, Department of Agroecology, Blichers Allé 20, 8830 Tjele, Denmark.<br />
Correspond<strong>in</strong>g author. E-mail: mtho@life.ku.dk<br />
ABSTRACT<br />
Animal manure management is associated with negative impacts on global warm<strong>in</strong>g, acidification and eutrophication of ecosystems.<br />
In the current study an <strong>LCA</strong> is used to assess the environmental impacts of treatment of 1000 kg of slurry ex-animal of five different<br />
technologies. These technologies are (a) direct land application (reference scenario), (b) separation by mechanical screw press, (c)<br />
screw press separation and compost<strong>in</strong>g of the solid fraction, (d) separation by decanter centrifuge, and (e) decanter centrifuge separation<br />
with ammonia stripp<strong>in</strong>g of the liquid fraction. In all separation scenarios, the liquid fraction was land applied close to the farm<br />
and the solid fraction was transported and land applied 100 km from the farm. In general, the treatment technologies analysed <strong>in</strong> this<br />
<strong>LCA</strong> show environmental impact potential reduction compared with the reference scenario. The decanter centrifuge scenarios have<br />
equal or lower impact potentials than the screw press scenarios. Relative rank<strong>in</strong>g of scenarios does not change after the sensitivity<br />
analysis, where field emission factors for N2O, NH3 and P were varied with<strong>in</strong> the range observed <strong>in</strong> literature. Choice of the technology<br />
to implement <strong>in</strong> any given situation depends on the environmental problem <strong>in</strong> focus.<br />
Keywords: life cycle assessment, pig slurry, slurry treatment technologies<br />
1. Introduction<br />
Large amounts of animal manure are produced <strong>in</strong> Europe and its management is associated with a number<br />
of environmental impacts. Impact categories that are ma<strong>in</strong>ly affected by animal manure management are (a)<br />
global warm<strong>in</strong>g potential, caused by m<strong>et</strong>hane and nitrous oxide emissions, (b) acidification potential, <strong>in</strong>duced<br />
by ammonia emissions, and (c) eutrophication potential caused by nitrogen and phosphorus emissions.<br />
These impacts are accentuated because an <strong>in</strong>creas<strong>in</strong>g share of agricultural land <strong>in</strong> Europe receives excessive<br />
amounts of animal manure. These so-called hotspot areas are characterised by high livestock densities<br />
and <strong>in</strong>sufficient land for manure application. This has resulted <strong>in</strong> phosphorus surplus <strong>in</strong> these areas and associated<br />
risks for losses to the environment. In other areas, agricultural fields do not receive sufficient amounts<br />
of nutrients from manure and farmers need to apply m<strong>in</strong>eral fertilisers to their fields. Non-renewable natural<br />
resources like phosphate rock, oil and natural gas, are used for the production of m<strong>in</strong>eral fertiliser and there<br />
are considerable environmental emissions, such as CO2 and phosphate leach<strong>in</strong>g, related to the extraction,<br />
manufactur<strong>in</strong>g and use of these fertilisers. In order to decrease the consumption of m<strong>in</strong>eral fertiliser and<br />
avoid losses from areas with excessive availability of animal manure, geographical redistribution of animal<br />
manure needs to improve.<br />
To enhance nutrient re-distribution, slurry treatment technologies have been developed that focus on the<br />
separation of slurry <strong>in</strong>to a solid and a liquid fraction. The liquid fraction conta<strong>in</strong>s most of the easily available<br />
nitrogen but less than half of the phosphorus, so is ma<strong>in</strong>ly valued as a nitrogen fertiliser. However, the high<br />
water content <strong>in</strong> the liquid fraction makes the fraction relatively heavy and less suitable for long distance<br />
transportation. Agricultural land nearby the farm often has been treated with slurry for multiple years, which<br />
implies that phosphorus concentrations <strong>in</strong> the soil are already sufficiently high to supply the crop demand.<br />
The solid fraction is more transportable, due to its relatively low water content. It has a high concentration of<br />
slowly-available nitrogen and phosphorus, so is ma<strong>in</strong>ly valuable as a phosphorus fertiliser. Additional technologies<br />
that are developed to avoid environmental impacts <strong>in</strong>clude ammonia stripp<strong>in</strong>g from the liquid fraction,<br />
which reduces emissions of ammonia, various technologies for energy extraction and upgrad<strong>in</strong>g of the<br />
solid fraction such as compost<strong>in</strong>g which may improve the solid fraction as a soil amendment.<br />
The objectives of this study are to d<strong>et</strong>erm<strong>in</strong>e environmental impact potentials of slurry treatment technologies<br />
<strong>in</strong> a Life Cycle Assessment (<strong>LCA</strong>) and to compare impact potentials of treatment technologies with<br />
a reference.<br />
2. M<strong>et</strong>hods<br />
2.1. Model description<br />
The <strong>LCA</strong> is based on <strong>in</strong>formation from literature research. The <strong>LCA</strong> itself was conducted by us<strong>in</strong>g the<br />
GaBi software (www.pe-<strong>in</strong>ternational.com). The functional unit that forms the basis for the assessment is the<br />
handl<strong>in</strong>g of 1000 kg of slurry excr<strong>et</strong>ed by pigs. Emissions from slurry, liquid and solid fractions were ana-
PARALLEL SESSION 6C: POULTRY AND PORK PRODUCTION SYSTEMS 8 th Int. Conference on <strong>LCA</strong> <strong>in</strong> the<br />
Agri-<strong>Food</strong> Sector, 1-4 Oct <strong>2012</strong><br />
lysed from the moment the slurry is excr<strong>et</strong>ed by pigs until 10 years after field application. The environmental<br />
impact categories that are <strong>in</strong>cluded <strong>in</strong> the analysis are the climate change potential, <strong>in</strong>clud<strong>in</strong>g CO2 (both biogenic<br />
and non-biogenic), CH4 and N2O, acidification potential, <strong>in</strong>clud<strong>in</strong>g NH3, freshwater eutrophication<br />
potential, <strong>in</strong>clud<strong>in</strong>g P, and mar<strong>in</strong>e water eutrophication potential, <strong>in</strong>clud<strong>in</strong>g NO3 - and NH3. ReCiPe2008 is<br />
used for analysis of environmental impact potentials (Goedkoop <strong>et</strong> al., 2009).<br />
2.2. Scenarios<br />
For this <strong>LCA</strong>, it is assumed that the pigs are raised <strong>in</strong> Denmark, and that they consume an average Danish<br />
feed composition. The pigs are housed <strong>in</strong> pig hous<strong>in</strong>g with partially-slatted floor<strong>in</strong>g. All liquid manure<br />
(slurry and liquid fraction) is assumed to be stored <strong>in</strong> a covered tank. Storage of the solid fraction is covered<br />
to reduce self-heat<strong>in</strong>g, and compost is well aerated. Liquid manure is applied by trail<strong>in</strong>g hose to fields around<br />
the farm, with an average distance of 8 km from storage. It is assumed that liquid manure is a substation for<br />
m<strong>in</strong>eral nitrogen fertiliser (ammonium nitrate). Solid fractions are transported to areas where phosphorus is<br />
needed, over an average distance of 100 km. As farmers on these fields with low phosphorus status would<br />
normally apply m<strong>in</strong>eral phosphorus fertiliser, it is assumed that the solid fraction is a substitution for m<strong>in</strong>eral<br />
phosphorus (s<strong>in</strong>gle superphosphate) and nitrogen (ammonium nitrate) fertiliser. Phosphorus losses from the<br />
soil are calculated as a proportion of the difference b<strong>et</strong>ween the phosphorus that is applied as fertiliser, and<br />
the average phosphorus need that plants have (assumed to be 21.5 kg P ha -1 yr -1 ). If less phosphorus is applied<br />
than plants take up, a negative freshwater eutrophication potential results. Solid fractions are applied by<br />
broadcast spread<strong>in</strong>g followed by rapid <strong>in</strong>corporation. Ma<strong>in</strong> emission factors are provided <strong>in</strong> Table 1.<br />
Four treatment scenarios were compared to a reference scenario:<br />
Reference Scenario – Conventional manure management <strong>in</strong> the form of slurry, with <strong>in</strong>-house storage<br />
of 6 weeks, covered out-house storage for 6 months, and field application with a trail<strong>in</strong>g hose<br />
Screw Press Scenario – Slurry separation with a mechanical screw press, with donor farm application<br />
of the liquid fraction, and transportation to and application on a recipient farm of the solid fraction<br />
Screw Press with Compost<strong>in</strong>g Scenario – As Screw Press Scenario with the difference that the solid<br />
fraction is w<strong>in</strong>drow composted before transportation to recipient farm<br />
Decanter Centrifuge Scenario – Slurry separation with a decanter centrifuge, with donor farm application<br />
of the liquid fraction, and transportation to and application on recipient farm of the solid fraction<br />
Decanter Centrifuge with Ammonia Stripp<strong>in</strong>g Scenario – As Decanter Centrifuge Scenario with the<br />
difference that ammonia is stripped from the liquid fraction result<strong>in</strong>g <strong>in</strong> a compact nitrogen fertiliser<br />
Table 1: LCI param<strong>et</strong>ers used for <strong>in</strong>-house storage, ex-house storage and field application.<br />
NH3-N N2O-N N2-N -<br />
NO3 -N Degradation CH4-C CO2-C MFE<br />
kg/kg TAN-N kg/kg N kg/kg N kg/kg N kg/kg OM kg/kg OM deg. kg/kg OM deg. %<br />
House 0,250 0,185 0,150 0,310<br />
Storage<br />
slurry / liquid 0,013 0,185 0,230 0,230<br />
solid 0,003 0,002 0,004 0,070 0,230 0,230<br />
compost 0,004 0,008 0,024 0,600 0,060 0,400<br />
reject 0,950<br />
Field application<br />
slurry 0,160 0,020 0,041 0,395 75<br />
liquid 0,120 0,020 0,038 0,405 85<br />
solid 0,390 0,020 0,038 0,332 65<br />
compost 0,390 0,020 0,050 0,304 45<br />
reject 0,950 0,020 0,038 0,405 85<br />
NH 3 -fration 0,020 0,020 0,025 0,418 100<br />
m<strong>in</strong>. fertilizer 0,027 0,020 0,024 0,407 100<br />
TAN = total ammoniacal nitrogen, OM = organic matter, reject is the liquid fraction after ammonia stripp<strong>in</strong>g,<br />
NH3-fraction is the ammonia-rich fraction after ammonia stripp<strong>in</strong>g.<br />
567
PARALLEL SESSION 6C: POULTRY AND PORK PRODUCTION SYSTEMS 8 th Int. Conference on <strong>LCA</strong> <strong>in</strong> the<br />
Agri-<strong>Food</strong> Sector, 1-4 Oct <strong>2012</strong><br />
3. Results and discussion<br />
3.1. Ma<strong>in</strong> model<br />
A comparison of the treatment scenarios with the reference scenario is done for four impact potential<br />
categories. The reference scenario is s<strong>et</strong> to 100%. For the treatment scenarios, values higher than 100% imply<br />
that the environmental impact is higher <strong>in</strong> the treatment scenario than <strong>in</strong> the reference scenario. Figure 1<br />
provides an overview of the relative climate change potential. The screw press with compost<strong>in</strong>g scenario has<br />
an impact potential that is 11.5% higher than the reference scenario due to CO2 (24.2 kg CO2-eq), CH4 (33.1<br />
kg CO2-eq), and N2O (2.7 kg CO2-eq), emissions dur<strong>in</strong>g the compost<strong>in</strong>g process. All other treatment scenarios<br />
have a lower global warm<strong>in</strong>g potential than the reference. The decanter centrifuge scenario show the<br />
lowest impact potential.<br />
All treatment scenarios show a lower freshwater eutrophication potential than the reference scenario, see<br />
Figure 1. For the two screw press scenarios, this reduced impact potential is approximately 24% smaller than<br />
<strong>in</strong> the reference, while for the decanter centrifuge with ammonia stripp<strong>in</strong>g scenario, this reduced impact potential<br />
is approximately 55% smaller than <strong>in</strong> the reference.<br />
Application of phosphorus from the liquid fraction <strong>in</strong> the centrifuge scenario is lower than the plant-need.<br />
71% of the phosphorus <strong>in</strong> slurry ends up <strong>in</strong> the solid fraction after centrifuge separation. Consequently, 29%<br />
of the <strong>in</strong>itial phosphorus ends <strong>in</strong> the liquid fraction. Nitrogen separation is less efficient, result<strong>in</strong>g <strong>in</strong> a relatively<br />
larger share of nitrogen <strong>in</strong> the liquid fraction compared to phosphorus. As field application is assumed<br />
to follow application limit of 170 kg N ha -1 yr -1 for nitrogen, a smaller amount of phosphorus <strong>in</strong> the liquid<br />
fraction is spread <strong>in</strong> the centrifuge scenario. Another explanation for the negative contribution to freshwater<br />
eutrophication for the two centrifuge scenarios is that the production of m<strong>in</strong>eral fertiliser contributes to<br />
freshwater eutrophication. The production of m<strong>in</strong>eral phosphorus fertiliser is replaced <strong>in</strong> the scenarios where<br />
the solid fraction is applied to fields that are low <strong>in</strong> phosphorus. In the decanter centrifuge scenarios, a large<br />
share of phosphorus is <strong>in</strong> the solid fraction, 71%, and thus replac<strong>in</strong>g 0.45 kg P2O5 (m<strong>in</strong>eral phosphorus fertiliser).<br />
After screw press separation, only 17% of <strong>in</strong>itial phosphorus is <strong>in</strong> the solid fraction, imply<strong>in</strong>g a replacement<br />
of 1.95 kg P2O5 (m<strong>in</strong>eral phosphorus fertiliser).<br />
Look<strong>in</strong>g at Fig. 1, it can be seen that all treatment scenarios have a lower contribution to mar<strong>in</strong>e eutrophication<br />
than the reference scenario. In the ReCiPe2008 m<strong>et</strong>hod, mar<strong>in</strong>e eutrophication potential is calculated<br />
from the emissions of nitrogen, because growth <strong>in</strong> saltwater bodies is assumed to be limited by nitrogen.<br />
Reductions range from 29% less for the screw press with compost<strong>in</strong>g scenario to 39% for the centrifuge with<br />
ammonia stripp<strong>in</strong>g scenario. This is ma<strong>in</strong>ly caused by the assumed m<strong>in</strong>eral fertiliser replacement efficiency<br />
for the different slurry fraction. With 45%, the lowest replacement efficiency is assumed for the screw press<br />
with compost<strong>in</strong>g scenario, while the highest is assumed for the stripped ammonia, with 100%.<br />
The relative acidification potential ranges from 86% for the centrifuge with ammonia stripp<strong>in</strong>g scenario,<br />
to 102% for the screw press with compost<strong>in</strong>g scenario. The ma<strong>in</strong> contribution <strong>in</strong> all scenarios is caused dur<strong>in</strong>g<br />
storage under the partly-slatted flours <strong>in</strong> the pig hous<strong>in</strong>g. As the storage dur<strong>in</strong>g hous<strong>in</strong>g is similar <strong>in</strong> all<br />
scenarios and treatment first takes place after this stage, differences <strong>in</strong> acidification potential for the scenarios<br />
are ma<strong>in</strong>ly caused after field application of the slurry. For the centrifuge with ammonia stripp<strong>in</strong>g scenario,<br />
emissions dur<strong>in</strong>g treatment are higher than <strong>in</strong> any other scenario due to <strong>in</strong>creased pH. However, this<br />
<strong>in</strong>crease dur<strong>in</strong>g treatment is more than compensated for after field application, lead<strong>in</strong>g to a n<strong>et</strong> reduction <strong>in</strong><br />
ammonia loss from the compl<strong>et</strong>e stripp<strong>in</strong>g process. The <strong>in</strong>creased acidification potential <strong>in</strong> the screw press<br />
with compost<strong>in</strong>g scenario is due to the addition of rape straw dur<strong>in</strong>g compost<strong>in</strong>g, <strong>in</strong>creas<strong>in</strong>g the total amount<br />
of nitrogen.<br />
A noticable difference b<strong>et</strong>ween this research and that of others is that biogenic carbon is <strong>in</strong>cluded <strong>in</strong> the<br />
analysis <strong>in</strong> this study but not <strong>in</strong> the others (De Vries <strong>et</strong> al., <strong>2012</strong>; Lopez-Ridaura <strong>et</strong> al., 2009; Prapaspongsa <strong>et</strong><br />
al., 2010). Both De Vries <strong>et</strong> al., (<strong>2012</strong>) and Prapaspongsa <strong>et</strong> al., (2010) show a negative contribution to climate<br />
change field, which implies that the use of m<strong>in</strong>eral fertiliser has a higher impact on climate change than<br />
the use of pig slurry. Lopez-Ridaura <strong>et</strong> al., (2009) and the current research show the opposite.<br />
568
PARALLEL SESSION 6C: POULTRY AND PORK PRODUCTION SYSTEMS 8 th Int. Conference on <strong>LCA</strong> <strong>in</strong> the<br />
Agri-<strong>Food</strong> Sector, 1-4 Oct <strong>2012</strong><br />
Figure 1. Relative Climate Change Potential, Freshwater Eutrophication Potential, Mar<strong>in</strong>e Eutrophication Potential and<br />
Terrestrial Acidification Potential of treatment scenarios compared to reference (100%).<br />
3.2. Sensitivity analysis<br />
In the sensitivity analysis, the effect of vary<strong>in</strong>g three param<strong>et</strong>ers was analysed, N2O emission rate, NH3<br />
emission rate and P loss rate. The param<strong>et</strong>ers were all related to emissions after field application, as large<br />
uncerta<strong>in</strong>ties are associated with these estimates (Hansen <strong>et</strong> al., 2008; IPCC, 2006; Nielsen & Wenzel, 2007).<br />
3.2.1. N2O emission rate (field)<br />
Accord<strong>in</strong>g to the IPCC (2006), the N2O emission rate after field application of slurry ranges from 0.7% to<br />
6.0% of total N. These values were <strong>in</strong>cluded <strong>in</strong> the sensitivity analysis, and results are shown <strong>in</strong> Figure 5.<br />
For the low emission model, the global warm<strong>in</strong>g potential is decreases the least with 16% for screw press<br />
with compost<strong>in</strong>g scenario to the most for the centrifuge scenario with 19%. For <strong>in</strong>creas<strong>in</strong>g the N2O emission<br />
rates to 6.0%, aga<strong>in</strong> the screw press with compost<strong>in</strong>g scenario is affected the least with 49% and the centrifuge<br />
scenario is affected the most with 59%. The relative rank<strong>in</strong>g of scenarios is not changed by edit<strong>in</strong>g the<br />
N2O emission rate.<br />
569
PARALLEL SESSION 6C: POULTRY AND PORK PRODUCTION SYSTEMS 8 th Int. Conference on <strong>LCA</strong> <strong>in</strong> the<br />
Agri-<strong>Food</strong> Sector, 1-4 Oct <strong>2012</strong><br />
Figure 2. Sensitivity of climate change potential to field N2O emission rates of different slurry fractions.<br />
3.2.2. NH3 emission rate (field)<br />
Values for the sensitivity analysis for the NH3 emission rate are based on ranges provided <strong>in</strong> Hansen <strong>et</strong><br />
al., (2008). Table 1 provides an overview of the emission rates that were analysed.<br />
Table 2: NH3-N emission rates <strong>in</strong> ma<strong>in</strong> sensitivity models (% of TAN-N).<br />
Ma<strong>in</strong> model Low High<br />
Slurry 16 3.1 20<br />
Liquid fraction 12 1.6 10<br />
Solid fraction 39 13 65<br />
Compost 39 13 65<br />
The impact category that is affected most by the chang<strong>in</strong>g emission rates is mar<strong>in</strong>e eutrophication (Table<br />
3). Lower NH3 emission rates (Table 2) correspond to a higher contribution to mar<strong>in</strong>e eutrophication. Mar<strong>in</strong>e<br />
eutrophication is ma<strong>in</strong>ly caused by NO3 - emissions to water bodies and <strong>in</strong>directly by NH3 emissions to the<br />
air. It is assumed that NH3 emissions ma<strong>in</strong>ly take place with<strong>in</strong> the first hours to days after land application,<br />
NO3 - emissions take place later <strong>in</strong> the 10 year period that is tracked. Therefore NO3 - emissions depend on<br />
how much N is removed from the soil system <strong>in</strong> the form of NH3. More NH3 emitted means a decrease <strong>in</strong><br />
NO3 - leach<strong>in</strong>g. The relative rank<strong>in</strong>g of scenarios is not changed by edit<strong>in</strong>g the NH3 emission rate.<br />
Contrary to the mar<strong>in</strong>e eutrophication potential, total impact on terrestrial acidification decreases if the<br />
NH3 emission rates decrease. NH3 is a ma<strong>in</strong> contributor to terrestrial acidification. Therefore, the impact<br />
potential decreases if the NH3 emission decreases. The ammonia stripp<strong>in</strong>g scenario decreases less than other<br />
scenarios. In this scenario only a small share of N is applied <strong>in</strong> the regular way, the rest is converted <strong>in</strong>to<br />
m<strong>in</strong>eral fertiliser. For the sensitivity analysis with high NH3 emission rates (Table 2), ma<strong>in</strong>ly rates for the<br />
solid fraction and compost are higher than <strong>in</strong> the ma<strong>in</strong> model. The emission rate of liquid fractions is lower<br />
than <strong>in</strong> the ma<strong>in</strong> model. The relatively low sensitivity of the screw press scenario to high NH3 emission rates<br />
is due to the relatively large amount of liquid fraction <strong>in</strong> this scenario.<br />
Table 3: Changes <strong>in</strong> mar<strong>in</strong>e eutrophication potential and terrestrial acidification potential after sensitivity<br />
analysis for field NH3 emission rates compared to ma<strong>in</strong> model.<br />
Mar<strong>in</strong>e eutrophication potential Terrestrial acidification potential<br />
Low High Low High<br />
Reference Scenario 34% -10% -28% 8.4%<br />
Screw Press Scenario 44% -1.5% -27% 2.5%<br />
Screw Press + Compost<strong>in</strong>g 46% -3.7% -29% 5.1%<br />
Centrifuge Scenario 45% -4.8% -28% 4.8%<br />
Centrifuge + Am Stripp<strong>in</strong>g 13% -13% -10% 10%<br />
3.2.3. P loss rate (field)<br />
Changes <strong>in</strong> the loss rate of P that is applied to fields only <strong>in</strong>fluence freshwater eutrophication. The <strong>in</strong>fluence<br />
is large, also with m<strong>in</strong>or changes to the loss rate. As <strong>in</strong> Nielsen and Wenzel (2007), the sensitivity<br />
570
PARALLEL SESSION 6C: POULTRY AND PORK PRODUCTION SYSTEMS 8 th Int. Conference on <strong>LCA</strong> <strong>in</strong> the<br />
Agri-<strong>Food</strong> Sector, 1-4 Oct <strong>2012</strong><br />
analysis is calculat<strong>in</strong>g the n<strong>et</strong> model outputs if P loss rates are varied from 0% to 100% of P surplus. The<br />
model with 100% loss of P surplus, is more than 1 order of magnitude larger than the ma<strong>in</strong> model. The<br />
model with 0% loss of P surplus leads to an emission of a freshwater eutrophication potential that is close to<br />
0. The slightly negative values for the four scenarios with slurry separation, are due to losses dur<strong>in</strong>g production<br />
of m<strong>in</strong>eral P fertiliser.<br />
Table 4: Sensitivity of freshwater eutrophication potential to field P loss rates.<br />
5% of P surplus 0% of P surplus 100% of P surplus<br />
Basel<strong>in</strong>e Scenario 0,022 0,000 0,445<br />
Screw Press Scenario 0,017 -0,001 0,352<br />
Screw Press + Compost<strong>in</strong>g 0,017 -0,001 0,352<br />
Centrifuge Scenario -0,012 -0,003 -0,183<br />
Centrifuge + Am Stripp<strong>in</strong>g 0,010 -0,003 0,253<br />
4. Conclusion<br />
In general, the treatment technologies analysed <strong>in</strong> this <strong>LCA</strong> show environmental impact potential reduction<br />
<strong>in</strong> comparison to a reference scenario. The only scenario that seems to have a higher impact potential,<br />
with respect to the global warm<strong>in</strong>g potential and acidification, is the scenario with screw press separation and<br />
compost<strong>in</strong>g of the solid fraction. The decanter centrifuge scenarios show higher impact potential reductions<br />
than the screw press scenarios. The sensitivity analysis shows that results are particularly sensitive to phosphorus<br />
loss rates. For all variables <strong>in</strong>cluded <strong>in</strong> the sensitivity analysis, relative scenario rank<strong>in</strong>g does not<br />
change.<br />
5. Acknowledgements<br />
The research was performed as a part of research project “CLEANWASTE” funded by The Danish<br />
Council for Strategic Research.<br />
6. References<br />
De Vries, J.W., Groeneste<strong>in</strong>, C.M., De Boer, I.J.M., <strong>2012</strong>. Environmental consequences of process<strong>in</strong>g manure to produce m<strong>in</strong>eral<br />
fertilizer and bio-energy. J Environ Manage 102, 173-183.<br />
Goedkoop, M., Heijungs, R., Huijbregts, M., De Schryver, A., Struijs, J., van Zelm, R., 2009. ReCiPe 2008: A life cycle impact<br />
assessment m<strong>et</strong>hod which comprises harmonised category <strong>in</strong>dicators at the midpo<strong>in</strong>t and the endpo<strong>in</strong>t level No. Report 1: Characterisation).<br />
The Hague: M<strong>in</strong>istry of Hous<strong>in</strong>g Spatial Plann<strong>in</strong>g and the Environment.<br />
Hansen, M.N., Sommer, S.G., Hutch<strong>in</strong>gs, N.J., Sørensen, P., 2008. Emmision factors for calculation of ammonia volatilization by<br />
storage and application of animal manure. DJF Husdyrbrug nr. 84. Published: Aarhus University, Tjele.<br />
IPCC, 2006. 2006 IPCC Guidel<strong>in</strong>es for National Greenhouse Gas Inventories, Prepared by the National Greenhouse Gas Inventories<br />
Programme, Eggleston, HS., Buendia, L., Miwa, K., Ngara, T., Tanabe, K. (eds.), Published: IGES, Japan.<br />
Lopez-Ridaura, S., Van der Werf, H., Paill<strong>et</strong>, J.M., Le Bris, B., 2009. Environmental evaluation of transfer and treatment of excess<br />
pig slurry by life cycle assessment. J Environ Manage 90, 1296-1304.<br />
Nielsen, P.H. & Wenzel, H. 2007. Environmental assessment of Ronozyme ® P5000 CT Phytase as an alternative to <strong>in</strong>organic phosphate<br />
supplementation to pig feed used <strong>in</strong> <strong>in</strong>tensive pig production. Int. J <strong>LCA</strong> 12, 514-520.<br />
Prapaspongsa, T., Christensen, P., Schmidt, J.H., Thrane, M., 2010. <strong>LCA</strong> of comprehensive pig manure management <strong>in</strong>corporat<strong>in</strong>g<br />
<strong>in</strong>tegrated technology systems. J Clean Prod 18, 1413-1422.<br />
571
PARALLEL SESSION 7A: CONSUMERS 8 th Int. Conference on <strong>LCA</strong> <strong>in</strong> the<br />
Parallel session 7a: Consumers<br />
572<br />
Agri-<strong>Food</strong> Sector, 1-4 Oct <strong>2012</strong><br />
Communication of <strong>LCA</strong> results <strong>in</strong> the French environmental<br />
experimentation context: user-friendly web-based tool for the case of<br />
coffee<br />
Simone Pedrazz<strong>in</strong>i 1,* , Carole Dubois 1 , Raphael Halloran 1 , Christophe Porté 1 , Sandi Northey 2 , Urs Schenker 3 ,<br />
Sebastien Humbert 1<br />
1 Quantis, Parc scientifique EPFL, Bât. D, 1015 Lausanne, Switzerland<br />
2 Nestlé, Av. Nestlé 55, 1800 Vevey, Switzerland<br />
3 Nestlé Research Center, Vers-chez-les-Blanc, 1000 Lausanne, Switzerland<br />
Correspond<strong>in</strong>g author. E-mail: simone.pedrazz<strong>in</strong>i@quantis-<strong>in</strong>tl.com<br />
ABSTRACT<br />
In the French environmental experimentation context, the communication of life cycle assessment (<strong>LCA</strong>) results to the general public<br />
is one of the ma<strong>in</strong> challenges of this <strong>in</strong>itiative. The Nescafé® <strong>LCA</strong> Communication Tool is presented as an example of user-friendly<br />
<strong>in</strong>teractive solution to communicate the results of an <strong>LCA</strong> made on a cup of coffee. The ma<strong>in</strong> advantages of this k<strong>in</strong>d of communication<br />
are the limited amount of <strong>in</strong>formation on display at a time, allow<strong>in</strong>g analysis of complex results of an <strong>LCA</strong> <strong>in</strong> a simple and<br />
engag<strong>in</strong>g way, as well as creat<strong>in</strong>g <strong>in</strong>teractivity which attracts the attention of the user.<br />
Keywords: French labell<strong>in</strong>g experimentation, Grenelle, communication, web-based tool, coffee, multi-<strong>in</strong>dicators<br />
1. Introduction<br />
S<strong>in</strong>ce the 1 st of July 2011 a French experimentation on environmental labell<strong>in</strong>g of consumer products is<br />
on-go<strong>in</strong>g. This experimentation results from the “Grenelle de l’Environnement” <strong>in</strong>itiative, promoted by the<br />
French Parliament (Cros <strong>et</strong> al., 2010). The objective of the Grenelle <strong>in</strong>itiative is to <strong>in</strong>form consumers about<br />
the environmental performance of consumer products throughout their life cycle, as a choice criterion when<br />
mak<strong>in</strong>g a purchase.<br />
One of the ma<strong>in</strong> challenges of this <strong>in</strong>itiative is the communication of life cycle assessment (<strong>LCA</strong>) results<br />
to the general public; that is mov<strong>in</strong>g from scientific report based results to simple and user-friendly means of<br />
communication. In this context, Nestlé contracted Quantis to help develop a web-based tool for Nescafé® -<br />
one of the products participat<strong>in</strong>g <strong>in</strong> the French pilot. The result is the Nescafé® <strong>LCA</strong> Communication Tool,<br />
which presents the results of an <strong>LCA</strong> made on a cup of coffee. The tool is a Nestlé propri<strong>et</strong>ary <strong>in</strong>itiative <strong>in</strong>tended<br />
to help communicate <strong>LCA</strong> results and understand<strong>in</strong>g to the general public. A key aim was to develop<br />
an <strong>in</strong>teractive web-based tool that displays results <strong>in</strong> an attractive and user-friendly way (http://nescafe.outilacv.com/).<br />
2. M<strong>et</strong>hods<br />
The full life cycle impacts of a cup of spray dried soluble coffee are based on Humbert <strong>et</strong> al., (2009) and<br />
are assessed for the climate change, water consumption and land occupation impact categories, us<strong>in</strong>g IM-<br />
PACT 2002+ (Jolli<strong>et</strong> <strong>et</strong> al., 2003, as adapted by Humbert <strong>et</strong> al., <strong>2012</strong>). The results are compliant with the<br />
standard developed for the French experimentation (BPX 30-323 2011) and follow the recommendations<br />
provided by the specific work<strong>in</strong>g group concern<strong>in</strong>g food products leaded by ADEME-AFNOR.<br />
3. Results and discussion<br />
The Nescafé® <strong>LCA</strong> Communication Tool allows consumers to analyse the results per life cycle stage and<br />
per <strong>in</strong>dicator. Consumers can “navigate” through the results and discover for themselves the environmental<br />
impacts of the different life cycle stages on the selected environmental <strong>in</strong>dicator. This allows display<strong>in</strong>g<br />
complex results of an <strong>LCA</strong> <strong>in</strong> a simple and engag<strong>in</strong>g way by hav<strong>in</strong>g only a limited amount of <strong>in</strong>formation on<br />
display at a time.<br />
The home page presents the seven life cycle stages assessed (see Figure 1). The user can both click on<br />
each life cycle stage to analyse its contribution for the three environmental <strong>in</strong>dicators or click on a s<strong>in</strong>gle<br />
environmental <strong>in</strong>dicator to analyse the contribution of each life cycle stage (see Figures 2, 3, and 4).
PARALLEL SESSION 7A: CONSUMERS 8 th Int. Conference on <strong>LCA</strong> <strong>in</strong> the<br />
Agri-<strong>Food</strong> Sector, 1-4 Oct <strong>2012</strong><br />
Figure 1. Nescafé® <strong>LCA</strong> Communication Tool <strong>in</strong>terface, “From bean to cup”.<br />
The greenhouse gas emissions <strong>in</strong>dicator has a total score of about 28 g CO2-eq./cup of coffee and the agriculture<br />
life cycle stage represents the ma<strong>in</strong> contribution, ma<strong>in</strong>ly due to fertiliser use, as seen <strong>in</strong> Figure 2<br />
below.<br />
Figure 2. Nescafé® <strong>LCA</strong> Communication Tool, <strong>LCA</strong> results for the greenhouse gas emissions <strong>in</strong>dicator.<br />
In terms of water consumption (relative), the total score is about 1.4 dl water-eq/cup of coffee and it is<br />
ma<strong>in</strong>ly due to crop irrigation dur<strong>in</strong>g the agriculture life cycle stage, as seen <strong>in</strong> Figure 3 below. This <strong>in</strong>dicator<br />
represents the amount of water consumed (i.e. evaporated, <strong>in</strong>tegrated <strong>in</strong>to the product or moved to another<br />
573
PARALLEL SESSION 7A: CONSUMERS 8 th Int. Conference on <strong>LCA</strong> <strong>in</strong> the<br />
Agri-<strong>Food</strong> Sector, 1-4 Oct <strong>2012</strong><br />
watershed) at each life cycle stage weighted by the local water stress <strong>in</strong>dicator. Therefore this <strong>in</strong>dicator can<br />
be described as evaluat<strong>in</strong>g the amount of water consumed that is “<strong>in</strong> comp<strong>et</strong>ition with another user”.<br />
Figure 3. Nescafé® <strong>LCA</strong> Communication Tool, <strong>LCA</strong> results for water consumption (relative) <strong>in</strong>dicator.<br />
The utilised surface (relative) <strong>in</strong>dicator has a total score about 300 cm 2 /cup of coffee of utilised surface<br />
due almost exclusively to coffee plantations, as seen <strong>in</strong> Figure 4 below. This <strong>in</strong>dicator represents the amount<br />
of surface used weighted by its specific pressure on biodiversity: lower the pressure on biodiversity lower the<br />
<strong>in</strong>dicator will be.<br />
Figure 4. Nescafé® <strong>LCA</strong> Communication Tool, <strong>LCA</strong> results for utilised surface (relative) <strong>in</strong>dicator.<br />
574
PARALLEL SESSION 7A: CONSUMERS 8 th Int. Conference on <strong>LCA</strong> <strong>in</strong> the<br />
Agri-<strong>Food</strong> Sector, 1-4 Oct <strong>2012</strong><br />
To be transparent, the m<strong>et</strong>hodology used is described giv<strong>in</strong>g d<strong>et</strong>ails about the environmental <strong>in</strong>dicators<br />
def<strong>in</strong>itions and the hypotheses used <strong>in</strong> this study (Figure 5).<br />
Figure 5. Nescafé® <strong>LCA</strong> Communication Tool, description of the <strong>in</strong>dicators assessed.<br />
4. Conclusion<br />
In the French environmental experimentation context, the communication of <strong>LCA</strong> results to the general<br />
public is one of the ma<strong>in</strong> challenges of this <strong>in</strong>itiative. The Nescafé® <strong>LCA</strong> Communication Tool is an example<br />
of user-friendly <strong>in</strong>teractive solution that allows consumers to analyse for themselves the results per life cycle<br />
stage and per <strong>in</strong>dicator. The ma<strong>in</strong> advantages of this k<strong>in</strong>d of communication are the limited amount of <strong>in</strong>formation<br />
on display at a time, allow<strong>in</strong>g analysis of complex results of an <strong>LCA</strong> <strong>in</strong> a simple and engag<strong>in</strong>g way,<br />
as well as creat<strong>in</strong>g an <strong>in</strong>teractivity which attracts the attention of the user. The “Grenelle de<br />
l’Environnement” <strong>in</strong>itiative is a multi-<strong>in</strong>dicator approach which allows coverage of a wider range of environmental<br />
impacts (e.g. it is not only focused on carbon footpr<strong>in</strong>t). A multi-<strong>in</strong>dicator approach results <strong>in</strong> a<br />
communication challenge. The idea to show a limited amount of <strong>in</strong>formation on display at a time is a good<br />
option to overcome this challenge.<br />
While it is clear that consumers are still becom<strong>in</strong>g familiar with a life cycle assessment approach to understand<strong>in</strong>g<br />
environmental impacts, this k<strong>in</strong>d of solution can be a valuable start <strong>in</strong> mov<strong>in</strong>g from scientific<br />
report based results to more engag<strong>in</strong>g consumer communication.<br />
5. References<br />
BP X 30-323, 2011. Pr<strong>in</strong>cipes généraux pour l'affichage environnemental des produits de grande consommation. Référentiel de<br />
bonnes pratiques. AFNOR. <strong>France</strong>.<br />
Cros, C., Fourdr<strong>in</strong>, E., Réthoré, O., 2010. The French <strong>in</strong>itiative on environmental <strong>in</strong>formation of mass mark<strong>et</strong> products. International<br />
Journal of Lice Cycle Assessment 15, 537-539.<br />
Humbert, S., Loer<strong>in</strong>cik, Y., Rossi, V., Margni, M., Jolli<strong>et</strong>, O., 2009. Life cycle assessment of spray dried soluble coffee and comparison<br />
with alternatives (drip filter and capsule espresso). Journal of Cleaner Production 17, 1351-1358.<br />
Jolli<strong>et</strong>, O., Margni, M., Charles, R., Humbert, S., Pay<strong>et</strong>, J., Rebitzer, G., Rosenbaum, R., 2003. IMPACT 2002+: a new life cycle<br />
impact assessment m<strong>et</strong>hod. International Journal of Life Cycle Assessment 8(6), 324–30.<br />
Humbert, S., De Schryver, A., Margni, M., Jolli<strong>et</strong>, O., <strong>2012</strong>. IMPACT 2002+: User Guide, Draft for version Q2.2 (version adapted<br />
by Quantis). Available at http://www.quantis-<strong>in</strong>tl.com.<br />
Nescafé website, 2011. Available at http://nescafe.outil-acv.com.<br />
575
PARALLEL SESSION 7A: CONSUMERS 8 th Int. Conference on <strong>LCA</strong> <strong>in</strong> the<br />
Agri-<strong>Food</strong> Sector, 1-4 Oct <strong>2012</strong><br />
576<br />
<strong>Food</strong> labell<strong>in</strong>g from a consumers’ perspective<br />
Ulrike Eberle<br />
Ulrike Eberle, corsus – corporate susta<strong>in</strong>ability, Nernstweg 32-34, D-22765 Hamburg, E-mail: u.eberle@corsus.de<br />
ABSTRACT<br />
In particular <strong>in</strong> the food sector the vari<strong>et</strong>y of products is enormous. Appropriate labels on food attributes that consumers have to trust<br />
<strong>in</strong> could play a key role <strong>in</strong> support<strong>in</strong>g more susta<strong>in</strong>able and environmental friendly purchas<strong>in</strong>g decisions. Various studies with a focus<br />
on the German mark<strong>et</strong> and on environmental impacts have been analysed and brought tog<strong>et</strong>her. The results show that <strong>LCA</strong> could be<br />
the m<strong>et</strong>hod of choice, but research on some environmental impact categories and how to <strong>in</strong>clude them best <strong>in</strong> <strong>LCA</strong> is still necessary.<br />
However, most important from a consumers perspective is that the <strong>in</strong>formation <strong>in</strong> the label is presented <strong>in</strong> a way that it is reliable and<br />
that it really supports susta<strong>in</strong>able purchas<strong>in</strong>g decisions. Thus, research has to be carried out how to ‘translate’ <strong>LCA</strong> results appropriately<br />
and how labels are used by consumers.<br />
Keywords: food labell<strong>in</strong>g, consumers’ perspective, environmental impacts, useability<br />
1. Introduction<br />
In particular <strong>in</strong> the food sector the vari<strong>et</strong>y of products is enormous. Large stores <strong>in</strong> Germany sell more<br />
than 30,000 different articles, the mark<strong>et</strong> as a whole offers more than 100,000 articles. Thus, consumers have<br />
to choose b<strong>et</strong>ween huge vari<strong>et</strong>ies of products, some of them quite similar. For decision mak<strong>in</strong>g they can use<br />
the <strong>in</strong>formation given on the product. Some of these declarations are obligatory, like the list of <strong>in</strong>gredients,<br />
best-before-date, or nutritional <strong>in</strong>formation; some are voluntary, like carbon labels or animal welfare labels<br />
and mark food attributes consumers have to trust <strong>in</strong>. Because of the amount of different declarations it is <strong>in</strong><br />
most cases really difficult for consumers to handle all these d<strong>et</strong>ailed <strong>in</strong>formation (Eberle <strong>et</strong> al., 2011). S<strong>in</strong>ce<br />
the 1950s it is known very well that most people are only able to take seven (plus or m<strong>in</strong>us two) different<br />
<strong>in</strong>formation <strong>in</strong>to account for their purchas<strong>in</strong>g decision - the so called ‘magical number seven’ (Miller 1956).<br />
On the other side, <strong>in</strong>formation overload can lead to excessive demands and a refusal to even study the offered<br />
choice (Walsh 2002).<br />
In consumer research the role and success factors of signals like labels as effective <strong>in</strong>formation <strong>in</strong>struments<br />
have been under <strong>in</strong>vestigation for a long time. Hence, it is known that consumers simplify decisions<br />
via selective perception of <strong>in</strong>formation (e.g. P<strong>et</strong>er <strong>et</strong> al., 1999). In this k<strong>in</strong>d of consumer research labels are<br />
understood as ‘<strong>in</strong>formation chunks’, which are particularly important for compar<strong>in</strong>g products and which<br />
substitute and bundle other <strong>in</strong>formation (Kröber-Riel & We<strong>in</strong>berg 2003, p. 284). Consumers expect essential<br />
or even sufficient <strong>in</strong>formation about the product or process quality from labels. But one has to keep <strong>in</strong> m<strong>in</strong>d<br />
that <strong>in</strong>formation has to be as simple as possible and at the same time as exact as possible. Thus, labels “can<br />
play a key role when it comes to trust-related properties of products or services, as consumers do not have a<br />
reliable alternative source of this <strong>in</strong>formation” (Eberle <strong>et</strong> al., 2011, p. II).<br />
Aga<strong>in</strong>st this background the recent practice regard<strong>in</strong>g labell<strong>in</strong>g of food attributes that consumers have to<br />
trust <strong>in</strong> like environmental impacts or social issues is analysed with a focus on Germany. The analysis focusses<br />
ma<strong>in</strong>ly on environmental issues and identifies problems <strong>in</strong> recent practice.<br />
2. M<strong>et</strong>hods<br />
For this purpose the f<strong>in</strong>d<strong>in</strong>gs from different studies and strategy papers of commissions and Advisory<br />
boards on food labell<strong>in</strong>g have been analysed and brought tog<strong>et</strong>her. The analysis has been carried out from a<br />
‘consumers’ perspective’ – a research m<strong>et</strong>hodology developed <strong>in</strong> the German research project<br />
‘Ernährungswende’ (www.ernaehrungswende.de) funded by the German M<strong>in</strong>istry for Education and Research<br />
(Hayn <strong>et</strong> al., 2005).<br />
3. Results<br />
In general, a “label means any tag, brand, mark, pictorial or other descriptive matter, written, pr<strong>in</strong>ted,<br />
stencilled, marked, embossed or impressed on, or attached to, a conta<strong>in</strong>er of food” (WHO/FAO 2007, p. 2).<br />
Furthermore, consumers also understand results of product tests as labels, i.e. the test results of the German<br />
‘Stiftung Warentest’ which gives the opportunity to pr<strong>in</strong>t the results on the product. Also brands can be seen<br />
as labels from a consumers’ perspective <strong>in</strong> particular if concr<strong>et</strong>e product qualities are promised with the<br />
brands name or logo (Eberle <strong>et</strong> al., 2011).<br />
In the past years more and more attributes of confidence, such as environmental or social issues, are labelled<br />
<strong>in</strong> food products, some claim for less environmental impacts or b<strong>et</strong>ter environmental performance,
PARALLEL SESSION 7A: CONSUMERS 8 th Int. Conference on <strong>LCA</strong> <strong>in</strong> the<br />
Agri-<strong>Food</strong> Sector, 1-4 Oct <strong>2012</strong><br />
others for b<strong>et</strong>ter animal welfare, or for more susta<strong>in</strong>ability of the labelled food product. Some labell<strong>in</strong>g<br />
schemes are already <strong>in</strong> place, e.g. fair trade or organically grown products; others such as climate labels,<br />
labels on animal welfare or labels that show aggregated susta<strong>in</strong>ability or environmental aspects are <strong>in</strong> place<br />
<strong>in</strong> few countries, but <strong>in</strong> most countries they are still under development or ready to push <strong>in</strong>to the mark<strong>et</strong>.<br />
3.1 German food labels<br />
In the German food mark<strong>et</strong> ten different labels for organically grown products could be found 4 . One of<br />
them is the obligatory EU Label for organic food. Another one is the German ‘Bio-Siegel’ which is with<br />
90% the best known food label <strong>in</strong> Germany. In contrast, the EU Label for organic food is known only by<br />
14% of German consumers. The other labels belong to the different organically growers associations like<br />
Dem<strong>et</strong>er or Bioland which are the two biggest. These labels are also known by consumers - the b<strong>et</strong>ter the<br />
bigger the association. However, the <strong>in</strong>formation given with the labels is not really clear to most consumers<br />
(Buxel 2010).<br />
Accord<strong>in</strong>g to Eberle (<strong>2012</strong>) at the end of 2011 four different labels could be found <strong>in</strong> the German food<br />
mark<strong>et</strong> which claimed for less greenhouse gas emissions: one of them is a label of an <strong>in</strong>dependent organisation,<br />
which could be obta<strong>in</strong>ed only for organically grown food products. Three of them are self-declarations<br />
of companies.<br />
In addition there exists a vari<strong>et</strong>y of further food labels. Some belong to <strong>in</strong>dependent organisations like<br />
Mar<strong>in</strong>e Stewardship Council (MSC) for fish and fish products caught with practices that avoid overfish<strong>in</strong>g;<br />
Fair Trade, for food that is produced follow<strong>in</strong>g the standards of fair trade along the value cha<strong>in</strong>; or Ra<strong>in</strong>forest<br />
Alliance, for food products from tropical countries e.g. coffee that follows the standards for a more susta<strong>in</strong>able<br />
coffee cultivation. Some are based on legislation like the label on gen<strong>et</strong>ically modified organism (EC<br />
regulations 1829/2003 and 1830/2003) or the national German label “GMO free” (EGGenTDurchfG) (Eberle<br />
2011). Others are company claims like the ProPlan<strong>et</strong> Label of the REWE Group (Eberle <strong>2012</strong>).<br />
3.2 M<strong>et</strong>hodological basis and m<strong>et</strong>hodological challenges<br />
Sengstschmid <strong>et</strong> al., (2011) showed <strong>in</strong> their study that only s<strong>in</strong>gle issue labels (e.g. on climate change) are<br />
based on a life cycle approach like the British Carbon Trust’s carbon label. Also <strong>in</strong> Germany the labels based<br />
on a life cycle approach are s<strong>in</strong>gle issue labels (Eberle 2011, <strong>2012</strong>): Three of the carbon labels on the German<br />
mark<strong>et</strong> are based on a life cycle approach (ISO 14040series, PAS 2050/German Memorandum Product<br />
Carbon Footpr<strong>in</strong>t (Grießhammer and Hochfeld, 2009), or a comparable self-developed standard (Stop Climate<br />
Change, 2008)); one of them gives no <strong>in</strong>formation on the standard on which the calculation of greenhouse<br />
gas emissions and assessment of impacts on climate change is based upon.<br />
Nevertheless various labels which are not based on a life cycle approach cover a broad range of important<br />
environmental impacts with their standards, but do not quantify them nor compare them to the impacts of<br />
similar products, e.g. labels for organically grown products (Sengstschmid <strong>et</strong> al., 2011). It is state of the art<br />
that at the moment no label for food or meals exists that is based on an assessment of the environmental performance<br />
of the product’s life cycle (Eberle <strong>et</strong> al., 2011, Sengstschmid <strong>et</strong> al., 2011). Only the French approach<br />
(Grenelle de l’Environnement, http://www.legrenelle-environnement.fr/) has foreseen that the analysis<br />
of the product’s life cycle will form the basis of the <strong>in</strong>formation given by the label.<br />
Sengstschmid <strong>et</strong> al., (2011) asked stakeholders and consumers which would be the ma<strong>in</strong> issues and important<br />
impact categories to be covered by an environmental food label. Accord<strong>in</strong>g to their results the ma<strong>in</strong><br />
environmental issues and important environmental impact categories would be waste and development of<br />
recycl<strong>in</strong>g systems, water usage, water pollution, greenhouse gas emissions, eco-toxicity and pesticide use.<br />
From an expert po<strong>in</strong>t of view there are some important issues lack<strong>in</strong>g related to environmental impacts of<br />
food, such as land use, degradation of soils, acidification, quality of water bodies, eutrophication, and impacts<br />
on ecosystems and biodiversity. Others like development of recycl<strong>in</strong>g systems have not been ranked <strong>in</strong><br />
first priority by experts (e.g. SRU 2002). Hav<strong>in</strong>g the need to quantify those important issues/impact categories<br />
it could be easily seen that most of them could be quantified best by us<strong>in</strong>g life cycle assessment (<strong>LCA</strong>)<br />
accord<strong>in</strong>g to ISO 14040 series. In contrast, others are up to date quite difficult to quantify with <strong>LCA</strong>.<br />
Amongst them is the impact on ecosystems and biodiversity for which different m<strong>et</strong>hodological approaches<br />
are <strong>in</strong> discussion (e.g. Müller-Wenk 1998, Brentrup <strong>et</strong> al., 2002, Kyläkorpi <strong>et</strong> al., 2005, L<strong>in</strong>dner 2008, Milà i<br />
4 http://www.nachhaltigkeitsrat.de/news-nachhaltigkeit/2011/2011-04-21/der-nachhaltige-warenkorb-rne-e<strong>in</strong>kaufsfuehrer-<br />
aktualisiert/?blstr=0<br />
577
PARALLEL SESSION 7A: CONSUMERS 8 th Int. Conference on <strong>LCA</strong> <strong>in</strong> the<br />
Agri-<strong>Food</strong> Sector, 1-4 Oct <strong>2012</strong><br />
Canals <strong>et</strong> al., 2007, Michelsen 2008), none of them ready to be used by default. But also degradation of soils<br />
is difficult to cover with the <strong>LCA</strong> approach. For some impact categories still exists a scientific discussion<br />
about which assessment m<strong>et</strong>hod would be best, e.g. eco-toxicity (e.g. Pant <strong>et</strong> al., 2005), for other important<br />
impacts it is quite difficult and complex to g<strong>et</strong> valid and appropriate data, e.g. water use (e.g. Morrison <strong>et</strong> al.,<br />
2010).<br />
Labels have the need for simple, aggregated <strong>in</strong>formation that could be easily understood. Thus, a m<strong>et</strong>hodology<br />
that allows aggregat<strong>in</strong>g the results of the assessment of the various environmental <strong>in</strong>dicators is needed<br />
(Eberle <strong>et</strong> al., 2011). But up to date, there is no consensus about how to do such an aggregated assessment of<br />
the environmental performance of products, even though various approaches have been developed (e.g.<br />
MIPS (Schmidt-Bleek, 1997), EcoGrade (Grießhammer <strong>et</strong> al., 2007)). In <strong>France</strong>, currently relevant <strong>in</strong>dicators<br />
for the declaration of food products’ environmental performance will be def<strong>in</strong>ed; obligatory is to take<br />
greenhouse gas emission <strong>in</strong>to account. This is done with<strong>in</strong> a stakeholder approach (http://affichageenvironnemental.afnor.org/actualites/liste-des-gt-sectoriels).<br />
Furthermore a public database is under development<br />
conta<strong>in</strong><strong>in</strong>g the relevant life cycle data for French agricultural raw products (van der Werf <strong>et</strong> al.,<br />
2010).<br />
3.3 Status quo or process label?<br />
Almost all labels at least on the German mark<strong>et</strong> s<strong>et</strong> standards which have to be fulfilled, i.e. the standards<br />
for organic agriculture, or they state the status quo of the environmental performance of one environmental<br />
<strong>in</strong>dicator, e.g. carbon labels (Eberle 2011). In contrast, labels which <strong>in</strong> addition support development processes<br />
- so-called ‘process labels’ (Eberle 2002) - are still rare, but the need for such labels is seen. Recently<br />
the Scientific Advisory Boards on Consumer and <strong>Food</strong> Policy and on Agricultural Policy at the German Federal<br />
M<strong>in</strong>istry of <strong>Food</strong>, Agriculture and Consumer Protection recommended such a label for food (state<br />
owned or supported) <strong>in</strong> their Strategy Paper on <strong>Food</strong> Labell<strong>in</strong>g (Eberle <strong>et</strong> al., 2011). The <strong>in</strong>tention of such a<br />
label is to stimulate further development towards more susta<strong>in</strong>ability or environmental friendl<strong>in</strong>ess.<br />
The Advisory Boards also stated that it is very important for the success of such a label that empirical<br />
analyses will be performed which exam<strong>in</strong>e how consumers understand and use the <strong>in</strong>formation given by<br />
labels. This should be done before launch<strong>in</strong>g a new label and cont<strong>in</strong>uously after the launch. Up to date such<br />
<strong>in</strong>vestigations are still rare, none of the state labels like the EU Label for organically grown food or the German<br />
‘Bio-Siegel’ carries out such research. However, the French Grenelle de l’Environnement has foreseen a<br />
phase to evaluate the experiences which have been made with<strong>in</strong> the test phase with respect to consumers and<br />
their understand<strong>in</strong>g of the tested labels.<br />
3.4 Recommendations<br />
The analysed studies give recommendations how to face the identified problems. Aim has to be to avoid<br />
misguidance of consumers, to avoid misuse of labels only for mark<strong>et</strong><strong>in</strong>g purposes, and to support more susta<strong>in</strong>able<br />
or more environmental friendly purchas<strong>in</strong>g decisions through credible and mean<strong>in</strong>gful labels. Thus,<br />
the analysed studies recommend the follow<strong>in</strong>g (VK BaWü 2011, Eberle 2011, Eberle <strong>et</strong> al., 2011, Eberle<br />
<strong>2012</strong>):<br />
The basic requirements for product labels and <strong>in</strong>formation on food attributes that consumers have to<br />
trust <strong>in</strong> should be publicly available and this should be fixed by law. These are requirements like label<br />
criteria, labell<strong>in</strong>g authority, monitor<strong>in</strong>g, control and f<strong>in</strong>ancial dependencies.<br />
An <strong>in</strong>formation tool should be established that <strong>in</strong>forms about the labell<strong>in</strong>g schemes. Such a tool<br />
should be <strong>in</strong>dependent from the labell<strong>in</strong>g authorities and should present background <strong>in</strong>formation and<br />
evaluations on the different labels schemes.<br />
The useability of the label for consumers has to be assured. Thus, accompany<strong>in</strong>g empirical research<br />
(ex-ante and cont<strong>in</strong>uously) is urgently necessary to understand how consumers use and understand<br />
the <strong>in</strong>formation given with the label.<br />
B<strong>in</strong>d<strong>in</strong>g m<strong>et</strong>hodological approaches (e.g. <strong>LCA</strong>, product category rules for different food products,<br />
assessment and aggregation m<strong>et</strong>hodology) have to be developed and agreed upon. Furthermore a<br />
consistent <strong>LCA</strong> database has to be provided.<br />
4 Discussion and conclusions<br />
578
PARALLEL SESSION 7A: CONSUMERS 8 th Int. Conference on <strong>LCA</strong> <strong>in</strong> the<br />
Agri-<strong>Food</strong> Sector, 1-4 Oct <strong>2012</strong><br />
Labels “can play a key role when it comes to trust-related properties of products or services, as consumers<br />
do not have a reliable alternative source of this <strong>in</strong>formation” (Eberle <strong>et</strong> al., 2011, p. II).<br />
Today <strong>in</strong> the German food mark<strong>et</strong> a huge vari<strong>et</strong>y of labels is <strong>in</strong> place. Up to date there are no food labels<br />
<strong>in</strong> place that consider the whole products life cycle based on a <strong>LCA</strong> approach and at the same time cover all<br />
important environmental impact categories. However, <strong>LCA</strong> would certa<strong>in</strong>ly be the most appropriate approach<br />
to g<strong>et</strong> <strong>in</strong>sights on a products’ environmental performance even if today no commonly accepted approach<br />
exists to assess and aggregate the environmental performance of food. In <strong>France</strong> such an approach is<br />
under development. The approach is promis<strong>in</strong>g, <strong>in</strong> particular because the useability of the labels tested <strong>in</strong> the<br />
pilot phase will be analysed and because of the <strong>in</strong>volvement of various stakeholders. This is important because<br />
results for the German mark<strong>et</strong> have shown that the useability of many labels for consumers is low because<br />
it is som<strong>et</strong>imes difficult for consumers to understand what the message of the label is. Another important<br />
fact is that it is quite difficult for consumers to f<strong>in</strong>d out at the po<strong>in</strong>t of sale which of the food labels is<br />
reliable. But the success of an environmental food label will very much depend on the reliability of a labell<strong>in</strong>g<br />
scheme.<br />
Thus, from a consumers’ perspective few but reliable food labels are needed <strong>in</strong> the mark<strong>et</strong> which deliver<br />
clear and simple messages. In order that this could be achieved research is still needed:<br />
Research on the translation of <strong>LCA</strong> results <strong>in</strong> understandable and thus appropriate <strong>in</strong>formation for<br />
consumers that could be used <strong>in</strong> labels that really support more environmental friendly purchas<strong>in</strong>g<br />
decisions;<br />
on the d<strong>et</strong>erm<strong>in</strong><strong>in</strong>g factors of useability of labell<strong>in</strong>g schemes for consumers, and<br />
on an appropriate and thus agreeable aggregat<strong>in</strong>g assessment m<strong>et</strong>hodology for the environmental<br />
performance of food.<br />
Furthermore, politics is requested to support labell<strong>in</strong>g of attributes of confidence by provid<strong>in</strong>g a general s<strong>et</strong>up<br />
that prevents misuse of labels and misguidance of consumers.<br />
5. References<br />
Brentrup, F.; Küsters, J.; Lammel, J.; Kuhlmann, H., 2002. Life Cycle Impact Assessment of Land Use Based on the Hemeroby<br />
Concept, Int J <strong>LCA</strong>, pp. 339 - 348<br />
Buxel, H., 2010. Akzeptanz von Güte- und Qualitätssiegeln auf Lebensmitteln. Ergebnisse e<strong>in</strong>er empirischen Untersuchung. Fachhochschule<br />
Münster<br />
Eberle, U., 2002. Das Nachhaltigkeitszeichen als Prozesslabel, <strong>in</strong>: Scherhorn, G.; Weber, C. (eds.): nachhaltiger Konsum. Auf dem<br />
Weg zur gesellschaftlichen Verankerung, Ökom Verlag, pp. 191-196<br />
Eberle, U., 2011. Bestandsanalyse Nachhaltigkeitssiegel. Kurzgutachten im Auftrag der Bundestagsfraktion Bündnis 90 / Die<br />
Grünen. Berl<strong>in</strong><br />
Eberle, U., <strong>2012</strong>. Auslobung klimarelevanter Aspekte bei Lebensmitteln. Verbraucherzentrale Schleswig-Holste<strong>in</strong> (Federführung),<br />
Verbraucherzentrale Niedersachsen, Verbraucherzentrale Hessen, Verbraucherzentrale Saarland, Verbraucherzentrale Nordrhe<strong>in</strong>-<br />
Westfalen und Verbraucherzentrale Bayern (eds.)<br />
Eberle, U., Spiller, A., Becker, T., Heißenhuber, A., Leonhäuser, I.U., Sundrum, A., 2011. Political strategy for food-labell<strong>in</strong>g; Jo<strong>in</strong>t<br />
Statement of the Scientific Advisory Boards on ‘Consumer and <strong>Food</strong> Policy’ and ‘Agricultural Policy’ at the Federal German<br />
M<strong>in</strong>istry of <strong>Food</strong>, Agriculture and Consumer Protection (BMELV), Berl<strong>in</strong><br />
Grießhammer, R., Buchert, M., Gensch, C., Hochfeld, C., Manhart, A., Rüdenauer, I., 2007. Prosa – Product Susta<strong>in</strong>ability Assessment.<br />
Grießhammer, R., Hochfeld, C., 2009. Memorandum Product Carbon Footpr<strong>in</strong>t. Position statement on measurement and communication<br />
of the product carbon footpr<strong>in</strong>t for <strong>in</strong>ternational standardization and harmonization purposes. Freiburg/Berl<strong>in</strong>,<br />
http://www.bmu.de/files/pdfs/allgeme<strong>in</strong>/application/pdf/memorandum_pcf_en_bf.pdf<br />
Hayn, D., Eberle, U., Rehaag, R., Simshäuser, U., Scholl, G., 2005. Konsument/<strong>in</strong>nenperspektive. E<strong>in</strong> <strong>in</strong>tegrativer Forschungsansatz<br />
für sozial-ökologische Ernährungsforschung. Discussion paper No. 8, www.ernaehrungswende.de<br />
Krober-Riel, W., We<strong>in</strong>berg, P., 2003. Konsumentenverhalten. 8th edition, Munich: Vahlen<br />
Kyläkorpi, K., Rydgren, B., Ellegård, A., Miliander, S., Grusell, E., 2005. The Biotope M<strong>et</strong>hod. A m<strong>et</strong>hod to assess the impact of<br />
land use on biodiversity. Vattenfall, Sweden<br />
L<strong>in</strong>dner, J.P., 2008. Development of an <strong>in</strong>dicator for biodiversity consideration <strong>in</strong> Life Cycle Assessment. Diplomarbeit, University<br />
of Stuttgart<br />
Michelsen, O., 2008. Assessment of Land Use Impact on Biodiversity - Proposal of a new m<strong>et</strong>hodology exemplified with forestry<br />
operations <strong>in</strong> Norway. Int J <strong>LCA</strong>, pp. 22-31<br />
Milà i Canals, L.; Bauer, C.; Depestele, J.; Dubreuil, A.; Freiermuth Knuchel, R.; Gaillard, G. <strong>et</strong> al., 2007. Key Elements <strong>in</strong> a<br />
Framework for Land Use Impact Assessment With<strong>in</strong> <strong>LCA</strong>. Int J <strong>LCA</strong>, pp. 5-15<br />
Miller, G., 1956. The Magical Number Seven, plus or m<strong>in</strong>us two: Some limits on our capacity for process<strong>in</strong>g <strong>in</strong>formation; <strong>in</strong>: The<br />
Psychological Review, 63, pp. 81-97<br />
Morrison, J., Schulte, P., Schenck, R., 2010. Corporate Water Account<strong>in</strong>g. An Analysis of M<strong>et</strong>hods and Tools for Measur<strong>in</strong>g Water<br />
Use and Its Impacts. United Nations Environment Programme, United Nations Global Compact, Pacific Institute.<br />
Müller-Wenk, R., 1998. Land use — the ma<strong>in</strong> threat to species. How to Include Land Use <strong>in</strong> <strong>LCA</strong>. IWÖ Diskussionsbeitrag Nr. 64.<br />
Institut für Wirtschaft und Ökologie, Universität St.Gallen, St.Gallen, Switzerland<br />
579
PARALLEL SESSION 7A: CONSUMERS 8 th Int. Conference on <strong>LCA</strong> <strong>in</strong> the<br />
Agri-<strong>Food</strong> Sector, 1-4 Oct <strong>2012</strong><br />
Pant, R., Van Hoof, G., Schowaneck, D., Feijtel, T.C.J., de Kon<strong>in</strong>g, A., Hauschild, M., Penn<strong>in</strong>gton, D.W., Olsen, S.I., Rosenbaum,<br />
R., 2004. Comparison b<strong>et</strong>ween three different LCIA m<strong>et</strong>hods for aquatic eco-toxicity and a product environmental risk assessment.<br />
Insight from a d<strong>et</strong>ergent case study with<strong>in</strong> OMNITOX. Int J <strong>LCA</strong>, pp. 295-306<br />
P<strong>et</strong>er, J.P., Olson, J.C., Grunert, K.G., 1999. Consumer behaviour and mark<strong>et</strong><strong>in</strong>g strategy: European Edition. London: McGraw Hill.<br />
Schmidt-Bleek, F., 1997. Wieviel Umwelt braucht der Mensch?: Faktor 10 - das Maß für ökologisches Wirtschaften. dtv, Munich<br />
Sengstschmid, H., Sprong, N., Schmid, O., Stockebrand, N., Stolz, H., Spiller, A., 2011. EU Ecolabel for food and feed products –<br />
feasibility study (ENV.C.1/ETU/2010/0025)<br />
http://ec.europa.eu/environment/ecolabel/about_ecolabel/pdf/Ecolabel%20for%20food%20f<strong>in</strong>al%20report.pdf<br />
SRU (Sachverständigenrat für Umweltfragen - German Advisory Council on the Environment), 2002. Umweltgutachten 2002,<br />
M<strong>et</strong>zler-Poeschel, Stuttgart<br />
Stop Climate Change (2008): Zertifizierungsprogramm zur Reduzierung von Treibhausgas-Emissionen. Standards zur Implementierung<br />
von Stop Climate Change. 10. Dezember 2008; S. 2; http://www.stop-climate-change.de/de/Standards.htm; Status: 15.<br />
October 2011<br />
Van der Werf, H.M.G., Gaillard, G., Biard, Y., Koch, P., Bass<strong>et</strong>-Mens, C., Gac. A., Lellahi, L., Deltour, L., 2010. Creation of a<br />
public <strong>LCA</strong> database of French agricultural raw products: agriBALYSE. Proceed<strong>in</strong>gs of the VII International Conference on Life<br />
Cycle Assessment <strong>in</strong> the agri-food sector, Bari, 22-24 September 2010, pp. 239-242<br />
Verbraucherkommission Baden Württemberg (VK BaWü), 2011. Vom Labelmissbrauch zu Vertrauenslabeln (From misusage of<br />
labels to labels of confidence)<br />
Walsh, G., 2002. Konsumentenverwirrtheit als Mark<strong>et</strong><strong>in</strong>gherausforderung. DUV: Wiesbaden.<br />
WHO/FAO (eds.), 2007. Codex Alimentarius, 5 th edition, Rome<br />
580
PARALLEL SESSION 7A: CONSUMERS 8 th Int. Conference on <strong>LCA</strong> <strong>in</strong> the<br />
Agri-<strong>Food</strong> Sector, 1-4 Oct <strong>2012</strong><br />
Communicat<strong>in</strong>g <strong>LCA</strong> results to the <strong>in</strong>terested consumer -<br />
development of a criteria-based meat guide<br />
El<strong>in</strong> Röös<br />
Department of Energy and Technology, Swedish University of Agricultural Sciences (SLU), Uppsala, Sweden, E-mail:<br />
el<strong>in</strong>.roos@slu.se<br />
ABSTRACT<br />
A low carbon footpr<strong>in</strong>t of meat is generally associated with low impacts across animal species <strong>in</strong> many environmental impact categories,<br />
but there is a risk of conflicts with categories such as biodiversity loss and pesticide use. Therefore, this project sought to develop<br />
a consumer guide that could assist Swedish consumers <strong>in</strong> mak<strong>in</strong>g less environmentally harmful meat choices and that could<br />
also act as a communication tool, rais<strong>in</strong>g awareness of the different environmental aspects of meat production and potential conflicts<br />
with animal welfare. Four <strong>in</strong>dicators (carbon footpr<strong>in</strong>t, biodiversity, use of pesticides and antibiotics and animal welfare) were chosen<br />
to represent the impact on the environment and animal welfare from different choices of meat and other prote<strong>in</strong> sources. For each<br />
<strong>in</strong>dicator, criteria were developed that placed the products <strong>in</strong>cluded <strong>in</strong> the meat guide <strong>in</strong> one of three different groups, represented by<br />
the well-known traffic light system of red/yellow/green.<br />
Keywords: animal welfare, biodiversity, carbon footpr<strong>in</strong>t, consumer guide, meat<br />
1. Introduction<br />
The carbon footpr<strong>in</strong>t (CF) of meat has received <strong>in</strong>creas<strong>in</strong>g attention <strong>in</strong> the quest for more susta<strong>in</strong>able eat<strong>in</strong>g<br />
habits. While a low CF of meat is generally associated with low impacts across animal species <strong>in</strong> many<br />
environmental impact categories, such as eutrophication, acidification and land use, there is a risk of conflicts<br />
with categories such as biodiversity loss and pesticide use (Röös <strong>et</strong> al., <strong>2012</strong>). In addition, the focus on<br />
reduc<strong>in</strong>g emissions of greenhouse gases (GHG) risks decreas<strong>in</strong>g animal welfare and <strong>in</strong>creas<strong>in</strong>g the use of<br />
antibiotics. This project sought to develop a consumer guide that could assist Swedish consumers <strong>in</strong> mak<strong>in</strong>g<br />
less environmentally harmful meat choices and that could also act as a communication tool, rais<strong>in</strong>g awareness<br />
of the different environmental aspects of meat production and potential conflicts with animal welfare.<br />
The purpose of this paper was to describe how the guide was designed and discuss m<strong>et</strong>hodological difficulties<br />
and data limitations <strong>in</strong> convey<strong>in</strong>g environmental <strong>in</strong>formation on generic meat production across many<br />
different production systems. The targ<strong>et</strong> groups for the guide were ‘the <strong>in</strong>terested consumer’, i.e. those <strong>in</strong>terested<br />
<strong>in</strong> accurately compar<strong>in</strong>g the environmental impacts of different meat production systems, and employees<br />
work<strong>in</strong>g with food as their profession, e.g. buyers and personnel <strong>in</strong> the r<strong>et</strong>ail, restaurant and public procurement<br />
sectors. The products <strong>in</strong>cluded <strong>in</strong> the guide were meat products based on certification schemes or<br />
other control programs with a high level of participation, <strong>in</strong> order to ensure that the criteria could be verified.<br />
Alternative sources of prote<strong>in</strong> (game meat, eggs, cheese and veg<strong>et</strong>arian alternatives) that could replace livestock<br />
meat on the d<strong>in</strong>ner plate were also <strong>in</strong>cluded <strong>in</strong> the guide. However, fish was not <strong>in</strong>cluded s<strong>in</strong>ce its<br />
characteristics are quite different from those of arable and livestock production, and s<strong>in</strong>ce several fish guides<br />
are already <strong>in</strong> use <strong>in</strong> Sweden.<br />
2. M<strong>et</strong>hods<br />
2.1. Choice of <strong>in</strong>dicators<br />
One of the challenges was to f<strong>in</strong>d suitable <strong>in</strong>dicators that accurately communicated the environmental impacts<br />
of meat production, while still be<strong>in</strong>g easy to understand. One option would have been to use an endpo<strong>in</strong>t<br />
<strong>in</strong>dicator that aggregated the results from many impact categories. This has been done <strong>in</strong> a meat guide<br />
for Swiss consumers, which uses the ‘potential species loss per year’ <strong>in</strong>dicator from the ReCiPe-m<strong>et</strong>hod<br />
(Blonk <strong>et</strong> al., 2010). However, such aggregation did not satisfy our requirements for a guide that also acted<br />
as a communication tool, rais<strong>in</strong>g awareness of the orig<strong>in</strong>s and causes of environmental impacts of meat production,<br />
the potential conflicts b<strong>et</strong>ween different environmental goals and the implications for animal welfare.<br />
Therefore, CF was chosen as the first <strong>in</strong>dicator, due to its familiarity and its ability to act as a proxy for<br />
eutrophication, acidification and land and energy use <strong>in</strong> most cases of meat production relevant for the guide,<br />
which was concluded <strong>in</strong> a study by Röös <strong>et</strong> al., (<strong>2012</strong>). The same study identified toxicity impacts (through<br />
the use of pesticides) and biodiversity as areas that risked com<strong>in</strong>g <strong>in</strong>to conflict with CF. In a previous study<br />
the possible conflict b<strong>et</strong>ween CF and animal welfare had been highlighted (Röös, 2011). Thus, use of pesticides,<br />
biodiversity and animal welfare were chosen as the other <strong>in</strong>dicators. In the review process, <strong>in</strong> which<br />
the guide was distributed to a large number of companies, NGOs and researchers, there was a general accep-<br />
581
PARALLEL SESSION 7A: CONSUMERS 8 th Int. Conference on <strong>LCA</strong> <strong>in</strong> the<br />
Agri-<strong>Food</strong> Sector, 1-4 Oct <strong>2012</strong><br />
tance of the categories, but with the addition of the need to add <strong>in</strong>formation on the use of antibiotics, due to<br />
the concern about antibiotic resistance. Thus use of antibiotics was added to the same category as use of<br />
pesticides, as is further discussed <strong>in</strong> section 4.<br />
2.2. Development of the criteria<br />
For each <strong>in</strong>dicator, criteria for three levels of environmental or animal welfare ‘harm’ were developed,<br />
judged as the level of complexity for the targ<strong>et</strong> group and correspond<strong>in</strong>g to the well-known traffic light symbols<br />
used to communicate the levels. The criteria were developed on a relative scale, hence describ<strong>in</strong>g best<br />
and worst <strong>in</strong> class, rather than us<strong>in</strong>g absolute susta<strong>in</strong>ability thresholds, which are very difficult to def<strong>in</strong>e on<br />
this d<strong>et</strong>ailed level. Data on CF, biodiversity impacts, use of antibiotics and pesticides and animal welfare (the<br />
chosen <strong>in</strong>dicators, see section 2.1) for the products <strong>in</strong>cluded <strong>in</strong> the guide were collected from the literature,<br />
trade associations and experts. From this <strong>in</strong>formation criteria were developed with the aim of differentiat<strong>in</strong>g<br />
b<strong>et</strong>ween different types of production systems. The ambition <strong>in</strong> the meat guide was to develop the criteria for<br />
all <strong>in</strong>dicators us<strong>in</strong>g a life cycle perspective related to the functional unit of 1 kg of product (bone-free meat <strong>in</strong><br />
the case of meat). This proved to be difficult for some <strong>in</strong>dicators due to m<strong>et</strong>hodological problems and lack of<br />
essential data. Therefore, <strong>in</strong> this first version of the meat guide it was necessary to take a pragmatic approach<br />
and develop the criteria consider<strong>in</strong>g current data availability and calculation m<strong>et</strong>hods, as well as certification<br />
schemes for verification (see sections 2.3-2.6).<br />
2.3. Carbon footpr<strong>in</strong>t<br />
The CF criteria were chosen to reflect the <strong>in</strong>herent variation <strong>in</strong> GHG emissions from the production of<br />
different types of prote<strong>in</strong> sources based on biophysical differences <strong>in</strong> either 1) Directly consum<strong>in</strong>g the veg<strong>et</strong>al<br />
prote<strong>in</strong>, 2) feed<strong>in</strong>g it to monogastric animals and los<strong>in</strong>g a large part of the energy; or 3) produc<strong>in</strong>g meat<br />
from ma<strong>in</strong>ly cellulose us<strong>in</strong>g rum<strong>in</strong>ants, which cause large m<strong>et</strong>hane emissions. Numerical results from numerous<br />
life cycle assessment (<strong>LCA</strong>) studies were used to s<strong>et</strong> the boundaries (Röös, <strong>2012</strong>; Röös <strong>et</strong> al., <strong>2012</strong>).<br />
A green light was given to foods with CF less than 1.5 kg CO2e/kg product, which <strong>in</strong>cludes most plantbased,<br />
prote<strong>in</strong>-rich foods such as legumes. Game animals not given extra feed were also given a green light,<br />
based on the reason<strong>in</strong>g that wildlife m<strong>et</strong>hane emissions belong to the natural ecosystem and are not anthropogenic.<br />
This reason<strong>in</strong>g holds only as long as the amount of wild game is kept at natural levels. A yellow<br />
light was given to products that cause emissions of 1.5-12 kg CO2e /kg product. These <strong>in</strong>clude eggs, chicken,<br />
pork and cheese. Products with CF greater than 12 kg CO2e /kg product, i.e. meat such as beef and lamb<br />
from rum<strong>in</strong>ant livestock, were given a red light. The variation <strong>in</strong> CF b<strong>et</strong>ween studies can be large for the<br />
same product (± 50%) depend<strong>in</strong>g on differences <strong>in</strong> production systems, system boundaries and calculation<br />
m<strong>et</strong>hods. However, the CF for the products with<strong>in</strong> the three levels still stayed with<strong>in</strong> the wide boundaries of<br />
green, yellow and red light, mak<strong>in</strong>g the need for more d<strong>et</strong>ailed data collection redundant for this <strong>in</strong>dicator.<br />
2.4. Biodiversity<br />
Includ<strong>in</strong>g impacts on biodiversity <strong>in</strong> <strong>LCA</strong> is challeng<strong>in</strong>g for many reasons. Biodiversity is a broad concept<br />
and <strong>in</strong>cludes diversity at gene, species and ecosystem level, so measur<strong>in</strong>g this complexity for use <strong>in</strong><br />
<strong>LCA</strong> is difficult. In addition, the impact on biodiversity from different types of land use varies considerably<br />
depend<strong>in</strong>g on the orig<strong>in</strong>al habitat type, production <strong>in</strong>tensity and surround<strong>in</strong>g landscape (Henle <strong>et</strong> al., 2008).<br />
Recent work based on the UNEP/SETAC life cycle <strong>in</strong>itiative proposed a conceptual framework for land use<br />
<strong>in</strong> <strong>LCA</strong> (Milà i Canals <strong>et</strong> al., 2007). Build<strong>in</strong>g on this framework, others have proposed m<strong>et</strong>hodology for develop<strong>in</strong>g<br />
characterisation factors for biodiversity, as well as actual factors (Schmidt, 2008; de Baan <strong>et</strong> al.,<br />
<strong>2012</strong>). The characterisation factors describe the impact on biodiversity as a change <strong>in</strong> species richness when<br />
transform<strong>in</strong>g a reference land use to different types of land use practices such as pasture, annual crops, agroforestry,<br />
<strong>et</strong>c.<br />
S<strong>in</strong>ce the meat guide <strong>in</strong>cludes products from different countries, the impacts on biodiversity needed to be<br />
assessed on a scale that encompassed global effects, but was still d<strong>et</strong>ailed enough to enable differentiation<br />
b<strong>et</strong>ween production systems. The ambition <strong>in</strong> the meat guide was to use global characterisation factors for<br />
biodiversity <strong>in</strong> order to assess the product’s biodiversity impact per kg of product. Ow<strong>in</strong>g to time limitations,<br />
it was not possible <strong>in</strong> this first version of the meat guide to develop specific characterisation factors for Sweden<br />
and the factors found <strong>in</strong> the literature were either too blunt to be used <strong>in</strong> the meat guide (no differentiation<br />
b<strong>et</strong>ween production systems, e.g. organic versus conventional production) or referred to basel<strong>in</strong>e scenar-<br />
582
PARALLEL SESSION 7A: CONSUMERS 8 th Int. Conference on <strong>LCA</strong> <strong>in</strong> the<br />
Agri-<strong>Food</strong> Sector, 1-4 Oct <strong>2012</strong><br />
ios for land use that did not match the desired land use <strong>in</strong> Sweden from a biodiversity perspective. Us<strong>in</strong>g<br />
species richness as a proxy for land use also has several limitations, e.g. it does not consider red-listed or<br />
desirable species. Many of the endangered and red-listed species <strong>in</strong> Sweden are found <strong>in</strong> the traditional mosaic<br />
agricultural landscape that is disappear<strong>in</strong>g due to agricultural <strong>in</strong>tensification. Agriculture only represents<br />
8% of the area <strong>in</strong> Sweden, planted forest be<strong>in</strong>g the dom<strong>in</strong>ant land use cover<strong>in</strong>g 53% of the area (SS, 2008).<br />
Hence, keep<strong>in</strong>g traditional semi-natural pastures grazed and conserv<strong>in</strong>g the traditional mosaic landscape has<br />
been identified as one of the most important measures for preserv<strong>in</strong>g biodiversity <strong>in</strong> Sweden and <strong>in</strong> many<br />
other parts of Europe (Henle <strong>et</strong> al., 2008).<br />
Therefore, the criteria for biodiversity <strong>in</strong> the meat guide were developed based on a qualitative assessment<br />
of the impact of different production systems on biodiversity. This assessment employed a comb<strong>in</strong>ation<br />
of the concept developed by Geyer <strong>et</strong> al., (2010), which coupled species to habitat preferences, and the notion<br />
that the most important driver of biodiversity loss is land conversion from a natural state to human use<br />
(MEA, 2005). A green light was thus given to meat from production systems that help to conserve sem<strong>in</strong>atural<br />
pastures through graz<strong>in</strong>g, thereby help<strong>in</strong>g to preserve many red-listed species. Products requir<strong>in</strong>g less<br />
than 5 m 2 of land use per kg (veg<strong>et</strong>al prote<strong>in</strong> sources), were also given a green light, based on the concept of<br />
‘land sav<strong>in</strong>g’ (avoid<strong>in</strong>g the need for new agricultural land) (Green <strong>et</strong> al., 2005). A yellow light was given to<br />
organic production systems, based on literature show<strong>in</strong>g higher biodiversity on organic farms (Bengtsson <strong>et</strong><br />
al., 2005; Rahmann, 2011). A yellow light was also given to production systems that do not use imported soy<br />
as prote<strong>in</strong> feed, ow<strong>in</strong>g to the risk of land use change <strong>in</strong> areas very rich <strong>in</strong> biodiversity due to expansion of<br />
soy cultivation. All other production systems were given a red light, s<strong>in</strong>ce <strong>in</strong>tensive agricultural production<br />
generally affects biodiversity negatively (Henle <strong>et</strong> al., 2008).<br />
In future versions of the meat guide, the criteria for biodiversity impacts can be improved by develop<strong>in</strong>g<br />
characterisation factors for Sweden us<strong>in</strong>g the national biodiversity monitor<strong>in</strong>g data. Tak<strong>in</strong>g <strong>in</strong>to account redlisted<br />
species would be necessary <strong>in</strong> such an <strong>in</strong>itiative to accurately reflect the value of graz<strong>in</strong>g semi-natural<br />
pastures <strong>in</strong> comparison with graz<strong>in</strong>g temporary leys. The development of such characterisation factors would<br />
enable biodiversity assessment on a per kg of product basis, hence <strong>in</strong>clud<strong>in</strong>g the aspect that different products<br />
require very different amounts of land (5-9 m 2 for chicken, 11-37 m 2 for pork and 24-244 m 2 for beef;<br />
Röös <strong>et</strong> al., <strong>2012</strong>), which is omitted <strong>in</strong> this version of the meat guide.<br />
2.5. Use of pesticides and antibiotics<br />
Use of pesticides and antibiotics varies greatly b<strong>et</strong>ween production systems, and <strong>in</strong> comparison with CF is<br />
not governed by <strong>in</strong>herent geophysical differences b<strong>et</strong>ween animal species. Rum<strong>in</strong>ants require more feed than<br />
monogastric animals per kg of meat produced, which could require more pesticides dur<strong>in</strong>g feed production.<br />
However, the majority of the feed for rum<strong>in</strong>ants is roughage, production of which usually uses very low<br />
amounts of pesticides. Hence, for this <strong>in</strong>dicator it was not possible to base the criteria on general literature<br />
data from <strong>LCA</strong> studies on pesticide use <strong>in</strong> livestock production. Thus, the use of pesticides and antibiotics<br />
needed to be <strong>in</strong>vestigated <strong>in</strong> greater d<strong>et</strong>ail for the different production systems <strong>in</strong> order to f<strong>in</strong>d relevant<br />
boundaries. Pesticide use at farm level must be recorded by law <strong>in</strong> Sweden, as must the use of antibiotics <strong>in</strong><br />
many certification schemes or control programs. However, such data are not related to the functional unit of<br />
1 kg of meat, are located on <strong>in</strong>dividual farms and are not collected <strong>in</strong> a manner prov<strong>in</strong>g that 1 kg of product<br />
from a specific certification program <strong>in</strong>cluded <strong>in</strong> the guide has given rise to a specific amount of pesticide or<br />
antibiotic use. In addition, for imported feed, meat and other food products <strong>in</strong> the guide this <strong>in</strong>formation is<br />
lack<strong>in</strong>g. Hence, the criteria for this <strong>in</strong>dicator needed to be based on national statistics on pesticide use (Eurostat,<br />
2007) and use of antibiotics (EMA, 2011), and a rough approximation of typical feed<strong>in</strong>g strategies for<br />
different production systems. As a start<strong>in</strong>g po<strong>in</strong>t, a green light regard<strong>in</strong>g use of pesticides was given to products<br />
orig<strong>in</strong>at<strong>in</strong>g from production systems that did not use pesticides at all, with organic farm<strong>in</strong>g represent<strong>in</strong>g<br />
the best <strong>in</strong> class. A red light was given to those us<strong>in</strong>g more than twice the amount of pesticides compared<br />
with the country with the lowest level (2 g active substance per kg of bone-free meat). The best <strong>in</strong> class level<br />
for use of antibiotics was s<strong>et</strong> at a maximum of twice the lowest use found <strong>in</strong> the literature (2x14 mg/kg live<br />
weight), s<strong>in</strong>ce was judged to be impossible and undesirable to have a zero level (sick animals need to be<br />
treated for animal welfare reasons). The worst <strong>in</strong> class level for the use of antibiotics was s<strong>et</strong> to more than 10<br />
times the lowest reported level (10x14 mg/kg live weight). To obta<strong>in</strong> a green light for this <strong>in</strong>dicator as a<br />
whole, a green light was required for the use of both antibiotics and pesticides, while to obta<strong>in</strong> a yellow light<br />
one green and one yellow light <strong>in</strong> either the use of antibiotics and pesticides was required. All other comb<strong>in</strong>ations<br />
gave a red light.<br />
583
PARALLEL SESSION 7A: CONSUMERS 8 th Int. Conference on <strong>LCA</strong> <strong>in</strong> the<br />
Agri-<strong>Food</strong> Sector, 1-4 Oct <strong>2012</strong><br />
2.6. Animal welfare<br />
Design<strong>in</strong>g animal welfare criteria is difficult s<strong>in</strong>ce the subjective experience of the animal is difficult to<br />
quantify. The start<strong>in</strong>g po<strong>in</strong>t for this <strong>in</strong>dicator was the five freedoms for animal welfare orig<strong>in</strong>ally developed<br />
<strong>in</strong> a UK report on livestock husbandry <strong>in</strong> 1965 (FAWC, <strong>2012</strong>) and now widely used as a basis for animal<br />
welfare regulations by a number of organisations. These are: 1) Freedom from hunger and thirst, 2) freedom<br />
from discomfort, 3) freedom from pa<strong>in</strong>, <strong>in</strong>jury or disease, 4) freedom to express normal behaviour and 5)<br />
freedom from fear and distress. The judgement as to how these freedoms were m<strong>et</strong> by different production<br />
systems was made <strong>in</strong> collaboration with animal welfare experts. To be awarded a green light, the livestock<br />
had to be kept accord<strong>in</strong>g to Swedish animal welfare legislation (or similar legislation), which explicitly requires<br />
the first four freedoms. In addition, to receive a green light there was a requirement on outdoor pasture,<br />
which gives extra weight to freedom (4) and hopefully also freedom (5), which is impossible to measure.<br />
This judgment is based on the assumption that animals can b<strong>et</strong>ter express their natural behaviour <strong>in</strong> outdoor<br />
environments with access to pasture, where their strong urge for food search<strong>in</strong>g can be satisfied. Enriched<br />
<strong>in</strong>door environments can fulfil the same function, but today there are few such systems, and no verification<br />
or certification that ensures that systems provide a certa<strong>in</strong> level of opportunities for natural behaviour<br />
and stimuli. To be given a yellow light the product had to come from systems that are either covered by<br />
Swedish legislation on animal welfare or the like or from animals out graz<strong>in</strong>g at least half the year. All other<br />
systems were given a red light. The criteria for this <strong>in</strong>dicator were not related to the functional unit of 1 kg of<br />
product, but were based on production system level, and did not take <strong>in</strong>to account the number of <strong>in</strong>dividual<br />
animals affected by the production of 1 kg of meat.<br />
3. Results<br />
The beef part of the current guide is shown <strong>in</strong> Figure 1. Although the guide conta<strong>in</strong>s many simplifications<br />
it still provides considerable amounts of <strong>in</strong>formation that allow a deeper understand<strong>in</strong>g of the underly<strong>in</strong>g<br />
orig<strong>in</strong>s and causes of environmental impacts from livestock production, to which the targ<strong>et</strong> audience, food<br />
professionals and <strong>in</strong>terested consumers, are presumably receptive. For example, it can be seen that animal<br />
welfare-friendly, pasture-based beef production, which keeps pastures open and helps conserve their rich<br />
biodiversity and m<strong>in</strong>imises the use of pesticides and antibiotics, is also associated with high emissions of<br />
greenhouse gases.<br />
4. Discussion<br />
All simplifications <strong>in</strong>volve difficulties <strong>in</strong> convey<strong>in</strong>g a compl<strong>et</strong>e and fair picture. The meat guide presented<br />
here has several limitations. All <strong>in</strong>dicators are given equal weight, although the CF <strong>in</strong>dicator acts as a proxy<br />
for several other impact categories. For the biodiversity and animal welfare <strong>in</strong>dicators, the criteria are not<br />
developed from a life cycle perspective and do not relate to the functional unit of 1 kg of product. The animal<br />
welfare criteria are s<strong>et</strong> on production system level and do not consider the number of <strong>in</strong>dividual animals affected<br />
<strong>in</strong> order to supply a certa<strong>in</strong> amount of meat. Systems which account for this could be designed by e.g.<br />
develop<strong>in</strong>g an equivalent to DALY (disability adjusted life years) for animals, as discussed by Blonk <strong>et</strong> al.,<br />
(2010). Assess<strong>in</strong>g biodiversity per kg of product could be made feasible through the development of characterisation<br />
factors applicable for Swedish conditions.<br />
584
PARALLEL SESSION 7A: CONSUMERS 8 th Int. Conference on <strong>LCA</strong> <strong>in</strong> the<br />
Agri-<strong>Food</strong> Sector, 1-4 Oct <strong>2012</strong><br />
Beef from semi-natural pastures, organic<br />
Beef from semi-natural pastures<br />
Organic beef, KRAV label<br />
Organic beef, EU label<br />
Swedish beef, Svensk Sigill label<br />
Swedish generic beef<br />
Irish generic beef<br />
Polish and German generic beef<br />
South-American generic beef<br />
Figure 1. The beef section of the Swedish meat guide<br />
Carbon footpr<strong>in</strong>t<br />
Biodiversity Pesticides<br />
and antibiotics<br />
Animal<br />
welfare<br />
It might seem strange to <strong>in</strong>clude legumes, as well as eggs and cheese, <strong>in</strong> what is called a meat guide. The<br />
reason for <strong>in</strong>clud<strong>in</strong>g these alternatives was partly to avoid sub-optimisations from exchang<strong>in</strong>g meat for<br />
cheese, a product with considerable environmental impact. Another reason was to show and discuss the possibility<br />
of exchang<strong>in</strong>g some meat consumption for plant-based prote<strong>in</strong> sources, which <strong>in</strong>herently has considerably<br />
lower impacts and no associated animal welfare issues. Many studies show that <strong>in</strong> future susta<strong>in</strong>able<br />
food supply systems, meat consumption <strong>in</strong> the developed world needs to decrease considerably (see e.g.<br />
Foley <strong>et</strong> al., 2011), which is why we believed it to be important to also show the environmental impacts of<br />
other prote<strong>in</strong> sources.<br />
Another area of possible criticism concern<strong>in</strong>g the design of the meat guide is the <strong>in</strong>clusion of pesticide<br />
use and use of antibiotics <strong>in</strong> the same category. This was done due to the strong desire to keep the number of<br />
<strong>in</strong>dicators to a maximum of four <strong>in</strong> order to limit the complexity of the guide. Although the use of pesticides<br />
and antibiotics is unrelated, they do have some common features. They are both chemical <strong>in</strong>puts to production<br />
systems that might leak <strong>in</strong>to the environment and affect ecosystems and species, and the use of both can<br />
be limited by tak<strong>in</strong>g precautionary measures (well-designed crop rotations <strong>in</strong> the case of pesticides and preventive<br />
health programs <strong>in</strong> the case of antibiotics). In this first version of the guide, use of pesticides and<br />
antibiotics are presented as LCI results rather than LCIA results. In later versions this could be improved by<br />
us<strong>in</strong>g LCIA models to capture e.g. variations <strong>in</strong> toxicity effects b<strong>et</strong>ween different pesticides.<br />
The design of the criteria for the different <strong>in</strong>dicators and the choice of the <strong>in</strong>dicators <strong>in</strong>volved subjective<br />
judgements. This is unavoidable when condens<strong>in</strong>g a large amount of scientific literature down to consumer<br />
communications. However, many experts and representatives from trade organisations, authorities and<br />
NGOs were <strong>in</strong>volved <strong>in</strong> development of the criteria and the <strong>in</strong>dicators chosen were as robust and wellconceived<br />
as possible. All underly<strong>in</strong>g assumptions are openly presented <strong>in</strong> the meat guide, so although there<br />
might be different op<strong>in</strong>ions as to how the criteria should be developed and how different production systems<br />
should be valued, the guide could function as a basis for discussion and raise awareness of the issues related<br />
to livestock production. This was the primary objective with the meat guide as well as mak<strong>in</strong>g an attempt to<br />
make <strong>LCA</strong> results on the food product category with the greatest environmental impact (meat) accessible to<br />
the wider public.<br />
5. Conclusions<br />
Bas<strong>in</strong>g choice of meat on an environmental impact and animal welfare perspective is complex and cannot be<br />
rely solely on the carbon footpr<strong>in</strong>t, as this can lead to goal conflicts. The meat guide described here attempts<br />
to condense and simplify the scientific literature <strong>in</strong> order to facilitate active choices by the ‘<strong>in</strong>terested consumer’<br />
and food professionals, while still captur<strong>in</strong>g and expla<strong>in</strong><strong>in</strong>g the complexity <strong>in</strong> compar<strong>in</strong>g different<br />
production systems. This first attempt to develop a meat guide for the Swedish mark<strong>et</strong> has several limitations,<br />
but should provide guidance and can act as a basis for discussion <strong>in</strong> the important task of decreas<strong>in</strong>g<br />
meat consumption and choos<strong>in</strong>g b<strong>et</strong>ter meat alternatives.<br />
585
PARALLEL SESSION 7A: CONSUMERS 8 th Int. Conference on <strong>LCA</strong> <strong>in</strong> the<br />
Agri-<strong>Food</strong> Sector, 1-4 Oct <strong>2012</strong><br />
6. References<br />
Bengtsson, J., Ahnström, J. and Weibull, A-C. 2005. The effects of organic agriculture on biodiversity and abundance: a m<strong>et</strong>aanalysis.<br />
Ecology 42, 261-269.<br />
Blonk, H., Mar<strong>in</strong>ussen, M., Goedkoop, M. 2010. Develop<strong>in</strong>g an <strong>LCA</strong> based consumer guide for environmental and animal welfare<br />
performance of meat/animal products. Proceed<strong>in</strong>gs of <strong>LCA</strong> <strong>Food</strong> 1, 381-386.<br />
de Baan, L., Alkemade, R., Koeller, T. <strong>2012</strong>. Land use impacts on biodiversity <strong>in</strong> <strong>LCA</strong>: a global approach. Int J of Life Cycle Assess.<br />
Published onl<strong>in</strong>e: 24 April <strong>2012</strong>.<br />
EMA (European Medic<strong>in</strong>e Agency). 2011. Trends <strong>in</strong> the sales of v<strong>et</strong>er<strong>in</strong>ary antimicrobial agents <strong>in</strong> n<strong>in</strong>e European countries. Report<strong>in</strong>g<br />
period: 2005-2009.<br />
Eurostat. 2007. The use of plant protection products <strong>in</strong> the European production. Eurostat Statistical Books. 2007 edition.<br />
FAWC. <strong>2012</strong>. Five freedoms. Farm Animal Welfare Council. London, UK. http://www.fawc.org.uk/freedoms.htm<br />
Foley, J., Ramankutty, N., Brauman, K., Cassidy, E., Gerber, J., Johnston, M., Mueller, N., O’Connell, C., Ray, D., West, P., Balzer,<br />
C., Benn<strong>et</strong>t, E., Carpenter, S., Hill, J., Monfreda, C., Polasky, S., Rockström, J., Sheehan, J., Siebert, S., Tilman, D., Zaks, D.<br />
2011. Solutions for a cultivated plan<strong>et</strong>. Nature 478, 337-342.<br />
Geyer, R., Stoms, D., L<strong>in</strong>dner, J., Davis, F, Wittstock, B. 2010. Coupl<strong>in</strong>g GIS and <strong>LCA</strong> for biodiversity assessments of land use. Int J<br />
Life Cycle Assess 15, 692-703.<br />
Green, R., Cornell, S., Scharlemann, J., Balmford, A. 2005. Farm<strong>in</strong>g and the fate of wild nature. Science 307, 550-555.<br />
Henle, K., Alard, D., Clitherow, J., Cobb, P., Firbank, L., Kull, T., McCracken, D., Moritz, R., Niemelä, J., Rebane, M., Wascher, D.,<br />
Watt, A., Young, J. 2008. Identify<strong>in</strong>g and manag<strong>in</strong>g the conflicts b<strong>et</strong>ween agriculture and biodiversity conservation <strong>in</strong> Europe –<br />
A review. Agriculture, Ecosystems and Environment 124, 60-71.<br />
MEA (Millennium Ecosystem Assessment). 2005. Ecosystems and Human Well-be<strong>in</strong>g: Biodiversity Synthesis. World Resources<br />
Institute, Wash<strong>in</strong>gton, DC.<br />
Milá i Canals, L., Bauerm C., Depestele, J., Dubeuil, A., Knuchel, R.F., Gaillard, G, <strong>et</strong> al., 2007. Key elements <strong>in</strong> a framework for<br />
land use impact assessment with<strong>in</strong> <strong>LCA</strong>. International Journal of Life Cycle Assessment 12(1), 5-15.<br />
Rahmann, G. 2011. Biodiversity and organic farm<strong>in</strong>g: What do we know? Landbauforschung Volkenrode<br />
61 (3), 189-208.<br />
Röös, E. 2011. The trade-off b<strong>et</strong>ween animal welfare and lowered emissions of greenhouse gases from pork production. Conference<br />
paper, 24 th Nordic Association of Agricultural Scientists (NJF) Conference, Uppsala, Sweden. Juni 14-16, 2011.<br />
Röös, E. <strong>2012</strong>. Mat-klimat-listan. Report 040. Department of Energy and Technology, Swedish University of Agricultural Sciences.<br />
Röös, E., Sundberg, C., Tidåker, P., Strid, I., Hansson, P-A. <strong>2012</strong>. Can carbon footpr<strong>in</strong>t serve as an <strong>in</strong>dicator of the environmental<br />
impact of meat production? Ecological Indicators, accepted for publication 120807.<br />
Schmidt, J. 2008. Development of LCIA characterisation factors for land use impacts on biodiversity. Journal of Cleaner Production<br />
16, 1929-1942.<br />
SS (Statistics Sweden). 2008. Land use <strong>in</strong> Sweden. Fifth edition.<br />
586
PARALLEL SESSION 7A: CONSUMERS 8 th Int. Conference on <strong>LCA</strong> <strong>in</strong> the<br />
Agri-<strong>Food</strong> Sector, 1-4 Oct <strong>2012</strong><br />
Life cycle impacts of prote<strong>in</strong>-rich foods for consumer <strong>in</strong>formation.<br />
How <strong>LCA</strong> results can be presented to consumers to make<br />
environmentally susta<strong>in</strong>able supermark<strong>et</strong> choices<br />
CE Delft, Delft, The N<strong>et</strong>herlands<br />
Correspond<strong>in</strong>g author. E-mail: krutwagen@ce.nl<br />
Marieke Head, Maartje Sevenster, Bart Krutwagen*, Harry Croezen<br />
ABSTRACT<br />
CE Delft has calculated the life cycle environmental impacts of 98 different animal products and animal product alternatives from the<br />
farm to the supermark<strong>et</strong>. The goal of this study was to provide the consumer with scientifically sound environmental data for several<br />
prote<strong>in</strong>-rich products. The results of this expansive life cycle assessment have been used <strong>in</strong> a mobile application. This consumer<br />
support tool will allow Dutch consumers to scan product barcodes and obta<strong>in</strong> relevant environmental impact <strong>in</strong>formation on their<br />
mobile phones. The impact assessment for the products was carried out us<strong>in</strong>g a customised version of the ReCiPe (hierarchic)<br />
m<strong>et</strong>hod on both midpo<strong>in</strong>t and endpo<strong>in</strong>t levels. The results from the analysis show substantial differences b<strong>et</strong>ween the lowest and the<br />
highest scor<strong>in</strong>g products, particularly <strong>in</strong> terms of the effects on nature & environment. However, the most pronounced trend is that<br />
the difference <strong>in</strong> environmental impact with<strong>in</strong> product groups can be just as great as the environmental impacts b<strong>et</strong>ween product<br />
groups.<br />
Keywords: <strong>LCA</strong>, agriculture, animal products, app, consumer, variation <strong>in</strong> impact<br />
1. Introduction<br />
Developed by the Varkens <strong>in</strong> Nood foundation (Pigs <strong>in</strong> Need), the Vleeswijzer (Meat Index) was launched<br />
at the end of 2009 and offers consumers <strong>in</strong>formation about the environmental and animal welfare impacts of<br />
the most common meat and meat alternative products. The Vleeswijzer was giv<strong>in</strong>g however only general<br />
impact data that did not dist<strong>in</strong>guish b<strong>et</strong>ween products with<strong>in</strong> a product group. With the large vari<strong>et</strong>y of prote<strong>in</strong><br />
products with<strong>in</strong> one productgroup available <strong>in</strong> the supermark<strong>et</strong>s, such as conventional, organic, freerange<br />
options, it is often difficult for the consumer to assess which products are the more susta<strong>in</strong>able ones.<br />
To overcome this problem CE Delft was asked to make a follow up, the Superwijzer; the end goal of this<br />
study was to update and expand the Vleeswijzer such that the consumer is able to make <strong>in</strong>formed purchas<strong>in</strong>g<br />
decisions amongst various meat, dairy, eggs, and alternative products, <strong>in</strong> terms of the environmental and<br />
animal welfare performance of those products.<br />
CE Delft’s contribution (Head <strong>et</strong> al., 2011) was d<strong>et</strong>erm<strong>in</strong><strong>in</strong>g the climate change, biodiversity and human<br />
health impact of meat, meat alternatives, dairy and additional product types. In comparison to the assessment<br />
done for the Vleeswijzer, the list of product types was expanded and the most recent scientific developments<br />
were <strong>in</strong>cluded <strong>in</strong> the product assessments. The environmental data for this app are derived from the thorough<br />
study of 98 prote<strong>in</strong>-rich product types available <strong>in</strong> the Dutch supermark<strong>et</strong>s, with<strong>in</strong> 10 different product categories.<br />
Such a wide vari<strong>et</strong>y of products were exam<strong>in</strong>ed <strong>in</strong> order to not only compare b<strong>et</strong>ween product groups<br />
but also with<strong>in</strong> product groups. It also made assessment of less obvious products like coffee creamer and<br />
whipped cream possible.<br />
For this <strong>in</strong>formation to be accessible and convenient for the consumer, Varkens <strong>in</strong> Nood created a smartphone<br />
App. This App allows the consumer to have an <strong>in</strong>teractive version of the Superwijzer, allow<strong>in</strong>g them<br />
to have product <strong>in</strong>formation available while shopp<strong>in</strong>g. Simply by scann<strong>in</strong>g the barcode of the products.<br />
2. M<strong>et</strong>hods<br />
As stated above, 98 prote<strong>in</strong>-rich product types with<strong>in</strong> 10 categories were assessed (Head <strong>et</strong> al., 2011). The<br />
results of this assessment were used to score over 15,000 products available <strong>in</strong> Dutch supermark<strong>et</strong>s. Relevant<br />
issues concern<strong>in</strong>g the extend of the life cycle, allocation and cut-off and <strong>in</strong>cluded impact categories are discussed<br />
<strong>in</strong> the follow<strong>in</strong>g sections.<br />
2.1 Extent of the life cycle<br />
The life cycles of all the products are modelled up to the po<strong>in</strong>t of r<strong>et</strong>ail (<strong>in</strong>clud<strong>in</strong>g cool<strong>in</strong>g). Although the<br />
products are diverse, there is much overlap b<strong>et</strong>ween the life cycles and therefore the system boundaries of<br />
each life cycle can be summarised by a simplified diagram (see Figure 10).<br />
587
PARALLEL SESSION 7A: CONSUMERS 8 th Int. Conference on <strong>LCA</strong> <strong>in</strong> the<br />
Agri-<strong>Food</strong> Sector, 1-4 Oct <strong>2012</strong><br />
Figure 10. General overview of processes that are <strong>in</strong>cluded <strong>in</strong> the product life cycles<br />
2.2. Allocation and cut-off<br />
Agriculture, particularly animal agriculture, can become rather complex to model accurately. There are<br />
many reasons for this complexity, much hav<strong>in</strong>g to do with the fact that farms can be very different and one<br />
often has to rely on average systems. However, some of the complexity is derived from the multiple outputs<br />
from processes and the multiple usages of these outputs, which can make the product focused goals of a life<br />
cycle assessment a daunt<strong>in</strong>g task. In order to solve this problem, various m<strong>et</strong>hods were employed:<br />
Apply<strong>in</strong>g a cut-off for manure: Emissions from management, as well as paddock manure, are <strong>in</strong>cluded to the<br />
animal system, but emissions from later applications are allocated to the crop system or energy system <strong>in</strong>volved.<br />
The allocation of crop products: Crop types can often be processed from their constituent parts (prote<strong>in</strong>s,<br />
oils, fibres, <strong>et</strong>c.) <strong>in</strong>to multiple products, thus an allocation approach based on economic value was applied.<br />
The allocation of animal products: Economic allocation was used to d<strong>et</strong>erm<strong>in</strong>e the relative share of the burden<br />
that such co-products have at the farm stage and at the slaughter stage.<br />
The allocation of raw milk to dairy products: Accord<strong>in</strong>g to the foot pr<strong>in</strong>t<strong>in</strong>g m<strong>et</strong>hodology of the International<br />
Dairy Federation (IDF, 2010), raw milk is allocated to products of dairy process<strong>in</strong>g via milk solids content.<br />
2.3. Data and model<br />
The basis for the Superwijzer is the study published by Blonk <strong>et</strong> al., (2008), the ma<strong>in</strong> basis of the<br />
Vleeswijzer. Given the complexity of the product life cycles and the large range <strong>in</strong> geographic coverage<br />
needed, a multitude of sources were used <strong>in</strong> the models to supply data concern<strong>in</strong>g animal feed, veg<strong>et</strong>arian<br />
products, land use and land transformation emissions, animal emissions, farm<strong>in</strong>g systems, slaughter, process<strong>in</strong>g,<br />
transport, distribution, storage and r<strong>et</strong>ail. While efforts were made to <strong>in</strong>clude all relevant aspects of the<br />
life cycles of the various products, not everyth<strong>in</strong>g could be <strong>in</strong>cluded. The effects of these exclusions on the<br />
results are most likely not significant; results were compared with exist<strong>in</strong>g results <strong>in</strong> literature, and the differences<br />
can be expla<strong>in</strong>ed by assumptions and m<strong>et</strong>hodological choices. A full description on <strong>in</strong>cluded and<br />
excluded processes can be found <strong>in</strong> (Head <strong>et</strong> al., 2011).<br />
588<br />
Crops<br />
Production<br />
veg<strong>et</strong>arian<br />
products<br />
Production<br />
feed<br />
Animal<br />
breed<strong>in</strong>g<br />
Animal<br />
husbandry<br />
Products<br />
process<strong>in</strong>g<br />
(eggs, milk)<br />
Warehouse<br />
R<strong>et</strong>ailer<br />
Slaughterhouse
PARALLEL SESSION 7A: CONSUMERS 8 th Int. Conference on <strong>LCA</strong> <strong>in</strong> the<br />
Agri-<strong>Food</strong> Sector, 1-4 Oct <strong>2012</strong><br />
2.4. Impact categories<br />
A customised version of ReCiPe (hierarchic endpo<strong>in</strong>t) m<strong>et</strong>hod is used <strong>in</strong> the assessment of the environmental<br />
impact of the various product types. The impact categories of the ReCiPe m<strong>et</strong>hod have been clustered<br />
<strong>in</strong>to four ma<strong>in</strong> categories, <strong>in</strong> order to make them more understandable for consumers:<br />
Biodiversity: The effects of environmental damage on biodiversity and ecosystems, measured <strong>in</strong><br />
species.yr or PDF (potentially disappear<strong>in</strong>g fraction). These <strong>in</strong>clude the impact on the biodiversity <strong>in</strong><br />
ecosystems due to: terrestrial acidification, freshwater eutrophication, terrestrial ecotoxicity, freshwater<br />
ecotoxicity, mar<strong>in</strong>e ecotoxicity, effects of climate change on ecosystems, agricultural land occupation,<br />
urban land occupation, natural land transformation.<br />
Human Health: The effects of environmental damage on human health are measured <strong>in</strong> DALY (disability-adjusted<br />
life years) and are measured as endpo<strong>in</strong>ts. The follow<strong>in</strong>g midpo<strong>in</strong>t impact categories<br />
are <strong>in</strong>cluded: ozone depl<strong>et</strong>ion, human toxicity, photochemical oxidant formation, particulate matter<br />
formation, ionis<strong>in</strong>g radiation;, effects of climate change on human health.<br />
Climate Change: Climate change is measured <strong>in</strong> terms of kg CO2-eq and <strong>in</strong>cludes the follow<strong>in</strong>g categories:<br />
climate change (process), climate change, land transformation.<br />
Land Use: Land use, measured <strong>in</strong> m 2 , takes <strong>in</strong>to consideration the physical space that is occupied by<br />
a given system. It <strong>in</strong>cludes the follow categories: agricultural land occupation, urban land occupation.<br />
This category was not used <strong>in</strong> the Superwijzer, but was used as a separate <strong>in</strong>dicator dur<strong>in</strong>g the<br />
research.<br />
In the Superwijzer App the impact of the product is presented <strong>in</strong> four categories that ma<strong>in</strong>ly overlap the categories<br />
mentioned above: Biodiversity, Climate change, Harmful substances (comb<strong>in</strong>ation of the Human<br />
health assessment by CE Delft and an <strong>in</strong>ternal review by Pigs <strong>in</strong> Need concern<strong>in</strong>g e.g. use of antibiotics) and<br />
Animal welfare (assessed by Science for Soci<strong>et</strong>y). The App-user is free to weight the categories accord<strong>in</strong>g to<br />
their own <strong>in</strong>terest (a default is automatically <strong>in</strong>cluded).<br />
3. Results<br />
The results show that there are large differences b<strong>et</strong>ween the product groups, but also with<strong>in</strong> product<br />
groups. The differences <strong>in</strong> livestock management, feed, feed conversion and greenhouse gas production by<br />
rum<strong>in</strong>ants are the ma<strong>in</strong> causes for the differences <strong>in</strong> the categories biodiversity, climate change and land use<br />
impacts. Human health impacts differ, relative to the volatisation of N-compounds from fertilisers, the<br />
amount of stable emissions occurr<strong>in</strong>g and the emissions from transport.<br />
The most significant results of the environmental assessment of the 98 products are shown <strong>in</strong><br />
589
PARALLEL SESSION 7A: CONSUMERS 8 th Int. Conference on <strong>LCA</strong> <strong>in</strong> the<br />
Agri-<strong>Food</strong> Sector, 1-4 Oct <strong>2012</strong><br />
Figure 11 and Figure 12, for biodiversity and climate change, respectively. These are the two categories<br />
directly used by Pigs <strong>in</strong> Need, and show the largest differences b<strong>et</strong>ween groups and with<strong>in</strong> groups or product.<br />
The bars <strong>in</strong>dicate the environmental impact or damage (larger bars <strong>in</strong>dicate that products are worse for the<br />
environment), relative to the product with the highest score. For biodiversity, climate change and human<br />
health the product with the highest score is Brazilian beef, for land use it is Argent<strong>in</strong>ian beef.<br />
Figure 11 Categorised scores for impact on biodiversity. The bars <strong>in</strong>dicate, from top to bottom, the lowest,<br />
the average and the highest score <strong>in</strong> each category. The number of products represented <strong>in</strong> each category is<br />
given beside the scores.<br />
590
PARALLEL SESSION 7A: CONSUMERS 8 th Int. Conference on <strong>LCA</strong> <strong>in</strong> the<br />
Agri-<strong>Food</strong> Sector, 1-4 Oct <strong>2012</strong><br />
Figure 12 Categorised scores for impact on climate change. The bars <strong>in</strong>dicate, from top to bottom, the lowest,<br />
the average and the highest score <strong>in</strong> each category The number of products represented <strong>in</strong> each category<br />
is given beside the scores.<br />
4. Discussion<br />
The results from the Superwijzer show substantial differences b<strong>et</strong>ween the lowest and the highest scor<strong>in</strong>g<br />
products, particularly <strong>in</strong> terms of the effects on biodiversity. At the extreme, the highest scor<strong>in</strong>g product<br />
(Brazilian beef) has a biodiversity score of over 3,000 times that of the lowest product (Dutch hare). Also<br />
with<strong>in</strong> the product group ‘Beef and Veal’ there is still a difference of factor 10 b<strong>et</strong>ween the lowest and highest<br />
score. In terms of the effects on climate change, Brazilian beef has a score that is about 36 times higher<br />
than Quorn, a meat alternative. Although these scores only illustrate the upper and lower scores, there is a<br />
dist<strong>in</strong>ct cluster<strong>in</strong>g of product types. In terms of an approximate product rank<strong>in</strong>g, beef and veal rank worst,<br />
followed by other meat types (the order depends on the impact category used), followed by eggs and cheese,<br />
and f<strong>in</strong>ally, the meat substitutes (veg<strong>et</strong>arian), milk and yoghurt and dairy alternatives rank best.<br />
There are also dist<strong>in</strong>ct variations <strong>in</strong> certa<strong>in</strong> product categories. Beef and veal have by far the largest range<br />
<strong>in</strong> scores both for biodiversity and climate change. The lowest scor<strong>in</strong>g products are m<strong>in</strong>ced and cut beef<br />
orig<strong>in</strong>at<strong>in</strong>g from spent dairy cows, while the highest scor<strong>in</strong>g product is Brazilian beef. Another product category<br />
with a large variation is ‘rabbit and hare’, which has a relatively low scores for Dutch hare and relatively<br />
high score for rabbit. Some product groups, such as pork have very little variation <strong>in</strong> the environmental<br />
impact with<strong>in</strong> the group.<br />
As shown <strong>in</strong> the results section, the differences are large b<strong>et</strong>ween product groups, but also with<strong>in</strong> product<br />
groups, especially the beef and veal group. There are several important factors result<strong>in</strong>g <strong>in</strong> the range <strong>in</strong> this<br />
group: e.g. the feed used, allocation assumptions and slaughter-age. Higher consumption of (soy) concentrate<br />
by livestock result <strong>in</strong> higher score, specifically for biodiversity. The lower-scor<strong>in</strong>g beef products are m<strong>in</strong>ce<br />
beef products from spent dairy cows; the environmental impact is allocated on an economic basis, thus only<br />
5.5% of the environmental impacts are allocated to the beef. Veal scores high because of relatively short live<br />
times and relatively high impact of feed due to their special feed mix.<br />
Based on these results we can state that consumers have much more choices <strong>in</strong> green<strong>in</strong>g their di<strong>et</strong>s then<br />
becom<strong>in</strong>g a veg<strong>et</strong>arian or restrict<strong>in</strong>g their di<strong>et</strong> to less meat. Even a choice b<strong>et</strong>ween product groups is not<br />
necessary, as long as the products with the lowest impact with<strong>in</strong> each product group is selected.<br />
5. Conclusion<br />
This study provides an <strong>in</strong>terest<strong>in</strong>g example of how <strong>LCA</strong> results can be made available to consumers, by<br />
provid<strong>in</strong>g easy to understand <strong>in</strong>formation <strong>in</strong> a simple way to help them to make environmentally conscious<br />
choices <strong>in</strong> their di<strong>et</strong>. The large variations <strong>in</strong> environmental impact with<strong>in</strong> product groups can have an effect<br />
on the rank<strong>in</strong>g of a particular product group, such that general statements regard<strong>in</strong>g the scores of specific<br />
groups are difficult to make, as is illustrated by the wide range of scores of beef products. Because of the<br />
large variation which exists both with<strong>in</strong> product groups and b<strong>et</strong>ween product groups, choos<strong>in</strong>g products with<br />
a low environmental impact will lead to significant reductions <strong>in</strong> the environmental impact of an <strong>in</strong>dividual’s<br />
di<strong>et</strong>. Therefore, it is important to assess a range of food products, as is done <strong>in</strong> the Superwijzer App <strong>in</strong> which<br />
15,000 different products are rated, to provide the best available <strong>in</strong>formation to the consumer at the location<br />
where choices are made; <strong>in</strong> the supermark<strong>et</strong>.<br />
6. References<br />
Blonk, H., Kool, A. and Luske, B. (2008). Milieueffecten van Nederlandse consumptie van eiwitrijke producten: Gevolgen van vervang<strong>in</strong>g<br />
van dierlijke eiwitten anno 2008, Blonk Milieuadvies, 2008<br />
Broekema, R., Blonk H., with Alverado, C. and Hegger, S. (2009). Milieukundige vergelijk<strong>in</strong>gen van vleesvervangers, Blonk Milieuadvies,<br />
2009<br />
Cederberg, C., Persson, U.M., Neovius, K., Molander, S. and Clift, R. (2011). Includ<strong>in</strong>g Carbon Emissions from Deforestation <strong>in</strong><br />
the Carbon Footpr<strong>in</strong>t of Brazilian Beef. Environmental Science and Technology, vol. 45, no.5 (2011); p. 1773-1779.<br />
Head, M., Sevenster, M. and Croezen, H. (2011). Life Cycle Impacts of Prote<strong>in</strong>- rich <strong>Food</strong>s for Superwijzer. Report 11.2329.57, CE<br />
Delft.<br />
IDF (2010), A common carbon footpr<strong>in</strong>t approach for dairy: the IDF guide to standard lifecycle assessment m<strong>et</strong>hodology for the<br />
dairy sector, In: Bull<strong>et</strong><strong>in</strong> of the International Dairy Federation no.445, 2010<br />
591
PARALLEL SESSION 7A: CONSUMERS 8 th Int. Conference on <strong>LCA</strong> <strong>in</strong> the<br />
Agri-<strong>Food</strong> Sector, 1-4 Oct <strong>2012</strong><br />
592<br />
Environmental impact of different broiler production systems <strong>in</strong><br />
Malaysia and consumer will<strong>in</strong>gness to pay for reduced impact<br />
Noraisah Spahat * , Jonathan H. Guy, Ilias Kyriazakis, Guy Garrod, Sandra A. Edwards<br />
School of Agriculture, <strong>Food</strong> and Rural Development, Newcastle University, Newcastle upon Tyne, NE1 7RU UK<br />
* Correspond<strong>in</strong>g author. E-mail: noraisah.spahat@newcastle.ac.uk<br />
ABSTRACT<br />
The objectives of this study were to i) estimate the environmental impact of different broiler production systems <strong>in</strong> Malaysia us<strong>in</strong>g a<br />
Life Cycle Assessment, with a functional unit of one tonne live-weight of broiler chickens and by tak<strong>in</strong>g a cradle to farm-gate approach;<br />
and ii) estimate consumers’ will<strong>in</strong>gness to pay (WTP) for chicken meat produced with a higher regard for the environment,<br />
with consideration of socio-economic characteristics, us<strong>in</strong>g a Cont<strong>in</strong>gent Valuation M<strong>et</strong>hod. The environmental impact analysis<br />
us<strong>in</strong>g data for two <strong>in</strong>tensive systems and one semi-<strong>in</strong>tensive system showed clear differences <strong>in</strong> impact b<strong>et</strong>ween the three systems,<br />
with the <strong>in</strong>tensive closed-house system be<strong>in</strong>g the least environmentally impact<strong>in</strong>g. The environmental awareness of respondents<br />
resulted <strong>in</strong> a stated WTP value for reduced environmental impact which was significantly higher than the average sale price of<br />
chicken meat at both national and regional levels, with half of respondents will<strong>in</strong>g to pay an <strong>in</strong>crement of 10% above the exist<strong>in</strong>g<br />
mark<strong>et</strong> price.<br />
Keywords: broiler chicken, environmental impact, life cycle assessment, will<strong>in</strong>gness to pay, cont<strong>in</strong>gent valuation m<strong>et</strong>hod<br />
1. Introduction<br />
The poultry <strong>in</strong>dustry has been the fastest grow<strong>in</strong>g of all livestock sectors <strong>in</strong> both developed and develop<strong>in</strong>g<br />
countries (Ste<strong>in</strong>feld <strong>et</strong> al., 2006; Narrod <strong>et</strong> al., 2008). It is characterised by a highly dynamic mark<strong>et</strong>,<br />
consolidated y<strong>et</strong> still expand<strong>in</strong>g, even though it constantly faces price fluctuations of raw materials and public<br />
health concerns. Accord<strong>in</strong>g to FAO (<strong>2012</strong>), world poultry meat production <strong>in</strong> 2010 was 98 million tonnes<br />
and is expected to reach 122.5 million tonnes by 2020 (Best, 2011). This growth <strong>in</strong> production is not only<br />
due to demand factors, such as <strong>in</strong>crease <strong>in</strong> population, disposable <strong>in</strong>come and urbanisation, which lead to a<br />
chang<strong>in</strong>g pattern of consumption, but also due to supply side factors, especially the implementation of large<br />
scale vertically and horizontally <strong>in</strong>tegrated production cha<strong>in</strong>s. This type of production is typically focused<br />
on <strong>in</strong>tensive systems which are able to absorb any great fluctuations <strong>in</strong> <strong>in</strong>put prices, reduc<strong>in</strong>g transaction<br />
costs and giv<strong>in</strong>g control over product quality and saf<strong>et</strong>y, besides hav<strong>in</strong>g a significant impact on overall production<br />
performance (Narrod <strong>et</strong> al., 2008).<br />
Malaysia is self-sufficient <strong>in</strong> me<strong>et</strong><strong>in</strong>g the domestic demands for poultry meat, with a sufficiency of 122%<br />
<strong>in</strong> 2009, represent<strong>in</strong>g an annual growth rate of 5.3% for the period 2005-2009. Poultry contributed 53% of<br />
the overall value of livestock products of Malaysia <strong>in</strong> 2009 (DVS, 2011). Most chicken meat is consumed<br />
fresh and only 10% is used by the process<strong>in</strong>g <strong>in</strong>dustries to manufacture products such as nugg<strong>et</strong>s, burgers<br />
and other value-added products, especially for the fast food bus<strong>in</strong>esses. The demand for poultry meat from<br />
the downstream <strong>in</strong>dustries has grown rapidly and generated an <strong>in</strong>crease <strong>in</strong> demand from the domestic and<br />
<strong>in</strong>ternational mark<strong>et</strong>. To achieve the demand targ<strong>et</strong>, the expansion of production through vertically and horizontally<br />
<strong>in</strong>tegrated approaches has been identified as an effective solution. There are many economic advantages<br />
of <strong>in</strong>tensive broiler chicken production, particularly the closed-house system that is popular <strong>in</strong> many<br />
countries with a developed broiler <strong>in</strong>dustry. However, <strong>in</strong>tensive production might be tax<strong>in</strong>g to the environment<br />
because of the release of higher levels of unavoidable waste. Therefore, development of more environmentally-friendly<br />
broiler production without compromis<strong>in</strong>g economic expectations is crucial. The objectives<br />
of this study were to i) estimate the environmental impacts of different broiler production systems <strong>in</strong> Malaysia;<br />
and ii) estimate consumer will<strong>in</strong>gness to pay (WTP) for chicken produced with a higher regard for the<br />
environment (chicken-HRE).<br />
Life Cycle Assessment (<strong>LCA</strong>) is an ISO standard procedure of environmental account<strong>in</strong>g, a framework<br />
which compiles and evaluates the use of resources (i.e. energy <strong>in</strong>puts, process<strong>in</strong>g of raw materials, disposal<br />
and emission of pollutants) for each stage of a production cycle, and <strong>in</strong>terpr<strong>et</strong>s the environmental burdens<br />
aris<strong>in</strong>g from this product system to the specific impact categories (de Vries and de Boer, 2010). Two types<br />
of impact categories are available accord<strong>in</strong>g to their position <strong>in</strong> the environmental relationship b<strong>et</strong>ween<br />
emissions and impacts, namely midpo<strong>in</strong>t and endpo<strong>in</strong>t <strong>in</strong>dicators. The midpo<strong>in</strong>t <strong>in</strong>dicators are param<strong>et</strong>ers <strong>in</strong><br />
a cause-effect cha<strong>in</strong> for a particular impact category, whilst endpo<strong>in</strong>t <strong>in</strong>dicators reflect the f<strong>in</strong>al effect of<br />
impact category and thus often have a higher relevance to soci<strong>et</strong>y.<br />
The second objective was to evaluate consumer WTP for chicken-HRE, as a proxy to evaluate nonexclusive<br />
goods, namely the favourable environmental quality which is <strong>in</strong>tangible and does not have a mar-
PARALLEL SESSION 7A: CONSUMERS 8 th Int. Conference on <strong>LCA</strong> <strong>in</strong> the<br />
Agri-<strong>Food</strong> Sector, 1-4 Oct <strong>2012</strong><br />
k<strong>et</strong> price. Based on a utilitarian approach, which refers to the sum of the utility of a certa<strong>in</strong> good to soci<strong>et</strong>y, a<br />
stated preference m<strong>et</strong>hod was used to estimate the marg<strong>in</strong>al benefits utility, i.e. a cont<strong>in</strong>gent valuation<br />
m<strong>et</strong>hod (CVM) (Mitchell and Carson, 2005). In the current study, some improvement <strong>in</strong> elicitation format<br />
was applied to reduce the potential for bias <strong>in</strong> responses which is always a possible criticism of CVM. Many<br />
environmental economists agree that CVM is a highly developed survey approach for non-mark<strong>et</strong> valuation,<br />
us<strong>in</strong>g tra<strong>in</strong>ed <strong>in</strong>terviewers and <strong>in</strong>volv<strong>in</strong>g extensive use of visual aids such as maps, photographs and charts to<br />
acquire the closed estimation of WTP and mirror real customer behaviour <strong>in</strong> the actual mark<strong>et</strong> (Hanley <strong>et</strong> al.,<br />
2001; Mitchell and Carson, 2005). In comb<strong>in</strong>ation, the <strong>LCA</strong> and CVM approaches may be useful to d<strong>et</strong>erm<strong>in</strong>e<br />
the strategic direction for the Malaysian poultry <strong>in</strong>dustry to ensure the effective distribution of f<strong>in</strong>ancial<br />
allocation to support development of food production that is both economically and environmentally susta<strong>in</strong>able.<br />
2. M<strong>et</strong>hods<br />
Life Cycle Assessment: The assessment of environmental burdens from a total system <strong>in</strong>volved <strong>in</strong> the life<br />
cycle of a product were taken <strong>in</strong>to account, from resources extraction through the process<strong>in</strong>g of raw materials<br />
(i.e. crop cultivation and the mechanisation used, feed and feed additives manufactured), utilities consumption<br />
(i.e. transportation, water, gas and electricity) and waste disposal (manure, gaseous emissions and substances<br />
derived from manure) as well as manure as a fertiliser credit. In this study, poultry manure from the<br />
<strong>in</strong>tensive systems could be used as plant nutrients to offs<strong>et</strong> the synth<strong>et</strong>ic fertiliser that would otherwise be<br />
required for grow<strong>in</strong>g crops. <strong>LCA</strong> was employed through the use of specialist software, namely SimaPro (version<br />
7.3.2, PRé Consultants, Amersfoort, N<strong>et</strong>herlands) to evaluate the environmental impacts of three different<br />
broiler production systems, namely an <strong>in</strong>tensive closed-house system (CH; typified by conf<strong>in</strong>ement of<br />
birds <strong>in</strong>doors <strong>in</strong> relatively large flocks with environmental control), an <strong>in</strong>tensive open-house system (OH; as<br />
for CH but without a controlled environment due to the open sides of the build<strong>in</strong>g) and a semi-<strong>in</strong>tensive system<br />
(SI; unlike the previous two systems, it uses unimproved genotypes, very small flock size, simple hous<strong>in</strong>g<br />
and provides access to range). A functional unit (FU) of one tonne live weight of broiler chickens was<br />
chosen, with cradle to farm-gate as a system boundary and focus<strong>in</strong>g on a s<strong>in</strong>gle product output (the model<br />
was such that no allocations were necessary) with an attributional approach, s<strong>in</strong>ce the motivation of the study<br />
was based on the technologies provided <strong>in</strong> different production systems. Four midpo<strong>in</strong>t impact categories<br />
were considered, namely energy use, global warm<strong>in</strong>g, acidification and eutrophication which conta<strong>in</strong> multiple<br />
types of burdens. Most burdens are aggregated <strong>in</strong>to potential for caus<strong>in</strong>g impacts us<strong>in</strong>g a specific characterisation<br />
factor, i.e. Global Warm<strong>in</strong>g Potential (GWP), Acidification Potential (AP) and Eutrophication<br />
Potential (EP). For example, the characterisation factor of CO2 is 1, and the GWP value result<strong>in</strong>g from 1 kg<br />
of CH4 and N2O are 25 and 298 times respectively higher than CO2. Time constra<strong>in</strong>ts meant that the potential<br />
impact of changes <strong>in</strong> land use was not considered <strong>in</strong> the current study. Foreground data from n<strong>in</strong>e broiler<br />
farms, three farms for each of the three different production systems, and one breeder farm were obta<strong>in</strong>ed<br />
from sources <strong>in</strong> the poultry <strong>in</strong>dustry and the Government of Malaysia. In addition, background data from the<br />
Eco<strong>in</strong>vent database (Eco<strong>in</strong>vent Centre, Dübendorf, Switzerland), cover<strong>in</strong>g the processes and services of<br />
products were applied.<br />
Cont<strong>in</strong>gent Valuation M<strong>et</strong>hod: The structure and essential components of most Cont<strong>in</strong>gent Valuation<br />
(CV) questionnaires consist of five steps, namely i) s<strong>et</strong>t<strong>in</strong>g up the valuation scenario; ii) <strong>in</strong>troduc<strong>in</strong>g the<br />
payment vehicle; iii) elicit<strong>in</strong>g valuation; iv) validation; and v) collect<strong>in</strong>g socio-demographic and economic<br />
characteristics. The valuation scenario conta<strong>in</strong>s the critical part of the CV, namely the establishment of the<br />
hypoth<strong>et</strong>ical scenario which def<strong>in</strong>es and creates the justification to value the good; a process of describ<strong>in</strong>g<br />
the potential consequences from the changes of the good and the <strong>in</strong>stitutional s<strong>et</strong>t<strong>in</strong>g which provides the<br />
<strong>in</strong>formation on the implementation, delivery and monitor<strong>in</strong>g actions to the public. A plausible mixed payment<br />
vehicle of a voluntary nature based on a price <strong>in</strong>crease was used <strong>in</strong> the survey (Pearce <strong>et</strong> al., 2002). A<br />
series of validation follow-up questions were asked <strong>in</strong> order to understand the motives for the answer given<br />
and to help identify any potential bias. The f<strong>in</strong>al element of the questionnaire asked for socio-demographic<br />
and economic <strong>in</strong>formation of the respondents, which was used to confirm the theor<strong>et</strong>ical expectation towards<br />
WTP (Mitchell and Carson, 2005). The face-to-face survey was employed <strong>in</strong> four regions with a total of two<br />
hundred and ten respondents recruited, compris<strong>in</strong>g 27, 93, 60 and 30 persons respectively from the northern,<br />
central, southern and eastern regions of Pen<strong>in</strong>sular Malaysia. The respondents could be anyone as long as<br />
they consumed chicken <strong>in</strong> their di<strong>et</strong> and were aged b<strong>et</strong>ween 21 and 56 years of age. Statistical differences <strong>in</strong><br />
WTP value b<strong>et</strong>ween respondents from different regions were explored us<strong>in</strong>g appropriate statistical tests <strong>in</strong>clud<strong>in</strong>g<br />
analysis of variance (ANOVA). Various association and correlation tests were performed to identify<br />
593
PARALLEL SESSION 7A: CONSUMERS 8 th Int. Conference on <strong>LCA</strong> <strong>in</strong> the<br />
Agri-<strong>Food</strong> Sector, 1-4 Oct <strong>2012</strong><br />
key socio-demographic param<strong>et</strong>ers for cause and effect relationship tests for WTP option (yes/no) and WTP<br />
value.<br />
3. Results<br />
3.1. Environmental impact of different broiler production systems<br />
Table 1. Life cycle impact assessment of energy use, global warm<strong>in</strong>g potential, acidification potential and<br />
eutrophication potential associated with the production of one tonne live weight of broiler chickens from<br />
three different Malaysian hous<strong>in</strong>g systems. For the impact of each hous<strong>in</strong>g system, the values <strong>in</strong> a row show<br />
the absolute amount followed by, <strong>in</strong> italics, the percentage of the total impact accounted for by that particular<br />
activity<br />
594<br />
Broiler feedrelated<br />
Breeder feedrelated<br />
On-farm <strong>in</strong>puts/<br />
emission<br />
Fertiliser<br />
Credit<br />
Energy use (MJ)<br />
Closed house system 8,946 74.2% 828 6.9% 2,280 18.9% -3,679 8,375<br />
Open house system 10,417 83.42% 1,104 8.9% 908 7.3% -3,945 8,484<br />
Semi-<strong>in</strong>tensive system 12,892 84.9% 1,065 7.0% 1,236 8.1% -4,807 10,386<br />
Global Warm<strong>in</strong>g Potential (kg CO2 eq. on a 100 year timescale)<br />
Closed house system 1,603 82.7% 142 7.3% 192 9.9% -680 1,257<br />
Open house system 1,866 86.7% 190 8.8% 95 4.4% -784 1,367<br />
Semi-<strong>in</strong>tensive system 2,309 87.6% 179 6.8% 148 5.6% -889 1,747<br />
Acidification Potential (kg SO2 eq.)<br />
Closed house system 12.8 67.8% 1.2 6.5% 4.9 25.7% -2.0 16.8<br />
Open house system 14.9 68.5% 1.6 7.5% 5.2 24.0% -2.3 19.4<br />
Semi-<strong>in</strong>tensive system 18.4 70.1% 1.4 5.2% 6.5 24.6% -2.7 23.6<br />
Eutrophication Potential (kg PO4 eq.)<br />
Closed house system 7.9 76.0% 0.7 7.0% 1.8 17.0% -0.3 10.0<br />
Open house system 9.2 76.1% 1.0 8.0% 1.9 15.9% -0.4 11.7<br />
Semi-<strong>in</strong>tensive system 11.4 78.6% 0.7 5.0% 2.4 16.4% -0.4 14.1<br />
After consider<strong>in</strong>g the offs<strong>et</strong> values from manure as fertiliser, the SI system recorded the largest burdens <strong>in</strong><br />
the categories of Energy Use, GWP, AP and EP with 10,386 MJ, 1,747 kg of CO2 eq., 24 kg of SO2 eq. and<br />
14 kg of PO4 eq. respectively (see Table 1). This was followed by the OH system, with the CH system be<strong>in</strong>g<br />
the least environmentally impact<strong>in</strong>g, produc<strong>in</strong>g approximately 14 to 28% lower impacts than the SI system.<br />
Broiler feed-related <strong>in</strong>puts accounted for approximately three quarters of the impact values (with 67.8 to<br />
82.7% for the CH system, 68.5 to 86.7% for the OH system and 70.1 to 87.6% for the SI system), followed<br />
by other on-farm <strong>in</strong>puts and emissions from the manure and chickens, while breeder feed-related <strong>in</strong>puts contributed<br />
the smallest environmental impact. Breeder feed-related <strong>in</strong>puts contributed approximately 5 to 9%<br />
to environmental impacts, with the OH system produc<strong>in</strong>g the highest impacts compared to other systems,<br />
s<strong>in</strong>ce this system required four breeder hens to produce one FU. The CH system required an energy <strong>in</strong>put of<br />
approximately four times that of the SI and OH systems, largely due to heat<strong>in</strong>g and ventilation requirements.<br />
However, the SI system produced much higher burdens from emissions, especially the categories of acidification<br />
and eutrophication potentials, ma<strong>in</strong>ly due to the large amount of manure generated throughout the<br />
extended production cycle of 12 weeks.<br />
3.2. Estimation of consumers’ WTP for chicken-HRE<br />
For the first objective of the CVM survey, respondents were asked to evaluate the relative environmental<br />
impact result<strong>in</strong>g from the six major economic activities of Malaysia. On average 48.1% of respondents considered<br />
the manufactur<strong>in</strong>g sector as be<strong>in</strong>g the major contributor of negative impacts on environmental quality,<br />
followed by the chemical <strong>in</strong>dustry (31.9%), transportation (10.5%), agriculture (5.7%), m<strong>in</strong><strong>in</strong>g (2.9%)<br />
and construction (1.4%). Almost two-thirds of respondents (63.3%) stated that the efforts taken by the both<br />
the Government and the <strong>in</strong>dustry <strong>in</strong> these six economic activities to prevent environmental degradation were<br />
less than their rate of development. Meanwhile, half of respondents stated that quality was the ma<strong>in</strong> factor<br />
<strong>in</strong>fluenc<strong>in</strong>g their decision when purchas<strong>in</strong>g chicken meat, and 40% of respondents believed that saf<strong>et</strong>y and<br />
price were essential <strong>in</strong> their decision. Over half of those surveyed believed that environmental problems<br />
aris<strong>in</strong>g from poultry production were generated from the production stage (<strong>in</strong>clud<strong>in</strong>g hous<strong>in</strong>g system)<br />
whereas only 5% considered that production of feed gave the negative impact.<br />
Total
PARALLEL SESSION 7A: CONSUMERS 8 th Int. Conference on <strong>LCA</strong> <strong>in</strong> the<br />
Agri-<strong>Food</strong> Sector, 1-4 Oct <strong>2012</strong><br />
Table 2: Will<strong>in</strong>gness to pay (WTP) for chicken meat produced with a higher regard for the environment<br />
based on an absolute value (RM/KG) and percentage <strong>in</strong>crement<br />
Average sale price Mean WTP SE t-test Value P Value<br />
(RM/KG) RM % Value % Value % Value %<br />
National 7.05 7.91 12.2 0.045 0.633 177.1 19.3
PARALLEL SESSION 7A: CONSUMERS 8 th Int. Conference on <strong>LCA</strong> <strong>in</strong> the<br />
Agri-<strong>Food</strong> Sector, 1-4 Oct <strong>2012</strong><br />
expla<strong>in</strong>ed by the urbanisation tak<strong>in</strong>g place <strong>in</strong> Malaysia; the proportion of population <strong>in</strong> Malaysia which is<br />
urban <strong>in</strong>creased from 62% to 71% dur<strong>in</strong>g the period 2000 to 2010 (DOS, 2011).<br />
Perhaps one of the most <strong>in</strong>terest<strong>in</strong>g f<strong>in</strong>d<strong>in</strong>gs of the current study was consumer perception of the effect of<br />
poultry production on environmental quality. Respondents believed that the major contribution to environmental<br />
impact came from manure management and only 5% considered that the production of poultry feed<br />
contributed to environmental problems. In contrast, the <strong>LCA</strong> results showed that b<strong>et</strong>ween 74 to 95% of environmental<br />
burdens were derived from feed (<strong>in</strong>clud<strong>in</strong>g the production, transportation and process<strong>in</strong>g) for<br />
broiler chickens and breeder hens, and only 2.3 to 24% burdens resulted from manure handl<strong>in</strong>g. This contradiction<br />
can be expla<strong>in</strong>ed by the difficulties of consumers <strong>in</strong> understand<strong>in</strong>g the nature of broiler production <strong>in</strong><br />
d<strong>et</strong>ail, coupled with non-visibility of the negative impacts <strong>in</strong> the short term. Thus, consumers may have considered<br />
the impacts of feed production, which occurred to a significant extent overseas, to be small when<br />
compared to other economic activities which produce visual effects, such as smoke from factories which can<br />
have a very large <strong>in</strong>fluence on public perception.<br />
Even though the mean WTP values showed regional variation, the median values at both national and regional<br />
levels confirmed that many respondents were will<strong>in</strong>g to pay 10% more than they currently paid for<br />
chicken meat produced with a higher regard for the environment. These two param<strong>et</strong>ers can have quite different<br />
<strong>in</strong>terpr<strong>et</strong>ations at the macro level of development plann<strong>in</strong>g. The mean WTP values have been used to<br />
d<strong>et</strong>erm<strong>in</strong>e the value of the benefit, which reflects the consumer behaviour and demand characteristics, and<br />
has high relevance for the purpose of cost-benefit analysis. Therefore if the mean benefit value outweighs the<br />
mean costs, this suggests that the proposal should proceed. On the other hand the median value <strong>in</strong>dicates<br />
likely public motivation and choices, s<strong>in</strong>ce it corresponds to the value which represents the majority endorsement.<br />
Respondents <strong>in</strong> the northern and eastern regions of Malaysia already have to pay 0.3 to 2.4%<br />
higher than the national average price for chicken, ma<strong>in</strong>ly as a result of the transportation and storage costs.<br />
Respondents from the northern region with mean WTP at 9.9%, which was the lowest value of all regions,<br />
may have been heavily <strong>in</strong>fluenced by the fact their <strong>in</strong>comes are generally lower than those of people <strong>in</strong> other<br />
regions.<br />
5. Conclusions<br />
The results suggest that the CH system was the least environmentally impact<strong>in</strong>g of the three Malaysian<br />
broiler production systems considered for all impact categories, produc<strong>in</strong>g approximately 12 to 40% less<br />
impact than the highest contributor which was the SI system. Broiler and breeder feed-related resources<br />
accounted for almost three quarters of the total impact values, followed by other on-farm <strong>in</strong>puts and emissions<br />
produced. In relation to consumers’ WTP for favourable environmental quality as a result of more environmental-friendly<br />
broiler production, half of the respondents were will<strong>in</strong>g to pay an <strong>in</strong>crement of 10%<br />
above mark<strong>et</strong> price <strong>in</strong> all regions, with type of occupation and the number of persons <strong>in</strong> the household d<strong>et</strong>erm<strong>in</strong><strong>in</strong>g<br />
the pattern of WTP among consumers. The analysis of the <strong>in</strong>teraction of these agro-ecological and<br />
socio-economic f<strong>in</strong>d<strong>in</strong>gs, tog<strong>et</strong>her with a comprehensive policy <strong>in</strong>tervention, could be useful to d<strong>et</strong>erm<strong>in</strong>e<br />
best practice to ensure susta<strong>in</strong>able broiler production <strong>in</strong> Malaysia.<br />
6. References<br />
Best, P., 2011. Worldwide poultry meat production, consumption forecasts', WATTAgN<strong>et</strong>.com. Available<br />
at:http://www.wattagn<strong>et</strong>.com/Worldwide_poultry_meat_production,_consumption_forecasts.aspx. (accessed: 02/<strong>2012</strong>).<br />
de Vries, M. and de Boer, I. J. M., 2010. Compar<strong>in</strong>g environmental impacts for livestock products: A review of life cycle assessments.<br />
Livestock Science 128, 1-11.<br />
DOS, 2011. Consumer Price Index. Putrajaya, Malaysia: Department of Statistics Malaysia.<br />
DVS, 2011. Annual Statistical Book. Putrajaya, Malaysia: Department of V<strong>et</strong>er<strong>in</strong>ary Service Malaysia.<br />
FAO, <strong>2012</strong>. <strong>Food</strong> Outlook: Global mark<strong>et</strong> analysis. Rome, Italy: <strong>Food</strong> and Agriculture Organization. Available at:<br />
http://www.fao.org/giews/ (accessed: 06/<strong>2012</strong>).<br />
Hanley, N., Shogren, J. F. and White, B., 2001. Introduction to environmental economics. Oxford University Press Inc. New York.<br />
Katajajuuri, J.M., 2008. Experiences and improvement possiblities - <strong>LCA</strong> case study of broiler chicken<br />
production. Proceed<strong>in</strong>gs of 6th International Conference Life Cycle Assessment <strong>in</strong> the Agri-<strong>Food</strong> Sector. Zurich, Switzerland.<br />
Le<strong>in</strong>onen, I., Williams, A. G., Wiseman, J., Guy, J. H. and Kyriazakis, I., <strong>2012</strong>. Predict<strong>in</strong>g the environmental impacts of chicken<br />
system <strong>in</strong> the United K<strong>in</strong>gdom through a life cycle assessment: Broiler production systems. Poultry Science 91, 1-18.<br />
Mitchell, R. C. and Carson, R. T. 2005. Us<strong>in</strong>g surveys to value public goods: the cont<strong>in</strong>gent valuation m<strong>et</strong>hod. Wash<strong>in</strong>gton, D.C.<br />
Narrod, C., Marites Tiongco, M., Costeles, A., 2008. Global poultry sector trends and external drivers of<br />
structural change. In Proceed<strong>in</strong>gs of the International Conference - Poultry <strong>in</strong> the Twenty-first Century: Avian Influenza and Beyond.<br />
Bangkok, Thailand.<br />
Pearce, D., O¨zdemiroglu, E., Bateman, I., Carson, R.T., Day, B., Hanemann, M., Hanley, N., H<strong>et</strong>t, T., Jones-Lee, M., Loomes, G.,<br />
Mourato, S., Pearce, D.W., Sugden, R. and Swanson, J. (2002) Economic valuation with stated preference techniques: summary<br />
guide. Rotherham: Department for Transport, Local Government and the Region. Publication Sales Centre.<br />
596
PARALLEL SESSION 7A: CONSUMERS 8 th Int. Conference on <strong>LCA</strong> <strong>in</strong> the<br />
Agri-<strong>Food</strong> Sector, 1-4 Oct <strong>2012</strong><br />
Pell<strong>et</strong>ier, N., 2008. Environmental performance <strong>in</strong> the US broiler poultry sector: Life cycle energy use and greenhouse gas, ozone<br />
depl<strong>et</strong><strong>in</strong>g, acidify<strong>in</strong>g and eutrophy<strong>in</strong>g emissions. Agricultural System 98, 67-73.<br />
Ste<strong>in</strong>feld, H., Wassenaar, T. and Jutzi, S. 2006. Livestock production systems <strong>in</strong> develop<strong>in</strong>g countries: status, drivers and trends.<br />
International Office of Epizootics 25(2), 505-516.<br />
Williams, A. G., Audsley, E. and Sandars, D. L., 2006. D<strong>et</strong>erm<strong>in</strong><strong>in</strong>g the environmental burdens and resource use <strong>in</strong> the production of<br />
agricultural and horticultural commodities. Ma<strong>in</strong> Report. Defra Research Project IS0205. Available at: http://www.defra.gov.uk<br />
(accessed 06/2010)<br />
597
PARALLEL SESSION 7B: BEEF PRODUCTION SYSTEMS 8 th Int. Conference on <strong>LCA</strong> <strong>in</strong> the<br />
Parallel session 7b: Beef Production Systems<br />
598<br />
Agri-<strong>Food</strong> Sector, 1-4 Oct <strong>2012</strong><br />
Environmental impacts accompany<strong>in</strong>g the production of milk, bov<strong>in</strong>e<br />
meat and gra<strong>in</strong> under h<strong>et</strong>erogeneous conditions <strong>in</strong> Norway<br />
Anne-Gr<strong>et</strong>e Roer 1,* , Audun Korsa<strong>et</strong>h 2 , Astrid Johansen 3 , Anne Kjersti Bakken 3 , Krist<strong>in</strong> Daugstad 4 , Gustav<br />
Fystro 4 , Trond Maukon Henriksen 2 , Anders Hammer Strømman 1<br />
1 The Industrial Ecology Programme, Department of Energy and Process Eng<strong>in</strong>eer<strong>in</strong>g, Norwegian University of Science and Tech-<br />
nology, 7491 Trondheim, Norway<br />
2 The Norwegian Institute for Agricultural and Environmental Research, Arable Crops Department, 2849 Kapp, Norway<br />
3 The Norwegian Institute for Agricultural and Environmental Research, Department of Landscapes, Grassland and Forage Crops,<br />
7500 Stjørdal, Norway<br />
4 The Norwegian Institute for Agricultural and Environmental Research, Løken Research Centre, 2940 Heggenes, Norway<br />
Correspond<strong>in</strong>g author. E-mail: anne-gr<strong>et</strong>e.roer@ntnu.no<br />
ABSTRACT<br />
We will present key results from a large, ongo<strong>in</strong>g, three-year project on environmental impact and resource use efficiency of selected<br />
food production cha<strong>in</strong>s <strong>in</strong> Norway (from cradle to store). The assessment presented here covers processes from cradle to farm gate,<br />
<strong>in</strong>clud<strong>in</strong>g all activities on the farm, along with the production of mach<strong>in</strong>ery, equipment, build<strong>in</strong>gs, diesels, oil, fertiliser, lime, seeds,<br />
pesticides and medic<strong>in</strong>es. N<strong>et</strong> m<strong>in</strong>eralisation of humus, which may play a major role for greenhouse gas emissions under certa<strong>in</strong><br />
conditions, is also considered.<br />
In the ongo<strong>in</strong>g project, the ambition is to account for the outspoken h<strong>et</strong>erogeneity, which characterises Norwegian agricultural systems,<br />
as soil type, management, climatic- and topographic conditions may vary largely b<strong>et</strong>ween regions and b<strong>et</strong>ween farms with<strong>in</strong><br />
the same region. To do so, we use high resolution <strong>in</strong>ventory data, based partly on <strong>in</strong>terviews with farmers, farm advisors, and agricultural<br />
experts, partly on data available <strong>in</strong> databases (e.g. soil properties, yields), and partly on models used for <strong>in</strong>terpolations where<br />
robust data is lack<strong>in</strong>g.<br />
<strong>LCA</strong> studies of Norwegian agri-food cha<strong>in</strong>s are scarce <strong>in</strong> the peer reviewed literature. A b<strong>et</strong>ter understand<strong>in</strong>g of the environmental<br />
impacts associated with agricultural production <strong>in</strong> Norway is important for three ma<strong>in</strong> reasons: Firstly, such data is required for<br />
environmental benchmark<strong>in</strong>g of various food pathways <strong>in</strong> order to assess the environmental profile of Norwegian food production<br />
versus imported products. Secondly, establish<strong>in</strong>g and consolidat<strong>in</strong>g knowledge on the environmental profile of current production<br />
practices is essential to develop future agriculture policies <strong>in</strong> an <strong>in</strong>creas<strong>in</strong>g carbon constra<strong>in</strong>ed world. Thirdly, a recent political goal<br />
s<strong>et</strong> for the agricultural sector <strong>in</strong> Norway push for an <strong>in</strong>crease <strong>in</strong> production of 1% annually for the next 20 years, and this <strong>in</strong>crease<br />
should be as environmental friendly as possible.<br />
The objective of this study is to perform a life cycle assessment from cradle to farm gate for Norwegian cereal- and dairy production,<br />
cover<strong>in</strong>g the three most important regions for each production cha<strong>in</strong>, respectively. Functional units are 1 kg of barley, oats, wheat,<br />
bov<strong>in</strong>e carcass and energy corrected milk. There will be focused on identify<strong>in</strong>g regional hotspots, and scenarios will be run <strong>in</strong> order<br />
to f<strong>in</strong>d possible, region wise improvements to reduce the overall environmental impact.
PARALLEL SESSION 7B: BEEF PRODUCTION SYSTEMS 8 th Int. Conference on <strong>LCA</strong> <strong>in</strong> the<br />
Agri-<strong>Food</strong> Sector, 1-4 Oct <strong>2012</strong><br />
Assess<strong>in</strong>g carbon, water and land use footpr<strong>in</strong>ts for beef cattle<br />
production <strong>in</strong> southern Australia<br />
Bradley G Ridoutt 1,* , Girija Page 2 , Kimberley Opie 3 , J<strong>in</strong>g Huang 4 , William Bellotti 2<br />
1 Commonwealth Scientific and Industrial Research Organisation (CSIRO), Susta<strong>in</strong>able Agriculture National Research Flagship,<br />
Private Bag 10, Clayton South, Victoria 3169, Australia<br />
2 University of Western Sydney, School of Science and Health, Locked Bag 1797, Penrith, NSW 2751, Australia<br />
3 CSIRO Land and Water, Private Bag 10, Clayton South, Victoria 3169, Australia<br />
4 Ch<strong>in</strong>a Agricultural University, College of Agriculture and Biotechnology, Beij<strong>in</strong>g 100193, Ch<strong>in</strong>a<br />
Correspond<strong>in</strong>g author. E-mail: brad.ridoutt@csiro.au<br />
ABSTRACT<br />
For agri-food products, concurrent assessment of GHG emissions, water use impacts and land use is necessary to communicate<br />
mean<strong>in</strong>gfully about environmental performance and to avoid potential negative consequences of narrowly focussed environmental<br />
improvement <strong>in</strong>itiatives, such as carbon footpr<strong>in</strong>t reduction. In this study, land use footpr<strong>in</strong>ts were calculated for six diverse beef<br />
cattle production systems <strong>in</strong> southern Australia (cradle to farm gate) us<strong>in</strong>g n<strong>et</strong> primary productivity of potential biomass (NPP0) as a<br />
means of describ<strong>in</strong>g the <strong>in</strong>tr<strong>in</strong>sic productive capability of land. The results per kg live weight, rang<strong>in</strong>g from 86 to 172 m 2 .yr-e (where<br />
1 m 2 .yr-e represents 1 m 2 of land occupation for 1 year at the global average NPP0) represent b<strong>et</strong>ween 1.3 and 2.7% of an average<br />
global citizen’s annual land use footpr<strong>in</strong>t, and highlight the importance of land use <strong>in</strong> cattle production. These results were approximately<br />
10 and 1000 times the normalised carbon and water footpr<strong>in</strong>t results. While NPP0 can be used to improve land use assessment<br />
beyond a simple measure of land area, further development of the land use footpr<strong>in</strong>t <strong>in</strong>dicator is recommended.<br />
Keywords: livestock, meat, potential n<strong>et</strong> primary productivity, global pressure on land resources, environmental labell<strong>in</strong>g<br />
1. Introduction<br />
For agricultural and food products, potential environmental impacts related to greenhouse gas (GHG)<br />
emissions, water use and land use are typically of highest concern (Pfister <strong>et</strong> al., 2011; Ridoutt <strong>et</strong> al., 2011).<br />
However, there are also frequent tradeoffs b<strong>et</strong>ween these sources of impact, mean<strong>in</strong>g that the evaluation of<br />
alternative agri-food production systems and products is not straightforward. For example, land can be used<br />
for biodiversity conservation and carbon sequestration or it can be used for food production, and some forms<br />
of agriculture conserve more soil carbon, perennial biomass and biodiversity than others. Alternatively, actions<br />
to reduce GHG emissions <strong>in</strong> agriculture might require greater water use, and <strong>in</strong>terventions to achieve<br />
water efficiency and water quality objectives might necessitate greater use of energy and consequently <strong>in</strong>crease<br />
GHG emissions. Furthermore, a small area of irrigated agricultural land might produce as much food<br />
as a much larger area of non-irrigated land and thereby be considered land use efficient and beneficial <strong>in</strong><br />
terms of m<strong>in</strong>imis<strong>in</strong>g pressure on arable land resources.<br />
This complexity highlights the futility of compar<strong>in</strong>g the environmental performance of food production<br />
systems or products us<strong>in</strong>g a s<strong>in</strong>gle stand-alone <strong>in</strong>dicator. An important objective of life cycle assessment<br />
(<strong>LCA</strong>) is the avoidance of burden shift<strong>in</strong>g, not only from one part of the product life cycle to another, but<br />
also from one environmental impact category to another. While carbon footpr<strong>in</strong>t<strong>in</strong>g of products has been<br />
<strong>in</strong>fluential <strong>in</strong> rais<strong>in</strong>g awareness about GHG emissions and has even been described as a catalyst for life cycle<br />
th<strong>in</strong>k<strong>in</strong>g and management (Weidema <strong>et</strong> al., 2008), concern has also been raised that the practice violates the<br />
core <strong>LCA</strong> pr<strong>in</strong>ciple of comprehensiveness, mean<strong>in</strong>g that consideration should be given to all relevant environmental<br />
impacts (F<strong>in</strong>kbe<strong>in</strong>er, 2009). Similar concerns could also be raised <strong>in</strong> relation to water footpr<strong>in</strong>ts,<br />
which consider only water use impacts (Ridoutt, 2011).<br />
In previous research, the carbon footpr<strong>in</strong>ts (cradle to farm gate) for six diverse beef cattle production systems<br />
<strong>in</strong> southern Australia were assessed and found to range from 10.1 to 12.7 kg CO2e kg -1 live weight (Ridoutt<br />
<strong>et</strong> al., 2011). This compared to <strong>LCA</strong>-based water footpr<strong>in</strong>ts of 3.3 to 221 L H2Oe kg -1 live weight for<br />
these same systems (Ridoutt <strong>et</strong> al., <strong>2012</strong>), calculated us<strong>in</strong>g the Water Stress Index (WSI) of Pfister <strong>et</strong> al.,<br />
(2009). Follow<strong>in</strong>g Ridoutt and Pfister (2010a, <strong>2012</strong>), the reference unit 1 L H2Oe represents the burden on<br />
freshwater systems from 1 L of consumptive freshwater use at the global average WSI. The purpose of this<br />
paper is to complement these case study f<strong>in</strong>d<strong>in</strong>gs for beef cattle with novel land use footpr<strong>in</strong>t <strong>in</strong>dicator results.<br />
The concurrent assessment of GHG emissions, water use and land use is considered a more reliable<br />
basis for assess<strong>in</strong>g environmental susta<strong>in</strong>ability than us<strong>in</strong>g a s<strong>in</strong>gle stand-alone <strong>in</strong>dicator, and for products <strong>in</strong><br />
the agriculture and food sectors, this multi-footpr<strong>in</strong>t <strong>in</strong>dicator approach could be considered sufficient to<br />
satisfy the comprehensiveness pr<strong>in</strong>ciple <strong>in</strong> <strong>LCA</strong>. To assist <strong>in</strong> the <strong>in</strong>terpr<strong>et</strong>ation of the environmental profile<br />
for each livestock production system, the <strong>in</strong>dicator results are also presented after normalisation.<br />
599
PARALLEL SESSION 7B: BEEF PRODUCTION SYSTEMS 8 th Int. Conference on <strong>LCA</strong> <strong>in</strong> the<br />
Agri-<strong>Food</strong> Sector, 1-4 Oct <strong>2012</strong><br />
In this study, a resource-based approach to land use footpr<strong>in</strong>t<strong>in</strong>g has been trialled. This approach recognises<br />
that productive land is a scarce resource and that the utilisation of land for the production of any particular<br />
goods or services adds <strong>in</strong>crementally to the global demand for productive land and the associated<br />
wide rang<strong>in</strong>g environmental impacts. In describ<strong>in</strong>g land as a resource, a simple quantitative measure (e.g.<br />
m 2 .yr) is <strong>in</strong>sufficient as land is not uniform <strong>in</strong> its productive capability. Land use footpr<strong>in</strong>t<strong>in</strong>g must therefore<br />
<strong>in</strong>corporate the quality dimension of land use. In regards to biodiversity and ecosystem services-based approaches<br />
to modell<strong>in</strong>g land use impacts <strong>in</strong> <strong>LCA</strong>, much progress has been made and a vari<strong>et</strong>y of new characterisation<br />
factors have been proposed relat<strong>in</strong>g to processes such as freshwater regulation, erosion regulation,<br />
water purification and carbon sequestration potential (de Baan <strong>et</strong> al., <strong>2012</strong>; de Souza <strong>et</strong> al., <strong>2012</strong>; Brandão<br />
and Milà i Canals, <strong>2012</strong>; Bos <strong>et</strong> al., <strong>2012</strong>; Saad <strong>et</strong> al., 2011, <strong>2012</strong>). However, at this po<strong>in</strong>t <strong>in</strong> time, these<br />
m<strong>et</strong>hods have not generally reached an operational stage of development, lack<strong>in</strong>g normalisation factors and<br />
coherence with established impact assessment m<strong>et</strong>hods which would allow evaluation of tradeoffs with other<br />
well established impact category <strong>in</strong>dicators. The exception is the modell<strong>in</strong>g of climate impacts of land use<br />
associated with carbon dioxide transfers b<strong>et</strong>ween veg<strong>et</strong>ation, soil and the atmosphere (Müller-Wenk and<br />
Brandão, 2010). Impact assessment m<strong>et</strong>hodologies which address <strong>in</strong>dividual ecosystem services and which<br />
lead to a profile of impact category <strong>in</strong>dicator results relat<strong>in</strong>g to land use will be rich <strong>in</strong> d<strong>et</strong>ail and most beneficial<br />
<strong>in</strong> contexts where the <strong>LCA</strong> practitioner is report<strong>in</strong>g with<strong>in</strong> the <strong>LCA</strong> expert community or where they<br />
have the opportunity to provide d<strong>et</strong>ailed explanation and <strong>in</strong>terpr<strong>et</strong>ation to the decision maker. On the other<br />
hand, a simplified resource-based approach to land use footpr<strong>in</strong>t<strong>in</strong>g, if it can be shown to be environmentally<br />
mean<strong>in</strong>gful, could be beneficial <strong>in</strong> contexts where a s<strong>in</strong>gle <strong>in</strong>dicator, reported us<strong>in</strong>g an <strong>in</strong>tuitively mean<strong>in</strong>gful<br />
unit is required, such as <strong>in</strong> the situation of Type III eco-labell<strong>in</strong>g.<br />
2. M<strong>et</strong>hods<br />
2.1. System description<br />
This case study concerns six geographically def<strong>in</strong>ed beef cattle production systems <strong>in</strong> the southern Australian<br />
state of New South Wales (NSW) where cattle are predom<strong>in</strong>antly raised <strong>in</strong> mixed (i.e. livestock and<br />
cropp<strong>in</strong>g) farm<strong>in</strong>g systems. The six systems (Table 1) were selected <strong>in</strong> order to be diverse <strong>in</strong> farm practice<br />
(grass and feedlot f<strong>in</strong>ish<strong>in</strong>g), product (12-15 month old yearl<strong>in</strong>g cattle to 24-36 month old heavy steers),<br />
environment (high-ra<strong>in</strong>fall coastal to semi-arid <strong>in</strong>land) and local water stress (as def<strong>in</strong>ed by the WSI of Pfister<br />
<strong>et</strong> al., 2009). The system boundary was from cradle to farm gate and <strong>in</strong>cluded all of the direct farm<strong>in</strong>g<br />
<strong>in</strong>puts (<strong>in</strong>clud<strong>in</strong>g replacement heifers and bulls), but excluded capital items such as mach<strong>in</strong>ery, build<strong>in</strong>gs and<br />
other <strong>in</strong>frastructure. The functional unit was 1 kg live weight (LW) of beef cattle at the po<strong>in</strong>t of sale to the<br />
processor. Life cycle <strong>in</strong>ventory data predom<strong>in</strong>antly came from farm enterprise budg<strong>et</strong>s compiled by the<br />
NSW government as a plann<strong>in</strong>g tool to assist farmers to evaluate bus<strong>in</strong>ess options. These budg<strong>et</strong>s are regarded<br />
as be<strong>in</strong>g realistic and achievable by most professional farmers with good management practices. Further<br />
d<strong>et</strong>ails are described <strong>in</strong> Ridoutt <strong>et</strong> al., (<strong>2012</strong>).<br />
Table 1. Summary of the six geographically-def<strong>in</strong>ed beef cattle production systems a<br />
Production system<br />
Ma<strong>in</strong> product b Location<br />
Mean max<br />
Temp (°C)<br />
Ra<strong>in</strong>fall<br />
(mm yr -1 )<br />
WSIc<br />
Japanese ox – grass-fed<br />
steers<br />
JOS 24-36 mth old steers, 340 kg DW Scone 24.1 644 0.032<br />
EU cattle EUP 24-30 mth old steers, 280-300 kg DW Parkes 23.4 584 0.815<br />
Inland weaners, IGF 24 mth old steers, 585 kg LW Walg<strong>et</strong>t 26.9 477 0.021<br />
grass fattened and<br />
Gunnedah 26.0 619 0.021<br />
feedlot f<strong>in</strong>ished<br />
Quir<strong>in</strong>di 24.6 683 0.021<br />
North coast weaners, NGF 24 mth old steers, 585 kg LW Cas<strong>in</strong>o 26.7 1096 0.012<br />
grass fattened and<br />
Glen Innes 19.4 849 0.021<br />
feedlot f<strong>in</strong>ished<br />
Rangers Valley 19.4 849 0.021<br />
Yearl<strong>in</strong>g YG 12-15 mth old yearl<strong>in</strong>g, 185-205 kg DW Gundagai 22.3 713 0.815<br />
Yearl<strong>in</strong>g YB 12-15 mth old yearl<strong>in</strong>g, 185-205 kg DW Bathurst 19.8 635 0.021<br />
a b<br />
Based on data presented <strong>in</strong> Ridoutt <strong>et</strong> al., (<strong>2012</strong>), DW: dressed weight or dressed carcass weight after removal of hide, head, fe<strong>et</strong>,<br />
tail and <strong>in</strong>ternal organs; LW: live weight; c WSI: Water Stress Index (Pfister <strong>et</strong> al., 2009).<br />
2.2. Carbon footpr<strong>in</strong>t modell<strong>in</strong>g<br />
The carbon footpr<strong>in</strong>t modell<strong>in</strong>g is described <strong>in</strong> d<strong>et</strong>ail elsewhere (Ridoutt <strong>et</strong> al., 2011). In summary, the<br />
calculation of GHG emissions from livestock enteric fermentation, manure and ur<strong>in</strong>e followed the country<br />
600
PARALLEL SESSION 7B: BEEF PRODUCTION SYSTEMS 8 th Int. Conference on <strong>LCA</strong> <strong>in</strong> the<br />
Agri-<strong>Food</strong> Sector, 1-4 Oct <strong>2012</strong><br />
specific IPCC Tier 2 approach used <strong>in</strong> Australia’s national GHG <strong>in</strong>ventory, tak<strong>in</strong>g <strong>in</strong>to account herd structure<br />
on a daily time step, feed quality and growth rate. The Australian national GHG <strong>in</strong>ventory m<strong>et</strong>hods were<br />
also applied <strong>in</strong> relation to emissions from agricultural soils as a result of <strong>in</strong>organic nitrogen fertiliser application<br />
and the residue of cultivated legum<strong>in</strong>ous pastures. Recent land use change (deforestation) was not a<br />
feature of any of the systems and possible changes <strong>in</strong> soil carbon were ignored due to a lack of relevant data.<br />
Data relat<strong>in</strong>g to GHG emissions associated with electricity, fuels (used on farm and <strong>in</strong> transportation processes),<br />
fertiliser production, supplementary feeds (gra<strong>in</strong>, pasture hay and feedlot ration) and v<strong>et</strong>er<strong>in</strong>ary products<br />
were obta<strong>in</strong>ed from various Australian database sources. To calculate the carbon footpr<strong>in</strong>t, the latest<br />
100-year global warm<strong>in</strong>g potentials for GHGs published by the IPCC were used.<br />
2.3. Water footpr<strong>in</strong>t modell<strong>in</strong>g<br />
The water footpr<strong>in</strong>t modell<strong>in</strong>g was based on consumptive water use only, as a recently developed m<strong>et</strong>hod<br />
<strong>in</strong>tegrat<strong>in</strong>g consumptive and degradative water use <strong>in</strong>to a s<strong>in</strong>gle <strong>in</strong>dicator was not available at the time (Ridoutt<br />
and Pfister, <strong>2012</strong>). A compl<strong>et</strong>e description of the water flows quantified is presented <strong>in</strong> Ridoutt <strong>et</strong> al.,<br />
(<strong>2012</strong>). In summary, the <strong>in</strong>ventory <strong>in</strong>cluded flows from surface and groundwater <strong>in</strong>to the farm<strong>in</strong>g system to<br />
irrigate pastures as well as crops used for supplemental feed<strong>in</strong>g on farm and <strong>in</strong> the feedlot. Secondly, it <strong>in</strong>cluded<br />
the reduction <strong>in</strong> flows from the farm<strong>in</strong>g land base to surface and groundwater as a result of the operation<br />
of farm dams used for livestock water<strong>in</strong>g. Thirdly, it <strong>in</strong>cluded direct water use <strong>in</strong> feedlot operations.<br />
F<strong>in</strong>ally, it <strong>in</strong>cluded water use associated with the production of <strong>in</strong>puts to the farm<strong>in</strong>g and feedlot operations.<br />
The <strong>in</strong>dicator results, <strong>in</strong> the units L H2Oe, were calculated by multiply<strong>in</strong>g each spatially differentiated <strong>in</strong>stance<br />
of water use by the locally relevant WSI and divid<strong>in</strong>g by the global average WSI (0.602).<br />
2.4. Land use footpr<strong>in</strong>t modell<strong>in</strong>g<br />
For each beef cattle production system, an <strong>in</strong>ventory of geographically-def<strong>in</strong>ed agricultural land use was<br />
compiled. The land use types were unimproved pasture, non-irrigated improved pasture, irrigated improved<br />
pasture and cropland. The <strong>in</strong>ventory excluded land use associated with the built environment (e.g. roads,<br />
factories) and land use associated with the extraction of resources from nature (e.g. m<strong>in</strong><strong>in</strong>g of rock phosphate,<br />
extraction of oil). Land use was expressed <strong>in</strong> the unit m 2 .yr, tak<strong>in</strong>g <strong>in</strong>to consideration the duration of<br />
occupation. Land was considered to be occupied if it was unavailable for other productive purposes. As such,<br />
s<strong>in</strong>gle cropp<strong>in</strong>g systems, which are prevalent <strong>in</strong> Australia, were deemed to occupy the land for the compl<strong>et</strong>e<br />
year, even if production only occurred dur<strong>in</strong>g part of the year. The <strong>in</strong>ventory did not <strong>in</strong>clude situations of<br />
multiple land use, such as mixed graz<strong>in</strong>g of livestock, recreation and timber production, mean<strong>in</strong>g that land<br />
use was compl<strong>et</strong>ely attributed to agricultural production. On the basis that biodiversity is largely reduced by<br />
<strong>in</strong>tensive agricultural production systems (Pfister <strong>et</strong> al., 2011), no attempt was made to describe the rema<strong>in</strong><strong>in</strong>g<br />
ecological value of the land.<br />
For land use footpr<strong>in</strong>t<strong>in</strong>g, the n<strong>et</strong> primary productivity of potential biomass (NPP0, g C.m -2 .yr -1 ) was used<br />
to describe the <strong>in</strong>tr<strong>in</strong>sic productive quality of land. Our reason<strong>in</strong>g is that the occupation of high-NPP0 land<br />
exerts more pressure on global land resources than the occupation of low-NPP0 land. This is obviously a<br />
simplification as factors <strong>in</strong> addition to NPP0 d<strong>et</strong>erm<strong>in</strong>e the desirability of land <strong>in</strong> terms of human development.<br />
However, NPP0 is a useful start<strong>in</strong>g po<strong>in</strong>t and it is an objective measure for which global datas<strong>et</strong>s exist.<br />
Land use footpr<strong>in</strong>t <strong>in</strong>dicator results were calculated by multiply<strong>in</strong>g each spatially-differentiated <strong>in</strong>stance of<br />
land use (m 2 .yr) by the relevant NPP0 associated with each land use type <strong>in</strong> each area, and divid<strong>in</strong>g by the<br />
global average NPP0. The <strong>in</strong>dicator results were expressed <strong>in</strong> the reference unit m 2 .yr-e, where 1 m 2 .yr-e<br />
represents 1 m 2 of land occupation for 1 year at the global average potential n<strong>et</strong> primary productivity. To<br />
perform the assessment, land use maps were obta<strong>in</strong>ed from the Australian Government Bureau of Rural Sciences<br />
(resolution 1 km) and NPP0 values at a resolution of 5 arc m<strong>in</strong> were obta<strong>in</strong>ed from Haberl <strong>et</strong> al.,<br />
(2007).<br />
2.5. Normalisation<br />
To assist <strong>in</strong> <strong>in</strong>terpr<strong>et</strong>ation of the life cycle impact category <strong>in</strong>dicator results, normalisation was performed,<br />
which is the step <strong>in</strong>volv<strong>in</strong>g comparison of <strong>in</strong>dicator results to a common reference situation. In this study, the<br />
chosen reference was the global economic system <strong>in</strong> the years 1995-2000 and results are reported <strong>in</strong> person<br />
equivalents. The land use footpr<strong>in</strong>t of humanity was calculated us<strong>in</strong>g data reported <strong>in</strong> Haberl <strong>et</strong> al., (2007)<br />
and Erb <strong>et</strong> al., (2007). To be consistent with the m<strong>et</strong>hod of calculation of land use footpr<strong>in</strong>ts described above<br />
601
PARALLEL SESSION 7B: BEEF PRODUCTION SYSTEMS 8 th Int. Conference on <strong>LCA</strong> <strong>in</strong> the<br />
Agri-<strong>Food</strong> Sector, 1-4 Oct <strong>2012</strong><br />
(Section 2.4), the cropland, <strong>in</strong>frastructure and graz<strong>in</strong>g land of suitability class 1 (highly productive graz<strong>in</strong>g<br />
land) land use classes were deemed to be fully occupied (i.e. effectively unavailable for other productive<br />
uses). In contrast, the forestry and graz<strong>in</strong>g lands of poorer suitability were deemed to be multiple-use and<br />
occupied <strong>in</strong> proportion to the fraction of NPP0 appropriated. As such, humanity’s land use footpr<strong>in</strong>t was assessed<br />
at 3.92E+13 m 2 .yr-e, or 6.40E+03 m 2 .yr-e per <strong>in</strong>habitant, <strong>in</strong> the year 2000 (Table 2). To avoid possible<br />
misunderstand<strong>in</strong>g, it is stressed that our land use footpr<strong>in</strong>t is a measure of land occupation, not human<br />
appropriation of n<strong>et</strong> primary production.<br />
Table 2. Normalisation factors used <strong>in</strong> this study.<br />
Indicator Unit Factor Year Reference<br />
Carbon footpr<strong>in</strong>t kg CO2-e person -1 yr -1 6.83E+03 2000 Sleeswijk <strong>et</strong> al., 2008<br />
Water footpr<strong>in</strong>t L H2O-e person -1 yr -1 6.73E+05 1995 Ridoutt and Pfister, 2010b<br />
Land use footpr<strong>in</strong>t m 2 .yr-e person -1 yr -1 6.40E+03 2000 Haberl <strong>et</strong> al., 2007; Erb <strong>et</strong> al., 2007<br />
3. Results<br />
3.1. Land use <strong>in</strong>ventory results<br />
The life cycle (cradle to farm gate) agricultural land use associated with the six beef cattle production systems<br />
varied from 64.0 to 121.1 m 2 .yr/kg LW. However, this land use cannot be directly compared as the<br />
proportions of unimproved and improved pasture and cropland varied (Table 3). The land use quality, as<br />
described by the n<strong>et</strong> primary productivity of potential biomass, also varied, from a high of 944 g C.m 2 .yr -1<br />
(high ra<strong>in</strong>fall coastal cropland) to a low of 355 g C.m 2 .yr -1 (semi-arid unimproved pastureland).<br />
Table 3. Land use <strong>in</strong>ventory results (m 2 .yr per kg live weight at farm gate) for 6 diverse beef cattle production<br />
systems <strong>in</strong> southern Australia.<br />
JOS EUP IGF NGF YG YB<br />
Pasture-unimproved 93.6 0 77.3 69.2 0 0<br />
Pasture-improved, non-irrigated 21.1 69.1 17.2 14.2 62.9 64.0<br />
Pasture-improved, irrigated 0.6 0 0.2
PARALLEL SESSION 7B: BEEF PRODUCTION SYSTEMS 8 th Int. Conference on <strong>LCA</strong> <strong>in</strong> the<br />
Agri-<strong>Food</strong> Sector, 1-4 Oct <strong>2012</strong><br />
normalised results (Table 4), the land use footpr<strong>in</strong>t results were approximately 10 times the carbon footpr<strong>in</strong>t<br />
results (range 9 to 18 times) and approximately 1000 times the water footpr<strong>in</strong>t results (range 39 to 2850).<br />
4. Discussion<br />
This study has highlighted the importance of land use <strong>in</strong> beef cattle production <strong>in</strong> southern Australia, with<br />
the production of 1 kg of animal live weight requir<strong>in</strong>g 1.3 to 2.7% of an average global citizen’s annual land<br />
use footpr<strong>in</strong>t (Table 4). For 1 kg of r<strong>et</strong>ail beef, this equates to b<strong>et</strong>ween 3 and 7% of an average global citizen’s<br />
annual land use footpr<strong>in</strong>t. Globally, the livestock sector is a major land user, estimated to occupy<br />
around 30% of the world’s land surface (Ste<strong>in</strong>feld <strong>et</strong> al., 2006). However, it is important to recognize that the<br />
land base support<strong>in</strong>g livestock production is diverse, <strong>in</strong>clud<strong>in</strong>g high productivity crop and pasture land as<br />
well as large areas of low productivity and non arable land. As such, the land use footpr<strong>in</strong>t calculation<br />
m<strong>et</strong>hod demonstrated <strong>in</strong> this paper, which takes <strong>in</strong>to account the NPP0 of the land used <strong>in</strong> production, is considered<br />
a b<strong>et</strong>ter <strong>in</strong>dicator of the pressure on global land resources than an assessment based on land area<br />
alone. This is particularly important <strong>in</strong> evaluat<strong>in</strong>g alternative livestock production systems as globally there<br />
is expansion <strong>in</strong> <strong>in</strong>dustrialised systems utiliz<strong>in</strong>g high nutrition feeds such as gra<strong>in</strong>s and oilseeds (de Haan <strong>et</strong><br />
al., 2010). The land base support<strong>in</strong>g livestock production is therefore <strong>in</strong> transition toward greater dedicated<br />
use of high productivity cropland.<br />
However, the NPP0 basis for assess<strong>in</strong>g land quality is not compl<strong>et</strong>ely satisfy<strong>in</strong>g. Firstly, there are additional<br />
factors which d<strong>et</strong>erm<strong>in</strong>e the productive capability of land. For example, a global assessment of land<br />
capability by Fischer <strong>et</strong> al., (2001) found that 12% of land is severely constra<strong>in</strong>ed for crop cultivation by<br />
slope and 65% by unfavourable soil quality. The NPP0 values used <strong>in</strong> this study, taken from Haberl <strong>et</strong> al.,<br />
(2007), <strong>in</strong>corporated climatic factors and a soil-type classification, but the spatial resolution of soil type<br />
(0.5 o , approx 60 km at the equator) is too coarse to describe much of the variation at the farm level which<br />
<strong>in</strong>fluences enterprise decision mak<strong>in</strong>g for mixed farm systems <strong>in</strong> Australia. The second issue concerns the<br />
potential substitutability of one land use with another, which is <strong>in</strong>compl<strong>et</strong>ely described by NPP0. Some pasture<br />
land may have high NPP0, but have poor suitability for cropp<strong>in</strong>g, and therefore should not be regarded as<br />
contribut<strong>in</strong>g to global pressure on arable land resources. On a global scale, NPP0 and crop yield are poorly<br />
correlated (West <strong>et</strong> al., 2010). NPP0 is highest <strong>in</strong> the tropics whereas the highest crop yields are generally<br />
found <strong>in</strong> temperate regions. In addition, sequences of legume-based pastures can offer benefits to crops, such<br />
as improved soil fertility and disease break for cereal root pathogens (Jensen <strong>et</strong> al., <strong>2012</strong>). Thirdly, a simplified<br />
NPP0 based approach to land use footpr<strong>in</strong>t<strong>in</strong>g has the potential to encourage excessive land use <strong>in</strong>tensification<br />
and land degradation, which is another way of <strong>in</strong>creas<strong>in</strong>g pressure on the earth’s land resources. These<br />
and other issues po<strong>in</strong>t to the need for further development of the land use footpr<strong>in</strong>t <strong>in</strong>dicator.<br />
5. Conclusion<br />
Land resources are currently under stress, and with a world population <strong>in</strong>creas<strong>in</strong>g toward 9 billion <strong>in</strong>habitants,<br />
the <strong>in</strong>creased demand for food, fibre, and <strong>in</strong>creas<strong>in</strong>gly biofuel, must be m<strong>et</strong> <strong>in</strong> ways which do not lead<br />
to cont<strong>in</strong>u<strong>in</strong>g loss of natural ecosystems and expand<strong>in</strong>g land degradation. An <strong>LCA</strong>-based land use footpr<strong>in</strong>t<br />
<strong>in</strong>dicator could help <strong>in</strong> understand<strong>in</strong>g the <strong>in</strong>cremental pressure on land resources of agri-food production<br />
systems and consumption patterns, and enable the assessment of tradeoffs with GHG emissions and water<br />
use. While NPP0 is an objective measure of the <strong>in</strong>tr<strong>in</strong>sic productive capability of land and can be used to<br />
improve land use assessment beyond a simple measure of land area alone, further development of the land<br />
use footpr<strong>in</strong>t <strong>in</strong>dicator is recommended.<br />
6. References<br />
Bos, U., Beck, T., L<strong>in</strong>der, J.P., Wittstock, B. <strong>2012</strong>. Land use impact assessment of ecosystem services accord<strong>in</strong>g to LANCA. Special<br />
Forum on Global Land Use Impacts on Biodiversity and Ecosystem Services <strong>in</strong> <strong>LCA</strong> with<strong>in</strong> the framework of the UNEP/SETAC<br />
Life Cycle Initiative, Brussels, Feb 17, <strong>2012</strong>.<br />
Brandão, M., Milà i Canals, L., <strong>2012</strong>. Global characterisation factors to assess land use impacts on biotic production. Int. J. Life<br />
Cycle Assess. DOI 10.1007/s11367-012-0381-3.<br />
de Baan, L., Alkemade, R., Koellner, T., <strong>2012</strong>. Land use impacts on biodiversity <strong>in</strong> <strong>LCA</strong>: a global approach. Int. J. Life Cycle Assess.<br />
DOI 10.1007/s11367-012-0412-0.<br />
de Haan, C., Gerber, P., Opio, C., 2010. Structural change <strong>in</strong> the livestock sector, <strong>in</strong>: Ste<strong>in</strong>feld, H., Mooney, H.A., Schneider, F.,<br />
Neville, L.E. (Eds.), Livestock <strong>in</strong> a Chang<strong>in</strong>g Landscape. Island Press, London, pp. 35-66.<br />
de Souza, D.M., Flynn, D., Koellner, T., <strong>2012</strong>. Land use impacts on functional species diversity: proposal of characterization factors<br />
to assess effects on ecosystem processes. Special Forum on Global Land Use Impacts on Biodiversity and Ecosystem Services <strong>in</strong><br />
<strong>LCA</strong> with<strong>in</strong> the framework of the UNEP/SETAC Life Cycle Initiative, Brussels, 17 th February <strong>2012</strong>.<br />
Erb, K.H., Gaube, V., Krausmann, F., Plutzar, C., Bondeau, A., Haberl, H., 2007. A comprehensive global 5 m<strong>in</strong> resolution land-use<br />
603
PARALLEL SESSION 7B: BEEF PRODUCTION SYSTEMS 8 th Int. Conference on <strong>LCA</strong> <strong>in</strong> the<br />
Agri-<strong>Food</strong> Sector, 1-4 Oct <strong>2012</strong><br />
data s<strong>et</strong> for the year 2000 consistent with national census data. J. Land Use Sci. 2, 191-224.<br />
F<strong>in</strong>kbe<strong>in</strong>er, M., 2009. Carbon footpr<strong>in</strong>t<strong>in</strong>g—Opportunities and threats. Int. J. Life Cycle Assess. 14, 91-94.<br />
Fischer, G., Shah, M., van Velthuizen, H., Nachtergaele, F.O., 2001. Global Agro-ecological Assessment for Agriculture <strong>in</strong> the 21 st<br />
Century. International Institute for Applied Systems Analysis, Laxenburg, Austria.<br />
Haberl, H., Erb, K.H., Krausmann, F., Gaube, V., Bondeau, A., Plutzar, C., G<strong>in</strong>grich, S., Lucht, W., Fischer-Kowalski, M., 2007.<br />
Quantify<strong>in</strong>g and mapp<strong>in</strong>g the human appropriation of n<strong>et</strong> primary production <strong>in</strong> earth’s terrestrial ecosystems. Proc. Natl. Acad.<br />
Sci. USA 104, 12942-12947.<br />
Jensen, E.S., Peoples, M.B., Boddey, R.M., Gresshoff, P.M., Hauggaard-Nielsen, H., Alves, B.J.R., Morrison, M.J., <strong>2012</strong>. Legumes<br />
for mitigation of climate change and the provision of feedstocks for biofuels and bioref<strong>in</strong>eries: A review. Agron. Susta<strong>in</strong>. Dev.<br />
32, 329-364.<br />
Müller-Wenk, R., Brandão, M., 2010. Climatic impact of land use <strong>in</strong> <strong>LCA</strong>: Carbon transfers b<strong>et</strong>ween veg<strong>et</strong>ation/soil and air. Int. J.<br />
Life Cycle Assess. 15, 172-182.<br />
Pfister, S., Bayer, P., Koehler, A., Hellweg, S., 2011. Environmental impacts of water use <strong>in</strong> global crop production: Hotspots and<br />
trade-offs with land use. Environ. Sci. Technol. 45, 5761-5768.<br />
Pfister, S., Koehler, A., Hellweg, S., 2009. Assess<strong>in</strong>g the environmental impacts of freshwater consumption <strong>in</strong> <strong>LCA</strong>. Environ. Sci.<br />
Technol. 43, 4098-4104.<br />
Ridoutt, B.G., 2011. Development and application of a water footpr<strong>in</strong>t m<strong>et</strong>ric for agricultural products and the food <strong>in</strong>dustry, <strong>in</strong>:<br />
F<strong>in</strong>kbe<strong>in</strong>er, M. (Ed.), Towards Life Cycle Susta<strong>in</strong>ability Management. Spr<strong>in</strong>ger, Dordrecht, pp. 183-192.<br />
Ridoutt, B.G., Pfister, S., 2010a. A revised approach to water footpr<strong>in</strong>t<strong>in</strong>g to make transparent the impacts of consumption and production<br />
on global freshwater scarcity. Glob. Environ. Change 20, 113-120.<br />
Ridoutt, B.G., Pfister, S., 2010b. Reduc<strong>in</strong>g humanity’s water footpr<strong>in</strong>t. Environ. Sci. Technol. 44, 6019-6021.<br />
Ridoutt, B.G., Pfister, S., <strong>2012</strong>. A new water footpr<strong>in</strong>t calculation m<strong>et</strong>hod <strong>in</strong>tegrat<strong>in</strong>g consumptive and degradative water use <strong>in</strong>to a<br />
s<strong>in</strong>gle stand-alone weighted <strong>in</strong>dicator. Int. J. Life Cycle Assess. (<strong>in</strong> press).<br />
Ridoutt, B.G., Sanguansri, P., Freer, M., Harper, G., <strong>2012</strong>. Water footpr<strong>in</strong>t of livestock: Comparison of six geographically-def<strong>in</strong>ed<br />
beef production systems. Int. J. Life Cycle Assess. 17, 165-175.<br />
Ridoutt, B.G., Sanguansri, P., Harper, G.S., 2011. Compar<strong>in</strong>g carbon and water footpr<strong>in</strong>ts for beef cattle production <strong>in</strong> southern<br />
Australia. Susta<strong>in</strong>. 3, 2443-2455.<br />
Saad, R., Margni, M., Koellner, T., Wittstock, B., Deschênes, L., 2011. Assessment of land use impacts on soil ecological functions:<br />
development of spatially differentiated characterization factors with<strong>in</strong> a Canadian context. Int. J. Life Cycle Assess. 16, 198-211.<br />
Saad, R., Koellner, T, Margni, M., <strong>2012</strong>. Land use impacts on freshwater and erosion regulation and water purification: A spatial<br />
approach for a global scale level. Int. J. Life Cycle Assess. (<strong>in</strong> press).<br />
Sleeswijk, A.W., van Oers, L.F.C.M., Gu<strong>in</strong>ée, J.B., Struijs, J., Huijbregts, M.A.J., 2008. Normalisation <strong>in</strong> product life cycle assessment:<br />
An <strong>LCA</strong> of the global and European economic systems <strong>in</strong> the year 2000. Sci. Total Environ. 390, 227-240.<br />
Ste<strong>in</strong>feld, H., Gerber, P., Wassenaar, T., Castel, V., Rosales, M., de Haan, C., 2006. Livestock’s Long Shadow: Environmental Issues<br />
and Options. FAO, Rome.<br />
Weidema, B.P., Thrane, M., Christensen, P., Schmidt, J., Løkke, S., 2008. Carbon footpr<strong>in</strong>t: A catalyst for life cycle assessment? J.<br />
Ind. Ecol. 12, 3-6.<br />
West, P.C., Gibbs, H.K., Monfreda, C., Wagner, J., Barford, C.C., Carpenter, S.R., Foley, J.A., 2010. Trad<strong>in</strong>g carbon for food:<br />
Global comparison of carbon stocks vs. crop yields on agricultural land. Proc. Natl. Acad. Sci. USA 107, 19645-19648.<br />
604
PARALLEL SESSION 7B: BEEF PRODUCTION SYSTEMS 8 th Int. Conference on <strong>LCA</strong> <strong>in</strong> the<br />
Agri-<strong>Food</strong> Sector, 1-4 Oct <strong>2012</strong><br />
Effect of farm<strong>in</strong>g practices for greenhouse gas mitigation and<br />
subsequent alternative land-use on environmental impacts of beefcattle<br />
production systems<br />
T.T.H. Nguyen 1,2,3,4,* , M. Doreau 1 , M. Eugène 1 , M.S. Corson 2,3 , F. Garcia-Launay 1,3,5 , G. Chesneau 4 , H.M.G.<br />
van der Werf 2,3<br />
1 INRA / V<strong>et</strong>agro Sup, UMR1213 Herbivores, 63122 Sa<strong>in</strong>t-Genès-Champanelle, <strong>France</strong><br />
2 INRA, UMR1069 Soil Agro and hydroSystem, 35000 Rennes, <strong>France</strong><br />
3 Agrocampus Ouest, 35000 Rennes, <strong>France</strong><br />
4 Valorex, La Messayais, 35210 Combourtillé, <strong>France</strong><br />
5 INRA, UMR1348 Physiology, Environment and Gen<strong>et</strong>ics for Animals and Livestock Systems, 35590 Sa<strong>in</strong>t-Gilles, <strong>France</strong><br />
ABSTRACT<br />
This study evaluated effects of farm<strong>in</strong>g-practice scenarios aim<strong>in</strong>g to reduce greenhouse gas (GHG) emissions and alternative landuse<br />
on environmental impacts of a beef-cattle production system. Farm<strong>in</strong>g-practice scenarios modified an element of grassland management,<br />
herd management or di<strong>et</strong>, as well as a s<strong>et</strong> of simultaneous compatible practices. The most promis<strong>in</strong>g practice was a comb<strong>in</strong>ation<br />
of several scenarios (reduction of impacts by 13-28% per kg of carcass), followed by advanc<strong>in</strong>g first calv<strong>in</strong>g age from 3 to 2<br />
years (reduction by 8-10%). For other scenarios, impact reduction did not exceed 5%, except for eutrophication (11%) and land<br />
occupation (10%). Some scenarios resulted <strong>in</strong> reduction of permanent grassland area and land occupation per kg of carcass. If this<br />
permanent grassland were converted to forest, climate change impact could be reduced by 20-48%. These results illustrate the potential<br />
of farm<strong>in</strong>g practices and forest as an alternative land use to contribute to GHG mitigation of beef production systems.<br />
Keywords: beef cattle, farm<strong>in</strong>g-practices, alternative land-use, environmental impacts, life cycle assessment<br />
1. Introduction<br />
Greenhouse gas (GHG) emissions are a major concern for livestock production worldwide, <strong>in</strong> particular<br />
rum<strong>in</strong>ant production (Ste<strong>in</strong>feld <strong>et</strong> al., 2006). Numerous GHG mitigation strategies for rum<strong>in</strong>ant production<br />
have focused on a s<strong>in</strong>gle GHG such as enteric m<strong>et</strong>hane (CH4) or nitrous oxide (N2O) (Mart<strong>in</strong> <strong>et</strong> al., 2010;<br />
Eckard <strong>et</strong> al., 2010). Measures to enhance carbon (C) sequestration <strong>in</strong> the soil have also been identified<br />
(Dawson and Smith, 2007). However, it is critical to ensure that there is a n<strong>et</strong> reduction <strong>in</strong> GHG emissions of<br />
the whole production system when such measures are implemented (Beauchem<strong>in</strong> <strong>et</strong> al., 2011), i.e. that a<br />
reduction <strong>in</strong> on-farm GHG emissions is not compensated by an <strong>in</strong>crease <strong>in</strong> off-farm GHG emissions due to<br />
imported feed. Therefore, these measures need to be assessed at the scale of the entire production system.<br />
Besides GHG emissions, other environmental impacts such as energy use, eutrophication and land-use impacts<br />
may be of major importance depend<strong>in</strong>g on the local or regional context (Ste<strong>in</strong>feld <strong>et</strong> al., 2010).<br />
The present study analysed the effects of farm<strong>in</strong>g practices aim<strong>in</strong>g to reduce GHG emissions of beefcattle<br />
production systems on their environmental impacts us<strong>in</strong>g the life cycle assessments approach. The<br />
basel<strong>in</strong>e beef production scenario, described by Nguyen <strong>et</strong> al., (<strong>2012</strong>), reflected the current farm characteristics,<br />
management practices by farmers of Charolais beef cattle <strong>in</strong> <strong>France</strong>. Alternative land-use was assessed<br />
by assum<strong>in</strong>g that any permanent grassland becom<strong>in</strong>g available due to more efficient farm<strong>in</strong>g practices was<br />
converted to even-aged forest. Eight scenarios were assessed, as well as the sum of all compatible scenarios.<br />
2. Materials and m<strong>et</strong>hods<br />
2.1. System boundaries<br />
Life cycle assessments of beef-cattle production systems were conducted from cradle to farm-gate for a<br />
one-year period, i.e. <strong>in</strong>clud<strong>in</strong>g the production and delivery of <strong>in</strong>puts used for grassland and cereals produced<br />
on-farm and for feed produced off-farm, herd management and associated upstream processes, emissions<br />
from the animals and manure storage. Environmental burdens from the application of manure for cereals and<br />
pasture were <strong>in</strong>cluded, as were those from build<strong>in</strong>gs. V<strong>et</strong>er<strong>in</strong>ary medic<strong>in</strong>es were excluded due to lack of<br />
data. The impacts, i.e. climate change (CC, exclud<strong>in</strong>g and <strong>in</strong>clud<strong>in</strong>g the effects of land use and land-use<br />
change (LULUC)), cumulative energy demand (CED), eutrophication (EP) and land occupation (LO), of<br />
different farm<strong>in</strong>g-practice scenarios were compared per 1 kg of carcass mass at the farm exit and per 1 ha of<br />
(on-farm and off-farm) land occupied. Per 1 kg of carcass mass, if farm<strong>in</strong>g practices reduced permanent<br />
grassland occupation, this released land was converted to fast-grow<strong>in</strong>g conifer even-aged forest as an alternative<br />
land-use to <strong>in</strong>crease the amount of C sequestered by the beef system. Plant<strong>in</strong>g and ma<strong>in</strong> management<br />
stages were from Corsican p<strong>in</strong>e (P<strong>in</strong>us nigra subsp. laricio) and amortized over 64 years (Vall<strong>et</strong> <strong>et</strong> al., 2009).<br />
605
PARALLEL SESSION 7B: BEEF PRODUCTION SYSTEMS 8 th Int. Conference on <strong>LCA</strong> <strong>in</strong> the<br />
Agri-<strong>Food</strong> Sector, 1-4 Oct <strong>2012</strong><br />
2.2. Description of basel<strong>in</strong>e of beef-production system<br />
The basel<strong>in</strong>e beef-production system (correspond<strong>in</strong>g to system St-SM described <strong>in</strong> Nguyen <strong>et</strong> al., (<strong>2012</strong>))<br />
comprised a cow-calf herd and a bull-fatten<strong>in</strong>g herd. The cow-calf herd <strong>in</strong>cluded 70 cows that produced 62<br />
weaned calves each year. These cows had their first calv<strong>in</strong>g at 3 years, and each provided a mean of 4.4<br />
calves over their lif<strong>et</strong>imes. All weaned female calves were reared as heifers (3% mortality) used for replacement<br />
cows until 27 months. Of the 30 heifers thus produced, 14 were not selected for replacement and were<br />
fattened <strong>in</strong> pasture complemented with cereals and slaughtered at 33 months. Cull cows were f<strong>in</strong>ished for<br />
100 days before be<strong>in</strong>g sent to the slaughterhouse. One male calf was selected to replace the breed<strong>in</strong>g bull,<br />
and the rest were sent to the bull-fatten<strong>in</strong>g herd at 11 months.<br />
The cow-calf herd ration was ma<strong>in</strong>ly based on grassland with 1.2 livestock units (LU) per ha of grassland<br />
and 7.5 months of graz<strong>in</strong>g. One LU is def<strong>in</strong>ed as an animal that consumes 5 t dry matter (DM)/year. We<br />
assumed that permanent grassland did not require till<strong>in</strong>g and sow<strong>in</strong>g operations. Apart from manure excr<strong>et</strong>ed<br />
on pasture dur<strong>in</strong>g graz<strong>in</strong>g, permanent grassland was fertilised with m<strong>in</strong>eral and organic N-fertilisers (contribut<strong>in</strong>g<br />
28 and 27 kg/ha of N, respectively). Permanent grassland potential yield was 5.6 t DM/ha/year,<br />
23% of which was harvested as conserved forage (hay and/or wrapped grass-silage). Temporary grassland, a<br />
comb<strong>in</strong>ation of grasses and clover, had a higher potential yield (8.3 t DM/ha/year, 75% harvested as conserved<br />
forage) and was renewed every 5 years by tillage and seed<strong>in</strong>g. M<strong>in</strong>eral N-fertiliser for temporary<br />
grassland was applied at 33 kg/ha. Grass not harvested as conserved forage was available for <strong>in</strong>gestion by<br />
animals dur<strong>in</strong>g graz<strong>in</strong>g. For several reasons (selective graz<strong>in</strong>g, trampl<strong>in</strong>g of grass, unfavourable weather<br />
conditions), some of the grass grown is not <strong>in</strong>gested; this “loss” corresponded to 31.5% of grass DM available<br />
for graz<strong>in</strong>g. Losses dur<strong>in</strong>g conservation of both hay and wrapped grass-silage were assumed to be 6% of<br />
the <strong>in</strong>itial DM. Indoors <strong>in</strong> w<strong>in</strong>ter, the herd was fed hay and concentrates (ma<strong>in</strong>ly based on cereals produced<br />
on-farm and imported prote<strong>in</strong> supplement conta<strong>in</strong><strong>in</strong>g 30% soybean meal, 40% rapeseed meal and 30% sunflower<br />
meal).<br />
Male calves <strong>in</strong> the standard bull-fatten<strong>in</strong>g herd were fed a high-forage di<strong>et</strong> composed of 58% maize silage,<br />
24% wheat, 15% soybean meal, 2% hay, and 1% m<strong>in</strong>erals (DM basis), result<strong>in</strong>g <strong>in</strong> an average daily live<br />
weight ga<strong>in</strong> (ADG) of 1.40 kg. All rations were formulated to satisfy beef-cattle nutrient requirements accord<strong>in</strong>g<br />
to animal characteristics and feed-composition values, based on recommendations of INRA beef<br />
researchers and data tables (INRA, 2007). The carcass yields of fattened bulls, the breed<strong>in</strong>g bull, f<strong>in</strong>ished<br />
heifers and f<strong>in</strong>ished cull cows were 59%, 57%, 56% and 54%, respectively. M<strong>et</strong>hods used to produce feed<br />
<strong>in</strong>gredients and to estimate emissions from animals were described <strong>in</strong> Nguyen <strong>et</strong> al., (<strong>2012</strong>).<br />
2.3. Farm<strong>in</strong>g-practice scenarios<br />
Farm<strong>in</strong>g-practice scenarios (denoted S1 to S9) were designed to reduce GHG emissions of the beef-cattle<br />
production system. These practices are already applied by some farmers or can be applied without adverse<br />
effect on animal performances, based on experimental results. The use of these practices, both <strong>in</strong>dividually<br />
and simultaneously has been studied. When farm<strong>in</strong>g practice affected total feed requirements, the land area<br />
needed was adjusted to produce feed. Feed <strong>in</strong>gredients were produced by the same practices as <strong>in</strong> the basel<strong>in</strong>e<br />
scenarios.<br />
Grassland management (S1-S2)<br />
Scenario S1 assessed effects of decreas<strong>in</strong>g m<strong>in</strong>eral N-fertiliser from 28.0 to 18.5 kg/ha of permanent grassland.<br />
The yield of permanent grassland was not affected because current m<strong>in</strong>eral N-fertiliser application levels<br />
exceed the optimum level required for grass growth (Devun J., pers. comm.). Estimated nitrate losses<br />
were reduced from 20 to 14 kg N/ha.<br />
Scenario S2 evaluated effects of decreas<strong>in</strong>g grass losses (i.e. grass that is not <strong>in</strong>gested by the cows) on pasture<br />
from 31.5 to 16.5% (Devun J., pers. comm.). This reduction can be obta<strong>in</strong>ed by b<strong>et</strong>ter management of<br />
grassland, i.e. turn out to pasture as soon as possible, rotational graz<strong>in</strong>g, adjust animal density for graz<strong>in</strong>g<br />
dur<strong>in</strong>g dry season. Estimated nitrate losses were reduced from 20 to 14 kg N/ha.<br />
Herd management (S3-S5)<br />
Scenario S3 evaluated effects of fatten<strong>in</strong>g of female calves from 9 to 19 months <strong>in</strong>stead of rear<strong>in</strong>g them as<br />
heifers used for replacement and fatten<strong>in</strong>g them on pasture for 4 months until slaughter at 33 months. Four-<br />
606
PARALLEL SESSION 7B: BEEF PRODUCTION SYSTEMS 8 th Int. Conference on <strong>LCA</strong> <strong>in</strong> the<br />
Agri-<strong>Food</strong> Sector, 1-4 Oct <strong>2012</strong><br />
teen female calves after wean<strong>in</strong>g not selected for replacement were fattened (until 650 kg LW) with a di<strong>et</strong><br />
based on maize silage, result<strong>in</strong>g <strong>in</strong> an ADG of 1.15 kg.<br />
Scenario S4 evaluated effects of <strong>in</strong>creas<strong>in</strong>g longevity of cows from 7 to 9 years to provide a mean of 6.5<br />
calves per lif<strong>et</strong>ime <strong>in</strong>stead of 4.4 calves. As a consequence, the number of culled cows decreased (from 16 to<br />
13), and the number of heifers used for meat production <strong>in</strong>creased (from 14 to 17).<br />
Scenario S5 evaluated effects of decreas<strong>in</strong>g first calv<strong>in</strong>g age from 3 to 2 years simulated based on Farrié <strong>et</strong><br />
al., (2008). All female calves were reared to reach 467 kg LW (<strong>in</strong>stead of 405 kg) at 15 months for the first<br />
breed<strong>in</strong>g. Heifers not used for replacement at 15 months were fattened to slaughter at 23 months (about 670<br />
kg LW) <strong>in</strong>stead of 33 months (at 698 kg LW). Replacement rate was slightly lower (21.4%) than <strong>in</strong> the basel<strong>in</strong>e<br />
(23%) scenario; although these cows produced more calves (mean = 4.7 <strong>in</strong>stead of 4.4) per lif<strong>et</strong>ime, they<br />
were culled sooner (at 6 years and 780 kg LW <strong>in</strong>stead of at 7 years and 800 kg LW).<br />
Feed<strong>in</strong>g practices (S6-S8)<br />
Scenario S6 evaluated the effects of replac<strong>in</strong>g some prote<strong>in</strong> supplement with lucerne hay dur<strong>in</strong>g the w<strong>in</strong>ter.<br />
A portion of temporary grassland was used to produce lucerne hay, and the prote<strong>in</strong> supplement was decreased<br />
from 6.8 to 2.3 t. Lucerne hay contributed 12.4% of the total hay production.<br />
Scenario S7 evaluated effects of us<strong>in</strong>g rapeseed meal to replace soybean meal <strong>in</strong> the bull di<strong>et</strong>.<br />
Extruded l<strong>in</strong>seed was used <strong>in</strong> scenario S8 to replace a portion of concentrate (cereals and prote<strong>in</strong> supplement)<br />
<strong>in</strong> the cow-calf herd. Lipid content <strong>in</strong> di<strong>et</strong>s for animals was not to exceed 3% DM. Male calves were<br />
sent to the bull-fatten<strong>in</strong>g herd after wean<strong>in</strong>g (350 kg LW) and were fed with concentrate-based di<strong>et</strong> rich <strong>in</strong><br />
lipids (13% barley straw and 83% concentrate <strong>in</strong>clud<strong>in</strong>g 46% cereals and 6% extruded l<strong>in</strong>seed) result<strong>in</strong>g an<br />
ADG of 1.71 kg.<br />
Comb<strong>in</strong>ation of scenarios S1, S2, S4, S5 and S7 (S9)<br />
This scenario (S9) is the addition of five scenarios, which were compatible, and of which effects are expected<br />
to be additive: decrease <strong>in</strong> m<strong>in</strong>eral-N fertiliser (S1), <strong>in</strong> grass losses on pasture (S2), <strong>in</strong>crease <strong>in</strong> cow<br />
longevity (S4), decrease <strong>in</strong> age at first calv<strong>in</strong>g (S5) and replacement of soybean meal with rapeseed meal<br />
(S7).<br />
2.3. Alternative land use: fast-grow<strong>in</strong>g conifer even-aged forest<br />
An alternative land-use option was explored to reduce GHG emissions of the farm system. If farm<strong>in</strong>g<br />
practices reduced permanent grassland occupation per kg of carcass mass, this land area released due to more<br />
efficient farm<strong>in</strong>g practices was converted to a conifer even-aged forest, which is more attractive to farmers<br />
than deciduous hard-wood species, due to its faster growth. Corsican p<strong>in</strong>e was chosen because it is well<br />
adapted even on poor sites, provides good wood quality and has been successful <strong>in</strong> several French regions. It<br />
further may enhance on-farm biodiversity. We assumed a 64-year rotation, dur<strong>in</strong>g which the forest sequesters<br />
11.4 t CO2/ha/yr <strong>in</strong>to the veg<strong>et</strong>ation (Vall<strong>et</strong> <strong>et</strong> al., 2009). The ma<strong>in</strong> function of the forest with<strong>in</strong> the beeffarm<br />
system be<strong>in</strong>g C sequestration, we did not <strong>in</strong>clude the harvest of the trees (which would occur 64 years<br />
after plant<strong>in</strong>g), neither concern<strong>in</strong>g <strong>in</strong>puts required nor with respect to the products it would yield. We did<br />
<strong>in</strong>clude <strong>in</strong>puts required for the plantation of the forest and its management dur<strong>in</strong>g the establishment phase.<br />
3. Results and discussion<br />
3.1. Effects of farm<strong>in</strong>g practices on CC, CC/LULUC, CED, EP and AC<br />
Grassland management (S1-S2)<br />
Decreas<strong>in</strong>g m<strong>in</strong>eral N-fertiliser application to permanent grassland (S1) slightly decreased impacts of the<br />
whole system (reduction b<strong>et</strong>ween 1 and 2%), except for CED and EP (by 2.9 and 10.5%, Table 1), because<br />
its use was already low <strong>in</strong> the basel<strong>in</strong>e. It can, however, reduce production costs.<br />
Decreas<strong>in</strong>g grass loss on pasture (S2) did not affect CC/LULUC (reduction
PARALLEL SESSION 7B: BEEF PRODUCTION SYSTEMS 8 th Int. Conference on <strong>LCA</strong> <strong>in</strong> the<br />
Agri-<strong>Food</strong> Sector, 1-4 Oct <strong>2012</strong><br />
Fatten<strong>in</strong>g female calves <strong>in</strong>stead of rear<strong>in</strong>g them as replacement heifers (S3) slightly decreased CED, and<br />
decreased other impacts per kg carcass mass by 4-5%. This is due to their faster growth, result<strong>in</strong>g <strong>in</strong> less<br />
rear<strong>in</strong>g time before slaughter. Also, their enteric CH4 emissions were lower as they were fed with maize silage<br />
and concentrate <strong>in</strong>stead of ma<strong>in</strong>ly forage. As maize silage has a higher yield per ha than grass, the area<br />
of grassland used for the herd decreased. Even though this practice <strong>in</strong>creased the use of feed-crops, it can be<br />
considered as a potential climate change mitigation practice.<br />
Increas<strong>in</strong>g cow longevity (S4) slightly decreased impacts of the whole system, as the annual number of<br />
cull-cows decreased but that of f<strong>in</strong>ished heifers <strong>in</strong>creased. Us<strong>in</strong>g different allocation m<strong>et</strong>hods, Nguyen <strong>et</strong> al.,<br />
(<strong>2012</strong>) showed that impacts per kg carcass mass of f<strong>in</strong>ished heifers slaughtered at 33 months were higher<br />
than those of 7-year-old cull cows (except for mass allocation). In S5, impact reductions obta<strong>in</strong>ed by extension<br />
of cow lif<strong>et</strong>ime were compensated by high impacts of f<strong>in</strong>ished heifers. Beauchem<strong>in</strong> <strong>et</strong> al., (2011) observed<br />
a similar result for GHG emissions and argued that the additional beef produced had higher per-kg<br />
GHG emissions. This practice will mitigate impacts more if impacts of f<strong>in</strong>ished heifers could be reduced. It<br />
is possible that comb<strong>in</strong><strong>in</strong>g this practice with fatten<strong>in</strong>g female calves <strong>in</strong>stead of rear<strong>in</strong>g them as replacement<br />
heifers (S3) could reduce impacts of the entire system.<br />
Decreas<strong>in</strong>g calv<strong>in</strong>g age (S5) seems one of the most effective impact-mitigation strategies, as impacts decreased<br />
by 8-10% due to two effects. First, all heifers were reared at higher growth rates to reach m<strong>in</strong>imum<br />
body condition for first breed<strong>in</strong>g at 15 months and first calv<strong>in</strong>g at 24 months <strong>in</strong>stead of 27 and 36 months,<br />
respectively. In this way, one year of cow rear<strong>in</strong>g (6 <strong>in</strong>stead of 7 years) was saved without reduc<strong>in</strong>g reproductive<br />
yield per lif<strong>et</strong>ime. Second, heifers not used for replacement also grew faster, thus f<strong>in</strong>ish<strong>in</strong>g sooner<br />
(23 <strong>in</strong>stead of 33 months), reduc<strong>in</strong>g impacts of the whole production system (as expla<strong>in</strong>ed for S3). First calv<strong>in</strong>g<br />
at 2 years is the current practice <strong>in</strong> western Canada (Beauchem<strong>in</strong> <strong>et</strong> al., 2011). In <strong>France</strong>, first calv<strong>in</strong>g at<br />
2 years with the Charolais breed was begun <strong>in</strong> experimental farms and later implemented by some <strong>in</strong>novative<br />
farmers (Farrié <strong>et</strong> al., 2008). Chang<strong>in</strong>g first calv<strong>in</strong>g from 3 to 2 years for half of a Charolais herd improved<br />
profit when the number of calv<strong>in</strong>gs per cow was <strong>in</strong>creased by 5-10% (Farrié <strong>et</strong> al., 2008).<br />
Feed<strong>in</strong>g practices (S6-S8)<br />
The partial replacement of prote<strong>in</strong> supplement by lucerne hay dur<strong>in</strong>g the w<strong>in</strong>ter (S6) did not affect impacts<br />
per kg carcass mass. This is due to the percentage of prote<strong>in</strong> supplement replaced be<strong>in</strong>g small (0.8% of<br />
total DM <strong>in</strong>take of the cow-calf herd) and only 30% of it was soybean meal.<br />
The replacement of soybean meal by rapeseed meal <strong>in</strong> bull di<strong>et</strong>s (S7) had modest effects on the impacts<br />
of the whole system, even though it decreased the CC/LULUC and CED impacts of the bull-fatten<strong>in</strong>g herd<br />
by 9 and 22%, respectively (results not shown).<br />
The use of extruded l<strong>in</strong>seed to <strong>in</strong>crease lipid content <strong>in</strong> animal di<strong>et</strong>s (S8) decreased CC and CC/LULUC<br />
per kg carcass mass by 3-4%, which was lower than the 11% decrease obta<strong>in</strong>ed by Beauchem<strong>in</strong> <strong>et</strong> al.,<br />
(2011). This difference is due to <strong>in</strong>clud<strong>in</strong>g a lower percentage of lipids <strong>in</strong> the w<strong>in</strong>ter cow-calf di<strong>et</strong> <strong>in</strong> this<br />
study than <strong>in</strong> that of Beauchem<strong>in</strong> <strong>et</strong> al., (2011) (1.2 vs. 4.0%, respectively). However, S8 <strong>in</strong>creased CED and<br />
EP by 8.0 and 6.7%, respectively due to an <strong>in</strong>crease <strong>in</strong> the use of cereals and <strong>in</strong> energy requirements for l<strong>in</strong>seed<br />
production, the extrusion process and concentrate production for f<strong>in</strong>ish<strong>in</strong>g and cow-calf di<strong>et</strong>s.<br />
Comb<strong>in</strong>ation of scenarios S1, S2, S4, S5 and S7 (S9)<br />
A comb<strong>in</strong>ation of several compatible scenarios (S9) appeared the most promis<strong>in</strong>g impact-mitigation strategy,<br />
which decreased CC, CC/LULUC and AC per kg carcass mass by 13%, CED by 18% and EP by 28%.<br />
Overall, the effects of each farm<strong>in</strong>g practice on impact were limited because they only affected one element<br />
of the whole system. Comb<strong>in</strong>ation of several compatible farm<strong>in</strong>g practice scenarios approximately results <strong>in</strong><br />
the sum of the relative effects of the separate scenarios. However, possible <strong>in</strong>teractions b<strong>et</strong>ween these practices<br />
were not considered due to lack of experimental data.<br />
Table 1: Environmental impacts (per kg carcass mass) of basel<strong>in</strong>e for standard beef-cattle production and<br />
farm<strong>in</strong>g-practice scenarios<br />
Impact Unit Basel<strong>in</strong>e S1 S2 S3 S4 S5 S6 S7 S8 S9<br />
Climate change kg CO2 eq. 27.8 27.3 27.2 26.4 27.4 25.5 27.9 27.8 26.9 24.2<br />
Climate change/ LULUC* kg CO2 eq. 25.5 25.0 25.3 24.6 25.1 23.5 25.5 25.2 24.4 22.2<br />
Cumulative energy demand MJ eq. 65.0 63.1 63.2 64.2 64.3 59.8 64.7 62.6 70.2 53.4<br />
Eutrophication g PO4 3- eq. 98.7 88.3 88.1 94.4 97.3 90.7 98.1 98.0 105.4 71.0<br />
3.2. Effects of farm<strong>in</strong>g practices on LO and alternative land use on CC/LULUC<br />
608
PARALLEL SESSION 7B: BEEF PRODUCTION SYSTEMS 8 th Int. Conference on <strong>LCA</strong> <strong>in</strong> the<br />
Agri-<strong>Food</strong> Sector, 1-4 Oct <strong>2012</strong><br />
Farm<strong>in</strong>g practices such as decreas<strong>in</strong>g grass loss on pasture (S2), fatten<strong>in</strong>g female calves <strong>in</strong>stead of rear<strong>in</strong>g<br />
them as replacement heifers (S3), decreas<strong>in</strong>g calv<strong>in</strong>g age (S5) and comb<strong>in</strong>ation of S1, S2, S4, S5, S7 (S9)<br />
decreased the use of permanent grassland and total land occupation per kg of carcass mass by 12-23% and 9-<br />
19%, respectively (Table 2). For these scenarios, if Corsican p<strong>in</strong>e were planted on the released permanent<br />
grassland, CC/LULUC both per kg of carcass mass decreased by 19-48% (20.5, 19.2, 18.7 and 13.4 kg CO2<br />
eq./kg carcass mass for S2, S3, S5 and S9, respectively). Corsican p<strong>in</strong>e planted on released permanent grassland<br />
did not affect CED. This <strong>in</strong>troduction of alternative land use <strong>in</strong>fluenced the CC/LULUC impact of the<br />
entire production system when compar<strong>in</strong>g farm<strong>in</strong>g practices. Besides forest, there is no other alternative use<br />
of permanent grassland that can <strong>in</strong>crease C sequestration <strong>in</strong> soil and biomass. This option appeared the most<br />
promis<strong>in</strong>g GHG mitigation strategy of beef production system without alter<strong>in</strong>g the farm’s productivity. Forest<br />
plantation may also enhance biodiversity of the production system.<br />
This study did not <strong>in</strong>clude the harvest of the even-aged forest, as a result of which, a part of C sequestered<br />
<strong>in</strong> the biomass will r<strong>et</strong>urn <strong>in</strong>to the atmosphere. On the other hand this biomass can be used as an energy resource<br />
to replace fossil energy which will contribute to GHG and energy use mitigation. In practice, plant<strong>in</strong>g<br />
even-aged forests is both labour-<strong>in</strong>tensive and regulated at regional levels. Although the <strong>in</strong>troduction of<br />
even-aged forest <strong>in</strong> regions dom<strong>in</strong>ated by grassland-based bov<strong>in</strong>e production may not be welcomed by all<br />
stakeholders concerned, it certa<strong>in</strong>ly has a major potential to contribute to GHG mitigation of worldwide rum<strong>in</strong>ant<br />
production. Furthermore, compar<strong>in</strong>g farm<strong>in</strong>g practices with identical farm area, i.e. consider<strong>in</strong>g alternative<br />
land uses on farms, avoids relative changes <strong>in</strong> impacts accord<strong>in</strong>g to each functional unit (per unit mass<br />
or unit of farm area).<br />
Table 2: Land occupation (m2*year/kg carcass mass) of basel<strong>in</strong>e for standard beef-cattle production and<br />
farm<strong>in</strong>g-practice scenarios<br />
Land-use type Basel<strong>in</strong>e S1 S2 S3 S4 S5 S6 S7 S8 S9<br />
Permanent pasture 34.0 34.0 29.8 29.3 33.8 29.8 34.4 34.0 33.9 26.3<br />
Temporary pasture 4.7 4.7 4.1 4.1 4.7 4.1 3.7 4.6 4.6 3.6<br />
Arable land on-farm 8.3 8.3 8.3 8.9 8.2 8.2 9.3 8.3 6.4 8.0<br />
Arable land off-farm 1.0 1.0 1.0 1.2 1.0 1.1 0.7 1.0 2.3 1.0<br />
Other land off-farm 0.1 0.1 0.1 0.1 0.1 0.1 0.1 0.1 0.1 0.1<br />
Total 48.2 48.2 43.4 43.7 47.7 43.4 48.3 48.1 47.4 38.9<br />
4. Conclusion<br />
It is difficult to strongly reduce the environmental impacts, and <strong>in</strong> particular the GHG emissions, of a<br />
beef-cattle production system as its impacts result to a very large extent from the suckler cow-calf herd,<br />
which offers few options to modify herd management and feed<strong>in</strong>g strategies. Modification of <strong>in</strong>dividual<br />
farm<strong>in</strong>g-practices modestly affected the impacts of the whole beef system; the most promis<strong>in</strong>g practice is a<br />
radical change <strong>in</strong> herd management by decreas<strong>in</strong>g calv<strong>in</strong>g age from 3 to 2 years. Our results suggest that<br />
simultaneous application of several compatible farm<strong>in</strong>g-practices can significantly reduce impacts of beefcattle<br />
production. However, our scenario did not consider possible <strong>in</strong>teractions b<strong>et</strong>ween farm<strong>in</strong>g practices.<br />
This po<strong>in</strong>t should be further explored, an approach comb<strong>in</strong><strong>in</strong>g system experiments and simulation model<strong>in</strong>g<br />
would seem appropriate. The <strong>in</strong>troduction of even-aged forest as an alternative land use <strong>in</strong> beef cattle farms<br />
seems promis<strong>in</strong>g and merits further exploration. It illustrates that alternative land use may strongly reduce<br />
the climate change impact of the entire production system when compar<strong>in</strong>g farm<strong>in</strong>g practices.<br />
5. References<br />
Beauchem<strong>in</strong>, K.A., Janzen, H.H., Little, S.M., McAllister, T.A., McG<strong>in</strong>n, S.M., 2011.Mitigation of greenhouse gas emissions from<br />
beef production <strong>in</strong> western Canada - Evaluation us<strong>in</strong>g farm-based life cycle assessment. Anim. Feed Sci. Technol. 166-167, 663-<br />
677.<br />
Dawson, J.J.C., Smith, P., 2007. Carbon losses from soil and its consequences for land-use management. Sci. Total Environ. 382,<br />
165-190.<br />
Eckard, R.J., Gra<strong>in</strong>ger, C., de Kle<strong>in</strong>, C.A.M., 2010. Options for the abatement of m<strong>et</strong>hane and nitrous oxide from rum<strong>in</strong>ant production:<br />
A review. Livest. Sci. 130, 47-56.<br />
Farrié, J.P., Renon, J., Bourge, C., Gros, J.M., Lahemade, T., Muron, G., Roudier, J., 2008. Conditions <strong>et</strong> conséquences de la mise en<br />
place du vêlage à deux ans dans un troupeau charolais. Renc. Rech. Rum<strong>in</strong>ants 15, 147-150.<br />
INRA, 2007. Alimentation des bov<strong>in</strong>s, ov<strong>in</strong>s <strong>et</strong> capr<strong>in</strong>s. Beso<strong>in</strong>s des animaux, valeurs des aliments. Tables INRA 2007. Eds. Quae,<br />
307p.<br />
Mart<strong>in</strong>, C., Morgavi, D.P., Doreau, M., 2010. M<strong>et</strong>hane mitigation <strong>in</strong> rum<strong>in</strong>ants: from the rumen microbes to the farm scale. Animal<br />
4, 351-365.<br />
609
PARALLEL SESSION 7B: BEEF PRODUCTION SYSTEMS 8 th Int. Conference on <strong>LCA</strong> <strong>in</strong> the<br />
Agri-<strong>Food</strong> Sector, 1-4 Oct <strong>2012</strong><br />
Nguyen, T.T.H., van der Werf, H.M.G., Eugène, M., Veyss<strong>et</strong>, P., Devun, J., Chesneau, G., Doreau, M., <strong>2012</strong>. Effects of type of<br />
ration and allocation m<strong>et</strong>hods on the environmental impacts of beef-production systems. Livest. Sci. 145, 239-251.<br />
Ste<strong>in</strong>feld, H., Gerber, P., Wassenaar, T., Castel, V., Rosales, M., De Haan, C., 2006. Livestock’s Long Shadow: Environmental<br />
Issues and Options. FAO, Rome, 390 p.<br />
Ste<strong>in</strong>feld, H., Mooney, H.A., Schneider, F., Neville, L.E., 2010. Livestock <strong>in</strong> a Chang<strong>in</strong>g Landscape. Drivers, Consequences, and<br />
Responses. Wash<strong>in</strong>gton, D.C.: Island Press.<br />
Vall<strong>et</strong>, P., Meredieu, C., Seynave, I., Bélouard, T., Dhôte, J.F., 2009. Species substitution for carbon storage: Sessile oak versus<br />
Corsican p<strong>in</strong>e <strong>in</strong> <strong>France</strong> as a case study. Forest Ecol. Manage. 257, 1314-1323.<br />
610
PARALLEL SESSION 7B: BEEF PRODUCTION SYSTEMS 8 th Int. Conference on <strong>LCA</strong> <strong>in</strong> the<br />
Agri-<strong>Food</strong> Sector, 1-4 Oct <strong>2012</strong><br />
An assessment of greenhouse gas emissions and economics of grass<br />
based suckler beef production systems<br />
Anne-Marie Clarke 1 , Paul Crosson 1,* , Padraig Brennan 2<br />
1 Animal & Grassland Research and Innovation Centre, Teagasc, Grange, Dunsany, Co. Meath, Ireland<br />
2 Bord Bia, Clanwilliam Court, Lower Mount Stre<strong>et</strong>, Dubl<strong>in</strong> 2, Ireland<br />
Correspond<strong>in</strong>g author. E-mail: paul.crosson@teagasc.ie<br />
ABSTRACT<br />
The objective of this paper was to evaluate the impact of stock<strong>in</strong>g rate (kg of organic nitrogen (N) per hectare (ha)) for steer beef<br />
production system on technical and economic performance and greenhouse gas emissions. Carcass output and profitability <strong>in</strong>creased<br />
with <strong>in</strong>creas<strong>in</strong>g stock<strong>in</strong>g rate. At a stock<strong>in</strong>g rate of 150 kg organic N/ha, total emissions were lowest per kg of beef carcass (23.4 kg<br />
CO2e /kg beef) and per hectare (9.7 t/CO2e/ha). The highest output and economic r<strong>et</strong>urns were achieved at the highest stock<strong>in</strong>g rate<br />
(220 kg organic N/ha). Enteric fermentation was the greatest source of GHG emissions and ranged from 46% to 44% of total emissions<br />
with <strong>in</strong>creas<strong>in</strong>g stock<strong>in</strong>g rate. N<strong>et</strong> marg<strong>in</strong> per tonne of CO2 e (emission efficiency) <strong>in</strong>creased with <strong>in</strong>creas<strong>in</strong>g stock<strong>in</strong>g rate.<br />
Keywords: <strong>LCA</strong>, profitability, stock<strong>in</strong>g rate<br />
1. Introduction<br />
In Ireland, agriculture is the largest contributor of greenhouse gas (GHG) emissions account<strong>in</strong>g for 30.4%<br />
of national emissions <strong>in</strong> 2010 (EPA, 2011a). Agriculture will be required to share the burden of emissions<br />
reductions based on the EU targ<strong>et</strong> to reduce emissions by 20% by 2020. The primary GHGs from agricultural<br />
production are m<strong>et</strong>hane (CH4) and nitrous oxide (N2O). Of emissions from agriculture, enteric fermentation,<br />
manure management and nitrogen additions to agricultural soils account for 47%, 28% and 20% of<br />
total emissions, respectively (EPA, 2011b). Life cycle assessment (<strong>LCA</strong>) is a m<strong>et</strong>hod that evaluates the environmental<br />
impact of products and is regulated by the International Organisation for Standardisation (ISO)<br />
standards (ISO, 2006). One of these environmental impact categories is Global Warm<strong>in</strong>g Potential which is a<br />
relative measure of how much heat a greenhouse gas traps <strong>in</strong> the atmosphere. The result of an <strong>LCA</strong> study is<br />
reported <strong>in</strong> terms of relative impact per unit product, known as the functional unit (ISO, 2006).<br />
A number of <strong>LCA</strong> studies (Nguyen <strong>et</strong> al., 2010; P<strong>et</strong>ers <strong>et</strong> al., 2010; Roy <strong>et</strong> al., <strong>2012</strong>) have been carried<br />
out on beef cattle production and <strong>in</strong> most cases the GHG emissions are reported per unit (kilogram) of meat<br />
produced <strong>in</strong> carbon dioxide equivalent, (CO2e). Roy <strong>et</strong> al., (<strong>2012</strong>) reported that GHG emissions of beef (35.6<br />
kg CO2e/kg-meat) were greater than that of pork (6.9 kg CO2e/kg-meat) or chicken (6.0 kg CO2e/kg-meat) <strong>in</strong><br />
Japan. P<strong>et</strong>ers <strong>et</strong> al., (2010) exam<strong>in</strong>ed red meat production <strong>in</strong> Australia and the results of this study showed<br />
that farm level emissions were responsible for the largest proportion of the total burden compared to feedlot<br />
and process<strong>in</strong>g stages of its lifecycle. Nguyen <strong>et</strong> al., (2010) reported that suckler cow calf-beef production<br />
system produced 27.3 kg CO2e/kg-meat (slaughter weight), while dairy calf to beef systems produced on<br />
average 17.9 CO2e/kg-meat. Casey and Holden, (2006), White <strong>et</strong> al., (2010) and Foley <strong>et</strong> al., (2011) exam<strong>in</strong>ed<br />
the effect on greenhouse gas emissions of different farm systems. However the effect of <strong>in</strong>creas<strong>in</strong>g<br />
stock<strong>in</strong>g rate on greenhouse gas emissions for Irish suckler beef systems has not been <strong>in</strong>vestigated.<br />
The objective of this paper was to evaluate the impact of stock<strong>in</strong>g rate (kg of organic nitrogen (N) per<br />
hectare (ha)) on steer beef production systems for technical and economic performance and greenhouse gas<br />
emissions.<br />
2. M<strong>et</strong>hods<br />
A bioeconomic model of suckler beef production systems, the Grange Beef Systems Model GBSM<br />
(Crosson <strong>et</strong> al., 2006; Crosson, 2008) was used to generate steer beef cattle system scenarios and to quantify<br />
the technical and economic performance of these systems. The scenarios were based on spr<strong>in</strong>g calv<strong>in</strong>g suckler<br />
calf to beef research farm systems <strong>in</strong> Ireland f<strong>in</strong>ish<strong>in</strong>g steers at 24 months of age and heifers at 20 months<br />
of age. (Drennan and McGee, 2009). The GBSM runs on a monthly time-step and assumes a steady state<br />
system over a calendar year. The output data of the GBSM specifies the essential <strong>in</strong>put data for the <strong>LCA</strong><br />
model that estimates the greenhouse gas emissions associated with grass based suckler beef production systems.<br />
This <strong>in</strong>cludes animal type and numbers, animal weights, feed <strong>in</strong>take, feed characteristics (eg DM,<br />
DMD, nitrogen concentrations, gross energy), manure application profile, nitrogen fertiliser application<br />
(kg/ha), beef produced (kg), lime application (kg/ha) and electricity consumption (kw). This model also provides<br />
f<strong>in</strong>ancial performance data such as farm n<strong>et</strong> marg<strong>in</strong>. N<strong>et</strong> marg<strong>in</strong> <strong>in</strong>cludes direct and overhead costs and<br />
611
PARALLEL SESSION 7B: BEEF PRODUCTION SYSTEMS 8 th Int. Conference on <strong>LCA</strong> <strong>in</strong> the<br />
Agri-<strong>Food</strong> Sector, 1-4 Oct <strong>2012</strong><br />
all livestock revenues. Land and labour costs are not <strong>in</strong>cluded as it is assumed that it is a family run farm and<br />
all land is owned. The f<strong>in</strong>anical data rema<strong>in</strong>s separate from the <strong>LCA</strong> model.<br />
To model the greenhouse gas emissions, the <strong>in</strong>put data (generated as outputs from GBSM) was imported<br />
<strong>in</strong>to the SimaPro software package (Pre Consultants, 2011) <strong>in</strong> the form of a Microsoft Excel she<strong>et</strong> (Microsoft<br />
Corporation, 2003). The model simulates production systems <strong>in</strong>volv<strong>in</strong>g up to 7 animal groups. The animal<br />
groups are cows, male calves and female calves (
PARALLEL SESSION 7B: BEEF PRODUCTION SYSTEMS 8 th Int. Conference on <strong>LCA</strong> <strong>in</strong> the<br />
Agri-<strong>Food</strong> Sector, 1-4 Oct <strong>2012</strong><br />
Table 2. Effect of stock<strong>in</strong>g on greenhouse gas emissions per kg of beef carcass and per hectare and the<br />
source and percentage of the total contribution to the total greenhouse gas emissions for steer/heifer production<br />
systems<br />
Organic Nitrogen (kg/ha) 150 160 170 180 190 200 210 220<br />
Total emissions per kg beef carcass (kg) 22.2 22.4 22.5 22.6 22.7 22.9 23.0 23.1<br />
Total emissions per hectare (t) 9.2 9.9 10.5 11.2 11.9 12.6 13.3 14.0<br />
Enteric fermentation (%) 48.2 47.9 47.6 47.4 47.2 46.9 46.7 46.5<br />
Manure management (%) 12.6 12.5 12.4 12.4 12.3 12.2 12.2 12.1<br />
Soils (%) 22.6 22.7 22.8 22.9 23.0 23.1 23.2 23.3<br />
Indirect nitrous oxide (%) 4.0 4.0 4.0 3.9 3.9 3.9 3.9 3.9<br />
Diesel use (%) 1.1 1.0 1.0 1.0 0.9 0.9 0.9 0.9<br />
Purchased <strong>in</strong>puts (%) 11.5 11.9 12.2 12.4 12.6 12.9 13.1 13.3<br />
4. Discussion<br />
In this study, a partial <strong>LCA</strong> model was developed to evaluate GHG emissions from Irish steer beef production<br />
systems. Ireland exports approximately 90% of its beef output (Breen <strong>et</strong> al., 2010) and due to the<br />
<strong>in</strong>creased awareness of carbon footpr<strong>in</strong>t by soci<strong>et</strong>y and consumer preference for ‘low carbon-footpr<strong>in</strong>t’ food<br />
(Schulte <strong>et</strong> al., 2011), it is important to quantify the carbon footpr<strong>in</strong>t of agricultural products. Nitrous oxide<br />
emissions are generated by the application of organic and <strong>in</strong>organic fertilisers and the deposition of faecal<br />
and ur<strong>in</strong>e nitrogen by livestock. The quantity of CH4 emissions are d<strong>et</strong>erm<strong>in</strong>ed primarily by the numbers of<br />
livestock and its ma<strong>in</strong> source is from animal digestion (enteric fermentation), followed by manure management<br />
where liquid manure storage systems predom<strong>in</strong>ate (Crosson <strong>et</strong> al., 2011). Emissions per kg of beef<br />
carcass <strong>in</strong> this study were similar to other studies of Irish beef production systems (Casey and Holden, 2006;<br />
Foley <strong>et</strong> al., 2011). The marg<strong>in</strong>ally lower values <strong>in</strong> the study of Foley <strong>et</strong> al., (2011) are due to the lower fertiliser<br />
N applied <strong>in</strong> their study compared to the present study and differences <strong>in</strong> emission factors applied.<br />
The developed model was applied to exam<strong>in</strong>e the effect of stock<strong>in</strong>g rate on greenhouse gas emissions.<br />
Stock<strong>in</strong>g rate is the most important factor affect<strong>in</strong>g production and profitability on farms (Fales <strong>et</strong> al., 1995;<br />
Crosson and McGee, 2011; Horan <strong>et</strong> al., <strong>2012</strong>). Higher stock<strong>in</strong>g rates due to <strong>in</strong>creased fertiliser N/ha applied<br />
<strong>in</strong> this study lead to greater GHG emissions. White <strong>et</strong> al., (2010) reported simalar f<strong>in</strong>d<strong>in</strong>gs on New Zealand<br />
beef and sheep farms. Neufeldt <strong>et</strong> al., (2006) found that greenhouse gas emissions on a per hectare basis were<br />
highly correlated (R 2 = 0.85) to the stock<strong>in</strong>g rates on farms <strong>in</strong> Germany and suggested that stock<strong>in</strong>g rates are<br />
good <strong>in</strong>dicators of overall agricultural GHG emissions. Emissions efficiency <strong>in</strong> terms of n<strong>et</strong> marg<strong>in</strong> per tonne<br />
of CO2e suggests that there is lower profitability per unit of GHG emission at lower stock<strong>in</strong>g rates.<br />
As a result of EU emissions reductions targ<strong>et</strong>s, national governments have must establish respective targ<strong>et</strong>s<br />
for their own jurisdictions. However, this analysis has shown that production systems which m<strong>in</strong>imize<br />
emissions on an area and product based basis also result <strong>in</strong> lower profitability. Furthermore, the analysis has<br />
shown that profitability can be <strong>in</strong>creased substantially by operat<strong>in</strong>g at higher stock<strong>in</strong>g rates with only modest<br />
<strong>in</strong>creases <strong>in</strong> GHG emissions per kg beef carcass albeit with substantial <strong>in</strong>creases <strong>in</strong> GHG emissions per hectare.<br />
It is apparent that concomitantly achiev<strong>in</strong>g GHG efficient and profitable production systems are possible<br />
provided that emissions <strong>in</strong>tensity (GHG emissions per unit product) is the m<strong>et</strong>ric used.<br />
5. Conclusion<br />
The developed model is a useful tool <strong>in</strong> evaluat<strong>in</strong>g GHG emissions from beef farms <strong>in</strong> Ireland This study<br />
shows that <strong>in</strong>creas<strong>in</strong>g stock<strong>in</strong>g rate via <strong>in</strong>creased fertiliser nitrogen application rates and higher grass utilisation<br />
rates lead to <strong>in</strong>creased profitability on beef farms with only modest <strong>in</strong>creases <strong>in</strong> GHG emissions.<br />
6. References<br />
Baudracco, J., Lopez-Villalobos, N., Romero, L.A., Scandolo, D., Maceil, M., Comeron, E.A., Holmes, C.W. & Barry, T. N. (2011).<br />
Effects of stock<strong>in</strong>g rate on pasture production, milk production and reproduction of supplemented crossbred Holste<strong>in</strong>-Jersey<br />
dairy cows graz<strong>in</strong>g lucerne pasture. Anim. Feed Sci. and Tech. 168, 131-143.<br />
Breen, J.P., Donnellan, T. & Westhoff, P. (2010). <strong>Food</strong> for Thought: EU Climate Change Policy Presents New Challenges for Agriculture.<br />
EuroChoices 9, 24-29.<br />
Casey, J.W. and Holden, N.M. (2006). Greenhouse gas emission from conventional, agri-environmental scheme, and organic Irish<br />
suckler-beef units. J. Env. Qual. 35, 231-239.<br />
Crosson, P., O’Kiely, P., O’Mara, F.P. & Wallace, M. (2006). The development of a mathematical model to <strong>in</strong>vestigate Irish beef<br />
production systems. Agric. Sys. 89, 349-370.<br />
Crosson, P. (2008). The impact of cow genotype on the profitability of grassland-based suckler beef production <strong>in</strong> Ireland. In: Proceed<strong>in</strong>gs<br />
of the 22 nd Annual Me<strong>et</strong><strong>in</strong>g of the European Grassland Federation, Uppsala, Sweden, 9-12 June, p 771.<br />
613
PARALLEL SESSION 7B: BEEF PRODUCTION SYSTEMS 8 th Int. Conference on <strong>LCA</strong> <strong>in</strong> the<br />
Agri-<strong>Food</strong> Sector, 1-4 Oct <strong>2012</strong><br />
Crosson, P. & McGee, M. (2011). Suckler beef production <strong>in</strong> Ireland: challenges and opportunities. Teagasc, National Beef Conference,<br />
5 th April, Kilkenny, Ireland. http://www.teagasc.ie/publications/2011/475/PaulCrossonMarkMcGee.pdf<br />
Crosson, P., Shalloo, L., O’Brien, D., Lanigan, G.J., Foley, P.A., & Boland, T.M. (2011). A review of whole farm systems models of<br />
greenhouse gas emissions from beef and dairy cattle production systems. Ani. Feed. Sci. and Tech. 166-167, 29-45.<br />
Drennan, M.J., and McGee, M. (2009). Performance of spr<strong>in</strong>g-calv<strong>in</strong>g beef suckler cows and their progeny to slaughter on <strong>in</strong>tensive<br />
and extensive grassland management systems. Livest. Sci.120, 1-12.<br />
EPA, 2011a. Ireland’s Greenhouse Gas emissions <strong>in</strong> 2010. 9/11/2011. Environmental Protection Agency, Johnstown Castle Estate,<br />
Co. Wexford, Ireland.<br />
EPA, 2011b. Ireland’s Greenhouse Gas Emissions Projections 2010-2020. Environmental Protection Agency, Johnstown Castle<br />
Estate, Co. Wexford, Ireland.<br />
Fales, S.L., Muller, L.D., Ford, S.A., O’Sullivan, M., Hoover, R.J., Holden, L.A., Lanyon, L.E. & Buckmaster, D.R. (1995). Stock<strong>in</strong>g<br />
rate affects production and profitability <strong>in</strong> a rotationally grazed pasture system. J. Prod. Agric. 8, 88-96.<br />
Foley, P.A., Crosson, P., Lov<strong>et</strong>t, D.K., Boland, T.M., O’Mara, F.P., Kenny, D.A. (2011). Whole-farm systems modell<strong>in</strong>g of greenhouse<br />
gas emissions from pastoral suckler beef cow production systems. Agric. Ecosyst. Env. 142, 222-230.<br />
French, P., O’Donovan, M., Horan, B. & Shalloo, L. (2010). What is the optimum stock<strong>in</strong>g rate to maximize profitability of grass<br />
based milk production? Ir. Grassl. Ass. J. 44, 16-22.<br />
Horan, B., McCarthy, B. & Brennan A. (<strong>2012</strong>). The effect of stock<strong>in</strong>g rate and calv<strong>in</strong>g date on the characteristics of milk production<br />
systems post milk quotas. http://www.agresearch.teagasc.ie/moorepark/Articles/Curt<strong>in</strong>s%20A%20Review_V2.pdf<br />
Intergovernmental Panel on Climate Change (IPCC), 2006. IPCC guidel<strong>in</strong>es for National Greenhouse Gas Inventories, In: Eggleston,<br />
H., Buendia, L., Miwa, K., Ngara, T., Tanabe, K. (Eds.), The National Greenhouse Gas Inventories Programme, Intergovernmental<br />
Panel on Climate Change. IGES, Japan.<br />
International Organisation of Standardisation (ISO), (2006). Environment Management – Life Cycle Assessment – Pr<strong>in</strong>ciples and<br />
Framework. EN ISO 14040.<br />
MacDonald, K.A., Penno, J.W., Lancaster, J.A.S. & Roche J.R. (2008). Effect of stock<strong>in</strong>g rate on pasture production, milk production<br />
and reproduction of dairy cows <strong>in</strong> pasture-bases systems. J. Dairy Sci. 91, 2151-2163.<br />
Microsoft Corporation, 2003. http://office.microsoft.com/en-us/excel/ 1 Microsoft Way, Redmond, Wash<strong>in</strong>gton, USA.<br />
Neufeldt, H. Schafer, M., Angenendt, E., Li, C., Kaltschmitt, M. & Zeddies, J. (2006). Disaggregated greenhouse gasd emission<br />
<strong>in</strong>ventories form agriculture via a coupled economic-ecosystem model. Agric., Ecosyst. Env. 112, 233-240.<br />
Nguyen T.L.T., Hermansen, J.E. & Mogensen L. (2010). Environmental consequences of different beef production systems <strong>in</strong> the<br />
EU. J. Clean. Prod. 18, 756-766.<br />
P<strong>et</strong>ers G.M., Rowley, H.V., Wiedemann, S., Tucker, R., Short, M.D. & Schulz M. (2010). Red meat production <strong>in</strong> Australia: life<br />
cycle assessment and comparison with overseas studies. Env. Sci. and Tech.44, 1327-1332.<br />
PRé Consultants (2011). SimaPro 7.2 m<strong>et</strong>hod. In: Database Manual. Pré Consultants B.V., Amersfoort, The N<strong>et</strong>herlands.<br />
Roy, P., Orikasa, T., Thammawong, M., Nakamura, N., Xu, Q., Shi<strong>in</strong>a, T. (<strong>2012</strong>). Life cycle of meats: an opportunity to abate the<br />
greenhouse gas emission from meat <strong>in</strong>dustry <strong>in</strong> Japan. J. Env. Man. 93, 218-224.<br />
Schulte R.P.O., Lanigan, G, Gibson, M. (2011). Irish Agriculture, Greenhouse Gas Emissions and Climate Change: Opportunities,<br />
obstacles and proposed solutions. Teagasc, Oak Park, Carlow.<br />
White, T.A., Snow, V.O. & McG K<strong>in</strong>g, W. (2010). Intensification of New Zealand beef farm<strong>in</strong>g systems. Agric. Syst. 103, 21–35.<br />
614
PARALLEL SESSION 7B: BEEF PRODUCTION SYSTEMS 8 th Int. Conference on <strong>LCA</strong> <strong>in</strong> the<br />
Agri-<strong>Food</strong> Sector, 1-4 Oct <strong>2012</strong><br />
Could cultured meat reduce environmental impact of agriculture <strong>in</strong><br />
Europe?<br />
Hanna L. Tuomisto 1,* , Avijit G. Roy 2<br />
1 European Commission, Jo<strong>in</strong>t Research Centre (JRC), Institute for Environment and Susta<strong>in</strong>ability, Via Enrico Fermi 2749, 21027<br />
Ispra, Italy<br />
2 Clore Laboratory, University of Buck<strong>in</strong>gham, Buck<strong>in</strong>gham, MK18 1EG, UK<br />
Correspond<strong>in</strong>g author. E-mail: hanna.tuomisto@jrc.ec.europa.eu<br />
ABSTRACT<br />
This paper assesses the potential of cultured meat to reduce environmental impacts of livestock production <strong>in</strong> Europe. Cultured meat<br />
(i.e. <strong>in</strong> vitro meat or lab-grown meat) is produced by cultivat<strong>in</strong>g livestock muscle cells <strong>in</strong> a growth media. The environmental impacts<br />
of hypoth<strong>et</strong>ical large-scale production of cultured meat were compared to the impacts of livestock production <strong>in</strong> the EU-27. The<br />
results showed that if all meat produced <strong>in</strong> the EU-27 was replaced by cultured meat, the GHG emissions, land use and water use<br />
would be reduced by two orders of magnitude compared to current meat production practices. When the opportunity costs of land use<br />
were <strong>in</strong>cluded, the environmental benefits were even higher. More research and development is required before the product can be<br />
commercialised. Further effort is needed to ga<strong>in</strong> public acceptance for this technology.<br />
Keywords: <strong>in</strong> vitro meat, greenhouse gas emissions, land use, life cycle assessment, water footpr<strong>in</strong>t<br />
1. Introduction<br />
Livestock production is one of the major contributors to global environmental degradation. The contribution<br />
of livestock production to greenhouse gas (GHG) emissions <strong>in</strong> the European Union (EU) has been estimated<br />
to account for 9.1% of total EU emissions or 12.8% when land use and land use change emissions are<br />
taken <strong>in</strong>to account (Weiss and Leip, <strong>2012</strong>). Furthermore, livestock production accounts for a large share of<br />
land and water use and is the ma<strong>in</strong> contributor to the eutrophication of water ways and loss of biodiversity.<br />
The ma<strong>in</strong> strategies to reduce the negative environmental impact of livestock production <strong>in</strong>clude changes <strong>in</strong><br />
feedstock, improvements of manure management and breed<strong>in</strong>g animals with higher feed-to-food conversion<br />
ratios. To achieve more substantial improvements, new approaches to meat production will be required,<br />
unless vast majority of people adopt purely veg<strong>et</strong>arian di<strong>et</strong>s. However, the current trends show that the<br />
global meat consumption will <strong>in</strong>crease rather than decrease by 2050 (FAO, 2006).<br />
A novel alternative to conventionally produced meat is to cultivate animal muscle cells <strong>in</strong> vitro without<br />
grow<strong>in</strong>g the whole animals. Currently, production of <strong>in</strong> vitro meat, also known as cultured meat, is <strong>in</strong> the<br />
research stage, but it has been estimated that the commercial production could start with<strong>in</strong> a decade. It has<br />
been shown that the potential environmental impacts of cultured meat are substantially lower than those of<br />
meat produced <strong>in</strong> Europe (Tuomisto and Teixeira de Mattos, 2011). When cyanobacteria hydrolysate is used<br />
as the ma<strong>in</strong> nutrient and energy source for muscle cell growth, life-cycle-assessment-based GHG emissions,<br />
land use, and water use are 78-96%, 99%, and 82-96% lower, respectively, per tonne of meat compared to<br />
those of conventionally produced European meat. Energy use for cultured meat production was 38% higher<br />
than that of poultry, but lower than those of beef, sheep or pork.<br />
This paper extends previous research by demonstrat<strong>in</strong>g the total potential GHG emission reductions and<br />
changes <strong>in</strong> land, water and energy use requirements <strong>in</strong> the EU-27 when conventional meat production is replaced<br />
by cultured meat. The environmental benefits result<strong>in</strong>g from alternative use of land released from<br />
agriculture are also considered. Furthermore, the impacts of cultured meat are compared with plant-based<br />
and livestock-based prote<strong>in</strong> sources. F<strong>in</strong>ally, the uncerta<strong>in</strong>ties related to the potential of cultured-meatmediated<br />
reductions <strong>in</strong> environmental impacts of meat production <strong>in</strong> the EU are discussed.<br />
2. M<strong>et</strong>hods<br />
2.1. Cultured meat production<br />
The data for the environmental impacts of cultured meat production came from Tuomisto and Teixeira de<br />
Mattos (2011) (Table 1). The cultured meat production process used <strong>in</strong> the study is briefly described here.<br />
This process produces m<strong>in</strong>ced-beef type of product as the production technologies for steak type of products<br />
are still under development. Cyanobacteria hydrolysate is used as the source of nutrients and energy for muscle<br />
cell production. Cyanobacteria are assumed to be cultivated <strong>in</strong> an open pond made of concr<strong>et</strong>e. After<br />
harvest<strong>in</strong>g, the cyanobacteria biomass is sterilised and hydrolysed to break down the cells. The stem cells are<br />
taken from an animal embryo. Embryonic stem cells have almost <strong>in</strong>f<strong>in</strong>ite self-renewal capacity and theor<strong>et</strong>i-<br />
615
PARALLEL SESSION 7B: BEEF PRODUCTION SYSTEMS 8 th Int. Conference on <strong>LCA</strong> <strong>in</strong> the<br />
Agri-<strong>Food</strong> Sector, 1-4 Oct <strong>2012</strong><br />
cally a small number of these cells would be sufficient to feed the world. However, the differentiated product<br />
of these stem cells, such as muscle cells, has a limited proliferation period. Embryonic stem cells can produce<br />
more than 1000 kg of cultured meat, and therefore, the impacts related to the production of the stem<br />
cells are not <strong>in</strong>cluded <strong>in</strong> this study. Eng<strong>in</strong>eered Escherichia coli bacteria are used for the production of specific<br />
growth factors that <strong>in</strong>duce the stem cells to differentiate <strong>in</strong>to muscle cells. The muscle cells are grown<br />
<strong>in</strong> a bioreactor on a medium composed of the cyanobacteria hydrolysate supplemented with growth factors<br />
and vitam<strong>in</strong>s. The system boundaries cover the major processes from <strong>in</strong>put production up to the factory gate,<br />
<strong>in</strong>clud<strong>in</strong>g production of <strong>in</strong>put materials and fuels, production of the feedstock, and growth of muscle cells.<br />
The production of growth factors and vitam<strong>in</strong>s are not <strong>in</strong>cluded <strong>in</strong> the study as the quantities needed are<br />
small (under 0.1% of the DM weight of the media), and therefore, the environmental impacts are negligible.<br />
The impacts of the waste management are not allocated to cultured meat as it is assumed that the waste will<br />
be used for other commercial processes.<br />
Table 1. Environmental impacts of cultured meat production per 1000 kg of cultured meat (Tuomisto and<br />
Teixeira de Mattos, 2011) (<strong>in</strong> italics the breakdown of the impacts of the ma<strong>in</strong> category)<br />
616<br />
Primary<br />
Indirect Direct Land<br />
energy GHG water use water use use<br />
Production stage GJ kg CO2-eq m 3 m 3<br />
m 2<br />
CYANOB. CULTIVATION 8.1 611.0 8.6 441.9 232.0<br />
Fertiliser production 3.2 205.9 3.4<br />
Cultivation of cyanobacteria 3.7 303.2 3.9 441.9 232.0<br />
Harvest<strong>in</strong>g of cyanobacteria 0.1 10.4 0.1<br />
Construction and ma<strong>in</strong>tenance of the cyanobacteria production plant 1.1 91.4 1.2<br />
BIOMASS TRANSPORTATION 0.4 25.9 0.4<br />
STERILISATION 2.9 143.8 7.6 7.2<br />
MUSCLE CELL CULTIVATION 21.2 1121.8 56.1<br />
Steel production 1.0 107.9 2.6<br />
Aeration 7.9 395.6 20.9<br />
Rotation 12.3 618.2 32.6<br />
GRAND TOTAL 32.5 1902.4 72.6 449.1 232.0<br />
2.2. Environmental impacts of livestock production <strong>in</strong> the European Union<br />
Data about meat production quantities and GHG emissions <strong>in</strong> the EU-27 were based on Weiss and Leip<br />
(<strong>2012</strong>) (Table 2). GHG emissions were considered both with and without land use and land use change (LU-<br />
LUC) emissions. Weiss and Leip (<strong>2012</strong>) <strong>in</strong>cluded three scenarios for estimat<strong>in</strong>g the LULUC emissions, and<br />
<strong>in</strong> this study the Scenario II was used, which represents the most likely mix of land use change probabilities.<br />
As the production quantities are reported <strong>in</strong> tonnes of carcass deadweight, the amount of cultured meat<br />
needed to replace the conventionally produced meat was calculated by us<strong>in</strong>g conversion factors that convert<br />
the carcass deadweight to edible meat (Table 3).<br />
The water footpr<strong>in</strong>t data of conventionally produced meat was based on datas<strong>et</strong>s of the Water Footpr<strong>in</strong>t<br />
N<strong>et</strong>work. The total water footpr<strong>in</strong>t of meat production <strong>in</strong> the EU-27 was calculated based on the data about<br />
water footpr<strong>in</strong>t of each meat type (m 3 /t) produced <strong>in</strong> each EU-27 country (Mekonnen and Hoekstra, <strong>2012</strong>)<br />
and that was multiplied by the meat production quantities <strong>in</strong> each country reported by Weiss and Leip<br />
(<strong>2012</strong>).<br />
Table 2. Production quantities and greenhouse gas (GHG) emissions (with and without land use and land use<br />
change (LULUC)) of conventionally produced meat <strong>in</strong> the EU-27 (Weiss and Leip <strong>2012</strong>)<br />
Impact Beef Sheep Pork Poultry Total<br />
Production (1000 t) 8146 1014 22384 11091 42635<br />
GHG emissions (1000 t CO2-eq)<br />
Without LULUC 156814 19920 97431 27405 301570<br />
With LULUC 191000 24425 164780 54360
PARALLEL SESSION 7B: BEEF PRODUCTION SYSTEMS 8 th Int. Conference on <strong>LCA</strong> <strong>in</strong> the<br />
Agri-<strong>Food</strong> Sector, 1-4 Oct <strong>2012</strong><br />
Table 3. Conversion factors used for estimat<strong>in</strong>g edible meat production quantities.<br />
% of carcass dead weight<br />
Beef a Sheep a Pork a Poultry b<br />
Edible meat 38.56 45.55 44.55 51.47<br />
a (Garn<strong>et</strong>t, 2007)<br />
b (Igri and Ausaji, 2006)<br />
2.3 Opportunity costs of land use<br />
Opportunity costs of land use were estimated by assum<strong>in</strong>g that the land area released from meat production<br />
was used for bioenergy production or forestry. It was assumed that grassland was used for forest and<br />
arable land for bioenergy crops. As the aim was not to estimate the bioenergy production potential <strong>in</strong> the EU,<br />
but only to demonstrate opportunity costs of land use, generic data for the entire EU was used. Energy production<br />
and GHG-emission sav<strong>in</strong>gs by forest and bioenergy crops were from Tuomisto <strong>et</strong> al., (<strong>2012</strong>a), who<br />
estimated the yearly n<strong>et</strong> energy production of woodland as 92.6 GJ/ha and its GHG mitigation as 10.2 t CO2eq/ha,<br />
and the yearly n<strong>et</strong> energy production of a bioenergy crop, Miscanthus, as 159.2 GJ/ha and its n<strong>et</strong> GHG<br />
mitigation as 15.4 t CO2-eq/ha.<br />
The calculations of the energy yield and GHG emission mitigation from woodland were based on the follow<strong>in</strong>g<br />
assumptions. It was assumed that 15 m 3 /ha/yr wood was harvested and 0.57 t wood chips (75% DM),<br />
2.3 t composite board (90% DM) and 0.39 t sawn timber was produced from the harvested wood. For the<br />
wood chips, a heat<strong>in</strong>g value of 17.8 MJ/kg was used and the boiler was assumed to operate at 90% efficiency.<br />
Life cycle energy use (345 ± 36 MJ/t) and GHG emissions (21 ± 2 kg CO2-eq/t) were associated with<br />
the harvest<strong>in</strong>g of wood (75% DM). It was assumed that the wood chips replaced oil used for heat<strong>in</strong>g, and the<br />
composite board and timber replaced steel. Production of 1 kg sta<strong>in</strong>less steel requires 30.6 MJ primary energy<br />
and emits 3.38 kg CO2-eq. It was assumed that soil carbon stocks <strong>in</strong>crease dur<strong>in</strong>g the first 100 years<br />
after plant<strong>in</strong>g by an average of 0.1 t C/ha/yr (equals 0.37 t CO2-eq/ha/yr). To avoid double-count<strong>in</strong>g, carbon<br />
mitigation by aboveground veg<strong>et</strong>ation was not <strong>in</strong>cluded, as the wood was harvested and burned or used as<br />
materials which will ultimately decompose.<br />
It was assumed that Miscanthus bioenergy crop was planted on arable land. An average yield of 10.4 t<br />
DM/ha through the whole grow<strong>in</strong>g cycle was used <strong>in</strong> the base calculations. The energy yield of Miscanthus<br />
was calculated by us<strong>in</strong>g the lower heat<strong>in</strong>g value of 17.6 MJ/kg DM and a 90%-efficient boiler. The energy<br />
<strong>in</strong>puts required for production of Miscanthus through the whole grow<strong>in</strong>g cycle was 9.26 GJ/ha/yr.<br />
2.4 Data used for product comparisons<br />
Data for energy use, land use and GWP of crops, livestock products and quorn (meat substitute that is<br />
produced from filamentous fungus Fusarium venenatum and egg album<strong>in</strong>) was based on Tuomisto (2010).<br />
Data for energy use, land use and GWP of tofu and salmon was from Blonk (2008). Data for water use of<br />
crops and livestock products came from Mekonnen and Hoekstra (2011) and Mekonnen and Hoekstra<br />
(<strong>2012</strong>).<br />
3. Results<br />
The results showed that if all meat produced <strong>in</strong> the EU-27 was replaced by cultured meat, the GHG emissions<br />
would be reduced by 98.8%, land use 99.7% and water use 94% compared to current meat production<br />
practices (Table 4). When the opportunity costs of land use are taken <strong>in</strong>to account the cultured meat system<br />
produced 21.1 EJ n<strong>et</strong> energy, which is about 30% of the gross <strong>in</strong>land primary energy consumption <strong>in</strong> EU-27<br />
<strong>in</strong> 2009. The GHG emission mitigation achieved by us<strong>in</strong>g the cultured meat system corresponds to 43% of<br />
the annual GHG emissions <strong>in</strong> the EU-27. Also <strong>in</strong> the EU-27, total water use would be reduced by 21%, and<br />
38% of the total land area would be released from livestock production.<br />
When the environmental impacts of cultured meat were compared with meat products, crops, tofu and<br />
quorn per unit of product, prote<strong>in</strong> and energy (Table 5), it was found that cultured meat had lower land use<br />
requirements than any other product, regardless of functional unit, except spirul<strong>in</strong>a. The energy use and<br />
GHG emissions of cultured meat were higher than those of crops. Cultured meat had also higher energy use<br />
than most livestock-based products. GHG emissions of cultured meat were almost always lower than those<br />
of livestock-based products and meat substitutes.<br />
617
PARALLEL SESSION 7B: BEEF PRODUCTION SYSTEMS 8 th Int. Conference on <strong>LCA</strong> <strong>in</strong> the<br />
Agri-<strong>Food</strong> Sector, 1-4 Oct <strong>2012</strong><br />
Table 4. Estimated impacts for the entire EU-27 of current meat production practices and reduction achieved<br />
by us<strong>in</strong>g cultured meat technology with and without tak<strong>in</strong>g <strong>in</strong>to account land use and land use change (LU-<br />
LUC) emissions (the former <strong>in</strong>cludes opportunity costs of land use).<br />
Current Cultured Reduction<br />
Impact Unit<br />
meat meat quantity %<br />
GHG without LULUC 1000 t CO2-eq 301570 3669 297900 99<br />
GHG with LULUC<br />
Water use<br />
1000 t CO2-eq<br />
1000 m<br />
434565 -2183663 2618200 603<br />
3 164250 10060 154200 94<br />
Land use km 2 1650000 4474 1645500 100<br />
Table 5. Land use, energy use, greenhouse gas emissions (GHG), and water use of plant, livestock and meat<br />
substitute products per functional unit of mass, prote<strong>in</strong>, or energy <strong>in</strong> the product.<br />
per edible (t) per prote<strong>in</strong> (t) per energy unit (TJ)<br />
Land Energy GHG Water Land Energy GHG Water Land Energy GHG Water<br />
Product ha TJ t CO2-eq 1000m 3 ha TJ t CO2-eq 1000m 3 ha TJ t CO2-eq 1000m 3<br />
wheat 0.14 2.5 0.8 3.6 1.1 19 6 28.2 11 0.2 62 27.6<br />
soybean 0.42 3.0 1.3 2.2 1.2 8 4 6.1 27 0.2 84 140.9<br />
maize 0.14 2.4 0.7 1.4 1.1 19 5 10.8 10 0.2 44 92.8<br />
field bean 0.30 2.0 1.0 3.0 1.4 9 5 13.6 22 0.1 74 219.5<br />
spirul<strong>in</strong>a 0.02 10.1 0.8 0.5 0.0 16 1 0.7 2 0.7 54 29.3<br />
beef 4.34 52.5 29.8 11.8 19.3 233 132 99.2 679 8.2 4665 3491.6<br />
pork 0.99 22.3 8.5 4.9 4.5 102 39 29.8 108 2.4 928 711.1<br />
sheep 2.91 48.7 36.9 8.3 14.5 243 184 87.9 297 5.0 3766 1796.3<br />
poultry 0.94 17.6 6.7 3.8 4.2 79 30 25.2 103 1.9 733 612.5<br />
salmon - 25.4 1.8 - - 151 11 - - 3.7 260 -<br />
eggs 0.55 11.8 4.6 3.4 4.4 94 37 30.1 105 2.2 878 716.4<br />
milk 0.12 2.5 1.1 1.1 3.7 79 33 33.6 45 1.0 400 406.0<br />
cheese 0.72 20.0 8.8 5.2 2.8 78 34 20.2 42 1.2 510 299.0<br />
quorn 0.17 38.0 2.3 - 1.0 233 14 - 38 8.5 514 -<br />
tofu 0.30 15.6 2.0 - 3.8 200 26 - 86 4.5 575 -<br />
cultured<br />
meat<br />
0.02 31.7 1.9 0.5 0.1 166 10 2.7 5 7.1 423 116.5<br />
4. Discussion<br />
Many technological and social issues have to be resolved before cultured meat can contribute to the reduction<br />
of environmental impacts of food production <strong>in</strong> the EU. Currently, only small quantities of cultured<br />
meat have been produced <strong>in</strong> research laboratories, and more research is required before the production can be<br />
scaled up to commercial levels. The ma<strong>in</strong> challenges for scal<strong>in</strong>g up the production <strong>in</strong>clude development of<br />
growth media, optimis<strong>in</strong>g the production conditions and mak<strong>in</strong>g the whole process f<strong>in</strong>ancially feasible.<br />
As the technology for produc<strong>in</strong>g cultured meat <strong>in</strong> large-scale production plants is currently not well def<strong>in</strong>ed,<br />
there are many uncerta<strong>in</strong>ties about the data of the environmental impacts of cultured meat production<br />
presented <strong>in</strong> this paper. An uncerta<strong>in</strong>ty analysis of the environmental impacts of cultured meat production is<br />
presented <strong>in</strong> Tuomisto <strong>et</strong> al., (2011). More <strong>in</strong>formation about the commercial scale cultured meat production<br />
system will assist with generat<strong>in</strong>g more accurate environmental impact estimates. This study did not take<br />
<strong>in</strong>to account the production of scaffolds on which the cells are cultivated. These scaffolds could be made of<br />
edible materials or alternatively the cells could be harvested on the surface of the scaffolds. Furthermore, this<br />
study did not consider the production of fat cells, and the mechanical and/or electric str<strong>et</strong>ch<strong>in</strong>g that would be<br />
required for exercis<strong>in</strong>g the muscle cells.<br />
Non<strong>et</strong>heless, cultured meat would provide substantial environmental benefits, as its land use, GHG emission<br />
and water use impacts are only a fraction of those of conventionally produced meat. In particular, when<br />
opportunity costs of land use are taken <strong>in</strong>to account, cultured meat could help reduce most environmental<br />
impacts of livestock production if the land released from livestock production were used for provid<strong>in</strong>g environmental<br />
services. However, it has to be noted that the analysis presented <strong>in</strong> this paper did not take <strong>in</strong>to<br />
account the fact that if majority of meat was produced by us<strong>in</strong>g cultured meat technology, the co-products of<br />
meat production, such as leather and wool, should be produced by alternative ways.<br />
Cultured meat production could also have potential benefits for wildlife conservation for two ma<strong>in</strong> reasons:<br />
i) it reduces pressure for convert<strong>in</strong>g natural habitats to agricultural land, and ii) it provides an alternative<br />
way of produc<strong>in</strong>g meat from endangered and rare species that are currently over-hunted or –fished for<br />
618
PARALLEL SESSION 7B: BEEF PRODUCTION SYSTEMS 8 th Int. Conference on <strong>LCA</strong> <strong>in</strong> the<br />
Agri-<strong>Food</strong> Sector, 1-4 Oct <strong>2012</strong><br />
food. However, large-scale replacement of conventional meat production by cultured meat production may<br />
have some negative impacts on rural biodiversity due to the reduction <strong>in</strong> need for grasslands and pastures. In<br />
some hilly areas, livestock also has an important role <strong>in</strong> ma<strong>in</strong>ta<strong>in</strong><strong>in</strong>g the open landscapes that are preferred<br />
over forested hills. The overall value of the biodiversity impacts would depend on the <strong>in</strong>dicators used. The<br />
conversion of grasslands <strong>in</strong>to forest and arable-lands to Miscanthus or other bioenergy crops might benefit<br />
some species whilst some others may suffer. Miscanthus and wood land were used <strong>in</strong> this study to demonstrate<br />
the opportunity costs of land use, but those options would not be the optimal for each location.<br />
Even though eutrophication impacts were not considered <strong>in</strong> this study, it can be hypothesised that cultured<br />
meat production has substantially lower nutrient losses to waterways compared to conventionally produced<br />
meat; s<strong>in</strong>ce wastewaters from cyanobacteria production can be more efficiently controlled compared<br />
to run-offs from agricultural fields.<br />
Large-scale production of cultured meat also requires sufficient demand for the product. This would require<br />
consumers to accept cultured meat as a substitute to conventionally produced meat. Therefore, taste<br />
and texture should be close to conventionally produced meat, and affordability should be taken <strong>in</strong>to account.<br />
Taste of meat is <strong>in</strong>fluenced by many factors, such as the source of muscle cell, fat content, texture, colour,<br />
and shape. Controlled production conditions may ease the addition, removal or modification of any feature<br />
<strong>in</strong> the f<strong>in</strong>al product based on consumer preferences. Fat can be added later, and the content and quality of<br />
fatty acids can be controlled. The first cultured meat products will most likely be processed products, such as<br />
sausages and/or hamburgers. The development of a steak structure will require more research. The costs of<br />
cultured meat production based on the current approach have not y<strong>et</strong> been quantified.<br />
In this study, it was assumed that 100% of the meat production <strong>in</strong> the EU would be replaced by cultured<br />
meat. However, this choice was made ma<strong>in</strong>ly to demonstrate the potential of cultured meat. Like other technologies<br />
on the mark<strong>et</strong>, cultured meat production and adoption will likely follow the ‘Technology S-curve’<br />
(Sood, 2010). This entails that <strong>in</strong>itially current m<strong>et</strong>hods of meat production will outcomp<strong>et</strong>e cultured meat on<br />
both aspect but with<strong>in</strong> a very short time based on the efficiency categorised <strong>in</strong> this paper cultured meat will<br />
outcomp<strong>et</strong>e other m<strong>et</strong>hods of production. We also envision that consumer adoption of cultured meat will<br />
probably <strong>in</strong>crease as it becomes more available and mark<strong>et</strong>able.<br />
5. Conclusion<br />
Regardless of the uncerta<strong>in</strong>ty of the study, the potential environmental benefits of replac<strong>in</strong>g livestock<br />
production with cultured meat are substantial. However, more research and development are needed before<br />
cultured meat products can be commercialised. Once more knowledge about the processes of the commercial-scale<br />
cultured meat production becomes available more d<strong>et</strong>ailed estimates about the environmental impacts<br />
of cultured meat production can be provided. In order to ga<strong>in</strong> the environmental benefits that cultured<br />
meat can offer, the wider acceptance of cultured meat among consumers is required. This could be achieved<br />
by improv<strong>in</strong>g the public understand<strong>in</strong>g of science.<br />
6. References<br />
Blonk, H., Kool, A., Luske, B., 2008. Milieueffecten van Nederlandse consumptie van eiwitrijke producten. Gevolgen van vervang<strong>in</strong>g<br />
van dierlijke eiwitten anno 2008. Blonk Milieu Advies, Gouda.<br />
FAO, 2006. Livestock’s long shadow –environmental issues and options. <strong>Food</strong> and Agricultural Organization of the United Nations,<br />
Rome, p. 390.<br />
Garn<strong>et</strong>t, T., 2007. Meat and dairy production & consumption -Explor<strong>in</strong>g the livestock sector's contribution to the UK's greenhouse<br />
gas emissions and assess<strong>in</strong>g what less greenhouse gas <strong>in</strong>tensive systems of production and consumption might look like. Work<strong>in</strong>g<br />
paper produced a part of the work of the <strong>Food</strong> Climate Research N<strong>et</strong>work, University of Surrey.<br />
Igri, O., Ausaji, A., 2006. Carcass characteristics and meat quality of broilers fed periw<strong>in</strong>kle flesh (Pachymelania aurita), palm kernel<br />
cake and oil-based rations. Journal of the Science of <strong>Food</strong> and Agriculture 24, 1021-1030.<br />
Mekonnen, M.M., Hoekstra, A.Y., 2011. The green, blue and grey water footpr<strong>in</strong>t of crops and derivered crop products. Hydrology<br />
and Earth System Sciences 15, 1577-1600.<br />
Mekonnen, M.M., Hoekstra, A.Y., <strong>2012</strong>. A Global Assessment of the Water Footpr<strong>in</strong>t of Farm Animal Products. Ecosystems 15,<br />
401-415.<br />
Sood, A., 2010. Technology S-Curve. Wiley International Encyclopedia of Mark<strong>et</strong><strong>in</strong>g. John Wiley & Sons, Ltd.<br />
Tuomisto, H.L., 2010. <strong>Food</strong> Security and Prote<strong>in</strong> Supply -Cultured meat a solution? Aspects of Applied Biology 102, 99-104.<br />
Tuomisto, H.L., Hodge, I.D., Riordan, P., Macdonald, D.W., <strong>2012</strong>a. Compar<strong>in</strong>g energy balances, greenhouse gas balances and biodiversity<br />
impacts of contrast<strong>in</strong>g farm<strong>in</strong>g systems with alternative land uses. Agricultural Systems 108, 42-49.<br />
Tuomisto, H.L., Teixeira de Mattos, M.J., 2011. Environmental Impacts of Cultured Meat Production. Environmental Science &<br />
Technology 45, 6117-6123.<br />
Weiss, F., Leip, A., <strong>2012</strong>. Greenhouse gas emissions from the EU livestock sector: A life cycle assessment carried out with the CA-<br />
PRI model. Agriculture, Ecosystems & Environment 149, 124-134.<br />
619
PARALLEL SESSION 7C: FOOD CHAIN AND FOOD WASTE 8 th Int. Conference on <strong>LCA</strong> <strong>in</strong> the<br />
Parallel session 7c: <strong>Food</strong> Cha<strong>in</strong> and <strong>Food</strong> Waste<br />
620<br />
Agri-<strong>Food</strong> Sector, 1-4 Oct <strong>2012</strong><br />
The environmental effects of seasonal food purchase: a case study<br />
Chris Foster 1* , Mark Holmes 2 , Jeremy Wiltshire 2 , Sarah Wynn 2<br />
1 EuGeos Limited, 1 Park Stre<strong>et</strong>, Macclesfield, UK<br />
2 ADAS, Pendeford House, Pendeford Bus<strong>in</strong>ess Park, Wobaston Road, Pendeford, Wolverhampton, WV9 5AP, UK<br />
Correspond<strong>in</strong>g author. E-mail: chrisf@eugeos.co.uk<br />
ABSTRACT<br />
The environmental effects of seasonal food supply and purchase patterns have been explored us<strong>in</strong>g <strong>LCA</strong>, <strong>in</strong> conjunction with research<br />
<strong>in</strong>to consumer perceptions of seasonal food. An <strong>LCA</strong> of raspberries supplied <strong>in</strong> the UK at different times of the year is reported<br />
here. The study was designed specifically to exam<strong>in</strong>e how impacts changed from one date of supply to another. Supply at<br />
different times of the year draws on different production systems and locations. Despite that, the results reveal relatively small differences,<br />
except <strong>in</strong> the case of the water footpr<strong>in</strong>t measures. The results are very sensitive to fruit yield. So <strong>in</strong> this case, yield and agricultural<br />
practice appear stronger drivers of the environmental burden of food production than is time of supply. In such situations a<br />
strong focus on “seasonality” <strong>in</strong> susta<strong>in</strong>able food provision<strong>in</strong>g is unlikely to deliver large environmental benefits.<br />
Keywords: seasonal, fruit, supply pattern, raspberry, <strong>LCA</strong><br />
1. Introduction<br />
As urbanisation progressed <strong>in</strong> the second half of the 20 th Century and the agricultural workforce shrank, so<br />
Western European citizens disengaged from food production, los<strong>in</strong>g their connection with its seasonal patterns.<br />
Recently, <strong>in</strong>terest <strong>in</strong> seasonal foods has been resurgent; Dibb <strong>et</strong> al., (2006) state that 2/3 of people <strong>in</strong><br />
the UK are now “tak<strong>in</strong>g steps to buy seasonally”. This trend has various drivers but - as Dibb <strong>et</strong> al.’s title<br />
suggests - some see implications for the environment <strong>in</strong> it. In l<strong>in</strong>e with this, governmental advice on “susta<strong>in</strong>able<br />
di<strong>et</strong>” often advocates consumption of seasonal food. Seek<strong>in</strong>g additional evidence relevant to such<br />
recommendations, the UK’s Department of the Environment, <strong>Food</strong> and Rural Affairs commissioned a research<br />
project encompass<strong>in</strong>g <strong>in</strong>vestigation of consumers’ perceptions and attitudes to “seasonality” alongside<br />
exploration of the environmental implications of seasonal food purchas<strong>in</strong>g patterns.<br />
1.1. “Seasonal” <strong>Food</strong><br />
A review of literature and consumer research demonstrated that clearly identify<strong>in</strong>g seasonal food is <strong>in</strong> fact<br />
quite difficult. Few commentators take the trouble to def<strong>in</strong>e the term “seasonal”, while consumer research<br />
found that UK consumers “have only a vague def<strong>in</strong>ition of seasonal food”. In essence “very different def<strong>in</strong>itions<br />
and perceptions of what is seasonal are applied by different parties” (Brooks <strong>et</strong> al., 2011). To <strong>in</strong>form<br />
the project, we used two work<strong>in</strong>g def<strong>in</strong>itions of seasonal. The first was a production-oriented or “global”<br />
def<strong>in</strong>ition: food that is outdoor grown or produced dur<strong>in</strong>g the natural grow<strong>in</strong>g/production period for the<br />
country or region where it is produced. It need not necessarily be consumed locally to where it is grown 5 .<br />
The second was a consumer-oriented, more “local”def<strong>in</strong>ition: food that is produced and consumed <strong>in</strong> the<br />
same climatic zone, e.g. UK, without high energy use for climate modification such as heated glasshouses or<br />
high energy use cold storage. The <strong>LCA</strong> element of the research concerned a number of food items which<br />
were expected to me<strong>et</strong> one or the other (or <strong>in</strong>deed both) of these def<strong>in</strong>itions.<br />
1.2. <strong>Food</strong>, seasonality and the environment<br />
In Brooks <strong>et</strong> al., (2011) we briefly outl<strong>in</strong>e how the tim<strong>in</strong>g of agricultural activities <strong>in</strong> any one place can<br />
change the effects of those activities on the wider environment impacts, even if the activities rema<strong>in</strong> the<br />
same. But as food production for supply <strong>in</strong> a certa<strong>in</strong> place is shifted further away <strong>in</strong> time from the “natural”<br />
time of production there, so one or both of two th<strong>in</strong>gs occurs: either the nature of the produc<strong>in</strong>g activity<br />
changes (e.g. through the <strong>in</strong>troduction of crop protection) or the place of production changes. Furthermore,<br />
preservation and storage allow the time of production and the time of supply to be separated, <strong>in</strong>troduc<strong>in</strong>g<br />
further flexibility <strong>in</strong>to the supply system. F<strong>in</strong>ally of course, consumers also have access to preservation and<br />
storage, so can separate the time of supply from the moment of consumption.<br />
Each of these adjustments changes the <strong>in</strong>teraction b<strong>et</strong>ween the food system and the natural environment surround<strong>in</strong>g<br />
it: different production systems for the same basic foodstuff have different yields and require different<br />
<strong>in</strong>puts, almost all preservation techniques require energy <strong>in</strong>puts, as does cold storage. The fact that<br />
5 This was orig<strong>in</strong>ally suggested <strong>in</strong> Defra’s project specification
PARALLEL SESSION 7C: FOOD CHAIN AND FOOD WASTE 8 th Int. Conference on <strong>LCA</strong> <strong>in</strong> the<br />
Agri-<strong>Food</strong> Sector, 1-4 Oct <strong>2012</strong><br />
these adjustments can be made at different po<strong>in</strong>ts <strong>in</strong> a generic food production-consumption system is a<br />
strong <strong>in</strong>dicator that life cycle assessment will be an effective tool to explore their environmental implications.<br />
In this project, certa<strong>in</strong> foods were selected as case studies through which the environmental implications<br />
of different adjustments could be explored. The foods were lamb, potatoes, raspberry, strawberry and<br />
two exotic fruits: melon and p<strong>in</strong>eapple. This paper draws on the raspberry case study to illustrate how environmental<br />
impacts vary across the year for one food consumed <strong>in</strong> the UK. The project did not explore storage<br />
and preservation by the consumer, so considered only the effect of chang<strong>in</strong>g the times of production and<br />
supply <strong>in</strong> the system as far as delivery to the food r<strong>et</strong>ailer.<br />
2. M<strong>et</strong>hods<br />
2.1 Scope<br />
In this research, we equate (reflect<strong>in</strong>g ma<strong>in</strong>stream economics and consumer data) consumption with purchase,<br />
and purchase with supply. This embodies a simplification: it is possible that consumers store foods for<br />
extended periods after purchas<strong>in</strong>g them. The effect of this, if it occurs, was not considered <strong>in</strong> the <strong>LCA</strong>; it<br />
would make food consumption less “seasonal” than statistics would lead us to believe it is. Some of the volume<br />
captured by this data is supplied to commercial buyers rather than f<strong>in</strong>al consumers, of course. This is<br />
still purchase, however, and there seems to be no reason to try to exclude it.<br />
Fig. 1 shows UK supply of raspberries changes through the year <strong>in</strong> volume and by source (data compiled<br />
from UK production 6 and import 7 statistics). There is scarcely comp<strong>et</strong>ition b<strong>et</strong>ween local production - certa<strong>in</strong>ly<br />
“seasonal” accord<strong>in</strong>g to the consumer-oriented def<strong>in</strong>ition above - and imports, which are “seasonal”<br />
only accord<strong>in</strong>g to the global def<strong>in</strong>ition; rather imports complement local produce <strong>in</strong> an overall supply pattern.<br />
To ga<strong>in</strong> some <strong>in</strong>sight <strong>in</strong>to the environmental implications of this supply pattern an <strong>LCA</strong> of raspberries<br />
was conducted. This covered 3 functional units:<br />
A. 1kg raspberries delivered fresh to a supermark<strong>et</strong> distribution centre (RDC) <strong>in</strong> May<br />
B. 1kg raspberries delivered fresh to a supermark<strong>et</strong> RDC <strong>in</strong> July<br />
C. 1kg raspberries delivered frozen to a supermark<strong>et</strong> RDC <strong>in</strong> November<br />
Figure 1. UK Raspberry Supply 2007. Sources: Defra Horticultural Statistics, UK Trade Statistics<br />
Reflect<strong>in</strong>g the sources and production techniques relevant to them, an appropriate product system for A <strong>in</strong>volved<br />
production <strong>in</strong> Southern Spa<strong>in</strong>. In this system, raspberries are grown on an annual basis <strong>in</strong> fields that<br />
are covered for the whole season with “Spanish” tunnels. The ground is prepared each year and beds then<br />
formed. The plant<strong>in</strong>g material (canes) is produced <strong>in</strong> the UK or N<strong>et</strong>herlands and transported to the produc<strong>in</strong>g<br />
site <strong>in</strong> chilled lorries. The canes are kept for 3-4 weeks <strong>in</strong> a cold store prior to plant<strong>in</strong>g, then planted directly<br />
through plastic <strong>in</strong>to the pre-prepared beds. Fertilisers are applied through drip irrigation: nitrogen as<br />
ammonium nitrate or potassium nitrate. Irrigation draws water from an aquifer. Harvest<strong>in</strong>g occurs by hand<br />
with the fruit then transported directly to the packhouse; yield is 8 tonnes per ha. In the packhouse the fruit is<br />
graded and cleaned, before be<strong>in</strong>g placed <strong>in</strong>to punn<strong>et</strong>s with a plastic film lid. Punn<strong>et</strong>s are cooled <strong>in</strong> a cold<br />
store prior to export <strong>in</strong> refrigerated trucks which travel 2,500km from Spa<strong>in</strong> to the UK.<br />
6 Department of Environment, <strong>Food</strong> and Rural Affairs Horticultural Statistics: www.defra.gov.uk/statistics/foodfarm/landuselivestock/bhs/<br />
7 HM Revenue & Customs Trade Statistics: https://www.uktrade<strong>in</strong>fo.com/Pages/Home.aspx<br />
621
PARALLEL SESSION 7C: FOOD CHAIN AND FOOD WASTE 8 th Int. Conference on <strong>LCA</strong> <strong>in</strong> the<br />
Agri-<strong>Food</strong> Sector, 1-4 Oct <strong>2012</strong><br />
For B and C production was <strong>in</strong> the east of England, on canes grown for seven years <strong>in</strong> fields covered with<br />
polytunnels dur<strong>in</strong>g fruit<strong>in</strong>g. In this case <strong>in</strong> the first year the ground is prepared, beds formed and soil sterilised<br />
(e.g. with chloropicr<strong>in</strong>). The canes are produced on a separate farm, cold stored prior to plant<strong>in</strong>g, then<br />
planted directly through plastic <strong>in</strong>to the pre-prepared beds. On an annual basis (for seven crops) fertilisers<br />
are applied through drip irrigation <strong>in</strong>clud<strong>in</strong>g nitrogen fertiliser as ammonium nitrate or potassium nitrate.<br />
Irrigation uses water from an aquifer. Fruit is hand-harvested then transported directly to the packhouse.<br />
Yield averages 12t/ha per year for the seven cropp<strong>in</strong>g years. In the packhouse the fruit is graded and cleaned,<br />
before be<strong>in</strong>g placed <strong>in</strong>to punn<strong>et</strong>s with a plastic film lid. Punn<strong>et</strong>s are cooled <strong>in</strong> a cold store prior to distribution<br />
<strong>in</strong> refrigerated trucks. At the end of the season the soil b<strong>et</strong>ween the beds is pulverised to reduce compaction.<br />
At the end of the seven years the crop is grubbed out, the ground sub-soiled and the plastic rolled up<br />
and recycled. For C, the product system <strong>in</strong>cluded frozen storage from the assumed time of harvest (July)<br />
until the time of delivery to the r<strong>et</strong>ail distribution centre (RDC). These production techniques are commonlyencountered<br />
ones produc<strong>in</strong>g for the UK supply pattern, although they are not the only ones.<br />
2.2. Boundaries<br />
The product systems <strong>in</strong>corporated production of fertilisers, canes, packag<strong>in</strong>g, fuels and all other <strong>in</strong>puts. Production<br />
of material for polytunnels was <strong>in</strong>cluded, but other capital equipment was excluded so that the calculations<br />
of global warm<strong>in</strong>g potential were compliant with PAS 2050 (2008). For the production system <strong>in</strong><br />
B&C, an additional year of operation without any crop production was <strong>in</strong>cluded as an allowance for cane<br />
production, for which direct data were unavailable.<br />
2.3. Data<br />
Primary data from <strong>in</strong>dividual operat<strong>in</strong>g locations were used to characterise agricultural operations, with expert<br />
consultation used to fill data gaps. Background data for <strong>in</strong>puts such as fertilisers, fuel and poly<strong>et</strong>hylene<br />
film were taken from the eco<strong>in</strong>vent database v2. Data characteris<strong>in</strong>g outdoor production of raspberry canes<br />
<strong>in</strong> the UK were based on the data provided for raspberry fruit production outdoors <strong>in</strong> the UK and advice from<br />
a horticultural expert on likely per ha yields. M<strong>et</strong>hane and nitrous oxide emissions were calculated us<strong>in</strong>g the<br />
m<strong>et</strong>hod s<strong>et</strong> out <strong>in</strong> the IPPC’s (2006) Guidel<strong>in</strong>es for National Greenhouse Gas Inventories. This aligned the<br />
m<strong>et</strong>hod with PAS 2050:2008. A s<strong>in</strong>gle s<strong>et</strong> of data, from one of the operat<strong>in</strong>g locations, was used to characterise<br />
all packhouse operations and packag<strong>in</strong>g.<br />
A datas<strong>et</strong> for chill<strong>in</strong>g and short-term cold storage of soft fruit was developed to characterise packhouse operations<br />
and storage prior to transhipment either to the RDC or to a long-term cold-storage location. This<br />
embodied data provided by one bus<strong>in</strong>ess participat<strong>in</strong>g <strong>in</strong> the study. To create an appropriate datas<strong>et</strong> for an<br />
equivalent operation <strong>in</strong> Spa<strong>in</strong>, the source of electricity used was changed from the UK grid to the Spanish<br />
one; energy consumption was assumed to be the same <strong>in</strong> both locations – i.e. any additional cool<strong>in</strong>g energy<br />
required <strong>in</strong> the warmer climate of Spa<strong>in</strong> was ignored. A datas<strong>et</strong> characteris<strong>in</strong>g frozen storage was also developed,<br />
encompass<strong>in</strong>g energy use and refrigerant loss and account for the burdens of provid<strong>in</strong>g a unit volume<br />
of cold storage capacity for a unit time; energy use <strong>in</strong> cold stores was taken from a review of UK facilities<br />
(Evans n.d); a mixture of gases was used to represent emissions to air to reflect the range of gases used<br />
(R404A and NH3). It is worth not<strong>in</strong>g that the range of specific energy use (energy use per volume) <strong>in</strong> cold<br />
stores found by Evans is very wide for each temperature regime studied (a factor of 8 b<strong>et</strong>ween most and least<br />
efficient) and this performance variation dwarfs any differences b<strong>et</strong>ween the energy requirements associated<br />
with the different temperature regimes (i.e. “frozen” and “chilled”). Because most <strong>LCA</strong> results for food<br />
products relate to a unit mass of product, figures for mass of product per unit of storage volume were taken<br />
from Brunel University (2009) to calculate the cold storage volume needed for 1kg raspberries. F<strong>in</strong>ally, a<br />
datas<strong>et</strong> for the unit operation of road transport <strong>in</strong> refrigerated trucks was developed us<strong>in</strong>g values for fuel<br />
consumption, vehicle utilisation and refrigerant loss given by Brunel University (2009); emissions per unit of<br />
fuel used were taken from eco<strong>in</strong>vent v2.1<br />
2.4. Impact Assessment<br />
Impact assessment was conducted for environmental categories deemed relevant to the project. Category and<br />
impact assessment m<strong>et</strong>hod selection also reflected Defra’s desire for the study’s results to be as compatible<br />
as possible with results from previous <strong>LCA</strong>s of UK agricultural commodities, particularly those produced by<br />
Williams <strong>et</strong> al., (2009). Therefore, CML midpo<strong>in</strong>t m<strong>et</strong>hods were used for the categories global warm<strong>in</strong>g,<br />
622
PARALLEL SESSION 7C: FOOD CHAIN AND FOOD WASTE 8 th Int. Conference on <strong>LCA</strong> <strong>in</strong> the<br />
Agri-<strong>Food</strong> Sector, 1-4 Oct <strong>2012</strong><br />
eutrophication, acidification and photochemical oxidation. In addition agricultural land occupancy was reported<br />
<strong>in</strong> units of m 2 .yr. (the result obta<strong>in</strong>ed by simply add<strong>in</strong>g all land occupation of all classes <strong>in</strong> the <strong>in</strong>ventory),<br />
as were the unweighted water footpr<strong>in</strong>t (to the m<strong>et</strong>hod described by Hoeskstra and Chapaga<strong>in</strong>, (2008);<br />
weighted water footpr<strong>in</strong>t (us<strong>in</strong>g a m<strong>et</strong>hod very similar to that outl<strong>in</strong>ed by Ridoutt and Pfister (2009) whereby<br />
a water stress characterisation factor for produc<strong>in</strong>g locations was <strong>in</strong>troduced through the use of a water stress<br />
<strong>in</strong>dex (WSI, Pfister <strong>et</strong> al., 2009) to “weight” the water use accord<strong>in</strong>g to the degree of water stress at the place<br />
of use) and environmental impact quotient (EIQ, Kovach <strong>et</strong> al., 1992) of pesticides used.<br />
3. Results<br />
The impact assessment results are shown <strong>in</strong> Table 1.<br />
Table 1. LCIA results, raspberries <strong>in</strong> the UK at different times of year.<br />
Product System<br />
Impact Category<br />
A. Raspberries,<br />
fresh at UK RDC <strong>in</strong><br />
May<br />
B. Raspberries fresh<br />
at UK RDC <strong>in</strong> July<br />
C. Raspberries frozen<br />
at UK RDC <strong>in</strong> November<br />
GWP100 (kg CO2 eq) 7.3 7.4 7.7<br />
Water footpr<strong>in</strong>t (WF) (m 3 Virtual water) 2.7 1.3 1.3<br />
Weighted WF (m 3 Virtual water) 2.7 0.09 0.09<br />
Agricultural land occupation (m 2 .yr) 1.5 1.6 1.6<br />
Pesticide hazard <strong>in</strong>dicator E.I.Q. 0.3 0.3 0.3<br />
Abiotic depl<strong>et</strong>ion (kg antimony eq.) 0.01 0.004 0.006<br />
Photochemical oxidation - high NOx (kg<br />
<strong>et</strong>hylene eq.)<br />
0.0004 0.0001 0.0002<br />
Acidification - (kg SO2 eq.) 0.01 0.003 0.004<br />
Eutrophication (kg PO4--- eq.) 0.005 0.004 0.004<br />
Sensitivity analysis was undertaken to assess the effect on the LCIA results of raspberry cane yield (no.<br />
Per ha) for case A and of cold-store operat<strong>in</strong>g param<strong>et</strong>ers for case C. Selected results are shown <strong>in</strong> Table 2<br />
(below). Results for impact categories driven strongly by horticultural process param<strong>et</strong>ers (for example, land<br />
occupation, GWP) are, as expected, highly sensitive to product yield. Categories to which transport process<br />
emissions contribute more (notably acidification) are of course less sensitive to this factor. Sensitivity to<br />
other param<strong>et</strong>ers was found to be weaker than to those <strong>in</strong>cluded <strong>in</strong> the Table. For cold storage, small variations<br />
<strong>in</strong> energy consumption per unit volume are less significant <strong>in</strong>fluences on overall <strong>LCA</strong> results than the<br />
nature of the refrigerant used and assumed loss rates for the more environmentally-significant refrigerants.<br />
4. Discussion<br />
The differences b<strong>et</strong>ween the LCIA results for the three cases of raspberry supply are not large, except for the<br />
water footpr<strong>in</strong>t measures. The fact that both canes and fruit are subject to long-distance refrigerated transport<br />
is a significant factor beh<strong>in</strong>d the higher acidification and abiotic depl<strong>et</strong>ion values obta<strong>in</strong>ed for raspberries<br />
delivered fresh <strong>in</strong> May (A); for example product transport accounts for 35% of the acidification potential for<br />
A but 18% of the acidification potential for B. The close similarity b<strong>et</strong>ween the EIQ values obta<strong>in</strong>ed partly<br />
results from the use of expert consultation to fill data gaps; results obta<strong>in</strong>ed for strawberries with<strong>in</strong> the same<br />
project (for which the pesticide use data was of higher quality) suggest that differences <strong>in</strong> soil sterilant applications<br />
rates and frequencies can have a significant <strong>in</strong>fluence on this <strong>in</strong>dicator.<br />
623
PARALLEL SESSION 7C: FOOD CHAIN AND FOOD WASTE 8 th Int. Conference on <strong>LCA</strong> <strong>in</strong> the<br />
Agri-<strong>Food</strong> Sector, 1-4 Oct <strong>2012</strong><br />
Table 2. Sensitivity analysis results<br />
Impact Category<br />
GWP100 (kg<br />
CO2 eq)<br />
Water footpr<strong>in</strong>t<br />
(WF) (m 3<br />
Virtual water)<br />
Weighted WF<br />
(m 3 Virtual<br />
water)<br />
Agricultural<br />
land occupation<br />
(m 2 .yr)<br />
Pesticide hazard<br />
<strong>in</strong>dicator<br />
E.I.Q.<br />
Abiotic depl<strong>et</strong>ion<br />
(kg anti-<br />
mony eq.)<br />
Photochemical<br />
oxidation -<br />
high NOx (kg<br />
<strong>et</strong>hylene eq.)<br />
Acidification -<br />
(kg SO2 eq.)<br />
Eutrophication<br />
(kg PO4--- eq.)<br />
624<br />
A. Raspberries,<br />
fresh at<br />
UK RDC <strong>in</strong><br />
May (base)<br />
A1. Raspberries,<br />
fresh at UK<br />
RDC <strong>in</strong><br />
May, fruit<br />
yield +10%<br />
A2. Raspberries<br />
fresh at UK<br />
RDC <strong>in</strong><br />
May, cane<br />
yield +30%<br />
Product System<br />
B. Raspberries<br />
fresh at UK<br />
RDC <strong>in</strong><br />
July<br />
B1. Raspberries<br />
fresh at UK<br />
RDC <strong>in</strong><br />
July, yield<br />
+10%<br />
C. Raspberries<br />
frozen<br />
at UK RDC<br />
<strong>in</strong> November<br />
C1. Raspberries<br />
frozen at UK<br />
RDC <strong>in</strong><br />
November,<br />
maximal<br />
cold-store<br />
occupancy<br />
7.3 5.7 6.0 7.4 6.7 7.7 7.5<br />
2.7<br />
2.7<br />
Not calculated<br />
Not calculated<br />
Not calculated<br />
Not calculated<br />
1.3<br />
0.09<br />
Not calculated<br />
Not calculated<br />
1.3<br />
0.09<br />
Not calculated<br />
Not calculated<br />
1.5 1.3 1.5 1.6 1.5 1.6 1.6<br />
0.3 0.3 0.3 0.3 0.3 0.3 0.3<br />
0.01 0.01 0.01 0.004 0.004 0.006 0.005<br />
0.0004 0.0004 0.0004 0.0001 0.0001 0.0002 0.0002<br />
0.01 0.008 0.009 0.003 0.003 0.004 0.003<br />
0.005 0.004 0.005 0.004 0.003 0.004 0.003<br />
For impact categories other than water, likely (e.g. year-to-year) variations <strong>in</strong> fruit yield and cane yield<br />
could rise to variations <strong>in</strong> the results obta<strong>in</strong>ed for one particular case greater than the differences b<strong>et</strong>ween the<br />
different cases shown <strong>in</strong> Table 1.<br />
N2O emissions from horticulture contribute a large proportion of the GWP: 75% for A and more than<br />
90% for B and C. However, <strong>in</strong> this project the calculation of N2O emissions from soil follow<strong>in</strong>g the <strong>in</strong>corporation<br />
of crop residues both <strong>in</strong> the UK or overseas was highly problematic. The IPCC 2006 m<strong>et</strong>hod us<strong>in</strong>g the<br />
tier 1 approach is complex and uses many default values for specific crops or crop groups. A large number of<br />
crops are not represented <strong>in</strong> the IPCC m<strong>et</strong>hod, therefore default data relevant to several of the products considered<br />
<strong>in</strong> this project – <strong>in</strong>clud<strong>in</strong>g raspberries - were not available. Data for another crop product were used<br />
as a proxy, but this <strong>in</strong>troduces a further element of uncerta<strong>in</strong>ty.<br />
The production of poly<strong>et</strong>hylene contributes some 25% of the abiotic depl<strong>et</strong>ion potential <strong>in</strong> A. Tunnels account<br />
for the majority of the poly<strong>et</strong>hylene <strong>in</strong> this case. While there is some uncerta<strong>in</strong>ty about the fate and<br />
longevity of the material used for these tunnels <strong>in</strong> practice, extend<strong>in</strong>g the material’s life and recycl<strong>in</strong>g it<br />
when it is no longer useable are clearly desirable.<br />
In case C (frozen raspberries supplied <strong>in</strong> November) no allowance was made for loss or spoilage dur<strong>in</strong>g<br />
cold storage. Such losses <strong>in</strong>crease the impacts associated with supplied product but no relevant data for loss<br />
rates were available when the work was conducted. Recent work by WRAP (Terry <strong>et</strong> al., 2011) provides an<br />
estimate of 2-3% losses of fresh raspberries <strong>in</strong> pack<strong>in</strong>g and <strong>in</strong> r<strong>et</strong>ail stores, but provides no estimate for<br />
losses of packed fruit consigned to frozen storage. The loss rates found for pack<strong>in</strong>g are similar to those used<br />
<strong>in</strong> this study.<br />
5. Conclusions<br />
An <strong>LCA</strong> has been compl<strong>et</strong>ed of a soft fruit supplied <strong>in</strong> the UK at three different times of the year. The<br />
impact assessment results are quite similar across all three, perhaps surpris<strong>in</strong>gly so <strong>in</strong> light of the operational<br />
differences b<strong>et</strong>ween the supply systems. The <strong>in</strong>fluence on environmental impact of the place of production
PARALLEL SESSION 7C: FOOD CHAIN AND FOOD WASTE 8 th Int. Conference on <strong>LCA</strong> <strong>in</strong> the<br />
Agri-<strong>Food</strong> Sector, 1-4 Oct <strong>2012</strong><br />
shows through strongly <strong>in</strong> the weighted water footpr<strong>in</strong>t. This impact assessment m<strong>et</strong>hod has, of course, location-sensitivity<br />
built <strong>in</strong>to it; it may be that if regionalised m<strong>et</strong>hods been used for other categories (notably<br />
eutrophication), the <strong>in</strong>fluence of place would have shown <strong>in</strong> those too.<br />
Compar<strong>in</strong>g the results obta<strong>in</strong>ed for the different cases with the results of the sensitivity analysis suggests<br />
that, <strong>in</strong> this case at least, yield and agricultural practice are stronger drivers of the environmental burden of<br />
food production than is time of supply. In such situations a strong focus on “seasonality” <strong>in</strong> susta<strong>in</strong>able food<br />
provision<strong>in</strong>g is unlikely to deliver large environmental benefits.<br />
That said, the scop<strong>in</strong>g phase of the work highlighted challenges fac<strong>in</strong>g any assessment of the environmental<br />
impacts associated with a shift towards “seasonal food consumption”. If such a shift occurred at any<br />
significant scale, it would presumably <strong>in</strong>volve a complex adjustment of food purchas<strong>in</strong>g and consumption<br />
patterns. Given the association of seasonal food provision<strong>in</strong>g with economic and social benefits, understand<strong>in</strong>g<br />
the environmental implications of that rema<strong>in</strong>s a desirable aim. Future work should look beyond s<strong>in</strong>gle<br />
food items. In do<strong>in</strong>g so, differences <strong>in</strong> understand<strong>in</strong>gs of seasonal food, modern health norms (e.g. “5-aday”)<br />
and 21 st -century consumer expectations 8 must be taken <strong>in</strong>to account <strong>in</strong> order to identify a realistic consumption<br />
or purchas<strong>in</strong>g pattern to assess.<br />
6. References<br />
Brooks, M., Foster, C., Holmes M., Wiltshire J., 2011. Does consum<strong>in</strong>g seasonal foods benefit the environment? British Nutrition<br />
Bull<strong>et</strong><strong>in</strong>, 36, 449-453.<br />
Brunel University, 2009. Greenhouse Gas Impacts of <strong>Food</strong> R<strong>et</strong>ail<strong>in</strong>g - report of project FO 0405. Defra, London.<br />
Dibb, S., Coll<strong>in</strong>s, J. and Mayo, E., 2006. Season’s Promise: an enjoyable way to tackle climate change. National Consumer Council.<br />
Evans, J., n.d. Cold storage of food. Review of available <strong>in</strong>formation on energy consumption and energy sav<strong>in</strong>gs options. FRPERC,<br />
University of Bristol.<br />
Foster. C., McMeek<strong>in</strong>, A., Mylan, J., <strong>2012</strong>. The entanglement of consumer expectations and (eco) <strong>in</strong>novation sequences. Technology<br />
Analysis and Strategic Management, 24, 391-405.<br />
Freidberg, S., 2009. Fresh, a Perishable History. Harvard University Press, Cambridge, Mass.<br />
Hoekstra, A.Y. and Chapaga<strong>in</strong>, A.K., 2008. Globalization of water: Shar<strong>in</strong>g the plan<strong>et</strong>'s freshwater resources, Blackwell Publish<strong>in</strong>g,<br />
Oxford, UK.<br />
Kovach, J., P<strong>et</strong>zoldt, C., Degnil, J. <strong>et</strong> al., 1992. A m<strong>et</strong>hod to measure the environmental impact of pesticides. New York's <strong>Food</strong> and<br />
Life Sci. Bull. 139, 1-8.<br />
Pfister, S., Koehler, A. and Hellweg, S., 2009. Assess<strong>in</strong>g the environmental impacts of freshwater consumption <strong>in</strong> <strong>LCA</strong>. Environmental<br />
Science and Technology 43, 4098-4104.<br />
Ridoutt, B.G., Pfister, S., 2010. A revised approach to water footpr<strong>in</strong>t<strong>in</strong>g to make transparent the impacts of consumption and production<br />
on global freshwater scarcity. Global Environmental Change - Human and Policy Dimensions, 20 (1), 113-120.<br />
Terry,L.A., Mena, C., Williams, A., Jenney, N., Whitehead, P., 2011. Fruit and veg<strong>et</strong>able resource maps: f<strong>in</strong>al report of project<br />
RSC008, WRAP, Banbury.<br />
Williams, A.G., Pell, E., Webb, J., Tribe, E., Evans, D., Moorhouse, E. & Watkiss, P., 2009. Comparative Life Cycle Assessment of<br />
<strong>Food</strong> Commodities Procured for UK Consumption through a Diversity of Supply Cha<strong>in</strong>s - F<strong>in</strong>al Report for Defra Project<br />
FO0103. Defra, London.<br />
8 For a discussion of the co-evolution of consumer expectations and food products, see Foster <strong>et</strong> al., (<strong>2012</strong>) or Freidberg (2009)<br />
625
PARALLEL SESSION 7C: FOOD CHAIN AND FOOD WASTE 8 th Int. Conference on <strong>LCA</strong> <strong>in</strong> the<br />
Agri-<strong>Food</strong> Sector, 1-4 Oct <strong>2012</strong><br />
626<br />
<strong>Food</strong> waste from cheese and yoghurt <strong>in</strong> a life cycle perspective<br />
Hanne Møller * , Vibeke Schakenda, Ole Jørgen Hanssen<br />
Ostfold Research, Gamle Bedd<strong>in</strong>gv. 2b, 1671 Kråkerøy, Norway<br />
Correspond<strong>in</strong>g author. E-mail: hanne.moller@ostfoldforskn<strong>in</strong>g.no<br />
ABSTRACT<br />
<strong>Food</strong> waste is a major contributor to climate change, however many <strong>LCA</strong> studies do not <strong>in</strong>clude it. In this carbon footpr<strong>in</strong>t case study<br />
of cheese and yoghurt, specific data relat<strong>in</strong>g to food waste at the r<strong>et</strong>ail stage have been <strong>in</strong>cluded for both products, and, <strong>in</strong> the case of<br />
cheese, also at the consumer stage. The cheese case study compares sliced cheese with cheese <strong>in</strong> a whole piece. The waste at the<br />
consumer stage is significantly higher for the whole piece of cheese than sliced cheese, but the opposite is found when one considers<br />
the use of packag<strong>in</strong>g material. When one looks at the total life cycle, sliced cheese has slightly lower global warm<strong>in</strong>g potential when<br />
compared with cheese <strong>in</strong> a whole piece. This reveals how the <strong>in</strong>creased use of packag<strong>in</strong>g materials can result <strong>in</strong> a lower impact on<br />
global warm<strong>in</strong>g, where the packag<strong>in</strong>g solution reduces product waste. In the yoghurt case study <strong>LCA</strong>, four different sizes of product<br />
and correspond<strong>in</strong>g packag<strong>in</strong>g systems are compared. The results show that the packag<strong>in</strong>g for the largest product unit had the lowest<br />
total global warm<strong>in</strong>g potential.<br />
Keywords: <strong>LCA</strong>, cheese, yoghurt, consumption, food waste, packag<strong>in</strong>g<br />
1. Introduction<br />
<strong>Food</strong> waste or loss is measured only for products that are directed to human consumption, exclud<strong>in</strong>g feed<br />
and parts of products which are not edible. In the early life cycle stages (production, postharvest and process<strong>in</strong>g<br />
stages) food loss can be def<strong>in</strong>ed as loss. At later stages of the life cycle (r<strong>et</strong>ail and f<strong>in</strong>al consumption) the<br />
term food waste is applied and generally relates to behavioural issues (FAO, 2011).<br />
<strong>Food</strong> waste can make a major contribution to climate change. <strong>Food</strong> waste creates impact both dur<strong>in</strong>g production<br />
of the wasted product, and from waste treatment. In many <strong>LCA</strong> studies food waste as an element, has<br />
not been <strong>in</strong>cluded, or <strong>in</strong>cluded only with data based on assumptions.<br />
Packag<strong>in</strong>g and packag<strong>in</strong>g waste is a major concern, both <strong>in</strong> the environmental debate and <strong>in</strong> governmental<br />
regulations and policies. Packag<strong>in</strong>g waste is a highly visible problem both domestically and <strong>in</strong> the r<strong>et</strong>ail sector.<br />
Other case studies have focused on packag<strong>in</strong>g, and shown that the packag<strong>in</strong>g itself has little significance<br />
for the product system as a whole (Busser and Jungbluth, 2009). With regard to packag<strong>in</strong>g, the follow<strong>in</strong>g<br />
factors can affect the amount of food waste relat<strong>in</strong>g to the product: improved <strong>in</strong>formation about the best before<br />
date; packag<strong>in</strong>g size adjusted to the consumer, and use of packag<strong>in</strong>g barrier properties which can <strong>in</strong>crease<br />
shelf life. There is no doubt that environmental impact can be significantly reduced with a decrease <strong>in</strong><br />
food waste, however the extent to which new packag<strong>in</strong>g solutions can <strong>in</strong>fluence food waste is not clear (Williams,<br />
2011).<br />
2. M<strong>et</strong>hods and data<br />
The carbon footpr<strong>in</strong>t case study on cheese and yoghurt, aims to show comparisons b<strong>et</strong>ween different<br />
product and packag<strong>in</strong>g solutions. The functional unit is the consumption of 1 kg cheese and 1 kg yoghurt<br />
respectively, <strong>in</strong> different packag<strong>in</strong>g solutions. The product system comprises the entire life cycle from cradle<br />
to grave. The data for farm<strong>in</strong>g and dairy produce is based on a review of literature relat<strong>in</strong>g to dairy products<br />
(IDF, 2009). This review considered 60 studies on the environmental impact of dairy products, and the averages<br />
are used <strong>in</strong> this case study on cheese and yoghurt. The case study has a particular focus on food waste<br />
and packag<strong>in</strong>g. For both products, specific data relat<strong>in</strong>g to food waste at the r<strong>et</strong>ail stage have been <strong>in</strong>cluded<br />
and, <strong>in</strong> the case of cheese, food waste at the consumer stage has also been <strong>in</strong>cluded.<br />
The life cycle of MAP-packed sliced cheese and vacuum packed whole piece cheese have been chosen as<br />
examples, <strong>in</strong> order to highlight the issues relat<strong>in</strong>g to optimal pack<strong>in</strong>g for cheese. Similarly, <strong>in</strong> the case of<br />
yoghurt, four different packag<strong>in</strong>g solutions have been selected: a 500 ml cup, an 8*125 ml cup, a duo-cup<br />
and a dr<strong>in</strong>k bottle 0,3 ml..<br />
The data for food waste at the r<strong>et</strong>ail stage have been calculated us<strong>in</strong>g data from a food waste project<br />
(Hanssen and Schakenda, 2011). Data for six r<strong>et</strong>ail stores have been selected, based on revenue (high, medium<br />
and low) and the type of store. Data for these stores have been sorted and food waste calculated <strong>in</strong> each<br />
pack<strong>in</strong>g group for cheese and yoghurt (table 1 and 2).
PARALLEL SESSION 7C: FOOD CHAIN AND FOOD WASTE 8 th Int. Conference on <strong>LCA</strong> <strong>in</strong> the<br />
Agri-<strong>Food</strong> Sector, 1-4 Oct <strong>2012</strong><br />
Table 1. <strong>Food</strong> waste as a percentage for semi hard cheese<br />
<strong>Food</strong> waste% MAP* packed sliced cheese Vacuum packed whole pieces<br />
R<strong>et</strong>ail 1.5 1.6<br />
Consumer 7 12<br />
*MAP - Modified atmosphere packag<strong>in</strong>g<br />
<strong>Food</strong> waste at the consumer stage is measured by d<strong>et</strong>ailed data from a waste sort<strong>in</strong>g analysis (Syversen,<br />
2010). The data is based on household waste from a limited area. Data is only recorded for cheese, the samples<br />
of yoghurt waste be<strong>in</strong>g too small to enable the calculation of food waste.<br />
The data for food waste at the r<strong>et</strong>ail stage is quite similar with regard to the different cheese packag<strong>in</strong>gs.<br />
At the consumer stage the food waste is much higher and <strong>in</strong> addition, it shows a significant difference b<strong>et</strong>ween<br />
the two cheese packag<strong>in</strong>g solutions. In the case of yoghurt the food waste at the r<strong>et</strong>ail stage is higher<br />
for the 500 ml cup than for the other packag<strong>in</strong>g categories.<br />
Table 2. <strong>Food</strong> waste as a percentage for yoghurt<br />
<strong>Food</strong> waste% 500 ml cup 8* 125 ml pack Duo-cup Dr<strong>in</strong>k bottle<br />
R<strong>et</strong>ail 1.8 0.6 0.7 0.8<br />
Consumer - - - -<br />
In the <strong>LCA</strong> m<strong>et</strong>hodology, waste is normally shown as an output from one system to other systems (material<br />
recycl<strong>in</strong>g or energy recovery) or to deposits, where only the impact of waste treatment is <strong>in</strong>cluded.<br />
Product waste <strong>in</strong> each part of the cha<strong>in</strong> can be <strong>in</strong>cluded <strong>in</strong> the reference flow if the functional unit has been<br />
def<strong>in</strong>ed as food be<strong>in</strong>g utilised by the consumer. In that case the food waste will be added to the reference<br />
flow of the product, result<strong>in</strong>g <strong>in</strong> a higher environmental impact from those earlier stages <strong>in</strong> the product life<br />
cycle. However, if the food losses are generated at the r<strong>et</strong>ail and consumer stages, the environmental impact<br />
should also be placed at these stages. This is the account<strong>in</strong>g system used <strong>in</strong> this case study. The global warm<strong>in</strong>g<br />
potential from food waste <strong>in</strong>cludes both emissions from the production of food as it becomes waste and<br />
the emissions from waste treatment.<br />
3. Results<br />
In the <strong>LCA</strong> of cheese and the correspond<strong>in</strong>g packag<strong>in</strong>g systems, sliced cheese is compared to cheese <strong>in</strong><br />
whole pieces (Curran, <strong>2012</strong>). The product system <strong>in</strong>cludes the entire life cycle from cradle to grave (Fig. 1).<br />
S<strong>in</strong>ce the project focuses on packag<strong>in</strong>g solutions and food waste, the data from farm and dairy produce are<br />
average literature data, and thus it has not been possible to refer to specific allocation rules. The pr<strong>in</strong>ciple of<br />
<strong>in</strong>clud<strong>in</strong>g both the impact of the production of food waste on the r<strong>et</strong>ail and consumer stage and the impact of<br />
waste treatment is also shown <strong>in</strong> Fig. 1.<br />
The results show that agricultural production has the most important global warm<strong>in</strong>g potential (Fig. 2).<br />
Consumer waste is much higher for cheese <strong>in</strong> whole pieces than for sliced cheese. The use of packag<strong>in</strong>g material<br />
is 5 times higher for sliced cheese when compared with cheese <strong>in</strong> whole pieces but overall, sliced<br />
cheese has slightly lower global warm<strong>in</strong>g than cheese <strong>in</strong> a whole piece. The packag<strong>in</strong>g system of sliced<br />
cheese itself represents approximately 3% of the total impacts on global warm<strong>in</strong>g, but as shown above it<br />
affects the entire system much more than does the production of packag<strong>in</strong>g and packag<strong>in</strong>g waste. The packag<strong>in</strong>g<br />
for cheese <strong>in</strong> whole pieces represents less than 1% for the total global warm<strong>in</strong>g potential. This shows<br />
how the <strong>in</strong>creased use of packag<strong>in</strong>g materials can result <strong>in</strong> a lower impact, if the packag<strong>in</strong>g solution reduces<br />
product waste.<br />
627
PARALLEL SESSION 7C: FOOD CHAIN AND FOOD WASTE 8 th Int. Conference on <strong>LCA</strong> <strong>in</strong> the<br />
Agri-<strong>Food</strong> Sector, 1-4 Oct <strong>2012</strong><br />
Figure 1. General product system for cheese and yoghurt<br />
Figure 2. Emission of GHG from 1 kg of cheese throughout its life cycle<br />
In the yoghurt case study, four different sizes of product and packag<strong>in</strong>g systems are compared. The result<br />
shows that the packag<strong>in</strong>g for the largest product unit has the lowest total impact on global warm<strong>in</strong>g. The<br />
yoghurt dr<strong>in</strong>k bottle has the highest global warm<strong>in</strong>g potential due to heavy packag<strong>in</strong>g per unit and therefore<br />
also high packag<strong>in</strong>g waste after consumption. The packag<strong>in</strong>g system represents b<strong>et</strong>ween 6% and 14% of<br />
global warm<strong>in</strong>g potential for the four different yoghurt product and packag<strong>in</strong>g systems.<br />
628<br />
Packag<strong>in</strong>g (<strong>in</strong>cl. extraction<br />
of raw materials)<br />
kg CO 2 equivalents per kg product<br />
Farm and dairy<br />
10<br />
9<br />
8<br />
7<br />
6<br />
5<br />
4<br />
3<br />
2<br />
1<br />
0<br />
Literature data<br />
Specific data<br />
T Pack<strong>in</strong>g of product T<br />
Production of product<br />
becom<strong>in</strong>g food waste<br />
T<br />
R<strong>et</strong>ail Consumer<br />
Treatment of food<br />
waste<br />
Sliced cheese Cheese whole piece<br />
Farm and dairy Packag<strong>in</strong>g Distribution R<strong>et</strong>ail food<br />
waste<br />
Consumer food<br />
waste<br />
Production of product<br />
becom<strong>in</strong>g food waste<br />
Treatment of food<br />
waste<br />
Packag<strong>in</strong>g<br />
waste<br />
Total<br />
Waste<br />
treatment of<br />
packag<strong>in</strong>g
PARALLEL SESSION 7C: FOOD CHAIN AND FOOD WASTE 8 th Int. Conference on <strong>LCA</strong> <strong>in</strong> the<br />
Agri-<strong>Food</strong> Sector, 1-4 Oct <strong>2012</strong><br />
Kg CO 2- equivalents per kg product<br />
1,6<br />
1,4<br />
1,2<br />
1,0<br />
0,8<br />
0,6<br />
0,4<br />
0,2<br />
0,0<br />
500 ml cup 8*125 g pack Duo cup 195 g Dr<strong>in</strong>k bottle 300 g<br />
Farm and dairy Packag<strong>in</strong>g Distribution R<strong>et</strong>ail food waste Packag<strong>in</strong>g waste Total<br />
Figure 3. Emission of GHG from 1 kg of yoghurt throughout its life cycle<br />
4. Discussion<br />
The case studies focus on global warm<strong>in</strong>g throughout the products' life cycle, the packag<strong>in</strong>g system and<br />
loss through product waste. The life cycles of both sliced cheese and a whole piece of cheese are used as<br />
examples to show the issues of optimal pack<strong>in</strong>g. The largest difference b<strong>et</strong>ween the two product systems is<br />
the production of the packag<strong>in</strong>g and consumer waste. Production of packag<strong>in</strong>g for sliced cheese has about 5<br />
times the global warm<strong>in</strong>g potential for that of cheese <strong>in</strong> a whole piece due to a higher packag<strong>in</strong>g weight per<br />
kg of cheese. The waste among consumers is significantly higher for the whole piece of cheese than sliced<br />
cheese. In total, sliced cheese has a slightly lower impact on global warm<strong>in</strong>g compared with cheese <strong>in</strong> a<br />
whole piece. This shows how the <strong>in</strong>creased use of packag<strong>in</strong>g materials can be compensated if the packag<strong>in</strong>g<br />
solution reduces product waste.<br />
The result for yoghurt shows that the largest product unit has the lowest global warm<strong>in</strong>g potential. This<br />
corresponds to another <strong>LCA</strong> study of yoghurt and its packag<strong>in</strong>g solutions (Busser and Jungbluth, 2009). The<br />
duo cup has lower global warm<strong>in</strong>g potential from the farm and dairy, as part of the product is muesli, which<br />
<strong>in</strong> itself has a lower impact on global warm<strong>in</strong>g.<br />
Reduction of waste is often the most important action <strong>in</strong> packag<strong>in</strong>g optimisation. The study also shows<br />
that packag<strong>in</strong>g optimisation should be based on the packag<strong>in</strong>g function, and focus on the entire value cha<strong>in</strong>,<br />
not just on the packag<strong>in</strong>g itself. This case study is an example of how packag<strong>in</strong>g can affect the amount of<br />
food loss. It will not be possible to apply this as a generalisation for all product types, but it provides a good<br />
documentation of how a new product and packag<strong>in</strong>g system can, <strong>in</strong> some cases, reduce the impact on global<br />
warm<strong>in</strong>g. It is important to use the results of further product development, but also to <strong>in</strong>crease understand<strong>in</strong>g<br />
among consumers <strong>in</strong> order to reduce food waste.<br />
5. Conclusion<br />
The carbon footpr<strong>in</strong>t study shows the effects on global warm<strong>in</strong>g of products and packag<strong>in</strong>g systems, focus<strong>in</strong>g<br />
on packag<strong>in</strong>g and food waste. The results of the study support the exist<strong>in</strong>g research (Williams <strong>et</strong> al.,<br />
2008 and Johansson, 2002) but are now made more robust by the use of specific data for product waste. A<br />
packag<strong>in</strong>g system with a larger packag<strong>in</strong>g consumption can be justified with reduced global warm<strong>in</strong>g potential<br />
if it avoids product waste. Reduction of waste is often the most important action <strong>in</strong> packag<strong>in</strong>g optimisation.<br />
6. References<br />
Büsser, S., Jungbluth, N.,2009, The role of flexible packag<strong>in</strong>g <strong>in</strong> the life cycle of coffee and butter. Presentasjon på 15th SETAC<br />
Case Studies Symposium. www.esu-services.ch<br />
629
PARALLEL SESSION 7C: FOOD CHAIN AND FOOD WASTE 8 th Int. Conference on <strong>LCA</strong> <strong>in</strong> the<br />
Agri-<strong>Food</strong> Sector, 1-4 Oct <strong>2012</strong><br />
Büsser S. and Jungbluth N., 2009. <strong>LCA</strong> of Yoghurt Packed <strong>in</strong> Polystyrene Cup and Alum<strong>in</strong>ium-Based Lidd<strong>in</strong>g. ESU-services Ltd.<br />
Uster, Switzerland. Commissioned by German Alum<strong>in</strong>ium Association (GDA) <strong>in</strong> cooperation with European Alum<strong>in</strong>ium Foil<br />
Association (EAFA), Düsseldorf, Germany.<br />
IDF, 2009. Environmental/Ecological Impact of the Dairy Sector: Literature review on dairy products for an <strong>in</strong>ventory of key issues.<br />
Bull<strong>et</strong><strong>in</strong> of the IDF No. 436/2009. List of environmental <strong>in</strong>itiatives and <strong>in</strong>fluences on the dairy sector<br />
http://ns6924.ovh.n<strong>et</strong>/Residents/filidf/Public/Publication.php?ID=28664.<br />
Curran, M. A., <strong>2012</strong>. “Life Cycle Assessment Handbook: A Guide for Environmentally Susta<strong>in</strong>able Products, (345–368). Scrivener<br />
Publish<strong>in</strong>g. ISBN: 9781118099728<br />
FAO, 2011. Global food losses and food waste. Report fromThe Swedish Institute for <strong>Food</strong> and Biotechnology (SIK) on request<br />
from FAO.<br />
Hanssen, O. J., Schakenda, V., 2011. Analysis of status and trends of food waste <strong>in</strong> Norway 2010-11. Report from the ForMat Project<br />
(<strong>in</strong> Norwegian). Report from Ostfold Research OR 27.11. ISBN 978-82-7520-655-6.<br />
Johansson, 3. 2002. Förpackn<strong>in</strong>gens b<strong>et</strong>ydelse för produktförluster i hemm<strong>et</strong>. Packforsk report nr. 204.<br />
Syversen, F., 2010.Household waste analysis for characterization of usable food waste. <strong>Food</strong> Waste Prevention. Mepex Consult AS.<br />
Februar 2010<br />
Williams, H., Wikström F., Löfgren M., 2008. A life cycle perspective on environmental effects of customer focused packag<strong>in</strong>g<br />
development. Karlstad University, SE-651 88 Karlstad, Sweden. Journal of Cleaner Production 16 (2008) 853e859.<br />
Williams, H., Wikström F., 2011. Environmental impact of packag<strong>in</strong>g and food losses <strong>in</strong> a life cycle perspective: a comparative<br />
analysis of five food items. Karlstad University, SE-651 88 Karlstad, Sweden. Journal of Cleaner Production 19 (2011) 43-48.<br />
630
PARALLEL SESSION 7C: FOOD CHAIN AND FOOD WASTE 8 th Int. Conference on <strong>LCA</strong> <strong>in</strong> the<br />
Agri-<strong>Food</strong> Sector, 1-4 Oct <strong>2012</strong><br />
<strong>Food</strong> waste <strong>in</strong> the food cha<strong>in</strong> and related climate impacts<br />
Juha-Matti Katajajuuri*, Kirsi Silvenno<strong>in</strong>en, Hanna Hartika<strong>in</strong>en, Lotta Jalkanen, H<strong>et</strong>a-Kaisa Koivupuro,<br />
Anu Re<strong>in</strong>ika<strong>in</strong>en<br />
MTT Agrifood Research F<strong>in</strong>land, Responsible <strong>Food</strong> Cha<strong>in</strong> – B<strong>et</strong>ter Consumer Well-be<strong>in</strong>g, 00790 Hels<strong>in</strong>ki, F<strong>in</strong>land<br />
Correspond<strong>in</strong>g author. E-mail: juha-matti.katajajuuri@mtt.fi<br />
ABSTRACT<br />
The F<strong>in</strong>nish <strong>Food</strong>spill study focussed on mapp<strong>in</strong>g the volume and composition of avoidable food waste <strong>in</strong> the F<strong>in</strong>nish food production-consumption<br />
cha<strong>in</strong> and showed that around 130 million kg of food waste is generated each year (23 kg per capita/year) from the<br />
household sector. Most of the discarded food was fresh and perishable, or leftovers from cook<strong>in</strong>g and d<strong>in</strong><strong>in</strong>g. Converted <strong>in</strong>to greenhouse<br />
gases, the annually discarded food from F<strong>in</strong>nish households is approximately equal to the annual carbon dioxide emissions of<br />
100,000 cars. In the food service sector the amount of waste ranged from 7-28% for cooked food, depend<strong>in</strong>g on restaurant type. In<br />
the entire sector it was estimated to be 75-85 million kg per year. <strong>Food</strong> waste was estimated to be 65-75 million kg per year <strong>in</strong> the<br />
r<strong>et</strong>ail sector. The entire food <strong>in</strong>dustry was estimated to produce around 75-140 million kg of food waste per year.<br />
Keywords: food waste, avoidable, household, food cha<strong>in</strong>, climate impact<br />
1. Introduction<br />
<strong>Food</strong> accounts for over a third of the environmental impact of F<strong>in</strong>nish consumption. When exam<strong>in</strong><strong>in</strong>g the<br />
impact on climate alone, food (agriculture, food <strong>in</strong>dustry, wholesale and r<strong>et</strong>ail, restaurants, and household<br />
activities) amounts to about a quarter of the climate impact of F<strong>in</strong>nish consumption, and the impact on the<br />
water system is even more pronounced due to eutrophication (Seppälä <strong>et</strong> al., 2011).<br />
It is argued that globally roughly one-third of food produced is lost or wasted, which amounts to about 1.3<br />
billion tonnes per year (Gustavsson <strong>et</strong> al., 2011). It is both ecologically and economically unsusta<strong>in</strong>able to<br />
waste edible food rather than consume it because the environmental impacts of produc<strong>in</strong>g the raw materials<br />
and process<strong>in</strong>g them <strong>in</strong>to food are rendered po<strong>in</strong>tless. Improv<strong>in</strong>g efficiency <strong>in</strong> food production and consumption,<br />
as well as chang<strong>in</strong>g the general di<strong>et</strong> <strong>in</strong> western countries is vital for ensur<strong>in</strong>g the future food supply for<br />
up to 9 billion people (e.g. Foley <strong>et</strong> al., 2011).<br />
The aim of this paper is to ascerta<strong>in</strong> the volume of F<strong>in</strong>nish food waste and its distribution among all parties<br />
<strong>in</strong>volved <strong>in</strong> the food supply cha<strong>in</strong>. In F<strong>in</strong>land to date there have been no large-scale food waste studies<br />
encompass<strong>in</strong>g the entire food cha<strong>in</strong> and only few limited studies have covered the amount and sources of<br />
food waste produced by households (Tarva<strong>in</strong>en 2009, Koivupuro <strong>et</strong> al., 2010). We specifically targ<strong>et</strong>ed<br />
households, food services, <strong>in</strong>dustry and the r<strong>et</strong>ail sector.<br />
2. Materials and m<strong>et</strong>hods<br />
In this study we concentrated on avoidable food waste, i.e. all wasted food and raw material that could<br />
have been consumed had it been stored or prepared differently. Other biowaste, such as coffee grounds and<br />
bones, was measured only for the food service sector. Of the liquid foodstuffs we <strong>in</strong>cluded milk, be<strong>in</strong>g <strong>in</strong>tegral<br />
part of F<strong>in</strong>nish food culture. (Silvenno<strong>in</strong>en <strong>et</strong> al., <strong>2012</strong>a).<br />
2.1. Household data collection and analysis<br />
We collected data <strong>in</strong> September 2010 by carry<strong>in</strong>g out a follow-up study mapp<strong>in</strong>g the volume and composition<br />
of food waste <strong>in</strong> F<strong>in</strong>nish households. In addition, we charted the respondents’ demographical backgrounds,<br />
<strong>in</strong>clud<strong>in</strong>g age, education and current life stage. Furthermore, we collected background <strong>in</strong>formation<br />
on, <strong>in</strong>ter alia, eat<strong>in</strong>g and shopp<strong>in</strong>g habits, waste process<strong>in</strong>g, op<strong>in</strong>ions about food packag<strong>in</strong>g, and we also<br />
evaluated the <strong>in</strong>fluence of these factors on food waste. The respondents were chosen from an onl<strong>in</strong>e consumer<br />
panel. A mark<strong>et</strong> research company responsible for arrang<strong>in</strong>g the survey also managed the practical<br />
arrangements for the study.<br />
A total of 420 households participated <strong>in</strong> the study and of these 380 households (1054 people) f<strong>in</strong>ished<br />
the study acceptably. Geographically, the households were situated <strong>in</strong> and around four cities: Hels<strong>in</strong>ki,<br />
Turku, Tampere, and Jyväskylä. Prior to the study, the participants compl<strong>et</strong>ed an onl<strong>in</strong>e background questionnaire<br />
and they were equipped with electronic kitchen scales, as well as a diary and d<strong>et</strong>ailed <strong>in</strong>structions<br />
on how to weigh and record their waste and associated reasons.<br />
The households weighed their food waste daily, each time they disposed of food. The study period was<br />
two weeks, and the results were recorded <strong>in</strong> the diary. The study was carried out <strong>in</strong> autumn, as summer holidays<br />
were over and the school autumn and w<strong>in</strong>ter holiday season had not y<strong>et</strong> started. The diary had separate<br />
631
PARALLEL SESSION 7C: FOOD CHAIN AND FOOD WASTE 8 th Int. Conference on <strong>LCA</strong> <strong>in</strong> the<br />
Agri-<strong>Food</strong> Sector, 1-4 Oct <strong>2012</strong><br />
entries for each time food was disposed of, where the respondents entered not only the weight and type of<br />
food disposed of, but also the reason for disposal, such as ’spoiled’; ‘past best-before date’, <strong>et</strong>c. Diary entries<br />
were easy to make under head<strong>in</strong>gs such as ’bread’, ’potato and potato products’, ’home cooked food’, and<br />
’convenience food’, so that the respondent needed only to tick the correspond<strong>in</strong>g box <strong>in</strong> the form. More d<strong>et</strong>ailed<br />
description of demographic factors is presented <strong>in</strong> Silvenno<strong>in</strong>en <strong>et</strong> al., (2011).<br />
We studied the <strong>in</strong>fluences of several socio-demographical, behavioural, and attitud<strong>in</strong>al factors on generat<strong>in</strong>g<br />
food waste. Initially we studied the data collected through the background questionnaire, cover<strong>in</strong>g the<br />
<strong>in</strong>fluences of all the socio-demographical, behavioural, and attitud<strong>in</strong>al factors that we expected to <strong>in</strong>fluence<br />
the amount of avoidable food waste, based on our assumptions and previously published food waste studies.<br />
Subsequently we analysed the <strong>in</strong>fluence of several other factors, for which we had collected data, <strong>in</strong> order to<br />
establish wh<strong>et</strong>her we could identify some further, more unexpected correlations. To beg<strong>in</strong> with, we analysed<br />
most of the data us<strong>in</strong>g descriptive statistics, crosstabs, and histograms. Afterwards we applied a l<strong>in</strong>ear regression<br />
model to the most promis<strong>in</strong>g factors to establish statistical significance of results. We formed dichotomous<br />
variables to <strong>in</strong>clude qualitative <strong>in</strong>formation <strong>in</strong>to the model. We also formed dummy variables, so<br />
that we could perform regression analysis us<strong>in</strong>g a categorical (ord<strong>in</strong>al and nom<strong>in</strong>al) variable with more than<br />
two categories. In addition, for some of the most <strong>in</strong>terest<strong>in</strong>g variants that stood out <strong>in</strong> the statistical tests, we<br />
performed one sample t-tests on the dummy variables (Koivupuro <strong>et</strong> al., 2011).<br />
2.2 <strong>Food</strong> services data collection and analysis<br />
Two communal food services and a company responsible for cater<strong>in</strong>g for the restaurants of Hels<strong>in</strong>ki University<br />
were partners <strong>in</strong> the study. The three companies had a total of 55 outl<strong>et</strong>s, provid<strong>in</strong>g meals for various<br />
daycare centres, schools, hospitals, elderly service centres, and workplace restaurants and canteens. The<br />
study time for food services lasted one week.<br />
Other restaurant and cater<strong>in</strong>g bus<strong>in</strong>esses, such as d<strong>in</strong>ers, restaurants, hotels, cafes, p<strong>et</strong>rol stations and<br />
similar establishments serv<strong>in</strong>g meals, participated dur<strong>in</strong>g a shorter, one-day research period. In total the<br />
study covered 17 such bus<strong>in</strong>esses and there were 72 participat<strong>in</strong>g restaurants. The total number of research<br />
days was 292. Most of the outl<strong>et</strong>s were schools and daycare centres (see Silvenno<strong>in</strong>en <strong>et</strong> al., <strong>2012</strong>a).<br />
In restaurants, d<strong>in</strong>ers and food outl<strong>et</strong>s the food waste was measured by establish<strong>in</strong>g the amount of food<br />
served, and weigh<strong>in</strong>g waste generated dur<strong>in</strong>g cook<strong>in</strong>g and serv<strong>in</strong>g, and customer leftovers. All restaurants<br />
participat<strong>in</strong>g <strong>in</strong> the study sorted and weighed leftovers. For communal food services the study was generally<br />
carried out at lunch-time, with the exception of elderly service centres and hospitals where d<strong>in</strong>ner was considered.<br />
In cafes, p<strong>et</strong>rol stations, d<strong>in</strong>ers and restaurants the whole day was usually covered. After the restaurants<br />
closed, either the restaurant personnel or the researchers weighed the sorted waste. In addition, the personnel<br />
compl<strong>et</strong>ed forms with daily amounts of food prepared, and amounts of food waste from cook<strong>in</strong>g,<br />
service, and leftovers.<br />
Furthermore, the researchers studied the leftover content over 33 days <strong>in</strong> various outl<strong>et</strong>s, establish<strong>in</strong>g the<br />
composition and quantity of leftovers. Of the liquid foodstuffs, we <strong>in</strong>cluded milk and sour milk used <strong>in</strong> the<br />
kitchen and served to the customers, but only milk was separated from leftovers. As the amount of waste<br />
food was compared to the amount of food cooked, all cooked food was weighed dur<strong>in</strong>g the study period. The<br />
personnel <strong>in</strong> restaurants and food service locations were briefed and <strong>in</strong>structed on how to def<strong>in</strong>e food waste<br />
and sort leftovers so that avoidable food waste could be measured. The restaurants were provided with the<br />
necessary forms, conta<strong>in</strong>ers for various types of food waste, boards with guidel<strong>in</strong>es for sort<strong>in</strong>g food waste,<br />
and several scales for weigh<strong>in</strong>g the produced food and food waste. A d<strong>et</strong>ailed description of data collection<br />
is reported by Silvenno<strong>in</strong>en <strong>et</strong> al., (<strong>2012</strong>a, <strong>2012</strong>b).<br />
2.3. <strong>Food</strong> waste <strong>in</strong> the r<strong>et</strong>ail sector and <strong>in</strong>dustry<br />
The data collection for food waste <strong>in</strong> the r<strong>et</strong>ail sector was done <strong>in</strong> cooperation with the Nordic Council’s<br />
R<strong>et</strong>ail food waste project. The project was carried out by <strong>in</strong>terview<strong>in</strong>g various parties <strong>in</strong> r<strong>et</strong>ail cha<strong>in</strong>s, waste<br />
management, and other associated actors <strong>in</strong> Sweden, Norway, Denmark and F<strong>in</strong>land. In F<strong>in</strong>land we <strong>in</strong>terviewed<br />
four r<strong>et</strong>ail cha<strong>in</strong> representatives (cover<strong>in</strong>g 90% of food mark<strong>et</strong>s), one waste management representative<br />
(Hels<strong>in</strong>ki Region Environmental Services Authority) and a member of The F<strong>in</strong>nish Grocery Trade Association.<br />
The research did not <strong>in</strong>clude any weigh<strong>in</strong>g to d<strong>et</strong>erm<strong>in</strong>e the actual amount of waste, and consequently<br />
there are no public statistical data available (Stenmark <strong>et</strong> al., 2011).<br />
The food waste data from the food <strong>in</strong>dustry were collected ma<strong>in</strong>ly from F<strong>in</strong>nish food companies that participated<br />
<strong>in</strong> the study, and from the literature and some corporate responsibility reports. These data were col-<br />
632
PARALLEL SESSION 7C: FOOD CHAIN AND FOOD WASTE 8 th Int. Conference on <strong>LCA</strong> <strong>in</strong> the<br />
Agri-<strong>Food</strong> Sector, 1-4 Oct <strong>2012</strong><br />
lected for the first time <strong>in</strong> F<strong>in</strong>land and this <strong>in</strong>formation represents a prelim<strong>in</strong>ary estimate of the food waste <strong>in</strong><br />
the <strong>in</strong>dustry. A suitable def<strong>in</strong>ition for food waste <strong>in</strong> <strong>in</strong>dustry turned out to be difficult.<br />
2.4. Environmental and economic analysis of food waste<br />
The environmental impacts of the life cycle of food waste were quantified, not only those l<strong>in</strong>ked to the<br />
treatment of food waste (such as m<strong>et</strong>hane from landfills), but also those generated dur<strong>in</strong>g earlier stages, i.e.<br />
unnecessary emissions from the food production cha<strong>in</strong>. The magnitude of environmental impacts of household<br />
food waste were analysed and expressed <strong>in</strong> terms of climate impacts. However, many <strong>in</strong>ternational<br />
standards and guidel<strong>in</strong>es (ISO 14040/4, 14067, PAS 2050, WRI/WBCSD GHG protocols, ILCD, DHCF,<br />
IDF <strong>et</strong>c.) are published but no commonly approved standards or communication m<strong>et</strong>hods evaluat<strong>in</strong>g a foodstuff’s<br />
climate impacts are available. In addition, the standards and guidel<strong>in</strong>es are too generic to provide<br />
practical <strong>in</strong>structions to produce comparable <strong>LCA</strong> studies. Thus we estimated climate impacts of household<br />
food waste by food type categories us<strong>in</strong>g numerous data sources (Katajajuuri 2009, Pulkk<strong>in</strong>en <strong>et</strong> al., 2011,<br />
Usva <strong>et</strong> al., 2009, Williams <strong>et</strong> al., 2006) by try<strong>in</strong>g to identify acceptable and relevant CO2-equivalent values<br />
for different food product categories. In parallel we made some approximations for the average GHG emissions<br />
per ton of food wasted, similarly as for the European Commission (2010) food waste report. With these<br />
two approaches we managed to evaluate the magnitude of climate impacts for households. For the r<strong>et</strong>ail and<br />
restaurant sector, as well as partly for <strong>in</strong>dustrial food waste, the latter approach was taken. The economic<br />
values were estimated us<strong>in</strong>g statistical data comb<strong>in</strong>ed with <strong>in</strong>formation from Statistics F<strong>in</strong>land, Tike Agricultural<br />
Statistics and the National Consumer Research Centre. Statistics F<strong>in</strong>land is the F<strong>in</strong>nish public authority<br />
that compiles and reports most official national statistics (OSF 2011).<br />
3. Results<br />
3.1. Household food waste<br />
Dur<strong>in</strong>g the two-week study period the amount of avoidable food waste per person ranged from 0 to 23.4<br />
kg. When extrapolated to describe the food waste over one year, the average annual avoidable food waste<br />
ranged from 0 to 160 kg per person, on average correspond<strong>in</strong>g to about 23 kg of food waste per person each<br />
year (Silvenno<strong>in</strong>en <strong>et</strong> al., <strong>2012</strong>a).<br />
Most of the discarded food was fresh and perishable, or leftovers from cook<strong>in</strong>g and d<strong>in</strong><strong>in</strong>g. Discarded<br />
food was diverse: the pr<strong>in</strong>cipal discarded foodstuffs were veg<strong>et</strong>ables 19%, home cooked food 18%, milk<br />
products 17%, bakery and gra<strong>in</strong> products 13% and fruits and berries 13%. For meat, fish and eggs the number<br />
was 7% and for convenience food 6%. Home cooked food <strong>in</strong>cluded various foodstuffs prepared at home,<br />
such as casseroles, stews, sauces, gravies, porridges, and soups. Convenience food <strong>in</strong>cluded ready-made<br />
casseroles and other meals, but also hamburgers, pizzas and baby food, <strong>in</strong>clud<strong>in</strong>g <strong>in</strong>fant formula. The waste<br />
from t<strong>in</strong>ned goods and other non-perishable foodstuffs, such as snacks, was relatively low, only 2.5%<br />
(Silvenno<strong>in</strong>en <strong>et</strong> al., <strong>2012</strong>b).<br />
The ma<strong>in</strong> reasons for dispos<strong>in</strong>g of food were spoilage, e.g. mouldy 29%, past ‘best before’ date 19%,<br />
leftovers from d<strong>in</strong><strong>in</strong>g 14% and prepar<strong>in</strong>g food <strong>in</strong> excess of needs 13%. The reasons beh<strong>in</strong>d food waste varied<br />
for foodstuffs discarded most often. For example, veg<strong>et</strong>ables were discarded because they were spoiled,<br />
whereas home cook<strong>in</strong>g was discarded as leftovers or due to prepar<strong>in</strong>g too much food. For milk products, the<br />
reasons were most often pass<strong>in</strong>g ‘best before’ or ‘use before’ dates. Bread, on the other hand, was either<br />
mouldy or otherwise undesirable, presumably due to dry<strong>in</strong>g out and becom<strong>in</strong>g less app<strong>et</strong>is<strong>in</strong>g (Silvenno<strong>in</strong>en<br />
<strong>et</strong> al., <strong>2012</strong>a).<br />
We also studied possible socio-demographical, behavioural, and possible attitud<strong>in</strong>al factors that could expla<strong>in</strong><br />
household food waste. Socio-demographical factors were, for example, age, size and type of the household,<br />
and number of children. Behavioural and additional factors <strong>in</strong>cluded shopp<strong>in</strong>g habits, waste sort<strong>in</strong>g<br />
habits and <strong>in</strong>fluence of package size. Unsurpris<strong>in</strong>gly, we found that the size of the household was directly<br />
correlated with waste produced – the more people there were <strong>in</strong> a household, the more waste was produced.<br />
When exam<strong>in</strong><strong>in</strong>g waste per person, we found that s<strong>in</strong>gles <strong>in</strong> general produced more waste than others, and<br />
s<strong>in</strong>gle women <strong>in</strong> particular produced the most food waste (Koivupuro <strong>et</strong> al., 2011).<br />
Statistically significant factors <strong>in</strong> household background <strong>in</strong>formation were size of household, type of<br />
household, gender of person ma<strong>in</strong>ly responsible for grocery shopp<strong>in</strong>g, op<strong>in</strong>ion on potential to reduce food<br />
waste, appreciation of low food prices and op<strong>in</strong>ion on the effect of purchas<strong>in</strong>g the most appropriate packag<strong>in</strong>g<br />
sizes. When study<strong>in</strong>g the effects of the packag<strong>in</strong>g, we obta<strong>in</strong>ed several <strong>in</strong>terest<strong>in</strong>g statistically significant<br />
results, such as households with fewer occupants had a stronger belief <strong>in</strong> their abilities to reduce food<br />
633
PARALLEL SESSION 7C: FOOD CHAIN AND FOOD WASTE 8 th Int. Conference on <strong>LCA</strong> <strong>in</strong> the<br />
Agri-<strong>Food</strong> Sector, 1-4 Oct <strong>2012</strong><br />
waste if food was sold and bought <strong>in</strong> smaller packag<strong>in</strong>g. (Hartika<strong>in</strong>en <strong>et</strong> al., <strong>2012</strong>). Other demographic factors<br />
did not expla<strong>in</strong> waste <strong>in</strong> a clear and consistent way (Koivupuro <strong>et</strong> al., 2011). The next phase of the research<br />
is to <strong>in</strong>clude the amount of food bought (<strong>in</strong> different product categories), to analyse food waste and<br />
reasons for it and the effect of socio-demographical factors.<br />
3.2. <strong>Food</strong> waste <strong>in</strong> the food services sector<br />
When exam<strong>in</strong><strong>in</strong>g all restaurants, service waste (over production) generally represented the ma<strong>in</strong> category<br />
of food waste. The ma<strong>in</strong> difference b<strong>et</strong>ween self-service restaurants and restaurants where food was prepared<br />
to order was that <strong>in</strong> the latter the ma<strong>in</strong> component of food waste was leftovers. However, the amount of leftovers<br />
varied notably from one restaurant to another, depend<strong>in</strong>g on the restaurant’s bus<strong>in</strong>ess model and type,<br />
which <strong>in</strong> turn d<strong>et</strong>erm<strong>in</strong>ed the portion sizes and the menu. In the restaurant bus<strong>in</strong>ess 25% of all food is served<br />
through licensed restaurants, hotels, and cater<strong>in</strong>g services. Dur<strong>in</strong>g the study we found that the restaurants<br />
represent<strong>in</strong>g this sector discarded 19% of all food produced and served. Of that 6% was kitchen waste, 5%<br />
service waste, and 7% leftovers. From these results we can deduce that <strong>in</strong> F<strong>in</strong>land food waste <strong>in</strong> licensed<br />
restaurants totals about 18-20 million kg per year.<br />
Workplace restaurants and canteens serve 14% of all food <strong>in</strong> the F<strong>in</strong>nish restaurant sector. In these establishments<br />
24% of food went to waste, as follows: kitchen waste 3%, service waste 17%, and leftovers 4%.<br />
These results would <strong>in</strong>dicate that workplace restaurants and canteens produce 13-16 million kg of food waste<br />
annually. In the fast food sector food waste was only 7% of all food handled, 2% of this was attributable to<br />
kitchen waste, 3% leftovers and 2% service waste. The results translate <strong>in</strong>to nation-wide annual food waste<br />
of roughly 3-4 million kg (Silvenno<strong>in</strong>en <strong>et</strong> al., <strong>2012</strong>b). The results show that the restaurant sector overall<br />
produces 75-85 million kg food waste. This means that about 20% of all produced and handled food <strong>in</strong> the<br />
sector is wasted.<br />
3.3. <strong>Food</strong> waste <strong>in</strong> the r<strong>et</strong>ail sector and <strong>in</strong>dustry<br />
Accord<strong>in</strong>g to the <strong>in</strong>terviews we estimated the total food waste of the F<strong>in</strong>nish wholesale and r<strong>et</strong>ail bus<strong>in</strong>ess<br />
to be 65,000-75,000 tonnes annually; 12-14 kg per F<strong>in</strong>nish citizen. The amount of food waste <strong>in</strong> households<br />
is approximately double that, 20-30 kg per person. The ma<strong>in</strong> product groups associated with food waste <strong>in</strong><br />
stores are fruits, veg<strong>et</strong>ables and bread. Other products result<strong>in</strong>g <strong>in</strong> waste <strong>in</strong>clude dairy products, fresh meat,<br />
fish and convenience food. Pursuant with F<strong>in</strong>nish Law, perishable products may not be sold after ‘best before’<br />
or ’use before’ dates, when they are to be removed from the shelves. The least food waste was found<br />
for t<strong>in</strong>ned goods, dried or frozen food, and other non-perishable goods. These product groups were identical<br />
<strong>in</strong> all Nordic Countries (Stenmark <strong>et</strong> al., 2010).<br />
The food <strong>in</strong>dustry was estimated to produce around 75-140 million kg of food waste per year. This corresponds<br />
to around 3% of the total production volume of the F<strong>in</strong>nish food <strong>in</strong>dustry. Altog<strong>et</strong>her, households,<br />
restaurants, the food <strong>in</strong>dustry and the r<strong>et</strong>ail sector produce 62-86 kg of food waste per year per capita, correspond<strong>in</strong>g<br />
to 335-460 million kg of food waste <strong>in</strong> F<strong>in</strong>land per year.<br />
3.4. Climate impacts of food waste<br />
Convert<strong>in</strong>g household food losses <strong>in</strong>to greenhouse gases, a rough estimate <strong>in</strong> F<strong>in</strong>land for the annually discarded<br />
food from households is equal to the annual carbon dioxide emissions of 100,000 cars. Even though<br />
pork and beef products amounted to only 4% of all discarded food, their carbon footpr<strong>in</strong>ts were among the<br />
highest compared with other food waste categories. For example, the amount of discarded cheese was less<br />
than 2% of total household food waste, but its carbon footpr<strong>in</strong>t was almost equal to that of discarded veg<strong>et</strong>ables.<br />
At the entire F<strong>in</strong>nish food system level, <strong>in</strong>clud<strong>in</strong>g r<strong>et</strong>ailers, restaurants and the food <strong>in</strong>dustry, the total<br />
carbon footpr<strong>in</strong>t of food waste was 500-1000 million kg of CO2-equivalent per year, around one percent of<br />
F<strong>in</strong>nish total annual greenhouse gas emissions.<br />
4. Discussion and conclusion<br />
On average 23 kg of food per person per year was wasted (and which was avoidable) <strong>in</strong> households based<br />
on this <strong>Food</strong>spill study. In our study we calculated average household food waste from diary entries, and<br />
established that the per capita values were significantly lower than for other <strong>in</strong>dustrialised countries (e.g.<br />
Jones 2005, Knudsen 2009 and KFS 2009). However, the results from other studies are not directly comparable<br />
due to differences <strong>in</strong> m<strong>et</strong>hodologies. Furthermore, because the respondents weighed food waste and<br />
634
PARALLEL SESSION 7C: FOOD CHAIN AND FOOD WASTE 8 th Int. Conference on <strong>LCA</strong> <strong>in</strong> the<br />
Agri-<strong>Food</strong> Sector, 1-4 Oct <strong>2012</strong><br />
recorded the reasons for discard<strong>in</strong>g food themselves, it is not possible to evaluate the accuracy and truthfulness<br />
of the diaries. The act of weigh<strong>in</strong>g may <strong>in</strong> itself also have reduced waste. In addition, the respondents<br />
comprised more families with children and households with multiple people than the F<strong>in</strong>nish average. The<br />
average household size <strong>in</strong> the sample, 2.8, was markedly higher than that of an average F<strong>in</strong>nish household,<br />
which <strong>in</strong> 2009 was 2.08 (OSF 2010).<br />
On the other hand, when we studied avoidable food waste volumes <strong>in</strong> restaurants and workplace restaurants<br />
and canteens, the results were about same, and were lower than for other countries. Leftovers discarded<br />
by customers ranged from 4% to 8%, which is less than recorded <strong>in</strong> <strong>in</strong>ternational studies (Engstrom 2004,<br />
The School <strong>Food</strong> Trust 2009). In addition, a recent F<strong>in</strong>nish biowaste study reported similar, moderate low<br />
levels of food waste (HSY 2011).<br />
Table 1. Avoidable food waste <strong>in</strong> the F<strong>in</strong>nish food supply cha<strong>in</strong> (Silvenno<strong>in</strong>en <strong>et</strong> al., <strong>2012</strong>b).<br />
Sector Households <strong>Food</strong> Services R<strong>et</strong>ail Sector <strong>Food</strong> <strong>in</strong>dustry Total<br />
Total millions kg/year 120-160 75-85 65-75 75-140 335-460<br />
kg per year per capita 22-30 14-16 12-14 14-26 62-86<br />
Altog<strong>et</strong>her, households, restaurants, the food <strong>in</strong>dustry and the r<strong>et</strong>ail sector produce 62-86 kg of food waste<br />
per year per capita, correspond<strong>in</strong>g to 335-460 million kg of food waste <strong>in</strong> F<strong>in</strong>land per year (Table 1). Compar<strong>in</strong>g<br />
our results, for which 10-15% of avoidable food <strong>in</strong> the entire cha<strong>in</strong> is wasted, to other studies our<br />
results seems rather low, while some of the <strong>in</strong>ternational studies (EU 2010, Gustavsson 2011) reported large<br />
food waste percentages. These marked differences are hard to expla<strong>in</strong> based on <strong>in</strong>dividual aspects such as<br />
primary production not be<strong>in</strong>g <strong>in</strong>cluded <strong>in</strong> the <strong>Food</strong>spill study. Consequently we still need <strong>in</strong>formation from<br />
other, complementary studies, especially waste-b<strong>in</strong> composition analysis, to provide a more reliable and<br />
comprehensive account of the volume and composition of food waste <strong>in</strong> different sectors of the food supply<br />
cha<strong>in</strong>.<br />
Overall, the production of food that is wasted causes marked, unnecessary negative environmental impacts.<br />
A huge amount of resources is used to cultivate, produce, store and distribute food that is not consumed.<br />
All these resources, e.g. land, fertilisers, fuel, materials, transportation, water, and electricity, result<br />
<strong>in</strong> significant greenhouse gas emissions and also have other environmental impacts, such as <strong>in</strong>creased water<br />
eutrophication.<br />
Exam<strong>in</strong><strong>in</strong>g the economic perspective of food waste, we f<strong>in</strong>d every year that the average household uses<br />
€4,300 for purchas<strong>in</strong>g food, of which the value of discarded food is €220. Thus, the total sum for food waste<br />
from F<strong>in</strong>nish households is roughly €550 million per annum (OSF 2011, Vi<strong>in</strong>isalo <strong>et</strong> al., 2008).<br />
When study<strong>in</strong>g the contribution for different food categories, the result is quite similar for the carbon<br />
footpr<strong>in</strong>t: the biggest economic value categories were home cooked food, pork and beef, veg<strong>et</strong>ables and<br />
bread. However, the food waste data generated did not turn out to be compl<strong>et</strong>ely comparable as such. There<br />
rema<strong>in</strong>s a considerable amount of research to do to expla<strong>in</strong> b<strong>et</strong>ter the phenomenon of food wastage, which is,<br />
<strong>in</strong> any case, quite a new research field.<br />
5. References<br />
Engstrom, R., Carlsson-Kanyama, A., 2004. <strong>Food</strong> losses <strong>in</strong> food service <strong>in</strong>stitutions: Examples from Sweden. <strong>Food</strong> Policy, Volume<br />
29, Issue 3, Pages 203-294.<br />
European Commission, 2010. Preparatory study of food waste across EU 27. Technical Report 2010 – 054. 210 p.<br />
Foley <strong>et</strong> al., (2011). Solutions for a cultivated plan<strong>et</strong>. Nature 478, 337–342 (20 October 2011)<br />
Gustavsson, J., Cederberg, C., Sonesson, U., Otterdijk, R., Meybeck, A., 2011. Global <strong>Food</strong> Losses and <strong>Food</strong> Waste. FAO Rome,<br />
Italy. 2011<br />
Hartika<strong>in</strong>en, H., Koivupuro, H.-K., Katajajuuri, J.-M., Korhonen, V., <strong>2012</strong>. Households’ perceptions about the <strong>in</strong>fluence of food<br />
packag<strong>in</strong>g sizes on their food waste levels. Packag<strong>in</strong>g Technology and Science. Submitted. (14 p.)<br />
HSY, 2011. Hels<strong>in</strong>ki Region Environmental Services Authority. Pääkaupunkiseudun biojätteen koostumusAbstact: Properties of<br />
Biowaste <strong>in</strong> Hels<strong>in</strong>ki M<strong>et</strong>ropolitan Area.<br />
http://www.hsy.fi/ti<strong>et</strong>oahsy/Documents/Julkaisut/6_2011_Paakaupunkiseudun_biojatteen_koostumus.pdf<br />
Jones, T., 2005. Us<strong>in</strong>g Contemporary Archaeology and Applied Anthropology to Understand <strong>Food</strong> Loss <strong>in</strong> the American <strong>Food</strong> System,<br />
Bureau of Applied Research <strong>in</strong> Anthropology, University of Arizona, Tucson.<br />
Katajajuuri, J.-M., 2009. In Valtioneuvoston tulevaisuusselonteko ilmasto- ja energiapolitiikasta. Government Foresight Report on<br />
Long-term Climate and Energy Policy: Towards a Low-carbon F<strong>in</strong>land. In F<strong>in</strong>nish.<br />
KFS Konsument Fören<strong>in</strong>gen Stockholm, 2009. Rapport från en slaskh<strong>in</strong>k.<br />
Knudsen, M. L. C., 2009. Affaldsforebyggelse i husholdn<strong>in</strong>ger – muligheder og barrierer for Danmark. Roskilde University, Specialreport,<br />
December 2009.<br />
Koivupuro, H.-K., Jalkanen, L., Katajajuuri, J.-M., Re<strong>in</strong>ika<strong>in</strong>en, A., Silvenno<strong>in</strong>en, K., 2010. <strong>Food</strong> waste <strong>in</strong> the supply cha<strong>in</strong>. El<strong>in</strong>tarvikek<strong>et</strong>jussa<br />
syntyvä ruokahävikki, kirjallisuuskatsaus. MTT report 12: 73 p. http://www.mtt.fi/mttraportti/pdf/mttraportti12.pdf<br />
635
PARALLEL SESSION 7C: FOOD CHAIN AND FOOD WASTE 8 th Int. Conference on <strong>LCA</strong> <strong>in</strong> the<br />
Agri-<strong>Food</strong> Sector, 1-4 Oct <strong>2012</strong><br />
Koivupuro, H., Hartika<strong>in</strong>en, H., Katajajuuri, J.-M., Silvenno<strong>in</strong>en, K., Heik<strong>in</strong>talo, N. Re<strong>in</strong>ika<strong>in</strong>en, A., Jalkanen , L., 2011. Influence<br />
of socio-demographical, behavioural and attitud<strong>in</strong>al factors on the amount of avoidable food waste generated <strong>in</strong> F<strong>in</strong>nish households.<br />
Official Statistics of F<strong>in</strong>land (OSF), 2011: Annual national accounts [e-publication]. Hels<strong>in</strong>ki: Statistics F<strong>in</strong>land [referred:<br />
27.11.2011].Access m<strong>et</strong>hod: http://www.stat.fi/til/vtp/<strong>in</strong>dex_en.html.<br />
Pulkk<strong>in</strong>en, H., Hartika<strong>in</strong>en, H., Katajajuuri, J.-M., 2011, El<strong>in</strong>tarvikkeiden hiilijalanjälkien laskenta ja viest<strong>in</strong>tä. MTT raportti 2011. In<br />
F<strong>in</strong>nish.<br />
Seppälä, J., Mäenpää, I., Koskela, S., Mattila, T., Niss<strong>in</strong>en, A., Katajajuuri, J.-M., Härmä, T., Korhonen, M.-R., Saar<strong>in</strong>en, M., Virtanen,<br />
Y. 2011. An assessment of greenhouse gas emissions and material flows caused by the F<strong>in</strong>nish economy us<strong>in</strong>g the ENVI-<br />
MAT model. Journal of Cleaner Production 19 (16): 1833-1841 November 2011.<br />
Silvenno<strong>in</strong>en, K., Katajajuuri, J.-M., Hartika<strong>in</strong>en, H., Jalkanen, L., Koivupuro, H.-K., Re<strong>in</strong>ika<strong>in</strong>en, A., <strong>2012</strong>a. <strong>Food</strong> Waste Volume<br />
and Composition <strong>in</strong> <strong>Food</strong> Cha<strong>in</strong>, Case Study F<strong>in</strong>land. In: Evans <strong>et</strong> al., (Eds.) Waste Matters: New Perspectives on <strong>Food</strong> and Soci<strong>et</strong>y.<br />
Wiley-Blackwell. Submitted. (20 p.)<br />
Silvenno<strong>in</strong>en, K., Koivupuro, H.-K., Katajajuuri, J.-M., Jalkanen, L., Re<strong>in</strong>ika<strong>in</strong>en, A., <strong>2012</strong>b. Ruokahävikki suomalaisessa ruokak<strong>et</strong>jussa<br />
– <strong>Food</strong>spill-hankkeen 2010-<strong>2012</strong> loppuraportti. <strong>Food</strong> Waste Volume and Composition <strong>in</strong> F<strong>in</strong>nish <strong>Food</strong> Cha<strong>in</strong>. MTT<br />
Raportti – MTT Report 41. http://www.mtt.fi/mttraportti/pdf/mttraportti41.pdf. 65 p. (<strong>in</strong> F<strong>in</strong>nish)<br />
Stenmark, Å., Hanssen, O., Silvenno<strong>in</strong>en, K., Katajajuuri, J.-M., Werge, M., 2011. Initiatives on Prevention of <strong>Food</strong> Waste <strong>in</strong> the<br />
R<strong>et</strong>ail and Wholesale Trades. Report. Swedish Environmental Research Institute. Juni 2011.<br />
Tarva<strong>in</strong>en, M., 2009. Rokka rikassa – Pääkaupunkiseudun lapsiperheiden ruokajätte<strong>et</strong>. YTV:n julkaisuja 25/2009. Hels<strong>in</strong>ki 2009.<br />
Tike, 2010. Balance She<strong>et</strong> for <strong>Food</strong> Commodities 2008 and 2009 (prelim<strong>in</strong>ary).<br />
http://www.maataloustilastot.fi/sites/default/files/rav<strong>in</strong>totase_2009_ennakko.pdf<br />
The School <strong>Food</strong> Trust (2009). The Primary School <strong>Food</strong> Survey. Research Report. http://www.schoolfoodtrust.org.uk/school-cookscaterers/reports/primary-school-food-survey-2009<br />
Usva, K., Saar<strong>in</strong>en, M., Katajajuuri, J.-M. & Kurppa, S. (2009). Supply cha<strong>in</strong> <strong>in</strong>tegrated <strong>LCA</strong> approach to assess environmental<br />
impacts of food production <strong>in</strong> F<strong>in</strong>land. Agricultural and <strong>Food</strong> Science 18, 3-4: 460-476.<br />
Vi<strong>in</strong>isalo, M., Nikkilä, M., Varjonen, J., 2008. El<strong>in</strong>tarvikkeiden kulutusmuutoks<strong>et</strong> kotitalouksissa vuos<strong>in</strong>a 1966–2006. Abstract:<br />
Changes <strong>in</strong> the consumption of foods <strong>in</strong> households dur<strong>in</strong>g the years 1966–2006. National Consumer Research Centre, publications<br />
7/2008.<br />
Williams, A.G., Audsley, E., Sandars, D.L., 2006. D<strong>et</strong>erm<strong>in</strong><strong>in</strong>g the environmental burdens and resource use <strong>in</strong> the production of<br />
agricultural and horticultural commodities. Ma<strong>in</strong> Report. Defra Research Project IS0205. Bedford: Cranfield University and Defra.<br />
636
PARALLEL SESSION 7C: FOOD CHAIN AND FOOD WASTE 8 th Int. Conference on <strong>LCA</strong> <strong>in</strong> the<br />
Agri-<strong>Food</strong> Sector, 1-4 Oct <strong>2012</strong><br />
Product energy use with<strong>in</strong> the agri-food supply cha<strong>in</strong><br />
Carla Sarrouy 1,* , Joe Davidson 2 , Rob Lillywhite 1<br />
1 School of Life Sciences, University of Warwick, Wellesbourne, Warwick, CV35 9EF, UK<br />
2 Institute of Manufactur<strong>in</strong>g, University of Cambridge, UK<br />
Correspond<strong>in</strong>g author. E-mail: c.sarrouy@warwick.ac.uk<br />
ABSTRACT<br />
The global food system consumes very large amounts of energy, a position which is made more challeng<strong>in</strong>g as an <strong>in</strong>creas<strong>in</strong>g global<br />
population is demand<strong>in</strong>g more food. In order that food production can be made more susta<strong>in</strong>able, it is important to produce food <strong>in</strong> a<br />
more energy efficient way or to identify food types that require less energy <strong>in</strong> production. This paper presents the results of a UK<br />
study that undertook a supply cha<strong>in</strong> analysis of the embedded energy of selected food products.<br />
A review of the academic literature identified over 50 products for which energy analysis had been undertaken for at least one stage<br />
of the food supply cha<strong>in</strong>; the majority of papers related to primary production. Embedded energy values for <strong>in</strong>dividual food products<br />
across the whole supply cha<strong>in</strong> (primary production to r<strong>et</strong>ailer) ranged from 2.4 MJ/kg for potato to 83 MJ/kg for coffee. For most<br />
food products, the <strong>in</strong>direct and direct energy used <strong>in</strong> primary production rema<strong>in</strong>ed the dom<strong>in</strong>ant use; 45, 45 and 72% respectively for<br />
potato, milk and pork. Process<strong>in</strong>g was the second biggest <strong>in</strong>fluence for selected products, e.g. the fry<strong>in</strong>g stage for oven chips consumed<br />
50% of total energy requirement. Embedded energy values for total product mark<strong>et</strong> share was dom<strong>in</strong>ated by ‘every day’<br />
items, e.g. meat, bread, milk and cheese.<br />
The review was supported by new analysis of four multi-<strong>in</strong>gredient products. Data were collected from multiple sources (farmers,<br />
trade associations, food processors, food manufacturers and r<strong>et</strong>ailers). The embedded energy of t<strong>in</strong>ned soup, pasta sauce <strong>in</strong> a glass<br />
jar, restaurant pizza and chocolate biscuits was 9, 24, 28 and 20 MJ/kg, respectively. The results show that different products have<br />
very different demands for energy and that the ‘hotspot’ of energy use varied greatly with product; however, <strong>in</strong> many situations it<br />
was possible to identify approaches to reduce energy use or to substitute one product with another. The choice of packag<strong>in</strong>g was very<br />
<strong>in</strong>fluential for some products; e.g. the glass jar for pasta sauce was responsible for 50% of the total product embedded energy whilst<br />
the cardboard for frozen pizza was responsible for only 18% of the total product embedded energy.<br />
Despite the high cost of energy, its contribution to product price rema<strong>in</strong>s relatively m<strong>in</strong>or for most products and most food companies<br />
do not identify energy as a priority; hygiene and food saf<strong>et</strong>y be<strong>in</strong>g the dom<strong>in</strong>ant focus.<br />
Keywords: energy, <strong>LCA</strong>, food supply cha<strong>in</strong>, dependency<br />
1. Introduction<br />
There is grow<strong>in</strong>g concern regard<strong>in</strong>g the <strong>in</strong>creased demand for energy with<strong>in</strong> the UK agri-food supply<br />
cha<strong>in</strong>, which is currently estimated to be 326 p<strong>et</strong>ajoules per year (Lillywhite <strong>et</strong> al., <strong>2012</strong>). The trend for more<br />
processed foods to feed an <strong>in</strong>creas<strong>in</strong>g population is likely to <strong>in</strong>crease the demand for energy <strong>in</strong> a time when<br />
energy supplies are becom<strong>in</strong>g more <strong>in</strong>secure.<br />
This paper reports the results of a UK study to identify energy use, at both product and mark<strong>et</strong> scale, and<br />
energy use hotspots with<strong>in</strong> the agri-food supply cha<strong>in</strong>; the supply cha<strong>in</strong> is assumed to have four ma<strong>in</strong> stages<br />
(primary production, process<strong>in</strong>g/manufactur<strong>in</strong>g, packag<strong>in</strong>g and logistics/r<strong>et</strong>ail). The identification of product<br />
and mark<strong>et</strong> embedded energy values and supply cha<strong>in</strong> hotspots provides a b<strong>et</strong>ter understand<strong>in</strong>g of the whole<br />
supply cha<strong>in</strong> and has identified areas where improvements could be made.<br />
2. M<strong>et</strong>hods<br />
Initial research was based on a literature review of life cycle assessment (<strong>LCA</strong>) studies of food items.<br />
This review was not limited to the UK but <strong>in</strong>cluded any country <strong>in</strong> which these studies had been conducted.<br />
The review identified 51 products for which energy analysis had been conducted <strong>in</strong> at least one stage of the<br />
food supply cha<strong>in</strong> (Audsley <strong>et</strong> al., 2009; Carlsson-Kanyama <strong>et</strong> al., 2003; Erz<strong>in</strong>ger <strong>et</strong> al., 2003; Lillywhite <strong>et</strong><br />
al., 2007; Williams <strong>et</strong> al., 2006). The studies ma<strong>in</strong>ly focused on the primary production stage, i.e. primary<br />
agricultural production rather than the entire food supply cha<strong>in</strong>. The review identified that very few studies<br />
had been undertaken on complex multi-<strong>in</strong>gredient products. This omission was addressed by analys<strong>in</strong>g four<br />
multi-<strong>in</strong>gredient products, i.e. pasta sauce, pizza, soup and chocolate biscuits. These were selected because<br />
they are widely-available and highly-consumed <strong>in</strong> the UK and their <strong>in</strong>gredients <strong>in</strong>clude veg<strong>et</strong>ables, cereals,<br />
meat and dairy products; their consumption is forecast to cont<strong>in</strong>ue <strong>in</strong>creas<strong>in</strong>g <strong>in</strong> the com<strong>in</strong>g years (Lillywhite<br />
<strong>et</strong> al., <strong>2012</strong>). Data were collected from multiple sources: farmers, trade associations, food processors, food<br />
and packag<strong>in</strong>g manufacturers and r<strong>et</strong>ailers. Two functional units were used: mega joules per kilo (MJ/kg) for<br />
<strong>in</strong>dividual products and terajoules (TJ) for total mark<strong>et</strong> share.<br />
637
PARALLEL SESSION 7C: FOOD CHAIN AND FOOD WASTE 8 th Int. Conference on <strong>LCA</strong> <strong>in</strong> the<br />
Agri-<strong>Food</strong> Sector, 1-4 Oct <strong>2012</strong><br />
3. Results<br />
3.1. Differences b<strong>et</strong>ween products and mark<strong>et</strong> shares<br />
The results show that <strong>in</strong>dividual products have a wide range of embedded energy values which range<br />
from 2 MJ/kg for m<strong>in</strong>eral water to 83 MJ/kg for coffee (Table 1). Annual embedded energy values for total<br />
product consumption range from 67 TJ for honey to 36,498 TJ for beef.<br />
Fruit and veg<strong>et</strong>ables have the lowest embedded energy values, for example, potato (2.4 MJ/kg), onion<br />
(2.9 MJ/kg) and carrot (3.3 MJ/kg). Domestic fruits such as apples (5 MJ/kg) and raspberries (7.5 MJ/kg)<br />
require less energy than imported fruit: oranges (8.1 MJ/kg), bananas (8.7 MJ/kg) and grapes (8.8 MJ/kg).<br />
There are two exceptions to this: UK strawberries (13.6 MJ/kg) are grown <strong>in</strong> polytunnels and UK tomatoes<br />
(95 MJ/kg) <strong>in</strong> heated glasshouses. Tomatoes have a wide range of energy requirements which illustrates different<br />
production systems (field grown <strong>in</strong> Mediterranean countries and glasshouse grown <strong>in</strong> Northern European<br />
countries).<br />
A number of dairy products were covered <strong>in</strong> the analysis. Liquid milk has the lowest embedded energy<br />
value (7.3 MJ/kg) but this <strong>in</strong>creases with added process<strong>in</strong>g: cream (12.1 MJ/kg), yoghurt (19.4 MJ/kg) and<br />
butter (23.5 MJ/kg) have values correspond<strong>in</strong>g to 166%, 266% and 322%, respectively, of the value for milk.<br />
Of the dairy products, cheese (48.8 MJ/kg) has the highest value.<br />
Meat is an energy <strong>in</strong>tensive product with most types hav<strong>in</strong>g similar average values: pork (33.3 MJ/kg),<br />
beef (34.4 MJ/kg) and chicken (39.7 MJ/kg) although the range of values for an <strong>in</strong>dividual product can be<br />
large and dependent on different production systems, e.g. beef (17.0 to 74.2 MJ/kg). It is <strong>in</strong>terest<strong>in</strong>g to note<br />
that these values are smaller than those for different fish species: t<strong>in</strong>ned tuna (44.0 MJ/kg), salmon (57<br />
MJ/kg) and frozen cod (61.9 MJ/kg). However, when total mark<strong>et</strong> share is considered, the energy requirement<br />
for fish is considerably lower than that of meat. Frozen cod and salmon require 1,581 and 1,819<br />
TJ/year, respectively, compared to chicken and beef that require 23,190 and 36,498 TJ/kg, respectively.<br />
The same product can have different energy requirements depend<strong>in</strong>g upon its process<strong>in</strong>g or packag<strong>in</strong>g, for<br />
example, there is a 7% difference b<strong>et</strong>ween fresh peas and t<strong>in</strong>ned peas, due to differences <strong>in</strong> the process<strong>in</strong>g<br />
and logistics stages.<br />
The review revealed that there is a lack of data on processed multi-<strong>in</strong>gredient products; this omission was<br />
rectified by undertak<strong>in</strong>g new research on pasta sauce, soup, pizza and chocolate biscuits. These four products<br />
have different energy uses but do not figure as the most energy-<strong>in</strong>tensive of the table below. Veg<strong>et</strong>able soup<br />
is the least energy-<strong>in</strong>tensive product of the sub-group (8.92 MJ/kg) and restaurant pizza requires the most<br />
energy (28 MJ/kg).<br />
Table 1. Embedded energy by product and mark<strong>et</strong> share<br />
Product<br />
Average product<br />
energy use<br />
(MJ/kg)<br />
Average product<br />
energy use rank<strong>in</strong>g<br />
Range of product<br />
energy use<br />
(MJ/kg)<br />
Mark<strong>et</strong> energy<br />
use (TJ)<br />
Mark<strong>et</strong> energy<br />
use rank<strong>in</strong>g<br />
Apple 5.0 49 2.5 – 11.1 2,585 28<br />
Banana 8.7 42 5.4 – 12.0 6,082 18<br />
Bean (t<strong>in</strong>ned) 18.0 22 16.0 – 20.0 6,205 17<br />
Beef 34.4 9 17.0 – 74.2 36,498 1<br />
Biscuit 25.4 13 23.0 – 27.2 13,296 7<br />
Bread 9.0 39 3.7 – 15.8 18,931 5<br />
Broccoli (fresh) 11.1 34 10.7 – 11.4 877 41<br />
Butter 23.5 15 12.6 – 30.7 3,000 25<br />
Cabbage (white) 4.4 50 3.7 – 5.1 548 45<br />
Cake 16.8 24 11.6 – 21.0 8,151 15<br />
Carrot (fresh) 3.3 53 2.6 – 4.1 2,468 29<br />
Cereal & muesli 13.5 30 10.8 – 17.0 5,602 20<br />
Cheese 48.8 4 35.7 – 65.0 18,175 6<br />
Chicken 24.9 8 20.6 – 29.2 23,190 4<br />
Chips (oven) 10.2 35 - - -<br />
Chocolate 43.5 7 43.0 – 44.0 12,219 9<br />
Chocolate biscuits 19.5 20 - - -<br />
Cod (frozen) 61.9 2 45.0 – 78.8 1,581 33<br />
Coffee 83.0 1 42.1 – 126.4 4,504 21<br />
Cream 12.1 32 5.1 – 19.0 811 42<br />
Crispbread 20.6 19 14.0 – 27.2 395 46<br />
Crisps (baked) 8.7 43 - - -<br />
Crisps (fried) 14.6 27 - - -<br />
Eggs 29.2 11 27.2 – 31.3 9,320 12<br />
Flour<br />
638<br />
3.6 51 1.7 – 5.2 724 44
PARALLEL SESSION 7C: FOOD CHAIN AND FOOD WASTE 8 th Int. Conference on <strong>LCA</strong> <strong>in</strong> the<br />
Fruit juice 9.1 38 7.1 – 10.2 9,440<br />
Agri-<strong>Food</strong> Sector, 1-4 Oct <strong>2012</strong><br />
11<br />
Grapes 8.8 41 7.8 – 9.7 1,620 32<br />
Honey 3.5 52 1.3 – 5.6 67 49<br />
Ice cream 16.4 25 14.0 – 20.2 8,637 14<br />
Jam 11.7 33 8.0 – 16.0 933 40<br />
L<strong>et</strong>tuce 6.3 48 3.5 – 9.1 744 43<br />
Margar<strong>in</strong>e 20.7 18 17.0 – 24.4 1,454 34<br />
Milk 7.3 46 3.4 – 7.0 27,154 3<br />
Oil 21.7 17 14.0 – 35.3 4,156 22<br />
Onion 2.9 54 1.9 – 3.8 1,046 39<br />
Oranges 8.1 44 6.8 – 9.4 1,267 37<br />
Pasta 9.8 36 8.7 – 13.8 2,065 30<br />
Pasta sauce 24.0 14 - - -<br />
Peas (fresh) 16.3 26 8.2 – 24.4 260 47<br />
Peas (t<strong>in</strong>ned) 17.4 23 17.0 – 17.7 1,166 38<br />
Pizza (frozen) 22.5 16 - - -<br />
Pizza (restaurant) 28.0 12 - - -<br />
Pork 33.3 10 25.1 – 48.2 5,846 19<br />
Potato 2.4 55 1.7 – 3.0 3,757 24<br />
Raspberries 7.5 45 - 128 48<br />
Rice 14.2 28 9.8 – 17.8 2,855 27<br />
Salmon 57.0 3 54.5 – 59.4 1,819 31<br />
Soft dr<strong>in</strong>ks 6.5 47 5.4 – 7.5 34,897 2<br />
Soup 8.9 40 - 7,332 16<br />
Strawberry 13.6 29 12.7 – 14.5 1,399 36<br />
Sugar 9.8 37 - 2,909 26<br />
Tomato 46.4 5 5.4 – 95.0 13,181 8<br />
Tuna (t<strong>in</strong>ned) 44.0 6 - 3,932 23<br />
Water (m<strong>in</strong>eral) 2.0 56 - 1,436 35<br />
W<strong>in</strong>e 13.0 31 12.0 – 14.0 9,295 13<br />
Yoghurt 19.4 21 13.7 – 25.1 11,146 10<br />
3.2. Differences with<strong>in</strong> products<br />
Fig. 1 shows the energy requirements, by production stage, for the production of 12 different products.<br />
The results show that energy use varies greatly b<strong>et</strong>ween products and with<strong>in</strong> products. Primary production<br />
normally uses the most energy; rang<strong>in</strong>g from 1.05 MJ/kg for potato (45% of total) to 27.4 MJ/kg for cheese<br />
(56% of total). However, there are some exceptions: oven chips consume 50% of their energy at the manufactur<strong>in</strong>g<br />
stage, and pasta sauce consumes 50% at the packag<strong>in</strong>g stage.<br />
Energy use dur<strong>in</strong>g the logistics stage is closely l<strong>in</strong>ked to product type. Products such as cheese (5.90<br />
MJ/kg) and chicken (6.81 MJ/kg) that require temperature-controlled transport and storage systems have<br />
high values but ambient products, such as chocolate biscuits and soup (both requir<strong>in</strong>g only 0.34 MJ/kg for<br />
logistics and storage) can be low. The exception is very light products, for example crisps, where transport<br />
conta<strong>in</strong>ers cannot be filled to maximum weight allowances.<br />
The study has highlighted the crucial role that can be played by packag<strong>in</strong>g <strong>in</strong> the overall energy use of<br />
products. For pizza, raw <strong>in</strong>gredients had the greatest energy requirement but it was the packag<strong>in</strong>g stage that<br />
was dom<strong>in</strong>ant for pasta sauce and soup, with 50 and 56% respectively, of their total energy used at the packag<strong>in</strong>g<br />
stage. Interest<strong>in</strong>gly preparation of pizza required different amounts of energy; restaurant prepared<br />
pizza hav<strong>in</strong>g a higher embedded energy value compared to factory prepared pizza, 28.0 to 22.54 MJ/kg;<br />
wh<strong>et</strong>her this 5 MJ/kg sav<strong>in</strong>g for factory prepared pizza is nullified by home cook<strong>in</strong>g is open to question.<br />
B<strong>et</strong>ween the four processed multi-<strong>in</strong>gredient products, the choice of raw <strong>in</strong>gredients and packag<strong>in</strong>g have the<br />
biggest impact on the overall energy content, rang<strong>in</strong>g b<strong>et</strong>ween 71% (restaurant pizza) to 92% (pasta sauce)<br />
of the total.<br />
639
PARALLEL SESSION 7C: FOOD CHAIN AND FOOD WASTE 8 th Int. Conference on <strong>LCA</strong> <strong>in</strong> the<br />
Agri-<strong>Food</strong> Sector, 1-4 Oct <strong>2012</strong><br />
Figure 1. Energy content breakdown for 12 different foods<br />
3.3. Differences <strong>in</strong> packag<strong>in</strong>g<br />
The study exam<strong>in</strong>ed both primary packag<strong>in</strong>g, used to conta<strong>in</strong> the product, and secondary packag<strong>in</strong>g, used<br />
to protect the product dur<strong>in</strong>g the logistics stage. Both packag<strong>in</strong>g types can have a considerable impact on the<br />
total embedded energy of products. Equally the choice of packag<strong>in</strong>g material and the recycled content of that<br />
packag<strong>in</strong>g material will have a considerable <strong>in</strong>fluence on product embedded energy. This study assumed<br />
average UK recycl<strong>in</strong>g rates, mean<strong>in</strong>g that plastic, alum<strong>in</strong>ium, glass and steel conta<strong>in</strong>ers used 100%, 57%,<br />
33% and 56% virg<strong>in</strong> materials respectively. (SCRIP, 2006; WRAP, not dated; WRAP, 2011).<br />
The results show that energy use for primary packag<strong>in</strong>g is much higher than for secondary packag<strong>in</strong>g<br />
(Figure 2). For alum<strong>in</strong>ium and steel cans, the embodied energy can be as high as 10.5 MJ/kg (94% of total<br />
energy use) and 2.5 MJ/kg (79% of total energy use) respectively. Glass jars also have a considerable energy<br />
use <strong>in</strong> the manufactur<strong>in</strong>g of their primary packag<strong>in</strong>g which can be as high as 50% of the total embedded energy.<br />
Secondary packag<strong>in</strong>g is much less energy-<strong>in</strong>tensive than primary packag<strong>in</strong>g. The importance of secondary<br />
packag<strong>in</strong>g is <strong>in</strong>versely proportional to the energy use of different types of packag<strong>in</strong>g. The most energy<strong>in</strong>tensive<br />
package types: glass jars and alum<strong>in</strong>ium cans, have the lowest percentage of energy used for secondary<br />
packag<strong>in</strong>g (3% each). The least energy-<strong>in</strong>tensive packag<strong>in</strong>g types, stand-up pouches and steel cans,<br />
have the highest share of energy required for secondary packag<strong>in</strong>g (63% and 22%, respectively). These values<br />
are due to the fact that the less energy-<strong>in</strong>tensive package types analysed tend to have a weaker structure<br />
that needs to be compensated by stronger (and more energy-<strong>in</strong>tensive) secondary package types. This highlights<br />
the importance of <strong>in</strong>clud<strong>in</strong>g secondary packag<strong>in</strong>g <strong>in</strong> the analysis and shows that lighter, less energy<strong>in</strong>tensive<br />
package types require much less energy, even when their secondary packag<strong>in</strong>g is <strong>in</strong>cluded <strong>in</strong> the<br />
calculation.<br />
The analysis shows that the ratio b<strong>et</strong>ween the energy use for packag<strong>in</strong>g to product conta<strong>in</strong>ment can be<br />
very different. The choice to package a product <strong>in</strong> a glass jar rather than <strong>in</strong> a carton means that more than<br />
five times more energy will be required to pack the same amount of conta<strong>in</strong>ment. This decision, although<br />
often overlooked, can have a very strong impact on the overall energy value of the f<strong>in</strong>al product. However,<br />
this discussion on packag<strong>in</strong>g types should be considered <strong>in</strong> the context of product saf<strong>et</strong>y which is paramount<br />
and exist<strong>in</strong>g production equipment. Glass is preferred <strong>in</strong> many situations because it is easy to sterilise the<br />
f<strong>in</strong>al product and it uses exist<strong>in</strong>g production l<strong>in</strong>es.<br />
640
PARALLEL SESSION 7C: FOOD CHAIN AND FOOD WASTE 8 th Int. Conference on <strong>LCA</strong> <strong>in</strong> the<br />
Agri-<strong>Food</strong> Sector, 1-4 Oct <strong>2012</strong><br />
Figure 2. Energy use associated with packag<strong>in</strong>g made of 100% virg<strong>in</strong> materials (plastic conta<strong>in</strong>er, pouch and<br />
carton) and a typical recycled content (alum<strong>in</strong>ium can, glass jar, steel can) (bars <strong>in</strong>dicate m<strong>in</strong>imum and<br />
maximum values for total packag<strong>in</strong>g type) (Oswald, 2011)<br />
4. Discussion<br />
The results reveal the great diversity of energy requirements and product embedded energy values. This<br />
diversity suggests that no s<strong>in</strong>gle approach is possible to reduce energy use <strong>in</strong> the agri-food supply cha<strong>in</strong> and<br />
that the best measure to promote energy efficiency will be directed at specific sectors or products. For most<br />
products, primary production requires the most energy; both for simple crops, such as potatoes, and for complex<br />
processed multi-<strong>in</strong>gredient foods such as pizza. Process<strong>in</strong>g is the second most energy-<strong>in</strong>tensive stage of<br />
the food supply cha<strong>in</strong> and for some products it is an area <strong>in</strong> which energy-sav<strong>in</strong>g <strong>in</strong>itiatives can be undertaken.<br />
The <strong>in</strong>creas<strong>in</strong>g popularity of highly processed multi-<strong>in</strong>gredient foods, manufactured across different<br />
countries and regions, is likely to <strong>in</strong>crease the embedded energy content of these food types. Consequently, it<br />
will be more difficult to reduce product energy requirements and successful <strong>in</strong>itiatives will require the cooperation<br />
of different stakeholders <strong>in</strong> multiple countries. It is not the sole responsibility of farmers to improve<br />
the energy efficiency of their production; it is also for processors, r<strong>et</strong>ailers and consumers to support change<br />
and to enable change by design<strong>in</strong>g more energy efficient products.<br />
Meat and dairy products have some of the highest embedded energy values which could be used to drive<br />
an <strong>in</strong>crease <strong>in</strong> consumption of more fruit and veg<strong>et</strong>ables; and changes to di<strong>et</strong> towards less meat and more<br />
fruit and veg<strong>et</strong>ables have been shown to br<strong>in</strong>g health benefits to the consumer and environmental benefits to<br />
the plan<strong>et</strong> (UN Human Rights Council, 2011). Additionally, the promotion of local and seasonal food can<br />
reduce the energy required <strong>in</strong> the transport and storage of food. In these areas, consumers have the ability to<br />
<strong>in</strong>fluence the agri-food supply cha<strong>in</strong> through their purchas<strong>in</strong>g choices.<br />
The results also show that packag<strong>in</strong>g can have an important role <strong>in</strong> reduc<strong>in</strong>g energy use so it is important<br />
to understand how different raw materials, manufactur<strong>in</strong>g processes and waste management (the percentage<br />
recycled, sent to landfill or <strong>in</strong>c<strong>in</strong>erated) are related to overall energy use. However, this stage of the agri-food<br />
supply cha<strong>in</strong> is very complex because it has several limitations. Firstly, packag<strong>in</strong>g types are restricted by<br />
product types (dr<strong>in</strong>ks tend to be <strong>in</strong> alum<strong>in</strong>ium cans rather than cartons whilst nuts can easily be packed <strong>in</strong> a<br />
stand-up pouch rather than a glass jar). It would require changes to process<strong>in</strong>g procedures, shelf life, storage<br />
requirements and customer perceptions to enable changes to packag<strong>in</strong>g types to be <strong>in</strong>troduced. However, it is<br />
likely that improv<strong>in</strong>g technology will still achieve energy efficiencies. Secondly, product packag<strong>in</strong>g is<br />
strongly <strong>in</strong>fluenced by product saf<strong>et</strong>y but it can also be affected by social conceptions. For example, even if<br />
switch<strong>in</strong>g pasta sauces to soft pouches could lower product embedded energy values, and be acceptable to<br />
customers, it is possible that concerns over saf<strong>et</strong>y would prevent manufacturers mak<strong>in</strong>g the switch. F<strong>in</strong>ally,<br />
the embedded energy of packag<strong>in</strong>g can be <strong>in</strong>fluenced by the end-user through recycl<strong>in</strong>g options. Companies<br />
that use recycled material and promote recycl<strong>in</strong>g, for example, Coca-Cola (Coca-cola, <strong>2012</strong>) can <strong>in</strong>crease the<br />
use of recycled material <strong>in</strong> their packag<strong>in</strong>g. A cont<strong>in</strong>uous <strong>in</strong>crease <strong>in</strong> the content of recycled material <strong>in</strong> their<br />
641
PARALLEL SESSION 7C: FOOD CHAIN AND FOOD WASTE 8 th Int. Conference on <strong>LCA</strong> <strong>in</strong> the<br />
Agri-<strong>Food</strong> Sector, 1-4 Oct <strong>2012</strong><br />
packag<strong>in</strong>g will reduce the use of virg<strong>in</strong> material and lower the embedded energy of the packag<strong>in</strong>g <strong>in</strong> the<br />
long-term.<br />
5. Conclusion<br />
This study of energy use <strong>in</strong> the agri-food supply cha<strong>in</strong> shows that there is great diversity <strong>in</strong> product embedded<br />
energy values. Different food types have very different requirements for energy and there is considerable<br />
scope for mitigation <strong>in</strong> energy consumption <strong>in</strong> the agri-food sector. Primary production has the greatest<br />
requirement for energy which is concentrated <strong>in</strong> the manufacture of nitrogen fertiliser and the use of road<br />
fuels; energy efficiency research should concentrate <strong>in</strong> this area. Process<strong>in</strong>g and manufactur<strong>in</strong>g also use considerable<br />
amounts of energy although new technology and comp<strong>et</strong>ition is br<strong>in</strong>g<strong>in</strong>g about greater energy efficiency.<br />
Packag<strong>in</strong>g rema<strong>in</strong>s an area where improvements are possible although progress may be restricted by<br />
an unwill<strong>in</strong>gness to <strong>in</strong>novate or to <strong>in</strong>vest <strong>in</strong> new technologies and equipment. In contrast, the <strong>in</strong>creas<strong>in</strong>g trend<br />
towards the consumption of ready-made, chilled and frozen foods has <strong>in</strong>creased product embedded energy<br />
values.<br />
Energy is not a priority for the majority of agri-food bus<strong>in</strong>esses s<strong>in</strong>ce hygiene and food saf<strong>et</strong>y are always<br />
of greater concern; <strong>in</strong>creases <strong>in</strong> the cost of energy are a long-term but solvable issue whereas a food saf<strong>et</strong>y<br />
problem has the ability to ru<strong>in</strong> a bus<strong>in</strong>ess almost over-night. Our study has shown that there is plenty of <strong>in</strong>terest<br />
<strong>in</strong> improv<strong>in</strong>g energy efficiency, ma<strong>in</strong>ly for economic reasons, but that there is a lack of <strong>in</strong>formation on<br />
the needs and concerns of the different stakeholders with<strong>in</strong> the supply cha<strong>in</strong>. More research is needed to<br />
identify efficient production m<strong>et</strong>hods, adapted to the needs of the different stakeholders. There is no s<strong>in</strong>gle<br />
solution for the reduction of energy consumption; <strong>in</strong>stead there is the need for broad spectrum changes towards<br />
energy efficiency along the entire agri-food supply cha<strong>in</strong>.<br />
6. Acknowledgements<br />
The authors would like to gratefully acknowledge the valuable <strong>in</strong>put of Julia Oswald on packag<strong>in</strong>g and Defra<br />
for fund<strong>in</strong>g this project.<br />
7. References<br />
Audsley, E., Brander, M., Chatterton, J., Murphy-Bokern, D., Webster, C., Williams, A., 2009. How low can we go? An assessment<br />
of greenhouse gas emissions from the UK food system and the scope to reduce them by 2050, FCRN-WWF-UK.<br />
Carlsson-Kanyama, A., Ekstrom, M., Shanahan, H. 2003. <strong>Food</strong> and life cycle energy <strong>in</strong>puts: consequences of di<strong>et</strong> and ways to <strong>in</strong>crease<br />
efficiency. Ecological Economics 44 (2-3): 293-307.<br />
Coca-Cola. http://www.coca-cola.co.uk/environment/ (accessed 14 August <strong>2012</strong>)<br />
Erz<strong>in</strong>ger, E., Dux, D., Zimmermann, A., Baderscher, R. 2003. <strong>LCA</strong> of animal products from different hous<strong>in</strong>g systems. In: <strong>LCA</strong> <strong>in</strong><br />
the Agri-<strong>Food</strong> Sector, Horsens.<br />
Lillywhite, R., Chandler, D., Grant, W., Lewis, K., Firth, C., Schmutz, U., Halp<strong>in</strong>, D. 2007. Environmental footpr<strong>in</strong>t and susta<strong>in</strong>ability<br />
of horticulture: A comparison with other agricultural sectors. F<strong>in</strong>al report of Defra project WQ0101. University of Warwick<br />
and Defra, London.<br />
Lillywhite, R., Sarrouy, C., Davidson, J., <strong>2012</strong>. Energy Dependency and <strong>Food</strong> Cha<strong>in</strong> Security, Ma<strong>in</strong> Report. Defra Research Project<br />
FO0415. University of Warwick and Defra, Coventry.<br />
Oswald, J., 2011. Evaluation of the Energy Use of Packag<strong>in</strong>g <strong>in</strong> the <strong>Food</strong> Industry. MPhil dissertation, University of Cambridge.<br />
SCRIP. 2006. The Steel Lifecycle. R<strong>et</strong>rieved 28 July 2010, from http://www.scrib.org/recycl<strong>in</strong>g_steel/steel_lifecycle.asp.<br />
UN Human Rights Council, 2011. Report of the Special Rapporteur on the Right to <strong>Food</strong>, The right to an adequate di<strong>et</strong>: the agriculture-food-health<br />
nexus, 26 December 2011, A/HRC/19/59.<br />
Willams, A., Audsley, E., Sandars, D. 2006. D<strong>et</strong>erm<strong>in</strong><strong>in</strong>g the environmental burdens and resource use <strong>in</strong> the production of agricultural<br />
and horticultural commodities. F<strong>in</strong>al report of Defra project IS0205. Cranfield University and Defra, London.<br />
WRAP, (not dated) Lightweight<strong>in</strong>g Beer and Cider Packag<strong>in</strong>g. R<strong>et</strong>rieved 28 July 2010, from<br />
http://www.wrap.org.uk/downloads/Case_Study_-_GlassRite_16_10_08_1230.79587ba6.6085.pdf.<br />
WRAP, 2011. Glass Toolkit – Recycled Content Calculator. R<strong>et</strong>rieved 28 July 2011, from<br />
http://www.wrap.org.uk/r<strong>et</strong>ail_supply_cha<strong>in</strong>/research_tools/tools/glass_recycled_content_toolkit/recycled_content.html.<br />
642
PARALLEL SESSION 7C: FOOD CHAIN AND FOOD WASTE 8 th Int. Conference on <strong>LCA</strong> <strong>in</strong> the<br />
Agri-<strong>Food</strong> Sector, 1-4 Oct <strong>2012</strong><br />
Comparison of the life cycle impacts of ready-made and home-made<br />
meals<br />
Ximena Schmidt Rivera, Namy Esp<strong>in</strong>oza Orias, Adisa Azapagic *<br />
School of Chemical Eng<strong>in</strong>eer<strong>in</strong>g and Analytical Science, Room C16, The Mill, Sackville Stre<strong>et</strong>, The University of Manchester,<br />
Manchester M13 9PL, UK<br />
Correspond<strong>in</strong>g author. e-mail: adisa.azapagic@manchester.ac.uk<br />
ABSTRACT<br />
This study compares the environmental impacts of a ready-made meal with an equivalent meal prepared at home. The meal considered<br />
consists of roast chicken, veg<strong>et</strong>ables and tomato sauce. The results <strong>in</strong>dicate that the home-made meal has on average 2.7 times<br />
lower environmental impacts than the ready-made meal. The ma<strong>in</strong> hotspots for both meals are the <strong>in</strong>gredients (chicken and tomato<br />
sauce) and <strong>in</strong> the case of the ready-made meal, refrigerant leakage. The contribution of packag<strong>in</strong>g and meal cook<strong>in</strong>g at home is small,<br />
although the latter is more significant for the home-made meal.<br />
Keywords: convenience food, home-made meals, ready-made meals, environmental impacts, <strong>LCA</strong><br />
1. Introduction<br />
Convenience food and particularly ready-made meals are becom<strong>in</strong>g <strong>in</strong>creas<strong>in</strong>gly popular due to our modern<br />
life style. For example, the UK ready-made meal mark<strong>et</strong> was valued at £2.7 billion <strong>in</strong> 2010 (MINTEL,<br />
2011) with approximately 8.8 kg of chilled and frozen ready-made meals consumed per capita per year<br />
(Millstone and Lang, 2008).<br />
Y<strong>et</strong>, there is currently little <strong>in</strong>formation on the life cycle environmental impacts of convenience food, and<br />
particularly ready-made meals. Whilst numerous <strong>LCA</strong> studies exist of s<strong>in</strong>gle food items, there are few studies<br />
of compl<strong>et</strong>e meals with most focus<strong>in</strong>g on global warm<strong>in</strong>g potential, GWP (e.g. Carlsson-Kanyama, 1998;<br />
Wiltshire <strong>et</strong> al., 2008; Stichnothe <strong>et</strong> al., 2008; Esp<strong>in</strong>oza-Orias <strong>et</strong> al., 2010) or on a limited number of environmental<br />
impacts (e.g. Sonesson <strong>et</strong> al., 2005; Davis and Sonesson, 2008; Davis <strong>et</strong> al., 2009; Berl<strong>in</strong> and<br />
Sund, 2010). To date, only two studies have considered the full <strong>LCA</strong> impacts of ready-made meals, both<br />
based <strong>in</strong> Spa<strong>in</strong> (Calderon <strong>et</strong> al., 2010; Zufia and Arana, 2008). As far as the authors are aware, no full <strong>LCA</strong><br />
studies have been carried out for ready-made meals <strong>in</strong> the UK.<br />
Therefore, this paper evaluates the life cycle environmental impacts of a ‘typical’ UK ready-made meal<br />
consist<strong>in</strong>g of roast chicken meat, veg<strong>et</strong>ables and tomato sauce and compares it to an equivalent meal made at<br />
home.<br />
2. M<strong>et</strong>hodology<br />
The life cycle assessment (<strong>LCA</strong>) m<strong>et</strong>hodology used <strong>in</strong> this study follows the ISO 14040 standard series (ISO,<br />
2006) and is outl<strong>in</strong>ed below. GaBi software (PE International, 2011) has been used to carry out the <strong>LCA</strong>,<br />
apply<strong>in</strong>g the CML 2 Basel<strong>in</strong>e 2001 m<strong>et</strong>hod (Gu<strong>in</strong>ée <strong>et</strong> al., 2001).<br />
2.1. Goal and scope of the study<br />
The goal of the study is to evaluate the environmental impacts of a ready-made meal prepared <strong>in</strong>dustrially<br />
and compare it to the impacts from an equivalent meal made at home. The results of the study are aimed at<br />
both food producers and consumers.<br />
The functional unit is def<strong>in</strong>ed as ‘preparation and consumption of a meal for one person’. The weight of<br />
the meal is 360 g and it consists of roast chicken meat and three veg<strong>et</strong>ables (potatoes, carrots and peas),<br />
served with tomato sauce. The meal is consumed at home. The scope is from ‘cradle to grave’ and the study<br />
is based <strong>in</strong> the UK.<br />
2.2. System def<strong>in</strong>ition and assumptions<br />
As shown <strong>in</strong> Fig. 1, the life cycles of the ready-made meal <strong>in</strong>volves chicken rear<strong>in</strong>g and cultivation of the<br />
veg<strong>et</strong>ables, process<strong>in</strong>g of the <strong>in</strong>gredients at a regional distribution centre (RDC), preparation of the meal at a<br />
manufactur<strong>in</strong>g site, its subsequent transport to another RDC, r<strong>et</strong>ailer and f<strong>in</strong>ally to consumer’s home where it<br />
is prepared accord<strong>in</strong>g to manufacturer’s <strong>in</strong>structions. The life cycle of the home-made meal is similar, except<br />
that the meal is fully prepared at home, start<strong>in</strong>g from the fresh <strong>in</strong>gredients. The meal <strong>in</strong>gredients are given <strong>in</strong><br />
Table 1.<br />
643
PARALLEL SESSION 7C: FOOD CHAIN AND FOOD WASTE 8 th Int. Conference on <strong>LCA</strong> <strong>in</strong> the<br />
Agri-<strong>Food</strong> Sector, 1-4 Oct <strong>2012</strong><br />
Figure 1. Life cycles of the ready and home-made meals. [RDCm and RDCp: Regional distribution centre<br />
for raw materials and products, respectively; T- transport; W - waste]<br />
The raw materials stage <strong>in</strong>volves cultivation of the veg<strong>et</strong>ables and chicken rear<strong>in</strong>g which are then transported<br />
from the farm to the regional distribution centre for raw materials (RDCm) to be processed. It is assumed<br />
that the raw materials (<strong>in</strong>gredients) are sourced from conventional farms <strong>in</strong> the UK, except for the<br />
tomatoes used for the tomato paste which are imported from Spa<strong>in</strong> (FAO, 2009). The tomato paste, oil and<br />
salt are transported directly from their respective manufacturers to the meal manufacturer.<br />
The pre-process<strong>in</strong>g stage <strong>in</strong>cludes clean<strong>in</strong>g the veg<strong>et</strong>ables and slaughter<strong>in</strong>g the chickens, packag<strong>in</strong>g <strong>in</strong><br />
plastic bags, crates and pall<strong>et</strong>s and subsequent refrigeration. The manufacture <strong>in</strong>volves cook<strong>in</strong>g of the readymade<br />
meal from fresh <strong>in</strong>gredients, its packag<strong>in</strong>g and transportation to the regional distribution centre for<br />
products (RDCp). Veg<strong>et</strong>ables and tomato paste are cooked tog<strong>et</strong>her while the chicken meat is cooked separately.<br />
The cooked <strong>in</strong>gredients are then comb<strong>in</strong>ed, packaged and refrigerated.<br />
The ready-made meals are stored at the RDCp and then distributed to the r<strong>et</strong>ailer as chilled. The assumed<br />
annual refrigerant leakage is 15%; the assumed average wastage of the meal at r<strong>et</strong>ailer is 2% (Brunel, 2008).<br />
The <strong>in</strong>gredients for the home-made meal are chilled at both the RDCp and the r<strong>et</strong>ailer. The ready-made<br />
meals and the <strong>in</strong>gredients for the home-made meal are then transported to consumer’s home.<br />
In the consumption stage, storage and meal preparation at home are considered. The ready-made meal is<br />
cooked <strong>in</strong> a microwave (accord<strong>in</strong>g to manufacturers’ recommendations). For the home-made meal, the average<br />
UK practice is assumed with the chicken roasted <strong>in</strong> the oven and the tomato sauce and the veg<strong>et</strong>ables<br />
cooked on the electric cooker. Note that refrigerated storage at home considers the electricity used but not<br />
refrigerant leakage as domestic refrigerators have negligible leakage rates.<br />
All the primary, secondary and tertiary packag<strong>in</strong>g has been considered, <strong>in</strong>clud<strong>in</strong>g the <strong>in</strong>gredients and<br />
ready-made meal packag<strong>in</strong>g, shopp<strong>in</strong>g bags, crates, boxes and pall<strong>et</strong>s. All the waste and packag<strong>in</strong>g are assumed<br />
to be landfilled, except for the chicken meat from the RDCm, which is <strong>in</strong>c<strong>in</strong>erated. These assumptions<br />
are <strong>in</strong> accordance with the prevalent UK waste management practice for food-related products and<br />
packag<strong>in</strong>g. All road transport is by diesel vehicles, assum<strong>in</strong>g an empty r<strong>et</strong>urn trip.<br />
2.3. Data sources<br />
An overview of the data used <strong>in</strong> the study is given <strong>in</strong> Table 2. As can be seen from the table, most data for<br />
the <strong>in</strong>gredients correspond to their country of orig<strong>in</strong> considered <strong>in</strong> this study. The exception is the data for<br />
carrots and onions which are not available for the UK, so Danish data have been used <strong>in</strong>stead (Nielsen <strong>et</strong> al.,<br />
2003). Furthermore, data for peas are also not available, so proxy data for green beans have been used follow<strong>in</strong>g<br />
recommendations by Milà i Canals <strong>et</strong> al., (2011) on deal<strong>in</strong>g with data gaps <strong>in</strong> the food sector.<br />
644<br />
Raw<br />
materials<br />
Pre-process<strong>in</strong>g<br />
Manufactur<strong>in</strong>g<br />
Distribution<br />
Consumption<br />
(meal<br />
preparation)<br />
Disposal<br />
Ready-made meal Home-made meal<br />
Ingredients<br />
RDCm<br />
Packag<strong>in</strong>g<br />
T T<br />
W<br />
T<br />
Manufactur<strong>in</strong>g<br />
T<br />
RDCp<br />
T<br />
R<strong>et</strong>ail<br />
T<br />
Consumption<br />
T<br />
Disposal<br />
W<br />
W<br />
W<br />
Ingredients<br />
RDCm<br />
R<strong>et</strong>ail<br />
Consumption<br />
Disposal<br />
Packag<strong>in</strong>g<br />
T T<br />
W<br />
T<br />
T<br />
T<br />
W
PARALLEL SESSION 7C: FOOD CHAIN AND FOOD WASTE 8 th Int. Conference on <strong>LCA</strong> <strong>in</strong> the<br />
Agri-<strong>Food</strong> Sector, 1-4 Oct <strong>2012</strong><br />
Table 1. Meal <strong>in</strong>gredients<br />
Ingredients Weight [g] Contribution [%]<br />
Chicken 98.0 27.2<br />
Potatoes 87.5 24.3<br />
Carrots 35.0 9.7<br />
Peas 35.0 9.7<br />
Tomato sauce: 94.5 26.3<br />
Tomatoes/tomato paste 66.2 70<br />
Onions 28.3 30<br />
Salt 1.0 0.3<br />
Veg<strong>et</strong>able oil 9.0 2.6<br />
Total 360 100<br />
Table 2. Overview of the data sources used <strong>in</strong> the study<br />
Stage D<strong>et</strong>ail Reference Data orig<strong>in</strong><br />
Raw materials British conventional & organic chicken Williams <strong>et</strong> al., (2006) UK<br />
Brazilian conventional chicken Prudêncio da Silva <strong>et</strong> al.,<br />
(2010)<br />
Brazil<br />
British conventional & organic tomatoes Williams <strong>et</strong> al., (2006) UK<br />
Spanish conventional tomatoes Anton <strong>et</strong> al., (2005) Spa<strong>in</strong><br />
British conventional & organic carrots Nielsen <strong>et</strong> al., (2003) Denmark<br />
British conventional onions Nielsen <strong>et</strong> al., (2003) Denmark<br />
British conventional peas a Milà i Canals <strong>et</strong> al.,<br />
(2008)<br />
UK<br />
Tomato paste EC (2006); FAO (2009) Spa<strong>in</strong><br />
Slaughterhouse Nielsen <strong>et</strong> al., (2003) Denmark<br />
Polypropylene crate Brunel (2008) UK<br />
Shopp<strong>in</strong>g bags Brunel (2008) UK<br />
Cardboard box Brunel (2008) UK<br />
Pall<strong>et</strong> Brunel (2008) UK<br />
RDCm Fresh pre-process<strong>in</strong>g Milà i Canals <strong>et</strong> al.,<br />
(2008)<br />
UK<br />
Manufactur<strong>in</strong>g Ready-made meal UK manufacturer 2010 b<br />
UK<br />
Emissions from food manufacture EC (2006) EU<br />
RDCp Energy consumption Brunel (2008) UK<br />
R<strong>et</strong>ail Supermark<strong>et</strong> d<strong>et</strong>ails Brunel (2008) UK<br />
Consumption Microwave and oven electricity; water consump- Nielsen <strong>et</strong> al., (2003); UK<br />
(meal preparation) tion<br />
eco<strong>in</strong>vent (2009)<br />
Waste Pre-process<strong>in</strong>g (RDCm) Milà i Canals <strong>et</strong> al.,<br />
(2008)<br />
Manufacture BIS (2011)<br />
RDCp Brunel (2008)<br />
R<strong>et</strong>ail Brunel (2008)<br />
Consumption WRAP (2009)<br />
Waste management <strong>Food</strong> landfill<strong>in</strong>g eco<strong>in</strong>vent (2009) -<br />
Inc<strong>in</strong>eration of chicken residues Nielsen <strong>et</strong> al., (2003) -<br />
Landfill of paper and cardboard PE (2011)<br />
Landfill of wood PE (2011) -<br />
Landfill of plastics (PP, HDPE) PE (2011) -<br />
Transport Road transport (diesel vehicles) eco<strong>in</strong>vent (2009) -<br />
Bulk sea carrier eco<strong>in</strong>vent (2009) -<br />
a<br />
Green beans used as proxy due to lack of data<br />
b Confidential data<br />
3. Results and discussion<br />
The life cycle impacts of the ready- and home-made meals are shown <strong>in</strong> Fig. 2. The results <strong>in</strong>dicate that<br />
the impacts of prepar<strong>in</strong>g the meal at home are on average 2.7 times lower than that of the ready-made meal,<br />
rang<strong>in</strong>g from 10% for GWP to 17 times for ODP <strong>in</strong> favour of the home-made meal (note that the average is<br />
skewed by a high difference <strong>in</strong> the ODP; if ODP is not considered, the average difference is 1.23 times). The<br />
ma<strong>in</strong> reason for this is the avoidance of leakage from the refrigerated storage and the lower amount of food<br />
waste <strong>in</strong> the home-made meal system.<br />
645
PARALLEL SESSION 7C: FOOD CHAIN AND FOOD WASTE 8 th Int. Conference on <strong>LCA</strong> <strong>in</strong> the<br />
Agri-<strong>Food</strong> Sector, 1-4 Oct <strong>2012</strong><br />
The raw materials, distribution and manufacture of the ready-made meal are the most important contributors<br />
to most impacts from this system. For example, as illustrated <strong>in</strong> Fig. 3, the raw materials and distribution<br />
each contribute around 25% to the GWP of the ready-made meal, followed by pre-process<strong>in</strong>g and meal<br />
manufactur<strong>in</strong>g (~17% each); packag<strong>in</strong>g contributes around 7%. Meal preparation at home has a relatively<br />
small impact (2%). Among the <strong>in</strong>gredients, chicken and tomato are the ma<strong>in</strong> hotspots, contribut<strong>in</strong>g 90% to<br />
GWP from the raw materials stage.<br />
Figure 2. Environmental impacts of the ready- and home-made meals<br />
Figure 3. GWP hotspots for the ready- and home-made meals<br />
4. Conclusions<br />
This study has exam<strong>in</strong>ed the life cycle environmental impacts of a typical ready-made meal produced and<br />
consumed <strong>in</strong> the UK. The results suggest that prepar<strong>in</strong>g the same meal at home is environmentally more<br />
susta<strong>in</strong>able than the ready-made meal when the same <strong>in</strong>gredients are used: the difference <strong>in</strong> the impacts is on<br />
average 2.7 times <strong>in</strong> favour of the home-made meal (or 1.23 times if the difference <strong>in</strong> ozone layer depl<strong>et</strong>ion<br />
is not considered). The ma<strong>in</strong> reason for this is the avoidance of refrigerant leakage and lower amount of food<br />
waste for the home-made meal system.<br />
646<br />
Global warm<strong>in</strong>g potential (kg/functional unit)<br />
70<br />
60<br />
50<br />
40<br />
30<br />
20<br />
10<br />
0<br />
3.83<br />
3.45<br />
GWP [kg CO2 eq.]<br />
4.0<br />
3.5<br />
3.0<br />
2.5<br />
2.0<br />
1.5<br />
1.0<br />
0.5<br />
0.0<br />
0.96<br />
ADP fossil [MJ]<br />
1.69<br />
29.51<br />
17.22<br />
ADP elements [g Sb eq.]<br />
Ingredients Preprocess<strong>in</strong>g<br />
0.61<br />
0.68<br />
4.64<br />
14.03<br />
AP [g SO2 eq.]<br />
0.73<br />
47.65<br />
41.40<br />
0.00<br />
Readiy-made meal Home-made meal<br />
EP [g PO4 eq.]<br />
14.77<br />
12.75<br />
FAETP x 10^-1 [kg DCB eq.]<br />
1.07<br />
2.92<br />
2.30<br />
HTP x 10^-1 [Kg DCB eq.]<br />
0.73<br />
0.08<br />
14.01<br />
11.98<br />
2.03<br />
1.57<br />
MAETP [t DCB eq.]<br />
Ready-made meal Home-made meal<br />
0.24<br />
ODP x 10 [µg R11 eq.]<br />
0.08<br />
0.11<br />
69.17<br />
3.98<br />
2.51<br />
1.87<br />
POCP [g C2H4 eq.]<br />
0.29<br />
0.01<br />
TETP [g DCB eq.]<br />
Manufacture Distribution Consumption Disposal Packag<strong>in</strong>g Total<br />
3.83<br />
12.67<br />
6.92<br />
3.45
PARALLEL SESSION 7C: FOOD CHAIN AND FOOD WASTE 8 th Int. Conference on <strong>LCA</strong> <strong>in</strong> the<br />
Agri-<strong>Food</strong> Sector, 1-4 Oct <strong>2012</strong><br />
The ma<strong>in</strong> hotspots for both types of meal are the <strong>in</strong>gredients and for the ready-made meal, refrigeration.<br />
The contribution of packag<strong>in</strong>g and meal preparation at home is relatively small, although the latter is more<br />
significant for home- rather than ready-made meals.<br />
5. References<br />
Anton, A., Montero J. I., and Muñoz, P., 2005. <strong>LCA</strong> and Tomato Production <strong>in</strong> Mediterranean Greenhouses. Int. J. Agriculture Resources<br />
Governance and Ecology 4(2).<br />
Berl<strong>in</strong>, J., and. Sund, V, 2010. Environmental Life Cycle Assessment (<strong>LCA</strong>) of Ready Meals. SIK Report No. 804 2010.<br />
http://www.sik.se/archive/pdf-filer-katalog/SR804.pdf.<br />
BIS, 2011. Global <strong>Food</strong> and Farm<strong>in</strong>g Futures, Synthesis Report C7: Reduc<strong>in</strong>g Waste. The Government Office for Science, Department<br />
for Bus<strong>in</strong>ess, Innovation and Skills, London. http://www.bis.gov.uk/ass<strong>et</strong>s/bispartners/foresight/docs/food-andfarm<strong>in</strong>g/synthesis/11-627-c7-reduc<strong>in</strong>g-waste.pdf.<br />
Brunel, U., 2008. Greenhouse Gas Impacts of <strong>Food</strong> R<strong>et</strong>ail<strong>in</strong>g. Report F0405, DEFRA, London.<br />
Calderón, L. A., Iglesias, L., Laca, A., Herrero, M. And Diaz., M., 2010. The Utility of Life Cycle Assessment <strong>in</strong> the Ready Meal<br />
<strong>Food</strong> Industry. Resources Conservation and Recycl<strong>in</strong>g 54(12): 1196-1207.<br />
Carlsson-Kanyama, A. 1998. Climate Change and Di<strong>et</strong>ary Choices – How Can Emissions of Greenhouse Gases from <strong>Food</strong> Consumption<br />
be Reduced? <strong>Food</strong> Policy, 23(3/4): 277-293.<br />
Davis, J. and U. Sonesson (2008). Life Cycle Assessment of Integrated <strong>Food</strong> Cha<strong>in</strong>s - A Swedish Case Study of Two Chicken Meals.<br />
Int. J. <strong>LCA</strong> 13(7): 574-584.<br />
Davis, J, Sonesson, U, Baumgartner, D, and Nemecek, T. (2009). Environmental Impact of Four Meals with Different Prote<strong>in</strong><br />
Sources: Case Studies <strong>in</strong> Spa<strong>in</strong> and Sweden. <strong>Food</strong> Research Int. 43(7): 1874-1884.<br />
http://archive.defra.gov.uk/foodfarm/grow<strong>in</strong>g/organic/standards/pdf/guidance-document-jan2010.pdf.<br />
EC 2006. Reference Document on Best Available Techniques <strong>in</strong> the <strong>Food</strong>, Dr<strong>in</strong>k and Milk Industries, European Commission. pp163-<br />
165. August 2006. http://ftp.jrc.es/eippcb/doc/fdm_bref_0806.pdf.<br />
Eco<strong>in</strong>vent 2009. Eco<strong>in</strong>vent Database. Swiss Centre for Life Cycle Inventories, http://www.eco<strong>in</strong>vent.ch.<br />
Esp<strong>in</strong>oza-Orias, N., Stichnothe, H., and Azapagic, A., 2010. Carbon Footpr<strong>in</strong>t of Ready-Made Chilled Meals. Proc. 1 st IIR International<br />
Cold Cha<strong>in</strong> Conference Susta<strong>in</strong>ability and the Cold Cha<strong>in</strong>, 29-31 March 2010, Cambridge.<br />
FAO 2009. Agribus<strong>in</strong>ess Handbook: Fruit and Veg<strong>et</strong>able Process<strong>in</strong>g. FAO Investment Centre Division and FAO’s Rural Infrastructure<br />
and Agro-Industries Division. Rome, Italy, http://www.fao.org/docrep/012/al177e/al177e.pdf.<br />
Gu<strong>in</strong>ée JB, Gorrée M, Heijungs R, Huppes G, Kleijn R, De Kon<strong>in</strong>g A. Life cycle assessment: an Operational Guide to the ISO Standards;<br />
Part 2a. Institute Oo Environmental Sciences, University of Leiden; 2001.<br />
ISO 2006. ISO 14040, Environmental Management – Life Cycle Assessment: Pr<strong>in</strong>ciples and Framework. International Standards<br />
Organisation, Geneva.<br />
Milà i Canals, Ll., Muñoz, I., Hospido, A., Plassmann, A. and McLaren, S., 2008. Life Cycle Assessment (<strong>LCA</strong>) of Domestic vs<br />
Imported Veg<strong>et</strong>ables: Case studies on Broccoli, Salad Crops and Green Beans. Centre for Environmental Strategy, University of<br />
Surrey. http://www.surrey.ac.uk/ces/files/pdf/0108_CES_WP_RELU_Integ_<strong>LCA</strong>_local_vs_global_vegs.pdf.<br />
Milà i Canals, L., Azapagic, A., Doka, G., Jefferies, D., K<strong>in</strong>g, H., Mutel, C., Nemecek, T., Roches, A., Sim, S., Stichnothe, H.,<br />
Thoma, G., and Williams, A., 2011. Approaches for Address<strong>in</strong>g <strong>LCA</strong> Data Gaps for Bio-based Products. J Industrial Ecology,<br />
15(5): 707-725.<br />
Millstone, E. and Lang, T., 2008. The Atlas of <strong>Food</strong>: Who Eats What, Where, and Why. Earthscan, London.<br />
Nielsen, P. H., Nielsen, A. M., Weidema, B. P, Frederiksen, R. H., Dalgaard, R., Halberg, N., 2003. <strong>LCA</strong> <strong>Food</strong> Database.<br />
http://www.lcafood.dk.<br />
Prudêncio da Silva, V., H.M.G. van der Werf and S. R. Soares (2010). <strong>LCA</strong> of French and Brazilian Broiler Poultry Production<br />
Systems. Proceed<strong>in</strong>gs of <strong>LCA</strong> <strong>Food</strong> 2010 (Vol.1): 475-480.<br />
PE International 2011. Gabi Software and Database. http://www.gabi-software.com.<br />
Sonesson, U., Mattsson, B., Nybrant, T., and Ohlsson, T., 2005. Industrial Process<strong>in</strong>g Versus Home Cook<strong>in</strong>g: An Environmental<br />
Comparison B<strong>et</strong>ween Three Ways to Prepare a Meal. Ambio 34(4-5): 414-421.<br />
Stichnothe, H., Hospido, A., and Azapagic, A., 2008. Carbon Footpr<strong>in</strong>t Estimation of <strong>Food</strong> Production Systems: The Importance of<br />
Consider<strong>in</strong>g M<strong>et</strong>hane and Nitrous Oxide.<br />
Williams, A. G., Audsley, E., and Sandars, D.L., 2006. D<strong>et</strong>erm<strong>in</strong><strong>in</strong>g the Environmental Burdens and Resource Use <strong>in</strong> the Production<br />
of Agricultural and Horticultural Commodities. Research Project ISO205.<br />
http://www.cranfield.ac.uk/sas/naturalresources/research/projects/is0205.html.<br />
Wiltshire, J., Wynn, S., Clarke, J., Chambers, B., Cottrill, B., Drakes, D., Gitt<strong>in</strong>s, J., Nicholson, C., Phillips, K., Thoman, R., Tiff<strong>in</strong>,<br />
D., Walker, O., Tucker, G., Thorn, R., Green, A., Fendler, A., Williams, A., Bellamy, P., Audsley, E., Chatterton, J., Chadwick,<br />
D., Foster, C., 2008. Scenario Build<strong>in</strong>g to Test and Inform the Development of a BSI M<strong>et</strong>hod for Assess<strong>in</strong>g GHG Emissions<br />
from <strong>Food</strong>. Research Project F<strong>in</strong>al Report (DEFRA project Code FO0404). Department for Environment, <strong>Food</strong> and Rural Affairs,<br />
London. http://randd.defra.gov.uk/Default.aspx?Menu=Menu&Module=More&Location=<br />
None&Compl<strong>et</strong>ed=0&ProjectID=15650.<br />
WRAP 2009. Household <strong>Food</strong> and Dr<strong>in</strong>k Waste <strong>in</strong> the UK. WRAP, London.<br />
http://www.wrap.org.uk/downloads/Household_<strong>Food</strong>_and_Dr<strong>in</strong>k_Waste_<strong>in</strong>_the_UK_Nov_2011.106b4a18.8048.pdf.<br />
Zufia, J. and Arana, L. 2008. Life Cycle Assessment To Eco-Design <strong>Food</strong> Products: Industrial Cooked Dish Case Study. J Cleaner<br />
Prod. 16(17): 1915-1921.<br />
647
POSTER SESSIONS<br />
8 th International Conference on<br />
Life Cycle Assessment <strong>in</strong> the Agri-<strong>Food</strong> Sector<br />
October 1-4<br />
<strong>2012</strong><br />
Sa<strong>in</strong>t-<strong>Malo</strong><br />
<strong>France</strong>
GROUP 1, SESSION A: ANIMAL PRODUCTION SYSTEMS 8 th Int. Conference on <strong>LCA</strong> <strong>in</strong> the<br />
648<br />
Agri-<strong>Food</strong> Sector, 1-4 Oct <strong>2012</strong><br />
Poster session A - Tuesday, 2 October, 16.20-16.50<br />
Group 1, Session A : Animal Production Systems<br />
1. Coupl<strong>in</strong>g <strong>LCA</strong> and GIS for the assessment of greenhouse gas<br />
emissions from global livestock production<br />
Alessandra Falcucci 1,* , Giuseppe Tempio 1 , Michael Macleod 1 , Carolyn Opio 1 , Theun Vell<strong>in</strong>ga 2 , Pierre<br />
Gerber 1<br />
1 <strong>Food</strong> and Agriculture Organization of the United Nations, 2 Wagen<strong>in</strong>gen Livestock Research, The N<strong>et</strong>herlands,<br />
Correspond<strong>in</strong>g author. E-mail: alessandra.falcucci@fao.org<br />
Usually life cycle assessments (<strong>LCA</strong>) are produced outside of any spatially explicit context even though the<br />
<strong>in</strong>tegration with a Geographical Information Systems (GIS) would provide the necessary tools to fully implement<br />
a spatially explicit <strong>LCA</strong>. The few examples available provide only a partial <strong>in</strong>tegration among the<br />
two, with the GIS used only for specific aspects of the <strong>LCA</strong> (e.g. land use). We provide an example of a<br />
compl<strong>et</strong>e <strong>in</strong>tegration b<strong>et</strong>ween <strong>LCA</strong> and GIS with the general aim of assess<strong>in</strong>g GHG emissions from livestock<br />
at the global level. In particular, us<strong>in</strong>g a process based approach, we estimated GHG emissions from different<br />
compartments, namely: feed production (<strong>in</strong>clud<strong>in</strong>g cultivation, <strong>in</strong>duced land use change, manufacture of<br />
fertiliser and process<strong>in</strong>g and transport), manure management, , enteric fermentation, energy use (embedded<br />
and direct), and post-farm emissions to the po<strong>in</strong>t of r<strong>et</strong>ail. The entire <strong>LCA</strong> was implemented <strong>in</strong> GIS us<strong>in</strong>g as<br />
<strong>in</strong>puts spatially explicit layers available at the global level from different sources, and represent<strong>in</strong>g the different<br />
variables <strong>in</strong>cluded <strong>in</strong> the model (e.g. climate, agro-ecological zones, <strong>et</strong>c.). The approach that we propose<br />
has many advantages. It allows for: (1) a global analysis that still ma<strong>in</strong>ta<strong>in</strong>s a reasonable spatial resolution<br />
compared to more traditional national and/or regional analyses; (2) the <strong>in</strong>clusion of the many spatially<br />
explicit variables developed <strong>in</strong> the last few years by a wealth of <strong>in</strong>ternational research centres, and; (3) a<br />
b<strong>et</strong>ter <strong>in</strong>tegration of variables that are naturally highly variable <strong>in</strong> time and space (e.g. temperatures, yields,<br />
<strong>et</strong>c.) and that represent the ma<strong>in</strong> drivers of important GHG emission sources (such as feed production, manure<br />
management). In addition, us<strong>in</strong>g a spatially explicit database it is possible to comb<strong>in</strong>e, aggregate and/or<br />
extract the data depend<strong>in</strong>g on the particular question at hand, consider<strong>in</strong>g different spatial scales and different<br />
adm<strong>in</strong>istrative regions (or other spatial aggregations). Outputs from the model can also be represented as<br />
GHG emissions maps, with a d<strong>et</strong>ails that is by far greater than a simple country or regional result. Future<br />
developments of our approach are possible ref<strong>in</strong><strong>in</strong>g the number of variables and processes to be considered<br />
(e.g. <strong>in</strong>clud<strong>in</strong>g b<strong>et</strong>ter estimates of transportation distances), improv<strong>in</strong>g the resolution and the accuracy of the<br />
data considered, and <strong>in</strong>vestigat<strong>in</strong>g livestock related impacts on nutrient balances, water consumption and<br />
biodiversity.
GROUP 1, SESSION A: ANIMAL PRODUCTION SYSTEMS 8 th Int. Conference on <strong>LCA</strong> <strong>in</strong> the<br />
Agri-<strong>Food</strong> Sector, 1-4 Oct <strong>2012</strong><br />
2. Comb<strong>in</strong>ed mass and economic allocation<br />
Erik Svanes<br />
Department for Preventive Environmental Research, Ostfold Research, Norway, E-mail:<br />
erik@ostfoldforskn<strong>in</strong>g.no<br />
Allocation is a common problem <strong>in</strong> Life Cycle Assessments. A common allocation situation <strong>in</strong> food production<br />
occurs when a production l<strong>in</strong>e produce one or several co-product(s) and by-product(s). Furthermore the<br />
dist<strong>in</strong>ction b<strong>et</strong>ween waste and by-product is often unclear because although a waste fraction might be given<br />
for free, the transportation of the waste entails costs and the waste can be raw material for products with a<br />
commercial value.<br />
Avoidance of allocation us<strong>in</strong>g the decision three given <strong>in</strong> ISO 14044 can be difficult because the processes<br />
cannot be split, systems expansion is not possible and no causality can be found. Systems expansion is often<br />
difficult because <strong>in</strong>corporat<strong>in</strong>g more functions <strong>in</strong> a Functional unit is not <strong>in</strong>terest<strong>in</strong>g if the aim is to study one<br />
product and systems expansion through substitution is impractical because a s<strong>in</strong>gle alternative product cannot<br />
be identified.<br />
Economic and mass allocation have <strong>in</strong> the past been the most commonly used allocation m<strong>et</strong>hods <strong>in</strong> food<br />
systems but both have their disadvantages. The use of economic allocation can be confus<strong>in</strong>g for consumers,<br />
e.g. because the fact that a product of a high commercial value should have a higher environmental impact<br />
than a low value product com<strong>in</strong>g from the same raw material and the same process is hard to understand.<br />
Mass allocation reflects only physical relationships thus avoid<strong>in</strong>g this problem- One disadvantage of mass<br />
allocation is the fact that byproducts of a low value, e.g. fish sk<strong>in</strong> and bones, carries the same environmental<br />
burden as the ma<strong>in</strong> products. The consequence might be that buyers of these by-products might have less<br />
<strong>in</strong>centive to use this resource. Another problem with mass allocation occurs when a by-product that was<br />
previously given for free to users is be<strong>in</strong>g sold <strong>in</strong>stead. The result could be a significant shift <strong>in</strong> the environmental<br />
burdens from one assessment to another while no physical changes have been made.<br />
One way to avoid the problems associated with these allocation m<strong>et</strong>hods is to comb<strong>in</strong>e mass and economic<br />
allocation. In the first step economic allocation can be used to distribute environmental impacts b<strong>et</strong>ween<br />
products of very different usage. In the second step mass allocation is used to distribute impacts b<strong>et</strong>ween<br />
products of the same usage. The concept has been <strong>in</strong>vestigated us<strong>in</strong>g two examples. In one example an animal<br />
gives several products go<strong>in</strong>g to human consumption, one product go<strong>in</strong>g to fertiliser and one to energy<br />
production. In another example carrots are sorted <strong>in</strong>to four ma<strong>in</strong> products go<strong>in</strong>g to human consumption and<br />
one waste fraction given for free to be used for animal feed. In these examples the above mentioned disadvantages<br />
were avoided. Thus comb<strong>in</strong>ed allocation proved to a good solution.<br />
ISO 14044 does not seem to preclude such an approach to allocation except maybe the passage that states<br />
that the same allocation procedure should be uniformly applied <strong>in</strong> the assessment. This could, however, be<br />
<strong>in</strong>terpr<strong>et</strong>ed to mean that consistency is required <strong>in</strong> similar situations, not that one s<strong>in</strong>gle allocation m<strong>et</strong>hod is<br />
applied.<br />
References<br />
Schau EM and F<strong>et</strong> AM (2008). <strong>LCA</strong> Studies of <strong>Food</strong> Products as Background for Environmental Product<br />
Declaration. Int J <strong>LCA</strong> 13 (3) 255–264.<br />
Ayer N, Tyedmers PH, Pell<strong>et</strong>ier NL, Sonesson U and Scholz A (2007): Co-Product Allocation <strong>in</strong> Life Cycle<br />
Assessments of Seafood Production Systems: Review of Problems and Strategies. Int J <strong>LCA</strong> 12 (7) 480–<br />
487.<br />
649
GROUP 1, SESSION A: ANIMAL PRODUCTION SYSTEMS 8 th Int. Conference on <strong>LCA</strong> <strong>in</strong> the<br />
Agri-<strong>Food</strong> Sector, 1-4 Oct <strong>2012</strong><br />
3. Animal- and environmentally friendly beef production: a conflict?<br />
Mart<strong>in</strong>a Alig * , Florian Grandl, Johanna Mieleitner, Thomas Nemecek, Gérard Gaillard<br />
Agroscope Reckenholz-Tänikon Research Station ART, Reckenholzstrasse 191, 8046 Zürich, Switzerland, <br />
Mart<strong>in</strong>a Alig. E-mail: mart<strong>in</strong>a.alig@art.adm<strong>in</strong>.ch<br />
Meat production faces many challenges today, like consumer demand for animal friendly production systems,<br />
the food supply of a grow<strong>in</strong>g world population and the dim<strong>in</strong>ishment of the environmental impacts of<br />
meat production. In order to provide a solid basis for decisions, the impacts of different production systems<br />
have to be quantified. This contribution presents a study of different beef production systems <strong>in</strong> Switzerland<br />
and <strong>in</strong> countries export<strong>in</strong>g to Switzerland as basis for the design of purchas<strong>in</strong>g strategies. The data were derived<br />
from model farms of the project <strong>LCA</strong>-FADN (Hersener <strong>et</strong> al., 2011). For Switzerland, three production<br />
systems were analysed: A conventional bull fatten<strong>in</strong>g system and two animal friendly suckler cow systems (a<br />
conventional and an organic one). Additionally, a conventional bull fatten<strong>in</strong>g system <strong>in</strong> Germany and a very<br />
extensive suckler cow system <strong>in</strong> Brazil were analysed. The functional unit was kg meat ready for sale at<br />
po<strong>in</strong>t of sale.<br />
The results show that for all systems the agricultural stage dom<strong>in</strong>ates the environmental impacts (Fig. 1). The<br />
most important contributions are the application of fertilisers and from field emissions, animal emissions and<br />
for the bull fatten<strong>in</strong>g systems the purchase of concentrates. Compar<strong>in</strong>g the Swiss systems, the most <strong>in</strong>tensive<br />
production system (conventional bull fatten<strong>in</strong>g) has the lowest impacts per kg live weight (LW) for most<br />
categories analysed (see also Alig <strong>et</strong> al., 2011). Exceptions are the categories deforestation, ecotoxicity and<br />
resource use potassium, where the conventional bull fatten<strong>in</strong>g system has the highest results, as well as resource<br />
use phosphorus (2 nd highest results). This is due to the use of concentrate feeds with soy beans from<br />
Brazil compared to the ma<strong>in</strong>ly grass-based feed<strong>in</strong>g <strong>in</strong> the suckler cow systems. The reason for the higher<br />
environmental impacts of the suckler cow systems is the general design of the production system itself: <strong>in</strong> a<br />
suckler cow system, the mother cow only serves to produce meat, whereas <strong>in</strong> a conventional bull fatten<strong>in</strong>g<br />
system the parent animal produces milk and meat. Therefore, its environmental impacts are allocated b<strong>et</strong>ween<br />
these two products, whereas <strong>in</strong> the suckler cow systems, the full environmental load of the mother cow<br />
is allocated to meat production. This is especially apparent with m<strong>et</strong>hane emissions, which are more than<br />
60% higher <strong>in</strong> the suckler cow systems than <strong>in</strong> the conventional bull fatten<strong>in</strong>g system (Fig. 2).<br />
The German bull fatten<strong>in</strong>g system is mostly similar to or a little bit lower than the Swiss conventional system.<br />
It is more <strong>in</strong>tensive than the Swiss system, i.e. more based on concentrates and maize silage. The Brazilian<br />
production system is a special case: it is very extensive, uses almost no external <strong>in</strong>puts but huge land<br />
area. This <strong>in</strong>fluences the results: <strong>in</strong> categories l<strong>in</strong>ked with the use of external <strong>in</strong>puts as energy demand, resource<br />
use or ecotoxicity the Brazilian system has very low impacts. On the other hand, it has very high results<br />
for land comp<strong>et</strong>ition and deforestation and therefore also high values for eutrophication. Due to the long<br />
fatten<strong>in</strong>g period (over two years), water use and m<strong>et</strong>hane emissions of this system are also high.<br />
In summary, there are no clear advantages for a certa<strong>in</strong> system. The animal friendly suckler cow systems<br />
stand out due to their low use of arable land and their ability to mitigate the comp<strong>et</strong>ition for food b<strong>et</strong>ween<br />
man and animals. In order to have advantages <strong>in</strong> categories like energy demand and resource use, a suckler<br />
cow system has to be really extensive (e.g. Brazil). In Switzerland, the animal friendly suckler cow systems<br />
had overall higher environmental impacts than the conventional bull fatten<strong>in</strong>g system. This is to a great deal<br />
due to the system design, where the full environmental impact of the mother cow is allocated to the meat<br />
production. In order to develop animal and environmental friendly production systems, alternative systems<br />
have to be contemplated, e.g. a comb<strong>in</strong>ed milk and meat production with dual purpose cows.<br />
References<br />
Alig <strong>et</strong> al., 2011. Ökologische Bewertung von R<strong>in</strong>d-, Schwe<strong>in</strong>e- und Geflügelfleisch. Schlussbericht Forschungs<strong>in</strong>itiative<br />
COOP-ART. In preparation.<br />
Hersener, J.-L., Baumgartner, D.U., Dux, D. (Eds.), 2011. Zentrale Auswertung von Ökobilanzen landwirtschaftlicher<br />
B<strong>et</strong>riebe (ZA-ÖB). Forschungsanstalt Agroscope Reckenholz-Tänikon ART,<br />
Zürich/Ettenhausen.<br />
650
GROUP 1, SESSION A: ANIMAL PRODUCTION SYSTEMS 8 th Int. Conference on <strong>LCA</strong> <strong>in</strong> the<br />
Agri-<strong>Food</strong> Sector, 1-4 Oct <strong>2012</strong><br />
Figure 1. Overview of the environmental impacts per kg meat ready for sale of the five analysed beef production<br />
systems. CB_CH: agricultural stage conventional bull fatten<strong>in</strong>g Switzerland; SC_conv_CH: agricultural<br />
stage conventional suckler cow system Switzerland; SC_org_CH: agricultural stage organic suckler<br />
cow system Switzerland; CB_DE: agricultural stage conventional bull fatten<strong>in</strong>g Germany; SC_BR: agricultural<br />
stage suckler cow system Brazil; post_agri: post-agricultural phase (slaughter<strong>in</strong>g and transports to po<strong>in</strong>t<br />
of sale).<br />
kg CO2-eq./kg LW<br />
18<br />
16<br />
14<br />
12<br />
10<br />
8<br />
6<br />
4<br />
2<br />
0<br />
CB_CH<br />
SC_conv_CH<br />
Figure 2. Global warm<strong>in</strong>g potential per kg live weight (LW) of the three Swiss beef production systems.<br />
Acknowledgement: These research results were developed by ART with the support of COOP.<br />
SC_org_CH<br />
M<strong>et</strong>hane, fossil<br />
Carbon dioxide, land<br />
transformation<br />
Carbon dioxide, fossil<br />
D<strong>in</strong>itrogen monoxide<br />
M<strong>et</strong>hane, biogenic<br />
other emissions<br />
651
GROUP 1, SESSION A: ANIMAL PRODUCTION SYSTEMS 8 th Int. Conference on <strong>LCA</strong> <strong>in</strong> the<br />
Agri-<strong>Food</strong> Sector, 1-4 Oct <strong>2012</strong><br />
652<br />
4. Allocation procedures <strong>in</strong> the beef life cycle assessment<br />
Claudio Mazz<strong>in</strong>i 1 , Nicola Br<strong>in</strong>a 1 , Sara Daga 1 , Fabrizio Boeri 2 , Massimo Mar<strong>in</strong>o 2 ,Sonia Pignatelli 2,*<br />
1 Coop Italia, 2 Life Cycle Eng<strong>in</strong>eer<strong>in</strong>g, Correspond<strong>in</strong>g author. E-mail: pignatelli@studiolce.it<br />
The beef production is one of the food sectors with the highest environmental impact: this is ma<strong>in</strong>ly due to<br />
the feed production, the manure management and the m<strong>et</strong>hane emissions from enteric digestion processes.<br />
Even if the high impact is well known among all the <strong>LCA</strong> practitioners, it is quite important the def<strong>in</strong>ition of<br />
the hypotheses because some of them are quite relevant for the f<strong>in</strong>al result such the functional unit (meat<br />
boneless or not), the system boundaries (from where to where), the data quality requirements, <strong>et</strong>c. Probably,<br />
the most important hypothesis needed for the beef <strong>LCA</strong> is related to the def<strong>in</strong>ition of the allocation rules<br />
b<strong>et</strong>ween the many by-products generated along the cha<strong>in</strong>.<br />
Consider<strong>in</strong>g the whole cha<strong>in</strong>, for example, aspects that shall be considered are:<br />
how to consider the impact of reproductive cow used for the generation of calves;<br />
the allocation rules when the reproductive cow is ma<strong>in</strong>ly bred for the milk production; <strong>in</strong> that case it<br />
is necessary to def<strong>in</strong>e the portion of impact to be allocated to the veal (by-product of farms that produce<br />
milk).<br />
how to deal when the meat comes directly from milk cow or reproductive cow for calves production<br />
at the end of their life;<br />
how to consider the leather.<br />
After the def<strong>in</strong>ition of the rules related to the system analysed and the eventual by-products generated along<br />
the cha<strong>in</strong>, the other issue concern the approach used to allocate the impact: economic allocation, mass allocation<br />
or other alternative approaches (i.e. biological causality def<strong>in</strong>ed as the physiological feed requirements<br />
of the animal to produce milk, meat or other by-product).<br />
The aim of this paper is to exam<strong>in</strong>e some allocation procedures and to present a sensitivity analysis of the<br />
chosen procedure on the f<strong>in</strong>al results; for example <strong>in</strong> Fig. 1 are illustrated the difference, <strong>in</strong> terms of Carbon<br />
Footpr<strong>in</strong>t, related to veal production cha<strong>in</strong> consider<strong>in</strong>g different allocations rules for the impact of reproductive<br />
cow ma<strong>in</strong>ly f<strong>in</strong>alised to produce milk.<br />
References<br />
Cederberg C., Stadig M., 2003. System Expansion and Allocation <strong>in</strong> Life Cycle Assessment of Milk and<br />
Beef Production, International Journal of <strong>LCA</strong> 8, 350-356.<br />
Ponsioen T., Kool A., December 2010. Carbon footpr<strong>in</strong>t assessment of calf milk replacer, calves and veal,<br />
Blonk Milieuadvies Study.<br />
Blonk H., Ponsioen T., Kool A., Mar<strong>in</strong>ussen M., April 2011. The Agri-Footpr<strong>in</strong>t m<strong>et</strong>hod - M<strong>et</strong>hodological<br />
<strong>LCA</strong> framework, assumptions and applied data - Version 1.0, Blonk Milieuadvies Study.<br />
Barilla Center for <strong>Food</strong> and Nutrition (BCFN), 2011. 2011 Double Pyramid: Healthy <strong>Food</strong> for People, Susta<strong>in</strong>able<br />
for the plan<strong>et</strong>, Support<strong>in</strong>g technical paper Version 2 of 14 July 2011.<br />
Casey J. W., Holden N. M., 2006. Quantification of GHG emissions from sucker-beef production <strong>in</strong> Ireland,<br />
Agricultural Systems 90, 79-98.<br />
Eco<strong>in</strong>vent Swiss database, v.2.0, www.eco<strong>in</strong>vent.ch.
GROUP 1, SESSION A: ANIMAL PRODUCTION SYSTEMS 8 th Int. Conference on <strong>LCA</strong> <strong>in</strong> the<br />
Agri-<strong>Food</strong> Sector, 1-4 Oct <strong>2012</strong><br />
Figure 1. Carbon Footpr<strong>in</strong>t of 1kg of veal meat with different allocations rules for the reproductive cow impact.<br />
653
GROUP 1, SESSION A: ANIMAL PRODUCTION SYSTEMS 8 th Int. Conference on <strong>LCA</strong> <strong>in</strong> the<br />
Agri-<strong>Food</strong> Sector, 1-4 Oct <strong>2012</strong><br />
5. Evaluation of the environmental impact of Belgian beef production<br />
systems through life cycle assessment m<strong>et</strong>hodology<br />
Loriers Astrid 1,* , Mathot Michael 2 , Stilmant Didier 2<br />
1 Agence cooperative de service <strong>et</strong> conseils (ACOSEC scrl), Centre Wallon de Recherches Agronomiques<br />
(CRA-W), 2 CRA-W, Correspond<strong>in</strong>g author. E-mail: a.loriers@cra.wallonie.be<br />
Environmental issues like GHG emissions, process of eutrophication and acidification, fossils fuels depl<strong>et</strong>ion,<br />
<strong>et</strong>c. received <strong>in</strong>creas<strong>in</strong>g attention over the last years by the European politic. In this context, the livestock<br />
sector is often po<strong>in</strong>ted out. At the same time, consumers search more “green” products and require<br />
more <strong>in</strong>formation on food production process and orig<strong>in</strong>.<br />
The aim of this study is to highlight and adapt, based on literature review and on the characteristics of the<br />
ma<strong>in</strong> beef production systems identified <strong>in</strong> Belgium, the emission param<strong>et</strong>ers which could be, <strong>in</strong> <strong>LCA</strong> (Life<br />
Cycle Assessment) m<strong>et</strong>hodology, adjusted to our national conditions. Indeed, beef livestock systems are<br />
based, <strong>in</strong> Belgium, on Belgian Blue breed characterised by a very high carcass yield associated to a very<br />
good feed conversion ratio.<br />
The impacts taken <strong>in</strong>to account for these processes will be the global warm<strong>in</strong>g, eutrophication, acidification,<br />
fossils fuels depl<strong>et</strong>ion, land use and occupation, and water use. In term of boundaries, the system that will be<br />
presented will add, to the classical cradle to farm gate approach, the slaughter house, carcass transformation<br />
and packag<strong>in</strong>g processes. We expect that this analysis will help identify the best practices to improve environmental<br />
performances of this sector <strong>in</strong> order to advise its different actors.<br />
654
GROUP 1, SESSION A: ANIMAL PRODUCTION SYSTEMS 8 th Int. Conference on <strong>LCA</strong> <strong>in</strong> the<br />
Agri-<strong>Food</strong> Sector, 1-4 Oct <strong>2012</strong><br />
6. Life cycle assessment on dairy and beef cattle farms <strong>in</strong> <strong>France</strong><br />
Jean Baptiste Dollé 1,* , Armelle Gac 2 , V<strong>in</strong>cent Manneville 3 , S<strong>in</strong>dy Moreau 4 , Elise Lor<strong>in</strong>quer 2<br />
1 Institut de l'Elevage, Build<strong>in</strong>g and Environment Department, F-62051 St Laurent Blangy, <strong>France</strong>, 2 Institut<br />
de l’Elevage, Build<strong>in</strong>g and Environment Department, F-35652 Le Rheu, <strong>France</strong>, 3 Institut de l'Elevage,<br />
Build<strong>in</strong>g and Environment Department, F-63170 Aubière, <strong>France</strong>, 4 Institut de l'Elevage, Build<strong>in</strong>g and Environment<br />
Department, F-69364 Lyon, <strong>France</strong>, Correspond<strong>in</strong>g author. E-mail: jean-baptiste.dolle@idele.fr<br />
In the current environmental context, as much as political (reduction of greenhouse gas emissions, preservation<br />
of biodiversity) and social (consumer demands for <strong>in</strong>formation concern<strong>in</strong>g food products), a need to<br />
d<strong>et</strong>erm<strong>in</strong>e the <strong>in</strong>fluence of rum<strong>in</strong>ant livestock on environment is <strong>in</strong>contestable. It is now crucial to quantify<br />
precisely the environmental impacts for different rum<strong>in</strong>ant livestock systems by us<strong>in</strong>g Life Cycle Assessment<br />
(<strong>LCA</strong>). The French Livestock Institute has launched a work program to d<strong>et</strong>erm<strong>in</strong>e the environmental<br />
assessment of dairy and beef cattle systems at farm scale. In this context, a m<strong>et</strong>hodology based on life cycle<br />
assessment m<strong>et</strong>hod has been built to assess many impacts which concern climate change, eutrophication,<br />
acidification and energy consumption. This m<strong>et</strong>hodology has been applied to several beef and dairy cattle<br />
systems from the French Breed<strong>in</strong>g N<strong>et</strong>work database (208 dairy farms and 268 beef farms) representative of<br />
the French cattle. Five types of dairy system, def<strong>in</strong>ed by farm typology based on part of maize <strong>in</strong> farm and<br />
location area, have been studied (Table 1). Milk gross carbon footpr<strong>in</strong>t varies from 0.8 to 1.5 kg CO2eq/kg of<br />
milk produced and n<strong>et</strong> carbon footpr<strong>in</strong>t vary from 0.1 to 1.4 kg CO2eq <strong>in</strong>clud<strong>in</strong>g carbon sequestration. Concern<strong>in</strong>g<br />
acidification, eutrophication and energy consumption for the five systems studied, the variation goes<br />
respectively from 0.005 to 0.010 kg SO2eq, 0.001 to 0.0010 kg PO4eq and 1.2 to 4.0 MJ, all expressed <strong>in</strong> kg<br />
of milk produced. Differences b<strong>et</strong>ween systems are not very high, however the systems located <strong>in</strong> pla<strong>in</strong> area<br />
conta<strong>in</strong> more than 30% maize <strong>in</strong> the di<strong>et</strong> and present a higher productivity per cow, that result <strong>in</strong> a higher<br />
risk of eutrophication and a higher n<strong>et</strong> carbon footpr<strong>in</strong>t than the other systems. In beef production, three specialised<br />
suckler-cattle systems have been studied (table 2), calf-to-weanl<strong>in</strong>g system produc<strong>in</strong>g weaners (9-10<br />
months old), calf-to-beef system produc<strong>in</strong>g beef steers (over 30 months old) and calf-to-beef system produc<strong>in</strong>g<br />
young bulls (17 months old). French suckler cattle farm systems produce from 8.7 to 26.0 kg CO2eq/kg<br />
of live weight. Calf-to-beef system produc<strong>in</strong>g beef steers, fattened on pasture, has the lower n<strong>et</strong> carbon footpr<strong>in</strong>t<br />
(5.9 kg CO2eq/kg of live weight) consider<strong>in</strong>g carbon sequestration and a lower risk of eutrophication.<br />
The energy used is quite similar for the three systems. In most cases, the <strong>in</strong>tra-system variability of environmental<br />
footpr<strong>in</strong>ts is higher than <strong>in</strong>ter-system variability. The <strong>in</strong>tra-system variability is related to technical<br />
and practices efficiency on farms. At equivalent systems, an important difference can be observed on the<br />
f<strong>in</strong>al impact b<strong>et</strong>ween optimised and non-optimised farms. These differences are due to herd management,<br />
cultural practices, feed and fertiliser strategies, <strong>et</strong>c. For example, <strong>in</strong> relation with the nitrous oxide emissions,<br />
the most optimised farms, which consume less feed, less fertiliser, <strong>et</strong>c. have b<strong>et</strong>ter nitrogen balance and<br />
lower environmental impacts. This study show l<strong>in</strong>k b<strong>et</strong>ween environmental issues and highlight the relation<br />
b<strong>et</strong>ween environmental issues and practices on farm, which propose some ways of mitigation adapted to the<br />
production systems. F<strong>in</strong>ally, these <strong>in</strong>vestigations demonstrate that numerous mitigation actions can be identified<br />
<strong>in</strong> the livestock systems to reduce the environmental footpr<strong>in</strong>t of milk and beef meat at the farm gate.<br />
Some of them concern management practices (adjustment of di<strong>et</strong>ary <strong>in</strong>take, fertilisation management, <strong>et</strong>c.)<br />
which result <strong>in</strong> substantial sav<strong>in</strong>gs <strong>in</strong> agricultural expenses. Others require <strong>in</strong>stallation of new technologies<br />
which would require additional funds to improve the production processes.<br />
References<br />
De Vries M., De Boer I.J.M., 2010. Compar<strong>in</strong>g environmental impacts for livestock products: A review of<br />
cycle assessments. Livestock Science, 120, 1-11.<br />
Gerber P., Vell<strong>in</strong>ga T., Opio C., Ste<strong>in</strong>feld H., 2011. Productivity ga<strong>in</strong>s and greenhouse gas emissions <strong>in</strong>tensity<br />
<strong>in</strong> dairy systems. Livestock Science, doi: 10.1016.j.livsci.2011.03.012.<br />
Veyss<strong>et</strong> P., Lherm M., Béb<strong>in</strong> D., 2010. Energy consumption, greenhouse gas emissions and economic performance<br />
assessments <strong>in</strong> French Charolais suckler cattle farms: Model-based analysis and forecasts. Agricultural<br />
Systems, 103, 41-50.<br />
655
GROUP 1, SESSION A: ANIMAL PRODUCTION SYSTEMS 8 th Int. Conference on <strong>LCA</strong> <strong>in</strong> the<br />
Agri-<strong>Food</strong> Sector, 1-4 Oct <strong>2012</strong><br />
Table 1. Environmental impact of milk on dairy farms<br />
656<br />
Pla<strong>in</strong><br />
> 30% maize<br />
Pla<strong>in</strong><br />
10-30%<br />
maize<br />
Production system<br />
Pla<strong>in</strong><br />
< 10% maize<br />
Mounta<strong>in</strong><br />
maize<br />
Mounta<strong>in</strong><br />
grass<br />
Number of farms 37 36 50 26 59<br />
Gross carbon<br />
footpr<strong>in</strong>t<br />
kg CO2eq/ kg<br />
milk<br />
N<strong>et</strong> carbon footpr<strong>in</strong>t<br />
kg CO2eq / kg<br />
milk<br />
Acidification<br />
kg SO2eq / kg<br />
milk<br />
Eutrophication<br />
kg PO4eq / kg<br />
milk<br />
Energy consumption<br />
MJ / kg milk<br />
Average<br />
<br />
1.06<br />
0.8-1,3<br />
1.0<br />
0.7-1.3<br />
0.007<br />
0.005-0.009<br />
0.006<br />
0.003-0.011<br />
2.5<br />
1.8-3.8<br />
Average<br />
<br />
1.1<br />
0.8-1.4<br />
0.8<br />
0.6-1.4<br />
0.007<br />
0.005-0.011<br />
0.004<br />
0.002-0.009<br />
2.2<br />
1.2-3.3<br />
Table 2. Environmental impact of meat on beef farms<br />
Calf-to-weanl<strong>in</strong>g system<br />
produc<strong>in</strong>g weaners (9-10<br />
months old)<br />
Average<br />
<br />
1.1<br />
0.7-1.4<br />
0.7<br />
0.4-1.1<br />
0.009<br />
0.005-0.012<br />
0.003<br />
0.001-0.010<br />
2.4<br />
1.2-3.9<br />
Production system<br />
Average<br />
<br />
1.1<br />
0.8-1.5<br />
0.9<br />
0.6-1.3<br />
0.008<br />
0.005-0.013<br />
0.005<br />
0.002-0.010<br />
2.6<br />
1.7-3.8<br />
Calf-to-beef system produc<strong>in</strong>g<br />
beef steers (> 30 months old)<br />
Average<br />
<br />
1.2<br />
0.9–1.5<br />
0.7<br />
0.1-1.0<br />
0.010<br />
0.006-0.013<br />
0.004<br />
0.002-0.008<br />
2.7<br />
1.8-4.0<br />
Calf-to-beef system produc<strong>in</strong>g<br />
young bulls (17<br />
months old)<br />
Number of farms 163 13 72<br />
Gross carbon<br />
footpr<strong>in</strong>t<br />
kg CO2eq / kg<br />
meat<br />
N<strong>et</strong> carbon footpr<strong>in</strong>t<br />
kg CO2eq / kg<br />
meat<br />
Acidification<br />
kg SO2eq / kg<br />
meat<br />
Eutrophication<br />
kg PO4eq / kg<br />
meat<br />
Energy consumption<br />
MJ / kg meat<br />
Average<br />
<br />
14.7<br />
10.9-25.4<br />
7.7<br />
0.3-17.3<br />
0.120<br />
0.078-0.217<br />
0.039<br />
0.019-0.113<br />
20.4<br />
5.6-35.6<br />
Average<br />
<br />
13.2<br />
9.5-18.8<br />
5.9<br />
3.8-8.5<br />
0.109<br />
0.069-0.156<br />
0.028<br />
0.016-0.048<br />
21.0<br />
10.8-38.7<br />
Average<br />
<br />
13.5<br />
8.7-18.4<br />
9.9<br />
5.6-15.0<br />
0.115<br />
0.062-0.194<br />
0.052<br />
0.021-0.130<br />
20.6<br />
6.9-34.1
GROUP 1, SESSION A: ANIMAL PRODUCTION SYSTEMS 8 th Int. Conference on <strong>LCA</strong> <strong>in</strong> the<br />
Agri-<strong>Food</strong> Sector, 1-4 Oct <strong>2012</strong><br />
7. Life cycle assessment of four fatten<strong>in</strong>g calves systems <strong>in</strong> Spa<strong>in</strong><br />
Sandra Lartategui Arias 1,* , José Soler Rovira 2<br />
1 Global <strong>Food</strong> Quality, Campus Montegancedo Parque Científico y tecnológico, Centro empresas Local 12<br />
28223 Pozuelo de Alarcón, Madrid, Spa<strong>in</strong>, 2 Escuela de Ingeniería Técnica Agrícola. Universidad Politécnica<br />
de Madrid. Ciudad Universitaria, s/n 28040 Madrid, Spa<strong>in</strong>, * Correspond<strong>in</strong>g author. E-mail address: slartategui@globalfq.com<br />
The livestock sector is a very important element of stress for many ecosystems and for the entire plan<strong>et</strong> (FAO,<br />
2009). In Spa<strong>in</strong>, livestock production contributes <strong>in</strong> a proportion of about 5% of the total equivalent CO2 (De<br />
Blas, <strong>et</strong> al. 2008). Although <strong>in</strong>tensive feedlot system is the most widespread <strong>in</strong> Spa<strong>in</strong>, there are other systems<br />
(extensive and semi-extensive) whose environmental impact is <strong>in</strong>terest<strong>in</strong>g to assess.<br />
We used the <strong>LCA</strong> m<strong>et</strong>hodology to asses four fatten<strong>in</strong>g systems of calves used <strong>in</strong> Spa<strong>in</strong>. Two of these systems<br />
were of <strong>in</strong>tensive fatten<strong>in</strong>g, where calves fed on concentrate of cereals; other system was of extensive fatten<strong>in</strong>g,<br />
calves fed on grass, and the last one was of semi-extensive fatten<strong>in</strong>g, with calves fatted <strong>in</strong> two phases, at<br />
the first one fed with grass and at the second one (named “f<strong>in</strong>ish<strong>in</strong>g”) with gra<strong>in</strong> concentrate.<br />
The objectives of this <strong>LCA</strong> study were firstly identify which unit processes generate more environmental<br />
impacts, and secondly compare the environmental impact of the those four systems of fatten<strong>in</strong>g. For each<br />
system of fatten<strong>in</strong>g were analysed: i) production of raw materials (soya, palm oil, grass, <strong>et</strong>c) used <strong>in</strong> the feedstuff,<br />
<strong>in</strong>clud<strong>in</strong>g fertilisation and tillage; ii) transport of raw materials to the farm where calves are fattened;<br />
iii) the fatten<strong>in</strong>g of calves on the farm, <strong>in</strong>clud<strong>in</strong>g enteric m<strong>et</strong>hane emissions and emissions from manure.<br />
Impact categories analysed were global warm<strong>in</strong>g potential (GWP), acidification potential (ACP) and eutrophication<br />
potential (EUP). Literature data of specific on site systems, transport calculation and different databases<br />
and references were used (Lartategui-Arias, 2010). The functional unit considered was ton of meat<br />
for consumption, once removed the entrails, sk<strong>in</strong>, head, legs and fat coverage. The system limits of the study<br />
are shown <strong>in</strong> Fig. 1.<br />
Accord<strong>in</strong>g to data from the agricultural process, fertilis<strong>in</strong>g and till<strong>in</strong>g, is the most pollut<strong>in</strong>g <strong>in</strong> GWP category<br />
<strong>in</strong> <strong>in</strong>tensive farms (Table 1). At extensive and semi-extensive farms, fatten<strong>in</strong>g of calves are the most pollut<strong>in</strong>g<br />
<strong>in</strong> this category. In EUP category, fatten<strong>in</strong>g activity is the most pollut<strong>in</strong>g <strong>in</strong> three of four systems analysed,<br />
the two <strong>in</strong>tensive and semi-extensive. In ACP, fatten<strong>in</strong>g is the most pollut<strong>in</strong>g activity <strong>in</strong> the four systems<br />
analysed. Add<strong>in</strong>g all the unitary processes, semi-extensive system is the most pollut<strong>in</strong>g <strong>in</strong> EUP and<br />
ACP categories, primarily due to the process of fertilisation of the raw materials form<strong>in</strong>g the feedstuff of the<br />
f<strong>in</strong>ish phase and fatten<strong>in</strong>g process. In GWP, the extensive system is the most pollut<strong>in</strong>g, primarily due to the<br />
fatten<strong>in</strong>g process, <strong>in</strong> which enteric m<strong>et</strong>hane emissions play an important role.<br />
References<br />
De Blas, C., García-Rebollar, P., Cambra-López, M. y Torres, A.G. 2008. El cebo de terneros en España, una<br />
actividad resp<strong>et</strong>uosa con el medioambiente. Estudio de la repercusión de la producción de vacuno de carne<br />
en la emisión de gases con efecto <strong>in</strong>vernadero. ASOPROVAC. Madrid, Spa<strong>in</strong>.<br />
FAO, 2009. La larga sombra del ganado, problemas ambientales y opciones. Roma. ISBN: 978-92-5-<br />
305571-5.<br />
Lartategui-Arias S. 2010. Aplicación de la m<strong>et</strong>odología de Análisis de Ciclo de Vida para la evaluación ambiental<br />
del cebo de terneros en España. Graduate Thesis, Universidad Politécnica de Madrid, Spa<strong>in</strong>.<br />
657
GROUP 1, SESSION A: ANIMAL PRODUCTION SYSTEMS 8 th Int. Conference on <strong>LCA</strong> <strong>in</strong> the<br />
Agri-<strong>Food</strong> Sector, 1-4 Oct <strong>2012</strong><br />
Figure 1. System limits of the <strong>LCA</strong>.<br />
Table 1. Results of the <strong>LCA</strong> for the four fatten<strong>in</strong>g systems <strong>in</strong> GWP, EUP and ACP impact categories.<br />
Emissions kg/t meat<br />
Unitary process Fatten<strong>in</strong>g system GWP (CO2-eq) EUP (PO4-eq) ACP (SO2-eq)<br />
Fertilisation Intensive 1 3504.20 25.16 4.44<br />
Intensive 2 2962.00 7.18 3.87<br />
Extensive 1444.00 6.33 3.39<br />
Semi-extensive 2810.00 23.53 12.42<br />
Tillage Intensive 1 53.70 0.44 2.27<br />
Intensive 2 107.00 0.33 1.85<br />
Extensive 41.80 0.13 0.72<br />
Semi-extensive 109.00 0.34 1.88<br />
Transport Intensive 1 254.60 0.81 4.34<br />
Intensive 2 153.00 0.45 2.42<br />
Extensive 30.60 0.05 0.25<br />
Semi-extensive 151.00 0.23 1.24<br />
Fatten<strong>in</strong>g Intensive 1 2372.10 21.55 11.13<br />
Intensive 2 1838.00 18.68 9.64<br />
Extensive 6499.30 20.26 10.47<br />
Semi-extensive 4319.00 28.51 14.72<br />
Total Intensive 1 6184.60 47.96 22.18<br />
Intensive 2 5060.00 26.64 17.78<br />
Extensive 8015.70 26.77 14.83<br />
Semi-extensive 7389.00 52.61 30.26<br />
658
GROUP 1, SESSION A: ANIMAL PRODUCTION SYSTEMS 8 th Int. Conference on <strong>LCA</strong> <strong>in</strong> the<br />
Agri-<strong>Food</strong> Sector, 1-4 Oct <strong>2012</strong><br />
8. Environmental impact of beef – role of slaughter<strong>in</strong>g, meat<br />
process<strong>in</strong>g and transport<br />
Johanna Mieleitner * , Mart<strong>in</strong>a Alig, Florian Grandl, Thomas Nemecek, Gérard Gaillard<br />
Agroscope Reckenholz-Tänikon Research Station ART, CH-8046 Zurich, Switzerland, Correspond<strong>in</strong>g<br />
author. E-mail: johanna.mieleitner@art.adm<strong>in</strong>.ch<br />
Environmental impact of meat production is widely discussed and of <strong>in</strong>creas<strong>in</strong>g importance to customers and<br />
stakeholders. To f<strong>in</strong>d mitigation strategies it is important to identify important processes <strong>in</strong> the whole production<br />
cha<strong>in</strong> from the agricultural stage up to the r<strong>et</strong>ail store. Several studies found that the environmental<br />
impact of meat is dom<strong>in</strong>ated by animal production (Roy <strong>et</strong> al. <strong>2012</strong>, Foster <strong>et</strong> al. 2006). But is this also the<br />
case if meat products are transported over longer distances? Knowledge about the role of the processes after<br />
the animal production stage is important, especially when compar<strong>in</strong>g domestic production with imports.<br />
The aim of this study is to assess the environmental impact of beef produced <strong>in</strong> Switzerland and to compare<br />
it with beef imported from Germany and Brazil. Emphasis is s<strong>et</strong> on the role of the processes after the animal<br />
production stage: slaughter<strong>in</strong>g, meat process<strong>in</strong>g and transport. The life cycle of beef is analysed from cradle<br />
to the sales po<strong>in</strong>t and the functional unit is 1 kg of meat ready for sale (packed). The agricultural phase is<br />
described by Alig <strong>et</strong> al. (<strong>2012</strong>). For slaughter<strong>in</strong>g, meat process<strong>in</strong>g and transport data from <strong>in</strong>dustry (meat<br />
production and r<strong>et</strong>ail bus<strong>in</strong>ess) and from literature are used.<br />
The environmental impact of beef produced and sold <strong>in</strong> Switzerland is dom<strong>in</strong>ated by animal production,<br />
which is responsible for over 80% of all <strong>in</strong>vestigated environmental impacts. The stages after animal production<br />
account for around 15% of the impact categories 'non-renewable energy demand' and 'blue water use'<br />
and for less than 5% of all other environmental impacts (Fig. 1). The most important process with<strong>in</strong> these<br />
post-agricultural stages is slaughter<strong>in</strong>g and meat process<strong>in</strong>g which contributes up to 15% to the total impact.<br />
The transport of liv<strong>in</strong>g animals and of processed meat and the distribution centres contribute less than 2% to<br />
all impact categories (Fig. 1).<br />
Beef imported from Germany is also dom<strong>in</strong>ated by animal production. Due to longer distances, transport has<br />
a slightly higher impact but still contributes less than 5% to all impacts (Fig. 2).<br />
Beef imported from Brazil by ship is dom<strong>in</strong>ated by the agricultural production for most environmental impacts,<br />
despite the higher impact of transport, as the impact of transport by freight ship is relatively low. This<br />
is different for beef imported by aircraft. Here the transport from Brazil to Europe has an important impact<br />
(Fig. 2). E.g. it accounts for around 15% of the global warm<strong>in</strong>g potential and over 80% of the non-renewable<br />
energy demand.<br />
Look<strong>in</strong>g at the environmental impact of slaughter<strong>in</strong>g and meat process<strong>in</strong>g, the ma<strong>in</strong> contribution to most<br />
impact categories comes from direct energy use. Also important factors are packag<strong>in</strong>g film, water use, sewage<br />
treatment and waste disposal.<br />
In conclusion, animal production dom<strong>in</strong>ates the production cha<strong>in</strong> for beef produced <strong>in</strong> Switzerland and imported<br />
from Germany and Brazil. An exception is the import of beef by aircraft from Brazil. Animal production<br />
is therefore the most important start<strong>in</strong>g-po<strong>in</strong>t for mitigation strategies. However it is also important to<br />
reduce the environmental impact of the post-agricultural stages. All stakeholders along the whole production<br />
cha<strong>in</strong> have to contribute to maximise the overall mitigation potential. Transport by airplane can have a high<br />
impact and should be avoided. Another important factor is the use of non-renewable energy dur<strong>in</strong>g slaughter<strong>in</strong>g<br />
and meat process<strong>in</strong>g which could for example be reduced by replac<strong>in</strong>g fossil fuels with renewable energy<br />
sources. Acknowledgement: These research results were developed by ART with the support of COOP.<br />
References<br />
Alig, M., Grandl, F., Mieleitner, J., Nemecek, T., <strong>2012</strong>. Animal and environmental friendly beef production:<br />
a conflict? Abstract, 8 th International conference on <strong>LCA</strong> <strong>in</strong> the Agri-<strong>Food</strong> sector.<br />
Foster, C., Green, K., Bleda, M., Dewick, P., Evans, B., Flynn, A., Mylan, J., 2006. Environmental impacts<br />
of food production and consumption. A F<strong>in</strong>al Report to the Department for Environment, <strong>Food</strong> and Rural<br />
Affairs, Manchester Bus<strong>in</strong>ess School, Defra, London.<br />
Roy, P., Orikasa, T., Thammawong, M., Nakamura, N., Xu, Q., Shi<strong>in</strong>a, T., <strong>2012</strong>. Life cycle of meats: An<br />
opportunity to abate the greenhouse gas emission from meat <strong>in</strong>dustry <strong>in</strong> Japan. Journal of Environmental<br />
Management 93, 218-224.<br />
659
GROUP 1, SESSION A: ANIMAL PRODUCTION SYSTEMS 8 th Int. Conference on <strong>LCA</strong> <strong>in</strong> the<br />
Agri-<strong>Food</strong> Sector, 1-4 Oct <strong>2012</strong><br />
100%<br />
90%<br />
80%<br />
70%<br />
60%<br />
50%<br />
40%<br />
30%<br />
20%<br />
10%<br />
0%<br />
Figure 2. Global warm<strong>in</strong>g potential (GWP) per kg meat ready for sale at the po<strong>in</strong>t of sale <strong>in</strong> Switzerland.<br />
80<br />
distribution center<br />
Left: Whole Cha<strong>in</strong>. 70 Right: slaughter<strong>in</strong>g, Legend: meat process<strong>in</strong>g and transports. CH: animal production <strong>in</strong> Switzer-<br />
transport distribution center-r<strong>et</strong>ail store<br />
land, transport 60 by lorry, DE: animal production transport <strong>in</strong> Germany, process<strong>in</strong>g-distribution transport center by lorry, BR: animal production <strong>in</strong><br />
Brazil, transport by freight ship (ship) and transport by port/airport-process<strong>in</strong>g<br />
aircraft (aircraft).<br />
660<br />
Energy demand non renew.<br />
Global warm<strong>in</strong>g potential<br />
Ozone formation Veg<strong>et</strong>ation<br />
Ozone formation Human<br />
Resources (phosphorus)<br />
Resources (potassium)<br />
Land comp<strong>et</strong>ition, arable<br />
Deforestation<br />
Water use (blue water)<br />
Eutrophication terr.<br />
Eutrophication aq. N<br />
Eutrophication aq. P<br />
Acidification<br />
Ecotox terr.<br />
Ecotox aq.<br />
Human tox<br />
distribution center<br />
transport distribution center-r<strong>et</strong>ail store<br />
transport process<strong>in</strong>g-distribution center<br />
transport farm-slaughterhouse<br />
slaughter<strong>in</strong>g and meat process<strong>in</strong>g<br />
80<br />
animal production<br />
14 distribution center<br />
70<br />
12 transport distribution center-r<strong>et</strong>ail store<br />
60<br />
50<br />
40<br />
30<br />
20<br />
transport process<strong>in</strong>g-distribution center<br />
10<br />
transport port/airport-process<strong>in</strong>g<br />
transport 8 by freight ship/aircraft<br />
transport 6 slaughterhouse-port/airport<br />
transport slaughterhouse-process<strong>in</strong>g<br />
4<br />
transport farm-slaughterhouse<br />
10<br />
slaughter<strong>in</strong>g 2 and meat process<strong>in</strong>g<br />
0<br />
animal 0 production<br />
CH DE BR BR<br />
CH DE BR BR<br />
(ship) (aircraft)<br />
(ship) (aircraft)<br />
Figure 1. Environmental impacts per kg meat ready for sale for beef produced and sold <strong>in</strong> Switzerland.<br />
GWP 100a<br />
kg CO2 eq./kg<br />
kgCO2-eq. / kg meat<br />
80<br />
70<br />
60<br />
50<br />
40<br />
30<br />
20<br />
10<br />
0<br />
GWP 100a<br />
kg CO2 eq./kg<br />
CH DE BR<br />
(ship)<br />
50<br />
40<br />
30<br />
20<br />
10<br />
0<br />
GWP 100a<br />
kg CO2 eq./kg<br />
BR<br />
(aircraft)<br />
CH DE BR<br />
(ship)<br />
kgCO2-eq. / kg meat<br />
GWP 100a<br />
kg CO2 eq./kg<br />
GWP 100a<br />
kg CO2 eq./kg<br />
BR<br />
(aircraft)<br />
GWP 100a<br />
kg CO2 eq./kg<br />
14<br />
80<br />
distribution center<br />
70<br />
Legend:<br />
12 transport distribution center-r<strong>et</strong>ail store<br />
transport 60 process<strong>in</strong>g-distribution center<br />
10<br />
transport 50 port/airport-process<strong>in</strong>g<br />
transport 8<br />
40 by freight ship/aircraft<br />
transport 6 slaughterhouse-port/airport<br />
30<br />
transport slaughterhouse-process<strong>in</strong>g<br />
4<br />
transport 20 farm-slaughterhouse<br />
distribution<br />
distribution<br />
center<br />
center<br />
transport distribution center-r<strong>et</strong>ail store<br />
transport distribution center-r<strong>et</strong>ail store<br />
transport process<strong>in</strong>g-distribution center<br />
transport process<strong>in</strong>g-distribution center<br />
transport port/airport-process<strong>in</strong>g<br />
transport port/airport-process<strong>in</strong>g<br />
transport by freight ship/aircraft<br />
transport<br />
transport<br />
by freight<br />
slaughterhouse-port/airport<br />
ship/aircraft<br />
transport transport slaughterhouse-port/airport<br />
slaughterhouse-process<strong>in</strong>g<br />
transport transport slaughterhouse-process<strong>in</strong>g<br />
farm-slaughterhouse<br />
slaughter<strong>in</strong>g 210<br />
and meat process<strong>in</strong>g<br />
transport slaughter<strong>in</strong>g farm-slaughterhouse<br />
and meat process<strong>in</strong>g<br />
animal 0 0 production<br />
slaughter<strong>in</strong>g animal production and meat process<strong>in</strong>g<br />
CH CH DE DE BR BR BR BR<br />
(ship) (ship) (aircraft) (aircraft)<br />
transport by freight ship/aircraft<br />
transport slaughterhouse-port/airport<br />
transport slaughterhouse-process<strong>in</strong>g<br />
transport farm-slaughterhouse<br />
slaughter<strong>in</strong>g and meat process<strong>in</strong>g<br />
animal production<br />
distribution<br />
transport di<br />
transport pr<br />
transport po<br />
transport by<br />
transport sl<br />
transport sl<br />
transport fa<br />
slaughter<strong>in</strong>g
GROUP 1, SESSION A: ANIMAL PRODUCTION SYSTEMS 8 th Int. Conference on <strong>LCA</strong> <strong>in</strong> the<br />
Agri-<strong>Food</strong> Sector, 1-4 Oct <strong>2012</strong><br />
9. Life cycle assessment of Mediterranean buffalo milk<br />
Giacomo Pirlo 1 , Sara Carè 1 , Valent<strong>in</strong>a Fant<strong>in</strong> 2,* , <strong>France</strong>sca Falconi 3 , Patrizia Buttol 2 , Giusepp<strong>in</strong>a Terzano 4 ,<br />
Paolo Masoni 2<br />
1 CRA-FLC Agricultural Research Council-Fodder and Dairy Productions Research Centre, Via Porcellasco<br />
7, 2610, Cremona, Italy, 2 ENEA - Italian National Agency for New Technologies, Energy and Susta<strong>in</strong>able<br />
Economic Development, Via Martiri di Monte Sole 4, 40129 Bologna, Italy, 3 <strong>LCA</strong>-lab SRL, Via Martiri di<br />
Monte Sole 4, 40129 Bologna, Italy, 4 CRA-PCM Agricultural Research Council, Research Centre for Meat<br />
Production and Gen<strong>et</strong>ic Improvement, Via Salaria 31, 00016 Monterotondo, Italy, * Correspond<strong>in</strong>g author.<br />
E-mail: valent<strong>in</strong>a.fant<strong>in</strong>@enea.it<br />
This study is part of a broader project carried out by CRA (Agricultural Research Council), <strong>in</strong> collaboration<br />
with ENEA, aimed at evaluat<strong>in</strong>g and identify<strong>in</strong>g environmentally friendly livestock models, which could be<br />
applied to Italian agri-food production systems, <strong>in</strong> order to improve their environmental susta<strong>in</strong>ability.<br />
In Italy there are about 365 thousands Mediterranean Buffaloes. This population <strong>in</strong>creased considerably <strong>in</strong><br />
recent years, as consequence of the strong worldwide demand of “Mozzarella di bufala campana – DOP”<br />
(AIA, 2011).<br />
At present no <strong>LCA</strong> study on buffalo milk production exists <strong>in</strong> literature, whereas many <strong>LCA</strong> studies have<br />
been performed on cattle milk production, both on farm<strong>in</strong>g systems and on the entire life cycle. In this study<br />
the standard ISO Life Cycle Assessment and ILCD Handbook m<strong>et</strong>hodology (ILCD, 2010) have been applied<br />
to the production of two buffalo dairy farms located <strong>in</strong> Southern Italy. The goal is to evaluate their environmental<br />
performance and to identify the hotspots <strong>in</strong> the production cha<strong>in</strong>. The functional unit is 1 kg of Normalised<br />
Buffalo Milk at farm gate. An attributional approach has been applied accord<strong>in</strong>g to the stated goal of<br />
the study.<br />
System boundaries (Fig. 1) comprise crop production, as well as the activities related to buffalo feed<strong>in</strong>g,<br />
breed<strong>in</strong>g and milk<strong>in</strong>g. Specific primary data, referred to 2010, have been collected from the two buffalo<br />
farms for each of the above phases. In particular, the follow<strong>in</strong>g items have been <strong>in</strong>cluded <strong>in</strong> the system<br />
boundaries: number of produc<strong>in</strong>g buffaloes and replacement heifers; production and transport of purchased<br />
feeds; production and transport of seeds, fertilisers, and d<strong>et</strong>ergents; energy consumption related both to cropp<strong>in</strong>g,<br />
feed<strong>in</strong>g and milk<strong>in</strong>g; disposal and treatment of waste produced at farms. Build<strong>in</strong>gs, <strong>in</strong>frastructures and<br />
equipments have not been <strong>in</strong>cluded <strong>in</strong> the system boundaries, but they are <strong>in</strong>cluded <strong>in</strong> some database’s processes.<br />
The production of medic<strong>in</strong>es and the milk-process<strong>in</strong>g phase have not been <strong>in</strong>cluded. Databases<br />
(ma<strong>in</strong>ly Eco<strong>in</strong>vent) and literature have been used for the background data. Manure and slurry produced by<br />
buffaloes are spread as fertilisers on agricultural farms’ land. As regards emissions related to the use of<br />
chemical and organic fertilisers, N2O airborne emissions and NO3 - waterborne emissions have been calculated<br />
accord<strong>in</strong>g to ISPRA (2008). NH3 airborne emissions have been calculated accord<strong>in</strong>g to ISPRA (2011a).<br />
Phosphorus waterborne emissions have been estimated accord<strong>in</strong>g to the budg<strong>et</strong> farm gate m<strong>et</strong>hodology proposed<br />
by Dalgaard <strong>et</strong> al. (2006). M<strong>et</strong>hane emissions on farms due to enteric fermentation and manure management<br />
have been estimated referr<strong>in</strong>g to ISPRA (2008). As buffalo milk production at farms is a multifunctional<br />
process, the environmental impacts have been allocated b<strong>et</strong>ween the ma<strong>in</strong> product (milk) and coproducts<br />
(calves and culled buffaloes) on the basis of their economic value.<br />
At the Conference the prelim<strong>in</strong>ary results, <strong>in</strong>clud<strong>in</strong>g the follow<strong>in</strong>g impact categories, will be presented and<br />
discussed: Global warm<strong>in</strong>g, Photochemical Oxidation, Acidification, Eutrophication. The assessment of<br />
Land Use and Ecotoxicity due to use of pesticides and antibiotics will be performed <strong>in</strong> a second step of the<br />
study.<br />
References<br />
Associazione Italiana Allevatori (AIA), 2011. Quadro economico e relazione attività 2010.<br />
Dalgaard, R., Halberg, N., Kristensen, Ib.,S., Larsen, I., 2006. Modell<strong>in</strong>g representative and coherent Danish<br />
farm types based on farm accountancy data for use <strong>in</strong> environmental assessment. Agriculture, Ecosystems<br />
and Environment 117, 223-237.<br />
International Reference Life Cycle Data System (ILCD), 2010. General guide for Life Cycle Assessment-<br />
D<strong>et</strong>ailed guidance. European Commission, Jo<strong>in</strong>t Research Centre (DG JRC), Available at:<br />
http://lct.jrc.ec.europa.eu/assessment/assessment/projects#d (visited <strong>in</strong> February <strong>2012</strong>).<br />
661
GROUP 1, SESSION A: ANIMAL PRODUCTION SYSTEMS 8 th Int. Conference on <strong>LCA</strong> <strong>in</strong> the<br />
Agri-<strong>Food</strong> Sector, 1-4 Oct <strong>2012</strong><br />
IPCC, 2006. 2006 IPCC Guidel<strong>in</strong>es for National Greenhouse Gas Inventories: volume 4: Agriculture, Forestry<br />
and other Land Use. Intergovernmental Panel on Climate Change. Available at: www.ipccnggip.iges.or.jp/public/2006gl/vol4.html<br />
(visited <strong>in</strong> February <strong>2012</strong>).<br />
ISPRA, 2008. Agricoltura-Inventario nazionale delle emissioni e disaggregazione prov<strong>in</strong>ciale. Institute for<br />
Environmental Protection and Research. Rome, Italy. Available at www.isprambiente.it.<br />
ISPRA, 2011. Agricoltura-Emissioni nazionali <strong>in</strong> atmosfera dal 1990 al 2009. Institute for Environmental<br />
Protection and Research. Rome, Italy. Available at www.isprambiente.it.<br />
662<br />
Figure 1. System boundaries.
GROUP 1, SESSION A: ANIMAL PRODUCTION SYSTEMS 8 th Int. Conference on <strong>LCA</strong> <strong>in</strong> the<br />
Agri-<strong>Food</strong> Sector, 1-4 Oct <strong>2012</strong><br />
10. Life cycle assessment of milk production <strong>in</strong> Italian <strong>in</strong>tensive dairy<br />
farms<br />
Matteo Guerci, Maddalena Zucali * , Anna Sandrucci, Alberto Tambur<strong>in</strong>i, Chiara Penati, Luciana Bava<br />
Dipartimento di Scienze Agrarie e Ambientali, Università degli Studi di Milano, Italy, Correspond<strong>in</strong>g author.<br />
E-mail: maddalena.zucali@unimi.it<br />
Environmental concerns are hav<strong>in</strong>g <strong>in</strong>creas<strong>in</strong>g priority upon political, social, and economic agendas, <strong>in</strong> particular<br />
when related to agriculture. <strong>Food</strong> production has an environmental impact, and as the global populations<br />
cont<strong>in</strong>ue to <strong>in</strong>crease, it is critical to produce sufficient high-quality food from a f<strong>in</strong>ite resource supply <strong>in</strong><br />
order to mitigate the effects upon the environment (Capper <strong>et</strong> al., 2009). In the North of Italy favorable climatic<br />
and <strong>in</strong>frastructural conditions promoted a great concentration of livestock farms with <strong>in</strong>tensive utilisation<br />
of natural resources (i.e. land, air, water). The objective of this study was to assess the environmental<br />
impact of milk production <strong>in</strong> <strong>in</strong>tensive dairy systems, <strong>in</strong> order to identify farm characteristics that guarantee<br />
at the same time low environmental impact and economic susta<strong>in</strong>ability. A cradle to farm gate Life Cycle<br />
Assessment (<strong>LCA</strong>) was performed on 41 <strong>in</strong>tensive dairy farms <strong>in</strong> Northern Italy. In addition to the evaluation<br />
of greenhouse potential, impact categories as acidification, eutrophication, land use and energy use were<br />
considered. The functional unit was 1 kg Fat and Prote<strong>in</strong> Corrected Milk (FPCM). Farm key param<strong>et</strong>ers<br />
about crop production for feed<strong>in</strong>g, livestock, manure management, purchased feed, fertilisers, pesticides,<br />
electricity and fuels, milk and meat sold were collected by personal <strong>in</strong>terview to the farmers. <strong>LCA</strong> was carried<br />
out us<strong>in</strong>g <strong>LCA</strong> software package, SimaPro 7.3.2 (Pré Consultants, 2011). Gross marg<strong>in</strong>, i.e revenues<br />
m<strong>in</strong>us the direct production costs, exclud<strong>in</strong>g labour costs (expressed <strong>in</strong> €/t FPCM), was used as economic<br />
<strong>in</strong>dicator. Database was analysed us<strong>in</strong>g the CLUSTER procedure (SAS, 2000). In order to identify different<br />
farm<strong>in</strong>g systems the follow<strong>in</strong>g variables were considered: gross marg<strong>in</strong>, feed self-sufficiency, dairy efficiency<br />
and stock<strong>in</strong>g density. Two ma<strong>in</strong> clusters of farms were identified (A and B); moreover <strong>in</strong> each of the<br />
two clusters two subgroups of farms were def<strong>in</strong>ed (Table 1). Farms from cluster B were slightly less <strong>in</strong>tensive<br />
than farms from cluster A: they had significantly larger farm land (ha), lower stock<strong>in</strong>g density (LU/ha)<br />
and higher feed self-sufficiency (%). Economic results were similar b<strong>et</strong>ween the two ma<strong>in</strong> clusters but ecological<br />
performances were b<strong>et</strong>ter for farms from cluster B: nitrogen and phosphorus balances at farm gate<br />
(kg/ha) and the off-farm components of total climate change, acidification, eutrophication, energy use and<br />
land use per kg FPCM were significantly lower <strong>in</strong> cluster B than <strong>in</strong> A. In fact farms from cluster B had<br />
higher feed self-sufficiency and purchased less feed, reduc<strong>in</strong>g off-farms fraction of all impacts but <strong>in</strong>creas<strong>in</strong>g<br />
on-farm component of eutrophication, acidification and land use. Farms from cluster B impacted more <strong>in</strong><br />
term of total eutrophication (on- and off-farm components) <strong>in</strong> comparison with farms from cluster A. Onfarm<br />
crop production weighted for the 50% on eutrophication, because of the use of fertiliser which could<br />
d<strong>et</strong>erm<strong>in</strong>e nitrate leach<strong>in</strong>g <strong>in</strong> the water and ammonia emission <strong>in</strong> the air. Consider<strong>in</strong>g the subgroups, farms<br />
from cluster 4 had b<strong>et</strong>ter economic performances than cluster 3; they were characterised by low stock<strong>in</strong>g<br />
density, high feed self-sufficiency and balanced partition of farm land among different crop production (lucerne:<br />
15.0% ; grass: 14.9%; maize for silage 21.2% of farm land). Farm <strong>in</strong>cluded <strong>in</strong> cluster 4 had lower<br />
nitrogen and phosphorus balances than cluster 3; they probably paid more attention <strong>in</strong> us<strong>in</strong>g fertilisers (134<br />
vs 178 kg of N <strong>in</strong>put from artificial fertilisers) and sold feed (446 vs 0 kg of N output from sold feed). The<br />
energy use of cluster 4 was lower than cluster 3 (P=0.10) as a consequence of reduced use of off-farm products,<br />
especially feeds. In the context of <strong>in</strong>tensive dairy farm<strong>in</strong>g of Northern Italy cluster 4 identifies a type of<br />
farm<strong>in</strong>g system that can produce good economic performances without <strong>in</strong>creas<strong>in</strong>g environmental impact.<br />
References<br />
Capper, J. L., Cady, R. A., Bauman, D. E., 2009. The environmental impact of dairy production: 1944 compared<br />
with 2007. J. Anim. Sci. 87, 2160-2167.<br />
Pré Consultants, 2011. SimaPro 7.3.2 PhD, <strong>LCA</strong> software. Pr<strong>in</strong>terweg, Amersfoort, N<strong>et</strong>herlands.<br />
SAS II, 2000. The SAS System for W<strong>in</strong>dows. In Book The SAS System for W<strong>in</strong>dows, Vol. Relase 8.01.<br />
663
GROUP 1, SESSION A: ANIMAL PRODUCTION SYSTEMS 8 th Int. Conference on <strong>LCA</strong> <strong>in</strong> the<br />
Agri-<strong>Food</strong> Sector, 1-4 Oct <strong>2012</strong><br />
Table 1. Characteristics of clusters (least square means)<br />
664<br />
Cluster A Cluster B<br />
Cluster<br />
1<br />
Cluster<br />
2<br />
Cluster<br />
3 Cluster 4<br />
n farms 6 11 8 16 SE<br />
11.<br />
P<br />
A vs<br />
B 1 vs 2 3 vs 4<br />
Farm land, ha 22.8 38.1 57.5 52.9 1<br />
50.<br />
0.07 0.01 0.28 0.70<br />
Livestock Unit 175 224 326 189 2 0.07 0.17 0.43 0.01<br />
0.8
GROUP 1, SESSION A: ANIMAL PRODUCTION SYSTEMS 8 th Int. Conference on <strong>LCA</strong> <strong>in</strong> the<br />
Agri-<strong>Food</strong> Sector, 1-4 Oct <strong>2012</strong><br />
11. Milk and meat biophysical allocation <strong>in</strong> dairy farms<br />
Jean Baptiste Dollé 1,* , Armelle Gac 2<br />
1 Institut de l'Elevage, Build<strong>in</strong>g and Environment Department, F-62051 St Laurent Blangy, <strong>France</strong>, 2 Institut<br />
de l’Elevage, Build<strong>in</strong>g and Environment Department, F-35652 Le Rheu, <strong>France</strong>, Correspond<strong>in</strong>g author. Email:<br />
jean-baptiste.dolle@idele.fr<br />
For the dairy farm<strong>in</strong>g systems, where the ma<strong>in</strong> focus is to produce milk, the meat generated from surplus<br />
calves and culled dairy cows is an important co-product. In Life Cycle Assessments (<strong>LCA</strong>), the environmental<br />
burdens (GHG, <strong>et</strong>c.) must be distributed b<strong>et</strong>ween these outputs. It is therefore necessary to d<strong>et</strong>erm<strong>in</strong>e<br />
total GHG emissions of the production system, which <strong>in</strong>clude dairy cows and heifers, and to allocate them<br />
b<strong>et</strong>ween milk and meat. This issue has already been addressed <strong>in</strong> several studies (Cederberg & Stadig, 2003,<br />
Flysjö <strong>et</strong> al., 2011). However, the ISO 14044 suggests that the allocation should be avoided as soon as the<br />
system allows it, by subdivision of the multifunction process by sub-processes. This implies each subprocess<br />
has to be precisely def<strong>in</strong>ed as dedicated to the production of one of the co-products and the <strong>in</strong>put and<br />
output fluxes of the whole system have to be attributed to each sub-process by a separated data collection or<br />
by the use of a technical distribution rule. Our <strong>in</strong>vestigation on French dairy systems is based on the causal<br />
relationship b<strong>et</strong>ween the energy needed by animals on dairy farms and the milk and meat production. Then,<br />
the biophysical allocation rule proposed is based on the technical function<strong>in</strong>g of the production system and<br />
consists to separate energy needed for dairy cows and heifers. It is considered that the total energy of the<br />
feed <strong>in</strong>take by cows is needed to produce milk (except pregnancy energy affected to the calf) and the total<br />
energy needed by heifers for their growth is to produce meat (f<strong>in</strong>al live weight before calv<strong>in</strong>g) <strong>in</strong> relation<br />
with meat avoided from suckler beef systems. In accordance to the IPCC guidel<strong>in</strong>es 2006 to d<strong>et</strong>erm<strong>in</strong>e m<strong>et</strong>hane<br />
emissions, energy demand for each category of animals (dairy cows and heifers) is evaluated by dist<strong>in</strong>guish<strong>in</strong>g<br />
energy for ma<strong>in</strong>tenance, activity, growth, pregnancy and milk production.<br />
This biophysical allocation has been tested on French dairy systems. The assessments highlight that energy<br />
affected to milk (ma<strong>in</strong>tenance, activity, growth and milk production) represent 73% of the total energy<br />
needed by the dairy herd (dairy cow + heifers) and the energy affected to meat (calv<strong>in</strong>g+ heifers) correspond<br />
to 27%. This ratio, applied to allocate GHG from dairy system to milk and meat, has been compared to<br />
milk/meat ratios obta<strong>in</strong>ed with other allocation approaches: prote<strong>in</strong> allocation used by FAO, IDF allocation<br />
(IDF - 2010), system expansion and economic allocation (Table 1). The distribution of environmental burdens<br />
to milk and meat varies <strong>in</strong> a range of 72-88%. The ratio obta<strong>in</strong>ed with biophysical allocation is close to<br />
the one with system expansion (meat from beef production system) but far from values observed with prote<strong>in</strong><br />
and IDF allocations. Applied <strong>in</strong> French dairy systems, these different allocation rules have an important <strong>in</strong>cidence<br />
on carbon footpr<strong>in</strong>t. For milk and meat, carbon footpr<strong>in</strong>ts at farm gate range respectively from 0.79 to<br />
0.97 kg CO2eq/kg of milk and from 4.4 and 9.5 kg CO2eq/kg of live weight (Fig. 2).<br />
The allocation choice for handl<strong>in</strong>g by-product is crucial for the outcome of the f<strong>in</strong>al carbon footpr<strong>in</strong>t of both<br />
milk and meat. This choice is often taken from a dairy production po<strong>in</strong>t of view but it should also consider<br />
that culled dairy cows represent a significant share of the total cattle meat production (40-50% <strong>in</strong> <strong>France</strong>).<br />
Consistency concern<strong>in</strong>g allocation <strong>in</strong> <strong>LCA</strong> studies on dairy and beef system, but also on all animal production<br />
(pigs, poultry) should then be found. This is allowed by biophysical allocation, which also has the advantage<br />
of be<strong>in</strong>g related to breed<strong>in</strong>g practices (feed <strong>in</strong>take, forage, <strong>et</strong>c.) and show<strong>in</strong>g the environmental ga<strong>in</strong><br />
allowed by mitigat<strong>in</strong>g techniques.<br />
References<br />
Cederberg C., Stadig M., 2003. System expansion and allocation <strong>in</strong> life cycle assessment of milk and beef<br />
production, Int J <strong>LCA</strong>, 350-356.<br />
Flysjö A., Cederberg C., Henriksson M, Ledgard S., 2011. How does co-product handl<strong>in</strong>g affect the carbon<br />
footpr<strong>in</strong>t of milk? Case study of milk production <strong>in</strong> New Zealand and Sweden, J Life cycle assessments,<br />
16, 420-430.<br />
IDF, 2010. Bull<strong>et</strong><strong>in</strong> of the IDF n°445/2010.<br />
IPCC 2006, 2006 IPCC Guidel<strong>in</strong>es for National Greenhouse Gas Inventories, Prepared by the National<br />
Greenhouse Gas Inventories Programme, Eggleston H.S., Buendia L., Miwa K., Ngara T. and Tanabe K.<br />
(eds). Published: IGES, Japan.<br />
ISO 14044: 2006. Environmental Management - Life Cycle Assessment - Requirements and guidel<strong>in</strong>es<br />
665
GROUP 1, SESSION A: ANIMAL PRODUCTION SYSTEMS 8 th Int. Conference on <strong>LCA</strong> <strong>in</strong> the<br />
Agri-<strong>Food</strong> Sector, 1-4 Oct <strong>2012</strong><br />
Table 1. Milk and meat ratios accord<strong>in</strong>g<br />
to different allocation rules<br />
Allocation Milk Meat<br />
Figure 1. Energy calculation <strong>in</strong> dairy system<br />
666<br />
rules<br />
Prote<strong>in</strong> 88% 12%<br />
IDF 82% 18%<br />
Economic 79% 21%<br />
Biophysical 73% 27%<br />
System<br />
expansion<br />
72% 28%<br />
Figure 2. Milk and meat carbon footpr<strong>in</strong>t at dairy farm gate accord<strong>in</strong>g to different allocation rules
GROUP 1, SESSION A: ANIMAL PRODUCTION SYSTEMS 8 th Int. Conference on <strong>LCA</strong> <strong>in</strong> the<br />
Agri-<strong>Food</strong> Sector, 1-4 Oct <strong>2012</strong><br />
12. Functional unit and reference flow <strong>in</strong> the dairy cow <strong>LCA</strong><br />
Chun-Youl Baek 1 , Kun-Mo Lee 1,* , Kyu-Hyun Park 2<br />
1 Department of Environmental Eng<strong>in</strong>eer<strong>in</strong>g, Eco-product Research Institute, Ajou University, Korea,<br />
2 National Institute of Animal Science, Suwon, Korea, Correspond<strong>in</strong>g author. E-mail: kunlee@ajou.ac.kr<br />
Functional unit <strong>in</strong> <strong>LCA</strong> def<strong>in</strong>es the functional performance characteristics delivered by the product system,<br />
here livestock. It serves as denom<strong>in</strong>ator <strong>in</strong> normalis<strong>in</strong>g the <strong>in</strong>put and output data (environmental load: EL) of<br />
a product system. Normalised EL is <strong>in</strong>tended implicitly and explicitly for comparison b<strong>et</strong>ween processes and<br />
activities <strong>in</strong> a given product system, or b<strong>et</strong>ween different product systems. Def<strong>in</strong><strong>in</strong>g functional unit of an<br />
<strong>in</strong>dustrial product is less complicated compared with that of a livestock. This is ma<strong>in</strong>ly because of the difference<br />
<strong>in</strong> functional performance characteristics of the two, where the former possesses fixed attribute while<br />
the latter variable attributes. Reference flow is an amount of product needed to fulfil the function of a product<br />
system.<br />
The objective of this paper is to <strong>in</strong>vestigate the effect of product attributes on the functional performance<br />
characteristics <strong>in</strong> def<strong>in</strong><strong>in</strong>g functional unit and reference flow. A dairy cow was chosen as the targ<strong>et</strong> product<br />
for the livestock <strong>LCA</strong> and a typical size dairy farm of 65 heads of cows with different stages <strong>in</strong> growth <strong>in</strong><br />
Korea was chosen to gather <strong>in</strong>put and output data. A dairy cow undergoes different stages <strong>in</strong> its life cycle<br />
<strong>in</strong>clud<strong>in</strong>g calf, heifer, lactat<strong>in</strong>g cow and dry cow with a life span of average five (5) years. Different life cycle<br />
stages of a cow means composition of a cow <strong>in</strong> a farm dur<strong>in</strong>g the life span of a cow of five years may<br />
<strong>in</strong>fluence the variability of the EL data from a cow. Thus, composition of a cow <strong>in</strong> a farm should be clearly<br />
def<strong>in</strong>ed <strong>in</strong> the reference flow.<br />
Key f<strong>in</strong>d<strong>in</strong>gs of this paper <strong>in</strong>clude: functional unit should be def<strong>in</strong>ed based on the functional performance<br />
characteristics delivered by the product, reference flow should be one cow with known composition and life<br />
span, and composition of cows <strong>in</strong> a farm may vary depend<strong>in</strong>g on the number of heads the farm houses which<br />
will affect <strong>LCA</strong> results. A stable composition should be used for def<strong>in</strong><strong>in</strong>g reference flow <strong>in</strong> the dairy cow<br />
<strong>LCA</strong>.<br />
References<br />
Ste<strong>in</strong>feld, H., Gerber, P., Wassenaar, T., Castel, V., Rosales, M., De Haan, C., 2006. Livestock's long<br />
shadow: environmental issues and options, FAO, Rome, Italy.<br />
De Vries, M., De Boer, I.J.M., 2010. Compar<strong>in</strong>g environmental impacts for livestock products - A review of<br />
life cycle assessments, Livestock Science, 128, 1-11.<br />
667
GROUP 1, SESSION A: ANIMAL PRODUCTION SYSTEMS 8 th Int. Conference on <strong>LCA</strong> <strong>in</strong> the<br />
Agri-<strong>Food</strong> Sector, 1-4 Oct <strong>2012</strong><br />
13. L<strong>in</strong>k<strong>in</strong>g environmental impact of milk production to the territory:<br />
the Qualaiter project<br />
Michaël Mathot 1,* , Michael S. Corson 2,3 , Didier Stilmant 1<br />
1 Farm<strong>in</strong>g Systems, Territory and Information Technologies Unit, Walloon Agricultural Research Center, rue<br />
du Serpont 100, B-6800 Libramont, Belgium, 2 INRA, UMR 1069, Sol, Agro- <strong>et</strong> hydrosystème Spatialisation,<br />
F-35000, Rennes, <strong>France</strong>, 3 Agrocampus Ouest, F-35000, Rennes, <strong>France</strong>, Correspond<strong>in</strong>g author. Email:<br />
m.mathot@cra.wallonie.be<br />
For the last decade, animal productions have been strongly criticised for their environmental impact. However,<br />
with<strong>in</strong> a given food cha<strong>in</strong> large impact variations b<strong>et</strong>ween different systems of production are highlighted<br />
at world (FAO, 2010) or at regional scale (Casey <strong>et</strong> al.,2006). Variations that are worthwhile to explore.<br />
Therefore the Qualaiter project aims to quantify environmental impact of milk production us<strong>in</strong>g <strong>LCA</strong><br />
approach, through the adaptation of EDEN m<strong>et</strong>hodology (Van der Werf <strong>et</strong> al., 2009) to the Belgian (Walloon)<br />
context, <strong>in</strong> l<strong>in</strong>k to territorial diversity recorded with<strong>in</strong> Walloon area. This diversity, related to climate,<br />
geological and historical conditions, leads to associated agricultural practices diversity that potentially <strong>in</strong>fluence<br />
the environmental impact of the production systems. In order to discrim<strong>in</strong>ate the territorial from the<br />
management role on the environmental impact of dairy farms we identify three farms types that could be<br />
found <strong>in</strong> three contrasted area to compare their environmental performances.<br />
References<br />
Casey, J.W., Holden, M.N., 2006. Quantification of GHG emissions from sucker-beef production <strong>in</strong> Ireland.<br />
Agricultural Systems 90, 79-98.<br />
FAO, 2010. Greenhouse Gas Emissions from the dairy Sector. A Life Cycle Assessment. <strong>Food</strong> and Agricultural<br />
Organization of the United Nations. Animal Production and Health Division. 94 p.<br />
Van der Werf, H. M. G., Kanyarushoki C., Corson M. S., 2009. An operational m<strong>et</strong>hod for the evaluation of<br />
resource use and environmental impacts of dairy farms by life cycle assessment. Journal of Environmental<br />
Management 90, 3643-3652.<br />
668
GROUP 1, SESSION A: ANIMAL PRODUCTION SYSTEMS 8 th Int. Conference on <strong>LCA</strong> <strong>in</strong> the<br />
Agri-<strong>Food</strong> Sector, 1-4 Oct <strong>2012</strong><br />
14. A matrix approach to spatialise impacts of US milk production<br />
Anne Assel<strong>in</strong>-Balençon 1,* , Andrew Henderson 1 , Marty Heller 1,3 , L<strong>in</strong>dsay Lessard 2 , Samuel Vionn<strong>et</strong> 2 ,<br />
Sebastien Humbert 2 , Rosie Saad 4 , Manuele Margni 4 , Greg Thoma 5 , Marty Matlock 6 , Olivier Jolli<strong>et</strong> 1<br />
1 School of Public Health (SPH), University of Michigan, 6622 SPH Tower, 1415 Wash<strong>in</strong>gton Heights, Ann<br />
Arbor, Michigan 48109-2029, USA, 2 Quantis, Parc scientifique de l'EPFL, Bât. D, 1015 Lausanne Switzerland,<br />
3 Center for Susta<strong>in</strong>able Systems, School of Natural Resources and Environment, University of Michigan,<br />
3012 Dana Build<strong>in</strong>g, 440 Church Stre<strong>et</strong>, Ann Arbor, MI 48109-1041, USA, 4 CIRAIG, École Polytechnique<br />
de Montréal, Département de génie chimique, C.P. 6079, succ. Centre-Ville, Montréal (Qc) Canada,<br />
H3C 3A7, 5 Ralph E. Mart<strong>in</strong> Department of Chemical Eng<strong>in</strong>eer<strong>in</strong>g, University of Arkansas, 3202 Bell Eng<strong>in</strong>eer<strong>in</strong>g<br />
Center, 800 West Dickson Stre<strong>et</strong>, Fay<strong>et</strong>teville, AR 72701-1201, USA, 6 Department of Biological &<br />
Agricultural Eng<strong>in</strong>eer<strong>in</strong>g, Eng<strong>in</strong>eer<strong>in</strong>g Hall, Fay<strong>et</strong>teville, AR 7270, USA, Correspond<strong>in</strong>g author. E-mail:<br />
aassel<strong>in</strong>@umich.edu<br />
In many cases <strong>in</strong> production, goods are not consumed <strong>in</strong> the same place they are produced. This is particularly<br />
the case <strong>in</strong> agriculture. Crops are produced for a lot of purposes, which can be milk or meat production<br />
or process<strong>in</strong>g for human consumption. The downstream production (eg milk or meat) does not necessarily<br />
take place <strong>in</strong> the same location where the crops were grown; some of those crops can be transported over<br />
very long distances before be<strong>in</strong>g consumed or processed. This is especially the case <strong>in</strong> the case of US milk,<br />
where corn gra<strong>in</strong> for example is mostly produced <strong>in</strong> the Corn Belt, while it is consumed all over the nation.<br />
On the other end and for some impact categories the impacts of crop production is very local. It is the case of<br />
water stress for example. Crop production is a water <strong>in</strong>tensive activity, and water use and impacts vary<br />
greatly depend<strong>in</strong>g on region, crop irrigation and type of crop. In some regions, irrigation account for up to<br />
90% of water withdrawn from available sources, while <strong>in</strong> some others with plentiful ra<strong>in</strong>water, irrigation is<br />
barely necessary.<br />
This presentation <strong>in</strong>troduces a generic model to properly account for the attribution of a flow or impact to the<br />
milk produc<strong>in</strong>g locations and gra<strong>in</strong> produc<strong>in</strong>g locations, through a matrix approach at the state level. This<br />
approach allows an analysis <strong>in</strong> which an <strong>in</strong>ventory flow <strong>in</strong> milk produc<strong>in</strong>g state j can be decomposed <strong>in</strong>to<br />
<strong>in</strong>ventories flows <strong>in</strong> gra<strong>in</strong> produc<strong>in</strong>g states i. Furthermore, impacts from those gra<strong>in</strong> and milk produc<strong>in</strong>g<br />
states are aggregated on the level of the <strong>in</strong>ducer (the state produc<strong>in</strong>g milk, for which gra<strong>in</strong> is grown <strong>in</strong> other<br />
states), the emitter (the states <strong>in</strong> which environmental emissions occur), or receiver (the states or other global<br />
regions <strong>in</strong> which the impacts of those environmental emissions are felt).<br />
Overall, the water stress impact of 1 kg milk <strong>in</strong> the US is equal to 109 litres <strong>in</strong> comp<strong>et</strong>ition per kg milk, California<br />
represent<strong>in</strong>g 22% of the national milk production and 54% of the impact. This national impact <strong>in</strong>corporates<br />
the impact of each of the feeds at a state resolution. Look<strong>in</strong>g at a particular feed production, corn<br />
gra<strong>in</strong>, the national water impact is 54 litres <strong>in</strong> comp<strong>et</strong>ition per kg corn gra<strong>in</strong>, nearly half of this impact com<strong>in</strong>g<br />
from one s<strong>in</strong>gle state, Nebraska, comb<strong>in</strong><strong>in</strong>g two factors: relatively high production and relatively high<br />
water stress <strong>in</strong>dex. The impact of eutrophication from phosphorus takes place over the whole watershed<br />
downstream of crop production and application of organic and <strong>in</strong>organic P fertiliser. The orig<strong>in</strong>al matrix<br />
approach is key to correctly assess local impacts of a given <strong>in</strong>dustry account<strong>in</strong>g for the orig<strong>in</strong> of its supplies,<br />
and can be used for different spatialised resolutions and <strong>in</strong>dustries.<br />
669
GROUP 1, SESSION A: ANIMAL PRODUCTION SYSTEMS 8 th Int. Conference on <strong>LCA</strong> <strong>in</strong> the<br />
Agri-<strong>Food</strong> Sector, 1-4 Oct <strong>2012</strong><br />
Figure 1. National assessment of water <strong>in</strong> comp<strong>et</strong>ition for corn gra<strong>in</strong> production <strong>in</strong> Leq <strong>in</strong> comp<strong>et</strong>ition/ kg<br />
dry matter<br />
670
GROUP 1, SESSION A: ANIMAL PRODUCTION SYSTEMS 8 th Int. Conference on <strong>LCA</strong> <strong>in</strong> the<br />
Agri-<strong>Food</strong> Sector, 1-4 Oct <strong>2012</strong><br />
15. Environmental and socioeconomic references of French<br />
conventional pig systems<br />
Sandr<strong>in</strong>e Espagnol 1,* , Alexandre Rugani 1 , Christ<strong>in</strong>e Baratte 2 , Christ<strong>in</strong>e Rogu<strong>et</strong> 1 , Michel Marcon 1 , Aurélie<br />
Tailleur 5 , Cyrille Rigolot 2 , Jean-Yves Dourmad 3,4<br />
1 IFIP Institut du porc, La Motte au vicomte BP35104, 35651 Le Rheu, <strong>France</strong>, 2 INRA UMR1080 Production<br />
du Lait, 35590 Sa<strong>in</strong>t Gilles, <strong>France</strong>, 3 INRA UMR1079 Système d'Elevage Nutrition Animale <strong>et</strong> Huma<strong>in</strong>e,<br />
35590 Sa<strong>in</strong>t Gilles, <strong>France</strong>, 4 Agrocampus Ouest, UMR 1079 Systèmes d'Élevage Nutrition Animale <strong>et</strong> Huma<strong>in</strong>e,<br />
35000 Rennes, <strong>France</strong>, 5 Arvalis Institut du Végétal, 91720 Boigneville, <strong>France</strong>, Correspond<strong>in</strong>g author.<br />
E-mail: sandr<strong>in</strong>e.espagnol@ifip.asso.fr<br />
This study aims to produce multicriteria environmental references (us<strong>in</strong>g Life Cycle Assessment, <strong>LCA</strong>) associated<br />
with socioeconomic <strong>in</strong>dicators for different types of pig units representative of the dom<strong>in</strong>ant French<br />
standard production systems. Eight systems are assessed, discrim<strong>in</strong>ated accord<strong>in</strong>g to the size, the degree of<br />
specialisation and the location of the pig unit, the slurry management and the pig feed<strong>in</strong>g strategy. The results<br />
are expressed per kilogram live pig produced and the <strong>LCA</strong> boundaries <strong>in</strong>clude the production and the<br />
supply of <strong>in</strong>puts, the production of build<strong>in</strong>gs, the pig breed<strong>in</strong>g and the management of slurry. The references<br />
br<strong>in</strong>g a socioeconomic and environmental photography of the performance of the exist<strong>in</strong>g pig production<br />
systems and their variability b<strong>et</strong>ween and with<strong>in</strong> systems. The environmental results allow identification of<br />
the most strategic and easily atta<strong>in</strong>able options of improvement. The effect of different improvement strategies<br />
are <strong>in</strong>dentified <strong>in</strong> connection with feed formulation, improvement of animal performance, and the implementation<br />
of the recommended good environmental practices. The socioeconomic <strong>in</strong>dicators of the systems<br />
show the various levels of access to the control levers of action.<br />
References<br />
Bass<strong>et</strong>-Mens, C., Van Der Werf, H., 2004. Evaluation environnementale de systèmes de production de porcs<br />
contrastés. Journées Rech. Porc<strong>in</strong>e, 36, 47-52.<br />
Chardon, X., Rigolot, C., Baratte, C., Le Gall, A., Espagnol, S., Mart<strong>in</strong>-Clouaire, R., Rellier, J.P., Raison, C.,<br />
Poupa, J.C., Faverd<strong>in</strong>, P., 2007. MELODIE: A whole-farm model to study the dynamics of nutrients <strong>in</strong><br />
<strong>in</strong>tegrated dairy and pig farms. In Oxley, L. and Kulasari, D. (eds) MODSIM 2007 International Congress<br />
on Modell<strong>in</strong>g and Simulation. December 2007, 1638-1645.<br />
CORPEN, 2003. Estimation des rej<strong>et</strong>s d’azote-phosphore-potassium-cuivre <strong>et</strong> z<strong>in</strong>c des porcs. Influence de la<br />
conduite alimentaire <strong>et</strong> du mode de logement des animaux sur la nature <strong>et</strong> la gestion des déjections produites.<br />
M<strong>in</strong>istère de l’écologie, 41p.<br />
Gac, A., Deltour, L., Cariolle, M., Dollé, J-B., Espagnol S., Flén<strong>et</strong>, F., Gu<strong>in</strong>gand, N., Lagadec, S., Le Gall,<br />
A., Lellahi, A. Malaval, C. Ponchant, P., Tailleur, A., 2010. GES’TIM: Guide méthodologique pour<br />
l’estimation des impacts des activités agricoles sur l’eff<strong>et</strong> de serre. Version 1.2, 155p.<br />
GIEC, 2006. Lignes directrices 2006 du GIEC pour les <strong>in</strong>ventaires nationaux de gaz à eff<strong>et</strong> de serre, Volume<br />
4: Agriculture, foresterie <strong>et</strong> autres affectations des terres. www.ipcc.ch<br />
Gu<strong>in</strong>gand, N., Aubert, C., Dollé, J.-B., 2010.Guide des bonnes pratiques environnementales d’élevage. Institut<br />
de l’élevage, IFIP, ITAVI, 303p.<br />
Ilari, E., 2007. De 2000 à 2005, comment ont évolué les exploitations porc<strong>in</strong>es françaises? Techniporc, 30<br />
(6), 19-25.<br />
Loyon, L., Guiziou, F., Bel<strong>in</strong>e, F., Peu, P., 2007. Gaseous emissions (NH3, N2O, CH4 and CO2) from the<br />
aerobic treatment of piggery slurry – Comparison with a conventional storage system. Biosystems eng<strong>in</strong>eer<strong>in</strong>g,<br />
97, 472-480.<br />
Marcon, M., 2008. Consommations d’énergie des bâtiments porc<strong>in</strong>s: comment les réduire?. IFIP, <strong>France</strong>.<br />
Massabie, P., 2001. L’abreuvement des porcs. Techniporc, 24 (6), 9-14<br />
Rigolot, C., Meda, B., Espagnol, S., Troch<strong>et</strong>, T., Dourmad, J-Y. 2009. ACV de 5 systèmes porc<strong>in</strong>s avec différentes<br />
hypothèses de comptabilisation des impacts. Journées Rech. Porc<strong>in</strong>e, 41, 281-282.<br />
Nemecek, T., Kägi, T., 2007. Life cycle <strong>in</strong>ventories of agricultural production systems. EcoInvent report<br />
No.15. Zürich, CH. www.eco<strong>in</strong>vent.ch<br />
671
GROUP 1, SESSION A: ANIMAL PRODUCTION SYSTEMS 8 th Int. Conference on <strong>LCA</strong> <strong>in</strong> the<br />
Agri-<strong>Food</strong> Sector, 1-4 Oct <strong>2012</strong><br />
Figure 1. <strong>LCA</strong> Impacts of different types of pig units and variability (results <strong>in</strong>% of the pig unit NE 150<br />
BZH).<br />
Figure 2. Flow diagram for <strong>LCA</strong> pig production.<br />
672
GROUP 1, SESSION A: ANIMAL PRODUCTION SYSTEMS 8 th Int. Conference on <strong>LCA</strong> <strong>in</strong> the<br />
Agri-<strong>Food</strong> Sector, 1-4 Oct <strong>2012</strong><br />
16. Environmental impact of the pork supply cha<strong>in</strong> depend<strong>in</strong>g on<br />
farm performances<br />
Karol<strong>in</strong>e Reckmann * , Joachim Kri<strong>et</strong>er<br />
Institute of Animal Breed<strong>in</strong>g and Husbandry, Christian-Albrechts-University Kiel, Germany, Correspond<strong>in</strong>g<br />
author. E-mail: kreckmann@tierzucht.uni-kiel.de<br />
The aim of the study is to figure the effect of changes <strong>in</strong> farm performances on the environmental impact of<br />
pork production. The environmental assessment was performed us<strong>in</strong>g data represent<strong>in</strong>g the typical Northern<br />
German pork production <strong>in</strong> 2010 on the one hand. On the other hand, data of German pig farms with 25%<br />
highest and lowest efficiency <strong>in</strong> terms of n<strong>et</strong> profit (economic success) was used. The data for the farms was<br />
gathered from an extension service for pig farms <strong>in</strong> Northern Germany (SSB, 2010). The database of the feed<br />
and slaughter<strong>in</strong>g stage was composed of own data collection from specific companies and of literature. The<br />
system boundaries of the Life Cycle Assessment cover the feed production, pig hous<strong>in</strong>g as well as the<br />
slaughter<strong>in</strong>g stage. Infrastructure, packag<strong>in</strong>g, r<strong>et</strong>ail and consumption were excluded. The manure produced at<br />
the farm had also a value as a fertiliser, thus substitut<strong>in</strong>g synth<strong>et</strong>ic fertiliser. The environmental impact of the<br />
whole production cha<strong>in</strong> was expressed per ‘1 kg pork produced’. Three impact categories were considered:<br />
Global warm<strong>in</strong>g potential (GWP), Eutrophication potential (EP) and Acidification potential (AP), expressed<br />
<strong>in</strong> equivalents (eq).<br />
Table 1 summarises the environmental performance with respect to the three impact categories. The average<br />
pork production results <strong>in</strong> a GWP of 3.62 kg CO2-eq, an EP of 42 g PO4-eq and an AP of 89 g SO2-eq per kg<br />
pork. A higher efficiency on farm level reduces the estimated environmental impacts of GWP as well as EP.<br />
The GWP is improved by 358 g CO2-eq per kg pork, whereas the reduction of EP reaches 0.37 g PO4-eq per<br />
kg pork. In contrast, the average production results <strong>in</strong> a 1% <strong>in</strong>creased AP compared to the production with a<br />
lower efficiency. However, the lowest AP arises out of the pork production with an enhanced performance<br />
on farm level. Nguyen <strong>et</strong> al. (2011) estimated a GWP of 3.1 kg CO2-eq per kg carcass weight produced <strong>in</strong><br />
Denmark. These results are <strong>in</strong> l<strong>in</strong>e with ours. In case of higher efficiency, the potential of reduc<strong>in</strong>g the GWP<br />
(2.8 kg CO2-eq per kg carcass weight) was shown more clearly than <strong>in</strong> the present study. This could arise<br />
from the different m<strong>et</strong>hod used or the fact that the higher efficiency was based on biological param<strong>et</strong>ers.<br />
For estimation of the contribution of these stages to the overall impacts, the production cha<strong>in</strong> was divided<br />
<strong>in</strong>to the stages of feed production, pig hous<strong>in</strong>g and slaughter<strong>in</strong>g. Feed production is the ma<strong>in</strong> contributor <strong>in</strong><br />
the case of GWP with a share of 80% (Fig. 1), followed by pig hous<strong>in</strong>g (15%) and slaughter<strong>in</strong>g. The largest<br />
part of Eutrophication is caused by pig hous<strong>in</strong>g (51%) and feed production (48%). In the case of AP, pig<br />
hous<strong>in</strong>g plays a key role with an amount of 72%. Feed production is responsible for 27% of the AP, whereas<br />
only 1% of the AP orig<strong>in</strong>ates from the slaughter<strong>in</strong>g process. Over all the shown impact categories, slaughter<strong>in</strong>g<br />
has only a marg<strong>in</strong>al share (1-5%) to the environmental impacts of the pork supply cha<strong>in</strong>.<br />
Further calculations will <strong>in</strong>clude different scenarios by vary<strong>in</strong>g s<strong>in</strong>gle param<strong>et</strong>ers on farm level, as e.g. number<br />
of litters per sow and year, feed <strong>in</strong>take, daily weight ga<strong>in</strong> and feed conversion rate. Results from the different<br />
<strong>LCA</strong>s will be compared to identify performance param<strong>et</strong>ers with a high effect on the overall impacts.<br />
In order to illustrate the variation of the impacts, Monte Carlo m<strong>et</strong>hods will be used for further calculations.<br />
References<br />
Nguyen TLT, Hermansen JE, Mogensen L., 2011. Environmental assessment of Danish pork. Aarhus, Denmark:<br />
Aarhus University.<br />
SSB, 2010. Schwe<strong>in</strong>ereport 2010. Schwe<strong>in</strong>espezialberatung Schleswig-Holste<strong>in</strong> e.V.<br />
Table 1. Results for the impact categories Global Warm<strong>in</strong>g Potential (GWP), Eutrophication (EP) and Acidification<br />
Potential (AP) for the three scenarios of pork production, related to 1 kg pork produced.<br />
Impact cate- + 25% farm Average produc- - 25% farm effigory<br />
efficiency tion 2010 ciency<br />
GWP<br />
CO2-eq)<br />
(kg<br />
3.46 3.62 3.67<br />
EP (g PO4-eq) 42.48 42.84 44.88<br />
AP (g SO2eq)<br />
85.41 89.56 89.10<br />
673
GROUP 1, SESSION A: ANIMAL PRODUCTION SYSTEMS 8 th Int. Conference on <strong>LCA</strong> <strong>in</strong> the<br />
Agri-<strong>Food</strong> Sector, 1-4 Oct <strong>2012</strong><br />
Figure 1. Percentages of the different stages of an average pork production for the impact categories Global<br />
Warm<strong>in</strong>g Potential (GWP), Eutrophication (EP) and Acidification Potential (AP) related to 1 kg pork produced.<br />
674
GROUP 1, SESSION A: ANIMAL PRODUCTION SYSTEMS 8 th Int. Conference on <strong>LCA</strong> <strong>in</strong> the<br />
Agri-<strong>Food</strong> Sector, 1-4 Oct <strong>2012</strong><br />
17. Characterisation of the pig systems panel for the production of<br />
environmental data <strong>in</strong> the program Agri-BALYSE<br />
Sandr<strong>in</strong>e Espagnol 1,* , Thibault Salou 2,3 , Hayo van der Werf 2,3<br />
1 IFIP Institut du porc, La Motte au vicomte BP35104, 35651 Le Rheu, <strong>France</strong>, 2 INRA, UMR1069 Sol, Agro<br />
and hydroSystem, 35000 Rennes, <strong>France</strong><br />
3 Agrocampus Ouest, 35000 Rennes, <strong>France</strong>, Correspond<strong>in</strong>g author. E-mail: sandr<strong>in</strong>e.espagnol@ifip.asso.fr<br />
The program Agri-BALYSE is a French <strong>in</strong>itiative which aims to develop a public LCI-database of French<br />
agricultural products by the end of <strong>2012</strong>.This database has two goals: (1) it will provide data to s<strong>et</strong> up environmental<br />
label<strong>in</strong>g for consumers; (2) it will also <strong>in</strong>clude environmental assessments of different contrast<strong>in</strong>g<br />
production systems which will be more useful for the R&D and the identification of action levers.<br />
Pig production/breed<strong>in</strong>g is one of the agricultural products which is covered by the Agri-BALYSE-database.<br />
Given the fact that there exists wide vari<strong>et</strong>y of pig production systems <strong>in</strong> <strong>France</strong>, it has been necessary to<br />
choose the best panel of pig production/breed<strong>in</strong>g systems <strong>in</strong> order to answer to the different objectives of the<br />
project. Actual representativeness of production systems was an important selection criteria but not the only<br />
one. Emphasis was given also to future representativeness as well as social desirability and agricultural practices.<br />
Three systems were def<strong>in</strong>ed to provide data for the environmental label<strong>in</strong>g: a national average standard<br />
production system, an organic production system as well as a pig system “fermier label rouge”. Four other<br />
systems have been selected to analyse the <strong>in</strong>cidence of specialisation levels and feed strategies which are<br />
considered to be the most important action drivers.<br />
The chosen systems are qualified concern<strong>in</strong>g their adaptability to the different uses by giv<strong>in</strong>g their actual and<br />
future representativeness, analyz<strong>in</strong>g if the ma<strong>in</strong> levers of action are considered, consider<strong>in</strong>g system which are<br />
wanted by soci<strong>et</strong>y. The f<strong>in</strong>al def<strong>in</strong>ition of the production system has also to consider if date and <strong>in</strong>formation<br />
are available and to see if it is (or will be) possible to trace system characteristics to the kilogram of pig.<br />
References<br />
IFIP, 2005-2009. Porc performances.<br />
IFIP, 2009. Bâtiments d’élevage porc<strong>in</strong> <strong>et</strong> environnement: Analyse de l’enquête de novembre 2008 réalisée<br />
par le SCEES. <strong>France</strong> AgriMer, 272 p.<br />
ITP, 2005. Compositions des effluents porc<strong>in</strong>s <strong>et</strong> de leurs co-produits de traitement - Quantités produites, 68<br />
p.<br />
Figure 1. Pig systems for Agri-BALYSE<br />
675
GROUP 1, SESSION A: ANIMAL PRODUCTION SYSTEMS 8 th Int. Conference on <strong>LCA</strong> <strong>in</strong> the<br />
Agri-<strong>Food</strong> Sector, 1-4 Oct <strong>2012</strong><br />
18. Life cycle th<strong>in</strong>k<strong>in</strong>g applied to an immunological product (vacc<strong>in</strong>e)<br />
used for boar ta<strong>in</strong>t control <strong>in</strong> male pigs<br />
Paulo Moraes 1 , Jim Allison 1 , Joseph A. Rob<strong>in</strong>son 1 , Stéphan Mart<strong>in</strong> 1 , Gian Luca Baldo 2 , Paola Borla 2<br />
1 Pfizer Animal Health, USA and Europe, 2 Life Cycle Eng<strong>in</strong>eer<strong>in</strong>g (LCE), Italy, * Correspond<strong>in</strong>g author. E-<br />
mail: baldo@studiolce.it<br />
In 2009, Pfizer Animal Health decided to apply the <strong>LCA</strong> m<strong>et</strong>hodology to some <strong>in</strong>novative products, with a<br />
first case-study on Improvac ® , an immunological product (vacc<strong>in</strong>e) for male pigs that provides farmers with<br />
an alternative way to avoid the problem of boar ta<strong>in</strong>t: its use <strong>in</strong>creases the efficiency of male pig production<br />
and could consequently provide life-cycle environmental benefits.<br />
A mean<strong>in</strong>gful <strong>LCA</strong> study of the vacc<strong>in</strong>e required the collection, with a global perspective, of reliable data<br />
about the life-cycle environmental burden of an average farm that uses or not the product. Information from<br />
with<strong>in</strong>-farm comparative studies was also <strong>in</strong>tegrated <strong>in</strong>to the analysis. This led to an understand<strong>in</strong>g of any<br />
possible environmental benefits of the vacc<strong>in</strong>e’s adoption by benchmark<strong>in</strong>g aga<strong>in</strong>st exist<strong>in</strong>g, traditional practices<br />
(castration).<br />
The two most relevant phases contribut<strong>in</strong>g to the life-cycle environmental burden of the exam<strong>in</strong>ed system are<br />
the production of feed given to pigs and pig slurry management (Fig. 1). Start<strong>in</strong>g from the feed recipe, an<br />
<strong>in</strong>terest<strong>in</strong>g close exam<strong>in</strong>ation was conducted on agricultural practices by country, provid<strong>in</strong>g a valuable description<br />
of how feed production burden changes accord<strong>in</strong>g to local conditions (yields, fertiliser use, <strong>et</strong>c.).<br />
The same conclusion applies to different slurry management procedures and technologies. Overall, the <strong>LCA</strong><br />
provided mean<strong>in</strong>gful <strong>in</strong>formation for use by farmers who are <strong>in</strong>terested <strong>in</strong> reduc<strong>in</strong>g their carbon footpr<strong>in</strong>t<br />
when rear<strong>in</strong>g sw<strong>in</strong>e for pork meat.<br />
The study shows a reduction <strong>in</strong> the environmental impacts considered for the vacc<strong>in</strong>ated pig life cycle compared<br />
to the castrated one. In particular, the calculated carbon footpr<strong>in</strong>t for the Improvac pig system demonstrates<br />
a reduction vs. the physically castrated pig system of 3.7% <strong>in</strong> terms of kg live-weight; given the annual<br />
production of pigs reared globally for prote<strong>in</strong> consumption (about 500M males), this carbon footpr<strong>in</strong>t<br />
reduction is <strong>in</strong>crementally significant and supports the adoption of Improvac over the traditional approach of<br />
castrat<strong>in</strong>g boars.<br />
The product is approved for use and distributed <strong>in</strong> nearly all pig produc<strong>in</strong>g countries worldwide: from South<br />
America to the US and from Europe to Australia, <strong>in</strong>clud<strong>in</strong>g the world leader <strong>in</strong> sw<strong>in</strong>e production, Ch<strong>in</strong>a.<br />
The Improvac Environmental Product Declaration was first published <strong>in</strong> January 2011 on the International<br />
EPD register and renewed <strong>in</strong> early <strong>2012</strong> after the required external review by a third party<br />
(www.environdec.com).<br />
References<br />
Allison J., McKeith F., C Souza, Boler D., Killefer J. Hennessy D., 2009. Impact of us<strong>in</strong>g vacc<strong>in</strong>ation with<br />
IMPROVAC® rather than physical castration on the carcass characteristics of f<strong>in</strong>ish<strong>in</strong>g male pigs <strong>in</strong><br />
ICOMST, 55 th International Congress of Meat Science and Technology, Copenhagen 16-21 August 2009,<br />
Denmark, paper n° 7.38.<br />
Bass<strong>et</strong>-Mens C., Van der Werf H.M.G., Durand P., L<strong>et</strong>erme P., 2006. Implications of uncerta<strong>in</strong>ty and variability<br />
<strong>in</strong> the life cycle assessment of pig production systems. Int J <strong>LCA</strong> 11, 298-304.<br />
Dunshea F., Colantoni C., Howard K., McCauley I., Jackson P., Long K.A., Lopaticki S., Nugent E.A.,<br />
Simons J.A., Walker J., Hennessy D.P., 2001. Vacc<strong>in</strong>ation of boars with a GnRH vacc<strong>in</strong>e (Improvac®)<br />
elim<strong>in</strong>ates boar ta<strong>in</strong>t and <strong>in</strong>creases growth performance. J. Anim. Sci. 79, 2524-2535.<br />
European Commission, 2003. Integrated Pollution Prevention and Control (IPPC) Reference Document on<br />
Best Available Techniques for Intensive Rear<strong>in</strong>g of Poultry and Pigs. JRC.<br />
Fàbrega E., Velarde A., Cros J., Gispert M., Suárez P., Tibau J., Soler J., 2010. Effect of vacc<strong>in</strong>ation aga<strong>in</strong>st<br />
gonadotroph<strong>in</strong>-releas<strong>in</strong>g hormone, us<strong>in</strong>g Improvac®, on growth performance, body composition, behaviour<br />
and acute phase prote<strong>in</strong>s. Livest Prod Sci 132, 53-59.<br />
Pfizer Animal Health, 2011. Environmental Product Declaration of Improvac (N° S-P-00261). The EPD<br />
International System.<br />
676
GROUP 1, SESSION A: ANIMAL PRODUCTION SYSTEMS 8 th Int. Conference on <strong>LCA</strong> <strong>in</strong> the<br />
Agri-<strong>Food</strong> Sector, 1-4 Oct <strong>2012</strong><br />
Figure 1. The most relevant contributors to the Carbon Footpr<strong>in</strong>t Indicator of the Improvac® system.<br />
677
GROUP 1, SESSION A: ANIMAL PRODUCTION SYSTEMS 8 th Int. Conference on <strong>LCA</strong> <strong>in</strong> the<br />
Agri-<strong>Food</strong> Sector, 1-4 Oct <strong>2012</strong><br />
678<br />
19. Emergy and life-cycle susta<strong>in</strong>ability of pig meat products<br />
Bened<strong>et</strong>to Rugani 1,* , Elena Neri 2 , Valent<strong>in</strong>a Niccolucci 3 , Federico M. Pulselli 3 , Simone Bastianoni 2<br />
1 Environmental evaluation & management, Public Research Centre Henri Tudor (CRPHT) - Resource Centre<br />
for Environmental, Technologies (CRTE) 66, rue de Luxembourg - P.B. 144, L-4002, Esch-sur-Alz<strong>et</strong>te,<br />
Luxembourg, 2 Ecodynamics Group, Dept. of Chemistry, University of Siena. via A. Moro, 2 – 53100 Siena<br />
– Italy, 3 Ecodynamics Group, Dept. of Chemistry, University of Siena, via della Diana, 2A – 53100 Siena,<br />
Italy, * Correspond<strong>in</strong>g author. E-mail: bened<strong>et</strong>to.rugani@tudor.lu<br />
The effects of globalisation have <strong>in</strong>evitably an impact on food choices <strong>in</strong> relation to mass produced at low<br />
cost and greater usability at the expense of local products, which are often more expensive but with higher<br />
quality. One of these examples is represented by the meat of C<strong>in</strong>ta Senese, which is a typical pig race of the<br />
rural area of Siena, Italy. The breed<strong>in</strong>g and production of this race is very different from that of the <strong>in</strong>tensive<br />
white race (Large White). Indeed, C<strong>in</strong>ta Senese is reared <strong>in</strong> an almost compl<strong>et</strong>ely natural way, with<strong>in</strong> forests<br />
and usually without us<strong>in</strong>g <strong>in</strong>dustrial fodder (Bass<strong>et</strong>-Mens <strong>et</strong> al., 2006). The aim of this work is to assess the<br />
susta<strong>in</strong>ability of pig meat products by explicitly focus<strong>in</strong>g on the breed<strong>in</strong>g phase. We have compared the two<br />
races through the application of Life Cycle Assessment (<strong>LCA</strong>) and eMergy analyses. In this connection,<br />
eMergy (Odum, 1996) is considered to be complementary to <strong>LCA</strong> allow<strong>in</strong>g for a broad assessment of resource<br />
consumptions and also of social and economic issues (Rugani <strong>et</strong> al., 2011). As shown <strong>in</strong> Fig.1, the<br />
application of <strong>LCA</strong> highlights that the production of 1 kg of C<strong>in</strong>ta Senese meat has lower potential impacts<br />
than the production of Large White with<strong>in</strong> a s<strong>et</strong> of impact categories considered (i.e. climate change, acidification<br />
and eutrophication). Indeed the production of 1 kg of C<strong>in</strong>ta Senese pig has a potential climate change<br />
impact of 2.25 kg CO2eq, while for Large White is 3.6 kg CO2eq (Fig.1). A greater discrepancy is observed<br />
on the potential impact related to acidification (0.016 kg SO2eq for C<strong>in</strong>ta Senese and 0.045 kg SO2 eq for<br />
Large White), while similar scores are depicted for the potential impact on eutrophication (around 0.23 kg<br />
NO3eq). Fertilisers, water and agricultural mach<strong>in</strong>ery operations, used for fodder production, are the ma<strong>in</strong><br />
responsible of all environmental impacts <strong>in</strong> C<strong>in</strong>ta Senese rear<strong>in</strong>g system. On the other hand, results from<br />
eMergy evaluation show that C<strong>in</strong>ta Senese is less efficient than the White race <strong>in</strong> terms of yield. In fact, the<br />
specific eMergy of C<strong>in</strong>ta Senese was about 3.5 times greater than that of Large White: 7.53E+09 seJ/g and<br />
2.57E+09 seJ/g respectively, this is pr<strong>in</strong>cipally due to the rear<strong>in</strong>g system. Dur<strong>in</strong>g one year of growth, C<strong>in</strong>ta<br />
Senese liv<strong>in</strong>g pig weighs 110 kg while Large White 140 kg and the available space for each head is<br />
12.00E+03 m 2 /head vs 0.23E+03 m 2 /head, respectively. Emergy evaluation highlights that the production<br />
system of C<strong>in</strong>ta Senese, due to the large use of renewable and local resources, generates less direct and <strong>in</strong>direct<br />
environmental impacts than the Large White breed<strong>in</strong>g (the percent of renewability is 21.03 and 2.15<br />
respectively). The “mon<strong>et</strong>ary” value of renewable (R) and non-renewable (N) emergy flows, created by giv<strong>in</strong>g<br />
a price to the local environmental eMergy, is 9.80E+03 seJ/€ for C<strong>in</strong>ta Senese and 8.78E+03 seJ/€ for<br />
Large White. Results highlight higher relative contributions of labour for the production of C<strong>in</strong>ta Senese,<br />
demonstrat<strong>in</strong>g the wider relevance of direct human resources for this extensive system. The present study<br />
po<strong>in</strong>ts out that it is possible to discuss the three fundamental pillars at the base of the susta<strong>in</strong>ability concept<br />
(environment, soci<strong>et</strong>y and economy) by us<strong>in</strong>g eMergy comb<strong>in</strong>ed with a life cycle <strong>in</strong>ventory. Emergy evaluation<br />
emphasised the peculiarities of the C<strong>in</strong>ta Senese system, <strong>in</strong> comparison to a conventional pig breed<strong>in</strong>g<br />
system of White race pigs, and the importance of the local ecosystem for the entire process dynamics.<br />
References<br />
Bass<strong>et</strong>-Mens, C., van der Werf, H.M.G., Durand, P., L<strong>et</strong>erme Ph., 2006. Implications of Uncerta<strong>in</strong>ty and<br />
Variability <strong>in</strong> the Life Cycle Assessment of Pig Production Systems. Int. J. Life Cycle Assess. 11, 298-<br />
304.<br />
Dalgaard, R., 2007. The Environmental Impact of Pork Production from a Life Cycle Perspective. Ph.D.<br />
thesis, Aalborg University, Denmark.<br />
Gu<strong>in</strong>èe, J. B., Gorreèe, M., Heijungs, R., Huppes, G., Kleijn, R., de Kon<strong>in</strong>g, A., van Oers, L., Wegener<br />
Sleeswijk, A., Suh, S., Udo de Haes, H. A., de Bruijn, H., van Du<strong>in</strong>, R., Huijbregts, M. A., 2001. Handbook<br />
on Life Cycle Assessment. Operational Guide to the ISO standards, Kluwer Academic Publisher:<br />
Dordrecht, The N<strong>et</strong>herlands.<br />
Odum, H.T., 1996. Environmental Account<strong>in</strong>g: Emergy and Environmental Decision Mak<strong>in</strong>g. Wiley &<br />
Sons, New York, USA.
GROUP 1, SESSION A: ANIMAL PRODUCTION SYSTEMS 8 th Int. Conference on <strong>LCA</strong> <strong>in</strong> the<br />
Agri-<strong>Food</strong> Sector, 1-4 Oct <strong>2012</strong><br />
Rugani, B., Pulselli, F.M., Niccolucci, V., 2011. Emergy Assessment of C<strong>in</strong>ta Senese Breed<strong>in</strong>g and Comparison<br />
with Conventional Pig Production, <strong>in</strong>: Emergy Synthesis 6. Theory and Applications of the<br />
Emergy M<strong>et</strong>hodology. The Center for Environmental Policy, Ga<strong>in</strong>esville, USA, pp. 347-358.<br />
Figure 1. Results comparison of impact characterisation for the production of C<strong>in</strong>ta Senese and Large White<br />
(LW data source: Dalgaard <strong>et</strong> al. (2007); reference = 1 kg live pigs). Life Cycle Inventory (LCI) & Life Cycle<br />
Impact Assessment (LCIA) elaborated us<strong>in</strong>g SimaPro 7. Impact characterisation performed us<strong>in</strong>g<br />
CML2001 m<strong>et</strong>hod, as proposed by Gu<strong>in</strong>èe <strong>et</strong> al. (2001).<br />
679
GROUP 1, SESSION A: ANIMAL PRODUCTION SYSTEMS 8 th Int. Conference on <strong>LCA</strong> <strong>in</strong> the<br />
Agri-<strong>Food</strong> Sector, 1-4 Oct <strong>2012</strong><br />
680<br />
20. Life cycle assessment of an <strong>in</strong>tensive Iberian pig farm<br />
Joel Gonzàlez * , Aitana Santamaria, Emma Fàbrega, Joan Tibau, Assumpció Antón<br />
IRTA, Research & Technology, <strong>Food</strong> & Agriculture, Spa<strong>in</strong>,<br />
joel.gonzalez@irta.cat<br />
Correspond<strong>in</strong>g author. E-mail:<br />
Iberian pig production has been a major livestock practice <strong>in</strong> Spa<strong>in</strong> for a long time, offer<strong>in</strong>g meat products<br />
dest<strong>in</strong>ed to a niche mark<strong>et</strong> which demands a high sensory quality. Nowadays the most extended system is the<br />
<strong>in</strong>tensive production of the crossbred Iberian x Duroc, reared dur<strong>in</strong>g at least 10 months of age and slaughtered<br />
at approximately 150 kg live weight.. The recent unfavourable economic situation and <strong>in</strong>crease <strong>in</strong> feed<br />
price has resulted <strong>in</strong> the clos<strong>in</strong>g at some farms, push<strong>in</strong>g them to improve their efficiency us<strong>in</strong>g the resources.<br />
With<strong>in</strong> this benchmark, an evaluation of the efficiency of the system is needed to assess farm<strong>in</strong>g viability by<br />
means of standardised tools. One of the ma<strong>in</strong> pillars of this efficiency is environmental impact, which was<br />
estimated by a Life Cycle Assessment <strong>in</strong> the present study, to be considered <strong>in</strong> an <strong>in</strong>tegrated susta<strong>in</strong>ability<br />
evaluation. The results should d<strong>et</strong>erm<strong>in</strong>e weaknesses and strengths of the system, as well as numerical<br />
scores, which could be used as consumer <strong>in</strong>formation.<br />
A representative closed cycle farm of Iberian pig production (Iberian x Duroc) located <strong>in</strong> Catalonia (Alt Empordà)<br />
was selected for the study. It has capacity for 450 sows, 1,120 pigl<strong>et</strong>s and 3,000 fatteners. One 150 kg<br />
pig at the farm gate was chosen as a functional unit. The system boundary is def<strong>in</strong>ed up to the farm gate,<br />
consider<strong>in</strong>g waste disposal, but not consider<strong>in</strong>g post stages such as slaughter<strong>in</strong>g or commercialisation. Impact<br />
categories selected were midpo<strong>in</strong>t impact categories def<strong>in</strong>ed by the CML (Gu<strong>in</strong>ée, <strong>et</strong> al., 2002).<br />
Primary data were obta<strong>in</strong>ed from the representative farm object of the study. ECOGAN software from the<br />
Agriculture Department (MARM, 2011) was used to calculate the NH3, NO2 and CH4 emissions and the<br />
resources used with<strong>in</strong> each production stage. Secondary data were obta<strong>in</strong>ed from Eco<strong>in</strong>vent database. Orig<strong>in</strong><br />
of feed <strong>in</strong>gredients was based on data from cereal producers <strong>in</strong> Spa<strong>in</strong>. It was assumed that soybean came<br />
from Brazil. The software used for the assessment was the SimaPro version 7.2 (PRé Consultants, 2010),<br />
perform<strong>in</strong>g the compulsory phases of classification and characterisation. For the whole closed cycle, data<br />
were collected from the different production stages <strong>in</strong>clud<strong>in</strong>g gestation, lactation, rear<strong>in</strong>g and fatten<strong>in</strong>g, they<br />
were considered as a part of the foreground (Fig. 1).<br />
Table 1 shows the absolute values for each environmental impact category for a 150 kg pig and related to 1<br />
kg of meat. It is important to bear <strong>in</strong> m<strong>in</strong>d that an Iberian pig is less efficient than conventional pigs with<br />
regard to its conversion rate, and this elevates the values of the impacts because they consume more feed.<br />
Therefore it would be <strong>in</strong>terest<strong>in</strong>g to relate the impacts not only to kg of meat, but also to other quality <strong>in</strong>dexes<br />
such as the percentage of <strong>in</strong>tramuscular fat.<br />
Crop and feed production, <strong>in</strong>clud<strong>in</strong>g gra<strong>in</strong> and soybean production needed for their manufacture, were shown<br />
to be the ma<strong>in</strong> environmental constra<strong>in</strong>s for impact categories such as eutrophication, air acidification and<br />
climate change, while the use of energy with<strong>in</strong> maternity contributed to a larger extent to impacts related to<br />
energy consumption, such as abiotic depl<strong>et</strong>ion.<br />
This study also provides <strong>in</strong>formation for the ma<strong>in</strong> drawbacks regard<strong>in</strong>g the application of the m<strong>et</strong>hodology<br />
and will therefore need further research, especially if it is to be used <strong>in</strong> environmental communication or<br />
labels. Ma<strong>in</strong> drawbacks can be summarised as: lack of local datas<strong>et</strong>s to be used <strong>in</strong> the background system;<br />
agreement and homogenisation among models used <strong>in</strong> the emission factors estimation, as well as emissions<br />
related to land use for imported feeds; consideration of nutritional qualities as functional units <strong>in</strong>stead of<br />
meat quantity.<br />
References<br />
Eco<strong>in</strong>vent, 2010. eco<strong>in</strong>vent Data v2.2. Swiss Centre for Life Cycle Inventories.<br />
Gu<strong>in</strong>ée, J. B., Gorrée, M., Heijungs, R., Huppes, G., R., K., de Kon<strong>in</strong>g, A., Wegener Sleeswijk A., Suh, S.,<br />
Udo de Haes, H., Bruijn, H., Du<strong>in</strong>, R. v. and Huijbregts, M. A. J., (2002). Handbook on life cycle assessment.<br />
Operational guide to the ISO standards. Dordrecht, The N<strong>et</strong>herlands. Kluwer.<br />
MARM, 2011. ECOGAN 2009.0.0 Software. Spa<strong>in</strong>.<br />
PRé Consultants, 2010. SimaPro 7.2. Amersfoort. The N<strong>et</strong>herlands.
GROUP 1, SESSION A: ANIMAL PRODUCTION SYSTEMS 8 th Int. Conference on <strong>LCA</strong> <strong>in</strong> the<br />
Agri-<strong>Food</strong> Sector, 1-4 Oct <strong>2012</strong><br />
Figure 1. Flowchart of a representative closed cycle farm of <strong>in</strong>tensive Iberian x Duroc pig production <strong>in</strong><br />
Spa<strong>in</strong>.<br />
Table 1. The environmental impacts of pig production expressed per pig unit and kg pork.<br />
per pig unit per 1 kg<br />
Impact category Units (150 kg) pork<br />
Air Acidification kg SO2 eq 5.05 0.03<br />
Global warm<strong>in</strong>g kg CO2 eq 910.6 6.07<br />
Abiotic depl<strong>et</strong>ion kg Sb eq 2.56 0.02<br />
Eutrophication<br />
kg PO4 3-<br />
eq<br />
6.91 0.05<br />
Photochemical oxidant<br />
formation<br />
kg C2H4 0.79 0.005<br />
Freshwater Toxicity<br />
kg 1,4-DB<br />
eq<br />
82.21 0.55<br />
Human Toxicity<br />
kg 1,4-DB<br />
eq<br />
349.8 2.33<br />
Terrestrial Toxicity<br />
kg 1,4-DB<br />
eq<br />
2.60 0.02<br />
681
GROUP 1, SESSION A: ANIMAL PRODUCTION SYSTEMS 8 th Int. Conference on <strong>LCA</strong> <strong>in</strong> the<br />
Agri-<strong>Food</strong> Sector, 1-4 Oct <strong>2012</strong><br />
21. Comparison of environmental impacts of corn or sorghum as geese<br />
feed <strong>in</strong> foie gras production<br />
Julien Arroyo 1,3 , Laurence Fortun-Lamothe 1,* , Ala<strong>in</strong> Auvergne 1 , Jean-Pierre Dubois 3 , Joël Aub<strong>in</strong> 2<br />
1 INRA, INPT ENSAT, INPT ENVT, UMR 1289 Tissus Animaux, Nutrition, Digestion, Ecosystème <strong>et</strong><br />
Métabolisme, F-31326 Castan<strong>et</strong>-Tolosan Cedex, <strong>France</strong>, 2 INRA, Agrocampus Rennes, UMR1069, Sol<br />
Agronomie Spatialisation, 65 rue de Sa<strong>in</strong>t Brieuc, CS 84215, F-35042 Rennes Cedex, <strong>France</strong> , 3 ASSEL-<br />
DOR, Station d'expérimentation appliquée <strong>et</strong> de démonstration sur l'oie, La Tour de Glane, 24420 Coulaures.<br />
, Correspond<strong>in</strong>g author. E-mail: laurence.lamothe@toulouse.<strong>in</strong>ra.fr<br />
Innovations are needed to improve the susta<strong>in</strong>ability of livestock production systems, i.e. to reduce their<br />
environmental impacts while ma<strong>in</strong>ta<strong>in</strong><strong>in</strong>g or <strong>in</strong>creas<strong>in</strong>g their economic viability. The feed represents the<br />
greatest part of the economic and environmental costs of poultry rear<strong>in</strong>g (Boggia <strong>et</strong> al., 2010). Therefore,<br />
chang<strong>in</strong>g feed<strong>in</strong>g practices, i.e. the choice of raw materials, seems one of the promis<strong>in</strong>g ways. Raw materials<br />
should be chosen accord<strong>in</strong>g to their environmental impacts and availability. To <strong>in</strong>crease the number of raw<br />
materials usable improves the flexibility of systems, limit<strong>in</strong>g the reliance on price fluctuat<strong>in</strong>g products. The<br />
feed<strong>in</strong>g of waterfowl <strong>in</strong> the production of “foie gras” is based <strong>in</strong> large part on corn as an energy source dur<strong>in</strong>g<br />
both the rear<strong>in</strong>g and the overfeed<strong>in</strong>g periods. Sorghum (Sorghum bicolor) has been chosen to substitute<br />
corn <strong>in</strong> “foie gras” production. Indeed, this cereal has similar nutritional characteristics to corn’s ones (Sauvant<br />
<strong>et</strong> al., 2004), but is more drought-resistant. Thus, it is an <strong>in</strong>terest<strong>in</strong>g candidate to reduce the vulnerability<br />
of French agriculture to the water shortage risk (Amigues <strong>et</strong> al., 2006), by reduc<strong>in</strong>g the need of irrigation.<br />
Arroyo <strong>et</strong> al. (<strong>2012</strong>) showed that sorghum could be used as goose feed dur<strong>in</strong>g grow<strong>in</strong>g-f<strong>in</strong>ish<strong>in</strong>g period (GF<br />
period) and dur<strong>in</strong>g overfeed<strong>in</strong>g period (O period) of “foie gras” production. The aim of this work was to<br />
evaluate with <strong>LCA</strong> m<strong>et</strong>hod, the environmental impacts of the effects of substitution of corn by sorghum dur<strong>in</strong>g<br />
GF and O periods on “foie gras” production. Attributional <strong>LCA</strong> was conducted on different scenarios of<br />
partial and total substitution of corn by sorghum, based on experimental data (Arroyo <strong>et</strong> al., <strong>2012</strong>) and the<br />
runn<strong>in</strong>g on average goose farms. Eco<strong>in</strong>vent was used as the source of secondary data, but specific data were<br />
generated for corn, sorghum and goose productions. The impact categories were calculated us<strong>in</strong>g ma<strong>in</strong>ly<br />
CML2 m<strong>et</strong>hod: eutrophication (EP, kg PO4- eq.), climate change (CC, kg CO2 eq.), acidification potential<br />
(AP, kg SO2 eq.), terrestrial ecotoxicity (TE, kg 1.4- DCB eq.), cumulative energy demand (CED, MJ), water<br />
use (WU, m 3 ) and land occupation (LO, m 2 per year). The functional unit was 1kg of "foie gras”. The<br />
impact calculation was conducted us<strong>in</strong>g SimaPro_ 7.2 software and mass allocation approach. 1kg of “foie<br />
gras” from geese fed with sorghum as the only cereal dur<strong>in</strong>g both GF and O periods <strong>in</strong>duced lower environmental<br />
impacts than the “foie gras” from the corn fed geese (i.e.: CC: 1,323 vs. 1,471 kg CO2-eq respectively).<br />
For all the impacts, the highest values were observed for 1kg of “foie gras” from geese fed with sorghum<br />
dur<strong>in</strong>g the G period, due to higher bird mortality dur<strong>in</strong>g O period (1,623 kg CO2-eq). Us<strong>in</strong>g sorghum<br />
dur<strong>in</strong>g the O period only did not affect the environmental impacts compared to the use of corn (1,427 kg<br />
CO2-eq). Present results suggested that total substitution of corn by sorghum <strong>in</strong> goose di<strong>et</strong> offers <strong>in</strong>terest<strong>in</strong>g<br />
perspectives for more susta<strong>in</strong>able feed<strong>in</strong>g strategy <strong>in</strong> the production of “foie gras”.<br />
References<br />
Amigues, J.P., Debaeke, P., Itier, B., Lemaire, G., Segu<strong>in</strong>, B., Tardieu, F., Thomas, A. 2006. Sécheresse <strong>et</strong><br />
agriculture. Réduire la vulnérabilité de l’agriculture à un risque accru de manque d’eau. Expertise scientifique<br />
collective, synthèse du rapport, INRA (<strong>France</strong>), 72pp.<br />
Arroyo, J., Auvergne, A., Dubois, J.P., Bijja, M., Lavigne, F., Fortun-Lamothe, L., <strong>2012</strong>. Influence of feed<strong>in</strong>g<br />
sorghum on the growth, gizzard development and carcass traits of grow<strong>in</strong>g geese. Animal (<strong>in</strong> press)<br />
Boggia, A., Paolotti, L., Castell<strong>in</strong>i, C., 2010. Environmental impact evaluation of conventional, organic and<br />
organic-plus poultry production systems us<strong>in</strong>g life cycle assessment. World’s Poultr. Sci. J. 66, 95-114.<br />
Sauvant, D., Perez, J.M., Tran, G., 2004. Tables of composition and nutritive value of feed materials: pigs,<br />
poultry, cattle, sheep, goats, rabbits, horses, fish. eds INRA Editions, Paris and Wagen<strong>in</strong>gen Academic<br />
Publishers, The N<strong>et</strong>herlands. 304pp.<br />
682
GROUP 1, SESSION A: ANIMAL PRODUCTION SYSTEMS 8 th Int. Conference on <strong>LCA</strong> <strong>in</strong> the<br />
Agri-<strong>Food</strong> Sector, 1-4 Oct <strong>2012</strong><br />
22. Nitrogen content allocation to handle co-products <strong>in</strong> livestock<br />
systems – case study on a poultry supply cha<strong>in</strong><br />
Alexandre Thevenot 1,* , Jonathan Vayssières 2 , Joel Aub<strong>in</strong> 3 , Emmanuel Tillard 1<br />
1 CIRAD Sa<strong>in</strong>t-Pierre, Reunion Island, <strong>France</strong>, 2 CIRAD Dakar, Senegal, 3 INRA UMR SAS, Rennes,<br />
<strong>France</strong>, Correspond<strong>in</strong>g author. E-mail: alexandre.thevenot@cirad.fr<br />
In food sectors processes along the life cycle of a product can be multifunctional. ISO standards for Life<br />
Cycle Assessment specify rules <strong>in</strong> order to allocate the environmental burden b<strong>et</strong>ween co-products. First<br />
recommendation is to avoid allocation with subdivision or system expansion. However when it is not possible,<br />
emissions and raw materials consumption allocation must reflect the physical relationship b<strong>et</strong>ween<br />
products. Usually economic, mass or gross energy content allocation rules are used. But several problems<br />
rema<strong>in</strong> for agricultural productions: economic allocation is highly sensitive to mark<strong>et</strong> fluctuations and mass<br />
and gross energy content allocations could lead to counter-<strong>in</strong>tuitive results. Co-products may <strong>in</strong>deed weight<br />
or conta<strong>in</strong> more energy than the product under study itself. For these po<strong>in</strong>ts, allocation has always been considered<br />
as one of the most controversial issues <strong>in</strong> <strong>LCA</strong> and particularly for agricultural systems (Audsley <strong>et</strong><br />
al., 1997).<br />
Livestock productions are highly multifunctional (e.g. dairy farm<strong>in</strong>g produces milk, meat, and manure). In<br />
<strong>in</strong>dustrialised countries, its ma<strong>in</strong> function is the provision of prote<strong>in</strong>s for human di<strong>et</strong> and its major environmental<br />
problems are l<strong>in</strong>ked to high nitrogen (N) losses occurr<strong>in</strong>g dur<strong>in</strong>g manure management. For these reasons,<br />
we proposed <strong>in</strong> this study to compare results obta<strong>in</strong>ed with allocation rule based on product’s nitrogen<br />
content with other classical allocation rules (Mass and economic allocation and economic allocation with<br />
system expansion to manure use). Effects of these different allocation rules were applied on a poultry supply<br />
cha<strong>in</strong> <strong>in</strong> La Réunion (French Tropical Island). Allocation is applied at different production stages: i) breeders<br />
rear<strong>in</strong>g where co-products are breeders and litter, ii) layer production with hatch<strong>in</strong>g eggs, cull animals and<br />
unfertilised eggs, iv) broiler production with broiler and litter, v) slaughterhouse vi) Inc<strong>in</strong>eration plant with<br />
production of feathers and blood meal as fertiliser and wastes management. For economic allocation we use<br />
the product price at process level. Manure price was estimated by on farm surveys. For system expansion,<br />
poultry litter was <strong>in</strong> this case replaced by m<strong>in</strong>eral fertiliser which is imported from ma<strong>in</strong>land <strong>France</strong> over ten<br />
thousand kilom<strong>et</strong>res. The functional unit was def<strong>in</strong>ed as one tonne of chicken carcass at slaughterhouse gate.<br />
System boundaries are shown <strong>in</strong> Fig. 1. <strong>LCA</strong> was performed us<strong>in</strong>g CML 2 Basel<strong>in</strong>e 2000 for Global Warm<strong>in</strong>g<br />
(GW), Energy Use (EU), Acidification Potential (AP) and Eutrophication Potential (EP) impact categories,<br />
and Cumulative Energy Demand m<strong>et</strong>hod v1.08, all implemented <strong>in</strong> Simapro Software.<br />
Impacts categories were significantly sensitive to the allocation rule (Fig. 2). Economic allocation leads to<br />
higher impact over all categories. System expansion reduced by 10% GW and EU and 5% EP and AP. Nitrogen<br />
content and mass allocation show results around 25% and 30% lower than economic allocation respectively.<br />
Most of differences were observed at farm<strong>in</strong>g stage with manure management.<br />
Manure management patterns could differ a lot with<strong>in</strong> a same territory that it is often difficult to establish a<br />
reasonable cost for economic allocation. Mass allocation has to be avoided because litter weight highly depends<br />
on moisture content. System expansion is not recommended <strong>in</strong> this case because of additionally maritime<br />
transport burden. Nitrogen content allocation seems to be an <strong>in</strong>terest<strong>in</strong>g option for livestock production<br />
environmental assessment and is <strong>in</strong> the range of other allocation rules. F<strong>in</strong>ally, the choice of allocation rule<br />
for agricultural systems always depends on the manure value <strong>in</strong> the given system. Us<strong>in</strong>g this allocation rule,<br />
poultry litter takes however a high part of environmental burden of meat production, which seems consistent<br />
regard<strong>in</strong>g its high value all over the world.<br />
References<br />
Audsley, A., <strong>et</strong> al., 1997. Harmonisation of environmental life cycle assessment for agriculture. F<strong>in</strong>al report,<br />
Concerted Action AIR3-CT94-2028. European Commission DG VI, Brussels, Belgium.<br />
Gu<strong>in</strong>ée, J.B., <strong>et</strong> al., 2002. Handbook on Life Cycle Assessment. An Operational Guide to the ISO Standards.<br />
Kluwer Academic Publishers, Dordrecht, The N<strong>et</strong>herlands.<br />
ISO, 2006. ISO 14040—Environmental management—life cycle assessment—pr<strong>in</strong>ciples and framework.<br />
International Organisation for Standardisation, Geneva.<br />
683
GROUP 1, SESSION A: ANIMAL PRODUCTION SYSTEMS 8 th Int. Conference on <strong>LCA</strong> <strong>in</strong> the<br />
Agri-<strong>Food</strong> Sector, 1-4 Oct <strong>2012</strong><br />
Figure 1. System boundaries for a cradle to slaughterhouse gate for 1 ton of broiler packed ready for transport<br />
Figure 2. Results of impact assessment for 1 ton of broiler packed depend<strong>in</strong>g on the chosen allocation<br />
m<strong>et</strong>hod<br />
684<br />
Ressources<br />
(Extraction, transformation, transport)<br />
Raw materials Energy Transport<br />
Breeders<br />
rear<strong>in</strong>g<br />
Layer<br />
Litter<br />
Managment<br />
Asia<br />
Rice<br />
Hatcher<strong>in</strong>g<br />
Argent<strong>in</strong>a<br />
Soybean<br />
Animal Feed<br />
Factory<br />
Rear<strong>in</strong>g<br />
<strong>France</strong><br />
Maize, wheat, barley,<br />
rapeseed, m<strong>in</strong>erals<br />
Slaughter<strong>in</strong>g<br />
Packag<strong>in</strong>g Shipp<strong>in</strong>g<br />
Inc<strong>in</strong>eration<br />
1 ton<br />
broiler<br />
packed
GROUP 1, SESSION A: ANIMAL PRODUCTION SYSTEMS 8 th Int. Conference on <strong>LCA</strong> <strong>in</strong> the<br />
Agri-<strong>Food</strong> Sector, 1-4 Oct <strong>2012</strong><br />
23. Influence of allocation m<strong>et</strong>hods and system boundaries <strong>in</strong> <strong>LCA</strong> of<br />
broiler production<br />
Edivan Cherub<strong>in</strong>i 1,* , Vamilson Prudêncio da Silva Junior 2 , Sebastião Roberto Soares 1 , Marco Antônio<br />
Santos 3<br />
1 Universidade Federal de Santa Catar<strong>in</strong>a, Florianópolis, Brazil, 2 Empresa de Pesquisa Agropecuária e Extensão<br />
Rural de Santa Catar<strong>in</strong>a, Florianópolis, Brazil, 3 Eng. Agrônomo - Especialista em Gestão Ambiental<br />
Agro<strong>in</strong>dustrial, Brazil, Correspond<strong>in</strong>g author. E-mail: cherub<strong>in</strong>i@ens.ufsc.br<br />
Although life cycle assessment is regulated by the ISO 14040 series, there are still several issues, such as<br />
described by Reap <strong>et</strong> al. (2008), <strong>in</strong> an <strong>LCA</strong> study that might generate questions and discussions. Def<strong>in</strong>itions<br />
as system boudaries or allocation for example, which may <strong>in</strong>duce to a mislead<strong>in</strong>g comparison b<strong>et</strong>ween <strong>LCA</strong><br />
studies. To develop this study we evaluated the broilers production <strong>in</strong> southern Brazil, rang<strong>in</strong>g the composition<br />
of the chicken di<strong>et</strong> <strong>in</strong> two scenarios: (i) feeds with use of by-products derived <strong>in</strong> the abattoir process<br />
(animal orig<strong>in</strong>), and (ii) substitution of by-products by an <strong>in</strong>crease of soybeans (veg<strong>et</strong>able broiler). First were<br />
evaluated the broiler with the system boundary compris<strong>in</strong>g the extraction of raw materials used for grow<strong>in</strong>g<br />
gra<strong>in</strong> <strong>in</strong> the di<strong>et</strong> of chickens to the farm gate, and then were expanded the boundaries to the port for export,<br />
<strong>in</strong>clud<strong>in</strong>g the slaughter<strong>in</strong>g process. This change <strong>in</strong> the boundaries makes necessary the use of allocations<br />
m<strong>et</strong>hods <strong>in</strong> the abattoir stage which depend<strong>in</strong>g of the adopted procedure adds high sensitivity <strong>in</strong> the f<strong>in</strong>al<br />
<strong>LCA</strong> results. Luo <strong>et</strong> al. (2009) studied the allocation’s <strong>in</strong>fluence <strong>in</strong> <strong>LCA</strong> of <strong>et</strong>hanol from corn and concluded<br />
that the results are highly sensitive to the allocation m<strong>et</strong>hod and a challenge from a scientific po<strong>in</strong>t of view.<br />
Therefore, the aim of this paper is to demonstrate the difference <strong>in</strong> the f<strong>in</strong>al results <strong>in</strong> a product’s <strong>LCA</strong> us<strong>in</strong>g<br />
two different m<strong>et</strong>hods of allocation, mass and economic <strong>in</strong> the veg<strong>et</strong>able broiler, also <strong>in</strong>tend<strong>in</strong>g to demonstrate<br />
the importance of def<strong>in</strong><strong>in</strong>g the system boundaries. For the broiler with animal prote<strong>in</strong> were used the<br />
mass allocation. The functional units were a ton of broilers live weight and a ton of broiler slaughtered, eviscerated<br />
and frozen at the port. The impact categories used for life cycle impact assessment were global<br />
warm<strong>in</strong>g potential from CML 2 basel<strong>in</strong>e 2000 m<strong>et</strong>hod plus the total cumulative energy demand. The results<br />
showed that the broiler feed with chicken by-products (animal prote<strong>in</strong>) has a b<strong>et</strong>ter environmental performance<br />
than the chicken with veg<strong>et</strong>able di<strong>et</strong> (without chicken by-products) for the evaluated impact categories.<br />
When the system boundary is <strong>in</strong>creased for the broiler slaughtered at the port for export, it shows the high<br />
sensitivity of the results depend<strong>in</strong>g on the allocation procedure used <strong>in</strong> the slaughter process the outputs can<br />
either improve as g<strong>et</strong>t<strong>in</strong>g worse the environmental performance of the veg<strong>et</strong>able broiler, as shown <strong>in</strong> Table<br />
01 and Figure 01.<br />
References<br />
Associação Brasileira de Normas Técnicas – ABNT, 2009. NBR ISO 14044 Gestão Ambiental – Avaliação<br />
do ciclo de vida – Requisitos e Orientações. Brasil.<br />
Luo, L., van der Vo<strong>et</strong>, E., Huppes, G., Udo de Haes, H. A., 2009. Allocation issues <strong>in</strong> <strong>LCA</strong> m<strong>et</strong>hodology: a<br />
case study of corn-stover-based fuel <strong>et</strong>hanol. International Journal of Life Cycle Assessment, 14, 529-<br />
539.<br />
Reap, J., Roman, F., Duncan, S., Bras, B., 2008. A survey of unresolved problems <strong>in</strong> life cycle assessment:<br />
Part 1: goal and scope and <strong>in</strong>ventory analysis. International Journal of Life Cycle Assessment, 13, 290-<br />
300.<br />
685
GROUP 1, SESSION A: ANIMAL PRODUCTION SYSTEMS 8 th Table 1. Results for 1 ton of frozen broiler.<br />
Int. Conference on <strong>LCA</strong> <strong>in</strong> the<br />
Agri-<strong>Food</strong> Sector, 1-4 Oct <strong>2012</strong><br />
Broiler with animal Veg<strong>et</strong>able Broiler<br />
Life Cycle<br />
prote<strong>in</strong><br />
(MA) a<br />
Veg<strong>et</strong>able Broiler<br />
(EA) b<br />
GWP c CED d GWP c CED d GWP c CED d<br />
Total maize 39.8 32.6 32.1 26. 39.5 32.6<br />
Total soybeans 34.6 26.8 32.2 25.1 40.2 31.1<br />
Other feed <strong>in</strong>gredients 7.3 14.9 6.3 9.6 8.2 12.1<br />
Feed subtotal 81.6 74.4 70.5 61.0 87.9 75.9<br />
Eggs to hatch 6.3 8.5 5.4 7.2 6.4 8.6<br />
Day-old chicks 0.4 0.8 0.4 0.1 0.5 0.8<br />
Live poultry 17.4 22.5 15.1 19.6 17.5 22.6<br />
Livestock transportation 3.3 4.6 2.5 3.7 3.3 4.7<br />
Slaughter 3.5 7.7 3.2 6.5 3.5 7.7<br />
Packag<strong>in</strong>g 1.4 4.9 1.4 4.9 1.4 4.9<br />
Total 113.9 123.3 98.6 103.2 120.5 125.0<br />
Avoided fertiliser 13.9 23.3 11.5 19.3 14.1 23.7<br />
Total 100.0 100.0 87.1 83.9 106.4 101.3<br />
a b c d<br />
Mass allocation., Economic allocation., Global Warm<strong>in</strong>g Potential, <strong>in</strong>%., Cumulative Energy Demand,<br />
<strong>in</strong>%.<br />
%<br />
Figure 2. Comparison of CO2 eq emissions of 1 ton of frozen broiler, <strong>in</strong>%. Consider<strong>in</strong>g the scenario of<br />
Broiler with animal prote<strong>in</strong> as base of comparison, show<strong>in</strong>g the difference <strong>in</strong> the results of the veg<strong>et</strong>able<br />
broiler with the allocations m<strong>et</strong>hods applied.<br />
686<br />
140<br />
120<br />
100<br />
80<br />
60<br />
40<br />
20<br />
0<br />
-20<br />
Global Warm<strong>in</strong>g Potential(GWP100)<br />
100<br />
(113,9-13,9)<br />
Broiler with animal<br />
prote<strong>in</strong><br />
87,1<br />
(98,6-11,5)<br />
Veg<strong>et</strong>able Broiler<br />
(MA)<br />
Veg<strong>et</strong>able Broiler<br />
(EA)<br />
106,4<br />
(120,5-14,1)<br />
Maize<br />
Soybeans<br />
Feed Other Ingredients<br />
Chicks<br />
Live Poultry<br />
Livestock transportation<br />
Slaughter<br />
Packag<strong>in</strong>g<br />
Fertilizer avoid
GROUP 1, SESSION A: ANIMAL PRODUCTION SYSTEMS 8 th Int. Conference on <strong>LCA</strong> <strong>in</strong> the<br />
Agri-<strong>Food</strong> Sector, 1-4 Oct <strong>2012</strong><br />
24. Reduction of GHG emissions from broilers fed a phytogenic<br />
additive<br />
Stefan Hörtenhuber 1,2,* , Mart<strong>in</strong> Veit 3<br />
1 Research Institute of Organic Agriculture (FiBL) Austria, 2 University of Natural Resources and Life Sciences<br />
Vienna, Department of Susta<strong>in</strong>able Agricultural Systems, 3 Delacon Biotechnik GmbH, Steyregg, Austria,<br />
Correspond<strong>in</strong>g author. E-mail: stefan.hoertenhuber@fibl.org<br />
Mitigation of greenhouse gas (GHG) emissions from broiler production may be achieved by various options,<br />
<strong>in</strong>clud<strong>in</strong>g <strong>in</strong>creased performance, changes <strong>in</strong> di<strong>et</strong>s and adaptations for hous<strong>in</strong>g and litter management<br />
systems (LMS). The overall aim of this study was to analyse GHG emissions from broiler production <strong>in</strong> Austria<br />
<strong>in</strong>clud<strong>in</strong>g a quantification of the impact of feed<strong>in</strong>g the phytogenic feed additive “Biostrong® 510” (BSG;<br />
Delacon Biotechnik GmbH, Steyregg, Austria). M<strong>et</strong>hods and emission factors for calculation of emitted NH3<br />
and GHG are based on IPCC (2006), Anderl <strong>et</strong> al. (2011), and Hörtenhuber <strong>et</strong> al. (2011). The reduc<strong>in</strong>g effect<br />
concern<strong>in</strong>g NH3 emissions is derived from experimental data (Jel<strong>in</strong>ek <strong>et</strong> al. 2004). Performance data and data<br />
on nitrogen excr<strong>et</strong>ion were taken from van Krimpen (2011).<br />
The calculated CO2-equivalents per kg BSG are about 2.0 kg. The <strong>in</strong>clusion of BSG <strong>in</strong> broiler feed (150<br />
ppm) does not <strong>in</strong>crease the feed production-related GHG emissions (less than 0.1%) per ton of feed. Emissions<br />
from the basal di<strong>et</strong> (corn, soybeans, wheat) were found to be the most important drivers for GHG emissions<br />
for broilers (see Fig. 1). It was concluded that GHG emissions per kg live weight could be reduced by<br />
5% (4 to 6%, depend<strong>in</strong>g on the orig<strong>in</strong> and production m<strong>et</strong>hods for feedstuffs and raw materials), if the cornsoy-wheat<br />
di<strong>et</strong> was supplemented with BSG. Accord<strong>in</strong>g to van Krimpen (2011), who analysed 18 comparable<br />
trials with BSG, this reduction is achieved by: (1) Improved digestibility and thus a b<strong>et</strong>ter feed conversion<br />
ratio (contribut<strong>in</strong>g 60% of the reduction), which also results <strong>in</strong> (2) less excr<strong>et</strong>ed nitrogen (responsible<br />
for 20% of the reduction); (3) sapon<strong>in</strong>s <strong>in</strong> BSG directly <strong>in</strong>hibit NH3 formation (Weber <strong>et</strong> al., <strong>2012</strong>; 20% of<br />
reduction). Consider<strong>in</strong>g that the use of this feed additive does not demand for major changes <strong>in</strong> supply cha<strong>in</strong>s<br />
or cost-<strong>in</strong>tensive <strong>in</strong>vestments, the reduction of about 5% of GHG emissions is remarkable. Furthermore, it is<br />
possible to comb<strong>in</strong>e the feed additive’s effect with other mitigation options (e.g. adaptations <strong>in</strong> LMS). The<br />
improved feed conversion and lower mortality (see van Krimpen, 2011) also result <strong>in</strong> a higher profit.<br />
References<br />
Anderl, M., Freudenschuß, A. , <strong>et</strong> al., 2011. Austria's National Inventory Report 2011. Submission under<br />
UNFCC and under the Kyoto Protocol. Vienna, Austria.<br />
Hörtenhuber, S., L<strong>in</strong>denthal, T., Zollitsch, W., 2011. Reduction of greenhouse gas emissions from feed supply<br />
cha<strong>in</strong>s by utiliz<strong>in</strong>g regionally produced prote<strong>in</strong> sources - the case of Austrian dairy production. Journal<br />
of the Science of <strong>Food</strong> and Agriculture 91, 1118-1127.<br />
IPCC (International Panel on Climate Change), 2006. Guidel<strong>in</strong>es for National Greenhouse Gas Inventories.<br />
[Available at www.ipccnggip.iges.or.jp/public/2006gl/<strong>in</strong>dex.html].<br />
Jel<strong>in</strong>ek, A., Děd<strong>in</strong>a, M., Plíva, P., Souček, J., 2004. Research of biological agents effects on reduction of<br />
ammonia concentration <strong>in</strong> stables of <strong>in</strong>tensive farm animals breed<strong>in</strong>g. Res. Agr. Eng., 50(2), 43-53.<br />
van Krimpen, M., 2011. Assess<strong>in</strong>g the effect of the phytogenic feed additive Biostrong® 510 on performance<br />
and ammonia emissions <strong>in</strong> broilers. Confidential report 281. ISSN 1570 - 8616.<br />
Weber, T., Veit, M., Wendler, K.R., Weghuber, J., Högl<strong>in</strong>ger, O., <strong>2012</strong>. Evaluation of ammonia reduction<br />
potential of sapon<strong>in</strong> conta<strong>in</strong><strong>in</strong>g plant materials by measurement of urease <strong>in</strong>hibition. In: Mair, C., Kraft,<br />
M., W<strong>et</strong>scherek, W., Schedle, K. (Eds.), Proc. of the 11 th BOKU-Symposium Tierernährung. Vienna,<br />
Austria, 19 April <strong>2012</strong>. University of Natural Resources and Applied Life Sciences Vienna, Austria. pp.<br />
213-215.<br />
687
GROUP 1, SESSION A: ANIMAL PRODUCTION SYSTEMS 8 th Int. Conference on <strong>LCA</strong> <strong>in</strong> the<br />
Agri-<strong>Food</strong> Sector, 1-4 Oct <strong>2012</strong><br />
Figure 1. GHG emissions per kg of broiler with and without Biostrong® 510 supplementation (kg CO2-eq<br />
per kg of live weight at farm gate before slaughter<strong>in</strong>g).<br />
688
GROUP 1, SESSION A: ANIMAL PRODUCTION SYSTEMS 8 th Int. Conference on <strong>LCA</strong> <strong>in</strong> the<br />
Agri-<strong>Food</strong> Sector, 1-4 Oct <strong>2012</strong><br />
25. Allocation b<strong>et</strong>ween high value co-products from livestock: a case<br />
study from Australian sheep production<br />
Stephen Wiedemann<br />
FSA Consult<strong>in</strong>g, Toowoomba, Queensland, Australia, E-mail: stephen.wiedemann@fsaconsult<strong>in</strong>g.n<strong>et</strong><br />
Much of the Australian sheep <strong>in</strong>dustry is based Mer<strong>in</strong>o sheep, which produce high value wool and also sheep<br />
meat. In contrast to many other sheep produc<strong>in</strong>g regions of the world, wool is the primary product from<br />
Mer<strong>in</strong>o sheep, though sheep meat is also an important and high value co-product. With<strong>in</strong> the meat production<br />
component of the system, two grades of meat are produced; high grade (HG) meat from lambs and low<br />
grade (LG) meat from older cull-for-age (CFA) breed<strong>in</strong>g animals. These co-production issues were <strong>in</strong>vestigated<br />
<strong>in</strong> a ‘farm-gate’ study of Australian sheep production. Handl<strong>in</strong>g of co-products for sheep systems has<br />
been <strong>in</strong>vestigated previously by Eady <strong>et</strong> al. (2011) for an Australian Mer<strong>in</strong>o sheep farm. Eady <strong>et</strong> al. (2011)<br />
<strong>in</strong>vestigated a biophysical allocation process based on partition<strong>in</strong>g the feed consumed by the breed<strong>in</strong>g flock<br />
to either wool or lamb production and an economic allocation process. Impacts were found to be similar<br />
us<strong>in</strong>g either approach. Eady <strong>et</strong> al. (2011) d<strong>et</strong>erm<strong>in</strong>ed that system expansion was difficult to apply to a sheep<br />
system because of the sensitivity around choices with substitution products for the meat. They also noted the<br />
difficulty <strong>in</strong> select<strong>in</strong>g substitution processes for other outputs from the flock such as rams, which are sold for<br />
breed<strong>in</strong>g purposes. All other studies reviewed by the author for sheep production have used economic allocation<br />
to handle wool / sheep meat, though most of these studies have been for production systems where the<br />
wool produced is of low quality, and sheep meat is the primary product. Hence, no study has y<strong>et</strong> applied<br />
system expansion to Mer<strong>in</strong>o sheep production. A similar co-production issue exists <strong>in</strong> the dairy <strong>in</strong>dustry,<br />
where the cow herd produces both milk, calves (that enter the beef production system) and CFA cows (beef).<br />
Two studies (Flysjö <strong>et</strong> al. 2011; Cederberg and Stadig 2003) have specifically <strong>in</strong>vestigated the sensitivity of<br />
m<strong>et</strong>hodology choices around this co-production issue, apply<strong>in</strong>g a vari<strong>et</strong>y of m<strong>et</strong>hods <strong>in</strong>clud<strong>in</strong>g economic<br />
allocation, biophysical allocation and system expansion. Cederberg & Stadig (2003) argue that system expansion<br />
is a logical approach for account<strong>in</strong>g for beef produced <strong>in</strong> dairy systems, because this product directly<br />
enters the beef mark<strong>et</strong> affect<strong>in</strong>g supply and demand. Both Cederberg & Stadig (2003) and Flysjö <strong>et</strong> al.<br />
(2011) note that us<strong>in</strong>g system expansion to handle meat (by substitut<strong>in</strong>g with beef from purpose grown beef<br />
herds) resulted <strong>in</strong> lower environmental burdens for the milk product. Co-production <strong>in</strong> dairy farm<strong>in</strong>g has<br />
some similarities to Mer<strong>in</strong>o sheep production, though sheep meat from Mer<strong>in</strong>o production is more important<br />
than meat from dairy systems <strong>in</strong> terms of total mass of product and economic value.<br />
The aim of the study was to <strong>in</strong>vestigate the sensitivity of co-production decisions by apply<strong>in</strong>g three m<strong>et</strong>hods;<br />
economic allocation, a simplistic biophysical allocation based on the total mass of product, and system expansion.<br />
The farm selected for the study was a small Mer<strong>in</strong>o producer from a high ra<strong>in</strong>fall region <strong>in</strong> New<br />
South Wales. The farm had 1500 ewes produc<strong>in</strong>g 4.1 kg wool / head.yr and 1200 lambs (80% wean<strong>in</strong>g rate).<br />
Allocation b<strong>et</strong>ween HG and LG meat is not unique to sheep production. From a review of the literature, few<br />
beef and pork studies were found that differentiated b<strong>et</strong>ween meat from young animals and older CFA animals.<br />
Allocation b<strong>et</strong>ween these meat products depends on the def<strong>in</strong>ition of product function. The ma<strong>in</strong> differences<br />
b<strong>et</strong>ween HG and LG meat relate to eat<strong>in</strong>g quality factors such as tenderness, meat colour and flavour,<br />
not the nutritional properties (mass of energy, prote<strong>in</strong> <strong>et</strong>c). Hence, if the focus of a study is the provision<br />
of nutrition for human consumption, it is reasonable to group HG and LG meat tog<strong>et</strong>her as they are<br />
functionally comparable. Further to this, the quality factors associated with HG and LG meat are mark<strong>et</strong><br />
specific. For example, some Australian sheep meat mark<strong>et</strong>s (such as the Middle East) prefer LG sheep meat<br />
because the flavour is considered superior to HG meat. Apply<strong>in</strong>g an allocation process (such as economic<br />
allocation) therefore <strong>in</strong>troduces mark<strong>et</strong> preferences and a wide range of quality factors, which need be reflected<br />
<strong>in</strong> the def<strong>in</strong>ition of the functional unit. This study chose to consider meat from HG and LG meat<br />
functionally equivalent, thereby avoid<strong>in</strong>g the need for allocation at this po<strong>in</strong>t.<br />
Co-production of wool (greasy weight) and sheep meat (live weight) was handled us<strong>in</strong>g three approaches;<br />
economic allocation, mass allocation and system expansion. Economic and mass allocation factors are provided<br />
<strong>in</strong> Table 1. The system expansion approach followed a similar approach used <strong>in</strong> the dairy <strong>in</strong>dustry by<br />
Cederberg and Stadig (2003). Meat from Mer<strong>in</strong>o systems enters the lamb and mutton supply cha<strong>in</strong> <strong>in</strong> Australia<br />
where it is considered functionally equivalent (on a nutritional basis) with meat from ‘purpose grown<br />
meat sheep’ flocks. ‘Purpose grown meat sheep’ is used here to describe production systems that focus on<br />
meat production, which tend to use different sheep breeds that produce lower quality wool that has negligible<br />
value. Some purpose grown meat sheep systems produce no saleable wool because breeds have been se-<br />
689
GROUP 1, SESSION A: ANIMAL PRODUCTION SYSTEMS 8 th Int. Conference on <strong>LCA</strong> <strong>in</strong> the<br />
Agri-<strong>Food</strong> Sector, 1-4 Oct <strong>2012</strong><br />
lected that naturally shed their wool each year. Consider<strong>in</strong>g meat from Mer<strong>in</strong>o flocks is not differentiated <strong>in</strong><br />
the meat supply cha<strong>in</strong> (post slaughter), meat from purpose grown meat sheep was considered an appropriate<br />
substitution product.<br />
Comparison of the three m<strong>et</strong>hods showed a four-fold difference <strong>in</strong> greenhouse gas (GHG) emissions for<br />
wool. The system expansion m<strong>et</strong>hod resulted <strong>in</strong> total GHG of 7.6-9.2 kg CO2-e / kg greasy wool. Economic<br />
allocation resulted <strong>in</strong> total GHG of 31.7-33.8 kg CO2-e / kg wool. The simple mass allocation approach resulted<br />
<strong>in</strong> total GHG emissions of 8.1-8.3 kg CO2-e / kg greasy wool, which was similar to the results us<strong>in</strong>g<br />
system expansion. The difference b<strong>et</strong>ween the system expansion and economic allocation results were similar,<br />
though much more pronounced, than the f<strong>in</strong>d<strong>in</strong>gs of Flysjö <strong>et</strong> al. (2011) for dairy production, which<br />
showed system expansion to generate the lowest impacts for the primary product.<br />
Economic allocation was sensitive to annual and cyclical changes <strong>in</strong> the value of wool and sheep meat. This<br />
changed the GHG emissions allocated to wool by ± 30% b<strong>et</strong>ween different years (over a five year period).<br />
While mass allocation is generally not favoured, it has some merit for Mer<strong>in</strong>o systems. Because wool and<br />
meat are closer to a jo<strong>in</strong>t production system than a typical primary product/by-product system, it follows that<br />
the burdens should be allocated <strong>in</strong> a more even manner. Follow<strong>in</strong>g a biological causality approach, wool and<br />
meat are both prote<strong>in</strong> based products that require broadly similar processes with<strong>in</strong> the animal for production.<br />
This offers a simple alternative to system expansion while generat<strong>in</strong>g similar results.<br />
This study concluded that allocation was not required to differentiate b<strong>et</strong>ween HG and LG meat, and highlighted<br />
the sensitivity of allocation processes b<strong>et</strong>ween wool and sheep meat. System expansion offers a useful<br />
approach that reflects the dynamics of the Australian sheep meat mark<strong>et</strong> well, and is considered the most<br />
suitable approach for further research <strong>in</strong> this <strong>in</strong>dustry.<br />
References<br />
Cederberg C & Stadig M. 2003. System expansion and allocation <strong>in</strong> Life Cycle Assessment of milk and beef<br />
production. Int J <strong>LCA</strong> 8 (6) 350-356<br />
Eady, S., Carre, A., Grant, T., 2011. Life cycle assessment modell<strong>in</strong>g of complex agricultural systems with<br />
multiple food and fibre co-products, J. Cleaner Prod. Volume 28, June <strong>2012</strong>, Pages 143–149<br />
Flysjö, A, Cederberg, C, Henriksson, M & Ledgard, S 2011, How does co-product handl<strong>in</strong>g affect the carbon<br />
footpr<strong>in</strong>t of milk? Case study of milk production <strong>in</strong> New Zealand and Sweden, Int. J or <strong>LCA</strong>, vol 16, 420-<br />
430.<br />
Table 1. Co-products and allocation factors for Mer<strong>in</strong>o wool production<br />
Economic<br />
Mass Alloca- Allocation<br />
Products<br />
tion Factors Factors System expansion substitution products<br />
Wool (greasy wool)<br />
kg<br />
14-15% 55-65%<br />
Sheep sales (lamb + 85-86% 35-45% Purpose grown lamb and sheep meat from sheep<br />
mutton – Live weight<br />
meat enterprises. Substitution applied us<strong>in</strong>g a<br />
basis) kg<br />
factor of 95% to account for higher dress<strong>in</strong>g percentage<br />
of purpose grown sheep compared to<br />
Mer<strong>in</strong>os<br />
690
GROUP 1, SESSION A: ANIMAL PRODUCTION SYSTEMS 8 th Int. Conference on <strong>LCA</strong> <strong>in</strong> the<br />
Agri-<strong>Food</strong> Sector, 1-4 Oct <strong>2012</strong><br />
26. How to decrease farmed fish environmental burdens through feed<br />
formulation and feed<strong>in</strong>g management<br />
Assunta Filar<strong>et</strong>o 1,* , Massimo Mar<strong>in</strong>o 1 , Umberto Luzzana 2 , Sonia Pignatelli 1<br />
1 Life Cycle Eng<strong>in</strong>eer<strong>in</strong>g, 2 Skr<strong>et</strong>t<strong>in</strong>g, Correspond<strong>in</strong>g author. E-mail: filar<strong>et</strong>o@studiolce.it<br />
The aim of this work is to quantify improvements <strong>in</strong> farmed fish (European seabass Dicentrarchus labrax<br />
and gilthead seabream Sparus aurata) environmental burdens result<strong>in</strong>g from the application of latest knowhow<br />
<strong>in</strong> feed formulation and feed<strong>in</strong>g management.<br />
Environmental impacts from the whole aquaculture production cha<strong>in</strong> were assessed accord<strong>in</strong>g to the life<br />
cycle assessment (<strong>LCA</strong>) m<strong>et</strong>hodology <strong>in</strong> order to identify critical areas. The present paper reports results <strong>in</strong><br />
terms of greenhouse gases emissions (GWP) and considerations about the reduction of pressure on wild fish<br />
stock.<br />
The <strong>LCA</strong> was performed per 1 kg of farmed fresh fish consider<strong>in</strong>g the whole production cha<strong>in</strong> from hatchery<br />
to fresh fish distribution platform (<strong>in</strong>clud<strong>in</strong>g the raw materials used for feed production). Results from this<br />
study show that the most significant phases <strong>in</strong> terms of GHG emissions are feed production and farm<strong>in</strong>g<br />
(Fig. 1).<br />
On the basis of the results from the <strong>LCA</strong>, critical areas for improvement were identified, and the effects of<br />
possible actions quantified on the basis of practical data from the <strong>in</strong>dustry, with specific reference to the feed<br />
as the ma<strong>in</strong> variable affect<strong>in</strong>g environmental burdens. Our study confirms that FCR improvement (through<br />
the use of nutritionally balanced formulations and careful feed<strong>in</strong>g management) is the most efficient strategy<br />
to reduce environmental burdens (Fig. 2), tog<strong>et</strong>her with flexible use of raw materials. Moreover, improved<br />
FCR, tog<strong>et</strong>her with advanced nutritional know-how and freedom <strong>in</strong> raw materials choice, results <strong>in</strong> reduced<br />
fish meal and fish oil consumption <strong>in</strong> farmed fish production, hence alleviat<strong>in</strong>g pressure on wild fish stocks.<br />
As consumers recognise the importance of susta<strong>in</strong>ability and the need to reduce environmental impacts from<br />
their food, the adoption of strategies such as the ones mentioned above should be promoted <strong>in</strong> specifications<br />
for high-value farmed fish.<br />
References<br />
Jackson, A., 2009. Fish <strong>in</strong>–Fish out ratios expla<strong>in</strong>ed, Aquaculture Europe Vol. 34 (3).<br />
van den Burg S.W.K. <strong>et</strong> al., Environmental performance of wild-caught North Sea whitefish, a comparison<br />
with aquaculture and animal husbandry us<strong>in</strong>g <strong>LCA</strong>, LEI report 2011-090, January <strong>2012</strong>, Project code<br />
2272000225, LEI, part of Wagen<strong>in</strong>gen UR, The Hague.<br />
W<strong>in</strong>ther U., Ziegler F., Skontorp Hognes E., Emanuelsson A., Sund V., Ell<strong>in</strong>gsen H., 2009, Carbon Footpr<strong>in</strong>t<br />
and energy use of Norwegian seafood products, SINTEF Fisheries and Aquaculture.<br />
691
GROUP 1, SESSION A: ANIMAL PRODUCTION SYSTEMS 8 th Int. Conference on <strong>LCA</strong> <strong>in</strong> the<br />
Agri-<strong>Food</strong> Sector, 1-4 Oct <strong>2012</strong><br />
Figure 1. GHG Emissions per kg of fresh fish.<br />
Figure 2. Correlation b<strong>et</strong>ween the feed-consumption ratio (FCR) and GHG emissions.<br />
692
GROUP 1, SESSION A: ANIMAL PRODUCTION SYSTEMS 8 th Int. Conference on <strong>LCA</strong> <strong>in</strong> the<br />
Agri-<strong>Food</strong> Sector, 1-4 Oct <strong>2012</strong><br />
27. A multi-scale m<strong>et</strong>hod for assess<strong>in</strong>g ecological <strong>in</strong>tensification <strong>in</strong><br />
aquaculture systems<br />
Aurélie Wilfart 1,2,* , Jéhane Prudhomme 1,2,3 , Jean-Paul Blanch<strong>et</strong>on 3 , Joël Aub<strong>in</strong> 1,2<br />
1 INRA, UMR1069 Sol Agro <strong>et</strong> hydrosystème Spatialisation, F-35000 Rennes, <strong>France</strong>, 2 AGROCAMPUS<br />
OUEST, F-35000 Rennes, <strong>France</strong>, 3 IFREMER, Laboratoire de Recherche Piscicole de Méditerranée,<br />
Chem<strong>in</strong> de Maguelone, 34250 Palavas-les-Flots, <strong>France</strong>, Correspond<strong>in</strong>g author. E-mail: aurelie.wilfart@rennes.<strong>in</strong>ra.fr<br />
To me<strong>et</strong> the challenges of produc<strong>in</strong>g more while lower<strong>in</strong>g impacts on ecosystems, new farm<strong>in</strong>g systems have<br />
to be designed. To def<strong>in</strong>e development strategies, a multi-scale assessment m<strong>et</strong>hod that estimates the tradeoff<br />
b<strong>et</strong>ween human demand and natural services, as well generates consistent performance <strong>in</strong>dicators on utilisation<br />
of natural resources and environmental emission levels based on the same s<strong>et</strong> of <strong>in</strong>put data is needed.<br />
<strong>LCA</strong> estimates resource use and potential environmental impacts throughout a product’s life cycle at global<br />
and regional scales (ISO, 2006) but does not consider the provision of ecosystem services or products (Ulgiati<br />
<strong>et</strong> al., 2006). Emergy account<strong>in</strong>g (EA) is an ecology-based tool developed to <strong>in</strong>tegrate all system <strong>in</strong>puts<br />
(environmental and economic values) us<strong>in</strong>g a common unit, solar emergy joule (Odum, 1996). EA <strong>in</strong>serts the<br />
productive cycle <strong>in</strong>to a local environmental context and quantifies the energy flows b<strong>et</strong>ween the environment<br />
and the production system. Through three contrast<strong>in</strong>g fish-farm<strong>in</strong>g systems, we attempted to demonstrate the<br />
<strong>in</strong>terest of a comb<strong>in</strong>ation of <strong>LCA</strong> and EA to def<strong>in</strong>e the major components of environmental susta<strong>in</strong>ability<br />
and ecological <strong>in</strong>tensification of fish farm<strong>in</strong>g and more globally of agricultural systems.<br />
The first system is a recirculat<strong>in</strong>g system (RSF) of Atlantic salmon depend<strong>in</strong>g highly on external <strong>in</strong>puts (feed<br />
and energy). The second one is extensive fish polyculture <strong>in</strong> a pond (PF1) with few external <strong>in</strong>puts. The last<br />
one is a small pond farm with use of external feeds. These systems were assessed accord<strong>in</strong>g the ISO standards<br />
for attributional <strong>LCA</strong> dur<strong>in</strong>g one production year. The assessment covered farm operations and transportation<br />
at all stages. Local emissions of nutrients were estimated us<strong>in</strong>g nutrient balance model<strong>in</strong>g and pond<br />
emissions were ref<strong>in</strong>ed to <strong>in</strong>clude nitrogen-fate factors. <strong>LCA</strong> results are presented as traditional midpo<strong>in</strong>t<br />
<strong>in</strong>dicators accord<strong>in</strong>g CML 2 basel<strong>in</strong>e 2001and are expressed by tonne of fish produced. Emergy account<strong>in</strong>g<br />
[3] is based on <strong>LCA</strong> system def<strong>in</strong>ition but <strong>in</strong>cludes also the contributions of natural systems (sun, ra<strong>in</strong>,<br />
groundwater, <strong>et</strong>c.) and provide <strong>in</strong>dicators to evaluate the efficiency of energy use and its quality dur<strong>in</strong>g the<br />
lifecycle. The chosen Emergy <strong>in</strong>dicators are: Percentage of renewability (%R); the Emergy Yield Ratio<br />
(EYR, ability to rely on local resources; Environmental Load<strong>in</strong>g Ratio (ELR, level of exploitation of nonrenewable<br />
resources compared to renewable ones).<br />
For 1 tonne of liv<strong>in</strong>g fish, RSF had higher potential impacts for NPPU and all the Emergy <strong>in</strong>dicators (Fig. 1).<br />
PF2 had higher potential impacts <strong>in</strong> comparison with PF1 except for water dependence. However, RSF had<br />
lower potential impacts for climate change, eutrophication, land comp<strong>et</strong>ition and water dependence than<br />
ponds, which reflects the level of <strong>in</strong>tensification of the systems. The consumption of energy (calculated by<br />
<strong>LCA</strong>, Figure 2) was similar for RSF and PF1 and higher for PF2. But, the contributors to this impact differed<br />
among the systems (direct energy use for ponds and feeds and direct energy used for RSF). The difference<br />
<strong>in</strong>%R b<strong>et</strong>ween systems was due to water orig<strong>in</strong>: for RSF water was pumped whereas for ponds it came essentially<br />
from ra<strong>in</strong> and water run-off. PF1 has a higher EYR, which means that it depends less on mark<strong>et</strong><br />
resources than RSF. The RSF higher value of ELR (7.98) <strong>in</strong>dicates a moderate environmental impact.<br />
The comb<strong>in</strong>ation of <strong>LCA</strong> and Emergy account<strong>in</strong>g on contrast<strong>in</strong>g systems provides a perspective of what<br />
ecological <strong>in</strong>tensification could mean <strong>in</strong> aquaculture: a decrease <strong>in</strong> potential impacts per unit mass of f<strong>in</strong>al<br />
products, especially for global warm<strong>in</strong>g, eutrophication and acidification; a decrease <strong>in</strong> dependence on mark<strong>et</strong>-based<br />
and external resources; and an <strong>in</strong>crease <strong>in</strong> the use of renewable natural resources and <strong>in</strong>put efficiency.<br />
This is particularly true for choices regard<strong>in</strong>g feed <strong>in</strong>gredients and the orig<strong>in</strong> of energy sources.<br />
References<br />
ISO, 2006. Environmental Management -Life Cycle Assessment- Pr<strong>in</strong>ciples and Framework. ISO 14040.<br />
Odum HT. Environmental Account<strong>in</strong>g: Emergy and Environmental Decision Mak<strong>in</strong>g. New York: Wiley;<br />
1996.<br />
Ulgiati S, Raugei M, Bargigli S., 2006. Overcom<strong>in</strong>g the <strong>in</strong>adequacy of s<strong>in</strong>gle-criterion approaches to Life<br />
Cycle Assessment. Ecol. Modell., 190:432-42.<br />
693
GROUP 1, SESSION A: ANIMAL PRODUCTION SYSTEMS 8 th Int. Conference on <strong>LCA</strong> <strong>in</strong> the<br />
Agri-<strong>Food</strong> Sector, 1-4 Oct <strong>2012</strong><br />
Figure 1. Comparison of the <strong>LCA</strong> and emergy impacts of the recirculat<strong>in</strong>g-system farm (RSF), large pond<br />
farm (PF1) and small pond farm (PF2). Impacts are represented as a percentage of the largest impact <strong>in</strong> each<br />
category. Certa<strong>in</strong> emergy <strong>in</strong>dicators were <strong>in</strong>versed accord<strong>in</strong>gly. NPPU - n<strong>et</strong> primary production use; EYR -<br />
Emergy Yield Ratio; ELR - Environmental Load<strong>in</strong>g Ratio<br />
Figure 2. Environmental impacts (climate change, total cumulative energy demand, water dependence, acidification,<br />
eutrophication, and land comp<strong>et</strong>ition) per tonne of fish of the recirculat<strong>in</strong>g-system farm (RSF), large<br />
pond farm (PF1) and small pond farm (PF2) calculated by <strong>LCA</strong>. For each environmental impact, the contribution<br />
of each <strong>in</strong>put or production stage is <strong>in</strong>dicated.<br />
694
GROUP 1, SESSION A: ANIMAL PRODUCTION SYSTEMS 8 th Int. Conference on <strong>LCA</strong> <strong>in</strong> the<br />
Agri-<strong>Food</strong> Sector, 1-4 Oct <strong>2012</strong><br />
28. A participatory approach framework to <strong>in</strong>tegrate social aspects <strong>in</strong><br />
<strong>LCA</strong>: the case of aquaculture systems<br />
Syndhia Mathé 1,* , Joël Aub<strong>in</strong> 2 , Aurélie Wilfart 2 , Hélène Rey-Val<strong>et</strong>te 3 , Myriam Callier 4 , Jean-Paul<br />
Blanch<strong>et</strong>on 4<br />
1 CNRS, UMR5474 LAMETA, F-34000 Montpellier, <strong>France</strong>, 2 INRA, UMR1069 Sol Agro <strong>et</strong> hydrosystème<br />
Spatialisation, F-35000 Rennes, <strong>France</strong>, 3 Université Montpellier 1, UMR5474 LAMETA, F-34000 Montpellier,<br />
<strong>France</strong>, 4 IFREMER Palavas, F-34250 Palavas les flots, <strong>France</strong>, Correspond<strong>in</strong>g author. E-mail:<br />
syndhia.mathe@univ-montp1.fr<br />
The identification of relevant social impact <strong>in</strong>dicators for a Social Life Cycle Assessment (S<strong>LCA</strong>) is still<br />
difficult and poorly documented (Jorgensen, <strong>et</strong> al., 2009). It requires the identification of the ma<strong>in</strong> social<br />
concerns for each considered case study and the adaptation of selected social impacts correspond<strong>in</strong>g to the<br />
actual social situation and which can be easily appropriated by the actors of the value cha<strong>in</strong>.<br />
In the case of aquaculture system the studies based on social aspects are essentially focused on manpower or<br />
on conflicts with other activities. In the PISCEnLit project (Ecologically Intensive PISciculture, funded by<br />
the French National Research Agency), we aim at emphasis<strong>in</strong>g a larger vision of the social impacts of fish<br />
farm<strong>in</strong>g systems us<strong>in</strong>g a new approach of S<strong>LCA</strong>. We studied fish farm<strong>in</strong>g pond systems <strong>in</strong> <strong>France</strong> and Brazil.<br />
In this study, we focussed on the choice of the impact categories us<strong>in</strong>g the participation of stakeholders<br />
(James <strong>et</strong> al., 2002). We emphasised the role of a participatory approach to identify and select the relevant<br />
social impacts to be assessed. From a practical viewpo<strong>in</strong>t, the proposed approach consists <strong>in</strong> implement<strong>in</strong>g<br />
surveys and focus groups about the social representations at different stages of the assessment process.<br />
Through this process, the op<strong>in</strong>ions of the stakeholders about potential or real social impacts of aquaculture<br />
may be taken <strong>in</strong>to consideration. However, the technical construction of the relevant impact <strong>in</strong>dicators allow<strong>in</strong>g<br />
evaluation of the impacts must be done by the researchers <strong>in</strong> the project.<br />
Our presentation focuses on the advantage of us<strong>in</strong>g a participatory approach based on the Pr<strong>in</strong>ciple, Criteria<br />
and Indicator (PCI) m<strong>et</strong>hod (Rey-Val<strong>et</strong>te <strong>et</strong> al., 2008) to identify relevant social <strong>in</strong>dicators for a S<strong>LCA</strong> <strong>in</strong> fish<br />
farm<strong>in</strong>g pond systems cases. This m<strong>et</strong>hod provides a basis for discussion, allow<strong>in</strong>g the stakeholders to rank<br />
and validate a list of impacts (Fig. 1). This list was constructed us<strong>in</strong>g <strong>in</strong>ternational conventions (e.g. Human<br />
Rights Declaration), the well-be<strong>in</strong>g components of the Millennium Ecosystem Assessment, social aspects<br />
which appear <strong>in</strong> referential of aquaculture susta<strong>in</strong>able development (Rey-Val<strong>et</strong>te <strong>et</strong> al., 2008) and results of<br />
the survey based on social representation. The adaptation of this m<strong>et</strong>hod to the social <strong>LCA</strong> allows the comparison<br />
of different systems at the level of the pr<strong>in</strong>ciples without standardisation of social impacts.<br />
References<br />
James, K. L., Grant, T., Sonneveld, K., 2002. Stakeholder <strong>in</strong>volvement <strong>in</strong> Australian paper and pack<strong>in</strong>g<br />
waste management <strong>LCA</strong> study. Int J Life Cycle Assess. 7, 151-157<br />
Jorgensen, A., Hauschild, M. Z., Jorgensen, M. S., Wangel, A., 2009. Relevance and feasibility of social life<br />
cycle assessment from a company perspective. Int J Life Cycle Assess. 14, 204-214<br />
Rey-Val<strong>et</strong>te, H., Clément, O., Aub<strong>in</strong>, J., Mathé, S., Chia, E., Legendre, M., Caruso, D., Mikolasek, O.,<br />
Blanch<strong>et</strong>on, J-P., Slembrouck, J., Baruthio, A., René, F., Levang, P., Morrissens, P., Lazard, J., 2008.<br />
Guide to the co-construction of susta<strong>in</strong>able development <strong>in</strong>dicators <strong>in</strong> aquaculture. © Cirad, Ifremer,<br />
INRA, IRD, Université Montpellier 1. Diffusion Cirad-Montpellier, Montpellier.<br />
695
GROUP 1, SESSION A: ANIMAL PRODUCTION SYSTEMS 8 th Int. Conference on <strong>LCA</strong> <strong>in</strong> the<br />
Agri-<strong>Food</strong> Sector, 1-4 Oct <strong>2012</strong><br />
Figure 1. M<strong>et</strong>hodological process <strong>in</strong>tegrat<strong>in</strong>g a participatory approach.<br />
696
GROUP 1, SESSION A: ANIMAL PRODUCTION SYSTEMS 8 th Int. Conference on <strong>LCA</strong> <strong>in</strong> the<br />
Agri-<strong>Food</strong> Sector, 1-4 Oct <strong>2012</strong><br />
29. Compar<strong>in</strong>g environmental impacts of wild-caught and farmed fish<br />
products - a review of life cycle assessments<br />
E.A. Groen * , T.C. Vi<strong>et</strong>s, E.A.M. Bokkers, I.J.M. De Boer<br />
Animal Production Systems Group, Wagen<strong>in</strong>gen University, Correspond<strong>in</strong>g author. E-mail: Evelyne.Groen@wur.nl<br />
Many discuss the differences b<strong>et</strong>ween fish products orig<strong>in</strong>at<strong>in</strong>g from aquaculture and fisheries. However, no<br />
systematic literature overview has been made y<strong>et</strong>. Most seafood <strong>LCA</strong> studies so far are limited to impact<br />
categories like energy use or global warm<strong>in</strong>g, or assess products on a national scale. We came up with a<br />
more extensive literature overview of the differences <strong>in</strong> environmental impact b<strong>et</strong>ween aquaculture and fisheries,<br />
based on the same m<strong>et</strong>hodology.<br />
The objective of this study was to compare environmental impact assessments of wild-caught and farmed<br />
fish products. We reviewed life cycle assessments (<strong>LCA</strong>s) of wild-caught plaice and cod, and farmed<br />
salmon, tilapia and pangasius, as these species are studied most often. Seven peer-reviewed studies were<br />
found that performed an <strong>LCA</strong> of these species, address<strong>in</strong>g diverse production systems. The follow<strong>in</strong>g environmental<br />
impacts were discussed: energy use (EU), global warm<strong>in</strong>g potential (GWP), acidification potential<br />
(AP), eutrophication potential (EP) and land use.<br />
To enable a comparison of EU and GWP among studies, we recalculated outcomes us<strong>in</strong>g the same functional<br />
unit (i.e. 1 kg of fresh fill<strong>et</strong>), allocation m<strong>et</strong>hod (i.e. mass allocation) and similar characterisation factors.<br />
Most articles, however, did not address AP, EP, or land use. We estimated the AP, EP, and land use of the<br />
seven studies, us<strong>in</strong>g published technical param<strong>et</strong>ers, complemented with data from eco<strong>in</strong>vent v2.2 and FAO.<br />
Next, the two systems were compared for GWP, EU, AP, EP, and land use us<strong>in</strong>g Wilcoxon rank-sum test.<br />
Energy use (for wild-caught and farmed fish) varied b<strong>et</strong>ween 11 to 273 MJ/kg of fresh fill<strong>et</strong>, whereas GWP<br />
varied b<strong>et</strong>ween 0.7 and 22.9 kg CO2-eq/kg of fresh fill<strong>et</strong>. Results of EU and GWP showed a similar pattern<br />
across studies, as especially <strong>in</strong> fisheries GWP is dom<strong>in</strong>ated by CO2 emissions from fossil fuel combustion.<br />
The GWP from process<strong>in</strong>g varied b<strong>et</strong>ween 0.03 and 0.93 kg CO2-eq/kg of fresh fill<strong>et</strong> (the fish with the highest<br />
value <strong>in</strong>cluded freez<strong>in</strong>g), the GWP due to transport b<strong>et</strong>ween 0.05 and 3.36 kg CO2-eq/kg of fresh fill<strong>et</strong><br />
(the highest value comprised air transport).<br />
Global warm<strong>in</strong>g potential, EU, and AP of farmed fish products were not different compared to wild-caught<br />
fish products (P>0.05; Fig. 1 shows GWP). However, EP and landuse were higher for farmed fish products<br />
(P
GROUP 1, SESSION A: ANIMAL PRODUCTION SYSTEMS 8 th Int. Conference on <strong>LCA</strong> <strong>in</strong> the<br />
Agri-<strong>Food</strong> Sector, 1-4 Oct <strong>2012</strong><br />
Figure 1. GWP of analysed systems (kg CO2-eq/kg fill<strong>et</strong>). Abbreviations of country names: CA: Canada; CI:<br />
Chile; DK: Denmark; ID: Indonesia; NO: Norway; SE: Sweden; VN: Vi<strong>et</strong>nam<br />
Figure 2. Eutrophication potential of analysed systems (kg NO3-eq/kg fill<strong>et</strong>).<br />
698<br />
5.0<br />
4.5<br />
4.0<br />
3.5<br />
3.0<br />
2.5<br />
2.0<br />
1.5<br />
1.0<br />
0.5<br />
0.0<br />
1<br />
0.9<br />
0.8<br />
0.7<br />
0.6<br />
0.5<br />
0.4<br />
0.3<br />
0.2<br />
0.1<br />
0<br />
Cod NO Cod<br />
Gilln<strong>et</strong> SE<br />
Cod NO Cod<br />
Gilln<strong>et</strong> SE<br />
Cod<br />
trawler<br />
SE<br />
Cod<br />
trawler<br />
SE<br />
Cod DK Plaice DK Salmon<br />
NO<br />
Cod DK Plaice DK Salmon<br />
NO<br />
GWP (kg CO 2-eq/kg fill<strong>et</strong>)<br />
Salmon<br />
NO<br />
Salmon<br />
CI<br />
EP (kg NO 3-eq/kg fill<strong>et</strong>)<br />
Salmon<br />
NO<br />
Salmon<br />
CI<br />
Salmon<br />
N<strong>et</strong> Pen<br />
CA<br />
Salmon<br />
N<strong>et</strong> Pen<br />
CA<br />
22.9 kg CO 2-eq/kg<br />
Char<br />
recirc. CA<br />
Char<br />
recirc. CA<br />
Tilapia<br />
Lake ID<br />
Tilapia<br />
Lake ID<br />
Tilapia<br />
Pond ID<br />
Tilapia<br />
Pond ID<br />
Striped<br />
catfish<br />
VN<br />
Striped<br />
catfish<br />
VN
GROUP 1, SESSION A: ANIMAL PRODUCTION SYSTEMS 8 th Int. Conference on <strong>LCA</strong> <strong>in</strong> the<br />
Agri-<strong>Food</strong> Sector, 1-4 Oct <strong>2012</strong><br />
30. Environmental consequences of gen<strong>et</strong>ic improvement by selective<br />
breed<strong>in</strong>g: a gilthead sea bream aquaculture case study<br />
Joël Aub<strong>in</strong> 1,2,* , Ivone Acosta Alba 1,2 , Pierrick Haffray 3 , Jérôme Bugeon 4 , Marc Vandeputte 5,6<br />
1 INRA, UMR1069 Sol Agro <strong>et</strong> hydrosystème Spatialisation, F-35000 Rennes, <strong>France</strong>, 2 Agrocampus Ouest,<br />
F-35000 Rennes, <strong>France</strong>, 3 SYSAAF, Campus de Beaulieu, F-35000 Rennes, <strong>France</strong>, 4 INRA, LPGP,<br />
UR1037, Campus de Beaulieu, F-35000 Rennes, <strong>France</strong>, 5 INRA, UMR1313 GABI, F-78352, Jouy-en-Josas,<br />
<strong>France</strong>, 6 Ifremer, UMR110 Intrepid, F-34250 Palavas-les-Flots, <strong>France</strong>, Correspond<strong>in</strong>g author. E-mail:<br />
joel.aub<strong>in</strong>@rennes.<strong>in</strong>ra.fr<br />
Livestock gen<strong>et</strong>ic improvement is based on selective breed<strong>in</strong>g of quantitative traits like growth or production<br />
yields. In fish farm<strong>in</strong>g, selective breed<strong>in</strong>g has a high potential due to the recent domestication of the species.<br />
Gen<strong>et</strong>ic improvement (i.e. shortened duration of the production cycle or <strong>in</strong>creased mark<strong>et</strong>able size due to<br />
selection on body weight) could <strong>in</strong>directly impact the use of production means and the valorisation of <strong>in</strong>puts.<br />
Consequently, the environmental performances of the production system can be modified. In order to explore<br />
the environmental consequences of gen<strong>et</strong>ic improvement <strong>in</strong> animal production and aquaculture, Life Cycle<br />
Assessment (<strong>LCA</strong>) was used to assess a sea bream (Sparus aurata) production system with expected gen<strong>et</strong>ic<br />
ga<strong>in</strong> on growth or fill<strong>et</strong> yield.<br />
Five scenarios were built us<strong>in</strong>g the results of expected selection response: <strong>in</strong>itial unselected control, and 5 or<br />
10% selection pressure on growth or fill<strong>et</strong> yield dur<strong>in</strong>g 5 generations (15 to 20 years). The system boundary<br />
<strong>in</strong>cluded the production of <strong>in</strong>puts such as feeds, f<strong>in</strong>gerl<strong>in</strong>gs, production <strong>in</strong>frastructures, farm runn<strong>in</strong>g, the<br />
commercial stage, purchase, the household cook<strong>in</strong>g and consumption stage and the waste management. An<br />
attributional <strong>LCA</strong> was applied on the different scenarios, based on CML 2 (2000) and Cumulative Energy<br />
Demand m<strong>et</strong>hods, implemented <strong>in</strong> SimaPro 7.2 software, and the use of orig<strong>in</strong>al data, and eco<strong>in</strong>vent database.<br />
The calculated impact categories were climate change, eutrophication, acidification, cumulative energy<br />
demand, and n<strong>et</strong> primary production use (Aub<strong>in</strong> <strong>et</strong> al., 2009). The functional unit was 1 kg of edible flesh.<br />
For all the impact categories, the step of fish production (<strong>in</strong>clud<strong>in</strong>g the upstream processes) contributed for<br />
more than 80% of the impacts.<br />
Due to the high <strong>in</strong>fluence of artificial feed production on the <strong>LCA</strong> results and to the hypothesis of lack of<br />
gen<strong>et</strong>ic correlation b<strong>et</strong>ween the traits selected for and feed efficiency, selection on growth only had a limited<br />
effect on the different impact categories (less than 2%). This limited improvement was essentially due to the<br />
marg<strong>in</strong>al improvement <strong>in</strong> the use of the <strong>in</strong>frastructure and the related energy use.<br />
Selective breed<strong>in</strong>g on fill<strong>et</strong> yield decreased environmental impacts from 10% to 22%. This decrease, calculated<br />
per kg of edible flesh can be expla<strong>in</strong>ed by the positive gen<strong>et</strong>ic correlations b<strong>et</strong>ween growth and fill<strong>et</strong><br />
yield and by the decrease of waste at the household cook<strong>in</strong>g and consumption stage.<br />
This study is the first application of <strong>LCA</strong> as an assessment m<strong>et</strong>hod of the environmental relevance of selective<br />
breed<strong>in</strong>g <strong>in</strong> animal productions. It supports the lack of adverse effect of selection for the targ<strong>et</strong>ed traits<br />
(growth, or fill<strong>et</strong> yield) on the environment. This work is also a first step to <strong>in</strong>troduce environmental goals<br />
<strong>in</strong>to gen<strong>et</strong>ic selection schemes.<br />
References<br />
Aub<strong>in</strong>, J., Papatryphon, E., van der Werf, H. M. G., Chatzifotis, S., 2009. Assessment of the environmental<br />
impact of carnivorous f<strong>in</strong>fish production systems us<strong>in</strong>g life cycle assessment. Journal of Cleaner Production<br />
17, 354-361.<br />
699
GROUP 1, SESSION A: ANIMAL PRODUCTION SYSTEMS 8 th Int. Conference on <strong>LCA</strong> <strong>in</strong> the<br />
Agri-<strong>Food</strong> Sector, 1-4 Oct <strong>2012</strong><br />
700<br />
31. Environmental assessment of trout production <strong>in</strong> <strong>France</strong>:<br />
<strong>in</strong>fluence of practices and production goals<br />
Joël Aub<strong>in</strong> 1,2,* , Elisab<strong>et</strong>h Samson 1,2,3 , Aurélien Tocqueville 4<br />
1 INRA, UMR1069 Sol Agro <strong>et</strong> hydrosystème Spatialisation, F-35000 Rennes, <strong>France</strong>, 2 AGROCAMPUS<br />
OUEST, F-35000 Rennes, <strong>France</strong>, 3 INRA, UMR1032 Structures <strong>et</strong> Marchés Agricoles, Ressources <strong>et</strong> Territoires,<br />
F-35000 Rennes, <strong>France</strong>, 4 ITAVI, F-75008 Paris, <strong>France</strong>, Correspond<strong>in</strong>g author. E-mail:<br />
joel.aub<strong>in</strong>@rennes.<strong>in</strong>ra.fr<br />
Trout production is the ma<strong>in</strong> fish farm<strong>in</strong>g activity <strong>in</strong> <strong>France</strong>, produc<strong>in</strong>g 37 000 tonnes of fish <strong>in</strong> 456 companies<br />
(MAAP, 2011). It is ma<strong>in</strong>ly based on ra<strong>in</strong>bow trout (Oncorhynchus mykiss), reared <strong>in</strong> flow through systems<br />
directly connected to rivers. The production level of trout decl<strong>in</strong>ed of 20% for the 10 past years, which<br />
clearly raises the question of the susta<strong>in</strong>able development of this activity. The variable mark<strong>et</strong> price of fish,<br />
the <strong>in</strong>creas<strong>in</strong>g costs of feed <strong>in</strong>gredients and the higher pressure of environmental regulations threaten the<br />
durability of the activity. Life Cycle Assessment was chosen as a m<strong>et</strong>hod to check the environmental susta<strong>in</strong>ability<br />
of fish farm<strong>in</strong>g, comb<strong>in</strong><strong>in</strong>g efficiency measurement and multicriteria characteristics, <strong>in</strong> order to<br />
draw new perspectives for trout farm<strong>in</strong>g. In 2007, a survey was conducted on 20 farms throughout <strong>France</strong>,<br />
and cover<strong>in</strong>g all types of production. We classified the trout farms <strong>in</strong> two groups depend<strong>in</strong>g on the commercial<br />
size of fish produced: the pan-size-trout farms (11 farms) and the large trout farms (9 farms). The attributional<br />
<strong>LCA</strong> was conducted from cradle to farm gate, us<strong>in</strong>g one tonne of fish as the functional unit. Environmental<br />
impacts (eutrophication, acidification, climate change, n<strong>et</strong> primary production use, land occupation,<br />
water dependence) were calculated us<strong>in</strong>g CML 2 (2000) m<strong>et</strong>hod (Aub<strong>in</strong> <strong>et</strong> al.2009), and cumulative<br />
energy demand was added. On farm work<strong>in</strong>g time was recorded. Primary data were ma<strong>in</strong>ly used for feed<br />
<strong>in</strong>gredients and process<strong>in</strong>g, and fish farm runn<strong>in</strong>g. The secondary data stem ma<strong>in</strong>ly from eco<strong>in</strong>vent database.<br />
The comparison of the impact categories b<strong>et</strong>ween the two groups of farms didn’t show any significant differences,<br />
unlike previous studies results (Papatryphon <strong>et</strong> al., 2004). N<strong>et</strong> primary production use, water dependence<br />
and work<strong>in</strong>g time showed a tendency of a higher level <strong>in</strong> pan-size-trout farms. These impact categories<br />
values <strong>in</strong>dicate a lower level of management and a lower efficiency of the production system. This remark is<br />
consistent with the high level of variability of the impacts <strong>in</strong> this group of farm. On the opposite, the large<br />
trout farms group had low levels of impact variability, which can be expla<strong>in</strong>ed by a more standardised production<br />
and a higher level of technical comp<strong>et</strong>ence. Despite the high contribution of feed production to the<br />
impacts (climate change, acidification, and cumulative energy demand) the correlation b<strong>et</strong>ween food conversion<br />
ratio and these impacts was not significant <strong>in</strong> the group of pan-size-trout farms (unlike <strong>in</strong> large trout<br />
farms). This is probably due to the multiple factors d<strong>et</strong>erm<strong>in</strong><strong>in</strong>g the farms efficiency. These results show how<br />
the different production objectives (direct consumption and restock<strong>in</strong>g for pan-size-trout farms, and fil<strong>et</strong><br />
production for large trout farms) <strong>in</strong>fluence the environmental impact variability of a production activity. This<br />
impacts variability <strong>in</strong>dicates a higher level of system improvement <strong>in</strong> pan size trout farms than <strong>in</strong> large trout<br />
farms.<br />
References<br />
Aub<strong>in</strong>, J., Papatryphon, E., van der Werf, H. M. G., Chatzifotis, S., 2009. Assessment of the environmental<br />
impact of carnivorous f<strong>in</strong>fish production systems us<strong>in</strong>g life cycle assessment. Journal of Cleaner Production.<br />
17 (3), 354-361.<br />
MAAP (M<strong>in</strong>istère de l’Agriculture de l’Alimentation <strong>et</strong> de la Pêche), 2011. Recensements 2008 de la salmoniculture<strong>et</strong><br />
de la pisciculture mar<strong>in</strong>e <strong>et</strong> des élevages d’esturgeons, Agreste Les Dossiers, no. 11, April<br />
2011, Paris,148p.<br />
Papatryphon, E., P<strong>et</strong>it, J., van der Werf, H. M. G., 2004. The development of Life Cycle Assessment for the<br />
evaluation of ra<strong>in</strong>bow trout farm<strong>in</strong>g <strong>in</strong> <strong>France</strong>. In: Halberg N., editor. Life Cycle Assessment <strong>in</strong> the Agrifood<br />
sector. Proceed<strong>in</strong>gs from the 4th International Conference. Danish Institute of Agricultural Sciences,<br />
Horsens, Denmark, 73-80.
GROUP 1, SESSION A: ANIMAL PRODUCTION SYSTEMS 8 th Int. Conference on <strong>LCA</strong> <strong>in</strong> the<br />
Agri-<strong>Food</strong> Sector, 1-4 Oct <strong>2012</strong><br />
32. <strong>LCA</strong> of locally produced feeds for Peruvian aquaculture<br />
Angel Avadí 1,* , Pierre Fréon 2 , Jesús Núñez 3 , Camilo Cuba 4<br />
1 UMR 212 EME, Institut de Recherche pour le Développement (IRD), Université Montpellier II, CRH, BP<br />
171, 34203, Sète, <strong>France</strong>, 2 UMR 212 EME, IRD, Centre de Recherche Halieutique Méditerranéenne <strong>et</strong><br />
Tropicale (CRH), BP 171, 34203, Sète, <strong>France</strong>, 3 UMR 5554 ISEM, IRD, Institut des Sciences de<br />
l’Evolution Montpellier , CS 19519, 34960 Montpellier cedex 2, <strong>France</strong>, 4 Universidad N. Federico Villarreal,<br />
Facultad de Oceanografía, Pesquería y Ciencias Alimentarias, 350 calle Roma, Lima, Peru, Correspond<strong>in</strong>g<br />
author. E-mail: angel.avadi@ird.fr<br />
The research presents and discusses a <strong>LCA</strong> performed on an aquafeed plants <strong>in</strong> the Iquitos area, Peru (<strong>in</strong>ventories<br />
were collected for two plants but results are presented for the larger one only). The ma<strong>in</strong> goal of the<br />
analysis is to explore local utilisation of Peruvian anchov<strong>et</strong>a (Engraulis r<strong>in</strong>gens) fishmeal <strong>in</strong> aquafeeds for<br />
both omnivorous and carnivorous cultured species. These results can be useful for the comparative study of<br />
seafood supply cha<strong>in</strong>s (e.g. Avadí & Fréon, this Conference).<br />
Results from other Anchov<strong>et</strong>a-SC work on two fishmeal plants (Fréon <strong>et</strong> al., <strong>in</strong> prep.) and the Peruvian <strong>in</strong>dustrial<br />
anchov<strong>et</strong>a fle<strong>et</strong> contributed prelim<strong>in</strong>ary downstream data for the fishmeal (fish<strong>in</strong>g and reduction<br />
stages). One fishmeal plant was fully modelled and one “average” 395 m3 hold<strong>in</strong>g capacity fish<strong>in</strong>g vessel<br />
(the most representative category of anchov<strong>et</strong>a-targ<strong>et</strong><strong>in</strong>g vessels, regard<strong>in</strong>g historical land<strong>in</strong>gs) was modelled<br />
<strong>in</strong>clud<strong>in</strong>g rough estimations of the construction and end-of-life phases. Data for other feed <strong>in</strong>gredients were<br />
taken from eco<strong>in</strong>vent, and adapted when necessary to fit the sourc<strong>in</strong>g of Amazonian aquafeed <strong>in</strong>gredients<br />
and energy sources (i.e. the grid-disconnected Iquitos electricity supply is based on thermal oil-powered generation).<br />
Weighted average of different feed formulations produced was utilised for d<strong>et</strong>erm<strong>in</strong><strong>in</strong>g the “typical”<br />
feed composition for Colossoma macropomum (mostly herbivore, the third more cultured freshwater species<br />
<strong>in</strong> Peru) and Brycon melanopterus (omnivore), two important Amazonian species provided by the Iquitos<br />
aquafeed <strong>in</strong>dustry. This scenario was compared with a theor<strong>et</strong>ical feed plant cater<strong>in</strong>g to carnivorous fish<br />
(ra<strong>in</strong>bow trout, Oncorhynchus mykiss) cultured <strong>in</strong> the Puno region, by adjust<strong>in</strong>g fishmeal and fish oil use and<br />
regional energy mix (Fig. 1 a,b). Moreover, Peruvian formulations were compared with northern hemisphere<br />
formulations. Life cycle impact assessments were performed with the ReCiPe m<strong>et</strong>hod, but additional impact<br />
categories were calculated: Cumulative Energy Demand and Biotic Resource Use as appropriation of primary<br />
production. Sensitivity analysis was carried out by explor<strong>in</strong>g and contrast<strong>in</strong>g various<br />
sources/proportions of key feed <strong>in</strong>gredients.<br />
As expected, most of the environmental impacts dur<strong>in</strong>g the life span of the plants are due to the provision of<br />
feed <strong>in</strong>gredients (>65%), especially fishmeal (>35% for trout), corn, wheat and soy meals. An allocation<br />
strategy for fishmeal and fish oil is <strong>in</strong> preparation, but a prelim<strong>in</strong>ary gross energy content criterion (71:29)<br />
was used for prelim<strong>in</strong>ary results. The oil-based Iquitos grid energy d<strong>et</strong>erm<strong>in</strong>es a high contribution of electricity<br />
used (~268 kWh/t feed) to several impact categories. Soy meal used <strong>in</strong> Peru is ma<strong>in</strong>ly imported from<br />
Bolivia, and thus a Bolivian soy meal was adapted from an exist<strong>in</strong>g eco<strong>in</strong>vent Brazilian soy meal by adjust<strong>in</strong>g<br />
the extent of the natural land transformation impact (provision of stubbed land, based on the characteristics<br />
of expansion zones for soy production <strong>in</strong> both countries (Dros, 2004)). Seasonal flood system rice grown<br />
<strong>in</strong> Iquitos was adapted from US rice, by reduc<strong>in</strong>g chemical <strong>in</strong>put and elim<strong>in</strong>at<strong>in</strong>g irrigation. Proxies for<br />
wheat and corn where used (US produce), but their important contribution to certa<strong>in</strong> impact categories suggests<br />
a full adaptation to local conditions is needed.<br />
It was observed, <strong>in</strong> l<strong>in</strong>e with previous <strong>LCA</strong> studies of seafood systems, that construction and ma<strong>in</strong>tenance of<br />
feed plants contributes negligibly to environmental impacts of aquafeed products. It was also demonstrated<br />
that <strong>in</strong>creas<strong>in</strong>g use of fishmeal and fish oil, as well as the source of agricultural <strong>in</strong>puts, contribute to important<br />
variations <strong>in</strong> certa<strong>in</strong> environmental impacts. Comparison b<strong>et</strong>ween similar feeds for carnivore fish from<br />
Peru and Northern countries showed the specificity of South American <strong>in</strong>gredients: roughly comparable performance<br />
of fishmeal and soy meal (except Brazilian). The sourc<strong>in</strong>g of feed <strong>in</strong>gredients was found to be<br />
critical for the contribution of feeds to impacts.<br />
References<br />
Avadí, A. and Fréon, P. <strong>2012</strong>. A framework for susta<strong>in</strong>ability comparison of seafood supply cha<strong>in</strong>s. This<br />
Conference.<br />
Fréon, P. Durand, H., Huaranca, S., Avadi, A. <strong>2012</strong>. <strong>LCA</strong> of two Peruvian fishmeal plants. In preparation.<br />
701
GROUP 1, SESSION A: ANIMAL PRODUCTION SYSTEMS 8 th Int. Conference on <strong>LCA</strong> <strong>in</strong> the<br />
Agri-<strong>Food</strong> Sector, 1-4 Oct <strong>2012</strong><br />
Dros, J. M. 2004. Manag<strong>in</strong>g the Soy Boom: Two scenarios of soy production expansion <strong>in</strong> South America.<br />
WWF Forest Conversion Initiative. AIDEnvironment. Amsterdam.<br />
702<br />
Figure 1. SimaPro-generated n<strong>et</strong>work view of (a) the studied Iquitos aquafeed plant (for Colossoma) and<br />
(b) the hypoth<strong>et</strong>ical Puno feed plant (for trout).<br />
Figure 2. Comparison of two feed compositions (selected ReCiPe categories, additional categories). ReCiPe<br />
endpo<strong>in</strong>ts s<strong>in</strong>gle score favours the Colossoma feed plant.
GROUP 1, SESSION A: ANIMAL PRODUCTION SYSTEMS 8 th Int. Conference on <strong>LCA</strong> <strong>in</strong> the<br />
Agri-<strong>Food</strong> Sector, 1-4 Oct <strong>2012</strong><br />
33. A framework for susta<strong>in</strong>ability comparison of seafood supply<br />
cha<strong>in</strong>s<br />
Angel Avadí 1,* , Pierre Fréon 2<br />
1 UMR 212 EME, Institut de Recherche pour le Développement (IRD), Université Montpellier II, CRH, BP<br />
171, 34203, Sète, <strong>France</strong>, 2 UMR 212 EME, IRD, Centre de Recherche Halieutique Méditerranéenne <strong>et</strong><br />
Tropicale (CRH), BP 171, 34203, Sète, <strong>France</strong>, Correspond<strong>in</strong>g author. E-mail: angel.avadi@ird.fr<br />
The research, carried out <strong>in</strong> the context of the ANCHOVETA-SC project (http://anchov<strong>et</strong>asc.wikispaces.com),<br />
proposes a modell<strong>in</strong>g and susta<strong>in</strong>ability assessment framework for compar<strong>in</strong>g comp<strong>et</strong><strong>in</strong>g<br />
seafood supply cha<strong>in</strong>s based on common <strong>in</strong>puts, <strong>in</strong> terms of a selected <strong>in</strong>dicators focus<strong>in</strong>g on environmental<br />
and socio-economic performance, with emphasis on environmental and energy performance. The<br />
approach allows for comparison of alternative stock exploitation scenarios and transformation strategies.<br />
Comp<strong>et</strong><strong>in</strong>g seafood supply cha<strong>in</strong>s are modelled <strong>in</strong> terms of their material and energy flows and, from a life<br />
cycle perspective, several tools and approaches are comb<strong>in</strong>ed and applied to assess their susta<strong>in</strong>ability. <strong>LCA</strong><br />
is used for environmental impact assessment (<strong>in</strong>clud<strong>in</strong>g seafood-specific impact categories), but further<br />
analyses on energy efficiency and nutritional value of feed <strong>in</strong>gredients and seafood co-products are carried<br />
out. Basic socio-economic data is also compiled and used for estimat<strong>in</strong>g socio-economic performance by<br />
means of key <strong>in</strong>dicators. A trophic model of the exploited mar<strong>in</strong>e ecosystem sourc<strong>in</strong>g the studied systems is<br />
<strong>in</strong>tegrated with<strong>in</strong> the supply cha<strong>in</strong> model <strong>in</strong> order to capture the ecosystem-fishery <strong>in</strong>teractions. The result<strong>in</strong>g<br />
supply cha<strong>in</strong> model is implemented <strong>in</strong> a material flow modell<strong>in</strong>g tool. This framework thus extends the ecosystem/supply<br />
cha<strong>in</strong> coupled model proposed by Christensen <strong>et</strong> al. (2011) by account<strong>in</strong>g for biophysical<br />
flows. To test the framework, scenario comparisons of supply cha<strong>in</strong>s based on Peruvian anchov<strong>et</strong>a (Engraulis<br />
r<strong>in</strong>gens) fishmeal are carried out. Scenarios are generated by vary<strong>in</strong>g the fish<strong>in</strong>g stage, <strong>in</strong> terms of catches<br />
volumes of anchov<strong>et</strong>a (and its predators) and the <strong>in</strong>tended “fate” of land<strong>in</strong>gs (direct or <strong>in</strong>direct human consumption,<br />
served by different fle<strong>et</strong>s and deliver<strong>in</strong>g different f<strong>in</strong>al products/species to consumers).<br />
The material flow modell<strong>in</strong>g tool used proves useful for representation of <strong>in</strong>terdependent <strong>in</strong>dustrial processes<br />
(i.e. supply cha<strong>in</strong>s) as P<strong>et</strong>ri n<strong>et</strong>s (Fig. 1) and Sankey diagrams, as well as provid<strong>in</strong>g the programm<strong>in</strong>g environment<br />
required to code the required material, energy and mon<strong>et</strong>ary flows logic. <strong>LCA</strong> and other life cycle<br />
tools provided the data and m<strong>et</strong>hods for extend<strong>in</strong>g the material and energy flows analysis towards susta<strong>in</strong>ability<br />
assessment, <strong>in</strong> such a way that basic mass and energy flows are complemented with specific biophysical<br />
flows (e.g. energy/nutritional value of substances). Indicators used (Fig. 2; Table 1), scaled respect to a<br />
functional unit, are based on a) energy use: Cumulative Energy Demand; b) energy efficiency: edible prote<strong>in</strong><br />
EROI (Tyedmers 2000); c) seafood-specific impact categories: Biotic Resource Use approximated from the<br />
primary production appropriation of feed <strong>in</strong>gredients, especially fish-derived (Pauly & Christensen, 1995)<br />
and a related ecological footpr<strong>in</strong>t; and d) nutritional value for the consumer: prote<strong>in</strong>/lipid content of raw materials<br />
and co-products. Socio-economic factors considered are limited to the most accessible ones (employment,<br />
added value). Alternative exploitation scenarios along the whole ecosystem-supply cha<strong>in</strong> are obta<strong>in</strong>ed<br />
by coupl<strong>in</strong>g models: outputs from a published trophic model (Ecopath with Ecosim) of the Humboldt Current<br />
ecosystem are used as <strong>in</strong>puts of a material flow analysis model (Umberto). The coupled model, <strong>in</strong>dicators<br />
and communication devices are currently <strong>in</strong> progress.<br />
Conclusions derived from the model will be suitable for policy recommendations regard<strong>in</strong>g exploitation volumes<br />
and seafood process<strong>in</strong>g strategies, aim<strong>in</strong>g at different <strong>in</strong>terests: ecosystem health, human nutrition,<br />
food security, energy efficiency, reduction of environmental impacts and rent redistribution.<br />
References<br />
Christensen, V., Steenbeek, J., & Failler, P., 2011. A comb<strong>in</strong>ed ecosystem and value cha<strong>in</strong> model<strong>in</strong>g approach<br />
for evaluat<strong>in</strong>g soci<strong>et</strong>al cost and benefit of fish<strong>in</strong>g. Ecological Modell<strong>in</strong>g, 222(3), 857-864.<br />
Pauly, D., & Christensen, V., 1995. Primary production required to susta<strong>in</strong> global fisheries. Nature,<br />
374(6519), 255-257.<br />
Tyedmers, P., 2000. Salmon and Susta<strong>in</strong>ability: The biophysical cost of produc<strong>in</strong>g salmon through the commercial<br />
salmon fishery and the <strong>in</strong>tensive salmon culture <strong>in</strong>dustry. Ph.D. Dissertation. The University of<br />
British Columbia.<br />
703
GROUP 1, SESSION A: ANIMAL PRODUCTION SYSTEMS 8 th Int. Conference on <strong>LCA</strong> <strong>in</strong> the<br />
Figure 1. Proposed P<strong>et</strong>ri n<strong>et</strong> of a Peruvian anchov<strong>et</strong>a-based supply cha<strong>in</strong>s model.<br />
704<br />
P24:Nutrients<br />
P7:Natural<br />
energy<br />
P27:D<strong>et</strong>ritus<br />
P2:Anchov<strong>et</strong>a<br />
mortalities and<br />
migration<br />
P26:Predators<br />
mortalities and<br />
migration<br />
T1:Ecosystem<br />
dynamics<br />
(anchov<strong>et</strong>a)<br />
<br />
P23:Predators<br />
biomass<br />
(stock)<br />
P8:Anchov<strong>et</strong>a<br />
biomass<br />
(stock)<br />
P20:Plankton<br />
biomass<br />
(Ew E functional<br />
groups 1-7)<br />
P1:Anchov<strong>et</strong>a<br />
biomass<br />
P25:Predators<br />
biomass<br />
P13:Abiotic<br />
materials<br />
P14:Biotic<br />
materials<br />
P15:Auxiliary<br />
energy<br />
P13:Abiotic<br />
materials<br />
P14:Biotic<br />
materials<br />
P15:Auxiliary<br />
energy<br />
T2:Fish<strong>in</strong>g<br />
P16:CED<br />
P17:ReCiPe<br />
P18:EF, BRU<br />
P16:CED<br />
P17:ReCiPe<br />
T14:Fish<strong>in</strong>g<br />
(predators)<br />
P18:EF, BRU<br />
Agri-<strong>Food</strong> Sector, 1-4 Oct <strong>2012</strong><br />
Figure 2. Proposed representation for susta<strong>in</strong>ability scores of selected seafood supply cha<strong>in</strong>s based on Peruvian<br />
anchov<strong>et</strong>a (dummy values and scenarios).<br />
Table 1. Key <strong>in</strong>dicators calculated.<br />
P3:Landed<br />
anchov<strong>et</strong>a<br />
P28:Landed<br />
predators<br />
P13:Abiotic<br />
materials<br />
P14:Biotic<br />
materials<br />
P15:Auxiliary<br />
energy<br />
P16:CED<br />
P17:ReCiPe<br />
P18:EF, BRU<br />
T3:Reduction<br />
P13:Abiotic<br />
materials<br />
P14:Biotic<br />
materials<br />
P15:Auxiliary<br />
energy<br />
P13:Abiotic<br />
materials<br />
P14:Biotic<br />
materials<br />
P15:Auxiliary<br />
energy<br />
T8:Production<br />
of agricultural<br />
<strong>in</strong>puts<br />
P10:Additional<br />
foodstuf<br />
P4:Fishmeal<br />
P12:Fish oil<br />
P16:CED<br />
P16:CED<br />
P17:ReCiPe<br />
P18:EF, BRU<br />
T7:Production<br />
of additional<br />
<strong>in</strong>puts<br />
P17:ReCiPe<br />
P18:EF, BRU<br />
P9:Additional<br />
<strong>in</strong>puts<br />
P13:Abiotic<br />
materials<br />
P14:Biotic<br />
materials<br />
P15:Auxiliary<br />
energy<br />
T5:Aquafeed<br />
process<strong>in</strong>g<br />
P13:Abiotic<br />
materials<br />
P14:Biotic<br />
materials<br />
P16:CED<br />
P17:ReCiPe<br />
P18:EF, BRU<br />
P15:Auxiliary<br />
energy<br />
P16:CED<br />
P17:ReCiPe<br />
T4:DHC<br />
process<strong>in</strong>g<br />
P18:EF, BRU<br />
P13:Abiotic<br />
materials<br />
P14:Biotic<br />
materials<br />
P15:Auxiliary<br />
energy<br />
Indicators Gross Energy Edible Biotic Resource <strong>LCA</strong><br />
Content prote<strong>in</strong> Use (g C/kg) Cumulative<br />
Comparison<br />
(MJ/kg) EROI (%) Ecological Energy<br />
objects<br />
Based on fat & prote<strong>in</strong><br />
Footpr<strong>in</strong>t (ha/t) Demand (MJ)<br />
Feed <strong>in</strong>gredients X X X<br />
Aquafeeds X X X<br />
P16:CED<br />
P17:ReCiPe<br />
P18:EF, BRU<br />
T9:Production<br />
of additional<br />
<strong>in</strong>puts<br />
P11:Additional<br />
<strong>in</strong>puts<br />
P5:Aquafeed<br />
P6:Seafood ready<br />
for distribution<br />
Socioeconomic<br />
<strong>in</strong>dicators<br />
Seafood products X X X X<br />
Supply cha<strong>in</strong>s /<br />
scenarios<br />
X X<br />
P13:Abiotic<br />
materials<br />
P14:Biotic<br />
materials<br />
P15:Auxiliary<br />
energy<br />
P15:Auxiliary<br />
energy<br />
P16:CED<br />
P17:ReCiPe<br />
P18:EF, BRU<br />
T6:Aquaculture<br />
P16:CED<br />
T10:Consumption<br />
P21:Dummy<br />
output
GROUP 1, SESSION A: ANIMAL PRODUCTION SYSTEMS 8 th Int. Conference on <strong>LCA</strong> <strong>in</strong> the<br />
Agri-<strong>Food</strong> Sector, 1-4 Oct <strong>2012</strong><br />
34. <strong>LCA</strong> of F<strong>in</strong>nish ra<strong>in</strong>bow trout, results and significance on different<br />
allocation m<strong>et</strong>hods<br />
Frans Silvenius 1,* , Juha Grönroos 2 , Hanna Hartika<strong>in</strong>en 1, , Sirpa Kurppa 1, , Markus Kanka<strong>in</strong>en 3 , Timo<br />
Mäk<strong>in</strong>en 3 , Raija Tahvonen 1, , Jouni Vielma 3<br />
1 MTT Agrifood Research F<strong>in</strong>land, Responsible <strong>Food</strong> Cha<strong>in</strong> – B<strong>et</strong>ter Consumer Well-be<strong>in</strong>g, FI 00790 Hels<strong>in</strong>ki,<br />
F<strong>in</strong>land 2 F<strong>in</strong>nish Environment Institute, P. O. Box 140, FI-00251 Hels<strong>in</strong>ki, F<strong>in</strong>land 3 F<strong>in</strong>nish Game<br />
and Fisheries Research Insitute, P.O. Box 2, FI-00791 Hels<strong>in</strong>ki, F<strong>in</strong>land, Correspond<strong>in</strong>g author. E-mail:<br />
frans.silvenius@mtt.fi<br />
An <strong>LCA</strong> of F<strong>in</strong>nish ra<strong>in</strong>bow trout was conducted <strong>in</strong> 2010-<strong>2012</strong> by MTT Agrifood Research F<strong>in</strong>land, F<strong>in</strong>nish<br />
Game and Research Insitute and F<strong>in</strong>nish Environment Institute. The functional unit of the study was one ton<br />
ra<strong>in</strong>bow trout fill<strong>et</strong> at the gate of the fish process<strong>in</strong>g plant. The system boundaries <strong>in</strong>cluded product cha<strong>in</strong> of<br />
feed raw materials, feed production, hatchery, fish farm<strong>in</strong>g plants, fish process<strong>in</strong>g, packages and transports.<br />
The impact classes studied were climate change, acidification, eutrophication, tropospheric ozone formation<br />
and primary energy use.<br />
One important part of the study was to make comparison to the previous <strong>LCA</strong> study of ra<strong>in</strong>bow trout (Seppälä<br />
<strong>et</strong> al. 2001, Silvenius and Grönroos 2003, Grönroos <strong>et</strong> al. 2006). Because of the development of feed<br />
and more effective feed<strong>in</strong>g of the fish, the environmental impacts of the ra<strong>in</strong>bow trout product cha<strong>in</strong> have<br />
reduced over 20%. The carbon footpr<strong>in</strong>t of the ra<strong>in</strong>bow trout <strong>in</strong> this study was about 4300 kg CO2/t of fill<strong>et</strong><br />
(Fig. 1)and eutrophication impact 38 kgPO4-eq/t of fill<strong>et</strong>.<br />
Allocation is one of the most biggest challenges related to <strong>LCA</strong>-<strong>in</strong>vestigations. In our study, the effects of<br />
different allocation m<strong>et</strong>hods to the results was studied. There have been some earlier studies concern<strong>in</strong>g effects<br />
of the allocation on the results of fish products <strong>LCA</strong>s (e.g. W<strong>in</strong>ther <strong>et</strong> al. 2009, Svanes <strong>et</strong> al. 2011). In<br />
our study, allocations based on different exist<strong>in</strong>g <strong>LCA</strong> standards were compared (Table 1). The allocation<br />
situations studied were allocation b<strong>et</strong>ween captured fish species used as raw materials for the fish meal and<br />
oil, allocation b<strong>et</strong>ween fish meal and oil, allocation b<strong>et</strong>ween soy meal and oil, rapeseed meal and oil and<br />
allocation b<strong>et</strong>ween fill<strong>et</strong> and by-products of slaughter<strong>in</strong>g and fill<strong>et</strong><strong>in</strong>g. Additionally, scenarios for the possible<br />
utilisation of the by-products were made.<br />
The chosen allocation m<strong>et</strong>hod had high effects on the f<strong>in</strong>al results. The mass allocation b<strong>et</strong>ween fish fill<strong>et</strong><br />
and by-products of the slaughter<strong>in</strong>g and fill<strong>et</strong><strong>in</strong>g resulted <strong>in</strong> lowest figures for environmental impacts. However,<br />
when us<strong>in</strong>g mass allocation for fish meal and oil raw material fish<strong>in</strong>g, and mass allocation b<strong>et</strong>ween soy<br />
meal and soy oil the estimated environmental impacts were highest.<br />
References<br />
Grönroos, J., Seppälä, J., Silvenius, F. & Mäk<strong>in</strong>en T., 2006. Life-cycle assessment of F<strong>in</strong>nish cultivated<br />
ra<strong>in</strong>bow trout. Boreal Environment Research 11:401-404.<br />
Hartika<strong>in</strong>en, H. 2011. Alloko<strong>in</strong>timen<strong>et</strong>telyt el<strong>in</strong>tarvikkeiden el<strong>in</strong>kaariarvio<strong>in</strong>neissa. Hels<strong>in</strong>g<strong>in</strong> yliopisto, Talousti<strong>et</strong>een<br />
laitos, Ympäristöekonomia, Pro gradu–tutkielma, Marraskuu 2011.<br />
Seppälä, J., Silvenius, F., Grönroos, J., Mäk<strong>in</strong>en, T., Silvo, K. & Storhammar, E. 2001. Kirjolohen tuotanto<br />
ja ympäristö. Suomen ympäristö 529. 164 pp.<br />
Silvenius, F. & Grönroos, J. 2003 Fish farm<strong>in</strong>g and the environment. Results of <strong>in</strong>ventory analysis. Suomen<br />
ympäristökeskuksen moniste 276, 71 pp.<br />
Svanes, E., Vold, M & Hanssen, O., J. 2011. Effect of different allocation m<strong>et</strong>hods on <strong>LCA</strong> results of products<br />
from wild-caught fish and on the use of such results. Int J Life Cycle Assess 16:512-521.<br />
W<strong>in</strong>ther, U., Ziegler, F., Hognes, E., Emanuelsson, A., Sund, V. & Ell<strong>in</strong>gsen, H. 2009. Carbon footpr<strong>in</strong>t and<br />
energy use of Norwegian seafood products. SINTEF Fisheries and Aquaculture, Norway.<br />
705
GROUP 1, SESSION A: ANIMAL PRODUCTION SYSTEMS 8 th Int. Conference on <strong>LCA</strong> <strong>in</strong> the<br />
Agri-<strong>Food</strong> Sector, 1-4 Oct <strong>2012</strong><br />
Table 1. The carbon footpr<strong>in</strong>t of ra<strong>in</strong>bow trout fill<strong>et</strong> calculated by different standards (Hartika<strong>in</strong>en 2011).<br />
706<br />
Standard<br />
Carbon<br />
footpr<strong>in</strong>t<br />
ILCD Handbook 4.2<br />
ISO14040 4.2-4.4<br />
GHG Protocol 4.1-4.3<br />
PAS 2050 4.2<br />
PCR Basic Module<br />
(2010a)<br />
2.4-4.4<br />
Figure 1. Carbon footpr<strong>in</strong>t of ra<strong>in</strong>bow trout fill<strong>et</strong> divided <strong>in</strong>to process stages.
GROUP 1, SESSION A: ANIMAL PRODUCTION SYSTEMS 8 th Int. Conference on <strong>LCA</strong> <strong>in</strong> the<br />
Agri-<strong>Food</strong> Sector, 1-4 Oct <strong>2012</strong><br />
35. Ma<strong>in</strong>stream<strong>in</strong>g Life Cycle Management <strong>in</strong> the seafood sector:<br />
us<strong>in</strong>g a sector based and regional approach <strong>in</strong> Northern <strong>France</strong><br />
Cather<strong>in</strong>e Beut<strong>in</strong> 1,* , Jodie Bricout 2 , Naeem Adibi 2 , Christelle Demar<strong>et</strong>z 3<br />
1 Aquimer comp<strong>et</strong>itivity cluster 16 rue du Commandant Charcot - 62200 Boulogne-sur-Mer, <strong>France</strong>, 2 cd2e –<br />
Plateforme [avniR], Rue de Bourgogne, Base du 11/19 62750 Loos en Gohelle, <strong>France</strong>, 3 Direction de<br />
l’environnement du Conseil Régional Nord-Pas de Calais, 141 rue Berthe Morisot, Lille, <strong>France</strong>, Correspond<strong>in</strong>g<br />
author. E-mail: cather<strong>in</strong>e.beut<strong>in</strong>@poleaquimer.com<br />
Whilst Life Cycle Management (LCM) is becom<strong>in</strong>g commonplace <strong>in</strong> larger corporations, or forward th<strong>in</strong>k<strong>in</strong>g<br />
governments, it is far from ma<strong>in</strong>stream. To achieve susta<strong>in</strong>able production and consumption patterns,<br />
LCM needs to be taken up by whole supply cha<strong>in</strong>s that <strong>in</strong>clude many small and medium enterprises. These<br />
bus<strong>in</strong>esses typically lack the f<strong>in</strong>ancial capacity or human resources to implement LC tools on their own, and<br />
are wary of work<strong>in</strong>g with support organisations outside of their sector or local area.<br />
The French comp<strong>et</strong>itively cluster Aquimer is pilot<strong>in</strong>g an <strong>in</strong>novative study to develop a strategic action plan<br />
to <strong>in</strong>tegrate Life Cycle Approaches (<strong>in</strong>clud<strong>in</strong>g eco-design and product environmental labell<strong>in</strong>g) <strong>in</strong>to bus<strong>in</strong>esses,<br />
education and research organisations <strong>in</strong> the seafood sector. Supported by the Nord Pas de Calais Regional<br />
Council and the ADEME (French Environment and Energy Management Agency), the study for the<br />
seafood sector is be<strong>in</strong>g undertaken <strong>in</strong> parallel with the textile, packag<strong>in</strong>g and mechanical sectors.<br />
The general process consists of four steps: benchmark, sector maturity assessment, needs identification, action<br />
plan development and Implementation.<br />
The benchmark identifies life cycle based <strong>in</strong>itiatives and tools relevant to seafood sector, focuss<strong>in</strong>g on, but<br />
not limited to North West Europe. The maturity of bus<strong>in</strong>esses, education bodies and research centres <strong>in</strong> the<br />
region with <strong>in</strong> relation to LCM practices is undertaken via <strong>in</strong>terviews with key stakeholders. Stakeholder<br />
engagement is a key aspect of the needs identification and action plan development phases, not only to ensure<br />
that the proposed LCM action plan “fits” the needs of the sector, but to create ownership for the implementation<br />
phase.<br />
The paper will also expla<strong>in</strong> how we develop an <strong>in</strong>ventory and a multi criteria matrix to measure the environmental<br />
maturity level of the seafood <strong>in</strong>dustry consider<strong>in</strong>g a life cycle vision <strong>in</strong> Nord Pas de Calais based<br />
on two ma<strong>in</strong> criteria: Maturity and will<strong>in</strong>gness of key actors for life cycle assessment and eco-design.<br />
This <strong>in</strong>novative approach to ma<strong>in</strong>stream<strong>in</strong>g LCM leverages sectorial and regional n<strong>et</strong>works to help overcome<br />
barriers to implementation. From a bus<strong>in</strong>ess perspective, <strong>in</strong>tegration with exist<strong>in</strong>g professional organisations<br />
means that SMEs access advice and tools through organisations that they already know and trust.<br />
References<br />
UNEP/SETAC. 2009. Life Cycle Management: How bus<strong>in</strong>ess uses it to decrease footpr<strong>in</strong>t, create opportunities<br />
and make value cha<strong>in</strong>s more susta<strong>in</strong>able.<br />
European Commission. 2003. COM Integrated Product Policy Build<strong>in</strong>g on Environmental Life-Cycle Th<strong>in</strong>k<strong>in</strong>g<br />
Boegl<strong>in</strong>. 2011. L’expérimentation nationale de l’affichage des caractéristiques environnementales <strong>in</strong> Proceed<strong>in</strong>gs<br />
<strong>LCA</strong> Conference 2011, 3-4 November Lille, <strong>France</strong><br />
707
GROUP 1, SESSION A: ANIMAL PRODUCTION SYSTEMS 8 th Int. Conference on <strong>LCA</strong> <strong>in</strong> the<br />
Agri-<strong>Food</strong> Sector, 1-4 Oct <strong>2012</strong><br />
36. Life cycle assessment of <strong>in</strong>tegrated fish pond aquaculture of<br />
household farms <strong>in</strong> sub-Saharan Africa<br />
Thomas Efole Ewoukem 5,* , Joël Aub<strong>in</strong> 1,2 , Olivier Mikolasek 4 , Michael S. Corson 1,2 , Hayo van der Werf 1,2 ,<br />
Dom<strong>in</strong>ique Ombredane 2,3<br />
1 INRA, UMR1069, Soil Agro and hydroSystem, F-35000 Rennes, <strong>France</strong>, 2 Agrocampus Ouest, F-35000,<br />
Rennes, <strong>France</strong>, 3 INRA, UMR0985, Ecology and Ecosystem Health, F-35000 Rennes, <strong>France</strong>, 4 CIRAD F-<br />
34398 Montpellier, <strong>France</strong>, 5 University of Dschang P.O.Box: 222 Dschang, Cameroon, * Correspond<strong>in</strong>g<br />
author. E-mail: efole_thomas@yahoo.fr<br />
Life Cycle Assessment (<strong>LCA</strong>) of <strong>in</strong>tegrated pond aquaculture of household farms <strong>in</strong> sub-Saharan Africa was<br />
carried out from 2008-2010 to identify ways to improve the systems and b<strong>et</strong>ter understand the contribution<br />
of fish-pond systems to regional susta<strong>in</strong>able development.<br />
A total of 20 polyculture fish ponds correspond<strong>in</strong>g to three types of <strong>in</strong>tegrated fishpond system (semi<strong>in</strong>tensive<br />
medium or small; extensive) were chosen after screen<strong>in</strong>g household farms with aquacultural activities.<br />
Thus, <strong>in</strong>land fish-farm production <strong>in</strong> two contrast<strong>in</strong>g areas of Cameroun was analysed. The fishproduction<br />
system were <strong>in</strong>tegrated <strong>in</strong> the farms with either pig- or crop-production systems. In all farms, fish<br />
production was a polyculture based on tilapia (Oreochromis niloticus) or a tilapia-catfish (Clarias gariep<strong>in</strong>us)<br />
association. Secondary species often were <strong>in</strong>cluded depend<strong>in</strong>g on the type of fish farm. For example,<br />
Hemichromis fasciatus or the snakehead fish (Parachana obscura) could be <strong>in</strong>cluded to control tilapia population<br />
size, while common carp (Cypr<strong>in</strong>us carpio) or H<strong>et</strong>erotis niloticus could be <strong>in</strong>cluded (accord<strong>in</strong>g to<br />
availability) due to their bottom-feed<strong>in</strong>g activity.<br />
<strong>LCA</strong> was conducted accord<strong>in</strong>g to the CML2001 m<strong>et</strong>hod adapted to aquaculture production us<strong>in</strong>g economic<br />
allocation (tak<strong>in</strong>g manure <strong>in</strong>to account), one tonne of fish as the functional unit, and background data from<br />
Ecoivent. The system boundary <strong>in</strong>cluded on-farm processes, production of feed and fertiliser, f<strong>in</strong>gerl<strong>in</strong>gs,<br />
and transportation at all stages. Dynamics of nitrogen and phosphorus were evaluated us<strong>in</strong>g a nutrient massbalance<br />
modell<strong>in</strong>g approach.<br />
With the exception of extensive systems, there was large variability <strong>in</strong> the magnitude of impacts with<strong>in</strong> each<br />
type of system. The ma<strong>in</strong> processes contribut<strong>in</strong>g to impacts were fish production, manure fertilisation, and<br />
fry production. Environmental impacts of the semi-<strong>in</strong>tensive systems analysed were high compared to similar<br />
aquatic systems <strong>in</strong> Brazil. Their low efficiency and the source and orig<strong>in</strong> of their <strong>in</strong>puts d<strong>et</strong>erm<strong>in</strong>ed the<br />
magnitude of impacts. A water-purification role of extensive systems was also observed. On the other hand,<br />
the amount of human labour, which plays a strong social role sub-Saharan Africa, was higher <strong>in</strong> all semi<strong>in</strong>tensive<br />
systems.<br />
708
GROUP 1, SESSION A: ANIMAL PRODUCTION SYSTEMS 8 th Int. Conference on <strong>LCA</strong> <strong>in</strong> the<br />
Agri-<strong>Food</strong> Sector, 1-4 Oct <strong>2012</strong><br />
37. Distribution of Norwegian fresh fish fill<strong>et</strong>s from an environmental<br />
and economic po<strong>in</strong>t of view<br />
Mie Vold * , Ole Jørgen Hanssen, Erik Svanes<br />
Ostfold Resarch, Fredrikstad, Norway, Correspond<strong>in</strong>g author. E-mail: mie@ostfoldforskn<strong>in</strong>g.no<br />
Optimisation towards more susta<strong>in</strong>able distribution solutions for fish fill<strong>et</strong>s are important topics <strong>in</strong> Norway.<br />
Several research projects have shown that it is important to consider the packag<strong>in</strong>g system from a holistic<br />
po<strong>in</strong>t of view, where the whole value cha<strong>in</strong> is <strong>in</strong>cluded. More material <strong>in</strong>tensive packag<strong>in</strong>g systems might be<br />
more susta<strong>in</strong>able if this leads to less loss of product through the value cha<strong>in</strong>. It is also important to consider<br />
how the effectiveness of packag<strong>in</strong>g systems can be improved, through maximis<strong>in</strong>g the volume of product <strong>in</strong><br />
relation to total pall<strong>et</strong> volume.<br />
Sea food is one of the most important export products from Norway. Dur<strong>in</strong>g the past years relatively more<br />
fish have been distributed as fil<strong>et</strong>s, and it is a long term strategy to distribute as much as possible as fil<strong>et</strong>s.<br />
Packag<strong>in</strong>g research <strong>in</strong> Norway has thus been focused on development of new solutions for sea food distribution.<br />
Through common projects f<strong>in</strong>anced by the Norwegian Research Council, new packag<strong>in</strong>g solutions have<br />
been developed, tested and optimised. Important drivers for <strong>in</strong>novation have been to develop solutions that<br />
are less volum<strong>in</strong>ous, less material <strong>in</strong>tensive, more effective <strong>in</strong> the pack<strong>in</strong>g process, utilise transport capacity<br />
b<strong>et</strong>ter and are easier to recycle after use and still preserve high quality and low product loss. In parallel, the<br />
traditional packag<strong>in</strong>g solutions have also been improved, to me<strong>et</strong> comp<strong>et</strong>ition from new solutions. For fresh<br />
products, time to mark<strong>et</strong> is a critical factor <strong>in</strong> distribution, and new solutions have also been developed to<br />
<strong>in</strong>crease the shelf life of fresh seafood products.<br />
This presentation will focus on experiences from <strong>in</strong>dustrial case studies of packag<strong>in</strong>g systems and distribution<br />
of fish fil<strong>et</strong>s, with ma<strong>in</strong> focus on changes from conventional pack<strong>in</strong>g with ice to super freez<strong>in</strong>g without<br />
ice and with new fibre based packag<strong>in</strong>g. The presentation <strong>in</strong>cludes life cycle data for processes and handl<strong>in</strong>g,<br />
production of packag<strong>in</strong>g materials, impacts on transport, convert<strong>in</strong>g to f<strong>in</strong>al packag<strong>in</strong>g solutions and<br />
treatment of packag<strong>in</strong>g waste resources (material, economic and energy data)<br />
References<br />
Rubach, S. & Hanssen, O.J. 2002. Nordic m<strong>et</strong>hods for documentation of packag<strong>in</strong>g optimisation. Proposal<br />
for Nordic m<strong>et</strong>hod – Part B. Benchmark<strong>in</strong>g system, Østfoldforskn<strong>in</strong>g.<br />
Hanssen, O.J. 1997. Susta<strong>in</strong>able product management. Dr.techn. thesis, Norwegian University of Science<br />
and Technology, Trondheim<br />
Nyland, C.A., Rubach, S., Hanssen, O.J., 2006. Value Cha<strong>in</strong> Analysis of Different Types of Distribution<br />
Packag<strong>in</strong>g For Fresh Fish Fill<strong>et</strong>s, Proceed<strong>in</strong>gs IAPRE Conference, Tokyo Oct. 2006.<br />
Svanes E., Vold M. and Hanssen O.J., 2011. Environmental assessment of cod (Gadus morhua) from autol<strong>in</strong>e<br />
fisheries. International Journal of Life Cycle Assessment, 16: 611-624.<br />
Svanes E., Vold M., Møller H., Kvalvåg P<strong>et</strong>tersen M, Larsen H. and Hanssen OJ, 2010. Susta<strong>in</strong>able Packag<strong>in</strong>g<br />
Design: a holistic m<strong>et</strong>hodology for packag<strong>in</strong>g design. Packag<strong>in</strong>g Technology and Science.<br />
Vold M, Hanssen O.J., Svanes E., 2006. Value Cha<strong>in</strong> Analysis of Different Types of Distribution Packag<strong>in</strong>g<br />
of Fresh Fish Fill<strong>et</strong>s, IAPRI conference,<br />
709
GROUP 1, SESSION A: ANIMAL PRODUCTION SYSTEMS 8 th Int. Conference on <strong>LCA</strong> <strong>in</strong> the<br />
Agri-<strong>Food</strong> Sector, 1-4 Oct <strong>2012</strong><br />
710<br />
38. System delimitation <strong>in</strong> life cycle assessment of aquaculture<br />
B<strong>in</strong>iam Samuel-Fitwi 1,2,* , Jan P. Schroeder 2 , Carsten Schulz 1,2<br />
1 Institute of Animal Breed<strong>in</strong>g and Animal Husbandry, Christian-Albrechts-Universität zu Kiel, 24098 Kiel,<br />
Germany, 2 Gesellschaft fuer Mar<strong>in</strong>e Aquakultur (GMA) mbH, Hafentoern 3, 25761 Buesum, Germany, <br />
Correspond<strong>in</strong>g author. E-mail: b<strong>in</strong>iam@gma-buesum.de<br />
In the past two decades, life cycle assessment (<strong>LCA</strong>) is recognised as a standardised and structured m<strong>et</strong>hod<br />
of evaluat<strong>in</strong>g the environmental impacts aris<strong>in</strong>g throughout the entire life cycle of a product, process or activity.<br />
However, m<strong>et</strong>hodological issues still exist, when allocat<strong>in</strong>g the environmental burden of a specific<br />
production system b<strong>et</strong>ween products and co-products. Accord<strong>in</strong>g to the ISO standards, the first option is to<br />
avoid allocation by mak<strong>in</strong>g use of a subdivision or to expand the systems <strong>in</strong>vestigated. Aquaculture system<br />
hardly applied system expansion whenever a multifunctional process has more than one functional flow. The<br />
objective of this study is to model the system expansion for aquaculture production. The different affected<br />
processes with co-products are selected for system expansion. Thus, <strong>in</strong> this study we have considered the<br />
system expansion <strong>in</strong> two different stages <strong>in</strong> the life cycle of the fish production: aquacultural stage, with case<br />
study of trout aquaculture; and feed manufactur<strong>in</strong>g stage. Ra<strong>in</strong>bow trout (Onchorhynchus mykiss) production<br />
was used as a case study to illustrate the m<strong>et</strong>hod us<strong>in</strong>g different scenarios of system expansion. This article<br />
showed that system expansion best describes the environmental impact of systems affected by <strong>in</strong>crease <strong>in</strong><br />
demand of ra<strong>in</strong>bow trout.<br />
Table 1. Relative emission load of ra<strong>in</strong>bow trout farm<strong>in</strong>g estimated follow<strong>in</strong>g different scenarios of system<br />
expansion. The results are characterised results and are related to the functional unit: 1 kg of ra<strong>in</strong>bow trout<br />
demanded <strong>in</strong> Germany.<br />
Impact cate-<br />
Scenario Scenario Scenario Scenario Scenario Scenario<br />
gory Unit I II III IV V VI<br />
Acidification<br />
kg SO2<br />
equiv. 0.0077 0.0083 0.0113 0.0113 0.0090 0.0086<br />
kg PO4<br />
Eutrophication equiv. 0.0600 0.0601 0.0604 0.0601 0.0599 0.0598<br />
Global warm- kg CO2<br />
<strong>in</strong>g<br />
Land comp<strong>et</strong>i-<br />
equiv. 0.7670 0.9000 2.3219 3.6333 2.5516 2.4500<br />
tion m²a 0.7422 0.7440 1.3030 1.0268 0.6013 0.5996<br />
Figure. 1 Relative emission load of ra<strong>in</strong>bow trout aquaculture us<strong>in</strong>g different system expansion scenarios.
GROUP 2, SESSION A: CARBON OR WATER FOOTPRINTS, SOIL, BIODIVERSITY 8 th Int. Conference on <strong>LCA</strong> <strong>in</strong> the<br />
Group 2, Session A : Carbon or Water Footpr<strong>in</strong>ts, Soil, Biodiversity<br />
Agri-<strong>Food</strong> Sector, 1-4 Oct <strong>2012</strong><br />
39. The assessment of biodiversity with<strong>in</strong> UK farm<strong>in</strong>g systems us<strong>in</strong>g<br />
an extended <strong>LCA</strong> ecosystem approach<br />
Cather<strong>in</strong>e Keel<strong>in</strong>g, Rob Lillywhite *<br />
School of Life Sciences, The University of Warwick, UK,<br />
robert.lillywhite@warwick.ac.uk<br />
Correspond<strong>in</strong>g author. E-mail:<br />
In 2009, the UK Government commissioned a three-year project to develop a m<strong>et</strong>hodology to assess the<br />
economic, environmental and social characteristics of UK farm<strong>in</strong>g systems. Thirty-two farm<strong>in</strong>g systems<br />
were identified to represent the diversity of UK agriculture and forty <strong>in</strong>dicators were described to cover a<br />
wide range of economic, environmental and social param<strong>et</strong>ers. The m<strong>et</strong>hodology uses a development of the<br />
exist<strong>in</strong>g Cranfield <strong>LCA</strong> model (Williams <strong>et</strong> al., 2007) comb<strong>in</strong>ed with newly developed economic and social<br />
matrices. A matrix was constructed to accommodate the data generated by the 1280 farm<strong>in</strong>g system/characteristic<br />
comb<strong>in</strong>ations. The matrix uses both actual and normalised values to <strong>in</strong>vestigate the advantages<br />
and disadvantages that accrue from different farm<strong>in</strong>g systems. This overall approach is described as an<br />
extended <strong>LCA</strong> ecosystem approach model. This paper reports on the <strong>in</strong>clusion of an aggregated biodiversity<br />
<strong>in</strong>dicator <strong>in</strong>to the m<strong>et</strong>hodology.<br />
One major difficulty <strong>in</strong> represent<strong>in</strong>g biodiversity is the def<strong>in</strong>ition and subsequent calculation of s<strong>in</strong>gle or<br />
multiple <strong>in</strong>dicators. S<strong>in</strong>gle <strong>in</strong>dicator species groups such as birds or carabids may be used, but effects of<br />
management practices have been shown to be specific to the different <strong>in</strong>dicator groups (Jeanner<strong>et</strong> <strong>et</strong> al.,<br />
2008). M<strong>et</strong>a-analyses have <strong>in</strong>vestigated the dose-effect relationships b<strong>et</strong>ween pressure factors and biodiversity<br />
<strong>in</strong> agricultural landscapes (Reidsma <strong>et</strong> al., 2006; Alkemade <strong>et</strong> al., 2009). Follow<strong>in</strong>g on from this work,<br />
ecosystem quality values (def<strong>in</strong>ed as the mean species abundance relative to the undisturbed situation) were<br />
assigned to each comb<strong>in</strong>ation of land-use type, <strong>in</strong>tensity level, and type of management (organic and nonorganic).<br />
Us<strong>in</strong>g data from the UK’s Farm Bus<strong>in</strong>ess Survey, an estimation of the rema<strong>in</strong><strong>in</strong>g ecosystem quality<br />
of each farm<strong>in</strong>g system could then be made.<br />
Highest ecosystem quality values were associated with the grass-based, low <strong>in</strong>tensity systems, whilst the<br />
lowest scores were obta<strong>in</strong>ed by the most <strong>in</strong>tensively housed livestock systems. With<strong>in</strong> production systems,<br />
the <strong>in</strong>dicator was capable of differentiat<strong>in</strong>g b<strong>et</strong>ween different types of management. For example, with<strong>in</strong> pig<br />
production, outdoor bred/<strong>in</strong>door f<strong>in</strong>ished systems scored higher than permanently housed systems. This<br />
m<strong>et</strong>hodology can be used to exam<strong>in</strong>e how changes <strong>in</strong> the farm<strong>in</strong>g landscape would affect levels of biodiversity;<br />
wh<strong>et</strong>her through land-use change, such as the conversion of grassland to arable land, through <strong>in</strong>tensification,<br />
or through conversion to organic production.<br />
References<br />
Alkemade, R., van Oorschot, M., Miles., L. Nellemann, C., Bakkenes, M., ten Br<strong>in</strong>k, B., 2009. GLOBIO3:<br />
A framework to <strong>in</strong>vestigate options for reduc<strong>in</strong>g global terrestrial biodiversity loss. Ecosystems 12, 374-<br />
390.<br />
Jeanner<strong>et</strong>, P., Baumgartner, D. U., Freiermuth Knuchel, R., Gaillard, G., 2008. A new LCIA m<strong>et</strong>hod for<br />
assess<strong>in</strong>g impacts of agricultural activities on biodiversity (SA<strong>LCA</strong>-Biodiversity). 6 th International Conference<br />
on Life Cycle Assessment <strong>in</strong> the Agri-<strong>Food</strong> Sector 2008, Proceed<strong>in</strong>gs, 34-39.<br />
Reidsma, P., Tekelenburg, T., van den Berg., M., Alkemade, R., 2006. Impacts of land-use change on biodiversity:<br />
an assessment of agricultural biodiversity <strong>in</strong> the European Union. Agriculture, Ecosystems and<br />
Environment 114, 86-102.<br />
Willams, A.G., Audsley, E., Sandars, D.L. 2006. D<strong>et</strong>erm<strong>in</strong><strong>in</strong>g the environmental burdens ands resource use<br />
<strong>in</strong> the production of agricultural and horticultural commodities. F<strong>in</strong>al report for Defra project IS0205.<br />
Cranfield University, Bedford and Defra, London.<br />
711
GROUP 2, SESSION A: CARBON OR WATER FOOTPRINTS, SOIL, BIODIVERSITY 8 th Int. Conference on <strong>LCA</strong> <strong>in</strong> the<br />
Agri-<strong>Food</strong> Sector, 1-4 Oct <strong>2012</strong><br />
712<br />
40. Proposal of a unified biodiversity impact assessment m<strong>et</strong>hod<br />
Jan P L<strong>in</strong>dner 1,* , Tabea Beck 2 , Sebastian Schwarz 3 , Ulrike Eberle 4 , Mart<strong>in</strong> Blumberg 5<br />
1 Fraunhofer IBP, dept. GaBi, Germany, 2 University of Stuttgart, LBP, dept. GaBi, Germany, 3 Five W<strong>in</strong>ds<br />
International, 4 Corsus – Corporate Susta<strong>in</strong>ability, Germany, 5 brands & values GmbH, Correspond<strong>in</strong>g author.<br />
E-mail: jan-paul.l<strong>in</strong>dner@ibp.fraunhofer.de<br />
Driven by the <strong>in</strong>sight of soci<strong>et</strong>y that biodiversity is worthy of protection, the decrease <strong>in</strong> habitats and species<br />
recently became a central topic <strong>in</strong> environmental policy. The European Union aims to study and to stop anthropogenic<br />
loss of biodiversity. In Germany this EU targ<strong>et</strong> led to the National Strategy on Biological Diversity<br />
(BMU 2007). Among others, one consensus po<strong>in</strong>t <strong>in</strong> environmental policy is that private and public actors<br />
need <strong>in</strong>struments to identify the “biodiversity performance” of product systems and services.<br />
A team under the lead of the GaBi department at Fraunhofer Institute for Build<strong>in</strong>g Physics (IBP) launched a<br />
project <strong>in</strong> <strong>2012</strong> to develop a m<strong>et</strong>hod for the assessment of the biodiversity impact of product systems. Regard<strong>in</strong>g<br />
future application the crucial po<strong>in</strong>t is that this tool has to be broadly accepted by scientific and economic<br />
actors. Thus, knowledge and experience of the <strong>LCA</strong> community must be <strong>in</strong>volved <strong>in</strong> the development<br />
of the m<strong>et</strong>hod.<br />
It is suggested that the assessment m<strong>et</strong>hod <strong>in</strong>cludes a prelim<strong>in</strong>ary quick check to decide on the extent to<br />
which the full m<strong>et</strong>hod should be applied (Fig. 1). Criteria may be land requirement or activities <strong>in</strong> biodiversity<br />
hot spots. The biodiversity impact assessment m<strong>et</strong>hod fits <strong>in</strong> the general land use impact assessment<br />
framework described <strong>in</strong> Milà i Canals <strong>et</strong> al. (2007). There, the impact of a land us<strong>in</strong>g process is def<strong>in</strong>ed as:<br />
Impact = affected area × duration of impact × quality change of the area<br />
The biodiversity impact assessment m<strong>et</strong>hod reflects the quality axis for the impact category “biodiversity”. It<br />
is loosely based on the m<strong>et</strong>hod proposed by Michelsen (2008) <strong>in</strong> that it employs region-specific characterisation<br />
models and allows aggregation across regions through weight<strong>in</strong>g factors. Biodiversity is described by<br />
means of a multidimensional potential function (Fig. 2). S<strong>et</strong>t<strong>in</strong>g the param<strong>et</strong>ers of the function s<strong>et</strong>s the biodiversity<br />
value for a certa<strong>in</strong> process at a certa<strong>in</strong> place. Comparison to the biodiversity value under given reference<br />
conditions allows the calculation of the quality change for the equation above. The form and param<strong>et</strong>ers<br />
of region-specific biodiversity potential functions are derived from literature research about the state of the<br />
regional ecosystem(s), national/regional conservation goals, as well as expert judgement. Weight<strong>in</strong>g factors<br />
for the aggregation across regions e.g. <strong>in</strong> global supply cha<strong>in</strong>s (Fig. 1) are derived from globally agreeable<br />
descriptors for biodiversity and/or ecosystem quality.<br />
The proposed m<strong>et</strong>hod allows relatively precise and accurate biodiversity impact assessment at the price of<br />
relatively high data acquisition. In the unified m<strong>et</strong>hod, the d<strong>et</strong>ailed procedure described above is used for the<br />
most relevant elements of a product system, as d<strong>et</strong>erm<strong>in</strong>ed by the quick check. A broad-brush impact assessment<br />
m<strong>et</strong>hod is applied to fill <strong>in</strong> the blanks for less relevant elements of the product system.<br />
References<br />
BMU, 2007. National Strategy on Biological Diversity. Federal M<strong>in</strong>istry for the Environment, Nature Conservation<br />
and Nuclear Saf<strong>et</strong>y (BMU), Public Relations Division, Berl<strong>in</strong>.<br />
Michelsen, O., 2008. Assessment of Land Use Impacts on Biodiversity. Proposal of a new m<strong>et</strong>hodology<br />
exemplified with forestry operations <strong>in</strong> Norway. Int. J. <strong>LCA</strong> 13 (1), 22-31.<br />
Milà i Canals, L., Bauer, C., Depestele, J., Dubreuil, A., Freiermuth Knuchel, R., Gaillard, G., Michelsen, O.,<br />
Müller-Wenk, R., Rydgren, B., 2007. Key elements <strong>in</strong> a framework for land use impact assessment with<strong>in</strong><br />
<strong>LCA</strong>. Int. J. <strong>LCA</strong> 12 (1), 5-15.
GROUP 2, SESSION A: CARBON OR WATER FOOTPRINTS, SOIL, BIODIVERSITY 8 th Int. Conference on <strong>LCA</strong> <strong>in</strong> the<br />
Agri-<strong>Food</strong> Sector, 1-4 Oct <strong>2012</strong><br />
Quick check<br />
Figure 1. M<strong>et</strong>hodology overview.<br />
Param<strong>et</strong>er 1<br />
Param<strong>et</strong>er 2<br />
Param<strong>et</strong>er 3<br />
Param<strong>et</strong>er n<br />
Param<strong>et</strong>er 1<br />
Param<strong>et</strong>er 2<br />
Param<strong>et</strong>er 3<br />
Param<strong>et</strong>er n<br />
High relevance<br />
Low relevance<br />
Figure 2. Region-specific impact model.<br />
Param<strong>et</strong>ers Biodiv potential<br />
Param<strong>et</strong>ers Actual biodiv<br />
Param<strong>et</strong>ers Biodiv potential<br />
Param<strong>et</strong>ers Actual biodiv<br />
Param<strong>et</strong>ers Biodiv potential<br />
Param<strong>et</strong>ers Actual biodiv<br />
Figure 3. Aggregation of several regional impacts.<br />
D<strong>et</strong>ailed<br />
assessment<br />
Coarse<br />
assessment<br />
Reference state<br />
Biodiversity<br />
potential<br />
Altered state<br />
Actual state of<br />
Biodiversity<br />
Regional impact model 1<br />
Regional impact model 2<br />
Regional impact model n<br />
Impact<br />
Aggregation<br />
Impact Weight<br />
Impact<br />
Unified result<br />
Weight<br />
Weight<br />
Impact of<br />
alteration<br />
Total impact<br />
713
GROUP 2, SESSION A: CARBON OR WATER FOOTPRINTS, SOIL, BIODIVERSITY 8 th Int. Conference on <strong>LCA</strong> <strong>in</strong> the<br />
Agri-<strong>Food</strong> Sector, 1-4 Oct <strong>2012</strong><br />
714<br />
41. Display<strong>in</strong>g environmental footpr<strong>in</strong>ts of agricultural products: a<br />
“biodiversity” <strong>in</strong>dicator based on landscape features<br />
Anton<strong>in</strong> Vergez * , Mart<strong>in</strong> Bortzmeyer<br />
M<strong>in</strong>istry of Ecology, Susta<strong>in</strong>able Development and Energy, CGDD, * Correspond<strong>in</strong>g author. E-mail: anton<strong>in</strong>.vergez@developpement-durable.gouv.fr<br />
Susta<strong>in</strong>able household consumption can be an important eng<strong>in</strong>e for a greener economic growth. Introduc<strong>in</strong>g<br />
<strong>in</strong>formation about the environmental impacts of products throughout their life cycle is one way to make the<br />
global consumption system more susta<strong>in</strong>able. In <strong>France</strong>, the “Grenelle” environmental laws <strong>in</strong>troduce the<br />
right for consumers to have <strong>in</strong>formation related to the multi-criteria environmental footpr<strong>in</strong>t of (mass mark<strong>et</strong>)<br />
products at the po<strong>in</strong>t of sale. A year-long experiment began <strong>in</strong> July 2011 <strong>in</strong>volv<strong>in</strong>g around 160 volunteer<br />
companies and other relevant economic stakeholders. Because the agricultural and food sectors are concerned,<br />
it is expected that provid<strong>in</strong>g consumers with this environmental <strong>in</strong>formation could have a positive<br />
effect and lead the whole food cha<strong>in</strong>, from farmers to r<strong>et</strong>ailers, to produce and mark<strong>et</strong> more susta<strong>in</strong>able<br />
goods.<br />
This legislative pillar of the French system relies on the technical ADEME AFNOR platform (expertise and<br />
standardisation) build<strong>in</strong>g m<strong>et</strong>hodological documents with all concerned stakeholders. In the food, beverage<br />
and p<strong>et</strong>-food sector, the transversal m<strong>et</strong>hodological document f<strong>in</strong>alised <strong>in</strong> April <strong>2012</strong> by the platform recommends<br />
us<strong>in</strong>g 100 mg or 100 ml as a functional unit and address<strong>in</strong>g the follow<strong>in</strong>g environmental impact<br />
<strong>in</strong>dicators, units (and degrees of precision) and calculation m<strong>et</strong>hods: greenhouse gas emissions (<strong>in</strong> kg eqCO2,<br />
us<strong>in</strong>g IPCC 2007), water consumption (litres, us<strong>in</strong>g n<strong>et</strong> consumption), water eutrophication (<strong>in</strong> g EqN, us<strong>in</strong>g<br />
ReCiPe), water ecotoxicity (CTUe, us<strong>in</strong>g USEtox), and impacts on biodiversity (but do not recommend any<br />
unit or m<strong>et</strong>hod for this issue: it has to be def<strong>in</strong>ed).<br />
The French M<strong>in</strong>istry of Ecology, Susta<strong>in</strong>able Development and Energy (MEDDE CGDD) decided to f<strong>in</strong>ance<br />
a study to propose such a product-level biodiversity <strong>in</strong>dicator because i) a multi-criteria environmental footpr<strong>in</strong>t<br />
is more representative, ii) stakeholders of the ADEME AFNOR platform have identified biodiversity as<br />
an environmental challenge to address, iii) agriculture’s contribution to both loss and preservation or improvement<br />
of biodiversity is important <strong>in</strong> the world and <strong>in</strong> <strong>France</strong>, and iv) exist<strong>in</strong>g <strong>LCA</strong> m<strong>et</strong>hods to address<br />
biodiversity impacts of food and agricultural products are unsatisfactory: based on land “occupation” or<br />
“consumption”, they associate higher impacts with more extensive farm<strong>in</strong>g practices. The poster presents the<br />
ma<strong>in</strong> characteristics of this study, which will end <strong>in</strong> autumn <strong>2012</strong>.<br />
A call for tenders specified the type of biodiversity <strong>in</strong>dicator to build. It i) has to express not only loss or<br />
impacts but also a positive contribution to biodiversity; ii) could be specific to the farm level, s<strong>in</strong>ce major<br />
biodiversity impacts of food products are concentrated <strong>in</strong> the agricultural production phase; iii) has to be<br />
calculated as a ratio divid<strong>in</strong>g a quantity of biodiversity by a quantity of product; and iv) has to be consistent<br />
with biodiversity <strong>in</strong>dicators already used <strong>in</strong> exist<strong>in</strong>g agricultural policies (CAP good agricultural and environmental<br />
conditions, CAP second pillar subsidies for grasslands and French farm environmental certification<br />
scheme). Two companies, Solagro (an agro-environmental consultancy firm) and ACTA (French agricultural<br />
technical <strong>in</strong>stitutes), were selected to perform.<br />
Consequently, “landscape features”, which are “semi-natural, unfarmed or extensively farmed environments”,<br />
were the proxy chosen to characterise biodiversity. Examples <strong>in</strong> the database cover extensive permanent<br />
grasslands and temporary grasslands with low nitrogen <strong>in</strong>puts, hedges, ponds, ditches, trees <strong>in</strong> a l<strong>in</strong>e<br />
or <strong>in</strong> a group, isolated trees, field marg<strong>in</strong>s and terraces, land left fallow, buffer strips, <strong>et</strong>c.<br />
The year-long study is divided <strong>in</strong>to 3 phases: i) stabilise m<strong>et</strong>hodology and def<strong>in</strong>itions and start data collection<br />
(3 months); ii) calculate values of the biodiversity <strong>in</strong>dicator for the selected agricultural products (6<br />
months); and iii) discuss the results and properties of the <strong>in</strong>dicator (3 months). Selected animal products are<br />
cow milk, cow meat (dairy or beef cattle), sheep meat, sheep milk, lamb meat, pig meat, chicken meat,<br />
chicken eggs. Selected plant products are wheat, barley, maize, sunflower, rapeseed, potatoes, prote<strong>in</strong> crops,<br />
orchards, v<strong>in</strong>eyard, sugarbe<strong>et</strong>s, grapes, apples, tomatoes, veg<strong>et</strong>ables, and fodder (silage maize, permanent<br />
and temporary grasslands, fallows).<br />
Three different approaches are used to calculate this <strong>in</strong>dicator: i) national statistical databases (National Forestry<br />
Inventory 2nd cycle, TERUTI-Lucas, National Agricultural Survey 2000), ii) representative farms for<br />
typical production systems (database of agricultural <strong>in</strong>stitutes) and iii) the farm database DIALECTE (conta<strong>in</strong><strong>in</strong>g<br />
around 2000 extensive agricultural units). “Landscape features” are measured at different levels depend<strong>in</strong>g<br />
on the database, for example, at the commune level (<strong>in</strong> the national database) or at the farm
GROUP 2, SESSION A: CARBON OR WATER FOOTPRINTS, SOIL, BIODIVERSITY 8 th Int. Conference on <strong>LCA</strong> <strong>in</strong> the<br />
Agri-<strong>Food</strong> Sector, 1-4 Oct <strong>2012</strong><br />
level. S<strong>in</strong>ce “landscape features” are of very different natures (grasslands, hedges, trees, <strong>et</strong>c.), four types of<br />
weight<strong>in</strong>g coefficients are used to convert them <strong>in</strong>to “biodiversity-equivalent area”, an estimated real surface<br />
area for which all coefficients of different “landscape features” are equal to 1 (CAP and direct-aid ecoconditionality<br />
coefficients, developed-area coefficients and coefficients based on developed areas but that<br />
also consider agricultural practices).<br />
Initial results show that it is possible to l<strong>in</strong>k an agricultural product with a quantity of biodiversity. Y<strong>et</strong>,<br />
much work is still required, for example, consider<strong>in</strong>g yield effects, allocation b<strong>et</strong>ween co-products or biodiversity<br />
impacts l<strong>in</strong>ked to animal-feed production. Results will be verified and compared <strong>in</strong> phase 3, which<br />
will also consist of an analysis of the <strong>in</strong>dicator's properties. Its ma<strong>in</strong> advantages are its existence (given the<br />
scarcity or absence of similar <strong>in</strong>dicators), its practicality and feasibility (to calculate an <strong>in</strong>dicator based on<br />
“landscape features” for several different agricultural products us<strong>in</strong>g several databases and entry levels), its<br />
consistency with other agricultural policy <strong>in</strong>dicators, its ability to measure a positive contribution to biodiversity<br />
and its acceptability by farmers. Its ma<strong>in</strong> limits and drawbacks <strong>in</strong>clude that it is specific to the farmand<br />
farm<strong>in</strong>g-production phase (it is thus not a life cycle <strong>in</strong>dicator) and it is very recent (pioneer<strong>in</strong>g and open<strong>in</strong>g<br />
a new <strong>in</strong>ternational research agenda). We conclude by <strong>in</strong>sist<strong>in</strong>g on the urgent need to develop academic<br />
and operational research to consolidate this agricultural-product-level biodiversity <strong>in</strong>dicator or to build a<br />
b<strong>et</strong>ter one that conta<strong>in</strong>s the properties desired.<br />
References<br />
IPCC, 2007. Intergovernmental Panel on Climate Change.<br />
MEDDE (French M<strong>in</strong>istry of Ecology, Susta<strong>in</strong>able Development and Energy), <strong>2012</strong>a. Display of the environmental<br />
footpr<strong>in</strong>ts of products: French developments. Onl<strong>in</strong>e: http://www.developpementdurable.gouv.fr/Product-Environmental-Footpr<strong>in</strong>t.html<br />
MEDDE (French M<strong>in</strong>istry of Ecology, Susta<strong>in</strong>able Development and Energy), <strong>2012</strong>b. Expérimentation nationale<br />
de l'affichage environnemental. Onl<strong>in</strong>e: http://www.developpement-durable.gouv.fr/-<br />
Experimentation-de-l-affichage,4303-.html<br />
Solagro and ACTA, <strong>2012</strong>a. Indicateur biodiversité pour l'affichage environnemental des produits agricoles.<br />
Rapport f<strong>in</strong>al de la phase 1 au MEDDE CGDD, February <strong>2012</strong>, 82 p.<br />
Solagro and ACTA, <strong>2012</strong>b. Indicateur biodiversité pour l'affichage environnemental des produits agricoles.<br />
Rapport f<strong>in</strong>al de la phase 2 au MEDDE CGDD, June <strong>2012</strong>, 107 p.<br />
Solagro and ACTA, <strong>2012</strong>c. Indicateur biodiversité pour l'affichage environnemental des produits agricoles.<br />
Rapport f<strong>in</strong>al de la phase 2 au MEDDE CGDD, October <strong>2012</strong>.<br />
715
GROUP 2, SESSION A: CARBON OR WATER FOOTPRINTS, SOIL, BIODIVERSITY 8 th Int. Conference on <strong>LCA</strong> <strong>in</strong> the<br />
Agri-<strong>Food</strong> Sector, 1-4 Oct <strong>2012</strong><br />
42. Carbon footpr<strong>in</strong>t of the Chilean apple orchard system: study <strong>in</strong> the<br />
ma<strong>in</strong> southern hemisphere producer<br />
Alfredo Iriarte 1,2,* , Pablo Villalobos 3 , Pablo Yañez 3 , Carlos Huenchuleo 3<br />
1 Department of Industrial Management and Modell<strong>in</strong>g. Faculty of Eng<strong>in</strong>eer<strong>in</strong>g. Universidad de Talca.<br />
Casilla 747, Talca, Chile, 2 Chilean <strong>Food</strong> Process<strong>in</strong>g Research Centre (Centro de Estudios en Alimentos<br />
Procesados CEAP). R09I2001. Av. San Miguel km 2. Talca, Chile, 3 Department of Agricultural Economics.<br />
Faculty of Agricultural Sciences. Universidad de Talca. Casilla 747, Talca, Chile, Correspond<strong>in</strong>g author. Email:<br />
airiarte@utalca.cl<br />
Chile is a major off-season fruit supplier and covers a significant portion of fresh fruit imports made by the<br />
United States, the European Union and Japan. Chile is the largest southern hemisphere producer and exporter<br />
of apple (CCM, 2010). Estimat<strong>in</strong>g carbon footpr<strong>in</strong>t of agricultural systems is becom<strong>in</strong>g an important issue<br />
for country’s horticulture sector. This study evaluated, us<strong>in</strong>g a life-cycle approach, the carbon footpr<strong>in</strong>t of<br />
the <strong>in</strong>tensive apple orchard system <strong>in</strong> Chile. The m<strong>et</strong>hodology used is accord<strong>in</strong>g to the PAS 2050 specifications<br />
(BSI, 2008). The system boundaries <strong>in</strong>cluded all the life cycle stages from the cradle to the farm gate<br />
(harvested apples). The apple production analysed <strong>in</strong> this study corresponds to nationwide representative<br />
practices. The results <strong>in</strong>dicated that m<strong>in</strong>eral fertilisers caused the major contribution to the carbon footpr<strong>in</strong>t.<br />
In contrast, packag<strong>in</strong>g waste had a m<strong>in</strong>or <strong>in</strong>fluence. The application of the life-cycle approach helped to<br />
identify improvement measures to reduce greenhouse gas emissions of the orchard production system.<br />
References<br />
BSI, 2008. PAS 2050:2008 Specification for the assessment of the life cycle greenhouse gas emissions of<br />
goods and services. British Standards Institution (BSI). London, UK.<br />
CCM (Centro de Comp<strong>et</strong>ividad del Maule), 2000. Manzanos. Universidad de Talca, Talca.<br />
716
GROUP 2, SESSION A: CARBON OR WATER FOOTPRINTS, SOIL, BIODIVERSITY 8 th Int. Conference on <strong>LCA</strong> <strong>in</strong> the<br />
Agri-<strong>Food</strong> Sector, 1-4 Oct <strong>2012</strong><br />
43. Assessment of carbon footpr<strong>in</strong>t m<strong>et</strong>hodologies used to evaluate<br />
Mediterranean horticultural production <strong>in</strong> standard multi-tunnel<br />
greenhouses<br />
Rubén Beltrán-Palafox 1 , Julia Martínez-Blanco 2,* , Joan Rieradevall 2,3 , Assumpció Antón 4,5 , Pere Muñoz 5<br />
1 Jo<strong>in</strong>t European Master <strong>in</strong> Environmental Sciences (JEMES), Universitat Autònoma de Barcelona (UAB).<br />
08193 Bellaterra Barcelona, Spa<strong>in</strong>, 2 Institute of Environmental Science and Technology (ICTA), Universitat<br />
Autònoma de Barcelona (UAB). 08193 Bellaterra, Barcelona, Spa<strong>in</strong>, 3 Chemical Eng<strong>in</strong>eer<strong>in</strong>g Department,<br />
Universitat Autònoma de Barcelona (UAB). 08193 Bellaterra, Barcelona, Spa<strong>in</strong>, 4 Departament d’Eng<strong>in</strong>yeria<br />
Química, Universitat Rovira i Virgili (URV). 43007 Tarragona, Spa<strong>in</strong>, 5 Institute of Research and Technology<br />
<strong>in</strong> Agrifood Sector (IRTA), Environmental Horticulture. 08348 Cabrils, Barcelona, Spa<strong>in</strong>, Correspond<strong>in</strong>g<br />
author. E-mail: julia.mart<strong>in</strong>ez@uab.cat<br />
Evaluat<strong>in</strong>g the environmental behaviour of the agri-food products has become an essential issue, not only to<br />
avoid the pollution, but also to reduce potential threats to human health and to assure the provision of b<strong>et</strong>ter<br />
quality food. Furthermore, novel demand<strong>in</strong>g consumers are concerned about this <strong>in</strong>formation and they are<br />
also aware of the possible carbon footpr<strong>in</strong>t <strong>in</strong>flicted by their consumption habits. Carbon footpr<strong>in</strong>t has become<br />
a popular tool to measure the impact of products <strong>in</strong> the environment because it is easy to use and understand<br />
and the study times are shorter and cheaper than other environmental m<strong>et</strong>hodologies. One drawback<br />
of this approach is the different m<strong>et</strong>hodologies that simultaneously exist and that provide different, and<br />
som<strong>et</strong>imes contradictory, results regard<strong>in</strong>g the environmental impact of products (Brenton <strong>et</strong> al., 2010).<br />
This project aims to compare three well-known carbon footpr<strong>in</strong>t m<strong>et</strong>hodologies: The PAS2050:2011, the<br />
French Bilan Carbone and the WBCSD’s GHG Protocol (see Table 1). The comparison highlights the different<br />
results due to variations <strong>in</strong> the procedure of each carbon footpr<strong>in</strong>t m<strong>et</strong>hodology when it is applied to agricultural<br />
systems (i.e. <strong>in</strong>clud<strong>in</strong>g capital goods, allocation criteria, <strong>in</strong>ventory orig<strong>in</strong>, system boundaries and<br />
expansion, carbon s<strong>in</strong>ks, land use and/or transportation approaches among the most important variations).<br />
The study evaluates the environmental impact of five horticultural products: tomato, l<strong>et</strong>tuce, beans, green<br />
peas and cucumber. The scope of the experiment also <strong>in</strong>cludes the evaluation of two fertilis<strong>in</strong>g treatments,<br />
<strong>in</strong>clud<strong>in</strong>g the application of m<strong>in</strong>eral fertilisers and compost (Martínez-Blanco, 2011). The stages assessed<br />
<strong>in</strong>clude the fertilisers production and transport, the cultivation stage and the greenhouse phase.<br />
The exclusion of capital goods represents a 4-16% decrease <strong>in</strong> the total CF when compared to the footpr<strong>in</strong>t<br />
measured by the GHG protocol and the Bilan Carbone. The <strong>in</strong>clusion of <strong>in</strong>direct processes (i.e. commut<strong>in</strong>g<br />
employees) and the capital goods generate an <strong>in</strong>crease of 12-50% <strong>in</strong> the CF. Additionally, when <strong>in</strong>clud<strong>in</strong>g<br />
the capital goods and add<strong>in</strong>g a commercialisation stage (that <strong>in</strong>cludes packag<strong>in</strong>g and transportation towards<br />
the r<strong>et</strong>ail mark<strong>et</strong>s) the CF suffers an <strong>in</strong>crease of 6-40% from the one obta<strong>in</strong>ed under the PAS 2050 param<strong>et</strong>ers.<br />
The packag<strong>in</strong>g sub-stage provides 99% of the total impact with<strong>in</strong> the commercialisation stage. These<br />
variations could be avoided if the system boundaries are extended to the end user stage, as suggested by the<br />
Bilan Carbone m<strong>et</strong>hodology; and <strong>in</strong>clud<strong>in</strong>g <strong>in</strong>direct processes, as considered by the GHG protocol. Paradoxically,<br />
still very few changes among the m<strong>et</strong>hodologies provide relevant variations (of more than 5%) <strong>in</strong><br />
the carbon footpr<strong>in</strong>t calculations.<br />
References<br />
Brenton, P., Edwards-Jones, G., & Friis Jensen, M. Carbon Footpr<strong>in</strong>ts and <strong>Food</strong> Systems. The World Bank<br />
Publications, 2010.<br />
Martínez-Blanco, J. Muñoz, P., Antón A., Rieradevall, J. Assessment of tomato Meditarrean production <strong>in</strong><br />
open-filed and standard multi-tunnel greenhouse, with compost or m<strong>in</strong>eral fertilisers, from an agricultural<br />
and environmental standpo<strong>in</strong>t, 2011. J Clean. Prod. 19, 985-997.<br />
Martínez-Blanco, J. Rieradevall, J., Muñoz, P., Pascua, P., Oliver-Solà, J., Gabarrell, X., Gasol, C., <strong>2012</strong>.<br />
Comparison of life cycle m<strong>et</strong>hodologies for the GHG assessment: CF and <strong>LCA</strong> <strong>in</strong> the horticulture sector .<br />
Int. J <strong>LCA</strong>.<br />
717
GROUP 2, SESSION A: CARBON OR WATER FOOTPRINTS, SOIL, BIODIVERSITY 8 th Int. Conference on <strong>LCA</strong> <strong>in</strong> the<br />
Agri-<strong>Food</strong> Sector, 1-4 Oct <strong>2012</strong><br />
Table 1. Ma<strong>in</strong> <strong>in</strong>formation of the Carbon footpr<strong>in</strong>t m<strong>et</strong>hodologies <strong>in</strong>cluded <strong>in</strong> the study<br />
M<strong>et</strong>hodology PAS 2050 Bilan Carbone Greenhouse Gas Protocol<br />
Developer Bristish Standards Institute (BSI)<br />
Agence de l’Environnment <strong>et</strong> de la<br />
Maîtrise de l’Energie (ADEME)<br />
World Resources Institute (WRI) / World Bus<strong>in</strong>ess<br />
Council for Susta<strong>in</strong>able Development (WBCSD)<br />
Country of orig<strong>in</strong> United K<strong>in</strong>gdom <strong>France</strong> United States<br />
Last update 2011 2007 2007<br />
Government sponsorship Yes Yes No<br />
Reach<br />
Extensively used with<strong>in</strong> the UK, but<br />
also <strong>in</strong> Japan, Western Europe and<br />
Northern Africa<br />
Used only <strong>in</strong> <strong>France</strong> and Belgium<br />
Used and promoted <strong>in</strong> the US, Brazil, Europe, India,<br />
Ch<strong>in</strong>a, Mexico and Australia<br />
Annexes on agricultural<br />
products<br />
Yes Unidentified Yes<br />
L<strong>in</strong>k www.bsigroup.com<br />
www.r-co2.com/Bilan-Carbone-<br />
ADEME--FRANCAIS<br />
www.ghgprotocol.org<br />
718
GROUP 2, SESSION A: CARBON OR WATER FOOTPRINTS, SOIL, BIODIVERSITY 8 th Int. Conference on <strong>LCA</strong> <strong>in</strong> the<br />
Agri-<strong>Food</strong> Sector, 1-4 Oct <strong>2012</strong><br />
44. Carbon footpr<strong>in</strong>t and energy use of different options for<br />
greenhouse tomato production<br />
Joana Almeida 1,* , Wouter Achten 1,2 , Bruno Verbist 1 , Bart Muys 1,*<br />
1 Group Forest Ecology and Management, Department of Earth and Environmental Sciences, University of<br />
Leuven, Belgium, 2 Department of M<strong>et</strong>allurgy and Materials Eng<strong>in</strong>eer<strong>in</strong>g, University of Leuven, Belgium, <br />
Correspond<strong>in</strong>g authors. E-mail: joana.almeida@ees.kuleuven.be; bart.muys@ees.kuleuven.be<br />
Ris<strong>in</strong>g susta<strong>in</strong>ability awareness makes consumers <strong>in</strong>creas<strong>in</strong>gly <strong>in</strong>terested <strong>in</strong> the environmental performance<br />
of the products on the mark<strong>et</strong>, concern<strong>in</strong>g e.g. the emission of greenhouse gases (GHG). For this reason,<br />
there are mark<strong>et</strong>-driven environmental impact assessment tools, which can both <strong>in</strong>form consumers and be<br />
used by producers to highlight their susta<strong>in</strong>ability efforts. The carbon footpr<strong>in</strong>t has been suggested as<br />
straightforward and resonant <strong>in</strong>dicator for product environmental performance (Weidema <strong>et</strong> al., 2008).<br />
In this case-study we report the carbon footpr<strong>in</strong>t and energy use of the production of Cuore di bue tomatoes<br />
<strong>in</strong> a greenhouse <strong>in</strong> Northern Italy with different energy-provision options. Despite the existence of other<br />
studies of this nature performed <strong>in</strong> Europe (e.g. Roy <strong>et</strong> al., 2009; Boulard <strong>et</strong> al., 2011), none has been performed<br />
<strong>in</strong> this region nor compares different energy supply configurations.<br />
The conventional system consists of a poly<strong>et</strong>hylene greenhouse supplied with grid electricity and heated<br />
through a natural gas boiler. The CO2 released <strong>in</strong> the combustion is used to fertilise the plants. There are<br />
future plans to obta<strong>in</strong> heat through municipal solid waste (MSW) <strong>in</strong>c<strong>in</strong>eration and recover CO2 from <strong>in</strong>dustry<br />
exhausts (scenario 1). Alternatively, both can be obta<strong>in</strong>ed from a co-generation facility (scenario 2), the latter<br />
provid<strong>in</strong>g also electricity. We assessed the life cycle GHG emissions and energy use of the present production<br />
cha<strong>in</strong> and those alternatives. This exercise was performed accord<strong>in</strong>g to appropriate official standards for<br />
life cycle assessment (ISO 14040-14044) and for carbon footpr<strong>in</strong>t (ISO 14067). Allocation was avoided by<br />
system boundary expansion. Assessment was made with software SimaPro ® (PRé, the N<strong>et</strong>herlands), through<br />
the s<strong>in</strong>gle-issue m<strong>et</strong>hods IPCC GWP 2007 100a and Cumulative Energy Demand (expressed <strong>in</strong> kg CO2 eq<br />
and MJ eq, respectively). The functional unit is 1 kg of fresh tomatoes packed and delivered at the local mark<strong>et</strong>.<br />
The carbon footpr<strong>in</strong>t of each kg of tomato produced <strong>in</strong> the current system is 2.33 kg CO2 eq (Fig. 1-A). Coupled<br />
heat<strong>in</strong>g and CO2 enrichment are responsible for 54% of GHG emissions. Construction of the greenhouse<br />
and fertilisation contribute 21% and 13%. The footpr<strong>in</strong>t can be decreased by 16% if MSW <strong>in</strong>c<strong>in</strong>eration<br />
supplies heat and CO2 fertilisation (scenario 1). If the co-generation facility were to be <strong>in</strong>stalled (scenario 2),<br />
the carbon footpr<strong>in</strong>t would be lowered by 7% (2.15 kg CO2 eq kg -1 tomato), ow<strong>in</strong>g to the excess electricity<br />
credited to the system. From the energ<strong>et</strong>ic po<strong>in</strong>t of view, the scenarios imply higher reductions (Fig. 1-B).<br />
While the energy use of the conventional system is 77 MJ eq kg -1 tomato, the co-generation and the waste<br />
valorisation options reduce it by 52 to 55, respectively. Heat<strong>in</strong>g and CO2 fertiliser reach 75% of the energy<br />
<strong>in</strong>put to the current system and 50% and 54% <strong>in</strong> scenarios 1 and 2 respectively. In all cases, construction and<br />
transport, packag<strong>in</strong>g and waste disposal are the second and third energy consumers.<br />
Literature presents wide ranges of GHG emissions and energy use of tomato production, <strong>in</strong>fluenced ma<strong>in</strong>ly<br />
by location and sophistication level of the system as described by Roy <strong>et</strong> al. (2009). These results are <strong>in</strong> l<strong>in</strong>e<br />
with averages from literature, even though Cuore di bue vari<strong>et</strong>y typically shows lower yields than conventional<br />
vari<strong>et</strong>ies.<br />
References<br />
Boulard T., Raeppel C., Brun R., Lecompte F., Hayer F., Carmassi G., <strong>et</strong> al., 2011. Environmental impact of<br />
greenhouse tomato production <strong>in</strong> <strong>France</strong>. Agron. Sust. Devel. 31(4), 757-77.<br />
Roy, P., Nei D., Orikasa T., Xu Q., Okadome H., Nakamura N., Shi<strong>in</strong>a T. 2009. A review of life cycle assessment<br />
(<strong>LCA</strong>) on some food products. J. <strong>Food</strong> Eng. 90(1): 1-10.<br />
Weidema B., Thrane M., Christensen P., Schmidt J., Løkke S., 2008. Carbon footpr<strong>in</strong>t: a catalyst for Life<br />
Cycle Assessment? J. Ind. Ecol.12(1), 3-6.<br />
719
GROUP 2, SESSION A: CARBON OR WATER FOOTPRINTS, SOIL, BIODIVERSITY 8 th Int. Conference on <strong>LCA</strong> <strong>in</strong> the<br />
Agri-<strong>Food</strong> Sector, 1-4 Oct <strong>2012</strong><br />
Figure 1. The carbon footpr<strong>in</strong>t (A) and cumulative energy demand (B) of the basel<strong>in</strong>e tomato production<br />
system and scenarios 1 (municipal waste <strong>in</strong>c<strong>in</strong>eration) and 2 (cogeneration facility).<br />
720
GROUP 2, SESSION A: CARBON OR WATER FOOTPRINTS, SOIL, BIODIVERSITY 8 th Int. Conference on <strong>LCA</strong> <strong>in</strong> the<br />
Agri-<strong>Food</strong> Sector, 1-4 Oct <strong>2012</strong><br />
45. Assessment of F<strong>in</strong>nish cultivation practices with carbon footpr<strong>in</strong>t<br />
and energy <strong>in</strong>dex<br />
Aki-Heikki F<strong>in</strong>ér * , Tero Hirvi, Jaakko Laur<strong>in</strong>en, Pasi Lähd<strong>et</strong>ie<br />
Raisio Group, Correspond<strong>in</strong>g author. E-mail: aki.f<strong>in</strong>er@raisio.com<br />
F<strong>in</strong>nish food cha<strong>in</strong> effect on climate change is estimated to be 14% of total climate change effect of F<strong>in</strong>nish<br />
consumption. Most of the food cha<strong>in</strong> emissions are orig<strong>in</strong>ated from agriculture. These emissions represent<br />
69% of the total climate change impacts from the food cha<strong>in</strong>. (Virtanen <strong>et</strong> al., 2011)<br />
A m<strong>et</strong>hod for d<strong>et</strong>erm<strong>in</strong><strong>in</strong>g the energy efficiency and environmental impact of a production of cultivation<br />
plants and for <strong>in</strong>creas<strong>in</strong>g positive environmental impact has been developed for Raisio Group’s contractual<br />
farmers. Environmental impact and energy efficiency are characterised from contractual farmers’ agricultural<br />
<strong>in</strong>put-output data. Production param<strong>et</strong>ers for cultivation are selected and cultivation procedures are performed<br />
by farmers, and further, the performed procedures are documented to give required <strong>in</strong>formation for<br />
environmental impact assessment and energy efficiency calculation.<br />
Farm specific <strong>in</strong>put-output data is collected after a produced crop yield is harvested. A representative sample<br />
of the crop yield is delivered to laboratory analysis with the required <strong>in</strong>formation. The gra<strong>in</strong> sample is analysed<br />
and energy content of the yield is measured. Energy <strong>in</strong>dex and carbon footpr<strong>in</strong>t of the crop yield are<br />
calculated us<strong>in</strong>g the representative sample <strong>in</strong>formation. The system boundary used for energy <strong>in</strong>dex and carbon<br />
footpr<strong>in</strong>t calculation is cradle-to-farm gate. Energy <strong>in</strong>dex represents a ratio of energy content of the crop<br />
yield per hectare and energy used <strong>in</strong> cultivation practices per hectare. Functional unit for carbon footpr<strong>in</strong>t is a<br />
gra<strong>in</strong> tonne.<br />
Agricultural <strong>in</strong>put-output <strong>in</strong>formation has been collected from contractual farmers dur<strong>in</strong>g harvest<strong>in</strong>g seasons<br />
2008-2011. The <strong>in</strong>put-output database <strong>in</strong>cludes 2000 to 2500 gra<strong>in</strong> vari<strong>et</strong>y specific datas<strong>et</strong>s from every season.<br />
Energy <strong>in</strong>dex tog<strong>et</strong>her with CO2 emissions of contractual farmers farm<strong>in</strong>g practices are estimated s<strong>in</strong>ce<br />
2008. Other greenhouse gas emissions are taken <strong>in</strong>to account and a carbon footpr<strong>in</strong>t of contractual farmers’<br />
gra<strong>in</strong> yield is calculated s<strong>in</strong>ce 2009. Development of the carbon footpr<strong>in</strong>t and the energy <strong>in</strong>dex trends are<br />
followed and the most significant factors for development are identified. Information is used for <strong>in</strong>structional<br />
purposes and also for product carbon footpr<strong>in</strong>t calculation.<br />
References<br />
Virtanen, Y., Kurppa, S., Saar<strong>in</strong>en, M., Katajajuuri, J-M., Usva, K., Mäenpää, I., Mäkelä, J., Grönroos, J.,<br />
Niss<strong>in</strong>en, A., 2011 Carbon footpr<strong>in</strong>t of food - approaches from national <strong>in</strong>put-output statistics and a <strong>LCA</strong><br />
of a food portion. Journal of Cleaner Production 19: 1849-1856.<br />
Figure 1. Average carbon footpr<strong>in</strong>t and energy <strong>in</strong>dex of oat produced by Raisio Group's contractual farmers<br />
dur<strong>in</strong>g cultivation seasons 2008 to 2011.<br />
721
GROUP 2, SESSION A: CARBON OR WATER FOOTPRINTS, SOIL, BIODIVERSITY 8 th Int. Conference on <strong>LCA</strong> <strong>in</strong> the<br />
Agri-<strong>Food</strong> Sector, 1-4 Oct <strong>2012</strong><br />
722<br />
46. Carbon footpr<strong>in</strong>t of Irish milk production<br />
M<strong>in</strong>g-Jia Yan 1 , James Humphreys 2 , Nicholas M. Holden 1,*<br />
1 UCD School of Biosystem Eng<strong>in</strong>eer<strong>in</strong>g, University College Dubl<strong>in</strong>. Belfield, Dubl<strong>in</strong> 4, Dubl<strong>in</strong>, Rep. of<br />
Ireland, 2 Animal and Grassland Research and Innovation Centre, Teagasc, Moorepark, Fermoy, County<br />
Cork, Rep. of Ireland, Correspond<strong>in</strong>g author. E-mail: nick.holden@ucd.ie<br />
The objective of this paper was to calculate the carbon footpr<strong>in</strong>t (CF) of Irish milk production on commercial<br />
dairy farms us<strong>in</strong>g life cycle assessment (<strong>LCA</strong>) to estimate the greenhouse gas (GHG) emissions to calculate<br />
CF. <strong>LCA</strong> of milk production has been carried out on commercial farms <strong>in</strong> Europe us<strong>in</strong>g both national statistics<br />
and ad hoc survey of farm-gate turnover. Most research has focused on compar<strong>in</strong>g production types (e.g.<br />
organic vs. conventional), however relatively little work has exam<strong>in</strong>ed how d<strong>et</strong>ail of farm management may<br />
<strong>in</strong>fluence CF.<br />
In this paper, a four stage <strong>LCA</strong> was implemented follow<strong>in</strong>g ISO 14040. The foreground data were based on a<br />
survey of specialist dairy farms, and the background data were taken from the Eco<strong>in</strong>vent database. The functional<br />
unit was 1 kg energy corrected milk (ECM). Economic allocation was used for concentrate feed <strong>in</strong>gredients<br />
at the pre-farm stage. Emission factors (EFs) were taken from relevant literature while the EF for enteric<br />
CH4 was d<strong>et</strong>erm<strong>in</strong>ed by estimat<strong>in</strong>g n<strong>et</strong> energy for ma<strong>in</strong>tenance, lactation, and pregnancy. Global warm<strong>in</strong>g<br />
potential of CH4 and N2O were taken as 25 and 298 times CO2 equivalent. The system boundary was s<strong>et</strong><br />
at the farm gate and <strong>in</strong>cluded production and transportation of fertiliser and concentrate feed and the on-farm<br />
activity. Infrastructure and mach<strong>in</strong>ery, soil carbon sequestration, pesticides, medic<strong>in</strong>e and m<strong>in</strong>or consumables<br />
were not <strong>in</strong>cluded. In order to exclude on-farm activities not relevant to dairy production a proportion<strong>in</strong>g<br />
rule was devised. This was done by (1) convert<strong>in</strong>g all animals <strong>in</strong>to livestock unit (LU) equivalents accord<strong>in</strong>g<br />
to the ratio of nitrogen excr<strong>et</strong>ion compared to a dairy cow as def<strong>in</strong>ed <strong>in</strong> the Irish “Statutory Instrument<br />
(SI) No. 610 (2010)”; (2) assum<strong>in</strong>g the dairy herd consisted of dairy cows + replacement animals +<br />
bulls or suckler cows (if any), deriv<strong>in</strong>g the proportion factor of dairy herd as “dairy LU/total LU”; and (3)<br />
exclud<strong>in</strong>g from the farm GHG <strong>in</strong>ventory electricity production, which was predom<strong>in</strong>antly used by dairy<br />
herd, and multiply the rest by the proportion factor, and then add<strong>in</strong>g back the electricity contribution to derive<br />
the dairy unit GHG. After proportion<strong>in</strong>g, economic allocation b<strong>et</strong>ween milk and meat (from surplus<br />
calves and culled cows) was performed based on farm sales records.<br />
Much variation <strong>in</strong> the tactical management of the farms was found. For example, as much as 1.5-fold difference<br />
<strong>in</strong> fertiliser N <strong>in</strong>put to support the same stock<strong>in</strong>g density, and up to 2 fold difference <strong>in</strong> concentrate feed<br />
for a similar milk output per cow. The CF of milk production of the farms averaged 1.23 ± 0.16 kg<br />
CO2 eq/kg ECM. CF was found to be correlated with various tactics us<strong>in</strong>g step-wise regression: milk per<br />
cow, economic allocation factor (both P
GROUP 2, SESSION A: CARBON OR WATER FOOTPRINTS, SOIL, BIODIVERSITY 8 th Int. Conference on <strong>LCA</strong> <strong>in</strong> the<br />
Agri-<strong>Food</strong> Sector, 1-4 Oct <strong>2012</strong><br />
47. Carbon footpr<strong>in</strong>t of the Australian dairy <strong>in</strong>dustry<br />
Sven Lundie 1 , Jake McLaren 2,* , Neil van Buuren 3 , Sebastian Gollnow 1,2 , Andrew Moore 2 , Larisa Maya<br />
Altamira 2 , Daniel Thylmann 1 , Barbara Nebel 2 , Hazel v. Rowley 4 , Manfred Lenzen 5 , Karen Christie 6 , Torsten<br />
Rehl 1 , Sab<strong>in</strong>e Deiml<strong>in</strong>g 1<br />
1 PE International AG, Stuttgart, Germany, 2 PE Australasia Ltd., Well<strong>in</strong>gton, New Zealand, 3 Dairy Australia,<br />
Melbourne, Australia, 4 Susta<strong>in</strong>ability Assessment Program, Water Research Centre, The University of New<br />
South Wales, Sydney, Australia, 5 Integated Susta<strong>in</strong>ability Assessment Group, University of Sydney, Australia,<br />
6 Tasmanian Institute of Agricultural Research, University of Tasmania, Hobart, Australia, Correspond<strong>in</strong>g<br />
author. E-mail j.mclaren@pe-<strong>in</strong>ternational.com<br />
This abstract describes an overview of a carbon footpr<strong>in</strong>t project conducted (2010-12) by PE International,<br />
PE Australasia and a consortium of research partners. The project sponsor is Dairy Australia act<strong>in</strong>g on behalf<br />
of the Australian national dairy <strong>in</strong>dustry. This abstract outl<strong>in</strong>es the project aims, m<strong>et</strong>hodology, approach<br />
adopted and lessons learnt.<br />
Overall the study aims to assist Australian dairy companies to understand the carbon footpr<strong>in</strong>t of their products,<br />
and develop long term strategies to reduce hot spots <strong>in</strong> the carbon footpr<strong>in</strong>t of dairy products. The overarch<strong>in</strong>g<br />
project aims are to:<br />
Quantify the carbon footpr<strong>in</strong>t of the major Australian dairy products produced for export, i.e. butter,<br />
cheese, fresh products, milk powders, nutritional and UHT-products, whey and lactose, from farmto-distributor’s<br />
warehouse or export harbour. Altog<strong>et</strong>her, 12 products have been <strong>in</strong>vestigated.<br />
Represent the weighted Australian average product carbon footpr<strong>in</strong>t for selected products based on<br />
annual production figures by region and by farm practices;<br />
Establish an auditable monitor<strong>in</strong>g system and framework for a reproducible carbon footpr<strong>in</strong>t report<strong>in</strong>g<br />
that can be updated and expanded to <strong>in</strong>clude other environmental impacts <strong>in</strong> the future.<br />
Me<strong>et</strong><strong>in</strong>g the goals of the project requires collection of primary <strong>LCA</strong> data from approximately 150 farms and<br />
and 15 dairy representative process<strong>in</strong>g sites across Australia operated by the major dairy companies.<br />
The m<strong>et</strong>hodology for this study is <strong>in</strong> l<strong>in</strong>e with ISO standards on Life Cycle Assessment and the sector specific<br />
Carbon footpr<strong>in</strong>t<strong>in</strong>g guidel<strong>in</strong>es of the International Dairy Federation (2010). Follow<strong>in</strong>g the IDF guidel<strong>in</strong>es<br />
(IDF, 2010) raw milk <strong>in</strong>take and transportation is allocated on the basis of the milk solids content of the<br />
f<strong>in</strong>al product. Operations with<strong>in</strong> the process<strong>in</strong>g plant are modelled as d<strong>et</strong>ailed as the data availability allow.<br />
Three modell<strong>in</strong>g and approaches are possible for address<strong>in</strong>g allocation issues at the process<strong>in</strong>g plants.<br />
The study <strong>in</strong>cludes all relevant activities from the grow<strong>in</strong>g of grass on farm to feed the cows, to the delivery<br />
of dairy products to warehouse or export harbour. On farm site this <strong>in</strong>cludes emissions from mechanical as<br />
well as non-mechanical sources. For the product process<strong>in</strong>g the system boundary conta<strong>in</strong>s all relevant activities<br />
from collection of the milk from the farm, product process<strong>in</strong>g, through to export harbours for export<br />
products, and for fresh products to the r<strong>et</strong>ailers’ distribution warehouse.<br />
The scale of data collection and complexity of modell<strong>in</strong>g approach for this project is extensive. The software<br />
solution utilised is a l<strong>in</strong>ked solution, comb<strong>in</strong><strong>in</strong>g both GaBi and SoFi software packages from PE International<br />
(Fig. 1). Data was collected us<strong>in</strong>g customised web-based questionnaires <strong>in</strong> the SoFi software which<br />
allow <strong>in</strong>dividual producers to submit their data <strong>in</strong> a secure and auditable environment.<br />
References<br />
International Dairy Federation (2010) “A common carbon footpr<strong>in</strong>t m<strong>et</strong>hodology for the dairy sector”, November<br />
2010<br />
723
GROUP 2, SESSION A: CARBON OR WATER FOOTPRINTS, SOIL, BIODIVERSITY 8 th Int. Conference on <strong>LCA</strong> <strong>in</strong> the<br />
Agri-<strong>Food</strong> Sector, 1-4 Oct <strong>2012</strong><br />
Figure 1. Integrated data collection and process<strong>in</strong>g approach. Web-based data collection <strong>in</strong> SoFi (left),<br />
<strong>LCA</strong>/LCI modell<strong>in</strong>g <strong>in</strong> GaBi, and f<strong>in</strong>al report<strong>in</strong>g and communications.<br />
724
GROUP 2, SESSION A: CARBON OR WATER FOOTPRINTS, SOIL, BIODIVERSITY 8 th Int. Conference on <strong>LCA</strong> <strong>in</strong> the<br />
Agri-<strong>Food</strong> Sector, 1-4 Oct <strong>2012</strong><br />
48. Contribution of packag<strong>in</strong>g to the carbon footpr<strong>in</strong>t of canned tuna<br />
Ngamtip Poovarodom * , Chularat Ponnak, Natthaphon Manatphrom<br />
Department of Packag<strong>in</strong>g and Materials Technology, Faculty of Agro-Industry, Kas<strong>et</strong>sart University, Bangkok<br />
10900, Thailand, Correspond<strong>in</strong>g author. E-mail: fag<strong>in</strong>tp@ku.ac.th<br />
Packag<strong>in</strong>g is an essential accompaniment of almost every food product. It performs multiple functions to<br />
ensure the saf<strong>et</strong>y and satisfactory condition of food products delivered to end users. Packag<strong>in</strong>g helps m<strong>in</strong>imise<br />
food losses, consequently reduc<strong>in</strong>g the environmental burden aris<strong>in</strong>g from excessive food production.<br />
In addition, packag<strong>in</strong>g is a key element <strong>in</strong> creat<strong>in</strong>g new food products to me<strong>et</strong> consumer needs. For <strong>in</strong>stance,<br />
canned foods discovered by a French chef, Nicholas Appert, more than 200 years ago have <strong>in</strong>creas<strong>in</strong>gly been<br />
presented <strong>in</strong> r<strong>et</strong>ort conta<strong>in</strong>ers which are more convenient and attractive than m<strong>et</strong>al cans.<br />
Nevertheless, packag<strong>in</strong>g has a negative impact on the environment, the extent of which depends significantly<br />
on the choice of materials and the efficiency of material recovery (Hospido <strong>et</strong> al., 2006; Humbert <strong>et</strong> al.,<br />
2009; Mungkung <strong>et</strong> al., 2010). These circumstances present an additional challenge to the food <strong>in</strong>dustry:<br />
select<strong>in</strong>g a packag<strong>in</strong>g system which could <strong>in</strong>crease consumer satisfaction while hav<strong>in</strong>g less impact on the<br />
environment.<br />
This study was thus <strong>in</strong>itiated to identify and compare the carbon footpr<strong>in</strong>t of different packag<strong>in</strong>g systems<br />
used to provide one s<strong>in</strong>gle-serve meal of canned food which tuna was selected as a study product. It also<br />
aimed at enhanc<strong>in</strong>g the application of <strong>LCA</strong> study at the early stage of a new product development and a<br />
product improvement. The study was conducted <strong>in</strong> accordance with publicly available specification PAS<br />
2050:2008 (BSI, 2008), with respect to <strong>LCA</strong> m<strong>et</strong>hodology covered by ISO 14040 and ISO 14044.<br />
S<strong>in</strong>gle-serve packages selected were: (1) two-piece cans made of chrome-coated steel, with an alum<strong>in</strong>ium<br />
pull r<strong>in</strong>g tab on the top; (2) r<strong>et</strong>ort pouches made of polypropylene (PP), alum<strong>in</strong>ium foil (Al) and oriented<br />
nylon (ON), referred to as PP/Al/ON/PP; and (3) r<strong>et</strong>ort cups made of PP and <strong>et</strong>hylene v<strong>in</strong>yl alcohol (EVOH),<br />
referred to as PP/EVOH/PP with lids made of poly<strong>et</strong>hylene terephthalate (PET), alum<strong>in</strong>ium foil, ON and PP,<br />
referred to as PET/Al/ON/PP. The system boundary, Figure 1, covered the production of tuna meat, the production<br />
of packages, product assembly, process<strong>in</strong>g, pack<strong>in</strong>g, transport, and disposal, exclud<strong>in</strong>g consumption.<br />
Primary data were collected for each ma<strong>in</strong> activity <strong>in</strong> the production l<strong>in</strong>e, <strong>in</strong>clud<strong>in</strong>g fill<strong>in</strong>g, clos<strong>in</strong>g or seal<strong>in</strong>g,<br />
sterilis<strong>in</strong>g, cool<strong>in</strong>g, labell<strong>in</strong>g, and unitis<strong>in</strong>g. As sterilisation is an energy-<strong>in</strong>tensive and batchwise process,<br />
primary data on energy use and steam consumption were carefully measured.<br />
The life cycle GHG emissions associated with a s<strong>in</strong>gle serv<strong>in</strong>g of tuna us<strong>in</strong>g different packag<strong>in</strong>g systems are<br />
shown <strong>in</strong> Figure 2. The manufactur<strong>in</strong>g process of r<strong>et</strong>ort pouches and cups produced 60% and 70% less GHG<br />
emissions, respectively, than that of m<strong>et</strong>al cans. However, the overall carbon footpr<strong>in</strong>t of canned tuna <strong>in</strong> r<strong>et</strong>ort<br />
cups was 10% and 22% less than when packaged <strong>in</strong> m<strong>et</strong>al cans and r<strong>et</strong>ort pouches, respectively. Packag<strong>in</strong>g<br />
and its associated process<strong>in</strong>g constituted significant fractions of the product’s carbon footpr<strong>in</strong>t, rang<strong>in</strong>g<br />
from 20-40%. These f<strong>in</strong>d<strong>in</strong>gs show that the advantage of low GHG emissions embodied <strong>in</strong> plastic packag<strong>in</strong>g<br />
might vanish if the associated processes are not optimally managed. To reduce a product’s carbon footpr<strong>in</strong>t,<br />
the choice of food packag<strong>in</strong>g thus depends not only on the materials but also on the further process<strong>in</strong>g <strong>in</strong>volved.<br />
Hotspots <strong>in</strong> the life cycle assessment of canned foods are packag<strong>in</strong>g production and disposal, and<br />
product sterilisation. The improvement of r<strong>et</strong>ort operation <strong>in</strong> terms of capacity and energy utilisation, and the<br />
efficiency of post-consumption packag<strong>in</strong>g material recovery, are the key factors responsible for the reduction<br />
of a product’s carbon footpr<strong>in</strong>t. These issues present a challenge to both the food <strong>in</strong>dustry and local authorities.<br />
References<br />
British Standards Institute (BSI), 2008. PAS 2050:2008: Specification for the Assessment of the Life Cycle<br />
Greenhouse Gas Emissions of Goods and Services. British Standards Institute, London.<br />
Hospido A, Vazquez ME, Cuevasc A, Feijoo G, Moreira MT., 2006. Environmental assessment of canned<br />
tuna manufacture with a life-cycle perspective. Resour. Conserv. Recycl. 47(1): 56-72.<br />
Humbert S, Rossi V, Margni M, Jolli<strong>et</strong> O, Loer<strong>in</strong>cik Y., 2009. Life cycle assessment of two baby food packag<strong>in</strong>g<br />
alternatives: glass jars vs. plastic pots. Int. J. Life Cycle Assess. 14(2), 95-106.<br />
Mungkung R, Gheewala SH, Kanyarushoki C, Hospido A, van der Werf H, Poovarodom N, Bonn<strong>et</strong> S, Aub<strong>in</strong><br />
J, Moreira MT, Feijoo G., 2010. Practical issues of product carbon footpr<strong>in</strong>t<strong>in</strong>g: experiences from Thailand.<br />
In Proc. of the 7 th Int. Conf. on <strong>LCA</strong> <strong>in</strong> the Agri-<strong>Food</strong> Sector. Bari, Italy.<br />
725
GROUP 2, SESSION A: CARBON OR WATER FOOTPRINTS, SOIL, BIODIVERSITY 8 th Int. Conference on <strong>LCA</strong> <strong>in</strong> the<br />
Agri-<strong>Food</strong> Sector, 1-4 Oct <strong>2012</strong><br />
Figure 1. System boundary of carbon footpr<strong>in</strong>t assessment for canned tuna products, exclud<strong>in</strong>g consumption.<br />
Figure 2. Total carbon footpr<strong>in</strong>t of different packag<strong>in</strong>g systems for tuna.<br />
726
GROUP 2, SESSION A: CARBON OR WATER FOOTPRINTS, SOIL, BIODIVERSITY 8 th Int. Conference on <strong>LCA</strong> <strong>in</strong> the<br />
Agri-<strong>Food</strong> Sector, 1-4 Oct <strong>2012</strong><br />
49. Carbon footpr<strong>in</strong>t of Canadian dairy products: national and<br />
regional assessments<br />
Xavier P. Vergé 1 , Dom<strong>in</strong>ique Maxime 2 , Raymond L. Desjard<strong>in</strong>s 3,* , Yves Arcand 4 , Devon Worth 3<br />
1 Agro-environmental consultant, Ottawa ON, Canada, 2 CIRAIG, École Polytechnique de Montréal, Montréal<br />
QC, Canada, 3 Agriculture and Agri-<strong>Food</strong> Canada, Eastern Cereal and Oilseed Research Centre, Ottawa<br />
ON, Canada, 4 Agriculture and Agri-<strong>Food</strong> Canada, <strong>Food</strong> Research and Development Centre, Sa<strong>in</strong>t-Hyac<strong>in</strong>the<br />
QC, Canada, * Correspond<strong>in</strong>g author. E-mail: ray.desjard<strong>in</strong>s@agr.gc.ca<br />
The production of dairy products such as milk, cheese, butter and yoghurt results <strong>in</strong> a wide range of greenhouse<br />
gas (GHG) emissions per kg of product. A calculator, which was recently developed to estimate the<br />
magnitude of the GHG emission <strong>in</strong>tensities of dairy products from cradle to the exit gate of the process<strong>in</strong>g<br />
plants, at the prov<strong>in</strong>cial and national scales, will be presented (Vergé <strong>et</strong> al., <strong>2012</strong>). Estimates based on a regional<br />
assessment of farm<strong>in</strong>g and process<strong>in</strong>g systems will be given for eleven dairy products for 2006 (Fig.<br />
1). The on-farm GHG emission estimates, which are based on the IPCC Tier 2 m<strong>et</strong>hodologies adapted for<br />
Canadian conditions (e.g. Vergé <strong>et</strong> al., 2006; Roch<strong>et</strong>te <strong>et</strong> al., 2008) also account for GHG emissions associated<br />
with farm <strong>in</strong>puts (Dyer and Desjard<strong>in</strong>s, 2003a, 2003b). Much of this work is based on previous work<br />
from Vergé <strong>et</strong> al. (2007) and has been improved 1) to account for co-products allocation where relevant; 2)<br />
for a more comprehensive assessment of background processes and to be fed by yearly statistics <strong>in</strong>stead of<br />
the five-year Census of agriculture data. For the process<strong>in</strong>g phase, a top-down approach (e.g. for energy <strong>in</strong>puts<br />
gathered from yearly statistics) is used, and data gaps (e.g. packag<strong>in</strong>g) have been filled with North-<br />
American generic data (Vergé <strong>et</strong> al., 2011). The dairy plant is seen as a multi-product output plant and coproducts<br />
allocation is performed us<strong>in</strong>g the physico-chemical approach described by Feitz <strong>et</strong> al. (2007), which<br />
has been modified to <strong>in</strong>corporate the solids characteristics (i.e. prote<strong>in</strong> and fat content) of Canadian dairy<br />
products (Maxime <strong>et</strong> al., 2011). The contribution of each step to the overall carbon footpr<strong>in</strong>t of dairy products<br />
will be discussed. Information on the magnitude of the carbon footpr<strong>in</strong>t is likely to become important<br />
<strong>in</strong>formation for dairy producers for sell<strong>in</strong>g their products on the <strong>in</strong>ternational scene.<br />
References<br />
Dyer, J., and R.L. Desjard<strong>in</strong>s. 2003a. Simulated farm field work, energy consumption and related greenhouse<br />
gas emissions <strong>in</strong> Canada. Biosystems Eng<strong>in</strong>eer<strong>in</strong>g 85(4), 503-513.<br />
Dyer, J.A. and R. L. Desjard<strong>in</strong>s. 2003b. The impact of farm mach<strong>in</strong>ery management on the greenhouse gas<br />
emissions from Canadian agriculture. Journal of Susta<strong>in</strong>able Agriculture 22(3), 59-74.<br />
Feitz A.J., Lundie, S., Dennien, G., Mora<strong>in</strong>, M., Jones M., 2007. Generation of an Industry-specific Physicochemical<br />
Allocation Matrix. Application <strong>in</strong> the Dairy Industry and Implications for Systems Analysis. Int.<br />
J. <strong>LCA</strong> 12(2), 109-117.<br />
Maxime D., Vergé, X., Arcand, Y., Desjard<strong>in</strong>s, R., 2011. A cradle-to-gate assessment of the carbon footpr<strong>in</strong>t<br />
of Canadian dairy products. <strong>LCA</strong> XI Conference, October 4-6, 2011, Chicago IL (USA).<br />
Roch<strong>et</strong>te P., Worth, D.E., Huffman, E.C., Brierley, J.A., McConkey, B.G., Yang, J., Hutch<strong>in</strong>son, J.J., Desjard<strong>in</strong>s,<br />
R.L., Lemke, R. and Gameda, S., 2008. Estimation of N2O emissions from agricultural soils <strong>in</strong><br />
Canada. II. 1990 2005 <strong>in</strong>ventory. Can. J. Soil Sci. 88, 655-669.<br />
Vergé, X. P. C., Worth, D., Hutch<strong>in</strong>son, J. J. and Desjard<strong>in</strong>s, R. L. 2006. Greenhouse gas emissions from<br />
agro-ecosystems <strong>in</strong> Canada. M<strong>et</strong>hane emissions: M<strong>et</strong>hodology for calculations. Pages 38 Technical Report.<br />
Agriculture and Agri-<strong>Food</strong> Canada, Ottawa, ON.<br />
Vergé X.P.C., Dyer, J.A., Desjard<strong>in</strong>s, R.L., Worth, D., 2007. Greenhouse gas emissions from the Canadian<br />
dairy <strong>in</strong>dustry <strong>in</strong> 2001. Agricultural Systems, 94(3), 683-693.<br />
Vergé X.P.C., Maxime D., Dyer, J. A., Desjard<strong>in</strong>s, R.L. and Arcand Y., 2011. Carbon footpr<strong>in</strong>t model for<br />
Canadian livestock production - Presentation and application to the dairy sector. Technical report (August<br />
2011); Contract # 01E86-110116/001/SS. 37p.<br />
Vergé X.P.C., Maxime D., Dyer, J. A., Desjard<strong>in</strong>s, R.L. and Arcand Y., <strong>2012</strong>. Carbon footpr<strong>in</strong>t calculators<br />
for Canadian livestock production – The ULICEES and (cafoo)² models. Technical report (January <strong>2012</strong>);<br />
Contract # 01E86-110116/001/SS. 47p.<br />
727
GROUP 2, SESSION A: CARBON OR WATER FOOTPRINTS, SOIL, BIODIVERSITY 8 th Int. Conference on <strong>LCA</strong> <strong>in</strong> the<br />
Agri-<strong>Food</strong> Sector, 1-4 Oct <strong>2012</strong><br />
Figure 1. Cradle-to-gate climate change impact of Canadian dairy products <strong>in</strong> 2006.<br />
728
GROUP 2, SESSION A: CARBON OR WATER FOOTPRINTS, SOIL, BIODIVERSITY 8 th Int. Conference on <strong>LCA</strong> <strong>in</strong> the<br />
Agri-<strong>Food</strong> Sector, 1-4 Oct <strong>2012</strong><br />
50. Carbon footpr<strong>in</strong>t of Flemish livestock products<br />
Ellen Bracquené * , Valerie Vandermeulen, Marianne Fernagut<br />
Environment Resources Management, Brussels, Belgium,<br />
ellen.bracquene@erm.com<br />
Correspond<strong>in</strong>g author. E-mail:<br />
The purpose of this study is to develop a monitor<strong>in</strong>g tool for the carbon footpr<strong>in</strong>t of the Flemish livestock<br />
farm<strong>in</strong>g produce. A carbon footpr<strong>in</strong>t quantifies the climate change impact of an activity, product or service.<br />
Consider<strong>in</strong>g the current <strong>in</strong>terest to mitigate the consequences of climate change, it is important to have a<br />
clear understand<strong>in</strong>g of this impact. When develop<strong>in</strong>g a monitor<strong>in</strong>g tool related to the impact of food production<br />
systems, horticulture and fishery products should also be taken <strong>in</strong>to account, however this is not covered<br />
by the scope of this study. Currently there are several <strong>in</strong>ternational carbon footpr<strong>in</strong>t calculation <strong>in</strong>itiatives<br />
be<strong>in</strong>g developed. However, there is no one unambiguous <strong>in</strong>ternational standard or specific rules for<br />
agricultural products.<br />
Us<strong>in</strong>g the available <strong>in</strong>ternational standards, a functional and transparent monitor<strong>in</strong>g tool has been developed<br />
to d<strong>et</strong>erm<strong>in</strong>e the carbon footpr<strong>in</strong>t of the Flemish livestock farm<strong>in</strong>g products. This study focuses on the livestock<br />
<strong>in</strong>dustry and more specifically on the supply cha<strong>in</strong> of beef, pork and milk. A m<strong>et</strong>hod was formulated<br />
and applied to these product groups, reveal<strong>in</strong>g the <strong>in</strong>fluenc<strong>in</strong>g param<strong>et</strong>ers and ‘hotspots’ with<strong>in</strong> the parts of<br />
the food cha<strong>in</strong> this study focused on.<br />
Where the results show the most potential for reduc<strong>in</strong>g the emissions, the ‘hotspots’ identified will have recommendations<br />
on how these can be implemented. This can help the Flemish government or the stakeholders<br />
<strong>in</strong>volved to develop a strategy for the reduction of greenhouse gas emissions. In this way, a carbon footpr<strong>in</strong>t<br />
may contribute to make the agro food cha<strong>in</strong> <strong>in</strong> Flanders as well as the livestock <strong>in</strong>dustry <strong>in</strong> particular more<br />
susta<strong>in</strong>able.<br />
For this the general standards about carbon footpr<strong>in</strong>t<strong>in</strong>g such as the PAS2050 and the ISO14067 have been<br />
used. For milk, there was the additional use of the guidel<strong>in</strong>es of the International Dairy Federation (IDF).<br />
Critical po<strong>in</strong>ts of the m<strong>et</strong>hodology that have an <strong>in</strong>fluence on the carbon footpr<strong>in</strong>t are the choice of functional<br />
unit, the system boundaries and the allocation m<strong>et</strong>hod (how to allocate the emission of greenhouse gases<br />
among the various co-products emerg<strong>in</strong>g from a s<strong>in</strong>gle process). All these were addressed dur<strong>in</strong>g the study.<br />
Data and knowledge has been collected from the faculty of bioscience eng<strong>in</strong>eer<strong>in</strong>g of Ghent University, data<br />
of Bemefa, the farmers union (Boerenbond) and the ILVO. The data regard<strong>in</strong>g other levels <strong>in</strong> the supply<br />
cha<strong>in</strong> (ma<strong>in</strong>ly the process<strong>in</strong>g <strong>in</strong>dustry) have been primarily collected through <strong>in</strong>-depth <strong>in</strong>terviews and primary<br />
activity data. With<strong>in</strong> the current scope of the study, no primary data were collected at the farm level.<br />
In general it can be stated that the data used are of good quality and represent livestock farm<strong>in</strong>g with<strong>in</strong> Flanders.<br />
The pr<strong>in</strong>cipal part of the activity data orig<strong>in</strong>ate from reliable sources, however there is always some<br />
natural variability. This is dependent of external factors (e.g. differences <strong>in</strong> breeds, farm<strong>in</strong>g yields will differ<br />
yearly, the composition of feed concentrates can vary depend<strong>in</strong>g on the available commodities and mark<strong>et</strong><br />
prices). Furthermore a number of data po<strong>in</strong>ts cannot be easily measured under real life conditions (e.g. the<br />
consumption of feed mixtures per animal and the number of days on the pasture), and estimation is necessary<br />
based on expert op<strong>in</strong>ion. The data used were also verified and validated by the members of the steer<strong>in</strong>g<br />
committee. The emission factors orig<strong>in</strong>ate from acknowledged life cycle <strong>in</strong>ventory databases and literature<br />
sources, and can be considered as representative for Flanders. Other available sources were used to crosscheck<br />
the values and are reported <strong>in</strong> a transparent way.<br />
The carbon footpr<strong>in</strong>t results depend on the data quality of both the collected activity data and the available<br />
emission factors. The data and calculations <strong>in</strong> the developed carbon footpr<strong>in</strong>t models of the current project<br />
are highly d<strong>et</strong>ailed. In some cases however, reference values and standard formulas from relevant literature<br />
or other exist<strong>in</strong>g models were applied. In future, the current carbon footpr<strong>in</strong>t models could be ref<strong>in</strong>ed and<br />
improved if additional data is collected. The shortcom<strong>in</strong>gs and restrictions of the current datas<strong>et</strong> are reviewed<br />
below. Recommendations are made to solve the identified knowledge gaps <strong>in</strong> Flanders.<br />
729
GROUP 2, SESSION A: CARBON OR WATER FOOTPRINTS, SOIL, BIODIVERSITY 8 th Int. Conference on <strong>LCA</strong> <strong>in</strong> the<br />
Agri-<strong>Food</strong> Sector, 1-4 Oct <strong>2012</strong><br />
Table 1. Overview of emission sources with<strong>in</strong> the covered system boundaries<br />
Greenhouse<br />
Name<br />
Feed mixtures and<br />
material for bedd<strong>in</strong>g of<br />
stables (own production)<br />
730<br />
gasses Description<br />
CO2 and N2O Diesel is taken <strong>in</strong>to account with<strong>in</strong> energy consumption.<br />
Production and transport of fertilisers, pesticides en lime.<br />
Impact of fertilisers and the use of lime (direct and <strong>in</strong>direct) and the<br />
impact of crop residues are taken <strong>in</strong>to account accord<strong>in</strong>g to the<br />
IPCC m<strong>et</strong>hod (Tier 2 calculation).<br />
CO2 and N2O Farm<strong>in</strong>g, transport, process<strong>in</strong>g en land conversion is taken <strong>in</strong>to<br />
account <strong>in</strong> de covered emission factors.<br />
CH4 The IPCC m<strong>et</strong>hod is applied (Tier 2 calculation).<br />
Feed mixtures (purchased)<br />
Animal (stomach<strong>in</strong>test<strong>in</strong>e<br />
fermentation)<br />
Manure storage and<br />
disposal<br />
CH4 and N2O The IPCC m<strong>et</strong>hod is applied (Tier 2 calculation).<br />
Manure application CH4 and N2O Allocation b<strong>et</strong>ween animal (40%) and veg<strong>et</strong>able production system<br />
(not used for own feed<br />
mixtures)<br />
(60%) on the basis of nitrogen uptake by plants.<br />
Energy and water consumption<br />
1<br />
CO2, CH4 and<br />
N2O<br />
Energy consumption (electricity; diesel; red diesel; gas)<br />
Water consumption (tap and ground water)<br />
Transport of goods CO2, CH4 and Assumptions are be<strong>in</strong>g made for the goods enter<strong>in</strong>g and leav<strong>in</strong>g the<br />
N2O farm.<br />
Process<strong>in</strong>g materials CO2, refrigerant<br />
Use of cleans<strong>in</strong>g products and refrigerants<br />
1: water is not a source of emission; however the use of energy for process<strong>in</strong>g and transport<strong>in</strong>g tap water is<br />
taken <strong>in</strong>to account.<br />
Table 2.Overview of the applied allocation m<strong>et</strong>hod<br />
Process Products Allocation m<strong>et</strong>hod<br />
Farm<strong>in</strong>g of crops Products for human consumption (like flower);<br />
Products for animal consumption (like wheat starch)<br />
Other products (like straw)<br />
Economic allocation<br />
Dairy sector Milk and meat Physical relation registered<br />
by the IDF<br />
Dairy products Low-fat (skimmed), medium-skimmed and whole Physical relation registered<br />
milk, cream, milk powder, yoghurt, butter, … by the IDF<br />
Manure production Stock farm<strong>in</strong>g products and farm<strong>in</strong>g of crops Physical relation<br />
Slaughter<strong>in</strong>g and<br />
debon<strong>in</strong>g of carcass<br />
Meat, bones, fat, sk<strong>in</strong>/hide, hart, blood, <strong>et</strong>c. Economic allocation
GROUP 2, SESSION A: CARBON OR WATER FOOTPRINTS, SOIL, BIODIVERSITY 8 th Int. Conference on <strong>LCA</strong> <strong>in</strong> the<br />
Agri-<strong>Food</strong> Sector, 1-4 Oct <strong>2012</strong><br />
51. Carbon footpr<strong>in</strong>t of organic crop production <strong>in</strong> Sweden<br />
Christel Cederberg * , Magdalena Wallman, Maria Berglund, Jenny Gustavsson<br />
SIK – The Swedish Institute for <strong>Food</strong> and Biotechnology, Susta<strong>in</strong>able <strong>Food</strong> Production, Box 5401, SE-402<br />
29 Göteborg, Sweden, Correspond<strong>in</strong>g author. E-mail: Christel.Cederberg@sik.se<br />
The aim of the study was to assess the carbon footpr<strong>in</strong>t (CF) of Swedish organic crop production, and to<br />
explore the need of b<strong>et</strong>ter statistics on organic crop production to improve environmental system analyses.<br />
The CF of organic crop production was compared to conventional production when possible. Improvements<br />
were suggested on how to reduce greenhouse gas emissions from organic cultivation. The analyses were<br />
based on five organic crop rotations reflect<strong>in</strong>g the current situation on organic farms with typical operations<br />
(milk and arable farms) <strong>in</strong> three regions <strong>in</strong> Sweden. In this study the whole crop rotation was <strong>in</strong>cluded <strong>in</strong> the<br />
environmental analysis s<strong>in</strong>ce organic nitrogen applications and weed control is managed over the whole crop<br />
rotation and not for an <strong>in</strong>dividual crop for a s<strong>in</strong>gle year. There was a lack of reliable statistics; hence <strong>in</strong>formation<br />
regard<strong>in</strong>g crop rotations, yields, fertiliser management <strong>et</strong>c. was collected <strong>in</strong> cooperation with agronomic<br />
advisors. Statistics were used for geographic allocation of different crops and the use of organic fertiliser<br />
products to reflect the current Swedish situation. Greenhouse gas emissions were estimated accord<strong>in</strong>g to<br />
IPCC (2006) and the functional unit was 1 kg crop at farm gate/farm storage.<br />
The CF per kg organic crop was ma<strong>in</strong>ly affected by yield levels and nitrogen management strategy. High<br />
yield levels comb<strong>in</strong>ed with moderate applications of organic fertiliser reduced the CF for organic cereal<br />
crops. Organic silage production (grass and clover) production had a lower CF than conventional silage due<br />
to relatively high yield levels and good crop management. An <strong>in</strong>dividual crop’s sequence <strong>in</strong> a given crop<br />
rotation had also a substantial <strong>in</strong>fluence on the overall CF. The distribution of nitrogen emissions b<strong>et</strong>ween<br />
<strong>in</strong>dividual crops <strong>in</strong> the rotation must be considered. In this study, the allocation was made b<strong>et</strong>ween the nitrogen<br />
fix<strong>in</strong>g crop and the subsequent crops as the N fix<strong>in</strong>g crops are cultivated to provide other crops with<br />
nitrogen. Crop rotational effects are more evident <strong>in</strong> organic agriculture than <strong>in</strong> conventional and therefore<br />
there is a need to develop a uniform m<strong>et</strong>hodology to estimate the CF of organic production.<br />
References<br />
Cederberg, C., Wallman, M., Berglund, M., Gustavsson, J. 2011. Klimatavtryck av ekologiska jordbruksprodukter<br />
[In Swedish; Carbon footpr<strong>in</strong>t of organic crop production]. Report 830, SIK – The Swedish Institute<br />
for <strong>Food</strong> and Biotechnology, Göteborg.<br />
IPCC. 2006. 2006 IPCC Guidel<strong>in</strong>es for National Greenhouse Gas Inventories. Vol. 4. Agriculture, Forestry<br />
and Other Land Use. Chapter 11. N2O Emissions from Managed Soils, and CO2 Emissions from Lime<br />
and Urea Application. http://www.ipcc-nggip.iges.or.jp/public/2006gl/vol4.html<br />
731
GROUP 2, SESSION A: CARBON OR WATER FOOTPRINTS, SOIL, BIODIVERSITY 8 th Int. Conference on <strong>LCA</strong> <strong>in</strong> the<br />
Agri-<strong>Food</strong> Sector, 1-4 Oct <strong>2012</strong><br />
732<br />
52. Guidel<strong>in</strong>es on <strong>in</strong>clusion of land use change emissions <strong>in</strong> carbon<br />
footpr<strong>in</strong>ts of food<br />
Hannele Pulkk<strong>in</strong>en * , Kristoffer Krogerus, Juha-Matti Katajajuuri<br />
MTT Agrifood Research F<strong>in</strong>land, Biotechnology and <strong>Food</strong> Research, FI-00790 Hels<strong>in</strong>ki, F<strong>in</strong>land, E-mail:<br />
hannele.pulkk<strong>in</strong>en@mtt.fi<br />
Currently there exist several m<strong>et</strong>hodologies for the calculation of greenhouse gas emissions result<strong>in</strong>g from a<br />
land use change, but no m<strong>et</strong>hodology has been commonly accepted for use <strong>in</strong> <strong>LCA</strong>. The m<strong>et</strong>hodologies produce<br />
differ<strong>in</strong>g results, because, for example, their emission boundaries differ (e.g. only some <strong>in</strong>clude the<br />
change of gas flux direction and magnitude). In F<strong>in</strong>land a harmonised national m<strong>et</strong>hodology for calculat<strong>in</strong>g<br />
carbon footpr<strong>in</strong>ts of food is developed <strong>in</strong> 2009-<strong>2012</strong>. As a part of it a more practical m<strong>et</strong>hodology for the<br />
F<strong>in</strong>nish food <strong>in</strong>dustry to calculate emissions from land use change on a product level was also developed.<br />
In <strong>Food</strong>pr<strong>in</strong>t, the m<strong>et</strong>hodology for estimat<strong>in</strong>g carbon stock changes is based on the IPCC 2006 Guidel<strong>in</strong>es.<br />
FAOSTAT statistics on trends of crop area expansion are used for assess<strong>in</strong>g which land use changes have<br />
occurred, based on the m<strong>et</strong>hodology orig<strong>in</strong>ally presented by Blonk <strong>et</strong> al. (2009). The trends of crop area expansion<br />
are calculated based on the mean of all annual crop area changes from the last 20 years, <strong>in</strong>stead of<br />
us<strong>in</strong>g l<strong>in</strong>ear regression to predict the crop area trend, s<strong>in</strong>ce it was realised that when large changes <strong>in</strong> crop<br />
area had occurred dur<strong>in</strong>g a studied period, the predicted land use changes would be distorted.<br />
The carbon storages and their changes due to land use change are to be evaluated accord<strong>in</strong>g to the m<strong>et</strong>hod<br />
described <strong>in</strong> European Commission guidel<strong>in</strong>es (EC 2010), which itself is based on the IPCC 2006 m<strong>et</strong>hodology.<br />
FAO’s Global Forest Resource Assessment is the preferred source for evaluat<strong>in</strong>g carbon stocks <strong>in</strong><br />
above-ground, root and litter biomass. For assess<strong>in</strong>g the change <strong>in</strong> carbon stocks, the GHGV approach<br />
(Anderson-Teixeira, 2011) was also considered, but it was seen that it did not provide remarkably more accurate<br />
results, while at the same time be<strong>in</strong>g much more work <strong>in</strong>tensive.<br />
The m<strong>et</strong>hod used <strong>in</strong> the <strong>Food</strong>pr<strong>in</strong>t guidel<strong>in</strong>es for allocat<strong>in</strong>g emissions result<strong>in</strong>g from land use change to agricultural<br />
products, us<strong>in</strong>g the trends of annual crop area expansions and reductions accord<strong>in</strong>g to FAOSTAT<br />
statistics, is specified <strong>in</strong> more d<strong>et</strong>ail <strong>in</strong> Ponsioen and Blonk (2010). The same m<strong>et</strong>hod is also presented <strong>in</strong><br />
GHG Protocol Product Standard. Other allocation m<strong>et</strong>hods were also analysed, such as us<strong>in</strong>g scientific articles<br />
and their results for estimations, e.g. one of Prudêncio da Silva (2010), which can be more accurate, but<br />
impractical for harmonis<strong>in</strong>g footpr<strong>in</strong>t calculations <strong>in</strong> F<strong>in</strong>nish food <strong>in</strong>dustry.<br />
Further land allocation was studied, which utilises the Ponsion and Blonk m<strong>et</strong>hodology and an assumption<br />
that the deforested crop area does not rema<strong>in</strong> as agricultural land, but ultimately ends up as pasture and secondary<br />
forests as well. It was though seen, that it can be too complicated for food companies to f<strong>in</strong>d such<br />
data from literature, and therefore this is optional <strong>in</strong> the <strong>Food</strong>pr<strong>in</strong>t guidel<strong>in</strong>es.<br />
The <strong>Food</strong>pr<strong>in</strong>t m<strong>et</strong>hodology was tested by assess<strong>in</strong>g the <strong>in</strong>crease <strong>in</strong> carbon footpr<strong>in</strong>t of a processed broiler<br />
product caused by land use changes. In the production cha<strong>in</strong>, the m<strong>et</strong>hodology predicted that land use<br />
changes occurred only <strong>in</strong> the cultivation of Brazilian soya. The <strong>in</strong>itial carbon footpr<strong>in</strong>t was 3.6 kgCO2e/kg<br />
product, while the new (<strong>in</strong>clud<strong>in</strong>g emissions from land use changes) one was 4.1 kg CO2e/kg product.<br />
References<br />
Anderson-Teixeira, K., DeLucia, E., 2011. The greenhouse gas value of ecosystems. Glob. Change Biol. 17,<br />
425-438.<br />
Blonk, H., Ponsioen, T., Scholten, J., 2009. Carbon Footpr<strong>in</strong>t<strong>in</strong>g of Horticultural Products. Available at:<br />
http://www.tu<strong>in</strong>bouw.nl/files/page/carbon%20footpr<strong>in</strong>t.pdf.<br />
EC, 2010. Commission Decision of 10 June 2010 on guidel<strong>in</strong>es for the calculation of land carbon stocks for<br />
the purpose of Annex V to Directive 2009/28/EC.<br />
Ponsioen, T., Blonk, H., 2010. Allocat<strong>in</strong>g greenhouse gas emissions from land conversion. Proceed<strong>in</strong>gs of<br />
<strong>LCA</strong> food 2010. 1, 551-556.<br />
Prudêncio da Silva, V., van der Werf, H., Spies, A., Soares, S., 2010. Variability <strong>in</strong> environmental impacts of<br />
Brazilian soybean accord<strong>in</strong>g to crop production and transport scenarios. J. Environ. Manage. 91, 1831-<br />
1839.
GROUP 2, SESSION A: CARBON OR WATER FOOTPRINTS, SOIL, BIODIVERSITY 8 th Int. Conference on <strong>LCA</strong> <strong>in</strong> the<br />
Agri-<strong>Food</strong> Sector, 1-4 Oct <strong>2012</strong><br />
53. A simplified tool for the estimation of N and P emissions due to the<br />
use of fertiliser <strong>in</strong> a <strong>LCA</strong> study<br />
Filippo Sessa 1,* , Massimo Mar<strong>in</strong>o 1 , Pierluigi Meriggi 2 , Matteo Ruggeri 3 , Michele Zerb<strong>in</strong>i 4<br />
1 Life Cycle Eng<strong>in</strong>eer<strong>in</strong>g, 2 Horta srl, 3 Univerisità Cattolica del Sacro Cuore, Piacenza, 4 Barilla G. R. Fratelli<br />
S.p.a, Correspond<strong>in</strong>g author. E-mail: sessa@studiolce.it<br />
Emissions of nitrogen and phosphorus compounds from soil are among the most relevant sources of environmental<br />
impact <strong>in</strong> the life cycle of most agricultural products. The most important emissions <strong>in</strong> air are<br />
N2O, which has a high Global warm<strong>in</strong>g potential and NO and NH3 which contribute to acidification. The<br />
most important emissions <strong>in</strong> water are nitrates and phosphates, which contribute to eutrophication of water.<br />
Agricultural practices such as fertilisation and tillage could seriously affect these k<strong>in</strong>ds of emission.<br />
It is often difficult to estimate these emissions because they depend on a multitude of factors such as climate<br />
conditions, soil characteristics and cultivated crops. There are models <strong>in</strong> literature that enable to estimate<br />
them with a certa<strong>in</strong> precision but <strong>in</strong> many cases they are too complicated and require <strong>in</strong>put which would imply<br />
money and time efforts that are not always available <strong>in</strong> a life cycle study. On the other hand it is possible<br />
to estimate emissions us<strong>in</strong>g emission factors or equations which however are too simplistic and do not permit<br />
for example to appreciate differences among different farm<strong>in</strong>g systems. The aim of this study was to identify<br />
models that may be easy to handle and <strong>in</strong> the meanwhile enough accurate to take <strong>in</strong>to account the ma<strong>in</strong> factors<br />
that <strong>in</strong>fluence the emissions. This is important <strong>in</strong> particular when perform<strong>in</strong>g a Life Cycle Assessment<br />
on a farm or on a territory level. With the <strong>in</strong>dividuated models a tool was then developed to permit the life<br />
cycle analyst to g<strong>et</strong> the values of emissions by <strong>in</strong>sert<strong>in</strong>g a few required <strong>in</strong>puts. Particular attention <strong>in</strong> the<br />
choice of the models has been given to the responsiveness to different types and dosage of fertilisers.<br />
The models <strong>in</strong>dividuated are Bouwman <strong>et</strong> al. (2002) for direct N2O emissions, IPCC (2006) for <strong>in</strong>direct N2O<br />
emissions, Bouwman <strong>et</strong> al. (2002) for NH3 emissions from m<strong>in</strong>eral fertilisers, Dohler <strong>et</strong> al. (2002) for NH3<br />
emissions from organic fertilisers, Stehfest <strong>et</strong> al. (2006) for NO emissions, De Willigen (2000) for nitrates<br />
emissions and Prahsun (2006) for phosphorus emissions.<br />
Most of the <strong>in</strong>put required can be obta<strong>in</strong>ed by ask<strong>in</strong>g the farmer and by soil analysis. Other data required are<br />
the quantity of annual precipitation and the type of climate, which can be easily obta<strong>in</strong>ed from literature or<br />
from some m<strong>et</strong>eorological database. Some factors required by the models are taken from literature and provided<br />
<strong>in</strong> the tool.<br />
The result of the work was a tool that enables the life cycle analyst to easily g<strong>et</strong> quite accurate estimates of<br />
nitrogen and phosphorus emissions from agricultural soils. The development prospect for the tool could enrich<br />
the <strong>in</strong>ternal database to make it more specific for d<strong>et</strong>erm<strong>in</strong>ed crops or geographical areas.<br />
References<br />
Bouwman, A.F., Boumans, L.J.M., Batjes, N.H., 2002. Estimation of global NH3 volatilization loss from<br />
synth<strong>et</strong>ic fertilizers and animal manure applied to arable lands and grasslands. Global Biogechem. Cycles<br />
16(2), 1024.<br />
Bouwman, A.F., Boumans, L.J.M., Batjes, N.H., 2002. Model<strong>in</strong>g global annual N2O and NO emissions from<br />
fertilized fields. Glob Biogeochem Cycles. 16(4), 1080-1107.<br />
IPCC, 2006. Guidel<strong>in</strong>es for National Greenhouse Gas Inventories<br />
Prasuhn, V., 2006. Erfassung der PO4-Austräge für die Ökobilanzierung. SA<strong>LCA</strong>-Phosphor. Zürich, CH,<br />
Agrocope FAL Reckenholz.<br />
Stehfest, E., Bouwman, L., 2006. N2O and NO emission from agricultural fields and soils under natural<br />
veg<strong>et</strong>ation: summariz<strong>in</strong>g available measurement data and modell<strong>in</strong>g of global annual emissions. Nutrient<br />
Cycl<strong>in</strong>g <strong>in</strong> Agroecosystems. 74, 207-228.<br />
733
GROUP 2, SESSION A: CARBON OR WATER FOOTPRINTS, SOIL, BIODIVERSITY 8 th Int. Conference on <strong>LCA</strong> <strong>in</strong> the<br />
Agri-<strong>Food</strong> Sector, 1-4 Oct <strong>2012</strong><br />
54. Soil and biogenic carbon account<strong>in</strong>g <strong>in</strong> carbon footpr<strong>in</strong>t: potential<br />
and challenges<br />
Edouard Périé 1,2,3,* , Sarah J. McLaren 1,3 , Brent E. Clothier 2,3<br />
1 Massey University, Palmerston North, New Zealand, 2 New Zealand Institute for Plant & <strong>Food</strong> Research<br />
Ltd, Palmerston North, New Zealand, 3 New Zealand Life Cycle Management Centre, New Zealand, Correspond<strong>in</strong>g<br />
author. E-mail: Edouard.perie@plantandfood.co.nz<br />
Carbon sequestration <strong>in</strong> soil has the potential to counterbalance a significant proportion of life-cycle greenhouse<br />
gas (GHG) emissions associated with (at least) some horticultural products, as well as improv<strong>in</strong>g soil<br />
health and orchard productivity (Lal, 2010). Furthermore, potentially significant quantities of atmospheric<br />
CO2 can also be stored <strong>in</strong> the stand<strong>in</strong>g biomass of perennial crops (Albrecht and Kandji, 2003).<br />
However, the most widely used standard for GHG account<strong>in</strong>g, the PAS 2050 (BSI, 2011), currently does not<br />
<strong>in</strong>clude above-ground biomass and changes <strong>in</strong> soil carbon stocks as a result of land use (unless provided for<br />
<strong>in</strong> supplementary requirements). This is due to a lack of an agreed m<strong>et</strong>hodology, and uncerta<strong>in</strong>ty as to how to<br />
measure these param<strong>et</strong>ers and <strong>in</strong>tegrate them <strong>in</strong>to a carbon footpr<strong>in</strong>t. Indeed, at the <strong>in</strong>ventory phase, it is<br />
difficult to measure accurately a change <strong>in</strong> the soil carbon stock over short time periods, whilst satisfy<strong>in</strong>g<br />
statistical significance and power levels (Post <strong>et</strong> al., 2001) because of the spatial variability of carbon stocks<br />
<strong>in</strong> soils and their small change with time. Measurement m<strong>et</strong>hods are costly and time consum<strong>in</strong>g – and thus<br />
not easily implementable. Regard<strong>in</strong>g m<strong>et</strong>hodology, the grower’s potential to store carbon is site-dependent<br />
due to the variability <strong>in</strong> the carbon stor<strong>in</strong>g capacity of different types of soil; arguably, this should be reflected<br />
<strong>in</strong> a carbon footpr<strong>in</strong>t calculation. Furthermore the timeframe adopted for measurement of carbon<br />
stock changes can have an important impact on the carbon footpr<strong>in</strong>t results (Milà i Canals <strong>et</strong> al., 2007), because<br />
changes are often not l<strong>in</strong>ear over time. Lastly, ma<strong>in</strong>tenance of soil carbon is also important and it may<br />
be desirable to account for this aspect. In this poster, we describe the challenges and the requirements for the<br />
development of a reliable and practical m<strong>et</strong>hodology to measure soil and biogenic carbon stocks changes<br />
over time <strong>in</strong> apple orchards, summarise m<strong>et</strong>hodological issues related to their <strong>in</strong>tegration <strong>in</strong>to carbon footpr<strong>in</strong>t,<br />
and discuss potential solutions.<br />
References<br />
Albrecht A, Kandji ST, 2003. Carbon sequestration <strong>in</strong> tropical agroforestry systems. Agriculture Ecosystems<br />
& Environment 99(1-3):15-27.<br />
BSI, 2011. PAS 2050:2011 Specification for the Assessment of the Life Cycle Greenhouse Gas Emissions of<br />
Goods and Services. London, UK: British Standards Institute.<br />
Lal R., 2010. Beyond Copenhagen: mitigat<strong>in</strong>g climate change and achiev<strong>in</strong>g food security through soil carbon<br />
sequestration. <strong>Food</strong> Security 2(2):169-77.<br />
Milà i Canals L., Romanyà J., Cowell SJ, 2007. M<strong>et</strong>hod for assess<strong>in</strong>g impacts on life support functions<br />
(LSF) related to the use of "fertile land" <strong>in</strong> Life Cycle Assessment (<strong>LCA</strong>). Journal of Cleaner Production<br />
15:1426-1440.<br />
Post WM, Izaurralde RC, Mann LK, Bliss N., 2001. Monitor<strong>in</strong>g and verify<strong>in</strong>g changes of organic carbon <strong>in</strong><br />
soil. Climatic Change 51(1):73-99.<br />
734
GROUP 2, SESSION A: CARBON OR WATER FOOTPRINTS, SOIL, BIODIVERSITY 8 th Int. Conference on <strong>LCA</strong> <strong>in</strong> the<br />
Agri-<strong>Food</strong> Sector, 1-4 Oct <strong>2012</strong><br />
55. Us<strong>in</strong>g <strong>LCA</strong> to <strong>in</strong>form policy for biochar <strong>in</strong> New Zealand<br />
Ruy Anaya de la Rosa 1 , Sarah J. McLaren 1,2,* , Jim Jones 1 , Ralph Sims 1<br />
1 Massey University, Palmerston North, New Zealand, 2 New Zealand Life Cycle Management Centre, New<br />
Zealand, Correspond<strong>in</strong>g author. E-mail: S.McLaren@massey.ac.nz<br />
Biochar is carbonised biomass; the focus of this study is biochar obta<strong>in</strong>ed from susta<strong>in</strong>able sources and sequestered<br />
<strong>in</strong> soils to susta<strong>in</strong>ably enhance their agricultural and environmental value under present and future<br />
management. Biochar has attracted <strong>in</strong>ternational attention as a carbon sequestration strategy s<strong>in</strong>ce it can take<br />
hundreds or thousands of years to decompose. Moreover, biochar offers opportunities <strong>in</strong> the energy, soil<br />
management, and end-of-life biomass (ELB) recycl<strong>in</strong>g sectors.<br />
The quantity of ELB feedstocks <strong>in</strong> New Zealand that could potentially be used to produce biochar was assessed.<br />
In a highly optimistic scenario <strong>in</strong> which 80% of the available ELB is sourced to make biochar, over 1<br />
million tonnes of CO2 could potentially be sequestered every year. This translates to about 1.5% of NZ’s<br />
total greenhouse gas emissions (based on 2009 data). Although this percentage is small, the relative contribution<br />
of us<strong>in</strong>g biochar on n<strong>et</strong> greenhouse gas emissions may be much more significant when consider<strong>in</strong>g<br />
products <strong>in</strong> particular economic sectors from a life cycle perspective e.g., <strong>in</strong> d<strong>et</strong>erm<strong>in</strong><strong>in</strong>g the carbon footpr<strong>in</strong>t<br />
of agricultural products.<br />
Although a number of biochar systems have been evaluated from a life cycle perspective, only two studies<br />
(Roberts <strong>et</strong> al. 2010; Hammond <strong>et</strong> al., 2010) and one life cycle <strong>in</strong>ventory analysis (Kameyama <strong>et</strong> al., 2010)<br />
seem to have followed <strong>LCA</strong> m<strong>et</strong>hodology – and they all focus on just one impact category (climate change).<br />
Also, one <strong>LCA</strong> study of <strong>et</strong>hanol produced from a hectare of corn <strong>in</strong>cludes stover-derived biochar <strong>in</strong> the<br />
analysis (Kauffman <strong>et</strong> al., 2011). Us<strong>in</strong>g an <strong>LCA</strong> approach, the m<strong>et</strong>hodological issues concern the goal, scope<br />
and decision-context of the study; functional unit; multiple functions; system boundaries and allocation;<br />
choice of impact categories; <strong>in</strong>direct consequences; and reference scenario with which the biochar system is<br />
compared. At the forefront of these variables, it is not clear when and how to conduct attributional versus<br />
consequential <strong>LCA</strong>, and so results can vary considerably.<br />
Therefore, particularly when consider<strong>in</strong>g future policy options to encourage or discourage production and<br />
use of biochar, it is important to carefully consider the different variables and their <strong>in</strong>fluence on the f<strong>in</strong>al<br />
results of an <strong>LCA</strong> study of biochar. This paper presents the results of a life cycle study on three different<br />
future management options for the woody ELB from apple orchards <strong>in</strong> the Hawke’s Bay region <strong>in</strong> NZ undertaken<br />
with the goal of <strong>in</strong>form<strong>in</strong>g stakeholders and policy makers on the best use of biomass to mitigate climate<br />
change. Three different scenarios are compared: i) reference scenario, <strong>in</strong> which the woody ELB is<br />
mulched and left on orchard soils; ii) energy scenario, <strong>in</strong> which the ELB is used for energy generation; and<br />
iii) biochar scenario, <strong>in</strong> which the ELB is used for biochar production and application <strong>in</strong>to the same area. The<br />
results show that the fuller trade-offs associated with alternative end uses of biomass need to be explored<br />
us<strong>in</strong>g a more compl<strong>et</strong>e system expansion perspective and representation of alternatives.<br />
References<br />
Hammond, J., Shackley, S., Sohi, S., Brownsort, P., 2011. Prospective life cycle carbon abatement for pyrolysis<br />
biochar systems <strong>in</strong> the UK. Energy Policy, 39, 2646-2655.<br />
Kameyama, K., Sh<strong>in</strong>ogi, Y., Miyamoto, T., Agarie, K., 2010. Estimation of n<strong>et</strong> carbon sequestration potential<br />
with farmland application of bagasse charcoal: life cycle <strong>in</strong>ventory analysis through a pilot sugarcane<br />
bagasse carbonisation plant. Aust. J Soil Res.,48, 586-592.<br />
Kauffman, N., Hayes, D., Brown, B., 2011. A life cycle assessment of advanced biofuel production from a<br />
hectare of corn. Fuel, 90,3306-3314.<br />
Roberts, K.G., Gloy, B.A., Joseph, S., Scott, N.R., & Lehmann, J., 2010. Life Cycle Assessment of biochar<br />
systems: estimat<strong>in</strong>g the energ<strong>et</strong>ic, economic, and climate change potential. Environ. Sci. Tech., 44, 827-<br />
833.<br />
735
GROUP 2, SESSION A: CARBON OR WATER FOOTPRINTS, SOIL, BIODIVERSITY 8 th Int. Conference on <strong>LCA</strong> <strong>in</strong> the<br />
Agri-<strong>Food</strong> Sector, 1-4 Oct <strong>2012</strong><br />
736<br />
56. Soil quality aspects <strong>in</strong> food <strong>LCA</strong><br />
Taija S<strong>in</strong>kko * , Merja Saar<strong>in</strong>en<br />
MTT Agrifood Research F<strong>in</strong>land, Correspond<strong>in</strong>g author. E-mail: taija.s<strong>in</strong>kko@mtt.fi<br />
Soil quality is a crucial issue <strong>in</strong> food production and consumption from a susta<strong>in</strong>ability po<strong>in</strong>t of view. However,<br />
there is no commonly accepted soil quality impact <strong>in</strong>dicator <strong>in</strong> food <strong>LCA</strong>. Soil quality can be def<strong>in</strong>ed<br />
as “The capacity of soil to function with<strong>in</strong> ecosystem boundaries to susta<strong>in</strong> biological productivity, ma<strong>in</strong>ta<strong>in</strong><br />
environmental quality, and promote plant and animal health” (Doran and Park<strong>in</strong> 1994). Soil properties are<br />
generally divided <strong>in</strong>to three categories; biological, chemical and physical quality characters. The m<strong>et</strong>hodology<br />
of soil quality assessment should adequately reflect all the ma<strong>in</strong> soil characters and/or their <strong>in</strong>terface.<br />
The aim of this on-go<strong>in</strong>g study is to 1) review suggested soil quality <strong>in</strong>dicators for <strong>LCA</strong>, 2) assess their practical<br />
applicability <strong>in</strong> process-based food <strong>LCA</strong>, 3) adapt or further develop the m<strong>et</strong>hodology for soil quality<br />
assessment <strong>in</strong> process-based food <strong>LCA</strong>, and 4) (prelim<strong>in</strong>arily) assess soil quality of case-products. Through a<br />
literature survey we compiled some m<strong>et</strong>hods suggested for the assessment of land use impacts on soil quality<br />
<strong>in</strong> <strong>LCA</strong> (e.g. Muys and García Quijano 2002, Achten <strong>et</strong> al. 2008, Wagendorp <strong>et</strong> al. 2006). The m<strong>et</strong>hods <strong>in</strong>clude<br />
numerous <strong>in</strong>dicators, and lack of data is one of the major challenges for practical application. Therefore,<br />
Milà i Canals <strong>et</strong> al. (2007) proposed a sole <strong>in</strong>dicator, soil organic matter (SOM), to assess land use impacts<br />
on soil quality. However, SOM of arable land changes rather slowly from an annual measurements<br />
po<strong>in</strong>t of view. This reduces its flexibility as an <strong>in</strong>dicator, restrict<strong>in</strong>g feedback for improvements. Accord<strong>in</strong>g<br />
to the ISO 14040 series, <strong>LCA</strong> impact category implies how production of a certa<strong>in</strong> product affects nature; i.e.<br />
the reference situation is a natural stage. The suggested m<strong>et</strong>hods <strong>in</strong> the literature represent this approach, but<br />
the approach of susta<strong>in</strong>able development challenges it. Actually, the field should rema<strong>in</strong> a field, and farm<strong>in</strong>g<br />
practices should ma<strong>in</strong>ta<strong>in</strong> or improve soil quality so that farm<strong>in</strong>g can cont<strong>in</strong>ue (with<strong>in</strong> ecosystem boundaries).<br />
A concept of ecosystem service takes this aspect <strong>in</strong>to account as it is based on the concept of susta<strong>in</strong>able<br />
use of natural resources. It was decided to take this as the theor<strong>et</strong>ical basis for develop<strong>in</strong>g a soil quality<br />
<strong>in</strong>dicator <strong>in</strong> this study.<br />
Based on review<strong>in</strong>g and assess<strong>in</strong>g m<strong>et</strong>hods we concluded that a new m<strong>et</strong>hodology (<strong>in</strong>cl. theor<strong>et</strong>ical background)<br />
is needed. We <strong>in</strong>itiated an <strong>in</strong>teraction b<strong>et</strong>ween specialists from different branches of soil science to<br />
establish which aspects should be <strong>in</strong>cluded <strong>in</strong> the soil quality <strong>in</strong>dicator to ensure that it is amenable to follow-up<br />
measurements and, for example, is sensitive to differences b<strong>et</strong>ween organic and conventional cultivation<br />
m<strong>et</strong>hods.<br />
The study is <strong>in</strong>cluded <strong>in</strong> the project “Towards Susta<strong>in</strong>able <strong>Food</strong> Choices – Consumer Information on Nutrition<br />
and Environmental Impacts of <strong>Food</strong> <strong>in</strong> the Context of Susta<strong>in</strong>ability” funded by the F<strong>in</strong>nish M<strong>in</strong>istry of<br />
Agriculture and Forestry and MTT Agrifood Research F<strong>in</strong>land.<br />
References<br />
Achten, W.M.J., Mathjis, E., Muys, B., 2008. Propos<strong>in</strong>g a life cycle land use impact calculation m<strong>et</strong>hodology.<br />
Proc. 6 th Int. Conf. on <strong>LCA</strong> <strong>in</strong> Agri-<strong>Food</strong> Sector, Zurich, pp. 22-33.<br />
Doran, J.W., Park<strong>in</strong>, T.B., 1994. Def<strong>in</strong><strong>in</strong>g and assess<strong>in</strong>g soil quality. In: J.W. Doran <strong>et</strong> al. (eds.) Def<strong>in</strong><strong>in</strong>g<br />
Soil Quality for a Susta<strong>in</strong>able Environment. Soil Science Soci<strong>et</strong>y of America, Madison, WI, Special Publication<br />
35, pp. 3-22.<br />
Milà i Canals, L., Romanyà, J., Cowell, S.J., 2007. M<strong>et</strong>hod for assess<strong>in</strong>g impacts on life support functions<br />
(LFS) related to the use of “fertile land” <strong>in</strong> Life Cycle Assessment (<strong>LCA</strong>). J Clean Prod 15, 1426-1440.<br />
Muys, B., García Quijano, J., 2002. A new m<strong>et</strong>hod for Land Use Impact Assessment <strong>in</strong> <strong>LCA</strong> based on ecosystem<br />
exergy concept. Internal report.<br />
Wagendorp, T., Gul<strong>in</strong>ck, H., Copp<strong>in</strong>, P., Muys, B., 2006. Land use impact evaluation <strong>in</strong> life cycle assessment<br />
based on ecosystem thermodynamics. Energy 31, 112-125.
GROUP 2, SESSION A: CARBON OR WATER FOOTPRINTS, SOIL, BIODIVERSITY 8 th Int. Conference on <strong>LCA</strong> <strong>in</strong> the<br />
Agri-<strong>Food</strong> Sector, 1-4 Oct <strong>2012</strong><br />
57. The <strong>in</strong>fluence of m<strong>et</strong>hodology on the water footpr<strong>in</strong>t of selected<br />
UK produced and consumed products<br />
Rob Lillywhite 1 , Ashok Chapaga<strong>in</strong> 2 , Tim Hess 3<br />
1 University of Warwick, Wellesbourne, Warwick, CV35 6JQ, UK, 2 WWF-UK, Goldam<strong>in</strong>g, UK, 3 Cranfield<br />
University, Bedford, UK, Correspond<strong>in</strong>g author. E-mail: robert.lillywhite@warwick.ac.uk<br />
Water footpr<strong>in</strong>t<strong>in</strong>g is still evolv<strong>in</strong>g as a discipl<strong>in</strong>e and various m<strong>et</strong>hodologies and approaches exist to quantify<br />
the volumes of water withdrawn, used and consumed for food production and to assess any associated<br />
environmental impacts. The choice of m<strong>et</strong>hodology will <strong>in</strong>fluence the results and <strong>in</strong>terpr<strong>et</strong>ation, a situation<br />
which has resulted <strong>in</strong> considerable variation <strong>in</strong> reported estimates on water use and its impacts for different<br />
agricultural and food products. M<strong>in</strong>dful of this, the UK Government commissioned research to explore the<br />
different approaches us<strong>in</strong>g selected UK produced and consumed products (potato, lamb, milk, strawberry,<br />
sugar and w<strong>in</strong>ter wheat) as case studies.<br />
The study used three approaches:<br />
1. The water footpr<strong>in</strong>t account<strong>in</strong>g framework developed by The Water Footpr<strong>in</strong>t N<strong>et</strong>work (Hoekstra <strong>et</strong><br />
al., 2011). This approach estimates the volume of green and blue water consumed dur<strong>in</strong>g the different<br />
stages of production (evapotranspiration, irrigation, crop protection, livestock dr<strong>in</strong>k<strong>in</strong>g, clean<strong>in</strong>g<br />
<strong>et</strong>c.)<br />
2. The stress-weighted water footpr<strong>in</strong>t (Ridoutt and Pfister, 2010). This approach estimates the volume<br />
of blue water consumed dur<strong>in</strong>g production and converts it to an assessment of local water stress us<strong>in</strong>g<br />
a water stress <strong>in</strong>dex (WSI) (Pfister at al., 2009)<br />
3. The normalised water footpr<strong>in</strong>t, H2Oe (Ridoutt <strong>et</strong> al., <strong>2012</strong>) This is a development of the stressweighted<br />
approach <strong>in</strong> which the stress-weighted value is divided by the global average WSI to give<br />
an assessment of water consumption relative to a global average.<br />
The results show that the considerable <strong>in</strong>fluence that m<strong>et</strong>hodology has on the estimated values. The volum<strong>et</strong>ric<br />
results are not directly comparable to the stress-weighted and normalised results s<strong>in</strong>ce they are based on<br />
different criteria, but they are all commonly referred to as water footpr<strong>in</strong>ts and clearly illustrate the potential<br />
for confusion that can arise <strong>in</strong> this discipl<strong>in</strong>e. Table 1 shows the results for UK and Israeli potato and allows<br />
the follow<strong>in</strong>g <strong>in</strong>terpr<strong>et</strong>ation.<br />
In terms of volum<strong>et</strong>ric water consumption, Israeli potatoes use one and a half times more water than UK<br />
production. However, where the impact of that water consumption is considered, Israeli potatoes can have a<br />
ten-fold greater impact on local water resources and a n<strong>in</strong><strong>et</strong>een-fold greater impact at a global scale. The key<br />
to understand<strong>in</strong>g and us<strong>in</strong>g these results is the omission of green water from the stress-weighed and normalised<br />
approaches which pr<strong>in</strong>cipally reflects the difference <strong>in</strong> evapotranspiration (and therefore climate) but<br />
also of irrigation practice, b<strong>et</strong>ween the two countries.<br />
The volum<strong>et</strong>ric water footpr<strong>in</strong>t has been very successful <strong>in</strong> rais<strong>in</strong>g awareness of the use of water and is <strong>in</strong>valuable<br />
for water audit<strong>in</strong>g purposes but we conclude that it has limited value for d<strong>et</strong>erm<strong>in</strong><strong>in</strong>g the local water<br />
stress of globally sourced products. A more balanced approach, especially with<strong>in</strong> the <strong>LCA</strong> framework, is<br />
possible us<strong>in</strong>g the normalised water footpr<strong>in</strong>t alongside other environmental <strong>in</strong>dicators, such as eutrophication<br />
and acidification. This will provide a more consistent and robust approach for environmental and susta<strong>in</strong>ability<br />
studies.<br />
References<br />
Hoekstra, A.Y., Chapaga<strong>in</strong>, A.K., Aldaya, M.M., Mekonnen, M.M. (2011) The water footpr<strong>in</strong>t assessment manual: S<strong>et</strong>t<strong>in</strong>g the global standard, Earthscan, London, UK.<br />
Pfister ,S., Koehler, A., Hellweg, S. (2009) Assess<strong>in</strong>g the environmental impacts of freshwater consumption <strong>in</strong> <strong>LCA</strong>. Environ. Sci. Tech 43, 4098-4104.<br />
Ridoutt, B.G., Pfister, S. 2010. A revised approach to water footpr<strong>in</strong>t<strong>in</strong>g to make transparent the impacts of consumption and production on global freshwater scarcity.<br />
Global Environ. Change 20, 113-120.<br />
Ridoutt B,G., Sanguansri, P., Freer, M., Harper, G.S. (<strong>2012</strong>) Water footpr<strong>in</strong>t of livestock: comparison of six geographically def<strong>in</strong>ed beef production systems. International<br />
Journal of <strong>LCA</strong> 17: 165-175.<br />
Table 1. The <strong>in</strong>fluence of m<strong>et</strong>hodology on the water footpr<strong>in</strong>t of UK and Israeli potato<br />
Volum<strong>et</strong>ric (liStress- Normalised<br />
Country tres/kg)weighted (H2Oe/kg)<br />
UK 107 10 9<br />
Israel 147 103 171<br />
737
GROUP 2, SESSION A: CARBON OR WATER FOOTPRINTS, SOIL, BIODIVERSITY 8 th Int. Conference on <strong>LCA</strong> <strong>in</strong> the<br />
Agri-<strong>Food</strong> Sector, 1-4 Oct <strong>2012</strong><br />
58. Water footpr<strong>in</strong>ts of wheat and maize: comparison b<strong>et</strong>ween Ch<strong>in</strong>a’s<br />
ma<strong>in</strong> breadbask<strong>et</strong> bas<strong>in</strong>s<br />
J<strong>in</strong>g Huang 1,2 , Bradley G Ridoutt 2 , Feng Huang 3 , Fu Chen 1,*<br />
1 Ch<strong>in</strong>a Agricultural University, College of Agriculture and Biotechnology, Beij<strong>in</strong>g 100193, Ch<strong>in</strong>a, 2 Commonwealth<br />
Scientific and Industrial Research Organisation (CSIRO), Susta<strong>in</strong>able Agriculture National Research<br />
Flagship, Private Bag 10, Clayton South, Victoria 3169, Australia, 3 Ch<strong>in</strong>a Agricultural University,<br />
College of Resource and Environmental Sciences, Beij<strong>in</strong>g 100193, Ch<strong>in</strong>a, * Correspond<strong>in</strong>g author. E-mail:<br />
chenfu@cau.edu.cn<br />
As the most populous country <strong>in</strong> the world, Ch<strong>in</strong>a’s food security has become an issue of broad concern. A<br />
critical factor which threatens food production is water scarcity. In recent decades, the water-scarce northern<br />
part of Ch<strong>in</strong>a has become the most important agricultural production area, supported <strong>in</strong> small part by water<br />
transfers from the South. Substantial volumes of food are be<strong>in</strong>g transferred from the water-scarce north to the<br />
water-rich south. In the context of Ch<strong>in</strong>a’s food security, this complex arrangement has been the focus of<br />
much debate. However, science-based evidence to support an environmentally-susta<strong>in</strong>able <strong>in</strong>crease <strong>in</strong><br />
Ch<strong>in</strong>a’s food production is rarely found <strong>in</strong> the literature.<br />
This study compares the water footpr<strong>in</strong>ts of cereal production (wheat and maize) <strong>in</strong> Ch<strong>in</strong>a’s ma<strong>in</strong> breadbask<strong>et</strong><br />
bas<strong>in</strong>s. Water footpr<strong>in</strong>ts were calculated us<strong>in</strong>g an <strong>LCA</strong>-based water footpr<strong>in</strong>t<strong>in</strong>g m<strong>et</strong>hod (Ridoutt and<br />
Pfister, 2010) which uses a Water Stress Index (WSI; Pfister <strong>et</strong> al., 2009) to express the environmental relevance<br />
of water use. The water footpr<strong>in</strong>ts are presented <strong>in</strong> the units H2Oe (equivalent), where 1 L H2Oe represents<br />
1 L of consumptive freshwater use at the global average WSI.<br />
Wheat grown <strong>in</strong> the Huang and Hai bas<strong>in</strong>s had much higher water footpr<strong>in</strong>ts (1,262 L H2Oe kg -1 ) compared<br />
to wheat grown <strong>in</strong> the Chang bas<strong>in</strong> (31 L H2Oe kg -1 ). The water footpr<strong>in</strong>ts of maize grown <strong>in</strong> the Huang,<br />
Huai and Hai bas<strong>in</strong>s (515 L H2Oe kg -1 ) were also much higher than maize grown <strong>in</strong> the Chang and Songliao<br />
bas<strong>in</strong>s (35 and 44 L H2Oe kg -1 respectively).<br />
These results demonstrate a huge spatial differentiation of water use for cereal production <strong>in</strong> Ch<strong>in</strong>a’s ma<strong>in</strong><br />
breadbask<strong>et</strong> bas<strong>in</strong>s. It is suggested that the variability <strong>in</strong> crop water footpr<strong>in</strong>t b<strong>et</strong>ween production systems<br />
should be taken <strong>in</strong>to consideration <strong>in</strong> strategic decisions related to Ch<strong>in</strong>a’s food production. National-scale<br />
cropp<strong>in</strong>g pattern adjustment and technological upgrade at the bas<strong>in</strong> level are considered as important <strong>in</strong>terventions<br />
to alleviate water stress from agriculture.<br />
References<br />
Ridoutt, B.G., Pfister, S., 2010. A revised approach to water footpr<strong>in</strong>t<strong>in</strong>g to make transparent the impacts of<br />
consumption and production on global freshwater scarcity. Global Environ. Chang. 20, 113-120.<br />
Pfister, S., Koehler, A., Hellweg, S., 2009. Assess<strong>in</strong>g the environmental impacts of freshwater consumption<br />
<strong>in</strong> <strong>LCA</strong>. Environ. Sci. Tech. 43, 4098-4104.<br />
738
GROUP 2, SESSION A: CARBON OR WATER FOOTPRINTS, SOIL, BIODIVERSITY 8 th Int. Conference on <strong>LCA</strong> <strong>in</strong> the<br />
Agri-<strong>Food</strong> Sector, 1-4 Oct <strong>2012</strong><br />
59. Environmental impact of green beans: the relevance of water use<br />
Thomas Kägi * , Silvan Rüttimann, Fredy D<strong>in</strong>kel<br />
Carbotech AG, Switzerland, Correspond<strong>in</strong>g author. E-mail: t.kaegi@carbotech.ch<br />
About 80% of the world fresh water consumption is attributed to agriculture. Excessive water use can lead to<br />
water stress, one of the major environmental challenges <strong>in</strong> the future. As fresh water is g<strong>et</strong>t<strong>in</strong>g scarcer due to<br />
climate change and due to <strong>in</strong>crease irrigation amounts, the role of environmental impact due to water scarcity<br />
is grow<strong>in</strong>g <strong>in</strong> life cycle impact assessments.<br />
The goal of this study (Kaegi <strong>et</strong> al. 2011) was to compare different green bean production and process<strong>in</strong>g<br />
scenarios and to derive the contribution of water use to the total environmental impact. The functional unit<br />
was 1kg of green beans, ready to eat. All relevant life cycle phases were considered <strong>in</strong>clud<strong>in</strong>g cultivation of<br />
beans (field processes, fertiliser and chemical <strong>in</strong>puts, irrigation, direct field emissions), transportation, further<br />
process<strong>in</strong>g (such as wash<strong>in</strong>g and then dry<strong>in</strong>g or cann<strong>in</strong>g or freez<strong>in</strong>g) and cook<strong>in</strong>g of the beans. Data for bean<br />
production was based on Lattauschke (2002) and data for direct field emissions were derived from Nemecek<br />
& Kägi (2007). The eco<strong>in</strong>vent <strong>in</strong>ventory V2.2 database (Swiss Centre for <strong>LCA</strong> 2009) was used for other<br />
secondary data (fertiliser production, transportation and other) and emission factors. For valuation of the<br />
different environmental impacts (such as global warm<strong>in</strong>g-, acidification-, eutrophication-, ozone depl<strong>et</strong>ion<br />
potential, ecological and human toxicity <strong>et</strong>c.) the ecological scarcity m<strong>et</strong>hod (Frischknecht 2007) was used<br />
<strong>in</strong>clud<strong>in</strong>g regional water scarcity factors for the water use.<br />
The high water scarcity <strong>in</strong> the Spanish region where the beans are grown leads to a large environmental impact.<br />
Beans grown <strong>in</strong> greenhouses show a similar high environmental impact due to fossil energy use for<br />
heat<strong>in</strong>g. Fresh beans from Egypt are flown to Switzerland which expla<strong>in</strong>s the high contribution from transportation.<br />
Further process<strong>in</strong>g such as cann<strong>in</strong>g, freez<strong>in</strong>g, dry<strong>in</strong>g lead to higher environmental impacts compared<br />
to fresh beans. However, when compared to irrigated beans from Spa<strong>in</strong>, this seems to be irrelevant.<br />
If the whole life cycle of ready to eat beans is considered the water impact can play a very important role. It<br />
contributes up to 85% of the total environmental impact <strong>in</strong> the case of beans from Spa<strong>in</strong>. The implemented<br />
water impact <strong>in</strong> nowadays life cycle assessment m<strong>et</strong>hods covers a crucial and important environmental topic<br />
and helps to improve environmental consult<strong>in</strong>g <strong>in</strong> the field of agriculture and water consumption.<br />
References<br />
D<strong>in</strong>kel <strong>et</strong> al. (2006). Calculations for „Der kluge E<strong>in</strong>kaufswagen“ Unterrichtse<strong>in</strong>heit zu den Themen Umwelt,<br />
Konsum, Ökobilanzen. Bundesamt für Umwelt (BAFU)<br />
Frischknecht <strong>et</strong> al. (2008) Frischknecht R., Ste<strong>in</strong>er R., Jungbluth N. (2008) M<strong>et</strong>hode der ökologischen Knappheit<br />
Ökofaktoren 2006. Bundesamt für Umwelt (BAFU)/ÖBU.<br />
Lattauschke, G, 2002. H<strong>in</strong>weise zum umweltgerechten Anbau von Freilandgemüse im Freistaat Sachsen –<br />
Buschbohnen. Sächsische Landesanstalt für Landwirtschaft. http://www.landwirtschaft.sachsen.de/LFL<br />
Nemecek T. & Kägi T. (2007). Life Cycle Inventories of Swiss and European Agricultural Production Systems.<br />
F<strong>in</strong>al report eco<strong>in</strong>vent V2.0 No. 15a. Agroscope Reckenholz-Taenikon Research Station ART,<br />
Swiss Centre for Life Cycle Inventories, Zurich and Dubendorf, CH, r<strong>et</strong>rieved from www.eco<strong>in</strong>vent.ch<br />
739
GROUP 2, SESSION A: CARBON OR WATER FOOTPRINTS, SOIL, BIODIVERSITY 8 th Int. Conference on <strong>LCA</strong> <strong>in</strong> the<br />
Agri-<strong>Food</strong> Sector, 1-4 Oct <strong>2012</strong><br />
Figure 1. Environmental impact per kg beans, ready to eat.<br />
740<br />
eco po<strong>in</strong>ts / kg beans<br />
7000<br />
6000<br />
5000<br />
4000<br />
3000<br />
2000<br />
1000<br />
0<br />
cook<strong>in</strong>g<br />
process<strong>in</strong>g<br />
transport<br />
production, rest<br />
production, water use
GROUP 2, SESSION A: CARBON OR WATER FOOTPRINTS, SOIL, BIODIVERSITY 8 th Int. Conference on <strong>LCA</strong> <strong>in</strong> the<br />
Agri-<strong>Food</strong> Sector, 1-4 Oct <strong>2012</strong><br />
60. Hands-on water footpr<strong>in</strong>t<strong>in</strong>g: putt<strong>in</strong>g the assessment of<br />
agricultural fresh water use <strong>in</strong>to practice<br />
Daniel Thylmann * , Ann<strong>et</strong>te Köhler, Sab<strong>in</strong>e Deiml<strong>in</strong>g<br />
PE INTERNATIONAL AG, Le<strong>in</strong>felden-Echterd<strong>in</strong>gen, Germany, Correspond<strong>in</strong>g author. E-mail:<br />
d.thylmann@pe-<strong>in</strong>ternational.com<br />
Freshwater scarcity is now recognised to become one of the ma<strong>in</strong> environmental issues <strong>in</strong> the future. However,<br />
the consideration of fresh water consumption <strong>in</strong> life cycle modell<strong>in</strong>g is still very young. The fact that<br />
no standardised m<strong>et</strong>hod has evolved so far has led to a hesitant reaction of stakeholders towards the generally<br />
ris<strong>in</strong>g <strong>in</strong>terest <strong>in</strong> the subject.<br />
Agriculture contributes 80% to worldwide freshwater use (WWAP 2009), thus its key importance <strong>in</strong> susta<strong>in</strong>able<br />
water management practices is undoubted. But agricultural systems are particularly difficult to assess <strong>in</strong><br />
an <strong>LCA</strong> framework, water use be<strong>in</strong>g no exception. PE INTERNATIONAL has implemented the latest m<strong>et</strong>hods<br />
developed by Pfister <strong>et</strong> al. (2009, 2011) <strong>in</strong> their balanc<strong>in</strong>g approaches and is now conduct<strong>in</strong>g compl<strong>et</strong>e<br />
water footpr<strong>in</strong>t assessments with consideration of regional water availability. The <strong>LCA</strong> software and database<br />
GaBi was updated (GaBi <strong>2012</strong>) and conta<strong>in</strong>s compl<strong>et</strong>e and consistent water <strong>in</strong>ventory data now, allow<strong>in</strong>g<br />
assessment of fresh water use and consumption <strong>in</strong> an <strong>LCA</strong> framework us<strong>in</strong>g software solutions.<br />
This paper describes how assessments of fresh water use <strong>in</strong> agricultural products can be put <strong>in</strong>to practice<br />
us<strong>in</strong>g the latest software solutions. More than 100 agricultural products conta<strong>in</strong>ed <strong>in</strong> the GaBi 5 database<br />
were updated to conta<strong>in</strong> data on water use and consumption. Important lessons learned from this update<br />
process are presented. Results from a case study on cotton cultivation <strong>in</strong> the US are shown, <strong>in</strong>clud<strong>in</strong>g differentiation<br />
of water availability <strong>in</strong> four different cultivation regions <strong>in</strong> the US (Fig. 1). These results are considered<br />
to be a representative example for a vari<strong>et</strong>y of other agricultural products as well.<br />
The experiences ga<strong>in</strong>ed underl<strong>in</strong>e the relevance of agricultural processes, especially of irrigation, for the<br />
water footpr<strong>in</strong>t results of the compl<strong>et</strong>e value cha<strong>in</strong>. It can also be seen that regional water availability needs<br />
to be considered <strong>in</strong> order to derive mean<strong>in</strong>gful conclusions from water use assessments. Another important<br />
aspect is the necessity of consistent <strong>in</strong>ventory data on water use and the difficulties to obta<strong>in</strong> these.<br />
Water is an important aspect when consider<strong>in</strong>g the environmental impact of a product and should not be<br />
ignored any longer <strong>in</strong> <strong>LCA</strong>s. With the m<strong>et</strong>hods on hand, it is now possible to account for fresh water consumption<br />
<strong>in</strong> a <strong>LCA</strong> framework, also for agricultural products. However, large challenges lay ahead. Further<br />
advancements are needed <strong>in</strong> the development of a harmonised and standardised m<strong>et</strong>hod, especially for the<br />
impact assessment phase. F<strong>in</strong>ally, <strong>LCA</strong> is not meant to be a self-conta<strong>in</strong>ed art. Not until companies, policy<br />
makers, civil soci<strong>et</strong>y and private people understand the necessity of a responsible use of fresh water resources,<br />
the f<strong>in</strong>al goal of water footpr<strong>in</strong>t<strong>in</strong>g will be reached.<br />
References<br />
GaBi, <strong>2012</strong>. GaBi 5 - Software and Databases for Life-Cycle-Eng<strong>in</strong>eer<strong>in</strong>g, PE INTERNATIONAL AG,<br />
Copyright, TM. Stuttgart, Echterd<strong>in</strong>gen. 1992 - <strong>2012</strong>.<br />
Pfister, S.; Koehler, A.; Hellweg, S., 2009. Assess<strong>in</strong>g the environmental impact of freshwater consumption<br />
<strong>in</strong> <strong>LCA</strong>. Environ Sci Technol 43(11), 4098-4104.<br />
Pfister, S; Bayer, P; Koehler, A; Hellweg, S, 2011. Environmental impacts of water use <strong>in</strong> global crop production:<br />
hotspots and trade-offs with land use. Environmental Science & Technology 45, 5761-5768.<br />
WWAP, World Water Assessment Programme, 2009. The United Nations World Water Development Report<br />
3: Water <strong>in</strong> a Chang<strong>in</strong>g World, UNESCO, Paris and Earthscan, London.<br />
741
GROUP 2, SESSION A: CARBON OR WATER FOOTPRINTS, SOIL, BIODIVERSITY 8 th Int. Conference on <strong>LCA</strong> <strong>in</strong> the<br />
Agri-<strong>Food</strong> Sector, 1-4 Oct <strong>2012</strong><br />
Figure 1. Example of a compl<strong>et</strong>e water footpr<strong>in</strong>t (<strong>in</strong> litres) of a processed agricultural product (cotton T-shirt)<br />
consider<strong>in</strong>g regional water availability<br />
742
GROUP 2, SESSION A: CARBON OR WATER FOOTPRINTS, SOIL, BIODIVERSITY 8 th Int. Conference on <strong>LCA</strong> <strong>in</strong> the<br />
Agri-<strong>Food</strong> Sector, 1-4 Oct <strong>2012</strong><br />
61. A m<strong>et</strong>hod for estimat<strong>in</strong>g water use <strong>in</strong> food supply cha<strong>in</strong>s: liquid<br />
milk as an example<br />
Stefan Hörtenhuber 1,2,* , Ra<strong>in</strong>er Weißhaid<strong>in</strong>ger 1 , Thomas L<strong>in</strong>denthal 1,3 ,Werner Zollitsch 2<br />
1 Research Institute of Organic Agriculture (FiBL) Austria, 2 University of Natural Resources and Life Sciences<br />
Vienna, Department of Susta<strong>in</strong>able Agricultural Systems, 3 University of Natural Resources and Life<br />
Sciences Vienna, Centre for Global Change and Susta<strong>in</strong>ability, Correspond<strong>in</strong>g author. E-mail:<br />
stefan.hoertenhuber@fibl.org<br />
A water-use (WU) m<strong>et</strong>hod, based on Hoekstra <strong>et</strong> al. (2009), was modified and applied to Austrian agriculture,<br />
particularly livestock production. To me<strong>et</strong> the requirements of a life cycle assessment (<strong>LCA</strong>) approach,<br />
system boundaries <strong>in</strong>clude additional demand for water, e.g. from dairies, trade, supply of production <strong>in</strong>puts<br />
(m<strong>in</strong>eral fertilisers) or for <strong>in</strong>dustrial process<strong>in</strong>g of feedstuffs. The WU m<strong>et</strong>hod accounts for effective or so<br />
called ‘blue’ water demand which is needed for irrigation, clean<strong>in</strong>g, livestock‘s dr<strong>in</strong>k<strong>in</strong>g water or for cool<strong>in</strong>g<br />
systems <strong>in</strong> dairies. Precipitation water which is evapotranspirated is summarised with<strong>in</strong> the ‘green’ water,<br />
<strong>in</strong>clud<strong>in</strong>g a potential loss of precipitation <strong>in</strong> the case of preced<strong>in</strong>g clear<strong>in</strong>g of tropical forests. The WU<br />
m<strong>et</strong>hod provides regionally differentiated water demand for effective evapotranspiration per kg yield for<br />
roughage, concentrates (gra<strong>in</strong>s, gra<strong>in</strong> legumes, oilseeds or co-products from oil mills and distilleries) or bedd<strong>in</strong>g<br />
material, which is not only based on precipitation <strong>in</strong>puts but also reflects climatic and soil conditions,<br />
groundwater recharge and run-off. ’Grey’ water partly <strong>in</strong>tegrates an eutrophication potential <strong>in</strong>to the water<br />
footpr<strong>in</strong>t. For derivation of the grey water (i.e. dilution below nitrate limits 45 mg NO3 per litre <strong>in</strong> dr<strong>in</strong>k<strong>in</strong>g<br />
water), a d<strong>et</strong>ailed nitrogen (N) cycle model was used, <strong>in</strong>clud<strong>in</strong>g various N-<strong>in</strong>puts and outputs from agricultural<br />
production and its upstream and downstream processes. Co-products (beef from cull cows and calves)<br />
and water required for the rear<strong>in</strong>g phase of dairy cow were also considered (see Hörtenhuber <strong>et</strong> al., 2010).<br />
Generally, results for livestock products’ WU ma<strong>in</strong>ly depend on type (i.e. composition) and quantity of the<br />
di<strong>et</strong> needed to produce one unit of product (kg milk).<br />
The result for an alp<strong>in</strong>e, grassland-based production system shows an overall water demand of about 940<br />
litres per kg liquid milk at the supermark<strong>et</strong> (Fig. 1). This WU result agrees with f<strong>in</strong>d<strong>in</strong>gs from previous studies<br />
for milk, e.g. 800 and 990 litres of water demand (global scale) as reported by Chapaga<strong>in</strong> and Hoekstra<br />
(2003) and Hoekstra and Chapaga<strong>in</strong> (2006), respectively. However, some differences b<strong>et</strong>ween these sources<br />
and our study are obvious, such as (1) a higher proportion of grey water and (2) a smaller proportion of green<br />
water <strong>in</strong> our result; (3) additional processes were <strong>in</strong>cluded, which require water along the entire supply cha<strong>in</strong>.<br />
A potential for the reduction of water demand was identified particularly for ‘grey water’ by implement<strong>in</strong>g<br />
the follow<strong>in</strong>g measures: (i) green<strong>in</strong>g and catch crops <strong>in</strong>stead of bare fallow, (ii) application of manure/fertiliser<br />
accord<strong>in</strong>g to the requirement of crops at the optimum po<strong>in</strong>t of time, (iii) decreas<strong>in</strong>g the <strong>in</strong>put<br />
of external production factors (m<strong>in</strong>eral fertilisers) or (iv) preferr<strong>in</strong>g organic over m<strong>in</strong>eral fertilisers. Because<br />
of the limited water supply <strong>in</strong> many parts of the world, comprehensive WU or water footpr<strong>in</strong>t m<strong>et</strong>hods need<br />
to be developed and <strong>in</strong>tegrated <strong>in</strong>to susta<strong>in</strong>ability assessment schemes for agricultural products.<br />
References<br />
Chapaga<strong>in</strong>, A.K., Hoekstra, A.Y., 2003. Virtual water flows b<strong>et</strong>ween nations <strong>in</strong> relation to trade <strong>in</strong> livestock<br />
and livestock products. Value of Water Research Report Series No. 13, UNESCO-IHE.<br />
Hoekstra, A.Y., Chapaga<strong>in</strong>, A.K., 2006. Water footpr<strong>in</strong>ts of nations: Water use by people as a function of<br />
their consumption pattern. Water Resources Management. 21(1), 35-48.<br />
Hoekstra, A.Y., Chapaga<strong>in</strong>, A.K., Aldaya, M.M., Mekonnen, M.M., 2009. Water footpr<strong>in</strong>t manual: State of<br />
the art 2009. Water Footpr<strong>in</strong>t N<strong>et</strong>work, Enschede, Niederlande.<br />
Hörtenhuber, S., L<strong>in</strong>denthal, T., Amon, B., Markut, T., Kirner, L., Zollitsch, W., 2010. Greenhouse gas<br />
emissions from selected Austrian dairy production systems – model calculations consider<strong>in</strong>g the effects of<br />
land use change. Renewable Agriculture and <strong>Food</strong> Systems 25(4), 316-329.<br />
Hörtenhuber, S., L<strong>in</strong>denthal, T., Schmid, E., 2011: Water Footpr<strong>in</strong>t – E<strong>in</strong> Beitrag zur Nachhaltigkeitsbewertung<br />
am Beispiel der Milcherzeugung, <strong>in</strong>: Proceed<strong>in</strong>gs of the 66th ALVA Conference, May 23-24 2011.<br />
Graz, Austria, pp. 87-89.<br />
743
GROUP 2, SESSION A: CARBON OR WATER FOOTPRINTS, SOIL, BIODIVERSITY 8 th Int. Conference on <strong>LCA</strong> <strong>in</strong> the<br />
Agri-<strong>Food</strong> Sector, 1-4 Oct <strong>2012</strong><br />
Figure 1. Results for a comprehensive evaluation of water use (litres H2O) of 1 kg liquid milk from an alp<strong>in</strong>e,<br />
grassland-based production system at the r<strong>et</strong>ailer level.<br />
744
GROUP 2, SESSION A: CARBON OR WATER FOOTPRINTS, SOIL, BIODIVERSITY 8 th Int. Conference on <strong>LCA</strong> <strong>in</strong> the<br />
Agri-<strong>Food</strong> Sector, 1-4 Oct <strong>2012</strong><br />
62. Irrigation systems used <strong>in</strong> water scarce locations: <strong>LCA</strong> of three<br />
contrasted scenarios for watermelon grow<strong>in</strong>g<br />
Ludiv<strong>in</strong>e Pradeleix 1,* , Sami Bouarfa 1 , Philippe Roux 2 , M. Gueguen 2 , V. Bellon-Maurel 2<br />
1 Cemagref/Irstea, Research Unit: G-Eau, Water management, stakeholders and uses, 361 rue JF Br<strong>et</strong>on,<br />
34196 Montpellier, <strong>France</strong>, 2 Cemagref/Irstea, Research Unit: Information & technologies for agroprocesses,<br />
361 rue JF Br<strong>et</strong>on, 34196 Montpellier, <strong>France</strong>, Correspond<strong>in</strong>g author. E-mail: ludiv<strong>in</strong>e.pradeleix@irstea.fr<br />
The agricultural productivity <strong>in</strong> arid and semi-arid regions greatly depends upon the access to irrigation. But<br />
irrigated areas are often charged with be<strong>in</strong>g water and chemical <strong>in</strong>puts <strong>in</strong>tensive and consequently damag<strong>in</strong>g<br />
the environment. In r<strong>et</strong>urn, irrigated systems allow more diversified and <strong>in</strong>tensified agricultural production.<br />
This is even more important when farmers shift from surface irrigation to drip irrigation that enable covered<br />
crops cultivation and use of mulch.<br />
Environmental impacts aris<strong>in</strong>g from this twofold <strong>in</strong>tensification process have to be addressed. Most of the<br />
<strong>LCA</strong> studies and guidel<strong>in</strong>es have targ<strong>et</strong>ed temperate locations (Nemecek & Kägi, 2007) and this study contribute<br />
to adapt the m<strong>et</strong>hod to southern contexts where the great variability of crop management practices<br />
leads to <strong>in</strong>creased uncerta<strong>in</strong>ty (Bass<strong>et</strong>-Mens, <strong>et</strong> al., 2006).<br />
Based on a case study located <strong>in</strong> the Tunisian central Irrigated Pla<strong>in</strong> of Kairouan, we choose to study the<br />
impacts per kg and per ha of three contrasted cropp<strong>in</strong>g systems of watermelon grow<strong>in</strong>g. They were identified<br />
among a typology of eight systems <strong>in</strong> total. The least <strong>in</strong>tensive cropp<strong>in</strong>g system relies on surface irrigation<br />
rather than drip irrigation for the middle and high <strong>in</strong>puts <strong>in</strong>tensive cropp<strong>in</strong>g systems. The most <strong>in</strong>tensive<br />
cropp<strong>in</strong>g system comb<strong>in</strong>es plastic mulches and row covers. Because it was not possible to measure irrigation<br />
water volumes, they were modeled with PILOTE, a crop-soil model (Mailhol, 2004).<br />
The most impact<strong>in</strong>g cropp<strong>in</strong>g system per kg is the middle <strong>in</strong>put <strong>in</strong>tensive for almost all the impacts categories<br />
apart from those related to toxicity and ecotoxicity. Then comes the high <strong>in</strong>put <strong>in</strong>tensive cropp<strong>in</strong>g system<br />
whose impacts are balanced by the relative high yield obta<strong>in</strong>ed. The low <strong>in</strong>put <strong>in</strong>tensive system shows the<br />
smallest impacts either per kg or ha.<br />
The drip irrigation equipment at field scale is drawn on Fig. 1, and Fig. 2 displays the environmental impacts<br />
of 1 ha of drip irrigated middle <strong>in</strong>put <strong>in</strong>tensive watermelon grow<strong>in</strong>g. The most impact<strong>in</strong>g field operation<br />
are fertilisation then irrigation and lastly soil preparation. More specific results of impacts caused by<br />
the drip irrigation device show the relatively high impact of energy for water pump<strong>in</strong>g and thus suggest<br />
the related improvements be done.<br />
References<br />
Bass<strong>et</strong> Mens, C., Van der Werf, H.M.G., Durand P., L<strong>et</strong>erme P., 2006. Implications of uncerta<strong>in</strong>ty and variability<br />
<strong>in</strong> the life cycle assessment of pig production systems. International Journal of Life Cycle Assessment,<br />
11(5), 298-304.<br />
Mailhol, J. 2004. Analysis of irrigation systems and irrigation strategies for durum wheat <strong>in</strong> Tunisia. Agricultural<br />
Water Management, 70(1), 19-37.<br />
Nemecek, T., Kägi, T. 2007. Life Cycle Inventories of Agricultural Production Systems, (15).<br />
745
GROUP 2, SESSION A: CARBON OR WATER FOOTPRINTS, SOIL, BIODIVERSITY 8 th Int. Conference on <strong>LCA</strong> <strong>in</strong> the<br />
Agri-<strong>Food</strong> Sector, 1-4 Oct <strong>2012</strong><br />
Figure 1. Field-scale drip irrigation system: irrigation elements for mid- and high-<strong>in</strong>put <strong>in</strong>tensive cropp<strong>in</strong>g<br />
systems.<br />
Figure 2. Characterisation of environmental impacts of the cultivation of 1 hectare of mid-<strong>in</strong>put <strong>in</strong>tensive<br />
watermelon, Recipe Midpo<strong>in</strong>t (H).<br />
746
GROUP 2, SESSION A: CARBON OR WATER FOOTPRINTS, SOIL, BIODIVERSITY 8 th Int. Conference on <strong>LCA</strong> <strong>in</strong> the<br />
Agri-<strong>Food</strong> Sector, 1-4 Oct <strong>2012</strong><br />
63. Green, blue, and grey water use of Canadian wheat and maize<br />
Brian McConkey 1,* , Chao Chen 1 , Dom<strong>in</strong>ique Maxime 2 , Suren Kulshrestha 3 , Xavier Vergé 4 , Ray Desjard<strong>in</strong>s 5 ,<br />
Devon Worth 5 , Jim Dyer 6<br />
1 Agriculture and Agri-<strong>Food</strong> Canada, Swift Current, SK, Canada, 2 Centre <strong>in</strong>teruniversitaire de recherche sur<br />
le cycle de vie des produits, procédés <strong>et</strong> services, Montréal, QC, Canada, 3 Department: Bioresource Policy,<br />
Bus<strong>in</strong>ess and Economics, University of Saskatchewan, Saskatoon, SK, Canada, 4 Consultant, Ottawa, ON,<br />
Canada, 5 Agriculture and Agri-<strong>Food</strong> Canada, Ottawa, ON, Canada, 6 Consultant, Cambridge, ON, Canada, <br />
Correspond<strong>in</strong>g author. E-mail: brian.mcconkey@agr.gc.ca<br />
Wheat (Triticum aestivum L.) and maize (Zea mays L.) are the major cereal crops of Canada and their use for<br />
produc<strong>in</strong>g bio<strong>et</strong>hanol has heightened <strong>in</strong>terest <strong>in</strong> their environmental footpr<strong>in</strong>t. In semiarid climates of western<br />
Canada, both green and blue water supply are a constant concern. Ra<strong>in</strong>fed agriculture periodically requires<br />
“drought disaster” f<strong>in</strong>ancial support from government. Irrigation is limited as water <strong>in</strong> major streams<br />
is fully allocated and water restrictions can occur dur<strong>in</strong>g drought years. In contrast, water excesses are more<br />
often a concern than deficiencies <strong>in</strong> the more humid climates of central and eastern Canada.<br />
We used the DSSAT model v4 to estimate 30-yr average green (evapotranspiration of <strong>in</strong> situ precipitation)<br />
and blue (from water withdrawals) use and yield across a range of important cereal production situations<br />
(Table 1). The model was validated with field data. Estimated blue water use embodied <strong>in</strong> <strong>in</strong>puts (pesticide,<br />
fossil fuel, mach<strong>in</strong>ery manufacture, fertiliser) was about 1 m 3 (t gra<strong>in</strong>) -1 based on withdrawals. Grey water<br />
use was calculated from P losses from the literature. The emerg<strong>in</strong>g Canadian guidel<strong>in</strong>e for total P <strong>in</strong> water to<br />
prevent eutrophication (0.02 mg L -1 ) is 500 times lower than dr<strong>in</strong>k<strong>in</strong>g water standard for N (10 mg L -1 as N-<br />
NO3). S<strong>in</strong>ce total N losses are about 2 to 10 times greater than those of P, roughly 50-250 times more water<br />
is needed to dilute the P than the N (divide by about 100 to compare with N-based studies).<br />
The total cereal water use <strong>in</strong> Canada was dom<strong>in</strong>ated by grey water (Table 1). Grey water use is higher <strong>in</strong><br />
humid climates due to larger P loss <strong>in</strong> runoff and artificial dra<strong>in</strong>age. Grey water use usually exceeds any<br />
precipitation surplus and this expla<strong>in</strong>s why P is the major environmental concern s<strong>in</strong>ce there is often <strong>in</strong>sufficient<br />
water to dilute the P to a desired concentration <strong>in</strong> cropland dom<strong>in</strong>ated watersheds. Total<br />
(green+blue+grey) water use decreased mov<strong>in</strong>g from humid to more arid climate. In contrast and as expected,<br />
the blue + green water use t -1 tended to <strong>in</strong>crease mov<strong>in</strong>g to drier climate (e.g. London to W<strong>in</strong>nipeg,<br />
L<strong>et</strong>hbridge or W<strong>in</strong>nipeg to Swift Current). However, the relationship b<strong>et</strong>ween climate and green+blue water<br />
use was less clear than total water use, probably due to confound<strong>in</strong>g effects of other weather factors (temperature,<br />
ra<strong>in</strong> tim<strong>in</strong>g, and sunlight) on production. As expected, maize was more water efficient than wheat<br />
under ra<strong>in</strong>fed conditions but efficiencies b<strong>et</strong>ween these cereals was similar under irrigation. In the most<br />
semiarid areas, summer fallow is still widely practiced where a crop is purposefully not grown <strong>in</strong> one year so<br />
as to use the soil-stored precipitation from that year to reduce drought risk for the crop grown the next year.<br />
A systems level calculation that considers the fallow year as an <strong>in</strong>separable part of wheat production on<br />
summer fallow has the highest cereal water use t -1 <strong>in</strong> Canada while the simplistic non-systems analysis that<br />
considers the crop year only would <strong>in</strong>dicate that summer fallow actually decreases water use t -1 ; we believe<br />
only the systems-level analysis is valid. Exclud<strong>in</strong>g summer fallow production, green +blue wheat water use<br />
t -1 did not vary much across the diverse climates or with and without irrigation.<br />
If lower green+blue+grey water use t -1 were used as the sole <strong>in</strong>dicator of greater water security for cereal<br />
production <strong>in</strong> Canada, it would result <strong>in</strong> the nonsensical conclusion that production should be <strong>in</strong>creased <strong>in</strong><br />
the region with regular water shortages and decreased <strong>in</strong> regions with abundant water. This would exacerbate<br />
the impact of droughts <strong>in</strong> water-stressed regions to the whole of Canada. Inter-regional comparisons of<br />
green+blue water use were more difficult to <strong>in</strong>terpr<strong>et</strong> although there was an <strong>in</strong>consistent trend of higher water<br />
use t -1 as climate became drier. Intra-regional comparisons of water use t -1 help identify crops and production<br />
m<strong>et</strong>hods that would, if selected, reduce water requirements for cereal production and lower natural<br />
resource requirements for biofuels produced from those cereals.<br />
747
GROUP 2, SESSION A: CARBON OR WATER FOOTPRINTS, SOIL, BIODIVERSITY 8 th Int. Conference on <strong>LCA</strong> <strong>in</strong> the<br />
Agri-<strong>Food</strong> Sector, 1-4 Oct <strong>2012</strong><br />
Table 1. Land use and green, blue, and grey water use for important cereal production situations <strong>in</strong> Canada<br />
across a range of climates.<br />
Land<br />
Use<br />
(ha t<br />
Crop Production M<strong>et</strong>hod<br />
-<br />
Water Use (m<br />
1<br />
)<br />
3 t -1 )<br />
Green<br />
Green +Blue +<br />
Green Blue Grey* + Blue Grey<br />
Semiarid (Swift Current: P=352 mm, PET=931 mm, MAT=3.9 o C**)<br />
Spr<strong>in</strong>g Wheat Ra<strong>in</strong>fed on stubble 0.53 968 1 5260 969 6230<br />
0.38 804 1 3850 805 4650<br />
748<br />
Spr<strong>in</strong>g Wheat Ra<strong>in</strong>fed on summerfallow<br />
exclud<strong>in</strong>g fallow area<br />
and evapotranspiration<br />
Spr<strong>in</strong>g Wheat Ra<strong>in</strong>fed on summerfallow<br />
<strong>in</strong>clud<strong>in</strong>g fallow area<br />
and evapotranspiration<br />
0.77 3850 1 15400 3850 19200<br />
Semiarid (L<strong>et</strong>hbridge: P =385mm, PE=917 mm, MAT=5.8 o C)<br />
Maize Irrigated 0.17 407 356 2540 763 3310<br />
Spr<strong>in</strong>g Wheat Irrigated 0.22 400 378 3330 778 4110<br />
Spr<strong>in</strong>g Wheat Ra<strong>in</strong>fed on stubble 0.45 818 1 4550 819 5370<br />
Subhumid (W<strong>in</strong>nipeg: P =514 mm, PE=716 mm, MAT=5.0 o C)<br />
Maize Ra<strong>in</strong>fed 0.19 821 1 4720 822 5540<br />
Spr<strong>in</strong>g Wheat Ra<strong>in</strong>fed 0.38 908 1 9620 909 10500<br />
Humid (London, Ontario: P =987 mm, PE=662 mm, MAT=7.5 o C)<br />
Maize Ra<strong>in</strong>fed 0.11 449 1 6842 450 7290<br />
Spr<strong>in</strong>g Wheat Ra<strong>in</strong>fed 0.23 707 1 14800 708 15500<br />
Humid (Charlott<strong>et</strong>own: P =1173 mm, PET=512 mm, MAT=5.3 o C)<br />
Spr<strong>in</strong>g Wheat Ra<strong>in</strong>fed 0.34 997 1 18600 998 19600<br />
*based on desired P concentration to me<strong>et</strong> Canadian environmental objectives, divide by about 100 to compare<br />
with other studies based on dr<strong>in</strong>k<strong>in</strong>g water NO3 objectives.<br />
**P=annual precipitation, PET=annual potential evapotranspiration, MAT=mean annual temperature
GROUP 2, SESSION A: CARBON OR WATER FOOTPRINTS, SOIL, BIODIVERSITY 8 th Int. Conference on <strong>LCA</strong> <strong>in</strong> the<br />
Agri-<strong>Food</strong> Sector, 1-4 Oct <strong>2012</strong><br />
64. Virtual water of sugar production <strong>in</strong> Spa<strong>in</strong><br />
J. Soler-Rovira * , P. Gómez de la Calle, J.M. Arroyo-Sanz<br />
Escuela Universitaria de Ingeniería Técnica Agrícola, Universidad Politécnica de Madrid, Ciudad Universitaria,<br />
s/n 28040 Madrid, Spa<strong>in</strong>, Correspond<strong>in</strong>g author. E-mail: jose.soler@upm.es<br />
<strong>Food</strong> production and consumption contributes to water use and abstraction, ma<strong>in</strong>ly dur<strong>in</strong>g the phase of cultivation.<br />
Water footpr<strong>in</strong>t of agricultural products is made up of blue, green and grey water. Green water is the<br />
ra<strong>in</strong>fall water evapotranspirated from cultivated soils. Blue water is the fresh water used <strong>in</strong> irrigation, taken<br />
from water bodies that is used and not r<strong>et</strong>urned. Grey water is the volume of water required to dilute pollutants<br />
to such extent that the water quality reaches acceptable standards. Irrigated sugar be<strong>et</strong> crop <strong>in</strong> Spa<strong>in</strong><br />
accounts for 93% of the 70,000 ha of cultivated surface. Be<strong>et</strong> is the ma<strong>in</strong> source of sugar and every Spanish<br />
<strong>in</strong>habitant consumes 5.5 kg per year, although 50% is imported.<br />
The aim of this work is to evaluate the virtual water content of sugar be<strong>et</strong> crop and <strong>in</strong>dustrial sugar <strong>in</strong> Spa<strong>in</strong>.<br />
The ma<strong>in</strong> prov<strong>in</strong>ces of sugar be<strong>et</strong> cultivation were considered. Virtual water content of the be<strong>et</strong> crop was<br />
calculated tak<strong>in</strong>g <strong>in</strong>to account the root and sugar yield and the evaporative and non-evaporative water used<br />
for crop production. The water consumed <strong>in</strong> evaporation was made up of green and blue water. The green<br />
one was computed from ra<strong>in</strong>fall and crop evapotranspiration plus soil evaporation comput<strong>in</strong>g a soil water<br />
balance with site specific soil data, climatic data and crop growth cycle. Reference evapotranspiration was<br />
computed with both Penman-Monteith and Hargreaves m<strong>et</strong>hod. Blue water was obta<strong>in</strong>ed from soil water<br />
balance as the difference of crop evapotranspiration and ra<strong>in</strong>fall and the efficiency of the irrigation system<br />
(gravity or spr<strong>in</strong>kler). Seedl<strong>in</strong>g emergence water applications were also accounted <strong>in</strong> spr<strong>in</strong>kler irrigated<br />
crops. Grey water was considered as the polluted water, and was calculated with the site specific fertilisation<br />
rate of the crop, estimated nitrate leach<strong>in</strong>g and water quality standards.<br />
The estimated water footpr<strong>in</strong>t per surface unit <strong>in</strong> Burgos and Valladolid prov<strong>in</strong>ces is shown <strong>in</strong> Figure 1. The<br />
volume of water is higher than 1,000 L per m 2 . Total water footpr<strong>in</strong>t of Valladolid prov<strong>in</strong>ce is greater than<br />
that of Burgos. Blue water (irrigation requirements) is higher <strong>in</strong> Valladolid because the <strong>in</strong>creased ETo values<br />
and the decreased ra<strong>in</strong>fall <strong>in</strong> that prov<strong>in</strong>ce. However, green water is lower due to the less ra<strong>in</strong>fall. As nitrogen<br />
fertilisation rates are higher <strong>in</strong> Valladolid than <strong>in</strong> Burgos, grey water is also higher. The water footpr<strong>in</strong>t<br />
is larger for gravity irrigation systems than for spr<strong>in</strong>kler ones, because their lower water application efficiency.<br />
Water footpr<strong>in</strong>t estimated per kg of sugar is more than 800 L (Fig. 2). The most important component of<br />
sugar water footpr<strong>in</strong>t is the blue one, because the sugar be<strong>et</strong> is sown <strong>in</strong> spr<strong>in</strong>g and the maximum canopy development<br />
and water transpiration is dur<strong>in</strong>g summer, when ETo is high and the ra<strong>in</strong>fall is low. Green water<br />
is less than 35% of total water footpr<strong>in</strong>t, and it is lower <strong>in</strong> prov<strong>in</strong>ces with decreased ra<strong>in</strong>fall values. Grey<br />
water account for 100-200 L per kg of sugar, and it depends on nitrogen fertilisation rates.<br />
749
GROUP 2, SESSION A: CARBON OR WATER FOOTPRINTS, SOIL, BIODIVERSITY 8 th Int. Conference on <strong>LCA</strong> <strong>in</strong> the<br />
Agri-<strong>Food</strong> Sector, 1-4 Oct <strong>2012</strong><br />
Figure 1. Estimated water footpr<strong>in</strong>t of sugar be<strong>et</strong> crop <strong>in</strong> two Spanish prov<strong>in</strong>ces, Burgos (Bu) and Valladolid<br />
(Va), with two different irrigation systems, spr<strong>in</strong>kler (spr<strong>in</strong>k.) and gravity (grav.).<br />
Figure 2. Estimated water footpr<strong>in</strong>t of sugar <strong>in</strong> two Spanish prov<strong>in</strong>ces, Burgos (Bu) and Valladolid (Va),<br />
with two different irrigation systems, spr<strong>in</strong>kler (spr<strong>in</strong>k.) and gravity (grav.).<br />
750<br />
Water footpr<strong>in</strong>t (L/kg sugar)<br />
Water footpr<strong>in</strong>t (mm)<br />
1600<br />
1400<br />
1200<br />
1000<br />
800<br />
600<br />
400<br />
200<br />
0<br />
1200<br />
1000<br />
800<br />
600<br />
400<br />
200<br />
0<br />
Spr<strong>in</strong>k. Bu Grav. Bu Spr<strong>in</strong>k. Va Grav. Va<br />
Spr<strong>in</strong>k. Bu Grav. Bu Spr<strong>in</strong>k. Va Grav. Va<br />
Grey water<br />
Green water<br />
Blue water<br />
Grey water<br />
Green water<br />
Blue water
GROUP 2, SESSION A: CARBON OR WATER FOOTPRINTS, SOIL, BIODIVERSITY 8 th Int. Conference on <strong>LCA</strong> <strong>in</strong> the<br />
Agri-<strong>Food</strong> Sector, 1-4 Oct <strong>2012</strong><br />
65. Modell<strong>in</strong>g sugar be<strong>et</strong> water use <strong>in</strong> Spa<strong>in</strong><br />
J. Soler-Rovira * , P. Gómez de la Calle, J.M. Arroyo-Sanz<br />
Escuela Universitaria de Ingeniería Técnica Agrícola, Universidad Politécnica de Madrid, Ciudad Universitaria,<br />
s/n 28040 Madrid, Spa<strong>in</strong>, Correspond<strong>in</strong>g author. E-mail: jose.soler@upm.es<br />
Crop production has a great contribution to water use and abstraction. Sugar be<strong>et</strong> is an important crop <strong>in</strong><br />
irrigated land <strong>in</strong> Spa<strong>in</strong> and covers 70,000 ha. Crop and resources management are key factors for a susta<strong>in</strong>able<br />
agriculture. The aim of this work is to model the sugar be<strong>et</strong> crop growth and water consumption <strong>in</strong> order<br />
to quantify crop water use and virtual water content <strong>in</strong> different grow<strong>in</strong>g conditions.<br />
In site daily m<strong>et</strong>eorological data from SIAR (Magrama, 2011) automatic weather stations n<strong>et</strong>work were<br />
downloaded for the time period 2001-2010 for the ma<strong>in</strong> sugar be<strong>et</strong> grow<strong>in</strong>g prov<strong>in</strong>ces <strong>in</strong> Spa<strong>in</strong>. Average<br />
farmers’ data for sow<strong>in</strong>g date were considered. Seedl<strong>in</strong>g emergence was computed us<strong>in</strong>g a thermal time<br />
model from literature data (120 ºC.day with a base temperature of 0 ºC). Biomass production of the crop was<br />
then estimated comput<strong>in</strong>g leaf and canopy development as a function of a thermal time model and the subsequent<br />
photosynth<strong>et</strong>ically active radiation <strong>in</strong>terception. Radiation use efficiency was estimated as a function<br />
of m<strong>et</strong>eorological daily values of maximum temperature and vapour pressure deficit, despite neither water<br />
nor nutrient limitation (Arroyo-Sanz, 2002). Sugar yield was estimated consider<strong>in</strong>g an average harvest <strong>in</strong>dex<br />
(Arroyo-Sanz, 2002). Crop growth was then modelled with daily values of mean temperature and mean solar<br />
radiation until farmers’ average harvest date for the 10 year period (2001-2010). A soil water balance was<br />
modelled and then green and blue water were estimated. Soil water balance <strong>in</strong>cluded crop ET, dra<strong>in</strong>age, ra<strong>in</strong>fall,<br />
irrigation and soil moisture content. Crop ET was the product of reference ETo, from daily m<strong>et</strong>eorological<br />
data (Penman-Monteith m<strong>et</strong>hod), and evaporation or crop coefficients. Evaporation coefficients were<br />
estimated before and after harvest as a function of ra<strong>in</strong>fall frequency and ETo. Crop coefficients were estimated<br />
consider<strong>in</strong>g canopy development. Ra<strong>in</strong>fall daily values were <strong>in</strong>cluded. In site soil texture def<strong>in</strong>ed<br />
readily available soil moisture as the difference of soil water content at 10 and 45 kPa (Arroyo-Sanz, 2002).<br />
A daily soil water balance was computed consider<strong>in</strong>g the dra<strong>in</strong>age water the excess of ra<strong>in</strong>fall over field<br />
capacity, effective ra<strong>in</strong>fall that stored <strong>in</strong> the soil and used by the crop and irrigation water as the amount of<br />
water applied to refill the soil moisture until field capacity. Blue water was estimated as the irrigation needs<br />
divided by the system application efficiency. Green water was estimated as the sum of soil evaporation before<br />
sow<strong>in</strong>g and after harvest, crop evapotranspiration from emergence until the first irrigation and effective<br />
ra<strong>in</strong> dur<strong>in</strong>g the irrigation period. Grey water was considered as the polluted water, and was calculated with<br />
the site specific nitrogen fertilisation of the crop, estimated nitrate leach<strong>in</strong>g and water quality standards. Virtual<br />
water content was computed add<strong>in</strong>g daily blue, green and grey water for the 10 year period (2001-2010).<br />
The modelled biomass accumulation <strong>in</strong> Valladolid prov<strong>in</strong>ce <strong>in</strong> the period 2001-2010 is shown <strong>in</strong> Figure 1.<br />
The temporal trend of crop growth dur<strong>in</strong>g the grow<strong>in</strong>g season shapes a sigmoid curve. Biomass at harvest is<br />
the last value of the curve. The most produc<strong>in</strong>g years are 2005 and 2007, so the value of the water footpr<strong>in</strong>t<br />
is relatively lower. The estimated value of sugar virtual water content is shown <strong>in</strong> Figure 2. The largest values<br />
are reached <strong>in</strong> year 2002 and 2003, the two w<strong>et</strong>test years. So, green water footpr<strong>in</strong>t (mm) is positively<br />
and highly correlated with annual ra<strong>in</strong>fall. This relatively high ra<strong>in</strong>fall does not affect the water consumption<br />
<strong>in</strong> irrigation nor the blue water footpr<strong>in</strong>t.<br />
References<br />
Arroyo Sanz, J.M. (2002). Influencia del riego sobre el crecimiento, el rendimiento, la calidad <strong>in</strong>dustrial y las<br />
eficiencias en el uso del agua de riego y de la radiación PAR en el cultivo de la remolacha azucarera<br />
(B<strong>et</strong>a vulgaris L.). Ph.D. Thesis. Universidad Politécnica de Madrid, Spa<strong>in</strong>.<br />
Magrama (2011). Sistema de <strong>in</strong>formación climática para el regadío. M<strong>in</strong>isterio de Agricultura, Alimentación<br />
y Medio Ambiente. In: http://www.magrama.es/es/agua/temas/observatorio-del-regadio-espanol/Sistemade-Informacion-Agroclimatica-para-el-Regadio/default.aspx<br />
751
GROUP 2, SESSION A: CARBON OR WATER FOOTPRINTS, SOIL, BIODIVERSITY 8 th Int. Conference on <strong>LCA</strong> <strong>in</strong> the<br />
Agri-<strong>Food</strong> Sector, 1-4 Oct <strong>2012</strong><br />
Biomass (g/m 2 )<br />
Figure 1. Simulated biomass accumulation of sugar be<strong>et</strong> crop <strong>in</strong> Valladolid prov<strong>in</strong>ce (Spa<strong>in</strong>) from 2001-<br />
2010.<br />
Figure 2. Estimated yearly virtual water content of sugar <strong>in</strong> Valladolid prov<strong>in</strong>ce (Spa<strong>in</strong>) dur<strong>in</strong>g the period<br />
2001-2010.<br />
752<br />
Water Footpr<strong>in</strong>t (L/kg)<br />
6000<br />
5000<br />
4000<br />
3000<br />
2000<br />
1000<br />
0<br />
06/12/1999 19/04/2001 01/09/2002 14/01/2004 28/05/2005 10/10/2006 22/02/2008 06/07/2009 18/11/2010 01/04/<strong>2012</strong><br />
600<br />
500<br />
400<br />
300<br />
200<br />
100<br />
0<br />
2001 2002 2003 2004 2005 2006 2007 2008 2009 2010<br />
Date<br />
Blue water<br />
Green water
GROUP 2, SESSION A: CARBON OR WATER FOOTPRINTS, SOIL, BIODIVERSITY 8 th Int. Conference on <strong>LCA</strong> <strong>in</strong> the<br />
Agri-<strong>Food</strong> Sector, 1-4 Oct <strong>2012</strong><br />
66. Water footpr<strong>in</strong>t of milk at dairy farm<br />
Armelle Gac 1,* , S<strong>in</strong>dy Moreau 1 , Didier Moreau 2 , Samuel Vionn<strong>et</strong> 3<br />
1 Institut de l'Elevage, Build<strong>in</strong>g and Environment Department, BP 85225, F-35652 Le Rheu, <strong>France</strong>, 2 Danone<br />
Dairy Division WorldWide, Environment Direction, F-75000 Paris, <strong>France</strong>, 3 Quantis International,<br />
Parc Scientifique EPFL, Bat-D, 1015 Lausanne, Switzerland, Correspond<strong>in</strong>g author. E-mail: armelle.gac@idele.fr<br />
The water resource preservation is becom<strong>in</strong>g a new challenge for agriculture at local and global scales. It is<br />
assessed through water footpr<strong>in</strong>t<strong>in</strong>g, an emerg<strong>in</strong>g m<strong>et</strong>hodology. The Water Footpr<strong>in</strong>t N<strong>et</strong>work was a precursor<br />
for def<strong>in</strong><strong>in</strong>g a water footpr<strong>in</strong>t m<strong>et</strong>hodology (Hoekstra <strong>et</strong> al. 2011) and provides figures focus<strong>in</strong>g on livestock<br />
productions (Mekonnen & Hoekstra, <strong>2012</strong>). The WFN m<strong>et</strong>hodology focuses only on specific types of<br />
water flow whereas the WU<strong>LCA</strong> project of the UNEP SETAC <strong>LCA</strong> Initiative (Koehler & Aoust<strong>in</strong> 2008) and<br />
the future ISO 14046 Water footpr<strong>in</strong>t (under development) support that water footpr<strong>in</strong>t<strong>in</strong>g should follow the<br />
same framework as <strong>LCA</strong> (ISO 14040 and 14044).<br />
This study presents an application of the water footpr<strong>in</strong>t to dairy farms, adapted from Ridoutt and Pfister<br />
(2010). This stress-weighted water footpr<strong>in</strong>t is based on an assessment of the amount of freshwater withdrawn,<br />
consumed water and grey water generated by the production activity (Figure 1). A regionalised characterisation<br />
factor, the water stress <strong>in</strong>dex, is then multiplied with the <strong>in</strong>ventory to obta<strong>in</strong> the Water Stress<br />
Assessment (WSA) (Figure 2) that reflects the potential for water uses to contribute to water scarcity.<br />
This m<strong>et</strong>hod has been tested <strong>in</strong> collaboration with Danone <strong>in</strong> 3 farms <strong>in</strong> 3 different countries (Spa<strong>in</strong>, Poland<br />
and Saudi Arabia). The functional unit is to produce one kg of whole milk, at the farm gate. The physical<br />
flows of water <strong>in</strong>side the system were described to identify the different sources of freshwater use and consumption<br />
(withdrawal water, consumed water). The four ma<strong>in</strong> sources (Fig. 3) gather the animals (dr<strong>in</strong>k<strong>in</strong>g<br />
water, transpiration of animals, water <strong>in</strong> milk and evaporation from manure), crops and pastures (irrigation<br />
and evapotranspiration of plants), the milk<strong>in</strong>g parlour (wash<strong>in</strong>g and evaporated water) and the farm <strong>in</strong>puts<br />
(diesel, electricity, fertilisers and off-farm feed production). Concern<strong>in</strong>g the flows occurr<strong>in</strong>g on the farm<br />
assumptions, references and models were used to assess the water requirements and losses. Data about the<br />
farm <strong>in</strong>puts for different countries were provided by databases (eco<strong>in</strong>vent v2.2, Quantis Water Database,<br />
access December 2011). The Grey water is calculated for the whole farm, based on N leach<strong>in</strong>g potential.<br />
Only nitrogen is considered assum<strong>in</strong>g that generally the quantity of water needed to assimilate produced<br />
nitrogen will be enough important to assimilate produced phosphorus as well as other pollutants.<br />
The prelim<strong>in</strong>ary results show the importance of off-farm processes, especially feed production, on the total<br />
WSA of the milk. It occurs that the options for farmers to reduce the water footpr<strong>in</strong>t of their products would<br />
focus on decreas<strong>in</strong>g the use of some <strong>in</strong>puts. Nevertheless, the consideration of physical flows at farm level<br />
rema<strong>in</strong>s important for appropriation of results by the farmers and also because actions to reduce water footpr<strong>in</strong>t<br />
can be more easily undertaken at this level than at the supply cha<strong>in</strong> level. The study also underl<strong>in</strong>es the<br />
fact that some m<strong>et</strong>hodological issues have to be improved: characterisation of the withdrawal water and assessment<br />
of the grey water, as well as implicit weight<strong>in</strong>g of consumed water with grey water.<br />
References<br />
Hoekstra AY, Chapaga<strong>in</strong> AK, Aldaya MM, Mekonnen MM. 2011. The water footpr<strong>in</strong>t assessment manual:<br />
S<strong>et</strong>t<strong>in</strong>g the global standard. London: Earthscan. p 203<br />
ISO 14040: 2006. Environmental Management - Life Cycle Assessment - Pr<strong>in</strong>ciples and Framework<br />
ISO 14044: 2006. Environmental Management - Life Cycle Assessment - Requirements and guidel<strong>in</strong>es<br />
Koehler A, Aoust<strong>in</strong> E (2008) Assessment of use and depl<strong>et</strong>ion of water resources with<strong>in</strong> <strong>LCA</strong>. SETAC<br />
Europe, Warsaw<br />
Mekonnen, M.M. and Hoekstra, A.Y., <strong>2012</strong>. A global assessment of the water footpr<strong>in</strong>t of farm animal products,<br />
Ecosystems, doi: 10.1007/s10021-011-9517-8.<br />
Ridoutt, B., Pfister, S., 2010. A revised approach to water footpr<strong>in</strong>t<strong>in</strong>g to make transparent the impacts of<br />
consumption and production on global freshwater scarcity. Global Environmental Change 20, 113-120.<br />
753
GROUP 2, SESSION A: CARBON OR WATER FOOTPRINTS, SOIL, BIODIVERSITY 8 th Int. Conference on <strong>LCA</strong> <strong>in</strong> the<br />
Agri-<strong>Food</strong> Sector, 1-4 Oct <strong>2012</strong><br />
Figure 1. Type of water considered <strong>in</strong> the WSA m<strong>et</strong>hodology (from Ridoutt and Pfister, 2010)<br />
Figure 2. Calculation of the Water Stress Assessment (adapted from Ridoutt and Pfister, 2010)<br />
Figure 3. Physical flows of water (withdrawn, consumed and r<strong>et</strong>urned water) on a dairy farm<br />
754
GROUP 2, SESSION A: CARBON OR WATER FOOTPRINTS, SOIL, BIODIVERSITY 8 th Int. Conference on <strong>LCA</strong> <strong>in</strong> the<br />
Agri-<strong>Food</strong> Sector, 1-4 Oct <strong>2012</strong><br />
67. <strong>Food</strong> production <strong>in</strong> Brazil: challenges for water footpr<strong>in</strong>t<br />
account<strong>in</strong>g<br />
Leda Coltro<br />
Institute of <strong>Food</strong> Technology – ITAL/CETEA, Brazil, E-mail: ledacolt@ital.sp.gov.br<br />
Due to the <strong>in</strong>creas<strong>in</strong>g pollution of the rivers as a consequence of <strong>in</strong>dustrial and agricultural activities, the<br />
importance of evaluat<strong>in</strong>g water use throughout the production cha<strong>in</strong>s <strong>in</strong> order to identify hot spots and then<br />
to implement improvements for water use reduction has ga<strong>in</strong>ed more and more attention. That is why <strong>in</strong> the<br />
last decade water use m<strong>et</strong>hodologies have be<strong>in</strong>g developed by several researchers (Chapaga<strong>in</strong>, Hoekstra,<br />
2007; Milá i Canals.<strong>et</strong> al. 2009; Ridout, Pfister, 2010). So, nowadays there are more than 30 m<strong>et</strong>hodologies<br />
to account water use <strong>in</strong> the life cycle of products or processes.<br />
In 2009, International Organization for Standardization – ISO launched the discussion on a new standard -<br />
ISO 14046 on the subject “Water footpr<strong>in</strong>t – Requirements and guidel<strong>in</strong>es”. This standard has the aim of<br />
harmonis<strong>in</strong>g the water footpr<strong>in</strong>t criteria adopted to account the use of this resource, as well as the consistency<br />
with carbon footpr<strong>in</strong>t and other <strong>LCA</strong> approaches among others (ISO, <strong>2012</strong>). By June <strong>2012</strong> the standard<br />
was submitted as a vote for CD (committee draft) by SC5 members and it is planned to be published <strong>in</strong> 2013-<br />
2014. Accord<strong>in</strong>g to ISO 14046, the water footpr<strong>in</strong>t can be represented by one or more param<strong>et</strong>ers which<br />
quantify the environmental impacts of a process, a product or an organisation related to water as follow: 1)<br />
the water footpr<strong>in</strong>t <strong>in</strong>dicator result (s<strong>in</strong>gle impact category); 2) the water footpr<strong>in</strong>t profile (several <strong>in</strong>dicator<br />
results) and 3) the water footpr<strong>in</strong>t param<strong>et</strong>er (weighted result).<br />
ISO 14046 will establish what must be done, but not how to do it. So, the several m<strong>et</strong>hodologies for water<br />
footpr<strong>in</strong>t should follow the requirements of this standard. Despite many questions must be solved until the<br />
publication of this standard, one requirement already established by ISO 14046 is that even the s<strong>in</strong>gle <strong>in</strong>dicator<br />
category should consider both the quantity and quality of water resources.<br />
Brazil has 12% of freshwater available <strong>in</strong> the world. However, approx. 74% of this water is <strong>in</strong> the Amazon<br />
hydrographical region, while the ma<strong>in</strong> food produc<strong>in</strong>g regions are located at Paraná, São Francisco, Atlântico<br />
Leste, Atlântico Sul and Atlântico Sudeste hydrological regions that have only 12.9% of the freshwater<br />
available <strong>in</strong> Brazil.<br />
The Brazilian System for Controll<strong>in</strong>g the Water Resources – SINGREH has an <strong>in</strong>formation system on water<br />
quantity well established, be<strong>in</strong>g the Brazilian Water Agency – ANA responsible for approx. 30% of the controll<strong>in</strong>g<br />
po<strong>in</strong>ts (ANA, 2007). Nevertheless, the water quality control is made only by approx. 12% of this<br />
amount of control po<strong>in</strong>ts (Table 1).<br />
Concern<strong>in</strong>g water quality, only four basic quality param<strong>et</strong>ers are controlled by ANA which are not proper to<br />
evaluate the water quality. However, the state and municipal environmental agencies from M<strong>in</strong>as Gerais,<br />
Paraná, Pernambuco, Rio de Janeiro, Rio Grande do Sul and São Paulo control a higher number of quality<br />
param<strong>et</strong>ers for some of their ma<strong>in</strong> rivers (Table 1) (IBGE, 2010).<br />
It is possible to conclude that the ma<strong>in</strong> challenges to account the water footpr<strong>in</strong>t of Brazilian food products<br />
are: 1) lack of quality data for many Brazilian rivers, and 2) many of quality water data are kept by the state<br />
and municipal environmental agencies as private data. So, much work should be done <strong>in</strong> order to g<strong>et</strong> reliable<br />
water footpr<strong>in</strong>t of Brazilian products.<br />
References<br />
Agência Nacional de Águas – ANA, 2007. Evolução da rede hidrom<strong>et</strong>ereológica nacional. v. 1, n.1, 15p.<br />
Chapaga<strong>in</strong>, A.K., Hoekstra, A.Y., 2007. The water footpr<strong>in</strong>t of coffee and tea consumption <strong>in</strong> the N<strong>et</strong>herlands.<br />
Ecological Economics 64, 109 – 118.<br />
ISO - International Organization for Standardization. ISO/CD 14046: Water footpr<strong>in</strong>t – Requirements and<br />
guidel<strong>in</strong>es, <strong>2012</strong>. (Work<strong>in</strong>g Draft 2)<br />
Instituto Brasileiro de Geografia e Estatística – IBGE. Indicadores de desenvolvimento sustentável Brasil<br />
2010. Rio de Janeiro. 442p.<br />
Milá i Canals, L., Chenow<strong>et</strong>h, J., Chapaga<strong>in</strong>, A., Orr, S., Antón, A., Cliff, R., 2009. Assess<strong>in</strong>g freshwater use<br />
impacts <strong>in</strong> <strong>LCA</strong>. Part I – <strong>in</strong>ventory model<strong>in</strong>g and characterization factors for the ma<strong>in</strong> impact pathways.<br />
Int. J. <strong>LCA</strong>, 14, 28-42.<br />
Ridoutt, B.G., Pfister, S., 2010. A revised approach to water footpr<strong>in</strong>t<strong>in</strong>g to make transparent the consumption<br />
and production on global freshwater scarcity. Global Environ. Change, 20, 113-120.<br />
755
GROUP 2, SESSION A: CARBON OR WATER FOOTPRINTS, SOIL, BIODIVERSITY 8 th Int. Conference on <strong>LCA</strong> <strong>in</strong> the<br />
Agri-<strong>Food</strong> Sector, 1-4 Oct <strong>2012</strong><br />
Table 1. Information system on water resources <strong>in</strong> Brazil (ANA, 2007; IBGE, 2010).<br />
Aspects Control Param<strong>et</strong>ers evalu-<br />
756<br />
Water<br />
quantity<br />
Water quality<br />
a<br />
Water quality<br />
b<br />
po<strong>in</strong>ts<br />
ated<br />
11,260 Discharge<br />
1,340<br />
----<br />
pH<br />
Dissolved Oxygen<br />
Conductivity<br />
Temperature<br />
BOD<br />
Water Quality Index -<br />
WQI c<br />
a Brazilian Water Agency<br />
b State and Municipal Environmental Water Agencies<br />
c WQI calculated from pH, Temperature, Dissolved Oxygen, BOD, N, P, total soluble solids, turbidity.
GROUP 3, SESSION A: LABELLING, CONSUMERS, DIET 8 th Int. Conference on <strong>LCA</strong> <strong>in</strong> the<br />
Group 3, Session A : Labell<strong>in</strong>g, Consumers, Di<strong>et</strong><br />
Agri-<strong>Food</strong> Sector, 1-4 Oct <strong>2012</strong><br />
68. A life cycle C3 commons: communicate, collaborate, connect<br />
Shelly Grist * , Mark Toleman<br />
University of Southern Queensland, Toowoomba, Queensland, Australia, Correspond<strong>in</strong>g author. E-mail:<br />
shelly.grist@usq.edu.au<br />
Practitioners conduct<strong>in</strong>g life cycle assessments (<strong>LCA</strong>) are uniquely dependent on m<strong>et</strong>hodology, databases,<br />
and tools, as wells as applications of <strong>LCA</strong> developed by their peers (Gnansounou <strong>et</strong> al., 2009; Suh <strong>et</strong> al.,<br />
2004). Conferences such as <strong>LCA</strong> <strong>Food</strong> <strong>2012</strong> serve as a global forum. They provide a physical me<strong>et</strong><strong>in</strong>g<br />
place for <strong>LCA</strong> practitioners from around the globe to share knowledge, discuss topics of <strong>in</strong>terest to the community<br />
and connect with peers. Unfortunately <strong>in</strong>ternational conferences like <strong>LCA</strong> <strong>Food</strong> are annual at best<br />
and not all who would benefit are able to attend. There is an on-go<strong>in</strong>g need for a me<strong>et</strong><strong>in</strong>g place, with relevant<br />
community resources ‘held <strong>in</strong> common’. In essence a virtual community commons where <strong>LCA</strong> practitioners<br />
can cont<strong>in</strong>ue to communicate, collaborate and connect.<br />
At <strong>LCA</strong> <strong>Food</strong> 2010 the authors presented a poster propos<strong>in</strong>g an <strong>LCA</strong> community website. The proposal<br />
outl<strong>in</strong>ed a virtual me<strong>et</strong><strong>in</strong>g place for community members: to f<strong>in</strong>d and share <strong>in</strong>formation through searchable<br />
publication and data knowledgebases; to learn from each other by ask<strong>in</strong>g questions of authors, watch<strong>in</strong>g<br />
onl<strong>in</strong>e video tutorials and participat<strong>in</strong>g <strong>in</strong> discussion forums and blogs; and to connect with colleagues with<br />
whom to collaborate.<br />
The proposed <strong>LCA</strong> community website is be<strong>in</strong>g designed and developed now. The website is based on<br />
SilverStripe, an open source framework and configuration management system (CMS). An open source<br />
solution was selected <strong>in</strong> keep<strong>in</strong>g with the design philosophy of a community commons. Once the community<br />
site is compl<strong>et</strong>ed both the site and its software will be available as a community resource. It’s hoped<br />
that the <strong>LCA</strong> C3 Commons website on its own will prove to be a valuable resource for the global <strong>LCA</strong><br />
community. The solution <strong>in</strong> whole or <strong>in</strong> part will also be available for <strong>LCA</strong> organisations who wish to<br />
download it and host it for their own use.<br />
A work<strong>in</strong>g prototype will be available for <strong>LCA</strong> <strong>Food</strong> <strong>2012</strong> conference attendees to trial. Feedback will be<br />
requested on exist<strong>in</strong>g features as well as suggestions for additional features.<br />
References<br />
Gnansounou E, Dauriat A, Villegas J, Panichelli L. Life cycle assessment of biofuels: Energy and greenhouse<br />
gas balances. Bioresource Technology, 100: 4919-4930.<br />
Suh S, Lenzen M, Treloar GJ, Hondo H, Horvath A, Huppes G, <strong>et</strong> al. System boundary selection <strong>in</strong> life-cycle<br />
<strong>in</strong>ventories us<strong>in</strong>g hybrid approaches. Environmental Science & Technology, 38: 657-664.<br />
757
GROUP 3, SESSION A: LABELLING, CONSUMERS, DIET 8 th Int. Conference on <strong>LCA</strong> <strong>in</strong> the<br />
Agri-<strong>Food</strong> Sector, 1-4 Oct <strong>2012</strong><br />
69. Assessment of the environmental impact of di<strong>et</strong>ary <strong>in</strong>take habits <strong>in</strong><br />
the UK<br />
Jan<strong>et</strong> Kyle 1,* , Jennie Macdiarmid 2 and Tony Craig 3<br />
1 Public Health Nutrition Research Group, Institute of Applied Health Sciences, University of Aberdeen, Foresterhill,<br />
Aberdeen, AB25 2ZD, UK, 2 Row<strong>et</strong>t Institute of Nutrition and Health, University of Aberdeen, UK,<br />
3 James Hutton Institute, Craigiebuckler, Aberdeen, AB15 8QH, UK, * Correspond<strong>in</strong>g author. E-mail:<br />
j.kyle@abdn.ac.uk<br />
The food system is estimated to account for 18-20% of total UK greenhouse gas (GHG) emissions, <strong>in</strong>creas<strong>in</strong>g<br />
to 30% factor<strong>in</strong>g land use change (Audsley <strong>et</strong> al 2009), and food consumption habits make an important<br />
contribution to these emissions. With the <strong>in</strong>troduction of legally b<strong>in</strong>d<strong>in</strong>g commitments to reduce GHGE; the<br />
UK Climate Change Act (2008) s<strong>et</strong> targ<strong>et</strong>s to reduce GHGE by at least 34% by 2020, this will require not<br />
only efficiency sav<strong>in</strong>gs <strong>in</strong> food production and process<strong>in</strong>g, but also adoption of lower impact di<strong>et</strong>s by consumers.<br />
However, <strong>in</strong> the UK, few studies have assessed the impact of actual di<strong>et</strong>ary habits and the environmental<br />
impact, measured <strong>in</strong> the form of GHG emissions. The current study aimed to <strong>in</strong>vestigate the potential<br />
of assess<strong>in</strong>g the environmental impact of di<strong>et</strong>ary <strong>in</strong>take habits us<strong>in</strong>g a novel approach to measur<strong>in</strong>g and rank<strong>in</strong>g<br />
the environmental impact of food consumption <strong>in</strong>to high, medium and low levels of emissions and compare<br />
this with the nutritional quality of the di<strong>et</strong>.<br />
A random sample to people liv<strong>in</strong>g <strong>in</strong> the South West of Scotland were asked to compl<strong>et</strong>ed an anonymised<br />
postal survey, 527 people, average age 58y (range 20-90y) r<strong>et</strong>urned the questionnaires. Habitual di<strong>et</strong> was<br />
measured us<strong>in</strong>g a food frequency questionnaire (FFQ) (www.foodfrequency.org), which asks for the frequency<br />
of consumption of 170 food and dr<strong>in</strong>k items and has been previously validated for di<strong>et</strong>ary assessment.<br />
<strong>Food</strong> and nutrient <strong>in</strong>take and environmental impact were d<strong>et</strong>erm<strong>in</strong>ed by l<strong>in</strong>k<strong>in</strong>g, the FFQ response<br />
<strong>in</strong>formation to an <strong>in</strong>-house food nutrient composition and food related GHG emissions database. Estimation<br />
of average daily GHG emissions acted as a marker of environmental impact.<br />
GHG emissions values for food items ‘as eaten’ were calculated from raw food commodities data from one<br />
of the most comprehensive lists of GHG emissions <strong>in</strong> the UK (Audsley <strong>et</strong> al 2009). These food commodity<br />
data did not represent the full ‘cradle to grave’ life cycle analysis (<strong>LCA</strong>), but rather the average GHG emissions<br />
for the production of raw food commodities up to the regional distribution centre (RDC). The RDC<br />
was described as a nom<strong>in</strong>al boundary of agricultural and food <strong>in</strong>gredient production up to the po<strong>in</strong>t of distribution<br />
<strong>in</strong> the UK and estimated to account on average for 56% of the total <strong>LCA</strong> GHG emissions. The later<br />
stages of process<strong>in</strong>g raw basic <strong>in</strong>gredients <strong>in</strong>to edible food products ready for consumption were not <strong>in</strong>cluded.<br />
These data were harmonised with the nutrient composition data to reflect food as eaten, with adjustments<br />
for edible portion, cook<strong>in</strong>g ga<strong>in</strong>s and losses, and production of composite dishes and food products,<br />
such as lasagne, crisps and cakes, employ<strong>in</strong>g a proportion of <strong>in</strong>gredients approach,. It is important to note for<br />
example that GHG emissions for cooked meat will <strong>in</strong> relative terms <strong>in</strong>crease due to weight loss whilst cook<strong>in</strong>g,<br />
while the emissions for rice will fall with cook<strong>in</strong>g due to weight ga<strong>in</strong>s through hydration. However it is<br />
important to highlight there is a lack of compl<strong>et</strong>e ‘cradle to grave’ <strong>LCA</strong> for commonly consumed foods.<br />
Prelim<strong>in</strong>ary results <strong>in</strong>dicate that though, as expected, <strong>in</strong>creas<strong>in</strong>g energy <strong>in</strong>take and levels of GHG emissions<br />
are closed l<strong>in</strong>ked, the actual quality of the di<strong>et</strong> from a health perspective does not appear to dim<strong>in</strong>ish. For<br />
example, the relative contribution of fat (34% of total energy), prote<strong>in</strong> (16% of total energy), to total energy<br />
<strong>in</strong>take rema<strong>in</strong>s unchanged with <strong>in</strong>creas<strong>in</strong>g levels of GHG emissions from the di<strong>et</strong>. This study has lead to<br />
deeper <strong>in</strong>sights <strong>in</strong>to the <strong>in</strong>teractions b<strong>et</strong>ween di<strong>et</strong>, environment and health which will contribute to development<br />
of the population based approaches to reduc<strong>in</strong>g the environmental impact of di<strong>et</strong>ary <strong>in</strong>take.<br />
References<br />
Audsley E, Brander M, Chatterton J, Murphy-Bokern D, Webster C, Williams A., 2009. How Low Can We<br />
Go? An assessment of greenhouse gas emissions from the UK food system and the scope for reduction by<br />
2050. WWF-UK.<br />
758
GROUP 3, SESSION A: LABELLING, CONSUMERS, DIET 8 th Int. Conference on <strong>LCA</strong> <strong>in</strong> the<br />
Agri-<strong>Food</strong> Sector, 1-4 Oct <strong>2012</strong><br />
70. Fish or meat? Is this a relevant question from an environmental<br />
po<strong>in</strong>t of view?<br />
Benedikt Buchspies 1 , Niels Jungbluth 2,*<br />
1 b.buchspies@gmx.de, 2 ESU-services Ltd., CH-8610 Uster, Switzerland, Correspond<strong>in</strong>g author. E-mail:<br />
jungbluth@esu-services.ch<br />
Nutrition accounts for about 30% of environmental impacts caused due to the f<strong>in</strong>al consumption of Swiss<br />
households (Jungbluth <strong>et</strong> al., 2011). It is thus the most important consumption sector from an environmental<br />
po<strong>in</strong>t of view. Out of this meat is the most important product group account<strong>in</strong>g for about 26% of impacts of<br />
food consumption (Jungbluth <strong>et</strong> al., <strong>2012</strong>). Therefore, it is necessary to <strong>in</strong>vestigate and understand the environmental<br />
impacts of food consumption and possibilities for the reduction of environmental impacts. One<br />
option discussed for this is a reduction of meat consumption. Fish might be considered as a possible replacement<br />
by consumers.<br />
With<strong>in</strong> a recent study we assessed the environmental impacts of different fish products sold <strong>in</strong> Swiss supermark<strong>et</strong>s<br />
(Buchspies <strong>et</strong> al., 2011). The life cycle <strong>in</strong>ventory for different types of fish is based on published<br />
work by different authors. These data have been harmonised and implemented <strong>in</strong> the EcoSpold format. The<br />
def<strong>in</strong>ed functional unit is one kg of frozen cod, canned mackerel, canned herr<strong>in</strong>g or smoked salmon. The<br />
former three are caught and processed <strong>in</strong> Denmark; the latter is farmed and processed <strong>in</strong> Norway. Data for<br />
the production of different meat products were available from earlier studies (Jungbluth, 2000; Jungbluth <strong>et</strong><br />
al., 2011). To evaluate environmental impacts, the ecological scarcity m<strong>et</strong>hod 2006 and global warm<strong>in</strong>g potential<br />
2007 are used.<br />
When compar<strong>in</strong>g the results with the ecological scarcity m<strong>et</strong>hod 2006, high sea fish is at the lower end of<br />
range for all compared products. Fish<strong>in</strong>g and packag<strong>in</strong>g are ma<strong>in</strong> d<strong>et</strong>erm<strong>in</strong>ant <strong>in</strong> regard to environmental<br />
impacts of high sea fish<strong>in</strong>g. Salomon’s environmental impacts are nearly as high as those of veal. Feed production<br />
and the nutrient emissions <strong>in</strong>to the sea are quite important for the total environmental impacts. In<br />
regard to the global warm<strong>in</strong>g potential, fish offers an alternative to meat. Depend<strong>in</strong>g on the type of fish,<br />
emission per kg of fil<strong>et</strong> range b<strong>et</strong>ween 3.7 and 6.6 kg CO2-eq. For farmed salmon <strong>in</strong>direct N2O emissions<br />
from nutrient emissions need to be considered. Fish cannot be regarded generally as a more environmentally<br />
friendly food product than meat, because environmental impacts of different fish products might be quite<br />
variable and be even higher than these of meat.<br />
References<br />
Buchspies B, Tölle SJ, Jungbluth N. Life Cycle Assessment of High-Sea Fish and Salmon Aquaculture<br />
[Practical tra<strong>in</strong><strong>in</strong>g report]. Uster, CH: ESU-services Ltd.; 2011.<br />
Jungbluth N. Umweltfolgen des Nahrungsmittelkonsums: Beurteilung von Produktmerkmalen auf Grundlage<br />
e<strong>in</strong>er modularen Ökobilanz [Dissertation Nr. 13499]. Berl<strong>in</strong>, D: Eidgenössische Technische Hochschule<br />
Zürich, Umweltnatur- und Umweltsozialwissenschaften, dissertation.de; 2000.<br />
Jungbluth N, Flury K, Büsser S, Stucki M, Frischknecht R. Life cycle <strong>in</strong>ventory database on demand: Eco-<br />
Spold LCI database of ESU-services. Uster, CH: ESU-services Ltd.; 2011.<br />
Jungbluth N, Itten R. Umweltbelastungen des Konsums <strong>in</strong> der Schweiz und <strong>in</strong> der Stadt Zürich: Grundlagendaten<br />
und Reduktionspotentiale. Zürich: ESU-services GmbH im Auftrag der Stadt Zürich (unpublished);<br />
<strong>2012</strong>.<br />
Jungbluth N, Nathani C, Stucki M, Leuenberger M. Environmental impacts of Swiss consumption and production:<br />
a comb<strong>in</strong>ation of <strong>in</strong>put-output analysis with life cycle assessment. Bern, CH: ESU-services Ltd. &<br />
Rütter+Partner, commissioned by the Swiss Federal Office for the Environment (FOEN); 2011. p. 171.<br />
759
GROUP 3, SESSION A: LABELLING, CONSUMERS, DIET 8 th Int. Conference on <strong>LCA</strong> <strong>in</strong> the<br />
Agri-<strong>Food</strong> Sector, 1-4 Oct <strong>2012</strong><br />
Figure 1. Distribution of eco-po<strong>in</strong>ts for different life cycle stages<br />
Figure 2. Comparison of fish and meat – ecological scarcity m<strong>et</strong>hod 2006<br />
760
GROUP 3, SESSION A: LABELLING, CONSUMERS, DIET 8 th Int. Conference on <strong>LCA</strong> <strong>in</strong> the<br />
Agri-<strong>Food</strong> Sector, 1-4 Oct <strong>2012</strong><br />
71. The impacts of food choices on the state of the Baltic Sea - example<br />
of the EIO<strong>LCA</strong> study<br />
Virpi Vorne 1,* , Yrjö Virtanen 2 , Sirpa Kurppa 2 , Sanna Hi<strong>et</strong>ala 1 , Matti Verta 3 , Juha Grönroos 3 , Li<strong>in</strong>a Laum<strong>et</strong>s 4 ,<br />
El<strong>in</strong>a Līce 5<br />
1 MTT Biotechnology and <strong>Food</strong> Research, P.O.Box 413, FI-90014 University of Oulu, F<strong>in</strong>land, 2 MTT Biotechnology<br />
and <strong>Food</strong> Research, FIN-31600 Jokio<strong>in</strong>en, F<strong>in</strong>land, 3 F<strong>in</strong>nish Environment Institute (SYKE),<br />
P.O.Box 140, FI-00251 Hels<strong>in</strong>ki, F<strong>in</strong>land, 4 University of Tartu, Ülikooli 18, 50090 Tartu, Estonia, 5 University<br />
of Latvia, 19 Ra<strong>in</strong>a Blvd., Riga, LV 1586, Latvia, Correspond<strong>in</strong>g author. E-mail: virpi.vorne@mtt.fi<br />
The Baltic Sea is a small and relatively shallow brackish body of water located <strong>in</strong> northern Europe. It is the<br />
second largest brackish water bas<strong>in</strong> <strong>in</strong> the world and is also considered to be the most polluted. Low sal<strong>in</strong>ity<br />
also makes the Baltic’s unique ecosystems sensitive to changes result<strong>in</strong>g from human activity. One of the<br />
biggest problems is accelerat<strong>in</strong>g eutrophication caused by nutrient <strong>in</strong>flow and deposit.<br />
The food production cha<strong>in</strong> is one the most resource demand<strong>in</strong>g and pollut<strong>in</strong>g sectors. Agriculture and the<br />
food cha<strong>in</strong> are largely responsible for eutrophication and pollution of waterways. <strong>Food</strong> consumption represents<br />
a significant part of the environmental load of households and, <strong>in</strong> addition, food can conta<strong>in</strong> hazardous<br />
compounds result<strong>in</strong>g, for example, from farm<strong>in</strong>g and livestock production and traces of harmful chemicals,<br />
like those <strong>in</strong> fertilisers.<br />
An average 3 600 tonnes of phosphorus and 78 000 tonnes of nitrogen were leached <strong>in</strong>to the Baltic Sea from<br />
F<strong>in</strong>land annually b<strong>et</strong>ween 2000 and 2006. Approximately 28% of the phosphorus and 36% of the nitrogen<br />
load were from natural sources. The runoffs of the food cha<strong>in</strong> were estimated at 2 320 tonnes of phosphorus<br />
and 34 680 tonnes of nitrogen <strong>in</strong> 2005, correspond<strong>in</strong>g to about 80% of the diffuse phosphorus load, and<br />
about 70% of the diffuse nitrogen load from socio-economic activities. Raw material production governs the<br />
total environmental load of the domestic food cha<strong>in</strong>. Its contribution to the eutrophic emissions is 83% on<br />
average. About 95% of nitrogen and phosphorus leach<strong>in</strong>g stems from raw material production.<br />
Based on the results of the EIO<strong>LCA</strong> food cha<strong>in</strong> model, the eutrophication <strong>in</strong>tensity varies among different<br />
foodstuffs: beef has the highest eutrophication <strong>in</strong>tensity of all meats, about three times higher than that of<br />
pork, and seven times that of poultry. The eutrophication impacts of plants also vary among species: gra<strong>in</strong><br />
has the highest <strong>in</strong>tensity of the plant-based raw materials.<br />
Eutrophication <strong>in</strong>tensity was estimated for Estonian and Latvian food raw materials us<strong>in</strong>g the F<strong>in</strong>nish<br />
EIO<strong>LCA</strong> model, which was modified for the emission factors of the raw material production sectors. For<br />
Estonia eutrophication <strong>in</strong>tensity estimates appeared higher than for F<strong>in</strong>land. For the Latvian cereals the estimate<br />
was considerably lower than for the F<strong>in</strong>nish ones. This reflected through gra<strong>in</strong> fodder to pork, poultry<br />
and eggs.<br />
The effects of di<strong>et</strong> were studied with help of the EIO<strong>LCA</strong> food cha<strong>in</strong> model as part of a project on the coherency<br />
assessment of other policies with the environmental policies <strong>in</strong> F<strong>in</strong>land. The modell<strong>in</strong>g results <strong>in</strong>dicated<br />
that eutrophication caused by the food cha<strong>in</strong> could be reduced by about 7% if the recommended di<strong>et</strong> were to<br />
have full effect on private food consumption. The eutrophication <strong>in</strong>tensities, which are the gradients of the<br />
changes and are much higher for animal prote<strong>in</strong> foods than for carbohydrate foods, expla<strong>in</strong> the change.<br />
Human activity and land-based agricultural operations exert key effects on the nutrient contents of the Baltic<br />
Sea. The most important factors are the total area of agricultural land, its local distribution, diversity and<br />
volumes of different crops produced, use of fertilisers, and other agricultural operations. Nutrient load <strong>in</strong>to<br />
the Baltic Sea can be reduced by improv<strong>in</strong>g crop yields, by optimis<strong>in</strong>g crop selection and fertiliser use, and<br />
by practis<strong>in</strong>g efficient nutrient recycl<strong>in</strong>g.<br />
761
GROUP 3, SESSION A: LABELLING, CONSUMERS, DIET 8 th Int. Conference on <strong>LCA</strong> <strong>in</strong> the<br />
Agri-<strong>Food</strong> Sector, 1-4 Oct <strong>2012</strong><br />
762<br />
72 Potential contribution of di<strong>et</strong>ary changes to improvements <strong>in</strong> the<br />
environment and human health<br />
G.A. Rood 1,* , H. Westhoek, A. de Marco 2 , J.P. Lesschen 3 , A. Leip 4 , D. Nijdam, S. Wagner 3,1<br />
1 PBL N<strong>et</strong>herlands Environmental Assessment Agency, Bilthoven, The N<strong>et</strong>herlands, 2 ENEA, Rome, Italy,<br />
3 Alterra, Wagen<strong>in</strong>gen-UR, Wagen<strong>in</strong>gen, The N<strong>et</strong>herlands, 4 European Commission - Jo<strong>in</strong>t Research Centre,<br />
Institute for Environment and Susta<strong>in</strong>ability, Ispra, Italy, Correspond<strong>in</strong>g author. E-mail: trudy.rood@pbl.nl<br />
The consumption of animal products has a large environmental impact, both with<strong>in</strong> and outside Europe.<br />
Livestock production is a large user of land and a source of greenhouse gas and nitrogen emissions. At the<br />
consumption side, European di<strong>et</strong>s are characterised by a high <strong>in</strong>take of prote<strong>in</strong>, dom<strong>in</strong>ated by animal prote<strong>in</strong><br />
and a relatively high <strong>in</strong>take of saturated fat, also ma<strong>in</strong>ly orig<strong>in</strong>at<strong>in</strong>g from animal products. Reduc<strong>in</strong>g meat<br />
and dairy consumption could have various beneficial effects and offer a scope for change on a European<br />
level.<br />
For our study, we based consumption on supply data from the FAO. Health impacts were assessed by calculat<strong>in</strong>g<br />
the <strong>in</strong>take of prote<strong>in</strong>s, saturated fats and red meat, and compar<strong>in</strong>g these <strong>in</strong>takes aga<strong>in</strong>st health recommendations.<br />
The recommendations were obta<strong>in</strong>ed from the World Health Organization (WHO) and the<br />
World Cancer Research Fund (WHO, 2003; WCRF, 2007). Environmental impacts – from land use, and<br />
greenhouse gas and nitrogen emissions – were assessed us<strong>in</strong>g a review of <strong>LCA</strong>s of animal products and the<br />
MITERRA-Europe model. The MITERRA-Europe model calculates annual nitrogen flows and greenhouse<br />
gas emissions from agriculture, follow<strong>in</strong>g a life-cycle approach that reaches 'up to the farm gate' (Velthof <strong>et</strong><br />
al., 2009; Lesschen <strong>et</strong> al., 2011).<br />
We assessed scenarios with reductions of 25% and 50% <strong>in</strong> beef and dairy consumption (S1, S4) and other<br />
scenarios with similar reductions <strong>in</strong> pork, poultry and egg consumption and production (S2, S5). Furthermore,<br />
scenarios with a 25% and 50% reduction <strong>in</strong> all meat and dairy were assessed (S3, S6). The energy<br />
<strong>in</strong>take was kept at a constant level <strong>in</strong> all scenarios. Only the prote<strong>in</strong> <strong>in</strong>take was decreased, tak<strong>in</strong>g <strong>in</strong>to account<br />
the m<strong>in</strong>imum amount of prote<strong>in</strong> recommended by the WHO.<br />
Our study showed that reductions <strong>in</strong> meat and dairy consumption <strong>in</strong> fact decreased the environmental impacts,<br />
due to the large differences <strong>in</strong> land use, and carbon and nitrogen footpr<strong>in</strong>ts b<strong>et</strong>ween food products.<br />
Currently, European di<strong>et</strong>s conta<strong>in</strong> more prote<strong>in</strong>s than necessary as well as more saturated fat which ma<strong>in</strong>ly<br />
orig<strong>in</strong>ates from animal products, than the maximum recommended amount by the WHO. Also, current <strong>in</strong>take<br />
of red meats is higher than recommended by the WCRF. Di<strong>et</strong>s with lower meat and dairy products have been<br />
found to reduce the risk of various diseases. It was concluded that a decrease <strong>in</strong> the consumption of animal<br />
products <strong>in</strong> the EU27 may result <strong>in</strong> a large reduction <strong>in</strong> environmental impacts and could be beneficial to<br />
human health.<br />
References<br />
Lesschen J.P., van den Berg M., Westhoek H.J., Witzke H.P. and Oenema O. 2011. Greenhouse gas emission<br />
profiles of European livestock sectors. Animal Feed Science & Technology 166-167, 16-28.<br />
Velthof G.L., Oudendag D., Witzke H.P., Asman W.A.H., Klimont Z., Oenema, O. 2009. Integrated assessment<br />
of nitrogen emissions from agriculture <strong>in</strong> EU-27 us<strong>in</strong>g MITERRA-EUROPE. J. of Environ. Quality<br />
38, 402-417.<br />
WCRF& AICR (2007), <strong>Food</strong>, nutrion, physical activity and the prevention of cancer: a global perspective.<br />
2 nd Expert report ed. World Cancer Research Fund, Wash<strong>in</strong>gton D.C.<br />
WHO (2003a). Di<strong>et</strong>, Nutrition and the prevention of chronic diseases. WHO technical report series 916,<br />
WHO, Geneva.<br />
WHO (2003b). <strong>Food</strong> based di<strong>et</strong>ary guidel<strong>in</strong>es <strong>in</strong> the WHO European region. WHO-Europe, Copenhagen.
GROUP 3, SESSION A: LABELLING, CONSUMERS, DIET 8 th Int. Conference on <strong>LCA</strong> <strong>in</strong> the<br />
Agri-<strong>Food</strong> Sector, 1-4 Oct <strong>2012</strong><br />
73. Benchmark<strong>in</strong>g Swedish cod and herr<strong>in</strong>g products by spatialtemporal<br />
life cycle assessment<br />
Andreas Emanuelsson 1,2,* , Friederike Ziegler 1 , Leif Pihl 2 , Mattias Sköld 3 , Sara Hornborg 1 , Ulf Sonesson 1<br />
1 SIK – The Swedish Institute for <strong>Food</strong> and Biotechnology, Department of Susta<strong>in</strong>able <strong>Food</strong> Production, 402<br />
29 Gothenburg, Sweden, 2 University of Gothenburg, Department of Biological and Environmental Science,<br />
Krist<strong>in</strong>eberg, 451 78 Fiskebäckskil, Sweden, 3 Swedish University of Agricultural Sciences, Department of<br />
Aquatic Resources, 453 30 Lysekil, Sweden, Correspond<strong>in</strong>g author. E-mail: ae@sik.se<br />
Fisheries today affect the environment and its ecosystems with a broad range of impacts. M<strong>et</strong>hods to quantify<br />
and compare these lay with<strong>in</strong> the Life Cycle Assessment (<strong>LCA</strong>) framework when traditional emission<br />
based impact categories are complemented with biological <strong>in</strong>dices cover<strong>in</strong>g <strong>in</strong>ternationally acknowledged<br />
aspects of direct targ<strong>et</strong> stock damage (i.e. overfish<strong>in</strong>g) and direct ecosystem damage. This study demonstrates<br />
the application of seafood <strong>LCA</strong>’s by midpo<strong>in</strong>t benchmark<strong>in</strong>g the environmental performance of the<br />
Swedish trawl fle<strong>et</strong> <strong>in</strong> the Baltic Sea. It was done by compar<strong>in</strong>g fish<strong>in</strong>g activities on two stocks of cod and<br />
two stocks of herr<strong>in</strong>g <strong>in</strong> 2008 (spatial resolution) <strong>in</strong> terms of average products. In addition one stock of each<br />
species was compared over time <strong>in</strong> terms of key drivers, i.e. b<strong>et</strong>ween 2002 and 2008 (temporal resolution).<br />
Newly developed/ref<strong>in</strong>ed impacts categories of Overfish<strong>in</strong>g, Overfishedness, Wasted Potential Yield, Primary<br />
Production Required and Swept Area were applied tog<strong>et</strong>her with a full s<strong>et</strong> of ReCiPe midpo<strong>in</strong>t impact<br />
categories. The results showed major differences b<strong>et</strong>ween stocks (Fig. 1), and positive or negative trends<br />
were highlighted by def<strong>in</strong>ed impact groups of targ<strong>et</strong> stock, ecosystem and emission impact. Temporal variation<br />
was found substantial <strong>in</strong> all categories <strong>in</strong> relation to key drivers. The case study also demonstrated the<br />
weakness of generally us<strong>in</strong>g low fuel consumption as an <strong>in</strong>dicator for good stock status due to technical differences<br />
<strong>in</strong>fluenc<strong>in</strong>g the catchability. Data availability was discussed as a limit<strong>in</strong>g factor for applicability and<br />
a sensitivity analysis of the model assumptions performed. Trade-offs were discussed and f<strong>in</strong>al scores<br />
evaluated <strong>in</strong> relation to decision support and the future role of seafood <strong>LCA</strong>’s. With the <strong>in</strong>clusion of biological<br />
impact categories <strong>in</strong> the m<strong>et</strong>hodology, <strong>LCA</strong>´s are concluded to be a useful complementary tool for fisheries<br />
managers, seafood <strong>in</strong>dustry or seafood labell<strong>in</strong>g/consumer guides. But without directly address<strong>in</strong>g and<br />
quantify<strong>in</strong>g the biological effects on targ<strong>et</strong> stock and ecosystem any future seafood <strong>LCA</strong> could easily be<br />
mis<strong>in</strong>terpr<strong>et</strong>ed or even deliberately misused as a biased proxy for holistic “environmental” damage.<br />
763
GROUP 3, SESSION A: LABELLING, CONSUMERS, DIET 8 th Int. Conference on <strong>LCA</strong> <strong>in</strong> the<br />
Agri-<strong>Food</strong> Sector, 1-4 Oct <strong>2012</strong><br />
A – Targ<strong>et</strong> Catch<br />
B – Ecosystem<br />
C – Emissions<br />
Fig. 1a-c. Comparison b<strong>et</strong>ween environmental performances of four Baltic fish stocks dur<strong>in</strong>g 2008 over three<br />
groups of impact categories: A – Direct targ<strong>et</strong> stock impact, B – Direct ecosystem impact. C- Indirect emission<br />
impact.<br />
764<br />
%<br />
%<br />
100<br />
50<br />
0<br />
100<br />
50<br />
0<br />
Overfish<strong>in</strong>g<br />
(F/Fmsy-1)<br />
Overfishedness<br />
(Bmsy/B-1)<br />
Total discard PPR<br />
(targ<strong>et</strong>+bycatch)<br />
Swept seafloor<br />
Potential Yield<br />
(MSY/L-1)<br />
Potential Yield<br />
(Average Future<br />
Yield)<br />
Western Baltic Cod<br />
Eastern Baltic Cod<br />
Eastern Baltic Herr<strong>in</strong>g<br />
Bothnian Sea Baltic Herr<strong>in</strong>g
GROUP 3, SESSION A: LABELLING, CONSUMERS, DIET 8 th Int. Conference on <strong>LCA</strong> <strong>in</strong> the<br />
Agri-<strong>Food</strong> Sector, 1-4 Oct <strong>2012</strong><br />
74. L<strong>in</strong>k<strong>in</strong>g geographical certification and environmental declaration<br />
of food products: the apple Mela Rossa Cuneo (PGI) case study<br />
Alessandro K. Cerutti 1,* , Andrea Sacch<strong>et</strong>to 1 , Sander Bruun 2 , Dario Donno 1 , Gabriele L. Beccaro 1 , Giancarlo<br />
Bounous 1<br />
1 Department of Arboriculture, University of Tor<strong>in</strong>o, Via Leonardo da V<strong>in</strong>ci, 44 – 10095 Grugliasco (TO),<br />
Italy, 2 Department of Agriculture and Ecology, University of Copenhagen, Thorvaldsensvej 40, 1871<br />
Frederiksberg, Copenhagen, Denmark, Correspond<strong>in</strong>g author. E-mail: alessandro.cerutti@unito.it<br />
Protected Geographical Status (PGS) is a legal body def<strong>in</strong>ed <strong>in</strong> European Union law <strong>in</strong> order to protect the<br />
names of regional foods. In this framework the Protected Geographical Indication (PGI) is a well known<br />
name used on certa<strong>in</strong> products orig<strong>in</strong>at<strong>in</strong>g from a specific geographical location (e.g. a region or a country).<br />
The use of a PGI is also a certification that the product possesses certa<strong>in</strong> qualities or is made accord<strong>in</strong>g to<br />
local traditional m<strong>et</strong>hods. As PGI foods enjoy a certa<strong>in</strong> reputation, due to their geographical orig<strong>in</strong>, they are<br />
of higher commercial value both on local mark<strong>et</strong>s and <strong>in</strong> wholesale r<strong>et</strong>ail systems, <strong>in</strong> which PGI foods from<br />
several national areas are usually collected under specific brands <strong>in</strong> order to differentiate them from other<br />
products.<br />
PGI foods are connected to specific quality traits without consider<strong>in</strong>g impact on the environment dur<strong>in</strong>g the<br />
production. However, as the PGI seal reflects a standardised production, it may also be associated to standardised<br />
environmental impacts. Therefore it may be possible to comb<strong>in</strong>e the geographical certification with<br />
some sort of environmental declaration which may thus result <strong>in</strong> a positive effect of the commercial performance<br />
of such product. Even though the production of PGI foods are standardised to a certa<strong>in</strong> extent, the<br />
application of an environmental assessment m<strong>et</strong>hods to a PGI food is complicated because of the variability<br />
of the production process (e.g. diverse production systems may merge to the same PGI) and production sites.<br />
Therefore, the aim of this research is to evaluate the suitability and the m<strong>et</strong>hodological requirements for the<br />
application of the Environmental Product Declaration (EPD®) system to a PGI food case study. The focus<br />
will be the red apple "Mela Rossa Cuneo", which is a PGI product from the prov<strong>in</strong>ce of Cuneo (Piedmont,<br />
Italy). This apple is characterised by an <strong>in</strong>tense red colour<strong>in</strong>g of the peel and particular bright and sh<strong>in</strong>y<br />
shades of colour. The PGI is constituted by a small list of apple vari<strong>et</strong>ies and their clones deriv<strong>in</strong>g from a<br />
strict quality selection of the vari<strong>et</strong>ies still grown today.<br />
Accord<strong>in</strong>g to the EPD® system, the specific Product Category Rules (PCRs) for fruit and nuts products<br />
where applied to the Mela Rossa Cuneo <strong>in</strong> order to quantify the environmental impacts of the production. A<br />
cradle-to-gate <strong>LCA</strong> has been performed <strong>in</strong> accordance with the guidel<strong>in</strong>es and requirements of the ISO<br />
14040. Data regard<strong>in</strong>g agricultural <strong>in</strong>puts, consumption and orchard management have been obta<strong>in</strong>ed directly<br />
from the growers, us<strong>in</strong>g a questionnaire for the season 2010-2011, and by consultation of the Italian<br />
protocols for such production. The environmental aspects of the production of fertilisers and pesticides have<br />
been <strong>in</strong>cluded with<strong>in</strong> the boundaries.<br />
765
GROUP 3, SESSION A: LABELLING, CONSUMERS, DIET 8 th Int. Conference on <strong>LCA</strong> <strong>in</strong> the<br />
Agri-<strong>Food</strong> Sector, 1-4 Oct <strong>2012</strong><br />
75. Eco-labell<strong>in</strong>g and <strong>in</strong>formation asymm<strong>et</strong>ry: <strong>in</strong>dependent consumer<br />
<strong>in</strong>formation through eco-labels <strong>in</strong> Bulgaria<br />
Elka Vasileva * , Daniela Ivanova, Stilian Stefanov, N<strong>in</strong>a Tipova<br />
Department of Economics of Natural Resource, University of National and World Economy, Sofia, Bulgaria,<br />
Correspond<strong>in</strong>g author. E-mail: elkav@unwe.acad.bg<br />
Third party eco-labell<strong>in</strong>g can serve three functions <strong>in</strong> the mark<strong>et</strong>place: 1) it can provide <strong>in</strong>dependent evaluation<br />
and endorsement of a product; 2) it can act as a consumer protection tool; and 3) it can be a means of<br />
achiev<strong>in</strong>g specific environmental policy goals (Boström and Kl<strong>in</strong>tmann, 2008; Nilsson <strong>et</strong> al., 2004; Rubik<br />
and Frankl, 2005).<br />
Eco-labell<strong>in</strong>g is a means to narrow the <strong>in</strong>formation gap: <strong>in</strong>dependent third parties assure the consumer that<br />
the producer has complied with published, transparent, environmentally friendly standards. In recent years a<br />
number of critical research studies have been published which evaluate the reliability of eco-labels (Amstel<br />
van Saane <strong>et</strong> al., 2008; D'Souza <strong>et</strong> al., 2007; Koos, 2011; Nilsson <strong>et</strong> al., 2004).<br />
An identification and analysis of third parties eco-labell<strong>in</strong>g foods schemes <strong>in</strong> Bulgaria is presented. Discussion<br />
focuses on the coverage, promoters/owners and stakeholder <strong>in</strong>clusion <strong>in</strong> such schemes, and consideration<br />
of their impartiality, accessibility, <strong>in</strong>dependence and transparency. The disclosure of <strong>in</strong>formation to consumers<br />
by third parties eco-labell<strong>in</strong>g certification (organic labels) is explored. Conclusions are drawn regard<strong>in</strong>g<br />
their potential role <strong>in</strong> future shifts towards efficient consumer <strong>in</strong>formation practices <strong>in</strong> Bulgaria.<br />
References<br />
Amstel van Saane M., Driessen P., Glasbergen P., 2008. Eco-labell<strong>in</strong>g and Information Asymm<strong>et</strong>ry: a Comparison<br />
of Five Eco-labels <strong>in</strong> the N<strong>et</strong>herlands. Journal of Cleaner Production 16 (3), 263-276.<br />
Boström M., Kl<strong>in</strong>tmann M., 2008. Eco Standards, Product Labell<strong>in</strong>g and Green Consumerism, Houndmills:<br />
Palgrave Macmillan.<br />
D'Souza C., Taghian M., Lamb P., Per<strong>et</strong>iatko R., 2007. Green Decisions: Demographics and Consumer Understand<strong>in</strong>g<br />
of Environmental Labels. International Journal of Consumer Studies. 31 (4), 371 – 376.<br />
Koos S., 2011. Vari<strong>et</strong>ies of Environmental Labell<strong>in</strong>g, Mark<strong>et</strong> Structures, and Susta<strong>in</strong>able Consumption<br />
Across Europe: A Comparative Analysis of Organizational and Mark<strong>et</strong> Supply D<strong>et</strong>erm<strong>in</strong>ants of Environmental-Labelled<br />
Goods. Journal of Consumer Policy. 34, 127 - 159.<br />
Nilsson H., Tuncer B., Thidell A., 2004. The Use of Eco-labell<strong>in</strong>g like Initiatives on <strong>Food</strong> Products to Promote<br />
Quality Assurance—is There Enough Credibility?. Journal of Cleaner Production. 12, 517–526.<br />
Rubik F, Frankl P., 2005. The Future of Eco-labell<strong>in</strong>g. Mak<strong>in</strong>g Environmental Product Information Systems<br />
Effective, Sheffield: Greenleaf Publish<strong>in</strong>g Ltd.<br />
766
GROUP 3, SESSION A: LABELLING, CONSUMERS, DIET 8 th Int. Conference on <strong>LCA</strong> <strong>in</strong> the<br />
Agri-<strong>Food</strong> Sector, 1-4 Oct <strong>2012</strong><br />
76. SENSE: harmonised environmental susta<strong>in</strong>ability <strong>in</strong> the European<br />
food and dr<strong>in</strong>k cha<strong>in</strong><br />
Guillermo Pardo 1,* , A<strong>in</strong>tzane Esturo 1 , Jaime Zufía 1 , Ulf Sonesson 2 , Thorkild Nielsen 3 , Erl<strong>in</strong>g Larsen 4 ,<br />
Guðrún Ólafsdóttir 5 , David Barl<strong>in</strong>g 6 , Begoña Perez Villarreal 1<br />
1,* AZTI-Tecnalia, Spa<strong>in</strong>, 2 Swedish Institute for <strong>Food</strong> and Biotechnology, Sweden, 3 Aalborg University<br />
Centre, Denmark, 4 DTU-Aqua, Denmark, 5 University of Iceland, Iceland, 6 The City University London,<br />
UK, Correspond<strong>in</strong>g author. E-mail: gpardo@azti.es<br />
The food and dr<strong>in</strong>k <strong>in</strong>dustry <strong>in</strong> Europe, of which 99% are SMEs, is highly fragmented, and food cha<strong>in</strong>s are<br />
very complex. Hence, to assess the environmental impact of a product there is a need for apply<strong>in</strong>g <strong>in</strong>tegrated,<br />
harmonised and scientifically robust m<strong>et</strong>hodologies, tog<strong>et</strong>her with appropriate communication strategies<br />
for mak<strong>in</strong>g environmental susta<strong>in</strong>ability understandable to the mark<strong>et</strong>. However, there are difficulties <strong>in</strong><br />
develop<strong>in</strong>g a commonly agreed m<strong>et</strong>hodology for environmental impact assessment that still need to be overcome,<br />
notably: complexity of food cha<strong>in</strong>s, large number of agents <strong>in</strong>volved, different <strong>in</strong>dicators depend<strong>in</strong>g<br />
on the bus<strong>in</strong>ess sector, regional differences, high data <strong>in</strong>tensity, costs and expertise required.<br />
Consider<strong>in</strong>g the previous difficulties, SENSE project will deliver a harmonised system for environmental<br />
impact assessment of food and dr<strong>in</strong>k products. The research will evaluate exist<strong>in</strong>g relevant environmental<br />
impact assessment m<strong>et</strong>hodologies, and consider socio-economical, quality and saf<strong>et</strong>y aspects, an approach<br />
that have been rare up till now, to deliver a new <strong>in</strong>tegral system that can be l<strong>in</strong>ked to monitor<strong>in</strong>g and traceability<br />
data.<br />
By means of <strong>in</strong>corporat<strong>in</strong>g a simplified data gather<strong>in</strong>g system, a matrix of key environmental performance<br />
<strong>in</strong>dicators and a certification scheme <strong>in</strong>to the new m<strong>et</strong>hodology the project will provide a tool to effectively<br />
reflect the susta<strong>in</strong>ability profile of any product. The e-<strong>in</strong>formation will allow food and dr<strong>in</strong>k cha<strong>in</strong> actors,<br />
and especially <strong>in</strong>dustrial SMEs, to s<strong>et</strong> realistic environmental susta<strong>in</strong>ability goals and improve their comp<strong>et</strong>itiveness<br />
towards a more susta<strong>in</strong>able production culture to all levels of the production process.<br />
The susta<strong>in</strong>ability <strong>in</strong>formation collected along the production cycle of any food stuff will be f<strong>in</strong>ally reflected<br />
<strong>in</strong>to an Environmental Identification Document (EID) which will contribute to enhanced environmental susta<strong>in</strong>ability<br />
motivation of the usual purchas<strong>in</strong>g behaviour of consumers and provide a comp<strong>et</strong>itive advantage<br />
to those products (and companies) which choose to use this approach.<br />
The communication of the <strong>in</strong>formation will have a visual presentation that will be <strong>in</strong>tuitively understandable<br />
by all the stakeholder of the food and dr<strong>in</strong>k sector, and especially the consumers. By means of a comprehensive<br />
environmental communication b<strong>et</strong>ween the <strong>in</strong>dustry and consumers will lead those to choose for the<br />
food products communicated as be<strong>in</strong>g environmentally friendly.<br />
The ma<strong>in</strong> results of SENSE will be:<br />
Standard key environmental performance <strong>in</strong>dicators (KEPI) and specifically for three food and dr<strong>in</strong>k<br />
cha<strong>in</strong>s from three regions (Northern Europe, Mid-Eastern Europe and Mediterranean Europe)<br />
Harmonised m<strong>et</strong>hodology for environmental impact assessment<br />
SENSE-tool for simplified environmental data collection<br />
Environmental Identification Document (EID) and EID-Communication Platform<br />
Certification Scheme Concept (CSC) for susta<strong>in</strong>ability based on EID<br />
Road map for policy and governance implementation<br />
767
GROUP 3, SESSION A: LABELLING, CONSUMERS, DIET 8 th Int. Conference on <strong>LCA</strong> <strong>in</strong> the<br />
Agri-<strong>Food</strong> Sector, 1-4 Oct <strong>2012</strong><br />
Figure 1. Diagram of objectives of SENSE<br />
Figure 2. Proposed web-based system to enable users to <strong>in</strong>put key environmental <strong>in</strong>formation from different<br />
supply cha<strong>in</strong> stages <strong>in</strong> food cha<strong>in</strong> follow<strong>in</strong>g a data traceability approach.<br />
768<br />
Environmental Identification Document (EID) (WP3)<br />
Common<br />
“SENSE” Server<br />
INTERNET<br />
Susta<strong>in</strong>ability<br />
performance<br />
<strong>in</strong>dicators (WP2)<br />
PRODUCER FOOD PROCESOR PACK. MANUFACTURER TRANSPORTER RETAILER<br />
<strong>Food</strong> Items<br />
<strong>Food</strong> Industries
GROUP 3, SESSION A: LABELLING, CONSUMERS, DIET 8 th Int. Conference on <strong>LCA</strong> <strong>in</strong> the<br />
Agri-<strong>Food</strong> Sector, 1-4 Oct <strong>2012</strong><br />
77. Life cycle assessment of rapeseed and sunflower oils<br />
Laureen Badey 1,* , Natie Lahitte, Francis Flen<strong>et</strong> 2 , Fabrice Bosque<br />
1 ITERG, French Institute of Fats and Oils, 2 CETIOM, Technical Center for Oilseed Crops and Industrial<br />
Hemp, Correspond<strong>in</strong>g author. E-mail: l.badey@iterg.com<br />
The aim of the study is to provide all necessary <strong>in</strong>formation to fit to the French national experimentation of<br />
environmental label<strong>in</strong>g for two standard oils: sunflower oil and rapeseed oil. The results of this study are a<br />
relevant overview of all sunflower and rapeseed oils produced <strong>in</strong> <strong>France</strong>, and are usable as standard values<br />
for both producers and users of veg<strong>et</strong>able oil. Industrials of oil sector use these values to compare to their<br />
own process values and to evaluate the improvement due to their ecodesign strategy. For example, the use of<br />
a biomass boiler, the reduction of packag<strong>in</strong>g, different choices for the suppliers of the seeds lead to a lower<br />
<strong>LCA</strong> score.<br />
The compl<strong>et</strong>e life cycle of oils has been studied from the seeds production to the end of life of the packag<strong>in</strong>g.<br />
Only storage and use have been excluded from the study because of a lack of data. The life cycle <strong>in</strong>ventory is<br />
illustrated <strong>in</strong> Fig. 1. In this graph, the cells <strong>in</strong> dotted l<strong>in</strong>e are the steps excluded from the study. All the other<br />
ones are <strong>in</strong>cluded. An energ<strong>et</strong>ic allocation has been done to the co-products (with a grey frame <strong>in</strong> the graph).<br />
The data were collected from different <strong>in</strong>dustrial sites belonged to Sofiproteol group that illustrate the diversity<br />
of all the French crush<strong>in</strong>g, ref<strong>in</strong><strong>in</strong>g and packag<strong>in</strong>g sites. About 4.5 million seeds were crushed <strong>in</strong> 2010<br />
by Sofiproteol group, which represents 80% of French crush<strong>in</strong>g. A focus has been made on the impacts of<br />
crush<strong>in</strong>g and chemical ref<strong>in</strong><strong>in</strong>g. The <strong>in</strong>dustrial data are specific to edible oils. Note that ref<strong>in</strong><strong>in</strong>g of edible oil<br />
(chemical ref<strong>in</strong><strong>in</strong>g) differs from the ref<strong>in</strong><strong>in</strong>g of oil used for biofuels (physical ref<strong>in</strong><strong>in</strong>g).<br />
For the agricultural step, data has been gathered from ADEME (2010) on first generation of biofuels used <strong>in</strong><br />
<strong>France</strong> and has been rounded off by CETIOM expertise (water consumption). Life cycle <strong>in</strong>ventories (LCI)<br />
come from the <strong>LCA</strong> database eco<strong>in</strong>vent.<br />
The <strong>in</strong>dicators used are congruent with the French national experimentation of environmental labell<strong>in</strong>g:<br />
greenhouse gases (GHGs) and water consumption. The most important po<strong>in</strong>t <strong>in</strong> the results (Table 1) is that<br />
the agricultural step is responsible of most impacts on the studied <strong>in</strong>dicators (from 58-71% of GHG and 47-<br />
73% of water consumption). The other steps that contribute the more are the <strong>in</strong>dustrial step, the transport and<br />
the packag<strong>in</strong>g.<br />
References<br />
ADEME - Direction Production <strong>et</strong> Énergies Durables, 2010. Analyses de cycle de vie appliquées aux biocarburants<br />
de première génération consommés en <strong>France</strong>. F<strong>in</strong>al report. 236 pages.<br />
ADEME, AFNOR, 2011. BPX 30-323 - Pr<strong>in</strong>cipes généraux pour l'affichage environnemental des produits de<br />
grande consommation - Partie 0: pr<strong>in</strong>cipes généraux <strong>et</strong> cadre méthodologique.<br />
Shonfield, P.K.A., Dumel<strong>in</strong> E.E., 2005. A life cycle assessment of spreads and margar<strong>in</strong>es. Lipid Technology,<br />
17: 199-203.<br />
Schmidt, J, 2007. Life cycle assessment of rapeseed oil and palm oil, Ph.D. thesis.<br />
Wightman. P., Eavis, R., Batchelor, S., Walker, K., Benn<strong>et</strong>t, R., Carruthers, P., Tranter, R., 1999. Comparison<br />
of rapeseed and m<strong>in</strong>eral oils us<strong>in</strong>g life-cycle assessment and cost-benefit Analysis. OCL – Oleag<strong>in</strong>eux,<br />
Corps Gras, Lipides, 6: 384-388.<br />
Table 1. Results of <strong>LCA</strong> on rapeseed and sunflower oils<br />
Rapeseed oil Sunflower oil<br />
Ref<strong>in</strong><strong>in</strong>g Packaged Ref<strong>in</strong><strong>in</strong>g Packaged<br />
Indicator Unit oil oil oil oil<br />
GHG emissions<br />
g CO2<br />
eq<br />
127 154 89 112<br />
Water consumption<br />
litres 0.7 1.0 1.7 1.9<br />
769
GROUP 3, SESSION A: LABELLING, CONSUMERS, DIET 8 th Int. Conference on <strong>LCA</strong> <strong>in</strong> the<br />
Agri-<strong>Food</strong> Sector, 1-4 Oct <strong>2012</strong><br />
Figure 1. LCI considered for the <strong>LCA</strong> of rapeseed and sunflower oils.<br />
770
GROUP 3, SESSION A: LABELLING, CONSUMERS, DIET 8 th Int. Conference on <strong>LCA</strong> <strong>in</strong> the<br />
Agri-<strong>Food</strong> Sector, 1-4 Oct <strong>2012</strong><br />
78. Effect of carbon footpr<strong>in</strong>t label on food purchase behaviour<br />
Aki-Heikki F<strong>in</strong>ér 1,* , Marika Kelokari 1 , Jussi Nikula 2 , Mira Povela<strong>in</strong>en 1<br />
1 Raisio Group, 2 WWF F<strong>in</strong>land, Correspond<strong>in</strong>g author. E-mail: aki.f<strong>in</strong>er@raisio.com<br />
Consumer <strong>in</strong>terest on products’ environmental profile is constantly <strong>in</strong>creas<strong>in</strong>g. Several eco-labels are published<br />
worldwide to <strong>in</strong>form consumers about products’ environmental performance. Raisio Group, an <strong>in</strong>ternational<br />
plant-based foods and feeds company, was one of the first companies to <strong>in</strong>troduce a carbon footpr<strong>in</strong>t<br />
label for food products <strong>in</strong> 2008. S<strong>in</strong>ce, Raisio’s carbon footpr<strong>in</strong>t label has been revised <strong>in</strong> compliance with<br />
customer feedback. Nowadays, Raisio has labelled more than 30 of its own products and the label is also <strong>in</strong><br />
use <strong>in</strong> more than 15 other companies’ food products <strong>in</strong>clud<strong>in</strong>g poultry and honey products.<br />
A consumer web survey was organised tog<strong>et</strong>her with Raisio Group and WWF F<strong>in</strong>land <strong>in</strong> July 2011 <strong>in</strong><br />
F<strong>in</strong>land. The survey was organised to d<strong>et</strong>erm<strong>in</strong>e which aspects F<strong>in</strong>nish people value when mak<strong>in</strong>g decisions<br />
concern<strong>in</strong>g food. Information about the survey was spread through social media, Raisio’s consumer newsl<strong>et</strong>ters<br />
and WWF F<strong>in</strong>land’s newsl<strong>et</strong>ter. Most important questions were how F<strong>in</strong>nish consumers take food cha<strong>in</strong>s<br />
different susta<strong>in</strong>ability aspects <strong>in</strong>to account <strong>in</strong> their purchase decisions, the mark<strong>et</strong> pen<strong>et</strong>ration of Raisio<br />
Group’s carbon footpr<strong>in</strong>t label and the relation of carbon footpr<strong>in</strong>t and other factors when mak<strong>in</strong>g purchase<br />
decision.<br />
The respondents were assumed to be environmentally conscious or aware of current discussion about food<br />
environmental impacts and susta<strong>in</strong>ability as a whole <strong>in</strong> F<strong>in</strong>land. The results of the survey show that approximately<br />
40% of 4960 respondents have seen Raisio Group’s carbon footpr<strong>in</strong>t label on a food product package.<br />
Almost 54% of the respondents stated that a carbon footpr<strong>in</strong>t label should be mandatory for food products.<br />
More than 60% suppose that mandatory carbon footpr<strong>in</strong>t label would have effect on purchase decision. Other<br />
key factors <strong>in</strong> decision mak<strong>in</strong>g are food products purity and saf<strong>et</strong>y, health<strong>in</strong>ess and price.<br />
Figure 1. Raisio Group’s carbon footpr<strong>in</strong>t label<br />
771
GROUP 3, SESSION A: LABELLING, CONSUMERS, DIET 8 th Int. Conference on <strong>LCA</strong> <strong>in</strong> the<br />
Agri-<strong>Food</strong> Sector, 1-4 Oct <strong>2012</strong><br />
772<br />
79. Bitterswe<strong>et</strong> comparability of carbon footpr<strong>in</strong>ts<br />
Silvia Marton<br />
myclimate – The Climate Protection Partnership, Zürich, Switzerland, E-mail: silvia.marton@myclimate.org<br />
Comparability of results from life cycle assessments is a critical topic, especially when results are used for<br />
communication and product labell<strong>in</strong>g. The ma<strong>in</strong> sources of variation are (1) different system boundary def<strong>in</strong>itions,<br />
(2) data handl<strong>in</strong>g and assumptions, (3) different databases for background data (Kägi <strong>et</strong> al. 2011). In<br />
our study of three types of chocolate, the carbon footpr<strong>in</strong>t is performed by the same person <strong>in</strong> order to elim<strong>in</strong>ate<br />
the first and second cause for variation. The carbon footpr<strong>in</strong>t was performed us<strong>in</strong>g two different tools,<br />
Footpr<strong>in</strong>t Expert (FPX) of the British Carbon Trust Footpr<strong>in</strong>t<strong>in</strong>g Company Ltd., and EMIS 5.6 from Carbotech<br />
AG. Both tools provide an <strong>in</strong>tegrated database for background data, the FPX Reference Database 3.3<br />
and eco<strong>in</strong>vent 2.2, respectively. The calculation of agricultural products was performed with the FPX Crop<br />
Calculator. In the EMIS model, direct emissions were calculated follow<strong>in</strong>g the m<strong>et</strong>hodology used <strong>in</strong> eco<strong>in</strong>vent<br />
(Nemecek & Kägi, 2007) and the IPCC 2006 Guidel<strong>in</strong>es. The aim of this study is to f<strong>in</strong>d out if the results<br />
of the footpr<strong>in</strong>ts are comparable or not. The study is performed accord<strong>in</strong>g to PAS 2050. Primary data<br />
were collected for cocoa and sugar cane farm<strong>in</strong>g and the production stages. Secondary data were ma<strong>in</strong>ly<br />
taken from the databases of the tools.<br />
The study shows that the f<strong>in</strong>al results from both tools are <strong>in</strong> the same magnitude order, with differences of<br />
less than 15 per cent. Larger differences could be observed for the s<strong>in</strong>gle production stages (Fig. 1 and Table<br />
1). The calculated greenhouse gas (GHG) emissions from cocoa beans were higher us<strong>in</strong>g the eco<strong>in</strong>vent<br />
m<strong>et</strong>hodology compared to those from the FPX Crop Calculator. For sugarcane, the result was different, as<br />
the emissions calculated with the eco<strong>in</strong>vent m<strong>et</strong>hodology were lower than those from the FPX Crop Calculator.<br />
GHG emissions from transport were higher when calculated with FPX compared to the transport emissions<br />
based on eco<strong>in</strong>vent. Especially for sea freight, eco<strong>in</strong>vent emission factors are much lower, which is <strong>in</strong><br />
l<strong>in</strong>e with the results from other studies analys<strong>in</strong>g sea freight (Emanuelsson <strong>et</strong> al. 2010).<br />
Both tools, FPX and EMIS, have their advantages and disadvantages. FPX is a tool with a strict guidel<strong>in</strong>e<br />
and especially designed for carbon footpr<strong>in</strong>t<strong>in</strong>g. Therefore it can be used by non-professionals, allow<strong>in</strong>g<br />
them to calculate carbon footpr<strong>in</strong>ts of good quality. The aim of FPX is to standardise carbon footpr<strong>in</strong>t<strong>in</strong>g <strong>in</strong><br />
order to enable comparable results, even if footpr<strong>in</strong>ts are performed by different organisations. However, the<br />
tool is limited to carbon footpr<strong>in</strong>t<strong>in</strong>g. EMIS is a tool for life cycle assessments (<strong>LCA</strong>). Therefore it can be<br />
used for other impact categories and <strong>in</strong>cludes more functionality such as <strong>in</strong>put-output analyses or uncerta<strong>in</strong>ty<br />
analyses. It allows a more differentiated analysis of products. However, as it is more flexible <strong>in</strong> its use, comparability<br />
of studies performed by different people is lower.<br />
Often product carbon footpr<strong>in</strong>t analyses are conducted ma<strong>in</strong>ly for mark<strong>et</strong><strong>in</strong>g reasons. It has to be emphasised<br />
that the communication of results on product labels is a difficult topic. Indicat<strong>in</strong>g an exact number may be<br />
mislead<strong>in</strong>g to customers, as it pr<strong>et</strong>ends an accuracy that cannot be achieved by current m<strong>et</strong>hodologies. However,<br />
standardised tools like FPX tog<strong>et</strong>her with an accredited certification body do provide comparable results<br />
that may help customers to choose climate friendly products.<br />
References<br />
Emanuelsson, A., Skontrop Hognes, E., Ziegler, F., Sund, V., W<strong>in</strong>ther, U., Elligsen, H., 2010. Life cycle<br />
approach to Norwegian seafood logistics – new ways to model food transports, <strong>in</strong>: Notarnicola B., S<strong>et</strong>tanni<br />
E., Tassielli G. Giungato, P. (Eds.), proceed<strong>in</strong>gs of <strong>LCA</strong>food 2010, Bari, Italy<br />
Kägi, T., W<strong>et</strong>tste<strong>in</strong>, D., Schmid, H., Azapagi, A., Amienyo, D., Contreras, A., Sanchez, M., Villegas Costa,<br />
L., Ménard, J.F., Bécaert, V., Kanzaki, M., 2011. <strong>LCA</strong> Comparative Study on Beer. 5 th PCF World Summit,<br />
Zurich, 7-8 April 2011<br />
Nemecek, T., Kägi, T., 2007. Life Cycle Inventories of Agricultural Production Systems. eco<strong>in</strong>vent report<br />
No. 15, Zurich and Dübendorf, Switzerland.
GROUP 3, SESSION A: LABELLING, CONSUMERS, DIET 8 th Int. Conference on <strong>LCA</strong> <strong>in</strong> the<br />
Agri-<strong>Food</strong> Sector, 1-4 Oct <strong>2012</strong><br />
Figure 1. GHG emissions from the chocolate „Peruvian chocolate 60%“, calculated with EMIS and FPX.<br />
Table 1. Emission sources and differences b<strong>et</strong>ween EMIS and FPX results.<br />
Emission source Difference of EMIS result compared<br />
to FPX result<br />
Cocoa Acopagro +68.0%<br />
Cocoa butter -2.3%<br />
Sugar -2.3%<br />
Paper, primary packag<strong>in</strong>g<br />
-23.0%<br />
Alum<strong>in</strong>ium, primary<br />
packag<strong>in</strong>g -5.7%<br />
Cardboard, secondary<br />
packag<strong>in</strong>g +10.5%<br />
LDPE foil, secondary<br />
packag<strong>in</strong>g +25.0%<br />
Electricity, CH +93.5%<br />
Fuel oil -0.5%<br />
Natural gas +9.3%<br />
District heat -<br />
Fugitive emissions -<br />
Transports, ship -59.8%<br />
Transports, road -22.5%<br />
Production waste +56.8%<br />
Total +10.3%<br />
773
GROUP 3, SESSION A: LABELLING, CONSUMERS, DIET 8 th Int. Conference on <strong>LCA</strong> <strong>in</strong> the<br />
Agri-<strong>Food</strong> Sector, 1-4 Oct <strong>2012</strong><br />
774<br />
80. Life cycle assessment as a basis for eco-labell<strong>in</strong>g of fish food<br />
products<br />
Erw<strong>in</strong> M. Schau 1,2,* , Annik M. F<strong>et</strong> 2 , Harald Ell<strong>in</strong>gsen 3 , Matthias F<strong>in</strong>kbe<strong>in</strong>er 1<br />
1 Department of Environmental Technology, Technische Universita<strong>et</strong> Berl<strong>in</strong>, Berl<strong>in</strong>, Germany, 2 Department<br />
of Industrial Economics and Technology Management, Norwegian University of Science and Technology<br />
(NTNU), Trondheim, Norway, 3 Department of Mar<strong>in</strong>e Technology, NTNU, Trondheim, Norway, Correspond<strong>in</strong>g<br />
author. E-mail: erw<strong>in</strong>.schau@tu-berl<strong>in</strong>.de<br />
Life cycle assessment (<strong>LCA</strong>) is a valuable tool for document<strong>in</strong>g environmental performance of food products.<br />
This is also true for fish food products – a commodity provid<strong>in</strong>g <strong>in</strong>come for millions and food for billions<br />
of people worldwide (FAO Fisheries Department, 2010) – even though most effort has been <strong>in</strong>vested <strong>in</strong><br />
the susta<strong>in</strong>able harvest<strong>in</strong>g of fish resources. The life cycle management <strong>in</strong> the food <strong>in</strong>dustry is ma<strong>in</strong>ly driven<br />
by policy makers, consumers and the <strong>in</strong>dustry itself on the emerg<strong>in</strong>g problem of climate change. In the fish<br />
<strong>in</strong>dustry, there is an urgent need for strategies, tools and communication with the mark<strong>et</strong> that emphasise the<br />
whole life cycle of the fish food product from catch to consumption. Tak<strong>in</strong>g this <strong>in</strong>to account, carbon footpr<strong>in</strong>t<br />
declaration (after the planned ISO14067 (ISO/DIS 14067, <strong>2012</strong>)), the com<strong>in</strong>g European environmental<br />
footpr<strong>in</strong>t of products (European Commission, <strong>2012</strong>), and the Environmental Product Declarations (EPD) -<br />
follow<strong>in</strong>g the ISO14025 standard (ISO 14025, 2006) - are all suitable for communicat<strong>in</strong>g results from food<br />
products <strong>LCA</strong>s. The EPD, ma<strong>in</strong>ly developed for bus<strong>in</strong>ess to bus<strong>in</strong>ess communication, can also be used for<br />
communication to the other important stakeholders, like environmental organisations and consumers. However,<br />
the special challenges with decl<strong>in</strong><strong>in</strong>g fish resources need to be taken <strong>in</strong>to account. This contribution<br />
presents results from a PhD-project on life cycle assessment of the fish food product with emphasis of the<br />
fish<strong>in</strong>g phase (Schau, <strong>2012</strong>). The results from the <strong>LCA</strong> of Atlantic herr<strong>in</strong>g landed <strong>in</strong> Norway and consumed<br />
<strong>in</strong> Germany, shows that the fish<strong>in</strong>g vessel, and especially the diesel use is the ma<strong>in</strong> contributor to most impact<br />
categories <strong>in</strong>vestigated. Besides from present<strong>in</strong>g the <strong>LCA</strong> results, the EPD also gives <strong>in</strong>formation on the<br />
status of the fish stock the product comes from. In addition, this contribution <strong>in</strong>vestigates how life cycle environmental<br />
impacts from fish food products can be presented <strong>in</strong> the carbon footpr<strong>in</strong>t declarations and <strong>in</strong> the<br />
com<strong>in</strong>g European environmental footpr<strong>in</strong>t of products.<br />
References<br />
European Commission, <strong>2012</strong>. Environmental footpr<strong>in</strong>t of products. R<strong>et</strong>rieved 24 Jan <strong>2012</strong> from<br />
http://ec.europa.eu/environment/eussd/product_footpr<strong>in</strong>t.htm.<br />
FAO Fisheries Department, 2010. The State of World Fisheries and Aquaculture - 2010. Rome, <strong>Food</strong> and<br />
Agriculture Organization of the United Nations.<br />
ISO 14025, 2006. Environmental labell<strong>in</strong>g and declarations - Type III environmental declarations - Pr<strong>in</strong>ciples<br />
and procedures (ISO 14025:2006). Geneva, ISO.<br />
ISO/DIS 14067, <strong>2012</strong>. Carbon footpr<strong>in</strong>t of products - Requirements and guidel<strong>in</strong>es for quantification and<br />
communication. Berl<strong>in</strong>, Secr<strong>et</strong>ariat DIN: 52.<br />
Schau, E.A.M., <strong>2012</strong>. Environmental life cycle assessments of fish food products with emphasis on the fish<br />
catch process. Trondheim, Norway, NTNU, Norwegian University of Science and Technology.
GROUP 3, SESSION A: LABELLING, CONSUMERS, DIET 8 th Int. Conference on <strong>LCA</strong> <strong>in</strong> the<br />
Agri-<strong>Food</strong> Sector, 1-4 Oct <strong>2012</strong><br />
Impact category Total<br />
Acidification Potential (AP)<br />
[g SO2-equivalent]<br />
Eutrophication Potential (EP)<br />
[g PO4-equivalent]<br />
Global Warm<strong>in</strong>g Potential (GWP)<br />
[kg CO2-equivalent]<br />
Mar<strong>in</strong>e Aquatic Eco-toxicity Potential<br />
(MAETP) [kg DCB-equivalent]<br />
Ozone Layer Depl<strong>et</strong>ion Potential<br />
(ODP) [mg R11-equivalent]<br />
Photochem. Ozone Creation Pot.<br />
(POCP) [g Ethene-equivalent]<br />
Radioactive Radiation (RAD)<br />
[DALY]<br />
Abbreviations: DCB : 1,4-dichlorobenzene<br />
DALY: disability-adjusted life year<br />
17.1<br />
4.4<br />
2.14<br />
67.2<br />
0.836<br />
2.03<br />
3.56×10 -9<br />
AP<br />
AP<br />
EP<br />
EP<br />
GWP<br />
GWP<br />
MAETP<br />
MAETP<br />
ODP ODP<br />
POCP POCP<br />
RAD RAD<br />
Vessel Vessel Fish<strong>in</strong>g Fish<strong>in</strong>gProcess<strong>in</strong>g Process<strong>in</strong>g & & Packag<strong>in</strong>g Packag<strong>in</strong>g Multimodal Multimodal Wholesale Wholesale & &<br />
construction construction Ref<strong>in</strong>ement Ref<strong>in</strong>ement production production transport transport r<strong>et</strong>ail<strong>in</strong>g r<strong>et</strong>ail<strong>in</strong>g<br />
0% 0% 20% 20% 40% 40% 60% 60% 80% 100%<br />
Home Home<br />
transport transport<br />
Consumption<br />
Figure 1. <strong>LCA</strong> results from the Atlantic herr<strong>in</strong>g (Clupea harrengus) case study. The fish<strong>in</strong>g life cycle phase<br />
dom<strong>in</strong>ates several impact categories (Schau, <strong>2012</strong>).<br />
775
GROUP 3, SESSION A: LABELLING, CONSUMERS, DIET 8 th Int. Conference on <strong>LCA</strong> <strong>in</strong> the<br />
Agri-<strong>Food</strong> Sector, 1-4 Oct <strong>2012</strong><br />
776<br />
81. Agrifood products: a comparison of exist<strong>in</strong>g carbon footpr<strong>in</strong>t<br />
systems <strong>in</strong> the world<br />
Stéphane Le Pochat * , Evelyne Lauren, Roberto Bell<strong>in</strong>o<br />
EVEA, 56 Bd de la Fraternité, 44100 Nantes, <strong>France</strong>, Correspond<strong>in</strong>g author. E-mail: s.lepochat@eveaconseil.com<br />
In 2011, EVEA and Sav<strong>in</strong> Mart<strong>in</strong><strong>et</strong> Associés carried out a study on behalf of the French <strong>Food</strong> and Agriculture<br />
M<strong>in</strong>istry (MAAPRAT <strong>2012</strong>). The aim of this study was first to compare the different product carbon<br />
footpr<strong>in</strong>t (PCF) systems of agrifood products around the world, and second to give a risk analysis of comp<strong>et</strong><strong>in</strong>g<br />
distortion from a world trade po<strong>in</strong>t of view.<br />
Thirty-eight PCF systems were checked off. These systems are dissem<strong>in</strong>ated worldwide: Europe (<strong>France</strong>,<br />
Germany, England, Sweden, Switzerland, <strong>et</strong>c.), North America, Asia, Australia and New Zealand. Dist<strong>in</strong>ctions<br />
were made firstly by system category (PCF, labels, or tools), and secondly by orig<strong>in</strong> (public or private,<br />
r<strong>et</strong>ailer). From these 38 systems, 14 of them provid<strong>in</strong>g exist<strong>in</strong>g PCF of agrifood products on the mark<strong>et</strong> were<br />
deeply analysed, 10 of which <strong>in</strong> Europe and 2 <strong>in</strong> Asia. This consisted <strong>in</strong> report<strong>in</strong>g and analys<strong>in</strong>g general <strong>in</strong>formation<br />
(country, owner of the system, number of committed enterprises, number of PCF labelled products,<br />
<strong>et</strong>c.) and more specific <strong>in</strong>formation about the structure of the PCF system such as exist<strong>in</strong>g PCR, verification<br />
process, tools for comput<strong>in</strong>g, underly<strong>in</strong>g database, <strong>et</strong>c. Furthermore, a comparison of PCF of several<br />
products was carried out. Around 300 PCF of products were reported from the 14 analysed systems and<br />
some d<strong>et</strong>ailed comparisons were made for 9 specific products (milk, w<strong>in</strong>e, ham, bread, rice, olive oil, yogurt,<br />
potatoes, and French beans) both with<strong>in</strong> a same system (<strong>in</strong>tra-comparison) and b<strong>et</strong>ween different systems<br />
(<strong>in</strong>ter-comparison). Table 1 shows an example for the comparison of several milk footpr<strong>in</strong>ts.<br />
Each time, <strong>in</strong>terpr<strong>et</strong>ation has been conducted from these comparisons confront<strong>in</strong>g on one hand the PCF figures<br />
and on the other hand available <strong>in</strong>formation related to these PCF (calculation rules, allocation, <strong>et</strong>c).<br />
Three criteria were def<strong>in</strong>ed: level of available <strong>in</strong>formation, estimated level of m<strong>et</strong>hodological divergence,<br />
objective comparability. For each product and each PCF system, this analysis led to identify the ma<strong>in</strong> <strong>in</strong>fluenc<strong>in</strong>g<br />
param<strong>et</strong>ers (packag<strong>in</strong>g, organic production or not, orig<strong>in</strong>, vari<strong>et</strong>ies, recipe, <strong>et</strong>c.) and their respective<br />
level of <strong>in</strong>fluence on the PCF result (as shown on table 1).<br />
Moreover, a juridical analysis was carried out <strong>in</strong> order to confront the PCF systems to the regulation rules of<br />
the 4 ma<strong>in</strong> follow<strong>in</strong>g <strong>in</strong>ternational organisations: WTO, OECD, European Union, and FAO. Indeed, regard<strong>in</strong>g<br />
the specific French context about environmental labell<strong>in</strong>g, the issue was: can a mandatory environmental<br />
labell<strong>in</strong>g system for consumer products be authorised on the French mark<strong>et</strong> by <strong>in</strong>ternational organisations?<br />
Regard<strong>in</strong>g the risk of a comp<strong>et</strong><strong>in</strong>g distortion that would be a case of no-compliance with the rules of the<br />
world trade, the ma<strong>in</strong> conclusions from this juridical focus are that such systems cannot be imposed as mandatory<br />
by a country except if they fully respect three conditions:<br />
Transparency about the elaboration process of the standard (m<strong>et</strong>hodology for calculation): the elaboration<br />
process must reach an <strong>in</strong>ternational consensus and must be opened to all stakeholders.<br />
No-discrim<strong>in</strong>ation about orig<strong>in</strong>: results (PCF) must not lead to discrim<strong>in</strong>at<strong>in</strong>g products based on their<br />
production process and geographic orig<strong>in</strong>.<br />
Proportionality of the means regard<strong>in</strong>g the claimed objectives (encourage a susta<strong>in</strong>able consumption):<br />
such a system must not engage costs that could be judged to be excessive for companies, <strong>in</strong> particular<br />
SMEs.<br />
The study leads to the follow<strong>in</strong>g conclusions:<br />
The different PCF systems present a great diversity regard<strong>in</strong>g their respective features and <strong>in</strong> particular<br />
regard<strong>in</strong>g the applied m<strong>et</strong>hodologies<br />
There is a huge variability of the PCF of products, and some m<strong>et</strong>hodological divergences have been<br />
demonstrated. Furthermore, very little <strong>in</strong>formation is usually available and most of the systems are absolutely<br />
not transparent and thus are not compliant with the only <strong>in</strong>ternationally recognised standard (ISO<br />
14020). All these items lead to the conclusion that for a same product different PCF calculated with<strong>in</strong><br />
different systems are objectively not comparable. This can be problematic for customers when different<br />
systems co-exist <strong>in</strong> the same mark<strong>et</strong> (eg. <strong>in</strong> <strong>France</strong>).<br />
For now none of the exist<strong>in</strong>g labell<strong>in</strong>g systems could be considered compliant with the rules of the world<br />
trade for a state to make it compulsory.
GROUP 3, SESSION A: LABELLING, CONSUMERS, DIET 8 th Int. Conference on <strong>LCA</strong> <strong>in</strong> the<br />
Agri-<strong>Food</strong> Sector, 1-4 Oct <strong>2012</strong><br />
References<br />
Bolwig, S., Gibbon, P., 2009. Emerg<strong>in</strong>g product carbon footpr<strong>in</strong>t standards and schemes and their possible<br />
trade impacts. Report, 2009, Technical University of Denmark, DTU Climate Center.<br />
MAAPRAT, <strong>2012</strong>. Comparaison des ACV <strong>et</strong> affichages carbone utilisés sur les produits agroalimentaires –<br />
Etude technique <strong>et</strong> juridique. Report, EVEA and Sav<strong>in</strong> Mart<strong>in</strong><strong>et</strong> Associés, February <strong>2012</strong>.<br />
Figure 1. Comparison of milk carbon footpr<strong>in</strong>ts (g CO2 eq.) per 100 cl<br />
Table 1. Influence of param<strong>et</strong>ers on carbon footpr<strong>in</strong>ts.<br />
Param<strong>et</strong>er Product/ PCF system Level of <strong>in</strong>fluence<br />
Packag<strong>in</strong>g Sale unit Ham / Cas<strong>in</strong>o (<strong>France</strong>) Strong<br />
Storage (ambient<br />
temperature or frozen)<br />
Yaourt / Cas<strong>in</strong>o (<strong>France</strong>) Strong<br />
Ham / CFP (Japan) Weak<br />
Rice / CFP (Japan) Strong ?<br />
Potatoes / CRL Tesco (UK) Weak<br />
Milk / EPD ® (Sweden) Important<br />
Bread / EPD ® vs. others Weak<br />
French beans / Greenc. Info ® (<strong>France</strong>) Strong<br />
Type of production Organic vs conventionnal W<strong>in</strong>e / H. de Carbono (Spa<strong>in</strong>) Strong (up)<br />
W<strong>in</strong>e / EPD ® (Sweden) Important (down)<br />
Olive oil / H. de Carbono (Spa<strong>in</strong>) Strong (down)<br />
Milk / EPD ® (Sweden) Weak<br />
Milk / CFL (Korea) Strong (up)<br />
Rice / Climatop (Switzerland) Strong ?<br />
Dry vs. immersed Rice / Climatop (and CFP Japan ?) Strong<br />
777
GROUP 3, SESSION A: LABELLING, CONSUMERS, DIET 8 th Int. Conference on <strong>LCA</strong> <strong>in</strong> the<br />
Agri-<strong>Food</strong> Sector, 1-4 Oct <strong>2012</strong><br />
82. F<strong>in</strong>nish carbon footpr<strong>in</strong>t protocol “<strong>Food</strong>pr<strong>in</strong>t” for food products<br />
Juha-Matti Katajajuuri * , Hannele Pulkk<strong>in</strong>en, Hanna Hartika<strong>in</strong>en, Kristoffer Krogerus, Merja Saar<strong>in</strong>en, Frans<br />
Silvenius, Kirsi Usva, Heli Yrjänä<strong>in</strong>en<br />
MTT Agrifood Research F<strong>in</strong>land, Responsible <strong>Food</strong> Cha<strong>in</strong> – B<strong>et</strong>ter Consumer Well-be<strong>in</strong>g, FI 00790 Hels<strong>in</strong>ki,<br />
F<strong>in</strong>land Correspond<strong>in</strong>g author. E-mail: juha-matti.katajajuuri@mtt.fi<br />
In the <strong>Food</strong>pr<strong>in</strong>t - research project harmonised m<strong>et</strong>hodology for assess<strong>in</strong>g carbon footpr<strong>in</strong>ts of food products<br />
was developed <strong>in</strong> collaboration with the F<strong>in</strong>nish food sector <strong>in</strong> 2009-<strong>2012</strong>. Many <strong>in</strong>ternational standards,<br />
protocols and guides are published but no common approved standard nor communication m<strong>et</strong>hod evaluat<strong>in</strong>g<br />
food products’ climate impacts is available. In addition, the published ones are too generic and they do not<br />
give practical <strong>in</strong>structions for companies to produce comparable carbon footpr<strong>in</strong>ts.<br />
However, <strong>in</strong>ternational standardisation, developments and best practices on evaluat<strong>in</strong>g climate impacts of the<br />
food products’ entire life cycle were taken <strong>in</strong>to account when national specific guidel<strong>in</strong>es were prepared.<br />
Some of the most challeng<strong>in</strong>g issues tackled <strong>in</strong> the m<strong>et</strong>hodology and protocol work are described <strong>in</strong> this paper.<br />
There are many situations <strong>in</strong> assess<strong>in</strong>g carbon footpr<strong>in</strong>ts where decisions are often done case by case. These<br />
issues are critical as they affect comparability and the magnitude of carbon footpr<strong>in</strong>t results. Attributional<br />
approach was selected as s start<strong>in</strong>g po<strong>in</strong>t of the protocol. The m<strong>et</strong>hodology development work was carried<br />
out as an iterative process b<strong>et</strong>ween research, companies and other stakeholders to ensure practical m<strong>et</strong>hodology<br />
and implementation.<br />
To harmonise m<strong>et</strong>hodology and future carbon footpr<strong>in</strong>t assessments, d<strong>et</strong>ailed <strong>in</strong>structions were given to different<br />
life cycle phases and many clear requirements have been established. All life cycle phases from raw<br />
material extraction to waste treatment shall generally be <strong>in</strong>cluded. Different requirements were also made for<br />
cultivation and for animal production. Cut-off rules are also applied <strong>in</strong> the m<strong>et</strong>hodology and more d<strong>et</strong>ailed<br />
<strong>in</strong>structions for their use are given. Capital goods are excluded from the system boundaries.<br />
Present data quality requirements, particularly requirements on primary data, <strong>in</strong> current and draft <strong>in</strong>ternational<br />
guidel<strong>in</strong>es are seen <strong>in</strong>sufficient. Therefore, <strong>in</strong> the <strong>Food</strong>pr<strong>in</strong>t protocol more d<strong>et</strong>ailed requirements were<br />
applied separately for each life cycle phase. D<strong>et</strong>ailed <strong>in</strong>structions were given to each life cycle phase wh<strong>et</strong>her<br />
data shall be collected directly from a supply cha<strong>in</strong>, or gathered from national statistics, databases <strong>et</strong>c., and<br />
which are adequate data sources. The <strong>in</strong>tention was to harmonise the data requirements from agricultural<br />
phase <strong>in</strong> the protocol with the fairly comprehensive activity data, which is already collected by primary producers<br />
for other purposes <strong>in</strong> F<strong>in</strong>land.<br />
New updated emission factors were also developed. National emission factors for N2O emissions from agricultural<br />
soils derived from field measurements were launched <strong>in</strong> the project to describe b<strong>et</strong>ter national circumstances.<br />
This means that new default will give considerable higher emissions to gra<strong>in</strong>s and veg<strong>et</strong>ables<br />
(outdoor) grown <strong>in</strong> open fields due to the northern conditions.<br />
Another area of improvement and generation of defaults were national emission factors for different electricity<br />
production types. The protocol proposes that specific emissions factors related to the actual electricity<br />
supplier should be used. This means that when the production profile of the supplier is known (as <strong>in</strong> F<strong>in</strong>land<br />
is the case by law), the new national defaults for different production types shall be used.<br />
Different exist<strong>in</strong>g m<strong>et</strong>hodologies to <strong>in</strong>clude land use changes, especially deforestation, were also analysed<br />
based on the F<strong>in</strong>nish case studies. Emissions result<strong>in</strong>g from land use change were proved to have a large<br />
impact on the f<strong>in</strong>al carbon footpr<strong>in</strong>t of food products. Thus they shall be <strong>in</strong>cluded <strong>in</strong> the assessment, and<br />
presented separately from total results. The m<strong>et</strong>hodology and some practical guides are presented <strong>in</strong> the protocol<br />
and additional material of the project.<br />
It is seen that <strong>in</strong> the near future, when climate impacts are understood and tackled by companies and they<br />
have suitable tools for that, this also directs proactive companies to develop more comprehensive m<strong>et</strong>hods, to<br />
consider issues such as water and nutrient footpr<strong>in</strong>ts.<br />
778
GROUP 3, SESSION A: LABELLING, CONSUMERS, DIET 8 th Int. Conference on <strong>LCA</strong> <strong>in</strong> the<br />
Agri-<strong>Food</strong> Sector, 1-4 Oct <strong>2012</strong><br />
83. How to measure susta<strong>in</strong>able agriculture? The GLOBAL 2000<br />
adaptive susta<strong>in</strong>ability assessment approach for agricultural products<br />
Mart<strong>in</strong> Wildenberg * , Tanja Altaparmakova, Kew<strong>in</strong> Comploi, Dom<strong>in</strong>ik Friel<strong>in</strong>g, Lydia Matiasch, Helmut<br />
Burtscher<br />
Umweltforschungs<strong>in</strong>stitut GLOBAL 2000 / Friends of the Earth Austria, Neustiftgasse 36, 1070 Vienna,<br />
Austria, * Correspond<strong>in</strong>g author. E-mail: mart<strong>in</strong>.wildenberg@global2000.at<br />
Eco-labell<strong>in</strong>g has been suggested as an approach to manage towards a more susta<strong>in</strong>able world by several<br />
authors and organisations (e.g. de Snoo 2006, Bruce & Laroiya 2006, Rigby <strong>et</strong> al 2001, UNDP (CSD) 1996).<br />
Although approaches to “measure” susta<strong>in</strong>ability have often been criticised we follow the op<strong>in</strong>ion of Gomez-<br />
Limon & Sanchez-Fernandez (2010) that the “design and use of such <strong>in</strong>dicators can be extremely useful <strong>in</strong><br />
that they force those <strong>in</strong>volved <strong>in</strong> the discussion of susta<strong>in</strong>ability to identify the key aspects of susta<strong>in</strong>able<br />
agriculture and to assign weights to them.” In such a context the often very general and theor<strong>et</strong>ic discussions<br />
about susta<strong>in</strong>ability are confronted with real world practices and problems and are requested to come up with<br />
workable solutions and improvements.<br />
This poster presents the GLOBAL 2000 adaptive susta<strong>in</strong>ability assessment approach (ASAP), with which the<br />
environmental performance of agricultural products is measured from field to shelf. Also first product specific<br />
results and lessons learned dur<strong>in</strong>g the implementation phase will be presented.<br />
The aim of the approach is to arrive at a comprehensive understand<strong>in</strong>g of the environmental impacts of a<br />
certa<strong>in</strong> agricultural product and the connected life cycle. Furthermore, it strives to s<strong>et</strong> <strong>in</strong>centives for farmers<br />
to adopt a more susta<strong>in</strong>able production mode and to help consumers make deliberative consumption choices,<br />
by <strong>in</strong>form<strong>in</strong>g them about the environmental impacts of products.<br />
Five field-level based <strong>in</strong>dicators (N-balance, P-balance, humus-balance, pesticide use and energy <strong>in</strong>tensity)<br />
and five based on “material <strong>in</strong>put per service unit” (MIPS) <strong>in</strong>dicators (carbon-footpr<strong>in</strong>t, biotic and abiotic<br />
material <strong>in</strong>put, water <strong>in</strong>put and area used) are used. We calculate the <strong>in</strong>dicators based on date provided by<br />
each producer and company along the production cha<strong>in</strong>. The approach uses a stepwise process that explicitly<br />
<strong>in</strong>volves stakeholders <strong>in</strong> the ref<strong>in</strong>ement and adaptation of monitor<strong>in</strong>g and benchmark<strong>in</strong>g and serves as a discussion<br />
and knowledge transfer arena.<br />
Our m<strong>et</strong>hod is applied <strong>in</strong> the context of the REWE International AG, GLOBAL 2000 and Caritas Susta<strong>in</strong>ability<br />
Program for Fruits Veg<strong>et</strong>ables and Eggs and is used for the REWE label Pro Plan<strong>et</strong> (www.proplan<strong>et</strong>.at)<br />
<strong>in</strong> Austria. This program provided the necessary frame and <strong>in</strong>frastructure to further develop the<br />
m<strong>et</strong>hodology and tools <strong>in</strong> an applied context.<br />
References<br />
Bruce C. and A. Laroiya, 2007. The Production of Eco-Labels. Environmental and resource Dynamics, 36:<br />
275-293.<br />
de Snoo, G. R., 2006. Benchmark<strong>in</strong>g the Environmental Performances of Farms. The International Journal of<br />
Life Cycle Assessment, 11:22-25.<br />
Gomez-Limon, J.A., G. Sanchez-Fernandez, Empirical evaluation of agricultural susta<strong>in</strong>ability us<strong>in</strong>g composite<br />
<strong>in</strong>dicators, Ecological Economics, 69: 1062-1075.<br />
Rigby D., P. Woodhouse, T. Young, M. Burton, 2001. Construct<strong>in</strong>g a farm level <strong>in</strong>dicator of susta<strong>in</strong>able<br />
agricultural practice. Ecological Economicsm 39: 463-478.<br />
UNDP (CSD), 1996, Eco-label<strong>in</strong>g United Nations Commission on Susta<strong>in</strong>able Development. Available at:<br />
http://www.un.org/documents/ecosoc/cn17/1996/background/ecn171996-bp8.htm<br />
779
GROUP 3, SESSION A: LABELLING, CONSUMERS, DIET 8 th Int. Conference on <strong>LCA</strong> <strong>in</strong> the<br />
Agri-<strong>Food</strong> Sector, 1-4 Oct <strong>2012</strong><br />
780<br />
84. Product carbon footpr<strong>in</strong>t for a l<strong>in</strong>e of production of cookies<br />
C. Naranjo 1,* , O. López 2 , C. Montoya 2 , J. Leal 1<br />
1 Gaia Environmental Services, Medellín Colombia, 2 NOEL Cookie Company, Medellín Colombia, Correspond<strong>in</strong>g<br />
author. E-mail: cnaranjo@gaiasa.com<br />
A l<strong>in</strong>e of cookies, from a Lat<strong>in</strong>-American company, has been analysed <strong>in</strong> their life cycle, tak<strong>in</strong>g the impact<br />
on GHG emissions. A total of 16 references were analysed. The m<strong>et</strong>hodology used for the study was the<br />
PAS2050: 2008. The study <strong>in</strong>cludes the GHG emissions from materials extraction, transportation, manufactur<strong>in</strong>g,<br />
packag<strong>in</strong>g, use and disposal of packag<strong>in</strong>g.<br />
The study uses the Umberto for carbon footpr<strong>in</strong>t software ® v 1.2, with eco<strong>in</strong>vent 2.2 datas<strong>et</strong>s. Primary data<br />
from process are <strong>in</strong>cluded, tak<strong>in</strong>g energy consumptions for each stage, process and mass efficiency <strong>in</strong> lam<strong>in</strong>ation<br />
process and bak<strong>in</strong>g process.<br />
The cookies <strong>in</strong>cluded <strong>in</strong> the study are healthy l<strong>in</strong>e with less fat and less sugar content. This cookies uses raw<br />
materials like wheat flour, bran, oat flour, corn flour, palm oil, sugar and water. The bak<strong>in</strong>g uses natural gas.<br />
The packag<strong>in</strong>g of the product uses PET/BOPP/M<strong>et</strong>, PET/BOPP, Fold<strong>in</strong>g boxboard and Corrugated cardboard.<br />
In the study the distribution is <strong>in</strong> truck and distances are calculated with the sales registers for 2011.<br />
See Fig. 1 with the system for assessment.<br />
For a cookie raw materials account for 55-68% of the carbon footpr<strong>in</strong>t associated ma<strong>in</strong>ly with wheat flour,<br />
followed by product packag<strong>in</strong>g that represents b<strong>et</strong>ween 17 and 30%, the process is <strong>in</strong> b<strong>et</strong>ween 9 and 17%.<br />
The carbon footpr<strong>in</strong>t of each cookie depends of its formulation (Fig. 2).<br />
In the analysis, it appears that with<strong>in</strong> the same l<strong>in</strong>e of cookies can have different levels of bak<strong>in</strong>g and variables<br />
as the percentage of waste <strong>in</strong> the lam<strong>in</strong>ation and bak<strong>in</strong>g and dry<strong>in</strong>g curve for the product, become representative<br />
<strong>in</strong> the product's carbon footpr<strong>in</strong>t, due to <strong>in</strong>creased raw material requirements.<br />
Hav<strong>in</strong>g the overall product carbon footpr<strong>in</strong>t, it was multiplied by the total production, and it allows calculate<br />
the Product Carbon Footpr<strong>in</strong>t contribution for the l<strong>in</strong>e of cookies (Fig 3). The Honey reference has 41% of<br />
the total carbon footpr<strong>in</strong>t of the entire l<strong>in</strong>e; it is because it has the major sales.<br />
The wheat is the most important raw material for the cookie production and for the product carbon footpr<strong>in</strong>t<br />
too. The importance of this will be associated to the risk of one company aga<strong>in</strong>st climate change.<br />
Change traditional wheat for organic one, was evaluated, but the organic production is small and it cannot<br />
produce the enough raw material needed for the production of the company. Otherwise, the quality requirements<br />
of the organic wheat do not me<strong>et</strong> demands of the product.<br />
For the products uses different packag<strong>in</strong>g with alum<strong>in</strong>ium and it <strong>in</strong>creases the carbon footpr<strong>in</strong>t. The fold<strong>in</strong>g<br />
box board and the corrugated cardboard are very important <strong>in</strong> the emissions for the product.<br />
References<br />
Carbon Trust, DEFRA, BSI, 2008. PAS2050:2008. Specification for the assessment of the life cycle greenhouse gas emissions of goods and services. BSI: London, 43p.<br />
ISO. ISO 14040:2006. Environmental management -- Life cycle assessment -- Pr<strong>in</strong>ciples and framework<br />
ISO. ISO 14044:2006. Environmental management -- Life cycle assessment -- Requirements and guidel<strong>in</strong>es<br />
Bimpre, M. 2006. Life Cycle Assessment of the production of homemade and <strong>in</strong>dustrial bread <strong>in</strong> Sweden. KTH. 25 pages.
GROUP 3, SESSION A: LABELLING, CONSUMERS, DIET 8 th Int. Conference on <strong>LCA</strong> <strong>in</strong> the<br />
Agri-<strong>Food</strong> Sector, 1-4 Oct <strong>2012</strong><br />
Table 1. Carbon footpr<strong>in</strong>t contribution per life cycle stage (%).<br />
Figure 1. System diagram for cookie production<br />
Wheat mill<br />
4%<br />
Milk<br />
2%<br />
Process<br />
8%<br />
Palm Oil<br />
11%<br />
Sugar<br />
0.5%<br />
Distribution<br />
1%<br />
Packag<strong>in</strong>g<br />
15%<br />
Figure 2. Example for raw material contribution<br />
<strong>in</strong> the product carbon footpr<strong>in</strong>t<br />
Life Cycle Stage<br />
Raw<br />
Material<br />
Process<strong>in</strong>g Packag<strong>in</strong>g Distribution Disposal<br />
Sesame SKU1 63.7 17.0 16.5 2.4 0.3<br />
Sesame SKU2 61.2 16.2 19.2 3.0 0.3<br />
Oatmeal Chocolate<br />
SKU1<br />
65.0 10.0 22.1 2.6 0.4<br />
Oatmeal Chocolate<br />
SKU2<br />
62.2 10.1 25.2 2.1 0.3<br />
Oatmeal and Red<br />
Berries SKU1<br />
58.5 11.5 26.5 3.0 0.4<br />
Oatmeal and Red<br />
Berries SKU2<br />
56.5 11.0 29.2 2.9 0.4<br />
Oatmeal Granola<br />
SKU1<br />
59.9 12.4 24.4 2.9 0.4<br />
Oatmeal Granola<br />
SKU2<br />
54.9 11.2 30.5 3.0 0.4<br />
Chocolate Bs. 6x2 63.3 8.6 25.1 2.6 0.4<br />
Fruits and Cereals 67.2 11.1 18.7 2.9 0.1<br />
Gra<strong>in</strong> Fusion SKU1 63.2 15.4 18.2 2.8 0.3<br />
Gra<strong>in</strong> Fusion SKU2 66.5 10.6 19.3 3.1 0.6<br />
Honey SKU1 67.0 11.4 18.5 2.7 0.3<br />
Honey SKU2 67.6 11.5 17.6 2.7 0.5<br />
Vanilla 60.2 8.9 26.7 3.7 0.5<br />
Yogurt Strawberry Bs<br />
x 6<br />
55.1 14.3 27.0 3.2 0.5<br />
Disposal<br />
0%<br />
Wheat<br />
59%<br />
41%<br />
3%<br />
1% 2%<br />
5%<br />
1%<br />
Figure 3. Product carbon footpr<strong>in</strong>t contribution by reference.<br />
16%<br />
17%<br />
2% 1%<br />
2%<br />
3%<br />
3%<br />
1% 1%<br />
0%<br />
Sesame SKU1<br />
Sesame SKU2<br />
Oatmeal Chocolate SKU1<br />
Oatmeal Chocolate SKU2<br />
Oatmeal and Red Berries SKU1<br />
Oatmeal and Red Berries SKU2<br />
Oatmeal Granola SKU1<br />
Oatmeal Granola SKU2<br />
Chocolate Bs. 6x2<br />
Fruits and Cereals<br />
Gra<strong>in</strong> Fusion SKU1<br />
Gra<strong>in</strong> Fusion SKU2<br />
Honey SKU1<br />
Honey SKU2<br />
Va<strong>in</strong>illa<br />
Yogurt Strawberry Bs x 6<br />
781
GROUP 3, SESSION A: LABELLING, CONSUMERS, DIET 8 th Int. Conference on <strong>LCA</strong> <strong>in</strong> the<br />
Agri-<strong>Food</strong> Sector, 1-4 Oct <strong>2012</strong><br />
782<br />
85. <strong>LCA</strong> <strong>in</strong> organic and conventional product comparison: a review<br />
Matthias S. Meier 1,* , Christian Schader 1 , Franziska Stoessel 2<br />
1 FiBL - Research Institute of Organic Agriculture, Ackerstrasse, CH-5070 Frick, Switzerland, 2 ETH Zurich,<br />
Institute of Environmental Eng<strong>in</strong>eer<strong>in</strong>g, Schafmattstrasse 6, CH-8093 Zurich, Switzerland, Correspond<strong>in</strong>g<br />
author. E-mail: matthias.meier@fibl.org<br />
Life cycle assessment (<strong>LCA</strong>) is an important assessment tool to evaluate the environmental impacts of agricultural<br />
products. One focus of assessments with<strong>in</strong> agriculture has been the comparison of organic and conventional<br />
production systems to evaluate wh<strong>et</strong>her organic or conventional agricultural products are more<br />
environmental friendly. In different studies it has been shown that organic farm<strong>in</strong>g has benefits for the environment<br />
when focus<strong>in</strong>g on the farm<strong>in</strong>g practice (e.g. Mondelaers <strong>et</strong> al. 2009). However, when us<strong>in</strong>g <strong>LCA</strong> to<br />
calculate impacts on a per unit product basis organic products show higher impacts for certa<strong>in</strong> categories<br />
mostly due to lower yields. If they are calculated per area*time unit basis the impact is lower due to lower<br />
<strong>in</strong>puts of agricultural means. Though, there are studies show<strong>in</strong>g a b<strong>et</strong>ter performance of organic products for<br />
both functional units (e.g. the global warm<strong>in</strong>g potential of milk <strong>in</strong> Cederberg and Mattsson (2000) or<br />
Hörtenhuber <strong>et</strong> al. (2010)). Basically, there are two reasons for contradict<strong>in</strong>g results of <strong>LCA</strong> studies compar<strong>in</strong>g<br />
organic versus conventional products: Firstly, real differences <strong>in</strong> performance of organic and conventional<br />
products (from farm to farm and supply cha<strong>in</strong> to supply cha<strong>in</strong>) secondly, m<strong>et</strong>hodological artifacts<br />
with<strong>in</strong> <strong>LCA</strong>. To elucidate these presumed reasons we reviewed <strong>LCA</strong> studies on organically and conventionally<br />
grown products of different product groups (fruits and veg<strong>et</strong>ables, cereals, dairies and meat), systematically<br />
analys<strong>in</strong>g the param<strong>et</strong>ers listed <strong>in</strong> Table 1.<br />
We identified shortcom<strong>in</strong>gs on different levels that impair the comparison of <strong>LCA</strong> studies b<strong>et</strong>ween organic<br />
and conventional products. The most str<strong>in</strong>gent is that system-specific characteristics of organic agriculture<br />
are not fully reflected on the <strong>in</strong>ventory level, which can lead to bias <strong>in</strong> certa<strong>in</strong> impact categories (e.g.: climate<br />
change, eco-/human toxicity, photo-oxidant formation, acidification and eutrophication). This is either due to<br />
a lack of data or due to <strong>in</strong>sufficient data quality. For example calculations of nitrous oxide emissions do not<br />
consider the different transformation processes of organic fertilisers (which act ma<strong>in</strong>ly via the soil N pool)<br />
but treat them as m<strong>in</strong>eral fertilisers; heavy m<strong>et</strong>al contents of manure from organic farms are based on measurements<br />
of manure from conventional agriculture; or carbon sequestration usually is not <strong>in</strong>cluded or the<br />
<strong>in</strong>terdependence of the C- and N-fluxes <strong>in</strong> soils is not reflected. Further, currently used allocation rules<br />
with<strong>in</strong> the livestock sector (milk and meat) seem to bias <strong>LCA</strong> results from organic and conventional production<br />
systems (Flysjö <strong>et</strong> al. <strong>2012</strong>). S<strong>in</strong>ce milk and meat production are <strong>in</strong>terl<strong>in</strong>ked and changes <strong>in</strong> the one production<br />
will affect environmental impacts <strong>in</strong> the other system expansion should be used <strong>in</strong>stead of allocation.<br />
On the LCIA-level, environmental impact categories such as soil quality and functional biodiversity, which<br />
are important impact categories for the analysis of agricultural systems, are not considered when compar<strong>in</strong>g<br />
organic and conventional agriculture products. We conclude based on present <strong>LCA</strong>s that an <strong>in</strong>ter-comparison<br />
of products from organic and conventional agricultural products is difficult and improvements can be<br />
reached on the <strong>in</strong>ventory and impact assessment level. With such adaptions <strong>LCA</strong> can become even more<br />
important to evaluate the environmental impacts of agricultural products.<br />
References<br />
Cederberg, C., Mattsson, B., 2000. Life cycle assessment of milk production - a comparison of conventional<br />
and organic farm<strong>in</strong>g. J. Clean. Prod. 8, 49-60.<br />
Flysjö, Anna , Christel Cederberg, Maria Henriksson, and Stewart Ledgard. <strong>2012</strong>. The <strong>in</strong>teraction b<strong>et</strong>ween<br />
milk and beef production and emissions from land use change e critical considerations <strong>in</strong> life cycle assessment<br />
and carbon footpr<strong>in</strong>t studies of milk. J. Clea. Prod. 28, 134-142.<br />
Hörtenhuber, S., L<strong>in</strong>denthal, T., Amon, B., Markut, T., Kirner, L., Zollitsch, W., 2010. Greenhouse gas<br />
emissions from selected Austrian dairy production systems - model calculations consider<strong>in</strong>g the effects of<br />
land use change. Renewable Agric. <strong>Food</strong> Syst. 25, 316-329.<br />
Mondelaers, K., Aertsens, J., Van Huylenbroeck, G., 2009. A m<strong>et</strong>a-analysis of the differences <strong>in</strong> environmental<br />
impacts b<strong>et</strong>ween organic and conventional farm<strong>in</strong>g. Br. <strong>Food</strong> J. 111, 1098-1119.
GROUP 3, SESSION A: LABELLING, CONSUMERS, DIET 8 th Int. Conference on <strong>LCA</strong> <strong>in</strong> the<br />
Agri-<strong>Food</strong> Sector, 1-4 Oct <strong>2012</strong><br />
Table 1. Param<strong>et</strong>ers reviewed <strong>in</strong> the analysis of <strong>LCA</strong> studies.<br />
Param<strong>et</strong>er<br />
Attributional or consequential <strong>LCA</strong><br />
Goal of the study<br />
Temporal and geographical system boundaries chosen<br />
Functional unit(s) used<br />
Assumptions made regard<strong>in</strong>g agricultural production<br />
(<strong>in</strong>clud<strong>in</strong>g yields)<br />
Inventory data basis used<br />
Site-specific emission and characterisation factors<br />
used<br />
Allocation rules applied<br />
Impact categories assessed<br />
LCIA-m<strong>et</strong>hods used<br />
Sensitivity analyses to choices of m<strong>et</strong>hods conducted<br />
Uncerta<strong>in</strong>ty analyses of results conducted<br />
783
GROUP 3, SESSION A: LABELLING, CONSUMERS, DIET 8 th Int. Conference on <strong>LCA</strong> <strong>in</strong> the<br />
Agri-<strong>Food</strong> Sector, 1-4 Oct <strong>2012</strong><br />
784<br />
86. Environmental impacts and resource use <strong>in</strong> feed production for<br />
Atlantic salmon aquaculture<br />
Erik Skontorp Hognes 1,* , Friederike Ziegler 2 , Veronica Sund 2<br />
1 SINTEF Fisheries and aquaculture, Norway, 2 SIK- the Swedish Institute for <strong>Food</strong> and Biotechnology,<br />
Sweden, Correspond<strong>in</strong>g author. E-mail: erik.hognes@s<strong>in</strong>tef.no<br />
As a part of the development of salmon feeds with reduced content of fish meal and fish oil the occupation of<br />
agricultural land; mar<strong>in</strong>e primary-production-required; GHG emissions and cumulative energy demand was<br />
assessed for a s<strong>et</strong> of different feed di<strong>et</strong>s for Atlantic salmon. The assessments were performed with <strong>LCA</strong><br />
m<strong>et</strong>hodology and covered the salmon production system from grow<strong>in</strong>g and catch of feed <strong>in</strong>gredients till the<br />
salmon was ready for slaughter. The results were compared with Swedish chicken and pig production. Data<br />
on the feed compositions was delivered by the three of the world's largest salmon feed producers.<br />
<strong>LCA</strong>s of Norwegian seafood have ma<strong>in</strong>ly focused on potential climate impact and cumulative energy demand<br />
(W<strong>in</strong>thur <strong>et</strong> al., 2009). This project expanded the scope of environmental impacts by address<strong>in</strong>g the<br />
reliance on agricultural land and mar<strong>in</strong>e resources (Pell<strong>et</strong>ier and Tydemers, 2007), the latter by <strong>in</strong>clud<strong>in</strong>g the<br />
mar<strong>in</strong>e primary production required (PPR) to susta<strong>in</strong> the mar<strong>in</strong>e <strong>in</strong>gredients (Pauly and Christensen, 1995).<br />
The PPR was calculated by comb<strong>in</strong><strong>in</strong>g the trophic level of each fish species with catch location and average<br />
primary production per square m<strong>et</strong>er ocean surface for that location. This m<strong>et</strong>hod has important uncerta<strong>in</strong>ties<br />
from decid<strong>in</strong>g the tropic level of the species and the average primary production per surface area for each<br />
fish<strong>in</strong>g location.<br />
A salmon that is fed the average Norwegian feed di<strong>et</strong>, <strong>in</strong> 2010, has a carbon footpr<strong>in</strong>t of 2.6 kg CO2 equivalents;<br />
it occupies 3.3 m 2 agricultural land and requires 115 m 2 of sea primary-production area. Study<strong>in</strong>g both<br />
potential climate impact and primary production required made it possible to study trade-offs b<strong>et</strong>ween them,<br />
but also discover where there are no trade-offs. E.g. reduc<strong>in</strong>g the content of American mar<strong>in</strong>e <strong>in</strong>gredients<br />
would <strong>in</strong>crease both the carbon footpr<strong>in</strong>t and the PPR, s<strong>in</strong>ce the American species, used <strong>in</strong> these feeds, have<br />
a low trophic level and are sourced by very energy efficient fisheries.<br />
Increas<strong>in</strong>g or decreas<strong>in</strong>g the use of mar<strong>in</strong>e <strong>in</strong>gredients may alter the carbon footpr<strong>in</strong>ts by ± 7%. One reason<br />
for this is that the mar<strong>in</strong>e <strong>in</strong>gredients are replaced with soy prote<strong>in</strong> concentrate that is attributed with a high<br />
carbon footpr<strong>in</strong>t s<strong>in</strong>ce it contributes to deforestation. Deforestation has previously rarely been <strong>in</strong>cluded <strong>in</strong> the<br />
GHG assessment of salmon feed production.<br />
The comparison with pig and chicken concluded that salmon has the lowest climate impact and occupies the<br />
least agricultural land. Even an almost "veg<strong>et</strong>arian" salmon occupy less agricultural land than chicken. Pig<br />
had the highest carbon footpr<strong>in</strong>t and the highest occupation of agricultural land.<br />
Important parts of the current and future feeds are derived from by-products from fisheries (pelagic and<br />
whitefish species) and from poultry by-products, The use of by-products highlighted the importance of the<br />
allocation strategy, here mass allocation was used and thus the by-products contributed significantly to the<br />
carbon footpr<strong>in</strong>t and this highlights the importance of evaluat<strong>in</strong>g how future standards for GHG assessments<br />
should treat allocation requirements. This <strong>LCA</strong> study was part of a bigger project by Nofima Mar<strong>in</strong> on the<br />
resource utilisation and eco-efficiency of Norwegian salmon farm<strong>in</strong>g <strong>in</strong> 2010 (Ytrestøyl <strong>et</strong> al., 2011).<br />
References<br />
Pauly D, Christensen V. Primary production required to susta<strong>in</strong> global fisheries. Nature. 1995;374: 255-257.<br />
[With erratum from 376: 279]<br />
Pell<strong>et</strong>ier N, Tyedmers P. Feed<strong>in</strong>g farmed salmon: Is organic b<strong>et</strong>ter? Aquaculture. 2007;272(1-4):399-416.<br />
W<strong>in</strong>ther U, Ziegler F, Skontorp Hognes E, Emanuelsson A, Sund V, Ell<strong>in</strong>gsen H. Project report: Carbon<br />
footpr<strong>in</strong>t and energy use of Norwegian seafood products www.s<strong>in</strong>tef.no/Fiskeri-og-Havbruk-<br />
AS/Prosjekter/2011/Miljoregnskap-og-klimaspor<strong>in</strong>g-av-sjomat/. Trondheim, Norway: SINTEF Fisheries<br />
and aquaculture; 2009.<br />
Ytrestøyl T, Aas TS, Berge GM, Hatlen B, Sørensen M, Ruyter B, <strong>et</strong> al. Resource utilisation and ecoefficiency<br />
of Norwegian salmon farm<strong>in</strong>g <strong>in</strong> 2010 Norway: Nofima; 2011.
GROUP 3, SESSION A: LABELLING, CONSUMERS, DIET 8 th Int. Conference on <strong>LCA</strong> <strong>in</strong> the<br />
Agri-<strong>Food</strong> Sector, 1-4 Oct <strong>2012</strong><br />
Figure 1. Contribution to mar<strong>in</strong>e primary-production-required per kg edible salmon from 2010 di<strong>et</strong><br />
Figure 2. Total carbon footpr<strong>in</strong>t per kg edible product for each di<strong>et</strong>. 2010=Average Norwegian di<strong>et</strong> <strong>in</strong> 2010;<br />
HMI=High level of Mar<strong>in</strong>e Ingredients; NAMI=No American Mar<strong>in</strong>e Ingredients, VEG=Low content of<br />
mar<strong>in</strong>e <strong>in</strong>gredients; LAP=Use of poultry by-products.<br />
785
GROUP 3, SESSION A: LABELLING, CONSUMERS, DIET 8 th Int. Conference on <strong>LCA</strong> <strong>in</strong> the<br />
Agri-<strong>Food</strong> Sector, 1-4 Oct <strong>2012</strong><br />
786<br />
87. EPD of extra-virg<strong>in</strong> olive oil: an Italian experience<br />
Giulio Mario Cappell<strong>et</strong>ti 1 , Giuseppe Mart<strong>in</strong>o Nicol<strong>et</strong>ti 1 , Alessandro Leone 2 , Giuseppe Lopriore 3 , Carlo<br />
Russo *<br />
1 Dipartimento di Scienze Economico-Aziendali, Giuridiche, Merceologiche e Geografiche (SEAGMeG) –<br />
Università degli Studi di Foggia - Via Caggese, 1 – 71121 Foggia, Italy, 2 Dipartimento di Dipartimento di<br />
Scienze Agro-Ambientali, Chimica e Difesa Veg<strong>et</strong>ale (DiSACD) – Università degli Studi di Foggia - Via<br />
Napoli, 25 – 71122 Foggia, Italy, 3 Dipartimento di Scienze delle Produzioni e dell'Innovazione nei Sistemi<br />
Agro-alimentari Mediterranei (PRIME) – Università degli Studi di Foggia - Via Napoli, 25 – 71122 Foggia,<br />
Italy, Correspond<strong>in</strong>g author. E-mail: c.russo@unifg.it<br />
The Environmental Product Declaration (EPD) is a document based on the ISO 14025 standards; it conta<strong>in</strong>s<br />
<strong>in</strong>formation about environmental performance related to a product. The quantification of environmental performance<br />
is calculated us<strong>in</strong>g Life Cycle Assessment m<strong>et</strong>hodology, thus follow<strong>in</strong>g the pr<strong>in</strong>ciple guides of ISO<br />
14040 standards. Nowadays many EPDs have been issued by the International EPD System®, especially for<br />
the agro-food sector, due to the <strong>in</strong>creased <strong>in</strong>terest of companies and customers <strong>in</strong> this environmental communication<br />
tool. Recently, the EPD has also been made available for extra-virg<strong>in</strong> olive oil (PCR 2010).<br />
To obta<strong>in</strong> the EPD, <strong>LCA</strong> m<strong>et</strong>hodology was applied to the life cycle of a pitted extra-virg<strong>in</strong> olive oil packed<br />
<strong>in</strong> a 1-litre glass bottle. The functional unit (FU) is 1 litre of extra-virg<strong>in</strong> olive oil, while the system boundaries<br />
<strong>in</strong>clude: a) the olive production (agricultural phase), b) the transportation of the olives from the olive<br />
grove to the oil mill, c) the process used for produc<strong>in</strong>g pitted extra-virg<strong>in</strong> olive oil (<strong>in</strong>dustrial phase), d) the<br />
packag<strong>in</strong>g process <strong>in</strong>volv<strong>in</strong>g putt<strong>in</strong>g the oil <strong>in</strong>to 1-litre glass bottles, e) transportation to distribution, f) the<br />
“end of life” of the product and packag<strong>in</strong>g disposal. An allocation procedure was only carried out for the<br />
phases of olive oil extraction and packag<strong>in</strong>g (CORE); this dist<strong>in</strong>guished b<strong>et</strong>ween: olive oil, pomace and pit.<br />
Allocation was calculated consider<strong>in</strong>g two factors: mass and economic value of the co-product.<br />
Data referr<strong>in</strong>g to the production of the raw material are all primary data, exception for the <strong>in</strong>formation about<br />
fuels, lubricants, and mach<strong>in</strong>es, for which the eco<strong>in</strong>vent v.2 database was used. As for transportation, distances<br />
were estimated by referr<strong>in</strong>g to average values, while emissions were calculated by us<strong>in</strong>g the PE –<br />
International database (updated July 2010). Data relat<strong>in</strong>g to olive oil production are all primary data directly<br />
collected <strong>in</strong> the oil mill. As far as electricity production is concerned, the Italian power grid mix derives from<br />
the literature (AEEG and GSE, 2011). Data referr<strong>in</strong>g to packag<strong>in</strong>g production comes from the Plastic Europe<br />
and PE-International database. As for the “use phase”, the percentages of recovery and landfill disposal of<br />
glass, as well as the data regard<strong>in</strong>g cardboard and plastic, derive from reports published by the National<br />
Packag<strong>in</strong>g Consortium. Collected data were elaborated us<strong>in</strong>g GaBi 4.4 software, with reference to the functional<br />
unit represented by 1 litre of pitted extra-virg<strong>in</strong> olive oil (weigh<strong>in</strong>g 0.92 kg) packed <strong>in</strong> a 1-L glass bottle.<br />
To obta<strong>in</strong><strong>in</strong>g one litre of extra-virg<strong>in</strong> olive oil, 5.29 kg of olives, harvested on a surface of 18.9 m 2 , are<br />
needed. In accordance with the <strong>in</strong>dications of PCR clause 10, an environmental impact assessment was carried<br />
out dist<strong>in</strong>guish<strong>in</strong>g the use of resources, potential environmental impact and other <strong>in</strong>dicators. The agricultural<br />
phase would benefit from more non-renewable material and energy resources, while the extraction<br />
process requires more renewable material resources, water and electricity. F<strong>in</strong>ally, the packag<strong>in</strong>g phase<br />
would need more renewable energy resources. The feedstock energy is only l<strong>in</strong>ked to the PVC production: it<br />
is almost 0.003 kg of crude oil and 0.002 kg of natural gas per functional unit.<br />
As for the assessment of the potential environmental impacts, the Global Warm<strong>in</strong>g Potential (GWP) is more<br />
affected by the agricultural phase, followed by the packag<strong>in</strong>g phase. This impact derives from the fuel consumption<br />
(for the soil cultivation) and from the production process of the primary packag<strong>in</strong>g (glass bottle<br />
and PVC capsule). The value of CO2 equiv. per FU is over 1 kg, and over 50% of this derives from the oliveproduction<br />
while 30% derives from the packag<strong>in</strong>g: The same trend is d<strong>et</strong>ected for the categories of Acidification,<br />
Photochemical Ozone Creation and Abiotic Depl<strong>et</strong>ion, while, as far as the Ozone Layer Depl<strong>et</strong>ion is<br />
concerned, the packag<strong>in</strong>g phase is the most pollutant. As for Eutrophication, the most pollutant phase is the<br />
olive oil extraction, due, <strong>in</strong> particular, to the higher pollutant charge of the wastewater (wash<strong>in</strong>g water, veg<strong>et</strong>ation<br />
water and water added <strong>in</strong> the extraction process). Analyz<strong>in</strong>g the impact calculated as kg of phosphate<br />
equiv., almost 90% of the total value per FU (about 16 g) is l<strong>in</strong>ked to the extraction phase (wastewater).<br />
As for the impact categories referr<strong>in</strong>g to toxicity, except for Terrestial Ecotoxicity, the packag<strong>in</strong>g phase is<br />
aga<strong>in</strong> the most pollutant. Here too, the explanation is l<strong>in</strong>ked to the production of the glass conta<strong>in</strong>er, which<br />
accounts for over 80% of the total impact.
GROUP 3, SESSION A: LABELLING, CONSUMERS, DIET 8 th Int. Conference on <strong>LCA</strong> <strong>in</strong> the<br />
Agri-<strong>Food</strong> Sector, 1-4 Oct <strong>2012</strong><br />
The analysis of the environmental performance <strong>in</strong>cludes the assessment of the impact categories of Land Use<br />
by us<strong>in</strong>g the Eco-<strong>in</strong>dicator-99 (Land Use and Land Conversion) and IMPACT 2002+ (Land Occupation)<br />
evaluation m<strong>et</strong>hods. For all these categories, over 90% of the total impact derives from the agricultural<br />
phase. Then other <strong>in</strong>dicators are analysed; the “Material subject for recycl<strong>in</strong>g or other use” category <strong>in</strong>cludes<br />
prun<strong>in</strong>g residues (agricultural phase), leaves and little branches (extraction phase) and recycled packag<strong>in</strong>g<br />
(glass, plastic and cardboard). The production of “Hazardous and environmentally active waste” is nil, as is<br />
the production of toxic emissions. With regard to other types of waste, the wastewater deriv<strong>in</strong>g from the<br />
extraction phase and the waste disposed <strong>in</strong> landfill (not recycled) must be <strong>in</strong>dicated. F<strong>in</strong>ally, prun<strong>in</strong>g residues<br />
and by-products of the olive oil extraction (leaves and little branches, pomace and pit) are <strong>in</strong>cluded among<br />
the waste that could be recovered as renewable energy.<br />
The <strong>LCA</strong> study enables us to d<strong>et</strong>ect some improvements which could be adopted for the agricultural phase<br />
(as reduc<strong>in</strong>g to the m<strong>in</strong>imum the employment of non-renewable energy resources and water, preserve the<br />
fertility of the soil or recover<strong>in</strong>g the energy value of prun<strong>in</strong>g residues, by the controlled burn<strong>in</strong>g carried out<br />
<strong>in</strong> a boiler for the thermal energy production) and for the processes of olive oil extraction and packag<strong>in</strong>g, (as<br />
improv<strong>in</strong>g the management of waste and wastewater dur<strong>in</strong>g the extraction phase or study<strong>in</strong>g other types of<br />
conta<strong>in</strong>er). While <strong>in</strong> order to reduce the environmental impact of the end of life, efforts must be made to<br />
improve the communication with consumers, by stat<strong>in</strong>g more <strong>in</strong>formation on the label, with the aim to guide<br />
consumers towards susta<strong>in</strong>able m<strong>et</strong>hods of packag<strong>in</strong>g disposal.<br />
The critical analysis of PCR developed by the International EDP® System aims to elaborate some consideration<br />
about the possibility of Italian firms adopt<strong>in</strong>g these rules or submitt<strong>in</strong>g to some modifications after the<br />
expiry date (31 Dec 2013), on the basis of elements which are more representative of the Italian olive oil<br />
<strong>in</strong>dustries. From this critical analysis we can assert that PCR could be adopted by the Italian olive oil firms<br />
without any particular problems. As for the environmental performance developed <strong>in</strong> paragraph 10 of PCR,<br />
some suggestions might be made <strong>in</strong> order to expla<strong>in</strong> the impact of toxicity and land use b<strong>et</strong>ter. The analysis<br />
of toxicity would be more compl<strong>et</strong>e if the two toxicity categories developed by Ralph K. Rosenbaum <strong>et</strong> al. <strong>in</strong><br />
the UseTox m<strong>et</strong>hod are considered (Ralph <strong>et</strong> al., 2008): Human Toxicity (expressed as no. of cases x kg) and<br />
Freshwater Ecotoxicity (expressed as kg DCB-equiv.). These suggestions could be relevant <strong>in</strong> consideration<br />
of the need to assess the toxicity for the processes <strong>in</strong> which there is an agricultural phase <strong>in</strong>volv<strong>in</strong>g a high<br />
impact <strong>in</strong> terms of toxicity, deriv<strong>in</strong>g from the use of pesticides.<br />
In the same way, as for the land use categories, <strong>in</strong>dicators could be b<strong>et</strong>ter shown, as Baitz (2002) suggests,<br />
by dist<strong>in</strong>guish<strong>in</strong>g: Erosion Resistance; Mechanical Filtration; Physicochemical Filtration; Groundwater Replenishment;<br />
Biotic Production. F<strong>in</strong>ally, some considerations regard<strong>in</strong>g the CO2 balance; to achieve a correct<br />
balance, the CO2 quantity immobilised <strong>in</strong>to soil from olive trees and herbaceous biomass (w<strong>in</strong>ter and spr<strong>in</strong>g<br />
weeds, grass cover <strong>et</strong>c) should be <strong>in</strong>dicated. Frequently, this <strong>in</strong>formation is not <strong>in</strong>dicated, or only partially,<br />
due to the lack of experimental data able to evaluate it <strong>in</strong> an appropriate way, even if some studies (Sofo <strong>et</strong><br />
al., 2005) d<strong>et</strong>erm<strong>in</strong>ed for Mediterranean areas the year-1 of CO2 fixed <strong>in</strong> an olive grove.<br />
References (selected)<br />
Alberti F., Neri P., Cecch<strong>in</strong>i F. 2005. <strong>LCA</strong> applied to the Olive Oil Cha<strong>in</strong> – standard study (<strong>in</strong> Italian). Thesis<br />
of Master <strong>in</strong> Environmental Development and Management of the Agro-Environmental Systems. University<br />
of Bologna, ENEA-PROT-P135-100.<br />
Baitz, M. 2002: Die Bedeutung der funktionsbasierten Charakterisierung von Flächen-Inanspruchnahmen <strong>in</strong><br />
<strong>in</strong>dustriellen Prozessk<strong>et</strong>tenanalysen. E<strong>in</strong> Beitrag zur ganzheitlichen Bilanzierung. Dissertation. Shaker<br />
(Berichte aus der Umwelttechnik), Aachen<br />
Carli G. 2002. The Environmental Impact of the Olive Oil Production: application of the Life Cycle Assessment<br />
(<strong>LCA</strong>) m<strong>et</strong>hodology (<strong>in</strong> Italian).<br />
International EPD Consortium (IEC). 2009. General Programme Instructions for Environmental Product<br />
Declaration EPD, Version 1.0, of 29/02/2009.<br />
PCR 2010:07; CPC 21537 – PCR for virg<strong>in</strong> olive oil and its fractions; ver. 1.0, 2010-04-27.<br />
787
GROUP 3, SESSION A: LABELLING, CONSUMERS, DIET 8 th Int. Conference on <strong>LCA</strong> <strong>in</strong> the<br />
Agri-<strong>Food</strong> Sector, 1-4 Oct <strong>2012</strong><br />
788<br />
88. Communication strategies for product susta<strong>in</strong>ability messag<strong>in</strong>g<br />
aimed at end consumers<br />
Thomas Redd 1,* , Doug Harrison 2 , Laura Riley 2 , Greg Thoma 3<br />
1 The Susta<strong>in</strong>ability Consortium, jo<strong>in</strong>tly adm<strong>in</strong>istered by Arizona State University and University of Arkansas,<br />
USA, 2 Harrison Group Inc., 3 University of Arkansas, USA, Correspond<strong>in</strong>g author. E-mail:<br />
tredd@asu.edu<br />
The proliferation of communication guidel<strong>in</strong>es for environmental claims and conflict<strong>in</strong>g eco-labell<strong>in</strong>g<br />
schemes has caused <strong>in</strong>dustry organisations to acknowledge the need to provide consumers with a more harmonised<br />
s<strong>et</strong> of susta<strong>in</strong>ability labels and claims <strong>in</strong> the mark<strong>et</strong>place (Ryan Partnership Chicago/Mambo<br />
Sprouts Mark<strong>et</strong><strong>in</strong>g, 2011). Government and <strong>in</strong>dustry organisations also widely recognise the need for more<br />
scientific research to help us understand how to effectively communicate susta<strong>in</strong>ability <strong>in</strong>formation to endconsumers<br />
(Ernst & Young, 2009; Galatola, 2011; Ryan Partnership Chicago/Mambo Sprouts Mark<strong>et</strong><strong>in</strong>g,<br />
2011). Initial reports conclude that consumers prefer to be presented with grades or scores of a product’s<br />
susta<strong>in</strong>ability performance, rather than the absolute values, ratios, and physical units found <strong>in</strong> most <strong>LCA</strong><br />
studies (Ernst & Young, 2009). Consumers’ <strong>in</strong>tent to use product level susta<strong>in</strong>ability disclosures is also<br />
highly dependent on the message be<strong>in</strong>g presented at the po<strong>in</strong>t of sale and verified by an <strong>in</strong>dependent organisation<br />
(Ernst & Young, 2009; Ryan Partnership Chicago/Mambo Sprouts Mark<strong>et</strong><strong>in</strong>g, 2011).<br />
Build<strong>in</strong>g on these <strong>in</strong>dustry reports, The Susta<strong>in</strong>ability Consortium launched an applied research project to<br />
answer some of the key questions posed by lead<strong>in</strong>g r<strong>et</strong>ailers and brand manufactures <strong>in</strong> the Consumer Goods<br />
<strong>in</strong>dustry. This particular empirical study seeks to understand, from a consumer’s perspective, how the design<br />
and format of <strong>LCA</strong>-generated scores presented with products at the po<strong>in</strong>t of sale affects the message’s understand-ability,<br />
believability, comparability, and usability. Researchers also attempt to measure consumer preferences<br />
for 13 susta<strong>in</strong>ability attributes (Fig. 1) and 22 messag<strong>in</strong>g formats (Fig. 2) on product level disclosures.<br />
To exam<strong>in</strong>e variance <strong>in</strong> consumer preferences across product categories, the attribute and format variables<br />
are tested <strong>in</strong> comb<strong>in</strong>ation with five different product category variables such as cereal, paper towels,<br />
and laundry d<strong>et</strong>ergent. Variance <strong>in</strong> consumer preferences across geo-political scales is also exam<strong>in</strong>ed by<br />
sampl<strong>in</strong>g consumers from four different sovereign nations, <strong>in</strong>clud<strong>in</strong>g <strong>France</strong>.<br />
Qualitative and quantitative results from ten focus group sessions and three onl<strong>in</strong>e surveys suggest there are<br />
ample opportunities for establish<strong>in</strong>g scientifically-grounded best practices for communicat<strong>in</strong>g <strong>LCA</strong>generated<br />
<strong>in</strong>formation. From a global perspective, the data <strong>in</strong>dicates 1) the presence of a scor<strong>in</strong>g scale and<br />
attributes with a positive tone are critical for establish<strong>in</strong>g understand-ability among consumers 2) consumers<br />
are most likely to prefer a messag<strong>in</strong>g format that’s grounded <strong>in</strong> the percentages scor<strong>in</strong>g technique 3) scores<br />
accompanied by stoplight colour cod<strong>in</strong>g that identifies three thresholds of relative <strong>in</strong>dustry performance substantially<br />
enhance usability. Further research is ongo<strong>in</strong>g and scheduled for compl<strong>et</strong>ion <strong>in</strong> May, <strong>2012</strong>.<br />
References<br />
Ernst & Young, 2009. Pistes pour un <strong>et</strong>iqu<strong>et</strong>age environnemental lisible <strong>et</strong> efficace – Resultat d’enqu<strong>et</strong>e<br />
consommatuer.<br />
Galatola, M., 2011. The role of the ILCD Handbook as m<strong>et</strong>hodological basis for robust life cycle based environmental<br />
policies, SETAC 2011. Milan<br />
Ryan Partnership Chicago/Mambo Sprouts Mark<strong>et</strong><strong>in</strong>g, 2011. One Green Score for One Earth Consumer Susta<strong>in</strong>ability<br />
Survey.
GROUP 3, SESSION A: LABELLING, CONSUMERS, DIET 8 th Int. Conference on <strong>LCA</strong> <strong>in</strong> the<br />
Agri-<strong>Food</strong> Sector, 1-4 Oct <strong>2012</strong><br />
Figure 1. A sample of the susta<strong>in</strong>ability attributes<br />
Figure 2. An example of one of the messag<strong>in</strong>g formats<br />
789
GROUP 3, SESSION A: LABELLING, CONSUMERS, DIET 8 th Int. Conference on <strong>LCA</strong> <strong>in</strong> the<br />
Agri-<strong>Food</strong> Sector, 1-4 Oct <strong>2012</strong><br />
790<br />
89. The good egg <strong>in</strong> the bask<strong>et</strong>: improvements <strong>in</strong> egg production<br />
with<strong>in</strong> the Pro Plan<strong>et</strong> eco-labell<strong>in</strong>g scheme<br />
Kew<strong>in</strong> Comploi * , Mart<strong>in</strong> Wildenberg, Tanja Altaparmakova, Dom<strong>in</strong>ik Friel<strong>in</strong>g, Lydia Matiasch, Helmut<br />
Burtscher<br />
Umweltforschungs<strong>in</strong>stitut GLOBAL 2000 / Friends of the Earth Austria, Neustiftgasse 36, 1070 Vienna,<br />
Austria, * Correspond<strong>in</strong>g author. E-mail: kew<strong>in</strong>.comploi@global2000.at<br />
Eco-labell<strong>in</strong>g has often been proposed as a valuable <strong>in</strong>strument for the implementation of higher environmental<br />
and social standards. For <strong>in</strong>stance, Gereffi <strong>et</strong> al. (<strong>in</strong> Honey 2002, p.51) suggest that “While certification<br />
will never replace the state, it is quickly becom<strong>in</strong>g a powerful tool for promot<strong>in</strong>g worker [...] rights and<br />
protect<strong>in</strong>g the environment <strong>in</strong> an era of free trade”.<br />
The poster shows actual quantifiable improvements <strong>in</strong> egg production us<strong>in</strong>g the GLOBAL 2000 adaptive<br />
susta<strong>in</strong>ability assessment approach. The results are based on five <strong>in</strong>dicators (carbon-footpr<strong>in</strong>t, biotic and abiotic<br />
material <strong>in</strong>put, water <strong>in</strong>put and area used) calculated for the most relevant stages of the product life<br />
cycle. For example, it can be illustrated that the mere replacement of Brazilian soy with soy produced <strong>in</strong> the<br />
EU more than halves greenhouse gas emissions of the whole egg production process due to different land use<br />
patterns (cf. Hörtenhuber and Zollitsch, 2010; Nemecek and Kägl, 2007). This co<strong>in</strong>cides with favourable<br />
conditions for ris<strong>in</strong>g European soy production: first, the latest price <strong>in</strong>creases on the mark<strong>et</strong>; second, the<br />
spread<strong>in</strong>g of the corn woodworm <strong>in</strong> some European countries and the need for crop rotation to avoid extensive<br />
use of nicot<strong>in</strong>iod-based <strong>in</strong>secticides.<br />
Both the m<strong>et</strong>hod used and the results refer to the eco-label Pro Plan<strong>et</strong> (www.pro-plan<strong>et</strong>.at) as part of the<br />
REWE International AG, GLOBAL 2000 and Caritas Susta<strong>in</strong>ability Program for Fruits, Veg<strong>et</strong>ables and<br />
Eggs.<br />
References<br />
Honey, M., 2002. Ecotourism and certification: s<strong>et</strong>t<strong>in</strong>g standards <strong>in</strong> practice; Island Press<br />
Hörtenhuber, S. and Zollitsch, W., 2010. Greenhouse gas emissions of regionally produced alternative feedstuffs<br />
rich <strong>in</strong> prote<strong>in</strong> for Austrian dairy production. In: Build<strong>in</strong>g susta<strong>in</strong>able rural futures, IFSA, Vienna,<br />
pp. 1349-1356.<br />
Nemecek, T. and Kägl, T., 2007. Life Cycle Inventories of Swiss and European Agricultural Production Systems.<br />
F<strong>in</strong>al report evo<strong>in</strong>vent V2.0 No 15a. Agroscope Reckenholz-Taenikon Research Station ART,<br />
Swiss Centre for Susta<strong>in</strong>able Life Cycle Inventories, Zurich ans Dübendorf, Switzerland.
GROUP 3, SESSION A: LABELLING, CONSUMERS, DIET 8 th Int. Conference on <strong>LCA</strong> <strong>in</strong> the<br />
Agri-<strong>Food</strong> Sector, 1-4 Oct <strong>2012</strong><br />
90. Carbon labels worldwide- a review of approaches and <strong>in</strong>dices<br />
Michael M. Blanke * , Florian Schaefer<br />
INRES – University of Bonn, Auf dem Hüegel 6, D-53121 Bonn, Germany, Correspond<strong>in</strong>g author. E-mail:<br />
mmblanke@uni-bonn.de<br />
This contribution does not provide a simple summary of carbon labels worldwide, but a critical review of<br />
exist<strong>in</strong>g <strong>in</strong>ternational labell<strong>in</strong>g policies and their background and ways of communicat<strong>in</strong>g their <strong>LCA</strong> foods<br />
results to the consumer. Advantages and disadvantages from both the manufacturer and consumer angle are<br />
presented.<br />
Carbon Footpr<strong>in</strong>t is a tool to allocate products or services a numeric value for their specific impact on climate<br />
change based on Life Cycle Assessment (<strong>LCA</strong>). Account<strong>in</strong>g greenhouse gas emissions over the whole<br />
life cycle of products or services allows allocat<strong>in</strong>g each product a unique Carbon Footpr<strong>in</strong>t. This is a first<br />
steps to communicate the susta<strong>in</strong>ability performance of products or services to the consumer.<br />
A thorough mark<strong>et</strong> analysis conducted <strong>in</strong> 2011 resulted <strong>in</strong> the categorisation of seven schemes, <strong>in</strong>to which<br />
the carbon labell<strong>in</strong>g and consumer communication of carbon footpr<strong>in</strong>t <strong>LCA</strong> <strong>Food</strong>s results can be categorised:<br />
(1) Presentation or label of a s<strong>in</strong>gle static numeric value on the product <strong>in</strong> the shop; examples are activities<br />
by the Carbon Trust, UK and the s<strong>in</strong>gle carbon footpr<strong>in</strong>t value as operated by Tesco’s supermark<strong>et</strong>s <strong>in</strong> the<br />
UK (but not <strong>in</strong> Tesco’s stores abroad). However, this labell<strong>in</strong>g policy is restricted to ca. 20 food and nonfood<br />
products (orange juice, skimmed milk, Walker’s crisps, sliced bread, and light bulbs as the non-food<br />
product) out of their ca. 70,000 <strong>in</strong>-store products viz 0.03% of products on offer. A similar policy is operated<br />
by KEITI with their “CO2 low label” or “COOL” <strong>in</strong> South Korea. The consumer, however, may f<strong>in</strong>d it difficult<br />
to judge and memorise numeric values, particularly if expressed on different units (e.g. pack<strong>et</strong> size, litre,<br />
100 g). Similar schemes operate <strong>in</strong> Thailand and Japan.<br />
(2) Carbon reduction labels (Climatop) offer an answer or alternative to the static CO2 value. They <strong>in</strong>dicate<br />
the activity <strong>in</strong> the field of carbon footpr<strong>in</strong>t, without giv<strong>in</strong>g a s<strong>in</strong>gle static CO2 value. Climatop <strong>in</strong> Switzerland<br />
is presented as an example and labels for green and white asparagus are discussed. Climatop labels have a<br />
life-span of two years, which encourages the manufacturer to further improve the carbon footpr<strong>in</strong>t.<br />
(3) The colour schemes offer another alternative, where consumers do not need to memorise or <strong>in</strong>terpr<strong>et</strong> a<br />
carbon label. The French Cas<strong>in</strong>o supermark<strong>et</strong>s react to the French carbon footpr<strong>in</strong>t laws, “Grenelle 2” and<br />
Grenelle 2” by operat<strong>in</strong>g a green- yellow colour code called ‘Indice Carbone’, where the product is visually<br />
ranked with<strong>in</strong> the best and worst product <strong>in</strong> the mark<strong>et</strong>.<br />
(4) Air freight labels on the produce, operated by Tesco and Marks and Spencer <strong>in</strong> the UK (and KaDeWe <strong>in</strong><br />
Germany and CoOp , Switzerland) <strong>in</strong>dicate the food items with the largest carbon footpr<strong>in</strong>t, are easy to handle<br />
by the supermark<strong>et</strong>s and understand by the consumer; they also give regional produce a chance, if with<strong>in</strong><br />
that season.<br />
(5) Carbon Zero <strong>in</strong>itiatives like the CarboNZero <strong>in</strong> New Zealand and CarbonFree <strong>in</strong> the USA may cause<br />
ambiguity and the consumer th<strong>in</strong>k the production of this particular food is carbon neutral. These schemes,<br />
however, are based on a thorough carbon footpr<strong>in</strong>t or compl<strong>et</strong>e <strong>LCA</strong> and subsequent purchase of golden<br />
carbon certificates.<br />
(6) QR codes on the products are a fairly new alternative s<strong>in</strong>ce 2011, where the new generation of mobile<br />
phones access the <strong>in</strong>tern<strong>et</strong> <strong>in</strong> the shop and relevant <strong>in</strong>formation is available e.g. for a carbon footpr<strong>in</strong>t, which<br />
varies seasonally or the <strong>LCA</strong> is more complicated than a s<strong>in</strong>gle value.<br />
(7) Susta<strong>in</strong>ability reports are the last option, favoured e.g. by companies <strong>in</strong> Germany, to report their carbon<br />
footpr<strong>in</strong>t both <strong>in</strong> the pr<strong>in</strong>ted and onl<strong>in</strong>e versions of their susta<strong>in</strong>ability report, which have to follow the standards<br />
and guidel<strong>in</strong>es for susta<strong>in</strong>ability reports, e.g. by dnv.<br />
791
GROUP 3, SESSION A: LABELLING, CONSUMERS, DIET 8 th Int. Conference on <strong>LCA</strong> <strong>in</strong> the<br />
Agri-<strong>Food</strong> Sector, 1-4 Oct <strong>2012</strong><br />
Table 1. Overview of carbon footpr<strong>in</strong>t /water footpr<strong>in</strong>t / <strong>LCA</strong> <strong>Food</strong>s results to the consumer.<br />
Types of communicat<strong>in</strong>g carbon Examples of schemes or or- Examples <strong>in</strong> the food sector<br />
footpr<strong>in</strong>t /<strong>LCA</strong> food results to<br />
the consumer<br />
ganisations<br />
(1) carbon value on produce a Tesco<br />
Milk, orange juice, bread, sugar,<br />
“COOL” by KEITI, S. Korea potato crisps<br />
(2 ) Carbon reduction label Climatop, Switzerland sugar<br />
(3) Colour schemes (green to<br />
yellow)<br />
Cas<strong>in</strong>o <strong>France</strong> All products on offer.<br />
(4) Air freight labels on produce Marks & Spencer (UK), Tesco Asparagus, pittaya, p<strong>in</strong>eapple,<br />
(UK), KadeWe (D), Coop (CH) lemon grass<br />
(5) Carbon Zero or Carbon-free CarboNZero, New Zealand<br />
<strong>in</strong>itiatives<br />
CarbonFree, USA<br />
(6) QR codes on produce or package<br />
Announced for the future<br />
(7) Susta<strong>in</strong>ability reports e.g. Unilever, Barilla <strong>et</strong>c. All products<br />
792
GROUP 3, SESSION A: LABELLING, CONSUMERS, DIET 8 th Int. Conference on <strong>LCA</strong> <strong>in</strong> the<br />
Agri-<strong>Food</strong> Sector, 1-4 Oct <strong>2012</strong><br />
91. <strong>Food</strong> waste amounts and avoidability <strong>in</strong> Switzerland<br />
Claudio Ber<strong>et</strong>ta 1,* , Franziska Stoessel 1 , Stefanie Hellweg 1 , Urs Baier 2<br />
1 ETH Zurich, Institute of Environmental Eng<strong>in</strong>eer<strong>in</strong>g, Schafmattstrasse 6, CH-8093 Zurich, Switzerland 2<br />
ZHAW Wädenswil, Life Sciences und Facility Management, E<strong>in</strong>siedlerstrasse 29, CH-8820 Wädenswil,<br />
Switzerland, Correspond<strong>in</strong>g author. E-mail: cber<strong>et</strong>ta@<strong>et</strong>hz.ch<br />
A key element <strong>in</strong> mak<strong>in</strong>g our food system more efficient and susta<strong>in</strong>able is the reduction of food losses<br />
across the entire food cha<strong>in</strong> (Quested and Johnson, 2009). Nevertheless, <strong>in</strong> many <strong>LCA</strong> analyses food losses<br />
are miss<strong>in</strong>g. The first step <strong>in</strong> develop<strong>in</strong>g efficient measures is the analysis of the present situation and the<br />
identification of hotspots. This paper aims to quantify the food losses <strong>in</strong> Switzerland at the various stages of<br />
the food cha<strong>in</strong> (agricultural production, postharvest handl<strong>in</strong>g and trade, process<strong>in</strong>g, food service <strong>in</strong>dustry,<br />
r<strong>et</strong>ail, and households), to identify hotspots and analyse the reasons for the losses. Twenty-two food categories<br />
are modelled separately <strong>in</strong> a mass and energy flow analysis, based on data from 31 companies with<strong>in</strong> the<br />
Swiss food cha<strong>in</strong>, as well as from public <strong>in</strong>stitutions, associations, and from literature.<br />
The energy balance shows that 48% of the total produced calories (edible crop yields at harvest time and<br />
animal products, <strong>in</strong>clud<strong>in</strong>g slaughter waste) is lost across the whole food cha<strong>in</strong>. Half of these losses would be<br />
avoidable. The allocation of the avoidable food losses to the various stages of the food cha<strong>in</strong> identifies agricultural<br />
production, the process<strong>in</strong>g <strong>in</strong>dustry and households as play<strong>in</strong>g a key role. Households waste 45% of<br />
the edible calories lost over the entire food cha<strong>in</strong>. However, there are various uncerta<strong>in</strong>ties <strong>in</strong> quantify<strong>in</strong>g<br />
food losses. A major uncerta<strong>in</strong>ty lies <strong>in</strong> the quantification of losses <strong>in</strong> agricultural production, which are<br />
ma<strong>in</strong>ly caused by quality sort<strong>in</strong>g and omission of harvest due to high fluctuations <strong>in</strong> demand and <strong>in</strong>appropriate<br />
organisation. Further research to quantify losses and to develop strategies for optimisation is especially<br />
important <strong>in</strong> this field.<br />
A broader scenario focuses on the potential <strong>in</strong>crease <strong>in</strong> food availability by replac<strong>in</strong>g animal products rely<strong>in</strong>g<br />
on feed grown on arable land by veg<strong>et</strong>arian products. In Switzerland, livestock relies up to one third on feed<br />
that is grown on arable land. If one third of the animal products were substituted by veg<strong>et</strong>arian products,<br />
45% more calories would be available for consumption. If, additionally, all the edible parts of the food produced<br />
for Swiss consumption were eaten by humans, 50% more calories would be available (Fig. 1).<br />
References<br />
Quested, T., Johnson, H., 2009. Household <strong>Food</strong> and Dr<strong>in</strong>k Waste <strong>in</strong> the UK: A report conta<strong>in</strong><strong>in</strong>g quantification<br />
of the amount and types of household food and dr<strong>in</strong>k waste <strong>in</strong> the UK. Report prepared by WRAP<br />
(Waste and Resources Action Programme). Banbury.<br />
793
GROUP 3, SESSION A: LABELLING, CONSUMERS, DIET 8 th Int. Conference on <strong>LCA</strong> <strong>in</strong> the<br />
Agri-<strong>Food</strong> Sector, 1-4 Oct <strong>2012</strong><br />
Figure 1. Total potential of avoid<strong>in</strong>g food losses <strong>in</strong> Switzerland: In a theor<strong>et</strong>ical scenario of perfect distribution,<br />
optimal m<strong>et</strong>hods of cook<strong>in</strong>g and preparation, and the replacement of one third of the actually consumed<br />
animal products by veg<strong>et</strong>arian food, 195% of the presently consumed food calories would become available<br />
for consumption.<br />
794
GROUP 4, SESSION B: CROP PRODUCTION SYSTEMS 8 th Int. Conference on <strong>LCA</strong> <strong>in</strong> the<br />
Poster session B - Wednesday, 3 October, 16.20-16.50<br />
Group 4, Session B: Crop Production Systems<br />
Agri-<strong>Food</strong> Sector, 1-4 Oct <strong>2012</strong><br />
92. Life cycle assessment of alg<strong>in</strong>ate production<br />
Juli<strong>et</strong>te Langlois 1,2,* , Jean-François Sassi 3 , Jean-Philippe Delegenes 2 , Jean-Philippe Steyer 2 , Arnaud Helias 1,2<br />
1 Montpellier SupAgro, F-34060 Montpellier cedex 2, <strong>France</strong>, 2 INRA, UR50 LBE, F- 11500 Narbonne,<br />
<strong>France</strong>, 3 CEVA, F-22610 Pleubian, <strong>France</strong>, Correspond<strong>in</strong>g author. E-mail: langlois@supagro.<strong>in</strong>ra.fr<br />
Algal polysaccharides, also called phycocolloids, are the ma<strong>in</strong> commercial seaweed extracts: their production<br />
for sale reached 86,100 t over the world <strong>in</strong> 2009, consider<strong>in</strong>g agar, alg<strong>in</strong>ates and carrageenans productions<br />
(Bixler and Porse 2010). They are ma<strong>in</strong>ly used <strong>in</strong> the agri-food sector, as textur<strong>in</strong>g agents, stabilisers,<br />
gel formers of film form<strong>in</strong>g agents. Many other <strong>in</strong>dustrial applications exist, as microbiological and electrophoresis<br />
media for agar, use <strong>in</strong> textile pr<strong>in</strong>t<strong>in</strong>g and paper coat<strong>in</strong>g for alg<strong>in</strong>ates and <strong>in</strong> toothpaste, cosm<strong>et</strong>ics<br />
and pharmaceutics for carrageenans (Bixler and Porse 2010). To our knowledge, their environmental assessment<br />
us<strong>in</strong>g Life Cycle Assessment (<strong>LCA</strong>) has not been performed y<strong>et</strong>, despite this large use at <strong>in</strong>dustrial<br />
scale.<br />
We performed the <strong>LCA</strong> of phycocolloid production <strong>in</strong>clud<strong>in</strong>g seaweed cultivation. The Recipe m<strong>et</strong>hod<br />
(Goedkoop <strong>et</strong> al. 2009) was used, with a hierarchist perspective us<strong>in</strong>g the eco<strong>in</strong>vent v2.2 database and the<br />
SimaPro 7.3 software to carry out the impact assessment. The functional unit was to produce 1 kg of hydrocolloid.<br />
The study is a prospective for European countries, consider<strong>in</strong>g pilot and semi-<strong>in</strong>dustrial data from<br />
the North-Eastern Atlantic zone (data from Aleor, French seaweed producer). Bibliographic data were also<br />
used for electricity consumption (Mafart 1997). We modeled the production of food-grade phycocolloid,<br />
because this use is the ma<strong>in</strong> mark<strong>et</strong> for phycocolloids (Bixler and Porse 2010). Brown seaweeds are considered<br />
due to their high growth rate potential. In the present study, seaweed was Sacchar<strong>in</strong>a latissima, commonly<br />
found <strong>in</strong> this area, and reach<strong>in</strong>g high alg<strong>in</strong>ate content, with high levels of guluronic to mannuronic<br />
acid ratio. It was cultivated on long-l<strong>in</strong>es <strong>in</strong> coastal waters, after plantl<strong>et</strong> production <strong>in</strong> nursery, as described<br />
<strong>in</strong> Langlois <strong>et</strong> al. (<strong>2012</strong>). Seaweeds were treated straight after harvest, with common techniques of sodium<br />
alg<strong>in</strong>ate production (McHugh 2003). Seaweed were first washed, crushed and treated with alcohol. After<br />
acid lixiviation and dewater<strong>in</strong>g, an alkal<strong>in</strong>e extraction was carried out to solubilise alg<strong>in</strong>ates, followed by<br />
dewater<strong>in</strong>g us<strong>in</strong>g filter press. An acid precipitation with blend<strong>in</strong>g was then operated, followed by a last dewater<strong>in</strong>g<br />
and the addition of sodium carbonate before dry<strong>in</strong>g.<br />
Contribution analysis results highlight the importance of the sodium alg<strong>in</strong>ate production itself (see Fig. 1).<br />
On average on every impact categories, the seaweed production accounts for less than 1% of the total impacts,<br />
even allow<strong>in</strong>g bioremediation to mar<strong>in</strong>e eutrophication thanks to the nutrient uptake offshore. Electricity<br />
is the ma<strong>in</strong> contributor to environmental impacts for 12 over 18 impact categories analysed, reach<strong>in</strong>g 39%<br />
of the total impacts on average. It is followed by the use of chemical (ma<strong>in</strong>ly because of hydrochloric acid),<br />
account<strong>in</strong>g for 26% of the total impacts on average. Heat and cool<strong>in</strong>g requirements, wastewater and waste<br />
treatments, and the use of freshwater and m<strong>in</strong>eral filter aid have only secondary impacts compared to them.<br />
This work underl<strong>in</strong>es the key elements to improve for an ecodesign of phycocolloids production.<br />
References<br />
Bixler, H.J., Porse, H., 2010. A Decade of Change <strong>in</strong> the Seaweed Hydrocolloids Industry. J Appl Phycol<br />
23 (3), 321-335.<br />
Goedkoop, M., Heijungs, R., Huijbregts, M. <strong>et</strong> al., 2009. ReCiPe 2008, a Life Cycle Impact Assessment<br />
M<strong>et</strong>hod. M<strong>in</strong>isterie VROM, Den Haag, pp. 125<br />
Langlois, J., Sassi, J.-F., Jard, G., <strong>et</strong> al., <strong>2012</strong>. Life Cycle Assessment of Biom<strong>et</strong>hane from Offhsorecultivated<br />
Seaweed. Accepted <strong>in</strong> Biofuels Bioprod Bioref.<br />
Mafart, P., 1997. Génie Industriel Alimentaire, Tome 1: Les Procédés Physiques De Conservation,<br />
vol.1. Technique Et Documentation. <strong>France</strong>: Lavoisier.<br />
McHugh, D., 2003. A Guide to the Seaweed Industry. FAO Fisheries Technical Paper, 441. Rome.<br />
pp.118. Available onl<strong>in</strong>e: http://www.fao.org/docrep/006/y4765e/y4765e00.htm<br />
795
GROUP 4, SESSION B: CROP PRODUCTION SYSTEMS 8 th Int. Conference on <strong>LCA</strong> <strong>in</strong> the<br />
Agri-<strong>Food</strong> Sector, 1-4 Oct <strong>2012</strong><br />
Figure 1. Contribution analysis for environmental impacts of sodium alg<strong>in</strong>ate production from offshore cultivated<br />
seaweed <strong>in</strong> European countries<br />
796<br />
%<br />
100.<br />
80.<br />
60.<br />
40.<br />
20.<br />
0.<br />
-20.<br />
Other<br />
Waste treatment<br />
Filter aid<br />
Heat and cool<strong>in</strong>g<br />
Chemical use<br />
Electricity use<br />
Seaweed production
GROUP 4, SESSION B: CROP PRODUCTION SYSTEMS 8 th Int. Conference on <strong>LCA</strong> <strong>in</strong> the<br />
Agri-<strong>Food</strong> Sector, 1-4 Oct <strong>2012</strong><br />
93. Sal<strong>in</strong>algue project: design<strong>in</strong>g a susta<strong>in</strong>able production system of<br />
biofuel and by-products from microalgae<br />
Mélissa Cornélus 1,* , Pierre Coll<strong>et</strong> 1 , Stéphane LePochat 3 , Roberto Bell<strong>in</strong>o 3 , Jean-Philippe Steyer 1 , Arnaud<br />
Hélias 1,2<br />
1 INRA, UR50, Laboratoire de Biotechnologie <strong>et</strong> de l’Environnement, Avenue des Etangs, 11100 Narbonne,<br />
<strong>France</strong>, 2 Montpellier SupAgro, 2 Place Viala, 34060 Montpellier Cedex 1, <strong>France</strong>, 3 EVEA, 56 Bd de la<br />
Fraternité, 44100 Nantes, <strong>France</strong>, Correspond<strong>in</strong>g author. E-mail: melissa.cornelus@supagro.<strong>in</strong>ra.fr<br />
Future developments for the microalgae sector are look<strong>in</strong>g promis<strong>in</strong>g with high production yields and no<br />
direct comp<strong>et</strong>ition with arable lands (Chisti, 2007). However, there rema<strong>in</strong> some major bottlenecks related to<br />
the process cha<strong>in</strong> where energy and water issues challenge the <strong>in</strong>dustrialisation of microalgae-based processes<br />
(Lardon <strong>et</strong> al., 2009).<br />
In address<strong>in</strong>g these challenges, Life Cycle Assessment (<strong>LCA</strong>) has become an essential eco-design tool <strong>in</strong> the<br />
R&D step of algoref<strong>in</strong>ery projects. As a consortium of 13 <strong>in</strong>stitutional and private partners, the Sal<strong>in</strong>algue<br />
project deals with the current environmental challenges underl<strong>in</strong>ed <strong>in</strong> several <strong>LCA</strong> studies on algal systems.<br />
This system features a culture s<strong>et</strong> <strong>in</strong> an old farm<strong>in</strong>g salty land <strong>in</strong> the aim of reconversion with an extremophile<br />
native species. This ensures there will be no contam<strong>in</strong>ation and no comp<strong>et</strong>ition aga<strong>in</strong>st arable lands.<br />
Moreover thanks to the proximity with an <strong>in</strong>dustrial area, microalgae may be supplied with <strong>in</strong>dustrial CO2<br />
from exhaust gas. <strong>LCA</strong> aims at pav<strong>in</strong>g the way towards build<strong>in</strong>g more susta<strong>in</strong>able systems. Figure 1 gives an<br />
overview of the process cha<strong>in</strong>: from the culture of biomass, its transformation by downstream processes to<br />
the use of oilcake and its conversion <strong>in</strong>to energy and digestates which can later be recycled as <strong>in</strong>puts of the<br />
system. Below are the 4 key po<strong>in</strong>ts addressed by the <strong>LCA</strong> study on the Sal<strong>in</strong>algue project:<br />
(1) As there are no <strong>in</strong>dustrial facilities y<strong>et</strong> (even at pilot-scale) (Brentner <strong>et</strong> al., 2011), most of data is scaled<br />
up accord<strong>in</strong>g to partners' knowledge and literature review. <strong>LCA</strong> helps to foresee the environmental impacts<br />
of emerg<strong>in</strong>g technologies. Several process technologies are considered at each step: such as green extraction<br />
by new technologies.<br />
(2) Tak<strong>in</strong>g up the bioref<strong>in</strong>ery concept, <strong>LCA</strong> helps partners by po<strong>in</strong>t<strong>in</strong>g out the hotspots, compar<strong>in</strong>g options<br />
and <strong>in</strong>form<strong>in</strong>g eco-choices. This approach is reiterated at each stage of the system. For example, several CO2<br />
supply cha<strong>in</strong>s for the algae culture have been compared.<br />
(3) The whole life cycle is analysed: from the production of algal nutrition to the recycl<strong>in</strong>g of nutrients conta<strong>in</strong>ed<br />
<strong>in</strong> the oilcake (with the liquid fraction be<strong>in</strong>g recirculated towards cultivation ponds) (Coll<strong>et</strong> <strong>et</strong> al.,<br />
2011). Thereby, <strong>LCA</strong> provides a holistic po<strong>in</strong>t of view. This is useful <strong>in</strong> such a collaborative project where<br />
each partner is mostly focused on its respective operation stage.<br />
(4) Sal<strong>in</strong>algue is a multi-output system. In such a complex system, it is critical to deal with all the byproducts<br />
<strong>in</strong> the <strong>LCA</strong> study, which raises some m<strong>et</strong>hodological issues such as allocation or substitution.<br />
Sal<strong>in</strong>algue is a two-stage project, where an <strong>in</strong>dustrial scal<strong>in</strong>g-up of the system will follow the experimental<br />
R&D stage. A step by step approach where the most preferable technology is selected will provide a roadmap<br />
towards the most susta<strong>in</strong>able process cha<strong>in</strong> to yield biofuel and bioproducts from microalgae.<br />
References<br />
Brentner, L. B., Eckelman, M. J. <strong>et</strong> Zimmerman, J. B., 2011. Comb<strong>in</strong>atorial Life Cycle Assessment to Inform<br />
Process Design of Industrial Production of Algal Biodiesel. Environ. Sci. Technol. 45 (16) pp.7060-<br />
67.<br />
Chisti, Y., 2007. Biodiesel from microalgae. Biotechnology Advances 25 (3) pp.294-306.<br />
Coll<strong>et</strong>, P., Hélias, A., Lardon, L., Ras, M., Goy, R.-A. <strong>et</strong> Steyer, J.-P., 2011. Life-cycle assessment of microalgae<br />
culture coupled to biogas production. Bioresource Technology 102 (1) pp.207-14.<br />
Lardon, L., Hélias, A., Sialve, B., Steyer, J.-P. <strong>et</strong> Bernard, O., 2009. Life-Cycle Assessment of Biodiesel<br />
Production from Microalgae. Environ. Sci. Technol. 43 (17) pp.6475-81.<br />
797
GROUP 4, SESSION B: CROP PRODUCTION SYSTEMS 8 th Int. Conference on <strong>LCA</strong> <strong>in</strong> the<br />
Agri-<strong>Food</strong> Sector, 1-4 Oct <strong>2012</strong><br />
798<br />
Figure 1. Process cha<strong>in</strong> of the Sal<strong>in</strong>algue project overview
GROUP 4, SESSION B: CROP PRODUCTION SYSTEMS 8 th Int. Conference on <strong>LCA</strong> <strong>in</strong> the<br />
Agri-<strong>Food</strong> Sector, 1-4 Oct <strong>2012</strong><br />
94. Us<strong>in</strong>g life cycle analysis to compare the environmental<br />
performance of organic and conventional apple orchards<br />
Aude Alaphilippe 1,* , Sylva<strong>in</strong>e Simon 1 , Laurent Brun 1 , Frank Hayer 2 , Gérard Gaillard 2<br />
1 2<br />
INRA, UERI Doma<strong>in</strong>e de Gotheron, 26320 Sa<strong>in</strong>t Marcel les Valence, <strong>France</strong>, Agroscope Reckenholz<br />
*<br />
Tanikon ART, CH-8046 Zurich, Switzerland, Correspond<strong>in</strong>g author. E-mail:<br />
aude.alaphilippe@avignon.<strong>in</strong>ra.fr<br />
Although the conventional farm<strong>in</strong>g system for apple production rema<strong>in</strong>s the common practice worldwide,<br />
the organic farm<strong>in</strong>g system is develop<strong>in</strong>g. Although organic farm<strong>in</strong>g is generally claimed to be environmentally<br />
friendly, very few global assessments of the environmental impacts of organic orchard systems are<br />
presently available. In this work, we analyse with life cycle analysis (<strong>LCA</strong>) weak and strong po<strong>in</strong>ts of the<br />
environmental performance of two organic and one conventional apple orchards, us<strong>in</strong>g a pluri-annual datas<strong>et</strong><br />
from experimental orchard systems located <strong>in</strong> the middle Rhone valley <strong>in</strong> <strong>France</strong>. The analysis was performed<br />
with the SA<strong>LCA</strong> m<strong>et</strong>hod (SA<strong>LCA</strong>-Crop, V3.1 adapted for pome fruit) and <strong>in</strong>cluded relevant impact<br />
categories us<strong>in</strong>g characterisation models ma<strong>in</strong>ly from the m<strong>et</strong>hods EDIP97 and CML01.<br />
Seven impact categories <strong>in</strong>clud<strong>in</strong>g ecotoxicity and human toxicity, as well as energy consumption and other<br />
environmental impact categories were calculated and are here presented. From this first <strong>in</strong>sight, the organic<br />
systems were globally less impact<strong>in</strong>g than the conventional system when consider<strong>in</strong>g the functional unit<br />
(FU) per hectare (ha*year), but among the highest impact –except for toxicity- when consider<strong>in</strong>g the<br />
(kg*year) FU because of low yields. High-yield conventional systems globally presented the opposite trend.<br />
The basic substitution of conventional by organic <strong>in</strong>puts or mechanical work was not sufficient to radically<br />
improve the overall environmental performance of the orchard system. This work also highlighted the importance<br />
of the cultivar <strong>in</strong> the orchard design towards more environmentally friendly apple production systems;<br />
a disease-susceptible cultivar such as Golden Delicious was more impact<strong>in</strong>g than a low-susceptibility cultivar<br />
such as Melrose under the same cropp<strong>in</strong>g system. Only one-year results are here presented, to be further<br />
validated after several years of full production.<br />
This study is the first apple <strong>LCA</strong> based on a multi-year system experiment, which provided all <strong>in</strong>formation<br />
requested to compute a <strong>LCA</strong> <strong>in</strong> a liable and high quality datas<strong>et</strong>, as it was collected on purpose <strong>in</strong> orchards<br />
under the same <strong>in</strong>fluence of the site or field context and management. The <strong>in</strong>terest of such system experiments<br />
to create references for agricultural productions newly assessed with <strong>LCA</strong> m<strong>et</strong>hodology is discussed.<br />
Moreover the potential contribution of <strong>LCA</strong> to the design of <strong>in</strong>novative and less <strong>in</strong>put dependant production<br />
systems is analysed: the calculation of the overall environmental impact potential (no focus on one aspect) of<br />
different farm<strong>in</strong>g systems, followed by an analysis of their weak and strong po<strong>in</strong>ts, permits to propose some<br />
improvement of the farm<strong>in</strong>g systems.<br />
799
GROUP 4, SESSION B: CROP PRODUCTION SYSTEMS 8 th Int. Conference on <strong>LCA</strong> <strong>in</strong> the<br />
Human tox (CML)<br />
Aquatic<br />
Ecotox<br />
(CML)<br />
800<br />
GWP [kg CO2-eq]<br />
3<br />
2<br />
1<br />
0<br />
NRE [MJ-eq]<br />
Acidification [kg SO2-Eq]<br />
Agri-<strong>Food</strong> Sector, 1-4 Oct <strong>2012</strong><br />
OG Melrose<br />
OG Golden D.<br />
CV Golden D.<br />
Terrestrial<br />
Eutrophication [kg N]<br />
ecotox (CML)<br />
Figure 1. Seven impact categories (one-year data) of the two organic farm<strong>in</strong>g systems (OG Golden Delicious<br />
and OG Melrose) relatively to the conventional (CV) Golden Delicious farm<strong>in</strong>g system which was s<strong>et</strong> up to<br />
the value 1 for each calculated impact category (functional unit: per ha*year).<br />
Human tox, CML<br />
Water ecotox, CML<br />
Terrestrian ecotox, CML<br />
GWP [kg CO2-eq]<br />
0<br />
Figure 2. Seven impact categories (one-year data) of the two organic farm<strong>in</strong>g systems (OG Golden Delicious<br />
and OG Melrose) relatively to the conventional (CV) Golden Delicious farm<strong>in</strong>g system which was s<strong>et</strong> up to<br />
the value 1 for each calculated impact category (functional unit: per kg*year).<br />
1<br />
2<br />
3<br />
Eutrophication [kg N]<br />
NRE [MJ-eq]<br />
4<br />
5<br />
6<br />
Acidification [kg SO2-Eq]<br />
OG Melrose<br />
OG Golden D.<br />
CV Golden D.
GROUP 4, SESSION B: CROP PRODUCTION SYSTEMS 8 th Int. Conference on <strong>LCA</strong> <strong>in</strong> the<br />
Agri-<strong>Food</strong> Sector, 1-4 Oct <strong>2012</strong><br />
95. Assess<strong>in</strong>g environmental susta<strong>in</strong>ability of apple ancient vari<strong>et</strong>ies <strong>in</strong><br />
Northern Italy<br />
Alessandro K. Cerutti 1,* , Daniela Galizia 1 , Sander Bruun 2 , Dario Donno 1 , Gabriele L. Beccaro 1 , Giancarlo<br />
Bounous 1<br />
1 Department of Arboriculture, University of Tor<strong>in</strong>o, Via Leonardo da V<strong>in</strong>ci, 44 – 10095 Grugliasco (TO),<br />
Italy, 2 Department of Agriculture and Ecology, University of Copenhagen, Thorvaldsensvej 40, 1871<br />
Frederiksberg, Copenhagen, Denmark, Correspond<strong>in</strong>g author. E-mail: alessandro.cerutti@unito.it<br />
Until the middle of the last century, hundreds of different cultivars of apples were grown <strong>in</strong> Italy, as <strong>in</strong> many<br />
other fruit produc<strong>in</strong>g countries. However <strong>in</strong> the Sixties, with <strong>in</strong>creas<strong>in</strong>g orchard commercialisation, the use<br />
of commercial vari<strong>et</strong>ies became more common. Ancient cultivars were gradually replaced by commercial<br />
vari<strong>et</strong>ies and Italian fruit-grow<strong>in</strong>g practices underwent significant changes. Indeed more than 70% of the<br />
orchards <strong>in</strong> the Piedmont Region (Northern Italy) only have one cultivar, the commercial vari<strong>et</strong>y Golden<br />
Delicious. In this region alone, ancient apple germplasm actually consists of about 350 cultivars, 130 of<br />
which were recently noted for their qualitative, morphologic and agronomic traits. Ancient vari<strong>et</strong>ies are<br />
characterised by very unconventional quality traits, such as alternative fruit shapes, sk<strong>in</strong> colour, nutritional<br />
values and organoleptic traits (such as crispness, juic<strong>in</strong>ess and flavour). Because of this, they constitute a<br />
well def<strong>in</strong>ed niche mark<strong>et</strong>.<br />
The commercial appeal of such products (and the follow<strong>in</strong>g mark<strong>et</strong><strong>in</strong>g) is based both on uncommon quality<br />
traits and claimed smaller environmental impacts due to the orig<strong>in</strong>al vocation of the agronomic properties of<br />
the land. Nevertheless specific environmental assessment of the vari<strong>et</strong>ies have not been conducted y<strong>et</strong>.<br />
Therefore, the aim of this research is to conduct a life cycle assessment (<strong>LCA</strong>) that compares the production<br />
of a representative ancient apple cultivar with Golden Delicious production, <strong>in</strong> order to evaluate significant<br />
differences <strong>in</strong> the environmental impacts. In particular, the objectives of this research are (I) to qualify and<br />
quantify the ma<strong>in</strong> environmental aspects of ancient apple vari<strong>et</strong>ies <strong>in</strong> Piedmont <strong>in</strong> order to establish param<strong>et</strong>ers<br />
for the susta<strong>in</strong>ability of that product; (II) to evaluate any significant differences with the environmental<br />
impact of the Golden Delicious supply cha<strong>in</strong> and (III) to highlight where such differences are located along<br />
the supply cha<strong>in</strong>.<br />
The assessment covers the whole supply cha<strong>in</strong>, <strong>in</strong>clud<strong>in</strong>g agricultural production and its <strong>in</strong>puts: process<strong>in</strong>g,<br />
cool<strong>in</strong>g, storage and transportation up to the consumer’s phase. Storage and consumption with<strong>in</strong> the consumer’s<br />
house have not been <strong>in</strong>cluded because they are considered to be the same regardless the supply<br />
cha<strong>in</strong>. The functional unit was 1 kg of apples delivered to the consumer. The study was performed <strong>in</strong> accordance<br />
with the guidel<strong>in</strong>es and requirements of the ISO 14040 standard series and with the cradle-to-gate<br />
approach as the basis for the Life Cycle Inventory (LCI) of the study. Data regard<strong>in</strong>g agricultural <strong>in</strong>puts,<br />
consumption and agrotechnique have been obta<strong>in</strong>ed directly from the growers, who filled <strong>in</strong> a questionnaire<br />
for the season 2010-2011, and by consultation of Italian production protocols. The environmental aspects of<br />
the production of fertilisers and pesticides have been <strong>in</strong>cluded with<strong>in</strong> the boundaries. Data regard<strong>in</strong>g resource<br />
use and supply cha<strong>in</strong> properties have been obta<strong>in</strong>ed from r<strong>et</strong>ailers through <strong>in</strong>terviews and field surveys.<br />
801
GROUP 4, SESSION B: CROP PRODUCTION SYSTEMS 8 th Int. Conference on <strong>LCA</strong> <strong>in</strong> the<br />
Agri-<strong>Food</strong> Sector, 1-4 Oct <strong>2012</strong><br />
96. Life cycle GHG and energy balance of organic apples: a case study<br />
<strong>in</strong> Italy<br />
Maurizio Cellura 1,* , Mario Fontana 1 , Sonia Longo 1 , Mar<strong>in</strong>a Mistr<strong>et</strong>ta 2 , Flavio Paol<strong>et</strong>ti 3<br />
1 Dipartimento dell’Energia, Università degli Studi di Palermo, Viale delle Scienze, 90128 Palermo, Italy, 2<br />
Dipartimento Patrimonio Archit<strong>et</strong>tonico e Urbanistico (PAU), Università degli Studi Mediterranea di Reggio<br />
Calabria, Salita Melissari, 89124 Reggio Calabria, Italy, 3 Istituto Nazionale di Ricerca per gli Alimenti e la<br />
Nutrizione (INRAN), via Ardeat<strong>in</strong>a N.546, 00178 Rome, Italy, Correspond<strong>in</strong>g author. E-mail: mcellura@dream.unipa.it<br />
The ma<strong>in</strong> household environmental impacts are concentrated <strong>in</strong> food, transport and build<strong>in</strong>g sectors. The<br />
food sector is responsible for 20-30% of the various environmental impacts due to the f<strong>in</strong>al consumptions,<br />
and <strong>in</strong> the case of eutrophication for even more than 50% (Tukker at al., 2006).<br />
Every stage of the production and consumption cha<strong>in</strong> of food, from grow<strong>in</strong>g crops, to transportation and<br />
storage, manufactur<strong>in</strong>g, distribution, purchas<strong>in</strong>g and consumption, and treatment of waste, has environmental<br />
effects. Consumers choices can significantly <strong>in</strong>fluence the environmental impacts of production, r<strong>et</strong>ail and<br />
distribution phases of food (EEA, 2005). In particular, they can choose to consume more organic food, which<br />
represents a key factor <strong>in</strong> the food productive sector, due to the added value of its products, to the socioeconomic<br />
benefits for the producers and the positive effects on the environment and human health.<br />
The present study is part of a research developed with<strong>in</strong> the project “BIOQUALIA – Nutritional and organoleptic<br />
quality and environmental impact of organic productions”, and aims to evaluate the energy and<br />
environmental impacts of 1 kg of organic apples cultivated <strong>in</strong> the north of Italy.<br />
The analysis was based on the Life Cycle Assessment (<strong>LCA</strong>) m<strong>et</strong>hodology as regulated by the <strong>in</strong>ternational<br />
standards of series ISO 14040 (UNI EN ISO 14040, 2006a; UNI EN ISO 14044, 2006b).<br />
In d<strong>et</strong>ail, the authors identified the supply cha<strong>in</strong> flow charts, the relevant mass and energy flows and the key<br />
environmental issues for the assessed product, follow<strong>in</strong>g the approach “from farm to fork”. Particular attention<br />
was paid on key issues, such as primary energy consumption, water exploitation and fertilisers use <strong>in</strong><br />
agricultural activities.<br />
The application of <strong>LCA</strong> allowed assess<strong>in</strong>g the <strong>in</strong>cidence of each life cycle step of apples on the total impacts<br />
and identify<strong>in</strong>g “hot spots” of the exam<strong>in</strong>ed supply cha<strong>in</strong>, by the identification of phases and processes that<br />
are responsible of the largest impacts.<br />
In d<strong>et</strong>ail, the results showed an average primary energy consumption of about 7 MJ/kg and a global warm<strong>in</strong>g<br />
potential of about 0.5 kg CO2eq/kg. A relevant <strong>in</strong>cidence on the total impacts (about 70% of primary energy<br />
consumption and global warm<strong>in</strong>g potential) was related to the transport of apples to f<strong>in</strong>al users, hypothesis<strong>in</strong>g<br />
that the product is distributed on local (10% of the product), national (49%) and <strong>in</strong>ternational mark<strong>et</strong>s<br />
(50%). The use of <strong>in</strong>secticides and the consumption of diesel for agricultural mach<strong>in</strong>es were found to be also<br />
significant <strong>in</strong> the overall energy and environmental impacts of apples. F<strong>in</strong>ally the authors carried out a comparison<br />
b<strong>et</strong>ween the outcomes of the presented study and the eco-profile of non organic apple production.<br />
References<br />
European Environment Agency, 2005. Household consumption and the environment. EEA report No<br />
11/2005.<br />
Tukker, A., Huppes, G., Gu<strong>in</strong>ée, J., Heijungs, R., de Kon<strong>in</strong>g, A., van Oers, L., Suh, S., Geerken, T., van<br />
Holderbeke, M., Jansen, B., Nielsen, P., May 2006. Environmental Impact of Products (EIPRO). Analysis<br />
of the life cycle environmental impacts related to the f<strong>in</strong>al consumption of the EU-25. Technical Report<br />
EUR 22284 EN. European Commission.<br />
UNI EN ISO 14040, 2006a. Environmental management – Life cycle assessment – Pr<strong>in</strong>ciples and framework.<br />
UNI EN ISO 14044, 2006b. Environmental management – Life cycle assessment – Requirements and guidel<strong>in</strong>es.<br />
802
GROUP 4, SESSION B: CROP PRODUCTION SYSTEMS 8 th Int. Conference on <strong>LCA</strong> <strong>in</strong> the<br />
Agri-<strong>Food</strong> Sector, 1-4 Oct <strong>2012</strong><br />
97. Life cycle assessment comb<strong>in</strong>ed with eMergy for the evaluation of<br />
an organic apple production system<br />
<strong>France</strong>sca Ross<strong>et</strong>ti 1,* , Bened<strong>et</strong>to Rugani 2 , Elena Neri 1 , Nicol<strong>et</strong>ta Patrizi 1 , Simone Bastianoni 1<br />
1 Ecodynamics Group, Dipartimento di Chimica, Università degli Studi di Siena, via A. Moro, 2 - 53100<br />
Siena, Italy, 2 Public Research Centre Henri Tudor (CRPHT) - Resource Centre for Environmental Technologies<br />
(CRTE), 66, rue de Luxembourg - P.B. 144, L-4002, Esch-sur-Alz<strong>et</strong>te, Luxembourg, * Correspond<strong>in</strong>g<br />
author. E-mail: francesca.ross<strong>et</strong>ti@unisi.it<br />
Traditionally organic farms aim to limit as much as possible external <strong>in</strong>puts to concentrate the production<br />
towards more susta<strong>in</strong>able systems. Organic systems aim to favour<strong>in</strong>g the preservation of ecosystems and the<br />
conservation of the landscape and of local complexity. But the management of a farm by means of organic<br />
practices does not always assure its susta<strong>in</strong>ability. In this work we comb<strong>in</strong>ed Life Cycle Assessment (<strong>LCA</strong>)<br />
and eMergy to study the susta<strong>in</strong>ability and environmental performance of an organic farm produc<strong>in</strong>g fresh<br />
apples and apple-juice. The parallel application of these two m<strong>et</strong>hodologies allows obta<strong>in</strong><strong>in</strong>g more significative<br />
and comprehensive results and it emphasises the necessity of a l<strong>in</strong>k b<strong>et</strong>ween ecological and economic<br />
analyses <strong>in</strong> agricultural systems (Odum, 1996). The farm exam<strong>in</strong>ed is situated <strong>in</strong> the south of Tuscany (Italy),<br />
with an annual yield of 34 ton/ha. The farm is managed <strong>in</strong> conformity to organic farm<strong>in</strong>g rules, pay<strong>in</strong>g<br />
particular attention to the preservation of biodiversity and to the respect of natural resources. The use of<br />
dr<strong>in</strong>k<strong>in</strong>g water is almost compl<strong>et</strong>ely substituted by the capture of ra<strong>in</strong>water and by the renewable use of well<br />
water. The farm is equipped with a photovoltaic system that satisfies the own electricity demand. For the<br />
analysis, the production process was divided <strong>in</strong> three phases: <strong>in</strong> Phase 1 apples are cultivated and collected;<br />
<strong>in</strong> Phase 2 apples are washed and selected, a part is dest<strong>in</strong>ed to the fresh mark<strong>et</strong> and a part is transformed <strong>in</strong><br />
apples-juice (Phase 3). <strong>LCA</strong> analysis was performed us<strong>in</strong>g SimaPro 7.3 (PRè Consultants); for the characterisation<br />
we have selected impact categories from CML 2 Basel<strong>in</strong>e M<strong>et</strong>hod 2000 (Gu<strong>in</strong>èe <strong>et</strong> al., 2001):<br />
Acidification (AC), Eutrophication (EU), Global Warm<strong>in</strong>g Potential (GWP100) and Photochemical Oxidation<br />
(PO). Despite what is usually observed <strong>in</strong> literature for conventional farms (Milà-i-Canals <strong>et</strong> al., 2006),<br />
<strong>LCA</strong> results showed that Phase 1 is the less critical of the system (AC 7%, GWP 7%, EU 17% and PO 6%).<br />
These results are justified by the fact that the farm, accord<strong>in</strong>g to regulations, reduces at m<strong>in</strong>imum the use of<br />
fertilisers and pesticides, decreas<strong>in</strong>g the generation of an important relevant share of many impact categories<br />
considered <strong>in</strong> <strong>LCA</strong> for this process. Phase 2 and 3 represent the most d<strong>et</strong>rimental (Phase 2: AC 24%, GWP<br />
30%, EU 21% and PO 17%, Phase 3: AC 68%, GWP 64%, EU 62% and PO 76%). In Phase 2 mach<strong>in</strong>eries,<br />
transport and fuels represent the major impacts, while <strong>in</strong> Phase 3 the most critical <strong>in</strong>put corresponds to the<br />
glass packag<strong>in</strong>g phase. Emergy results highlight a quasi-self-sufficiency of the considered system. In fact the<br />
imported flows (F) are very low and it is remarked also by the EIR <strong>in</strong>dicator. The% renewability (%R) is<br />
nearly 80%. Transports have a considerable weight <strong>in</strong> the amount of impacts due to the purchase of apples<br />
from other regions that the farm sells as fresh mark<strong>et</strong>. The transport of fruits through long distances has usually<br />
a relevant impact, and the farm should limit or totally elim<strong>in</strong>ate this unsusta<strong>in</strong>able scenario. F<strong>in</strong>ally,<br />
glass represents another major <strong>in</strong>put of the farm and probably the use of a lighter type of glass would decrease<br />
impacts related to the bottl<strong>in</strong>g phase. Results obta<strong>in</strong>ed from the two m<strong>et</strong>hodologies provide a wide<br />
range of useful <strong>in</strong>formation to b<strong>et</strong>ter identify environmental hotspots of production systems and also to<br />
communicate to producers the opportunities to improve their susta<strong>in</strong>ability.<br />
References<br />
Gu<strong>in</strong>èe, J. B., Gorreèe, M., Heijungs, R., Huppes, G., Kleijn, R., de Kon<strong>in</strong>g, A., van Oers, L., Wegener<br />
Sleeswijk, A., Suh, S., Udo de Haes, H. A., de Bruijn, H., van Du<strong>in</strong>, R., Huijbregts, M. A., 2001. Handbook<br />
on Life Cycle Assessment. Operational Guide to the ISO standards, Kluwer Academic Publisher:<br />
Dordrecht, The N<strong>et</strong>herlands<br />
Milà i Canals, L., Burnip, G.M., Cowell, S.J., 2006. Evaluation of the environmental impacts of apple production<br />
us<strong>in</strong>g Life Cycle Assessment (<strong>LCA</strong>): Case study <strong>in</strong> New Zealand. Agriculture Ecosystems & Environment<br />
114, 226-238.<br />
Odum, H.T. 1996. Environmental Account<strong>in</strong>g: Emergy and Environmental Policy Mak<strong>in</strong>g. John Wiley and<br />
Sons, New York. 370 pp.<br />
803
GROUP 4, SESSION B: CROP PRODUCTION SYSTEMS 8 th Int. Conference on <strong>LCA</strong> <strong>in</strong> the<br />
Agri-<strong>Food</strong> Sector, 1-4 Oct <strong>2012</strong><br />
98. Prelim<strong>in</strong>ary research on the analysis of life cycle assessment <strong>in</strong> the<br />
production of rapeseed and biodiesel <strong>in</strong> Poland<br />
Magdalena Borzecka-Walker * , Antoni Faber, Rafał Pudełko, Katarzyna Mizak<br />
1 Institute of Soil Science and Plant Cultivation-State Research Institute, Correspond<strong>in</strong>g author. E-mail:<br />
mwalker@iung.pulawy.pl<br />
The aim of the project is to gather necessary <strong>in</strong>formation to perform <strong>LCA</strong> analysis on rapeseed production<br />
and its conversion to biodiesel, the execution of these studies accord<strong>in</strong>g to ISO standards adopted by <strong>LCA</strong><br />
software as well as a professional presentation of the survey results at different levels of adm<strong>in</strong>istration and<br />
biodiesel production plants.<br />
Poland, like every other country <strong>in</strong> the EU is committed to reduc<strong>in</strong>g greenhouse gas emissions. The ma<strong>in</strong><br />
road lead<strong>in</strong>g to this is to be the <strong>in</strong>creased use of RES. In this situation, particularly important research, studies,<br />
analysis and technical-organisational measures are aimed at secur<strong>in</strong>g the implementation of its obligations<br />
for Directive 2009/28/EC of 23 April 2009. From the moment when the Directive comes <strong>in</strong>to force <strong>in</strong><br />
order to promote RES, bio<strong>et</strong>hanol or biodesiel must ensure the reduction of greenhouse gas emissions by<br />
35% and from 2017 by 50%, mov<strong>in</strong>g up to 60% <strong>in</strong> 2018 compared to conventional fuels. Reduc<strong>in</strong>g emissions<br />
is to be d<strong>et</strong>erm<strong>in</strong>ed by life cycle analysis (<strong>LCA</strong>).<br />
The developed database conta<strong>in</strong>s the <strong>in</strong>formation on energy costs over the cycle of cultivation, harvest<strong>in</strong>g<br />
and storage and process<strong>in</strong>g of biomass under Polish conditions. Survey (200) was conducted on farms produc<strong>in</strong>g<br />
rapeseeds for biofuel production.<br />
The average GHG emission was 24.5 g eq. CO2 MJ -1 . The <strong>LCA</strong> analysis for the production and process<strong>in</strong>g of<br />
biomass to biodiesel were performed with SimaPro. The greenhouse gas emissions were <strong>in</strong>corporated <strong>in</strong>to an<br />
assessment of environmental impacts such as acidification, eutrophication, load<strong>in</strong>g with organic compounds,<br />
<strong>in</strong>organic, toxicity to humans and ecosystems, and carc<strong>in</strong>ogenic impact. The results from the research will be<br />
adjusted to a scale of adm<strong>in</strong>istrative regions <strong>in</strong> accordance with the requirements from the European Commission,<br />
where member states are obliged to present the results of <strong>LCA</strong> for liquid biofuels for adm<strong>in</strong>istrative<br />
units NUTS-2.<br />
References<br />
Directive 2009/28/EC. The European Parliament and of the Council on the promotion of the use of energy<br />
from renewable sources amend<strong>in</strong>g and subsequently repeal<strong>in</strong>g Directives 2001/77/EC and 2003/30/EC.<br />
804
GROUP 4, SESSION B: CROP PRODUCTION SYSTEMS 8 th Int. Conference on <strong>LCA</strong> <strong>in</strong> the<br />
Agri-<strong>Food</strong> Sector, 1-4 Oct <strong>2012</strong><br />
99. The construction of a database for the evaluation of greenhouse<br />
gas emissions from cultivation of crops for biofuels <strong>in</strong> Poland<br />
Magdalena Borzecka-Walker * , Katarzyna Mizak, Antoni Faber, Al<strong>in</strong>a Syp, Rafal Pudelko<br />
Institute of Soil Science and Plant Cultivation-State Research Institute, Correspond<strong>in</strong>g author. E-mail:<br />
mwalker@iung.pulawy.pl<br />
Poland, like every other country <strong>in</strong> the EU is committed to reduc<strong>in</strong>g greenhouse gas emissions. The ma<strong>in</strong><br />
road lead<strong>in</strong>g to this is to be <strong>in</strong>creased use of Renewable Energy Sources (RES). In this situation, particularly<br />
important research, studies, analysis and technical-organisational measures aimed at secur<strong>in</strong>g the implementation<br />
of its obligations Directive 2009/28/EC of 23 April 2009. From the moment when the Directive comes<br />
<strong>in</strong>to force <strong>in</strong> order to promote RES, bio<strong>et</strong>hanol or biodesiel must ensure the reduction of greenhouse gas<br />
emissions by 35% and from 2017 by 50%, mov<strong>in</strong>g up to 60% <strong>in</strong> 2018 compared to conventional fuels. Reduc<strong>in</strong>g<br />
emissions is to be d<strong>et</strong>erm<strong>in</strong>ed by life cycle analysis (<strong>LCA</strong>).<br />
The study <strong>in</strong>cluded farms produc<strong>in</strong>g raw materials that can be used to produce liquid biofuels. The farms<br />
(1500) produc<strong>in</strong>g w<strong>in</strong>ter wheat, maize and oilseed rape were selected at random and surveyed thoroughly.<br />
The sample size was s<strong>et</strong> at 3% the number of farms produc<strong>in</strong>g or likely to produce raw materials for biofuels<br />
production purposes. These farms produced raw materials <strong>in</strong> different soils and different weather conditions<br />
b<strong>et</strong>ween 2005 and 2010 with the exception of extreme conditions (especially farms located <strong>in</strong> flooded areas<br />
<strong>in</strong> 2010).<br />
References<br />
Directive 2009/28/EC. The European Parliament and of The Council on the promotion of the use of energy<br />
from renewable sources amend<strong>in</strong>g and subsequently repeal<strong>in</strong>g Directives 2001/77/EC and 2003/30/EC<br />
805
GROUP 4, SESSION B: CROP PRODUCTION SYSTEMS 8 th Int. Conference on <strong>LCA</strong> <strong>in</strong> the<br />
Agri-<strong>Food</strong> Sector, 1-4 Oct <strong>2012</strong><br />
806<br />
100. Environmental implications of us<strong>in</strong>g biomass versus fossil fuels<br />
for energy production: the case of willow, an energy crop<br />
Thu Lan T. Nguyen * , John E. Hermansen<br />
Dept. of Agroecology, Aarhus University, Blichers Allé 20, Postbox 50, DK-8830 Tjele, Denmark, Correspond<strong>in</strong>g<br />
author. E-mail: ThuLan.ThiNguyen@agrsci.dk<br />
Fossil fuel use for energy production is fac<strong>in</strong>g serious problems related to resource depl<strong>et</strong>ion and environmental<br />
degradation, notably climate change. Biomass fuels e.g. wood waste, crop residues, energy crops, <strong>in</strong><br />
contrast, are considered renewable and carbon neutral. Unlike fossil fuels that take millions of years to be<br />
available as an energy source, biomass can be regenerated relatively quickly through photosynthesis. Biomass<br />
burn<strong>in</strong>g releases CO2 back to the atmosphere but this biogenic CO2 is not counted as contribut<strong>in</strong>g to<br />
global warm<strong>in</strong>g. Apart from wood waste and crop residues, energy crops e.g. willow and miscanthus have<br />
recently received large attention as a potential source of renewable energy. Whereas biomass is “carbon neutral”<br />
when burned, the <strong>in</strong>puts used to produce it may be a source of CO2 and other GHG emissions.<br />
Our research questions were: (1) What if the upstream impacts of energy production from biomass fuels, i.e.<br />
those connected with biomass cultivation and distribution, are <strong>in</strong>cluded?, (2) In addition to global warm<strong>in</strong>g<br />
and non-renewable energy, what about other impact categories like acidification, eutrophication, ecotoxicity,<br />
human toxicity, <strong>et</strong>c., and 3) How to account for trade-offs among different impact categories? A thorough<br />
and comprehensive analysis is thus necessary to assess the susta<strong>in</strong>ability of substitut<strong>in</strong>g biomass for fossil<br />
fuels <strong>in</strong> energy production. The task is not only to <strong>in</strong>clude more impact categories than global warm<strong>in</strong>g and<br />
non-renewable energy but also to perform the analysis at a more aggregated level, i.e., translat<strong>in</strong>g impacts <strong>in</strong><br />
different mid-po<strong>in</strong>t categories <strong>in</strong>to a s<strong>in</strong>gle unit so that they can be weighted and added tog<strong>et</strong>her to give a<br />
s<strong>in</strong>gle score value.<br />
In this paper, we present as a case study the results of an <strong>LCA</strong> study on electricity generation from willow<br />
produced on arable land, <strong>in</strong> comparison with fossil fuels. Inventory data for the entire process from willow<br />
cultivation to energy production were from Nielsen and Illerup (2003) and Uellendahl <strong>et</strong> al. (2008). Midpo<strong>in</strong>t<br />
impact categories considered were global warm<strong>in</strong>g, non-renewable energy, acidification, eutrophication,<br />
respiratory <strong>in</strong>organics, human toxicity, ecotoxicity, photochemical ozone and nature occupation. All midpo<strong>in</strong>t<br />
impacts were then translated <strong>in</strong>to a s<strong>in</strong>gle mon<strong>et</strong>ary unit. The LCIA m<strong>et</strong>hod used was Stepwise 2006<br />
(Weidema, 2009). For a verification of the mon<strong>et</strong>arisation scheme used <strong>in</strong> the Stepwise2006 m<strong>et</strong>hod versus<br />
that used <strong>in</strong> previous studies, a sensitivity analysis was also performed.<br />
The midpo<strong>in</strong>t impact assessment shows that substitution of willow for fossil fuels would br<strong>in</strong>g both environmental<br />
benefits and costs. The substitution for coal offered environmental benefits <strong>in</strong> all impact categories<br />
considered except for nature occupation and eutrophication. The substitution for natural gas reduced<br />
impacts on human toxicity, ecotoxicity, global warm<strong>in</strong>g and non-renewable energy but <strong>in</strong>creased nature occupation,<br />
eutrophication, respiratory <strong>in</strong>organics, acidification and photochemical ozone. The results at the<br />
aggregated level show that energy production from willow scores b<strong>et</strong>ter than from coal (0.11 vs. 0.12<br />
EUR/kWh) but worse than from natural gas (0.11 vs. 0.06 EUR/kWh). Much of this <strong>in</strong>ferior performance is<br />
accounted for by the impact on nature occupation of biomass fuel crops; nature occupation is by far the ma<strong>in</strong><br />
contributor with a share of approx. 80% of the aggregated s<strong>in</strong>gle score. Nature occupation thus rema<strong>in</strong>s a<br />
major environmental hotspot for bioenergy development, stress<strong>in</strong>g the importance of seek<strong>in</strong>g improvements<br />
<strong>in</strong> relation to this <strong>in</strong>dicator <strong>in</strong> order for biomass fuels like energy crops to be a viable fuel source.<br />
References<br />
Nielsen, M., Illerup, J.B., 2003. Emissionsfaktorer og emissionsopgørelse for decentral kraftvarme, Eltra<br />
PSO projekt 3141, Kortlægn<strong>in</strong>g af emissionsfaktorer fra decentral kraftvarme, Delrapport 6, Faglig rapport<br />
fra DMU, nr. 442.<br />
Uellendahl, H., Wang, G., Moller, H.B. <strong>et</strong> al., 2008. Energy balance and cost-benefit analysis of biogas production<br />
from perennial energy crops pre-treated by w<strong>et</strong> oxidation. Water Sci Technol. 58, 1841-1847<br />
Weidema, B.P., 2009. Us<strong>in</strong>g the budg<strong>et</strong> constra<strong>in</strong>t to mon<strong>et</strong>arise impact assessment results. Ecological Economics<br />
68, 1591-1598.
GROUP 4, SESSION B: CROP PRODUCTION SYSTEMS 8 th Int. Conference on <strong>LCA</strong> <strong>in</strong> the<br />
Agri-<strong>Food</strong> Sector, 1-4 Oct <strong>2012</strong><br />
101. Influence of allocation m<strong>et</strong>hods <strong>in</strong> the quantification of the<br />
environmental impacts of compost application<br />
Julia Martínez-Blanco 1,* , Joan Rieradevall 1,2 , Pere Muñoz 3 , Assumpció Antón 3,4<br />
1 Institute of Environmental Science and Technology (ICTA), Universitat Autònoma de Barcelona (UAB),<br />
08193 Bellaterra, Barcelona, Spa<strong>in</strong>, 2 Chemical Eng<strong>in</strong>eer<strong>in</strong>g Department, Universitat Autònoma de Barcelona<br />
(UAB), 08193 Bellaterra, Barcelona, Spa<strong>in</strong>, 3 Institute of Research and Technology <strong>in</strong> Agrifood Sector<br />
(IRTA), Environmental Horticulture, 08348 Cabrils, Barcelona, Spa<strong>in</strong>, 4 Departament d’Eng<strong>in</strong>yeria Química,<br />
Universitat Rovira i Virgili (URV), 43007 Tarragona, Spa<strong>in</strong>, Correspond<strong>in</strong>g author. E-mail:<br />
julia.mart<strong>in</strong>ez@uab.cat<br />
Fertilisation has been reported as one of the key factors for the environmental performance of horticulture<br />
products, which are often highly nutrient-demand<strong>in</strong>g, particularly for systems of low technology (Antón <strong>et</strong><br />
al., 2005; Romero-Gámez <strong>et</strong> al., 2011). An special case, among fertilisers, is compost. Our previous studies<br />
have <strong>in</strong>dicated that compost fertilisers have higher environmental impacts than m<strong>in</strong>eral ones <strong>in</strong> some impact<br />
categories when yields are used as reference flow (Martínez-Blanco <strong>et</strong> al. 2011).<br />
Compost is also known to be a slow-release fertiliser, usually applied for periods of 1-2 years, consider<strong>in</strong>g<br />
the nutritional necessities of the annual or biannual crop cycle, <strong>in</strong> order to avoid <strong>in</strong>dividual environmental<br />
burdens of transport and mach<strong>in</strong>ery for each crop. Therefore, compost is applied at the beg<strong>in</strong>n<strong>in</strong>g of the rotation,<br />
but is supply<strong>in</strong>g nutrients to all the considered crops.<br />
Therefore, when the burdens of compost production and application have to be distributed among the crops<br />
<strong>in</strong> the cycle, a multifunctional problem arises. Accord<strong>in</strong>g to ISO 14044, wherever possible, allocation should<br />
be avoided by divid<strong>in</strong>g the unit process or expand<strong>in</strong>g the product system. Where allocation cannot be<br />
avoided, the <strong>in</strong>puts and outputs of the system should be partitioned b<strong>et</strong>ween its different products underly<strong>in</strong>g<br />
physical relationships, as a first option, or other relationships (e.g. economic value).<br />
Accord<strong>in</strong>gly, the ma<strong>in</strong> goal of our study is the comparison of the environmental performance of four crops <strong>in</strong><br />
a rotation, which are apply<strong>in</strong>g compost and m<strong>in</strong>eral fertilisers, when several m<strong>et</strong>hods for compost burdens<br />
distribution are used.<br />
For the study, four experimental Mediterranean crops (chard, tomato, cauliflower and onion) <strong>in</strong> a rotation are<br />
compared and the reference flow hectare is selected. Three ma<strong>in</strong> stages are <strong>in</strong>cluded with<strong>in</strong> the boundaries of<br />
the system: fertiliser production, transport and cultivation. Most of this data were obta<strong>in</strong>ed experimentally <strong>in</strong><br />
the fields and the compost<strong>in</strong>g plants, by the authors or from previous research of the group (Martínez-Blanco<br />
<strong>et</strong> al., 2011). When local <strong>in</strong>formation was not available, bibliographical sources and the database v2.0 were<br />
used. The environmental assessment is follow<strong>in</strong>g the obligatory classification and characterisation phases<br />
def<strong>in</strong>ed by the ISO 14044 and four mid-po<strong>in</strong>t impact categories are considered (acidification, eutrophication,<br />
abiotic depl<strong>et</strong>ion and global warm<strong>in</strong>g).<br />
Four alternative approaches for compost burdens distribution are compared here: (1) system expansion, i.e.<br />
the impacts of m<strong>in</strong>eral fertilisers avoided due to compost use are subtracted from the total burdens; and three<br />
allocation alternatives (2) accord<strong>in</strong>g to compost delayed m<strong>in</strong>eralisation; (3) accord<strong>in</strong>g to nitrogen crop requirements;<br />
and (4) accord<strong>in</strong>g to economic allocation us<strong>in</strong>g cost-benefit values.<br />
Compost burdens distributions are different for the four approaches and thus impact differences with the<br />
m<strong>in</strong>eral fertiliser traditional option, for each one of the crops <strong>in</strong> the rotation, are d<strong>et</strong>ected.<br />
References<br />
Antón, A., Montero, J.I., Muñoz, P., Castells, F., 2005. <strong>LCA</strong> and tomato production <strong>in</strong> Mediterranean greenhouses.<br />
Int. J. Agric. Resour. Gov. Ecol. 4(2), 102–112.<br />
Romero-Gamez, M., Anton, A., Soriano, T., Suarez-Rey, E.M., Castilla, N., 2011. Environmental impact of<br />
screenhouse and open-field cultivation us<strong>in</strong>g a life cycle analysisi. The case study of green bean production.<br />
J Cleaner Prod. On-l<strong>in</strong>e, doi:10.1016/j.jclepro.<br />
Martínez-Blanco, J., Muñoz, P., Antón, A., Rieradevall, R., 2011. Assessment of tomato Meditarrean production<br />
<strong>in</strong> open-filed and standard multi-tunnel greenhouse, with compost or m<strong>in</strong>eral fertilizers, from an<br />
agricultural and environmental standpo<strong>in</strong>t. J Cleaner Prod. 19, 985-997.<br />
807
GROUP 4, SESSION B: CROP PRODUCTION SYSTEMS 8 th Int. Conference on <strong>LCA</strong> <strong>in</strong> the<br />
Agri-<strong>Food</strong> Sector, 1-4 Oct <strong>2012</strong><br />
808<br />
102. How to overcome time variation <strong>in</strong> <strong>LCA</strong><br />
Saioa Ramos * , Guillermo Pardo, Jaime Zufia<br />
<strong>Food</strong> Research Division, AZTI-Tecnalia, Correspond<strong>in</strong>g author. E-mail: sramos@azti.es<br />
When perform<strong>in</strong>g an environmental impact analysis of food products and processes, <strong>LCA</strong> appears as a suitable<br />
tool. However, there are a number of uncerta<strong>in</strong>ties that need to be faced. Current studies regard<strong>in</strong>g life<br />
cycle analysis assessment of food products have reported high variability on the results depend<strong>in</strong>g ma<strong>in</strong>ly on<br />
the quality, reliability and significance of the <strong>in</strong>ventory data of the process or product. Functional unit and<br />
allocation or selection of system boundaries are other factors that <strong>in</strong>fluence directly on results.<br />
All those mentioned factors have been deeply studied; nevertheless, time dependant variations are, still today,<br />
a poorly studied variable (Reap <strong>et</strong> al., 2008). It has been shown that regard<strong>in</strong>g to primary production,<br />
and more specifically to the extraction of wild resources, this time scale could lead to an important variability<br />
on the obta<strong>in</strong>ed results (Ramos <strong>et</strong> al., 2011). This is due to unpredictable external factors that affect the<br />
performance of the activity such as environmental conditions or wh<strong>et</strong>her episodes. Regard<strong>in</strong>g food cha<strong>in</strong>s<br />
there are several sub-sectors which are susceptible to show variations on the impact characterisation depend<strong>in</strong>g<br />
on the selected period of time.<br />
On the topic of fisheries, recent study has shown great differences on the Global Warm<strong>in</strong>g Potential per ton<br />
of landed fish when perform<strong>in</strong>g a Timel<strong>in</strong>e <strong>LCA</strong> of the purse se<strong>in</strong>e Basque fle<strong>et</strong> (Ramos <strong>et</strong> al., 2011). Furthermore,<br />
significant variation <strong>in</strong> agricultural yields has been also suggested. Thus, <strong>in</strong> recent study on w<strong>in</strong>emak<strong>in</strong>g<br />
by Vazquez-Rowe <strong>et</strong> al., <strong>2012</strong>, significant variability of about 20% is also described for the eutrophication<br />
potential <strong>in</strong> a range of 4 years.<br />
To overcome timel<strong>in</strong>e matters, an approach with Basque trawl<strong>in</strong>g fle<strong>et</strong> have done us<strong>in</strong>g Data Envelopment<br />
Analysis (DEA) comb<strong>in</strong>ed with <strong>LCA</strong> (Iribarren <strong>et</strong> al., 2010). DEA was implemented to identify possible<br />
variations b<strong>et</strong>ween different years for each impact category along the selected period of time. This m<strong>et</strong>hodology<br />
analyses differences <strong>in</strong> the efficiency of every s<strong>in</strong>gle ship of each year and compare different impact<br />
categories b<strong>et</strong>ween the years and b<strong>et</strong>ween each ship.<br />
Results reported variations up to 25% <strong>in</strong> all the environmental impact categories b<strong>et</strong>ween studied years.<br />
However, when compar<strong>in</strong>g operational efficiencies b<strong>et</strong>ween fish<strong>in</strong>g vessels on each year, variations up to<br />
10% have reported. Therefore, DEA+<strong>LCA</strong> analysis suggest that for the Basque trawl<strong>in</strong>g fle<strong>et</strong> there is no<br />
considerable potential to reduce the environmental impact due to the fact that almost all the ships showed<br />
similar efficiencies.<br />
On the whole, there is a need to evaluate a wide range of years when perform<strong>in</strong>g a primary production <strong>LCA</strong>.<br />
Moreover, it is suggested that comb<strong>in</strong><strong>in</strong>g <strong>LCA</strong> with DEA could lead to an eco-efficiency benchmark<strong>in</strong>g<br />
analysis, <strong>in</strong> order to support decision-mak<strong>in</strong>g.<br />
References<br />
Iribarren D, Vázquez-Rowe I, Moreira MT, Feijoo G. Further potentials <strong>in</strong> the jo<strong>in</strong>t implementation of Life<br />
Cycle Assessment and Data Envelopment Analysis. Sci Total Environ 2010;408(22):5265–72.<br />
Ramos, S., Vázquez-Rowe, I., Art<strong>et</strong>xe, I., Moreira, M.T., Feijoo, G., Zufia, J.. 2011a. Environmental assessment<br />
of Atlantic mackerel (Scomber scombrus) <strong>in</strong> the Basque Country. Increas<strong>in</strong>g the time l<strong>in</strong>e delimitation<br />
<strong>in</strong> fishery <strong>LCA</strong> studies. Int J of Life Cycle Assess 16 (7), 599-610.<br />
Reap, J., Roman, F., Duncan, , Bras, B. 2008. A survey of unresolved problmens <strong>in</strong> life cycle assessment –<br />
Part 1: goal and scope and <strong>in</strong>ventory analysis. Int J Life CyCle Assess 13:290-300.<br />
Vazquez-Rowe., I, Villanueva-Rey, P. Moreira, Feijoo, G. <strong>2012</strong>. Environmental analysis of Ribeiro w<strong>in</strong>e<br />
from a timel<strong>in</strong>e perspective: Harvest year matters when report<strong>in</strong>g environmental impacts. Journal of Environmental<br />
Management 98:73-9.
GROUP 4, SESSION B: CROP PRODUCTION SYSTEMS 8 th Int. Conference on <strong>LCA</strong> <strong>in</strong> the<br />
Agri-<strong>Food</strong> Sector, 1-4 Oct <strong>2012</strong><br />
103. The role of spatial modell<strong>in</strong>g us<strong>in</strong>g GIS <strong>in</strong> the development of life<br />
cycle <strong>in</strong>ventory for Australian agriculture<br />
Jonathan Hercule 1 , Sandra Eady 2,* , Tim Grant 3 , Russell Lyons 4<br />
1 AgroParisTech, Paris, <strong>France</strong>, 2 CSIRO, Locked Bag 1, Armidale NSW 2350, Australia, 3 Lifecycle Strategies,<br />
Swanson Stre<strong>et</strong>, Melbourne VIC 3000, Australia, 4 CSIRO, 306 Carmody Road, St Lucia QLD 4067,<br />
Australia, * Correspond<strong>in</strong>g author. E-mail: sandra.eady@csiro.au<br />
In Life Cycle Assessment, spatial data has been used <strong>in</strong> a range of applications: to enable site or region specific<br />
impact assessment, to track the flow of pollutants through the environment, for biodiversity assessments<br />
of land use, and for develop<strong>in</strong>g new impact categories such as desertification. However, there has been<br />
limited application of spatial data to generate underly<strong>in</strong>g life cycle <strong>in</strong>ventory. This paper exam<strong>in</strong>es how spatial<br />
data can assist <strong>in</strong> build<strong>in</strong>g a national <strong>in</strong>ventory for agriculture, where a consistent approach across the<br />
nation is required, and d<strong>et</strong>ailed data collection at all sites or regions is not feasible.<br />
One of the first tasks <strong>in</strong> establish<strong>in</strong>g national life cycle <strong>in</strong>ventory for agriculture is to def<strong>in</strong>e the major production<br />
systems that represent the country’s production. In some <strong>in</strong>stances, this can be approached us<strong>in</strong>g GIS<br />
layers to describe land systems with<strong>in</strong> which the production of an agricultural commodity is likely to be relatively<br />
consistent. This approach has been applied to Australian wheat and wool production systems, with<br />
comb<strong>in</strong>ations of GIS layers for soil type, ra<strong>in</strong>fall and land use be<strong>in</strong>g used to identify relatively homogeneous<br />
regions for production. The goal of national <strong>in</strong>ventory is to present data with a structure that allows both<br />
regional differences <strong>in</strong> production systems to be identified as well as <strong>in</strong>ventory <strong>in</strong> a format that is appropriate<br />
for the next user <strong>in</strong> the supply cha<strong>in</strong>. GIS layers can be used to provide data to make this <strong>in</strong>ventory spatially<br />
explicit.<br />
Emissions to the environment are often dependant on the geo-location of the agricultural production system;<br />
this <strong>in</strong>cludes emissions such as pesticides, nutrient discharge to waterways and <strong>in</strong>direct N2O emissions from<br />
fertiliser and animal waste, where regional differences <strong>in</strong> ra<strong>in</strong>fall, temperatures and soils can be major d<strong>et</strong>erm<strong>in</strong>ants<br />
of flows to the environment. By geo-locat<strong>in</strong>g agricultural production these flows can be estimated <strong>in</strong><br />
a consistent manner across the nation by us<strong>in</strong>g appropriate GIS layers.<br />
Inputs from the techno-sphere for a number of important agricultural operations are <strong>in</strong>fluenced by factors<br />
related to the geo-location of the production system. As part of the AusAgLCI project we have been <strong>in</strong>vestigat<strong>in</strong>g<br />
means of us<strong>in</strong>g GIS data layers to standardise and simplify the choice of <strong>in</strong>ventory for agricultural<br />
production, so that important factors d<strong>et</strong>erm<strong>in</strong><strong>in</strong>g variation <strong>in</strong> <strong>in</strong>puts are accounted for without the need for<br />
d<strong>et</strong>ailed <strong>in</strong>dividual research by the <strong>LCA</strong> practitioner. As long as the geo-location of the production system is<br />
known, standard data can be accessed to give appropriate <strong>in</strong>ventory for that region. These <strong>in</strong>clude <strong>in</strong>puts<br />
such as pump<strong>in</strong>g energy required for irrigation (largely d<strong>et</strong>erm<strong>in</strong>ed by the height water needs to be pumped)<br />
and fuel <strong>in</strong>puts for cultivation (largely d<strong>et</strong>erm<strong>in</strong>ed by clay content of the soil). With GIS data now at the<br />
scale of 5km 2 or less, it becomes feasible to use this resource to accurately represent the local conditions for<br />
agricultural production.<br />
There are a number of ways <strong>in</strong> which GIS data can be used to enhance the development of LCI, <strong>in</strong> a manner<br />
that assists with consistency for national databases, allows a level of automated updat<strong>in</strong>g, and improves the<br />
accuracy of data <strong>in</strong>puts for production systems. The challenge is <strong>in</strong> turn<strong>in</strong>g these opportunities <strong>in</strong>to reality,<br />
with the provision of easy to use <strong>in</strong>terfaces b<strong>et</strong>ween GIS data and LCI, a step that is only just commenc<strong>in</strong>g<br />
for enabl<strong>in</strong>g the use of GIS data.<br />
809
GROUP 4, SESSION B: CROP PRODUCTION SYSTEMS 8 th Int. Conference on <strong>LCA</strong> <strong>in</strong> the<br />
Agri-<strong>Food</strong> Sector, 1-4 Oct <strong>2012</strong><br />
810<br />
104. Us<strong>in</strong>g spatial data to def<strong>in</strong>e <strong>in</strong>dustry sub-sectors for Australian<br />
wheat<br />
Gonzalo Mata 1,* , Sandra Eady 2 , Tim Grant 3<br />
1 2<br />
CSIRO Animal <strong>Food</strong> and Health Sciences, Private Bag 5, Wembley WA 6913, Australia, CSIRO Animal<br />
<strong>Food</strong> and Health Sciences, Locked Bag 1, Armidale NSW 2350, Australia, 3 Life Cycle Strategies Pty Ltd,<br />
<br />
125 Swanston Stre<strong>et</strong>, Melbourne Vic 3000, Australia, Correspond<strong>in</strong>g author. E-mail:<br />
Gonzalo.Mata@csiro.au<br />
A Life Cycle Inventory (LCI) for Australian agriculture is currently <strong>in</strong> development. With<strong>in</strong> each <strong>in</strong>dustry<br />
(e.g. crops, livestock, horticulture) sub-sectors need to be identified so that the LCI can be structured <strong>in</strong> such<br />
a way users can identify the most appropriate on-farm production process for their supply cha<strong>in</strong>. For <strong>in</strong>stance,<br />
major users of Australian wheat purchase gra<strong>in</strong> based on grade (gra<strong>in</strong> hardness and prote<strong>in</strong> content)<br />
rather than the region or production system employed to produce the wheat. However, primary sources of<br />
<strong>in</strong>formation to describe production data don’t necessarily relate well to grade classifications, as gra<strong>in</strong> quality<br />
expectations can be affected due to environmental <strong>in</strong>teractions or manipulated through blend<strong>in</strong>g of various<br />
sources of gra<strong>in</strong> to me<strong>et</strong> mark<strong>et</strong> specifications post-farm gate.<br />
Therefore, <strong>in</strong> develop<strong>in</strong>g a national <strong>in</strong>ventory for wheat it is necessary to def<strong>in</strong>e these production systems as<br />
regional sub-sectors of the <strong>in</strong>dustry, decide how many sub-sectors are needed to represent important differences<br />
<strong>in</strong> environmental impacts, and from these systems construct <strong>in</strong>ventory processes that have utility to the<br />
downstream users of Australian wheat.<br />
This paper will explore the GIS m<strong>et</strong>hodology needed to def<strong>in</strong>e regional sub-sectors for the Australian wheat<br />
<strong>in</strong>dustry, us<strong>in</strong>g a comb<strong>in</strong>ation of <strong>in</strong>dustry expertise and spatial data on land use, soil types, ra<strong>in</strong>fall and other<br />
available statistical boundaries and biophysical param<strong>et</strong>ers to capture regional differences which translate<br />
<strong>in</strong>to differentiated production systems with differentiated environmental impacts.
GROUP 4, SESSION B: CROP PRODUCTION SYSTEMS 8 th Int. Conference on <strong>LCA</strong> <strong>in</strong> the<br />
Agri-<strong>Food</strong> Sector, 1-4 Oct <strong>2012</strong><br />
105. Improv<strong>in</strong>g pesticide account<strong>in</strong>g <strong>in</strong> agricultural life cycle<br />
assessment: a review of exist<strong>in</strong>g <strong>LCA</strong> practice and available <strong>LCA</strong> and<br />
Ecological Risk Assessment models<br />
Mitchell Burns 1,* , Philippe Roux 2 , Carole S<strong>in</strong>fort 3 , Claud<strong>in</strong>e Bass<strong>et</strong>-Mens 1 , Eric Malezieux 1<br />
1 CIRAD, Research unit: Hortsys. TA B-103/PS4 Boulevard de la Lironde 34398 Montpellier Cedex 5,<br />
<strong>France</strong>, 2 IRSTEA, Research unit: ITAP, 361 rue JF Br<strong>et</strong>on, 34196 Montpellier, <strong>France</strong>, 3 SUPAGRO, Research<br />
unit: ITAP, 2 place Pierre Viala 34060 Montpellier Cedex 2, <strong>France</strong>, Correspond<strong>in</strong>g author. E-mail:<br />
mitchell.burns@cirad.fr<br />
Pesticides require special attention <strong>in</strong> agricultural Life Cycle Assessment (<strong>LCA</strong>) because: i) relative to other<br />
chemical <strong>LCA</strong>s pesticides are <strong>in</strong>tentionally applied to the biosphere; ii) they are designed to effect a targ<strong>et</strong><br />
group of organisms; and iii) for comparative purposes, they are a characteristic that dist<strong>in</strong>guishes organic and<br />
conventional cropp<strong>in</strong>g systems (Hauschild 2000). In a complementary paper, van Zelm <strong>et</strong> al. (submitted)<br />
characterise an overlap or gap that may exist b<strong>et</strong>ween LCI (<strong>in</strong>ventory) and LCIA (impact assessment) phases<br />
for the toxicity assessment of pesticide emissions <strong>in</strong> agroecosystems. Specifically, conceptual models or<br />
available experimental data used to assess pesticide fate should be compatible with the respective LCI and<br />
LCIA phases when consider<strong>in</strong>g temporal and spatial scale. This was identified to be an outcome of limited<br />
guidance be<strong>in</strong>g available for comb<strong>in</strong><strong>in</strong>g location-specific LCI and globally estimated LCIA outputs. However,<br />
as <strong>LCA</strong> has been mov<strong>in</strong>g toward more locally explicit impact assessments, similar to that of Ecological<br />
Risk Assessment (ERA) (USEPA 1998), accurate characterisation of more complex <strong>in</strong>teractions become<br />
<strong>in</strong>creas<strong>in</strong>gly important and the models used <strong>in</strong> LCI and LCIA phases should be adapted.<br />
An important conceptual difference b<strong>et</strong>ween <strong>LCA</strong> and ERA is that they respectively estimate “potential”<br />
global and “true” local impacts. It is common <strong>in</strong> <strong>LCA</strong> that generic emission factors are used to estimate the<br />
extent of chemical distribution b<strong>et</strong>ween the air, water and soil phases of the environment, with limited account<strong>in</strong>g<br />
of fate beyond the agricultural parcel gate. In contrast, ERA accounts for more complex fate phenomena<br />
to def<strong>in</strong>e the distribution and emission of pesticides beyond the farm gate, as accurate accounts of<br />
these processes are important for risk management. The development of more complex emission models (e.g.<br />
PestLCI; Birkved and Hauschild 2006) has seen <strong>LCA</strong> move toward this level of complexity. However, an<br />
<strong>in</strong>ventory of pesticide application and fate management techniques (e.g. buffer zones, <strong>et</strong>c) accord<strong>in</strong>g to crop<br />
type is needed to improve accurate estimations of chemical distribution and fate for such modell<strong>in</strong>g efforts.<br />
This paper presents a review of how <strong>LCA</strong>s have typically accounted for pesticide fate and distribution <strong>in</strong> the<br />
field tog<strong>et</strong>her with the ma<strong>in</strong> available fate models benchmarked aga<strong>in</strong>st environmental fate (<strong>in</strong>clud<strong>in</strong>g transport,<br />
transfer and degradation) characterisation approaches typically used <strong>in</strong> ERA, and proposes some m<strong>et</strong>hods<br />
to improve this area of research.<br />
References<br />
Birkved, M., Hauschild, M.Z., 2006. PestLCI - A model for estimat<strong>in</strong>g field emissions of pesticides <strong>in</strong> agricultural<br />
<strong>LCA</strong>. Ecol. Model. 198, 433-451.<br />
Hauschild, M. Z. 2000. Estimat<strong>in</strong>g pesticide emissions for <strong>LCA</strong> of agricultural products, <strong>in</strong> Weidema, B.P.,<br />
Meeusen, M.J.G (Eds.), Agricultural data for life cycle assessments, vol. 2. <strong>LCA</strong>N<strong>et</strong> <strong>Food</strong>, The Hague,<br />
pp. 64-79.<br />
United States Environmental Protection Agency (USEPA) 1998. Guidel<strong>in</strong>es for Ecological Risk Assessment,<br />
USEPA, Wash<strong>in</strong>gton.<br />
van Zelm, R., Larrey-Lassalle, P., Roux, P., (submitted). Bridg<strong>in</strong>g the gap b<strong>et</strong>ween LCI and LCIA for toxicological<br />
assessments of pesticides used <strong>in</strong> crop production: application to banana grow<strong>in</strong>g, <strong>in</strong>: 8th International<br />
Conference on <strong>LCA</strong> <strong>in</strong> the Agri-<strong>Food</strong> Sector, Sa<strong>in</strong>t <strong>Malo</strong>, <strong>France</strong>, 2-4 October <strong>2012</strong>.<br />
811
GROUP 4, SESSION B: CROP PRODUCTION SYSTEMS 8 th Int. Conference on <strong>LCA</strong> <strong>in</strong> the<br />
Agri-<strong>Food</strong> Sector, 1-4 Oct <strong>2012</strong><br />
812<br />
106. Comparison of assessment m<strong>et</strong>hods for the environmental<br />
impacts of pesticide production<br />
Kiyotada Hayashi 1,* , Koichi Shobatake 2 , Naoki Mak<strong>in</strong>o 2<br />
1 National Agriculture and <strong>Food</strong> Research Organization, Japan, 2 TCO2 Co. Ltd., Japan, * Correspond<strong>in</strong>g<br />
author. E-mail: hayashi@affrc.go.jp<br />
With regard to the environmental impact of agricultural production systems, the proportion of pesticide production<br />
is smaller than that of, for example, chemical fertiliser production (Hayashi, 2011). Although life<br />
cycle <strong>in</strong>ventory (LCI) analysis of pesticides has been limited, there have been recent development <strong>in</strong> estimation<br />
techniques for the environmental impacts of pesticide production (Wern<strong>et</strong> <strong>et</strong> al., 2008) and for the LCIs<br />
of pesticides (Sutter, 2010). However, the differences b<strong>et</strong>ween the various assessment m<strong>et</strong>hods are not well<br />
understood, and the practical implications for LCI data construction are not known. Therefore, this study<br />
compares different assessment m<strong>et</strong>hods for the environmental impacts of pesticide production.<br />
The assessment m<strong>et</strong>hods considered <strong>in</strong> this study <strong>in</strong>clude (1) assessment based on eco<strong>in</strong>vent 2.2 (hereafter,<br />
eco<strong>in</strong>vent), (2) estimation us<strong>in</strong>g the F<strong>in</strong>echem tool (hereafter, F<strong>in</strong>echem), and (3) estimation us<strong>in</strong>g emission<br />
factors derived from <strong>in</strong>put-output tables for Japan (hereafter, IO). We conducted two comparisons, namely,<br />
one b<strong>et</strong>ween eco<strong>in</strong>vent and F<strong>in</strong>echem, and the other b<strong>et</strong>ween eco<strong>in</strong>vent and IO. Twenty active <strong>in</strong>gredients<br />
were analysed <strong>in</strong> the first comparison, and 52 pesticide products (13 active <strong>in</strong>gredients) were assessed <strong>in</strong> the<br />
latter. Global warm<strong>in</strong>g (IPCC 2007 GWP 100a) was used as the impact category. S-PLUS (TIBCO Spotfire<br />
S+® 8.1J for W<strong>in</strong>dows) was employed for statistical analyses such as regression analysis.<br />
The result of the first comparison showed that it is difficult to f<strong>in</strong>d a correlation b<strong>et</strong>ween the results obta<strong>in</strong>ed<br />
from eco<strong>in</strong>vent and from F<strong>in</strong>echem (Fig. 1). In general, the variability (standard deviation) <strong>in</strong> the case of<br />
F<strong>in</strong>echem was larger than that <strong>in</strong> the case of eco<strong>in</strong>vent. The result of the second comparison demonstrated<br />
that the d<strong>et</strong>erm<strong>in</strong>ation coefficients of the regression analyses were sufficiently large, and that the regression<br />
coefficients were significant at the 1% or 5% levels. The estimated values based on IO tended to be 5 times<br />
or 10 times larger than those based on eco<strong>in</strong>vent (Fig. 2, Table 1).<br />
These results <strong>in</strong>dicate that under the assumption that estimated values based on eco<strong>in</strong>vent are reliable, further<br />
study is necessary for develop<strong>in</strong>g reliable estimation m<strong>et</strong>hods. In addition, although the values obta<strong>in</strong>ed from<br />
eco<strong>in</strong>vent can be predicted from the values obta<strong>in</strong>ed from IO, adjustments may be necessary because of the<br />
tendency to overestimate <strong>in</strong> the latter. The dependence of the results on the selection of the assessment<br />
m<strong>et</strong>hod is expected to be resolved by further development of life cycle <strong>in</strong>ventories.<br />
References<br />
Hayashi, K., 2011. Assess<strong>in</strong>g management <strong>in</strong>fluence on environmental impacts under uncerta<strong>in</strong>ty: a case<br />
study of paddy rice production <strong>in</strong> Japan, <strong>in</strong>: F<strong>in</strong>kbe<strong>in</strong>er, M. (Ed.), Towards Life Cycle Susta<strong>in</strong>ability<br />
Management. Spr<strong>in</strong>ger, pp. 331-340.<br />
Sutter, J., 2010. Life cycle <strong>in</strong>ventories of pesticides, Swiss Centre for Life Cycle Inventories, St. Gallen.<br />
Wern<strong>et</strong>, G., Hellweg, S., Fischer, U., Papadokonstantakis, S., Hungerbühler, K. 2008. Molecular-structurebased<br />
models of chemical <strong>in</strong>ventories us<strong>in</strong>g neural n<strong>et</strong>works. Environ. Sci. Technol. 42, pp. 6717-6722.
GROUP 4, SESSION B: CROP PRODUCTION SYSTEMS 8 th Int. Conference on <strong>LCA</strong> <strong>in</strong> the<br />
GHG emissions based on eco<strong>in</strong>vent 2.2<br />
(kg CO2 eq./kg <strong>in</strong>gredient)<br />
16<br />
14<br />
12<br />
10<br />
8<br />
6<br />
4<br />
2<br />
Fungicide Molluscicide Herbicide<br />
0<br />
0 5 10 15 20 25 30 35<br />
GHG emissions based on F<strong>in</strong>echem<br />
(kg CO 2 eq./kg-<strong>in</strong>gredient)<br />
Figure 1. The relationship b<strong>et</strong>ween greenhouse gas<br />
(GHG) emissions based on F<strong>in</strong>echem and those based<br />
on eco<strong>in</strong>vent 2.2.<br />
Agri-<strong>Food</strong> Sector, 1-4 Oct <strong>2012</strong><br />
0<br />
0 10 20 30 40 50 60<br />
Figure 2. The relationship b<strong>et</strong>ween greenhouse gas<br />
(GHG) emissions based on <strong>in</strong>put-output tables and<br />
those based on eco<strong>in</strong>vent 2.2.<br />
Table 1. The results of regression analysis without <strong>in</strong>tercepts<br />
Type of pes- Adjusted R- Regression coeffiticidesquarecient<br />
Fungicides 0.881 0.097**<br />
Insecticides 0.702 0.128*<br />
Herbicides<br />
* Significant at 5% level.<br />
** Significant at 1% level.<br />
0.880 0.225**<br />
GHG emissions based on eco<strong>in</strong>vent 2.2<br />
(kg CO2 eq./kg-product)<br />
10<br />
9<br />
8<br />
7<br />
6<br />
5<br />
4<br />
3<br />
2<br />
1<br />
Fungicide Insecticide Herbicide<br />
GHG emissions based on <strong>in</strong>put-output tables<br />
(kg CO 2 eq./kg-product)<br />
813
GROUP 4, SESSION B: CROP PRODUCTION SYSTEMS 8 th Int. Conference on <strong>LCA</strong> <strong>in</strong> the<br />
Agri-<strong>Food</strong> Sector, 1-4 Oct <strong>2012</strong><br />
814<br />
107. Implement<strong>in</strong>g decision mak<strong>in</strong>g <strong>in</strong> irrigation management based<br />
on productive and environmental <strong>in</strong>dicators<br />
Maria José Amores 1,* , <strong>France</strong>sc Ferrer 2 , Orene Cabot 2 , Assumpció Anton 1,3 , Albert Duaigües 2 , <strong>France</strong>sc<br />
Castells 1 , Esk<strong>in</strong>der Demisse Gemechu 1<br />
1 Universitat Rovira i Virgili, Tarragona, Spa<strong>in</strong>, 2 LabFerrer. Centre Assessoria Dr Ferrer SL, Cervera<br />
(Lleida), Spa<strong>in</strong>, 3 Institut de Recerca i Tecnologia Agroalimentaria, Eng<strong>in</strong>yeria i Biosistemes. Cabrils (Barcelona),<br />
Spa<strong>in</strong>, Correspond<strong>in</strong>g author. E-mail: mariajose.amores@urv.cat<br />
Irrigated agriculture faces the need to improve water management practices at a farm level from a productive,<br />
social and environmental po<strong>in</strong>t of view. To evaluate the performance from a productive and water use<br />
efficiency po<strong>in</strong>t of view, some <strong>in</strong>dices have been traditionally used (Hoffman <strong>et</strong> al., 2007; Fessehaziona <strong>et</strong><br />
al., 2011 and Stirzaker, 2011). They could be classified <strong>in</strong> three categories: first, Water Productivity or Irrigation<br />
requirements based on water consumption, yield and evapotranspiration (ET) estimations; second,<br />
Leach<strong>in</strong>g fraction or dra<strong>in</strong>age requirements for soil and water sal<strong>in</strong>ity control; and third, Irrigation system<br />
performance. To be useful to the irrigator, these <strong>in</strong>dexes should be calculated for each Farm Management<br />
Unit (FMU), which may correspond to a particular field where water consumption, potential water crop requirements<br />
(ETc), yield, manpower, mach<strong>in</strong>ery and other param<strong>et</strong>ers could be assigned. At the end of the<br />
season, these <strong>in</strong>dicators could help assess<strong>in</strong>g its strategy, by benchmark<strong>in</strong>g the FMUs performance, th<strong>in</strong>k<br />
about changes or improvements that may have a beneficial impact on the crop and water use performance of<br />
the farm. To be able to steer irrigation management along the grow<strong>in</strong>g season and make tactical decisions,<br />
reliable <strong>in</strong>formation should be obta<strong>in</strong>ed at different scales (FMUs, farm and watershed). Assess<strong>in</strong>g practices<br />
to reduce the environmental impact of irrigation (ma<strong>in</strong>ly, avoid<strong>in</strong>g consumptions beyond real necessities and<br />
reduc<strong>in</strong>g the impact of leach<strong>in</strong>g and erosion) will have to be done at a FMU scale and be <strong>in</strong>tegrated <strong>in</strong>to the<br />
manager’s dashboard. Therefore, the quantification of water use susta<strong>in</strong>ability <strong>in</strong>dicators should be based on<br />
a solid and simple conceptual model, so it can be <strong>in</strong>tegrated <strong>in</strong>to the farmer’s decision mak<strong>in</strong>g processes.<br />
This work presents an attempt to implement an <strong>in</strong>ventory procedure at a Management Unit level with the aim<br />
of calculat<strong>in</strong>g production, water use and environmental <strong>in</strong>dicators to quantify and assess the impact of irrigation,<br />
and to <strong>in</strong>tegrate it <strong>in</strong>to the managers’ dashboard to make strategical decisions. We believe that the results<br />
from this project could help orient<strong>in</strong>g the application of the much more complex Life Cycle Assessment<br />
(<strong>LCA</strong>) to quantify and assess the environmental impact of irrigation consider<strong>in</strong>g a system beyond the limits<br />
of the farm. As a practical trial of assessment of sustanaibility and decision mak<strong>in</strong>g a case study was carried<br />
out <strong>in</strong> the Ebro Valley near Lleida (NE Spa<strong>in</strong>) where three irrigated farms where chosen dur<strong>in</strong>g the 2011<br />
grow<strong>in</strong>g season. The crops were v<strong>in</strong>eyard, nectar<strong>in</strong>e and corn for silage. In this first year, the goal of the<br />
project was to construct a web-based program to calculate the basic production and water use efficiency <strong>in</strong>dicators,<br />
based on real data and a solid conceptual model. The idea beh<strong>in</strong>d was to validate the results for the<br />
studied FMUs, to test if this procedure can be used at a larger farm scale (with many FMUs) and to assess<br />
the eventual <strong>in</strong>sertion <strong>in</strong>to the software of environmental susta<strong>in</strong>ability <strong>in</strong>dicators.<br />
By and large, there are several criteria and m<strong>et</strong>hods to assess environmental susta<strong>in</strong>ability at farm level, so it<br />
provides some <strong>in</strong>creas<strong>in</strong>g variability and uncerta<strong>in</strong>ty. Hence, it is needed assess<strong>in</strong>g that from statistical po<strong>in</strong>t<br />
of view or from large regions. However, that issue lead us to discuss about underestimat<strong>in</strong>g or overvalu<strong>in</strong>g<br />
the susta<strong>in</strong>ability, highlight the importance of geographical reference units and quantify the uncerta<strong>in</strong>ty that<br />
these decisions could have to choose the correct criteria for decision makers.<br />
References<br />
Fessehaziona, M.K., R.J. Stirzaker, J.G. Annandale, C.S. Everson.2011. Improv<strong>in</strong>g nitrogen and irrigation<br />
water use efficiency through adaptive management: A case study us<strong>in</strong>g annual ryegrass. Agriculture, ecosystems,<br />
environment 141 (2011): 350-358<br />
Hoffman, G.J., R.G. Evans, M.E. Jensen, D.L. Mart<strong>in</strong>, R.L. Elliott (Eds.). 2007. Design and operation of<br />
farm irrigation systems. 2 nd Edition. ABABE, MI, USA.<br />
Stirzaker, R.J. 2011. Strategy, tactics and heuristics for manag<strong>in</strong>g solutes <strong>in</strong> horticultural crops. Proc. 6 th IS<br />
on Irrigation of Horticultural crops. Ed.: S. Ortega-Farias and G. Selles. Acta Hort. 889, ISHS 2011
GROUP 4, SESSION B: CROP PRODUCTION SYSTEMS 8 th Int. Conference on <strong>LCA</strong> <strong>in</strong> the<br />
Agri-<strong>Food</strong> Sector, 1-4 Oct <strong>2012</strong><br />
Table 1 Results for the studied Farm Management Units (FMUs) <strong>in</strong> 2011.<br />
Yield<br />
Area (kg ha<br />
FMU (ha)<br />
-<br />
Water consumption<br />
1<br />
)<br />
1 (m 3<br />
ha -1 Energy consumption<br />
)<br />
2<br />
Acc<br />
(kWh)<br />
3 . Acc<br />
ETo<br />
(mm)<br />
3 .<br />
Precip. WUE<br />
(mm)<br />
4<br />
(kg m -3 EUE<br />
)<br />
5<br />
(kg<br />
kWh -1 )<br />
V<strong>in</strong>eyard 4.2 11,935 2,040 2,859 838 93 4.36 4.17<br />
Nectar<strong>in</strong>e 12.5 44,780 5,424 3,300 897 272 5.86 13.57<br />
Corn 70.0 14,286 6,750 3,000 595 81 1.96 4.76<br />
1<br />
The irrigation season for each crop was as follows: V<strong>in</strong>eyard (28 March to 26 Sept 2011; 26 weeks), Nectar<strong>in</strong>e<br />
(7 March to 31 Oct 2011; 34 weeks) and Corn (23 May to 12 Sept, 2011; 16 weeks). Irrigation uniformity<br />
and application efficiency of the irrigation system was estimated from default values, with spr<strong>in</strong>klers <strong>in</strong><br />
the corn and drippers <strong>in</strong> the other two crops.<br />
2<br />
Energy consumption (kWh) was provided by the farms’ manager.<br />
3<br />
Weekly weather data (Precipitation and Reference ET) was gathered from nearby automatic monitor<strong>in</strong>g<br />
weather stations consider<strong>in</strong>g the irrigation season for each crop. Crop coefficients (kc = ETc/ETo) were obta<strong>in</strong>ed<br />
from local extension agents.<br />
4<br />
Water Use Efficiency (WUE), consider<strong>in</strong>g applied water + effective precipitation.<br />
5<br />
Energy Use Efficiency (EUE), consider<strong>in</strong>g the energy used to pump the water.<br />
Acknowledgements: This work was partially f<strong>in</strong>anced by the VALOR 2010 fund<strong>in</strong>g from the Generalitat de<br />
Catalunya (Spa<strong>in</strong>). We also would like to thank the valuable advice from Prof. Josep M. Villar (University of<br />
Lleida). We also would like to thank the <strong>in</strong>terest and the help from the farm managers.<br />
815
GROUP 4, SESSION B: CROP PRODUCTION SYSTEMS 8 th Int. Conference on <strong>LCA</strong> <strong>in</strong> the<br />
Agri-<strong>Food</strong> Sector, 1-4 Oct <strong>2012</strong><br />
816<br />
108. <strong>LCA</strong>s for a large repertoire of F<strong>in</strong>nish outdoor plant products<br />
Merja Saar<strong>in</strong>en * , Yrjö Virtanen, Helena Hyvär<strong>in</strong>en<br />
MTT Agrifood Research F<strong>in</strong>land, * Correspond<strong>in</strong>g author. E-mail: merja.saar<strong>in</strong>en@mtt.fi<br />
The paper presents results of <strong>LCA</strong> for a large repertoire of outdoor crops produced <strong>in</strong> F<strong>in</strong>land <strong>in</strong> two resource<br />
use categories (land and energy) and three impact categories (climate change, eutrophication and<br />
acidification). Assessed crops were cereals, potato, rapeseed, pea, broad bean, carrot, be<strong>et</strong>root, yellow turnip,<br />
parsnip, Ch<strong>in</strong>ese cabbage, onion, strawberry and blackcurrant.<br />
The functional unit of <strong>LCA</strong>s is the kilo of a product at the farm gate (without packag<strong>in</strong>g). System boundaries<br />
<strong>in</strong>clude production of agricultural <strong>in</strong>puts and energy <strong>in</strong> the upstream phases, and use of agricultural <strong>in</strong>puts<br />
and energy, and mechanical work <strong>in</strong> the production phase on farms. However, potential packag<strong>in</strong>g and storage<br />
on farms, and transportation of agricultural <strong>in</strong>puts to the farm were excluded from the product systems.<br />
Emissions from organic soils were excluded. Data on agricultural <strong>in</strong>put manufacture were obta<strong>in</strong>ed from<br />
<strong>in</strong>dustry, which produces most agricultural <strong>in</strong>puts used <strong>in</strong> F<strong>in</strong>land. Energy consumption was based on the<br />
F<strong>in</strong>nish average grid values. Data on the use of <strong>in</strong>puts for crop production were based on the national agricultural<br />
database, compris<strong>in</strong>g data on the cultivation <strong>in</strong>stances of various crops, i.e. primary data. Data on mechanical<br />
work were based on physical models. Data represent average F<strong>in</strong>nish production. Emissions and<br />
impacts from domestic animal production (<strong>in</strong>clud<strong>in</strong>g manure-based emission from animal shelter and storage)<br />
were not allocated to the manure used as fertiliser for plant production. There were no other significant<br />
allocation issues.<br />
For the climate impact calculation, estimation of N2O, CO2 and <strong>in</strong>direct N2O emissions from the field were<br />
based on the IPCC m<strong>et</strong>hod and data (IPCC, 2006). Data on NH3 emissions from the application of fertilisers<br />
were estimated based on models from the EEA (European Environmental Agency, 2006). For the assessment<br />
of eutrophication, site-specific nitrogen and phosphorus leach<strong>in</strong>g models and site-dependent factors were<br />
applied.<br />
The climate impact and acidification of rapeseed was by far the highest, and the lowest was for root veg<strong>et</strong>ables<br />
and potato (Table 1). The eutrophication potential of broad bean was highest, followed by Ch<strong>in</strong>ese cabbage,<br />
and the lowest eutrophication potential was for carrot, followed by oat and barley. Production of rapeseed<br />
consumed most energy, and root veg<strong>et</strong>ables the least. Source of energy varied considerably among<br />
products.<br />
It is concluded that the priority order of products varies accord<strong>in</strong>g to impact category, as <strong>in</strong>dicated <strong>in</strong> Table<br />
1. CO2 and N2O are the ma<strong>in</strong> emissions that impact climate. Their share differs for different plants. Figure 1<br />
illustrates the significance of different emissions for climate impact.<br />
The study was part of the ConsEnv-project. The results have been used <strong>in</strong> the <strong>LCA</strong> for lunch portions<br />
(Saar<strong>in</strong>en <strong>et</strong> al., <strong>2012</strong>) tog<strong>et</strong>her with <strong>LCA</strong> results for animal-based products (Usva <strong>et</strong> al., <strong>2012</strong>).<br />
References<br />
European Environment Agency (EEA) 2006. EMEP/CORINAIR Emission Inventory Guidebook - 2006.<br />
Web publication. Available at: http://www.eea.europa.eu/publications/EMEPCORINAIR4<br />
IPCC, 2006. IPCC Guidel<strong>in</strong>es for National Greenhouse Gas Inventories. Volume 4. Agriculture, Forestry<br />
and Other Land Use. IPCC-NGGIP Publications<br />
Saar<strong>in</strong>en, M., Kurppa, S., Virtanen, Y., Usva, K., Mäkelä, J. and A. Niss<strong>in</strong>en, 2011. <strong>LCA</strong> approach to the<br />
impact of homemade, ready-to-eat and school lunches on climate and eutrophication. J Cleaner Production.<br />
28, 177-186.<br />
Saar<strong>in</strong>en, M., Kurppa, S., Virtanen, Y., Usva, K., Mäkelä, J. and A. Niss<strong>in</strong>en, <strong>2012</strong>b. <strong>LCA</strong> approach to the<br />
impact of homemade, ready-to-eat and school lunches on climate and eutrophication. J Cleaner Production<br />
28, 177-186.<br />
Usva, K., Nousia<strong>in</strong>en, J., Hyvär<strong>in</strong>en, H. and Y. Virtanen <strong>2012</strong>. <strong>LCA</strong>s of average animal products pork, beef,<br />
milk and eggs <strong>in</strong> F<strong>in</strong>land. Abstract for <strong>LCA</strong> <strong>Food</strong> <strong>2012</strong> Conference.
GROUP 4, SESSION B: CROP PRODUCTION SYSTEMS 8 th Int. Conference on <strong>LCA</strong> <strong>in</strong> the<br />
Agri-<strong>Food</strong> Sector, 1-4 Oct <strong>2012</strong><br />
Table 1. Results of <strong>LCA</strong>s for plant products produced <strong>in</strong> F<strong>in</strong>land.<br />
Climate<br />
impact,<br />
kg CO2<br />
Total energy<br />
use,<br />
kWh/kg<br />
Eutrophication, Acidification, Land use,<br />
Product eq/kg g PO4 eq/kg g AE/kg ha/1000kg<br />
Barley 0.60 1.27 0.67 0.28 0.557<br />
Rye 0.86 2.00 0.80 0.34 0.656<br />
Wheat 0.68 1.44 0.62 0.26 0.554<br />
Oat 0.62 1.26<br />
0.89 0.29 0.588<br />
Potato 0.08 0.25<br />
0.08 0.04 0.054<br />
Rapeseed 1.48 3.39<br />
1.42 0.71 0.949<br />
Pea 0.41 1.55<br />
0.57 0.41 0.516<br />
Broad bean 0.43 4.56<br />
0.58 0.37 0.641<br />
Carrot 0.06 0.11<br />
0.05 0.02 0.024<br />
Be<strong>et</strong>root 0.08 0.21<br />
0.07 0.04 0.027<br />
Yellow tur- 0.08 0.20<br />
0.08 0.03 0.039<br />
nip 0.21 0.37<br />
0.16 0.05 0.050<br />
Parsnip 0.25 0.41<br />
0.21 0.05 0.376<br />
Ch<strong>in</strong>ese 0.13 0.31<br />
0.11 0.05 0.053<br />
cabbage 0.47 2.59<br />
0.37 0.30 0.703<br />
Onion<br />
Strawberry<br />
Blackcurrant<br />
0.45 2.94<br />
0.36 0.33 0.743<br />
Figure 1. Climate impact per kg product divided by ma<strong>in</strong> emissions.<br />
817
GROUP 4, SESSION B: CROP PRODUCTION SYSTEMS 8 th Int. Conference on <strong>LCA</strong> <strong>in</strong> the<br />
Agri-<strong>Food</strong> Sector, 1-4 Oct <strong>2012</strong><br />
818<br />
109. Life cycle assessment of long-lived perennial cropp<strong>in</strong>g systems:<br />
almond and pistachio production <strong>in</strong> California<br />
Elias Marv<strong>in</strong>ney 1,* , Alissa Kendall, Sonja Brodt, Theodore Dejong<br />
1 University of California, Davis, California, USA, * Correspond<strong>in</strong>g author. E-mail: emarv<strong>in</strong>ney@ucdavis.edu<br />
This study characterises typical almond and pistachio orchard production systems <strong>in</strong> the U.S. state of California.<br />
These <strong>in</strong>dustrialised agro-ecosystems are of great economic and environmental importance, encompass<strong>in</strong>g<br />
more than 361,300 ha of the state’s agricultural land and yield<strong>in</strong>g more than 85% of global almond<br />
exports and 50% of global pistachio exports. In 2009, 240,000 tonnes of almonds and 82,000 tonnes of pistachio<br />
were imported by the European Union (USDA 2009). Commercial nut orchards <strong>in</strong> California’s Central<br />
Valley demand significant agrochemical <strong>in</strong>puts, irrigation, and fuel for mechanised field operations throughout<br />
their lifespan - up to 25 years for almond (Duncan <strong>et</strong> al 2011) and 80 years for pistachio (Beede <strong>et</strong> al<br />
2008). Due to high-<strong>in</strong>tensity <strong>in</strong>puts and long lifespans of these systems, the California nut <strong>in</strong>dustry is responsible<br />
for significant emissions of greenhouse gases (GHGs) and other atmospheric pollutants.<br />
Orchards have the potential to sequester carbon <strong>in</strong> soils and/or biomass (Kroodsma and Field 2006). In California,<br />
much of this biomass is used to produce electricity at regional electricity generation plants, widely<br />
distributed <strong>in</strong> California (Wallace 2007). The potential for sequestration versus emissions offs<strong>et</strong> through use<br />
of waste biomass as an energy feedstock is dependent on management characteristics, orchard lifespan, and<br />
other factors. Here we present a comparative assessment of the n<strong>et</strong> GHG footpr<strong>in</strong>t of California almond and<br />
pistachio production, account<strong>in</strong>g for material and energy <strong>in</strong>puts of production up to farm gate, exclud<strong>in</strong>g<br />
process<strong>in</strong>g and distribution as well as annual variation <strong>in</strong> operations and <strong>in</strong>puts as trees mature.<br />
The study also explores the potential for carbon sequestration and GHG offs<strong>et</strong> under several possible scenarios<br />
for both pistachio and almond. Data were gathered from cost-r<strong>et</strong>urn studies, farmer surveys, and published<br />
literature. Transportation characteristics, <strong>in</strong>-field emissions from fuel combustion, and soil ecological<br />
processes were <strong>in</strong>dependently modelled. Our analysis provides <strong>in</strong>formation for growers on where to focus<br />
GHG reduction efforts and offers <strong>in</strong>sights regard<strong>in</strong>g the trade-offs b<strong>et</strong>ween energy and material <strong>in</strong>puts and<br />
field emissions under different management scenarios, as well as provid<strong>in</strong>g an assessment of the typical<br />
greenhouse gas and energy footpr<strong>in</strong>t of an economically important export commodity.<br />
References<br />
Beede R. H., Kallsen C. E., Holtz B. A., Klonsky K. M., Moura R. L. D., 2008. Sample costs to establish an<br />
orchard and produce pistachios: San Joaqu<strong>in</strong> Valley South – Low volume Irrigation. University of California<br />
Cooperative Extension. Davis CA.<br />
Duncan, R. A., Verdegaal, P. S., Holtz, B. A., Doll, D. A., Klonsky, K. A., Moura, R. L. D., 2011. Sample<br />
costs to establish an orchard and produce almonds: San Joaqu<strong>in</strong> Valley North – Microspr<strong>in</strong>kler Irrigation.<br />
University of California Cooperative Extension. Davis CA.<br />
USDA Office of Global Analysis, 2009. Tree Nuts: World Mark<strong>et</strong>s and Trade. United States Department of<br />
Agriculture, Foreign Agriculture Service. Wash<strong>in</strong>gton, D.C.<br />
Wallace H. N., 2007. Feasibility of a California Energy Feedstock Supply Cooperative. California Center for<br />
Cooperative Development. Davis, CA.
GROUP 4, SESSION B: CROP PRODUCTION SYSTEMS 8 th Int. Conference on <strong>LCA</strong> <strong>in</strong> the<br />
Agri-<strong>Food</strong> Sector, 1-4 Oct <strong>2012</strong><br />
110. Land use key param<strong>et</strong>ers to be addressed <strong>in</strong> life cycle assessment<br />
study of soybean gra<strong>in</strong>s<br />
Anna Lúcia Mourad 1,* , Lília Sichmann Heiffig-del Aguila 2<br />
1 CETEA – Packag<strong>in</strong>g Technology Center / ITAL – Institute of <strong>Food</strong> Technology, Brazil, 2 Brazilian Agricultural<br />
Research Corporation – EMBRAPA Temperate Agriculture, Brazil, Correspond<strong>in</strong>g author. E-mail:<br />
anna@ital.sp.gov.br<br />
Brazil is considered as one of the largest exporters of agricultural products <strong>in</strong> the world. The growth of Brazilian<br />
agriculture <strong>in</strong> a cont<strong>in</strong>uous and solid way is extremely important to improve the quality of life of millions<br />
of Brazilians. A great part of this growth has come from the soy complex (gra<strong>in</strong>, meal and oil) whose<br />
exports have more than quadrupled over the last 10 years, reach<strong>in</strong>g the value of US$ 23.8 billion <strong>in</strong> 2011. In<br />
2011, Brazil produced 74.3 million tons of soy, be<strong>in</strong>g ranked as the second largest world producer of soy<br />
with 26% of the world crop, estimated at 263.7 million tons. The cultivation of soy occupies the largest area<br />
(35.7%) among the products of the annual and perennial crops of the country. Soy is planted practically all<br />
over the country with the Center-west (49%) and South (34%) be<strong>in</strong>g two of largest areas. The recent expansion<br />
of the crop has taken place <strong>in</strong> areas of degraded pasturelands. Due to the importance of this crop to the<br />
country, the objective of this work is to select important param<strong>et</strong>ers relative to the land use which can be<br />
considered <strong>in</strong> a life cycle assessment study of soy gra<strong>in</strong>s. The first selected param<strong>et</strong>er is the occupation of<br />
agricultural lands for this crop. The country has an area of 8.5 million of km 2 of which 37.3% is used for<br />
general agricultural and pasture purposes and 25.6% for cultivation of food products such as meat and veg<strong>et</strong>ables.<br />
As the param<strong>et</strong>ers for land use have not been established y<strong>et</strong> for <strong>LCA</strong> purposes <strong>in</strong> the country, 2.18<br />
million of km 2 was considered as the reference area for normalisation of land for food production. The average<br />
land occupation for the soy crop 1.12 m 2 yr per ton produced <strong>in</strong> 2010. Besides the territorial occupation<br />
itself the authors suggest that the total amount of fertilisers <strong>in</strong> relation to the nitrogen, phosphorus and potassium<br />
macronutrients as well as the total amount of pesticides (only actives) used per hectare could be <strong>in</strong>dicative<br />
of the human <strong>in</strong>terference on the land. These <strong>in</strong>dicators are <strong>in</strong>dependent of the climate, temperature,<br />
relief, type of the soil or other factor that m<strong>in</strong>imises the anthropogenic <strong>in</strong>terference due to the capability of<br />
nature recover<strong>in</strong>g. They are also <strong>in</strong>dependent of time, a key param<strong>et</strong>er <strong>in</strong> agricultural impacts. The impact of<br />
land use could be evaluated by soil organic matter content as this measure is considered as the one of the best<br />
stand-alone <strong>in</strong>dicator of life support functions of land. Soil organic matter, consist<strong>in</strong>g mostly of C, is the<br />
largest terrestrial pool <strong>in</strong> the C biogeochemical cycle. Soil organic matter, although occupy<strong>in</strong>g only 5% of<br />
the total soil volume, has an important <strong>in</strong>fluence <strong>in</strong> soil physical, chemical and biological properties, directly<br />
<strong>in</strong>fluenc<strong>in</strong>g the productivity of soybean. Management systems capable of ma<strong>in</strong>ta<strong>in</strong><strong>in</strong>g and even <strong>in</strong>creas<strong>in</strong>g<br />
the soil organic carbon may stocks contribute to ma<strong>in</strong>ta<strong>in</strong><strong>in</strong>g the productive capacity of soils and to mitigate<br />
the problem of <strong>in</strong>creas<strong>in</strong>g atmospheric CO2.<br />
References<br />
Milà i Canals L., Romanya J., Cowell S.J., 2007. M<strong>et</strong>hod for assess<strong>in</strong>g impacts on life support functions<br />
(LSF) related to the use of ‘fertile land’ <strong>in</strong> Life Cycle Assessment (<strong>LCA</strong>). J. Clean. Prod., 15, 1524-1440.<br />
Gu<strong>in</strong>ée JB <strong>et</strong> al., 2001. Life Cycle Assessment – An operational Guide to the ISO Standards, Leiden.<br />
Instituto Brasileiro de Geografia e Estatística - IBGE, <strong>2012</strong>. SIDRA- Banco de Dados Agregados. Produção<br />
agrícola municipal.<br />
Associação Brasileira das Indústrias de Óleos Veg<strong>et</strong>ais, <strong>2012</strong>. Dados estatísticos do complexo soja.<br />
Brady NC, 1989. Natureza e propriedade dos solos. São Paulo, McGraw-Hill, 878p.<br />
Campos BC <strong>et</strong> al., 2011. Long-term C-CO2 emissions and carbon crop residue m<strong>in</strong>eralization <strong>in</strong> an oxisol<br />
under different tillage and crop rotation systems. Rev. Bras. Ciênc. Solo, 35, 819-832.<br />
819
GROUP 4, SESSION B: CROP PRODUCTION SYSTEMS 8 th Int. Conference on <strong>LCA</strong> <strong>in</strong> the<br />
Agri-<strong>Food</strong> Sector, 1-4 Oct <strong>2012</strong><br />
111. Comparison of the susta<strong>in</strong>ability of different potato production<br />
systems: use of AgBalance m<strong>et</strong>hodology to identify strengths and<br />
weaknesses of organic, conventional and gen<strong>et</strong>ically modified diseaseresistant<br />
potato cultivation<br />
Martijn Gipmans 1,* , Jan Schöneboom 2 , Brigitte Achatz 2 , Thorsten Storck 3 , Markus Prüfe 4 , Manuel Knauer 4 ,<br />
P<strong>et</strong>er Sal<strong>in</strong>g 2<br />
1 BASF Plant Science Company GmbH, c/o m<strong>et</strong>anomics GmbH, Tegeler Weg 33, 10589, Berl<strong>in</strong>, Germany, 2<br />
BASF SE, Susta<strong>in</strong>ability Center, GU/NE – Z7, 67056 Ludwigshafen, Germany, 3 BASF Plant Science<br />
Company GmbH, GB/P, Agrarzentrum Li444, 67117 Limburgerhof, Germany, 4 BASF Plant Science<br />
Company GmbH, GBB/E, Agrarzentrum Li444, 67117 Limburgerhof, Germany, Correspond<strong>in</strong>g author. Email:<br />
martijn.gipmans@basf.com<br />
AgBalance is a new <strong>LCA</strong>-based m<strong>et</strong>hodology to assess susta<strong>in</strong>ability <strong>in</strong> the agricultural value cha<strong>in</strong> <strong>in</strong> a<br />
comprehensive and holistic way. AgBalance is based on BASF’s Eco-Efficiency and SEEBALANCE Analysis,<br />
to which, <strong>in</strong> consultation with <strong>in</strong>ternational stakeholders and experts, new <strong>in</strong>dicators specific for agriculture<br />
were added. AgBalance <strong>in</strong>tegrates over 200 data po<strong>in</strong>ts <strong>in</strong> up to 70 <strong>in</strong>dicators cover<strong>in</strong>g ecological, economical<br />
and social aspects of agriculture and received a validation of coherence and functionality from D<strong>et</strong><br />
Norske Veritas (DNV), TÜV Süd as well as the National Sanitation Foundation (NSF) <strong>in</strong> the US.<br />
Here<strong>in</strong> we present a case study us<strong>in</strong>g the AgBalance m<strong>et</strong>hodology, that <strong>in</strong>vestigated the factors d<strong>et</strong>erm<strong>in</strong><strong>in</strong>g<br />
the susta<strong>in</strong>ability of different potato production systems <strong>in</strong> Germany. In general terms, potatoes are cultivated<br />
either us<strong>in</strong>g organic standards as def<strong>in</strong>ed by the EC Regulation 834/2007 or us<strong>in</strong>g conventional cultivation<br />
practices.<br />
Potato late blight is a fungal disease caused by Phytophthora <strong>in</strong>festans, which accounts for annual losses<br />
(costs of control and damage) estimated at more than € 1,000,000,000 <strong>in</strong> the EU alone. BASF has developed<br />
a potato with a full and durable resistance aga<strong>in</strong>st late blight through <strong>in</strong>troduction of resistance genes from a<br />
wild potato by gen<strong>et</strong>ic modification (GM) technology <strong>in</strong>to a modern European potato vari<strong>et</strong>y<br />
We compared the susta<strong>in</strong>ability of organic, conventional and gen<strong>et</strong>ically modified (GM) disease-resistant<br />
potato cultivation us<strong>in</strong>g the AgBalance m<strong>et</strong>hod. Agronomic <strong>in</strong>put data is taken from KTBL publications, the<br />
state office for agriculture <strong>in</strong> Lower-Saxony, federal m<strong>in</strong>istry agriculture statistics and further public databases<br />
such as EUROSTAT. This data is representative of the 2007/08 grow<strong>in</strong>g season. Average yields are<br />
assumed to be 45 t/ha for the conventional and GM-, and 25 t/ha for the organic cultivation system.<br />
Under conditions of moderate Phytophthora <strong>in</strong>festation, the aggregated susta<strong>in</strong>ability impact score of the GM<br />
potato is similar to conventional vari<strong>et</strong>ies. The organic cultivation system receives a somewhat worse impact<br />
score, ma<strong>in</strong>ly due to the lower yield and the use of copper hydroxide <strong>in</strong> relatively high amounts. Apply<strong>in</strong>g<br />
scenario analysis, the effect of <strong>in</strong>creased levels of <strong>in</strong>festation pressure is shown to result <strong>in</strong> significant environmental<br />
and economic benefits of the GMO potato, as conventional and organic production systems are<br />
affected by <strong>in</strong>creased application rates of fungicides and yield losses. At the level of <strong>in</strong>dividual impact categories,<br />
there are marked strengths and weaknesses <strong>in</strong> each of the three alternatives. The GMO and conventional<br />
production are associated with fewer burdens through land use, acidification potential and emissions to<br />
water. Organic potato on the other hand is associated with less pressure on biodiversity <strong>in</strong> agricultural areas,<br />
less energy and resource consumption and global warm<strong>in</strong>g potential. On the economic side, there are no major<br />
differences <strong>in</strong> macro-economic <strong>in</strong>dicators such as farm profits and subsidies, but production costs for<br />
organic potatoes are much higher. The differences <strong>in</strong> the social stakeholder categories are rather small, which<br />
is partly related to trade-offs b<strong>et</strong>ween <strong>in</strong>dicators that relate to benefits (positive implication, e.g. wages) as<br />
well as to burdens (negative implication, e.g., work<strong>in</strong>g accidents).<br />
Taken tog<strong>et</strong>her, AgBalance has proven to be a useful m<strong>et</strong>hodology to look at the susta<strong>in</strong>ability of potato<br />
cultivation <strong>in</strong> a holistic way. AgBalance identifies the strengths and weaknesses of the different potato production<br />
systems and can deliver guidance for susta<strong>in</strong>able development <strong>in</strong> potato cultivation.<br />
References<br />
KTBL: B<strong>et</strong>riebsplanung Landwirtschaft 2006/7, 20. Auflage 2006. ISBN: 3-939371-07-6<br />
Sal<strong>in</strong>g P., Kicherer A., Dittrich-Kraemer B., Wittl<strong>in</strong>ger R., Zombik W., Schmidt I., Schrott W., Schmidt S.,<br />
2002. Eco-efficiency Analysis by BASF: The M<strong>et</strong>hod. Int. J. Life Cyle Assess. 7, 203-218.<br />
820
GROUP 4, SESSION B: CROP PRODUCTION SYSTEMS 8 th Int. Conference on <strong>LCA</strong> <strong>in</strong> the<br />
Agri-<strong>Food</strong> Sector, 1-4 Oct <strong>2012</strong><br />
Kölsch, D., Sal<strong>in</strong>g P., Kicherer A., Grosse-Sommer A., Schmidt I, 2008. How to measure social impacts? A<br />
socio-eco-efficiency analysis by the SEEBALANCE® m<strong>et</strong>hod. Int. J. Susta<strong>in</strong>. Dev. 11, 1 – 23.<br />
Schöneboom J.C., Sal<strong>in</strong>g P., van Gelder R. <strong>2012</strong>. AgBalance – Holistic Assessment of Susta<strong>in</strong>ability <strong>in</strong> Agriculture.<br />
Submitted to Int. J. Life Cycle Assess.<br />
821
GROUP 4, SESSION B: CROP PRODUCTION SYSTEMS 8 th Int. Conference on <strong>LCA</strong> <strong>in</strong> the<br />
Agri-<strong>Food</strong> Sector, 1-4 Oct <strong>2012</strong><br />
822<br />
112. Modell<strong>in</strong>g Estonian field crop farm types for <strong>LCA</strong><br />
Sirli Pehme * , Eve Veromann<br />
Estonian University of Life Sciences, Estonia, * Correspond<strong>in</strong>g author. E-mail: Sirli.Pehme@emu.ee<br />
<strong>Food</strong> and beverage f<strong>in</strong>al household consumption <strong>in</strong> EU accounts for 22–34% of total life-cycle impacts <strong>in</strong> all<br />
environmental impact categories (except eutrophication that accounts 60%) (Tukker <strong>et</strong> al. 2006). Furthermore,<br />
different agricultural production practices have different impacts on environment. Thus, assessment<br />
through life cycle is needed to choose the best practises and mitigate pressure on environment.<br />
Although, field crops have significant share <strong>in</strong> Estonian agricultural production, no agricultural <strong>LCA</strong> studies<br />
have been done <strong>in</strong> Estonia so far. There are huge variability <strong>in</strong> resource use and environmental impact b<strong>et</strong>ween<br />
farms because of the variation <strong>in</strong> actual practises (Halberg 1999). Most of the <strong>LCA</strong>-s are based on data<br />
from case studies (Pfefferli and Gaillard 2000). To ensure the representativeness and to aim more general<br />
validity, assessment should be based on a larger sample of farm data. There are huge differences b<strong>et</strong>ween<br />
countries <strong>in</strong> agricultural practices, therefore country-specific <strong>in</strong>ventory data about farm practises is needed.<br />
In addition, environmental assessment through the life cycle tak<strong>in</strong>g account local conditions is necessary.<br />
The aim of this paper was to create representative farm type models of Estonian arable crop farms based on<br />
different characteristics – ma<strong>in</strong> product type, management type, animal density (<strong>in</strong> case of mixed farm<strong>in</strong>g) –<br />
for further life cycle assessments. Different data sources were used to create <strong>in</strong>ventory data of Estonian field<br />
crop farm models: systematic statistics, farm accountancy data n<strong>et</strong>works, experiments, surveys, recommendations<br />
and expert op<strong>in</strong>ion. Data of land area, energy and fertiliser use, yields and other characteristics are<br />
presented for each farm type. Challenges on creat<strong>in</strong>g farm type models are discussed.<br />
References<br />
Halberg, N., 1999. Indicators of resource use and environmental impact for use <strong>in</strong> a decision aid for Danish<br />
livestock farmers. Agriculture, Ecosystems and Environment 76 17-30.<br />
Pfefferli S., Gaillard, G., 2000. Development of a new management tool by comb<strong>in</strong><strong>in</strong>g <strong>LCA</strong> and FADN. In:<br />
Weidema, BP., Meeusen MJG., (eds.), Agricultural data for life cycle assessments, Vol 2., Agricultural<br />
Economics Research Institute, The Hague, The N<strong>et</strong>herlands, 137-144.<br />
Tukker, A., Huppes, G., Gu<strong>in</strong>ee J., Heijungs, R., de Kon<strong>in</strong>g, A., van Oers, L., Suh, S., Geerken, T., van<br />
Holderbeke, M., Jansen, B., Nielsen, B., 2006. Environmental impacts of products (EIPRO). European<br />
Science and Technology Observatory and Institute for Prospective Technological Studies, Seville, Spa<strong>in</strong>.<br />
Available from: http://ec.europa.eu/environment/ipp/pdf/eipro_report.pdf
GROUP 4, SESSION B: CROP PRODUCTION SYSTEMS 8 th Int. Conference on <strong>LCA</strong> <strong>in</strong> the<br />
Agri-<strong>Food</strong> Sector, 1-4 Oct <strong>2012</strong><br />
113. Develop<strong>in</strong>g <strong>in</strong>novative technical agronomical practices <strong>in</strong><br />
sunflower cultivation for <strong>in</strong>dustrial applications: experience from<br />
central Italy<br />
<strong>France</strong>sco Razza 1,* , <strong>France</strong>sco Degli Innocenti 2 , Michele Falce 2 , Luciano Concezzi 3 , Andrea Massoli 3<br />
1 Novamont, Piazz.le Donegani 4, 05100 Terni – Italy, 2 Novamont, Via G. Fauser 8, 28100 Novara - Italy, 3<br />
3A - Parco Tecnologico Agroalimentare dell’Umbria, Frazione Pantalla, 06059 Todi (Terni) – Italy, Correspond<strong>in</strong>g<br />
author. E-mail: francesco.razza@novamont.com<br />
At worldwide level biomass is mostly exploited for produc<strong>in</strong>g materials rather than for energy use. With<strong>in</strong><br />
the PSR Umbria project (Piano per lo Sviluppo Rurale - Cooperazione per lo sviluppo dei nuovi prodotti,<br />
processi e tecnologie nei s<strong>et</strong>tori agricolo e alimentare e <strong>in</strong> quello forestale) a biodegradable hydraulic lubricant<br />
was developed start<strong>in</strong>g from sunflower oil with high oleic acid content. Such a lubricant, functionally<br />
equivalent to the fossil-based one, is characterised by a lower persistence <strong>in</strong> the environment s<strong>in</strong>ce it is biodegradable.<br />
The PSR project was focused also on the development of <strong>in</strong>novative (low impact) technical<br />
agronomical practices for sunflower cultivation. Basically two high oleic sunflower cultivars (i.e. VarA and<br />
VarB) have been selected and tested with three different agronomical practices: “normal <strong>in</strong>put” (i.e. traditional<br />
cultivation with a normal <strong>in</strong>put of fertilisers and pesticides), “low <strong>in</strong>put” (i.e. fertilisers were reduced<br />
by 50%) and “zero <strong>in</strong>put” (i.e. no fertilisers applied but green manure before sunflower saw<strong>in</strong>g). The lower<br />
<strong>in</strong>put practices have been tested because the <strong>in</strong>puts to the agricultural phase (e.g. fertilisers, pesticides <strong>et</strong>c.)<br />
are generally higher than the actual needs of the crop as confirmed by experimental data reported <strong>in</strong> Table 1,<br />
where it is <strong>in</strong>terest<strong>in</strong>g to notice that the crop yield for the “low <strong>in</strong>put” and “zero <strong>in</strong>put” is equivalent or even<br />
higher compared to the “normal <strong>in</strong>put”. In reference to the ”zero <strong>in</strong>put”, it is important to po<strong>in</strong>t out that, accord<strong>in</strong>g<br />
to previous filed trials performed elsewhere, it was observed that green manure practice <strong>in</strong> sunflower<br />
cultivation, provides the right amount of nutrients (e.g. nitrogen) without generat<strong>in</strong>g a depl<strong>et</strong>ion of them,<strong>in</strong><br />
the soil, rather they <strong>in</strong>crease. Further the crop yield rema<strong>in</strong> constant and similar to that generally obta<strong>in</strong>ed <strong>in</strong><br />
a “normal <strong>in</strong>put” practice also <strong>in</strong> the long run but with the advantage that the green manure practice protects<br />
the soil from erosion as well.<br />
These practices have been assessed by <strong>LCA</strong> analysis where the functional unit was def<strong>in</strong>ed as the production<br />
of 1 kg of oleic acid. Also the oil cake (the co-product of mechanical oil extraction) uses (i.e. animal feed or<br />
energy utilisation) have been <strong>in</strong>cluded <strong>in</strong> the analysis. LCIA results show that the highest benefits were<br />
reached <strong>in</strong> the “zero <strong>in</strong>put” where the oil cake is used for energy purposes.<br />
Basically it has been demonstrated that the right match b<strong>et</strong>ween the sunflower cultivar, the geographic area,<br />
the <strong>in</strong>tegrated production of sunflower oil, contribute to reduce loads to the environment mak<strong>in</strong>g the whole<br />
agricultural system particularly efficient.<br />
References<br />
Raschka, A., Carus, M.,<strong>2012</strong>. Industrial material use of biomass. Basic data for Germany, Europe and the<br />
world. Nova-Institute GmbH Chemiepark Knapsack, Industriestrasse, Hurth (Germany).<br />
Laur<strong>et</strong>i D., Pieri S., 1999. Fertilizzazione Biologica del Girasole. L’<strong>in</strong>formatore Agrario, supplemento al<br />
n.10, 20-23. Istituto Sperimentale per Colture Industriali di Bologna – Sezione di Osimo (Ancona)<br />
Laur<strong>et</strong>i D., Pieri S., 2001. Sovescio di legum<strong>in</strong>ose nella fertilizzazione del girasole. L’<strong>in</strong>formatore Agrario,<br />
n.30. Istituto Sperimentale per Colture Industriali di Bologna – Sezione operativa periferica di Osimo<br />
(Ancona)<br />
823
GROUP 4, SESSION B: CROP PRODUCTION SYSTEMS 8 th Int. Conference on <strong>LCA</strong> <strong>in</strong> the<br />
Agri-<strong>Food</strong> Sector, 1-4 Oct <strong>2012</strong><br />
Table 1. Experimental data (2011) – Silveri farm<br />
Agronomi<br />
c pathway<br />
NORMAL<br />
INPUT<br />
LOW IN-<br />
PUT<br />
ZERO<br />
INPUT<br />
824<br />
Dry<br />
Sunflowe<br />
matte Oil<br />
Extracte<br />
r seeds<br />
Yiel<br />
r DM (% Oil d oil Oleic (kg fresh<br />
d<br />
(kg/kg on extractio (kg/kg acid matter<br />
Sunflowe (t/ha Moistur fresh DM n yield fresh conten per kg of<br />
r cultivar ) e (%) seeds) ) (%) seeds) t (%) oleic acid<br />
VarA 2.3 4.8 0.952 51.2 80 0.390 89.0 2.9<br />
VarB 2.5 5.1 0.949 42.8 80 0.325 88.5 3.5<br />
VarA 3.0 5.1 0.949 48.5 80 0.368 89.8 3.0<br />
VarB 2.8 6.2 0.938 39.1 80 0.293 88.4 3.8<br />
VarA 2.7 6.8 0.932 48.5 80 0.361 89.9 3.1<br />
VarB 2.2 6.4 0.936 45.1 80 0.338 88.5 3.4
GROUP 4, SESSION B: CROP PRODUCTION SYSTEMS 8 th Int. Conference on <strong>LCA</strong> <strong>in</strong> the<br />
Agri-<strong>Food</strong> Sector, 1-4 Oct <strong>2012</strong><br />
114. Effects of different crop management on durum wheat GHGs<br />
emission<br />
Salem Alhajj ali 1,* , Giuseppe De Mastro 1 , Luigi Tedone 1 , Stefano Bona 2 , Lucia Col<strong>et</strong>to 2<br />
1 University of Bari - Dipt of agricultural and environmental science, Via Amendola, 165/A - 70126, Italy, 2<br />
University of Padova – Dipt. of agronomy, Viale dell’Uuniversità 16, 35020, Legnaro, PD, Italy, Correspond<strong>in</strong>g<br />
author. E-mail: salem_grb@yahoo.com<br />
Hav<strong>in</strong>g all the impacts, associated with different management typology of the agro-ecosystem, assessed<br />
through the use of <strong>LCA</strong> m<strong>et</strong>hodology accord<strong>in</strong>g to an implementation of the data collected directly from the<br />
field to m<strong>in</strong>imise data uncerta<strong>in</strong>ties, could be a very sensitive model which can support the current political<br />
action plans for reduction of the impacts which lead to the environmental effects. Moreover, the use of this<br />
k<strong>in</strong>d of model to identify more susta<strong>in</strong>able comb<strong>in</strong>ation of agricultural practices could satisfy the agronomists,<br />
economists as well as environmentalists once the productivity of the system is be<strong>in</strong>g ma<strong>in</strong>ta<strong>in</strong>ed with<br />
as low <strong>in</strong>puts and emissions as possible.<br />
For that, an on farm field trial <strong>in</strong> Southern Italy (Basilicata Region) was conducted to evaluate alternative<br />
agricultural practices that could help farmers to reduce reliance on fossil fuel, lower the <strong>in</strong>put costs and decrease<br />
the GHG emissions of durum wheat production systems through life cycle assessment (<strong>LCA</strong>) m<strong>et</strong>hod.<br />
The focus of this study was specially oriented to the potential GHGs emitted (expressed as CO2-eq) as a consequence<br />
of the different levels of soil tillage (<strong>in</strong>tensive (IT), reduced (RT) and conservative (CT) comb<strong>in</strong>ed<br />
with different nitrogen fertilisation rates (90, 60, 30, 0 kg N ha-¹ as urea). A special attention was given to<br />
gra<strong>in</strong> yield as this represents the ma<strong>in</strong> farmers’ objective and was be<strong>in</strong>g further correlated to the emissions.<br />
The <strong>LCA</strong> analysis considered the entire system of the field experiment <strong>in</strong> which each treatment was replicated<br />
three times and the farm gate was considered as the system boundary. Inventory data of all agricultural<br />
operations <strong>in</strong> the field <strong>in</strong>clud<strong>in</strong>g tillage, seed<strong>in</strong>g, fertilisation, herbicide application and harvest<strong>in</strong>g, have been<br />
collected. Then, all data were used to estimate and compare (Through SimaPro 7.3 us<strong>in</strong>g the IPCC 2007<br />
GWP 100a m<strong>et</strong>hod for comparison) the impacts of different wheat production systems. Furthermore, <strong>in</strong> spit<br />
of all the data collected directly from the field, nitrogen balance was also calculated as the differences b<strong>et</strong>ween<br />
nitrogen <strong>in</strong>puts and outputs of total nitrogen <strong>in</strong> the soil, gra<strong>in</strong>, straw and plant residues sampled.<br />
This study showed that there was a higher proportion of energy consumption and GHG emissions attributed<br />
to N fertiliser and to the plough<strong>in</strong>g operations for the production of wheat. The GHG emissions of different<br />
wheat production systems showed statistically significant differences with<strong>in</strong> the treatments (tillage and N<br />
fertiliser rate), but no significant differences found <strong>in</strong> the <strong>in</strong>teraction b<strong>et</strong>ween tillage and N fertiliser applications.<br />
Go<strong>in</strong>g deep <strong>in</strong>to the analysis, we found that the highest CO2-eq emissions was reported <strong>in</strong> the <strong>in</strong>tensive tillage<br />
(IT) with 90 kg N ha-¹ ma<strong>in</strong>ly because of the high emissions associated with the fertiliser and fuel production.<br />
The overall emissions were lower <strong>in</strong> conservation tillage (CT) and <strong>in</strong> reduced tillage (RT) systems<br />
compared by <strong>in</strong>tensive tillage (IT) system due to the diesel fuel consumption which resulted from the high<br />
number of field operations.<br />
On the basis of this first year of activity, conservation tillage (CT), represent a more environmentallyfriendly<br />
system of wheat cultivation, which could sequester more CO2, and as a consequence gave lower<br />
emissions and impact on the environment than both other systems. In contrast, <strong>in</strong>tensive tillage (IT) was the<br />
worst <strong>in</strong> all scenarios.<br />
825
GROUP 4, SESSION B: CROP PRODUCTION SYSTEMS 8 th Int. Conference on <strong>LCA</strong> <strong>in</strong> the<br />
Agri-<strong>Food</strong> Sector, 1-4 Oct <strong>2012</strong><br />
115. Environmental and economic life cycle assessment of organic and<br />
conventional olive systems<br />
Ramez Mohamad 1,* , Annalisa De Boni 2 , Gianluigi Cardone 1 , Marie Re<strong>in</strong>e Bteich 1 , Michele Mor<strong>et</strong>ti 2 , Rocco<br />
Roma 2 , V<strong>in</strong>cenzo Verrastro 1<br />
1 Mediterranean Agronomic Institute of Bari, Italy, 2 Dep. Agro-environmental and territorial Sciences, Bari<br />
University, Italy, Correspond<strong>in</strong>g author. E-mail: ramez_19777@yahoo.com<br />
The environmental awareness of the agricultural sector has been <strong>in</strong>creas<strong>in</strong>g dur<strong>in</strong>g the last decades. Cover<strong>in</strong>g<br />
the environmental impacts of any agricultural product or service became a fundamental trend towards the<br />
optimal selection b<strong>et</strong>ween different alternatives to improve the production. Organic farm<strong>in</strong>g has been reported<br />
to be an <strong>in</strong>novative system that contributes to the reduction of environmental impacts of agricultural<br />
practices. This study will <strong>in</strong>vestigate this assumption through a comparison of the environmental impact and<br />
the economic performance b<strong>et</strong>ween two production systems of olive cultivation <strong>in</strong> Apulia region-Italy.<br />
Based on a survey for farms selection, two olive farms have been selected for a case study of organic and<br />
conventional management systems. The criteria of farms selection was based on the similarity of general<br />
characteristics (location, olive vari<strong>et</strong>y, trees age, irrigated, plant<strong>in</strong>g system) and the dissimilarity of agricultural<br />
practices management, particularly fertilisation, soil management, pest and weed control.<br />
<strong>LCA</strong> based m<strong>et</strong>hodology, adopt<strong>in</strong>g the Eco-<strong>in</strong>dicator 99 m<strong>et</strong>hod, has been used for assess<strong>in</strong>g the environmental<br />
impact. Data collection has been analysed by SimaPro software consider<strong>in</strong>g 1 hectare as a functional<br />
unit with a system boundary limited to olive production (cradle to farm gate).<br />
The olive life cycle was assumed to extend over 50 years and was divided <strong>in</strong>to three phases: juvenility phase<br />
(4 years), grow<strong>in</strong>g phase (13 years) and productive phase (33 years). The environmental impacts were<br />
roughly similar dur<strong>in</strong>g the juvenility and grow<strong>in</strong>g phases due to the likeness of the conventional managements<br />
<strong>in</strong> both case studies. Environmental results below are associated to the productive phase when the<br />
organic farm was certified organic and the conventional farm changed <strong>in</strong>to no-tillage conventional system.<br />
Fertilisation and soil management activities resulted <strong>in</strong> a higher environmental impact <strong>in</strong> the organic system<br />
compared to the conventional one, <strong>in</strong> terms of both s<strong>in</strong>gle impact category and damage categories (damage to<br />
the human health, ecosystem quality and resources). This is due to the emissions <strong>in</strong>duced by the transportation<br />
and application of animal manure as well as the higher fuel consumption for manag<strong>in</strong>g the soil <strong>in</strong> the<br />
organic system compared to no-tillage conventional one. Nevertheless, the total environmental impact of<br />
agricultural practices was lower <strong>in</strong> the organic system compared to the conventional one, ma<strong>in</strong>ly the lower<br />
impact on the fossil fuel depl<strong>et</strong>ion as a result of the more recurrent weed and pest control activities <strong>in</strong> conventional<br />
system. In fact, the total environmental impact caused by pest control activity was higher <strong>in</strong> the<br />
conventional system even if carc<strong>in</strong>ogenic effects, ecotoxicity and m<strong>in</strong>erals depl<strong>et</strong>ion impact categories were<br />
higher <strong>in</strong> the organic system, as a result of copper products uses for pest control.<br />
LCC m<strong>et</strong>hodology has been used for assess<strong>in</strong>g the economic performance of both systems by calculat<strong>in</strong>g all<br />
costs and revenues over the life cycle. No large differences were registered b<strong>et</strong>ween the farms <strong>in</strong> terms of<br />
costs and revenues <strong>in</strong> juvenility and grow<strong>in</strong>g phases, while bulk differences were recorded <strong>in</strong> the productive<br />
phase. The organic system resulted <strong>in</strong> higher total costs and lower yield compared to the conventional one.<br />
However, it showed higher revenue and consequently higher n<strong>et</strong> <strong>in</strong>come thanks to the higher sell<strong>in</strong>g price.<br />
Both systems had a positive N<strong>et</strong> Present Value (NPV), show<strong>in</strong>g a positive <strong>in</strong>vestment. Furthermore, the Internal<br />
Rate of R<strong>et</strong>urn (IRR) resulted, <strong>in</strong> both farms, higher than the bank <strong>in</strong>terest rate (1.25%). The organic<br />
system resulted to have a higher NPV and IRR than the conventional one. Therefore, accord<strong>in</strong>g to the farm<strong>in</strong>g<br />
price system and based on the profitability and f<strong>in</strong>ancial analyses, the organic system can be considered a<br />
more profitable <strong>in</strong>vestment system than the conventional one.<br />
826
GROUP 4, SESSION B: CROP PRODUCTION SYSTEMS 8 th Int. Conference on <strong>LCA</strong> <strong>in</strong> the<br />
Agri-<strong>Food</strong> Sector, 1-4 Oct <strong>2012</strong><br />
116. A life cycle assessment of rice cultivation<br />
Torsten Rehl 1, , Barbara Dannenmann 2 , Sab<strong>in</strong>e Deiml<strong>in</strong>g 1 , Joachim Müller 2<br />
1 PE INTERNATIONAL AG, Le<strong>in</strong>felden-Echterd<strong>in</strong>gen, Germany, 2 University of Hohenheim, Institute of<br />
Agricultural Eng<strong>in</strong>eer<strong>in</strong>g (440), Stuttgart, Germany, Correspond<strong>in</strong>g author. E-mail: t.rehl@pe<strong>in</strong>ternational.com<br />
Rice cultivation represented about 22% of the world´s gra<strong>in</strong> crops area <strong>in</strong> 2008 (FAO 2010). It is cultivated<br />
across a vast area spann<strong>in</strong>g wide ranges of temperate, subtropical and tropical climates. Various climatic and<br />
socio-economic conditions at different locations effect the rice cultivation and the environmental impacts<br />
go<strong>in</strong>g along with it. Rice cultivation however is a major source of green house gasses, especially m<strong>et</strong>hane<br />
(CH4) (e.g. Sass 2005; Yan 2005). However, the alternation <strong>in</strong> w<strong>et</strong>t<strong>in</strong>g and dry<strong>in</strong>g to mitigate m<strong>et</strong>hane emissions<br />
can <strong>in</strong>crease nitrous oxide (N2O) emissions through enhanced nitrification and de-nitrification (Akiyama<br />
2005a & b). Complex mechanisms impact not only global warm<strong>in</strong>g potential (GWP) but also acidification<br />
(AP), eutrophication (EP) and photochemical ozone creation (POCP). The objective of this study was to<br />
assess the environmental performance of different rice cultivation systems <strong>in</strong> various countries and climates.<br />
Eight cropp<strong>in</strong>g systems have been chosen for data collection on precipitation, soil type, irrigation system,<br />
fertilisation, field operations, and pesticide use: conventional, irrigated, lowland rice cultivation <strong>in</strong> Ch<strong>in</strong>a<br />
(CC); deepwater rice cropp<strong>in</strong>g system <strong>in</strong> India (DWI); irrigated, conventional, lowland rice cultivation <strong>in</strong><br />
India with rice straw <strong>in</strong>corporation (II) and with rice straw burn<strong>in</strong>g (IB); irrigated, conventional, lowland rice<br />
cultivation <strong>in</strong> the Philipp<strong>in</strong>es with two cropp<strong>in</strong>g cycles (IP2) and with three cropp<strong>in</strong>g cycles per year (IP3);<br />
irrigated, organic rice cropp<strong>in</strong>g system <strong>in</strong> Japan (OUJ) and a ra<strong>in</strong>-fed, conventional, upland rice cultivation<br />
system <strong>in</strong> Japan (UJ). Rice systems were compared on a hectare (ha yr-1) as well as a product (kg ha-1) basis.<br />
The life cycle assessment followed ISO 14040. The <strong>in</strong>ventory quantities fossil/renewable primary energy<br />
demand (PED) and water use (WU) were analysed. GWP, AP, EP and POCP were computed accord<strong>in</strong>g to<br />
the CML m<strong>et</strong>hod (Gu<strong>in</strong>ée 2002).<br />
Upland rice systems (UJ and to some degree OUJ) showed lowest impacts among the rice-cropp<strong>in</strong>g systems<br />
tested <strong>in</strong> WU, GWP, AP and POCP and one of the lowest <strong>in</strong> PED and EP. OJ performed well <strong>in</strong> PED, GWP,<br />
POCP, AP and WU. On the other hand, the highest environmental impacts was caused by the systems IP2<br />
and IP3, due to high <strong>in</strong>puts of fertiliser, diesel <strong>et</strong>c. along with low yields. The ma<strong>in</strong> emissions were released<br />
<strong>in</strong> the field by decomposition of nitrogen <strong>in</strong>to NH3, NO3- and carbon <strong>in</strong>to CH4. Fertiliser production and diesel<br />
combustion <strong>in</strong> tractors and diesel generators of irrigation pumps were identified as additional sources of<br />
emissions. A removal of straw for bio-energy or burn<strong>in</strong>g on the field reduces nitrogen (i.e., N2O, NOx, NO3 − )<br />
and carbon related emissions (CH4). At the same time potential accumulation rate of soil organic carbon<br />
decreases and consequently <strong>in</strong>crease PED and GWP due to the additional demand for m<strong>in</strong>eral fertiliser. The<br />
ma<strong>in</strong> challenges were identified as the water regime and organic <strong>in</strong>puts, as well as the type of soil, the climate,<br />
the field management and the production and <strong>in</strong>tensity of fertiliser use.<br />
References<br />
Akiyama, H., Yagi, K., Yan, X., 2005. Summary of N2O emissions from rice paddy fields: Summary of<br />
available data. Global Biogeochemical Cycle 19: 1005.<br />
FAO (2010). FAOSTAT database, <strong>Food</strong> and Agriculture Organization (FAO). Rome<br />
Gu<strong>in</strong>ée, J. B., 2002. Handbook on <strong>LCA</strong>: Operational Guide to the ISO Standards. N<strong>et</strong>herlands<br />
Watanabe, A., Kimura, M., 1999. Influence of chemical properties of soils on m<strong>et</strong>hane emission from rice<br />
paddies. Commum Soil Sci Plant Anal. 30: 2449-2463.<br />
Yan, X., Yagi, K., Akiyama, H., Akimoto, H., 2005. Statistical analysis of the major variables controll<strong>in</strong>g<br />
m<strong>et</strong>hane emission from rice fields. Global Change Biology 11 (7): 1131-1141.<br />
827
GROUP 4, SESSION B: CROP PRODUCTION SYSTEMS 8 th Int. Conference on <strong>LCA</strong> <strong>in</strong> the<br />
Agri-<strong>Food</strong> Sector, 1-4 Oct <strong>2012</strong><br />
Figure 1. System boundaries of the <strong>LCA</strong> study applied for the various rice cropp<strong>in</strong>g systems.<br />
828
GROUP 4, SESSION B: CROP PRODUCTION SYSTEMS 8 th Int. Conference on <strong>LCA</strong> <strong>in</strong> the<br />
Agri-<strong>Food</strong> Sector, 1-4 Oct <strong>2012</strong><br />
117. Environmental assessment of rice production <strong>in</strong> Camargue,<br />
<strong>France</strong><br />
Ancia Drocourt 1 , Yannick Mervant 1 , Franc ois Milhau 1 , Mireille Ch<strong>in</strong>al 2 , Arnaud Hélias 1,3,*<br />
1 2<br />
Montpellier SupAgro, 2 Place Viala, 34060 Montpellier Cedex 2, <strong>France</strong>, Sud Céréales, Mas des Saules<br />
RD 6113, 30300 Fourques, <strong>France</strong>, 3 INRA, UR50, LBE, Laboratoire de Biotechnologie <strong>et</strong> de<br />
l’Environnement, Avenue des Etangs, 11000 Narbonne, <strong>France</strong>, * Correspond<strong>in</strong>g author. E-mail: arnaud.helias@supagro.<strong>in</strong>ra.fr<br />
In a context where environmental labell<strong>in</strong>g tends to become certa<strong>in</strong>, life cycle <strong>in</strong>ventories of agricultural<br />
productions are key elements for the food product assessment. The here<strong>in</strong> study focuses on rice crops <strong>in</strong> the<br />
Camargue area (south of <strong>France</strong>), and the functional unit is “to produce one ton of rice”.<br />
The system is limited to the field operation, and does <strong>in</strong>clude transportation after harvest and recycl<strong>in</strong>g of<br />
agricultural mach<strong>in</strong>ery. The <strong>in</strong>ventory is based on generic data available <strong>in</strong> the eco<strong>in</strong>vent database. Cultural<br />
practices and crop yield from real data of Sud Céréales (an agricultural cooperative, ma<strong>in</strong> rice producer to<br />
Camargue) are used to describe the system. In this context, consistent with the regulation, crop residues are<br />
ploughed <strong>in</strong>. Models proposed <strong>in</strong> the literature are used to assess the emission from fertilisation, and m<strong>et</strong>hane<br />
release from rice fields is calculated us<strong>in</strong>g the IPCC model (IPCC 2006).<br />
The life cycle impact assessment is carried out with the Impact 2002+ m<strong>et</strong>hod (except for climate change<br />
where characterisation factors over 100 years are used). Results are put <strong>in</strong> front of American rice production<br />
available <strong>in</strong> the database. This comparison shows the environmental benefit of the Camargue rice (a decrease<br />
of 42% for greenhouse gas emissions) ma<strong>in</strong>ly due to more efficient submersion practices. Fertilisation (production<br />
and crop emission) is the most pollut<strong>in</strong>g step for all impacts; m<strong>et</strong>hane release is also a problem (Fig.<br />
1). A sensitivity analysis underl<strong>in</strong>es the lesser importance of agricultural mach<strong>in</strong>ery and the importance of<br />
the model chosen to assess the fertilisation. A decrease <strong>in</strong> yield would also cause greater damage to the environment;<br />
this is <strong>in</strong> accordance with a "mass based" functional unit.<br />
References<br />
IPCC, 2006. 2006 IPCC Guidel<strong>in</strong>es for National Greenhouse Gas Inventories, Prepared by the National<br />
Greenhouse Gas Inventories Programme. Eggleston, H.S., Buendia, L., Miwa, K., Ngara, T., Tanabe,<br />
K., (Eds). IGES, Japan.<br />
829
GROUP 4, SESSION B: CROP PRODUCTION SYSTEMS 8 th Int. Conference on <strong>LCA</strong> <strong>in</strong> the<br />
830<br />
100%<br />
90%<br />
80%<br />
70%<br />
60%<br />
50%<br />
40%<br />
30%<br />
20%<br />
10%<br />
0%<br />
Caractérisation des impacts de la culture de riz selon les opérations agricoles<br />
Agri-<strong>Food</strong> Sector, 1-4 Oct <strong>2012</strong><br />
Figure 1. Process contribution for one tonne of rice <strong>in</strong> Camargue. Dark blue: fertiliser production, light blue:<br />
crop emission due to fertiliser, dark orange: mach<strong>in</strong>eries and fuel production, light orange: crop emissions<br />
due to agricultural acts, Figure green: pest 9 : Caractérisation treatment consequences des impacts and grey: de la submersion culture de practice. riz selon les opérations agricoles<br />
Emissi<br />
subme<br />
Emissi<br />
traitem<br />
phyto<br />
Emissi<br />
actes a<br />
Emissi<br />
produ<br />
matér<br />
des ca<br />
Emissi<br />
l'épan<br />
engrai<br />
Emissi<br />
fabrica<br />
engrai<br />
En ce qui concerne l’écotoxicité aquatique, les résultats sont similaires à ceu<br />
avec une contribution légèrement plus importante de l’étape fertilisation (fabrication<br />
des engrais) à l’impact total (54%). La fabrication des engrais phosphatés provoque une<br />
métaux lourds vers l’environnement (pr<strong>in</strong>cipalement du cuivre). L’alum<strong>in</strong>ium rej<strong>et</strong><br />
production du matériel agricole <strong>et</strong> des carburants est responsable de la contribution de<br />
33% de l’impact.<br />
Dans le cas de l’écotoxicité terrestre, les émissions causées par la fabrication<br />
(9%) deviennent négligeables devant les émissions liées aux actes eagricoles<br />
(44%) <strong>et</strong> à l’é<br />
engrais (28%). Ceci s’explique pr<strong>in</strong>cipalement par les émissions de métaux lourds d<br />
notamment de z<strong>in</strong>c, du fait du passage des mach<strong>in</strong>es <strong>et</strong> de l’apport ’ dél<br />
éments fertilisan<br />
Concernant l’acidification des eaux, l’étape d’épandage des engrais s’a<br />
importante avec 76% de l’impact. Ceci est majoritairement udû ax<br />
’ émissions da<br />
mmonia<br />
d’azote dans l’air, suite à l’apport d’engrais au champ. L’étape de fabrication des engr<br />
en second lieu à 12% de l’impact. Les émissions de dioxyde de soufre, d’ammoni
GROUP 4, SESSION B: CROP PRODUCTION SYSTEMS 8 th Int. Conference on <strong>LCA</strong> <strong>in</strong> the<br />
Agri-<strong>Food</strong> Sector, 1-4 Oct <strong>2012</strong><br />
118. Allocat<strong>in</strong>g environmental burdens from fertilisation to crops <strong>in</strong> a<br />
rotation<br />
Alice Gueud<strong>et</strong> 1,* , Hervé Bossuat 1 , Marilys Pradel 2 , Afsaneh Lellahi 3 , Aurélie Tailleur 3<br />
1 ACTA, le réseau des <strong>in</strong>stituts des filières animales <strong>et</strong> végétales, 149 rue de Bercy – Paris, F-75595, <strong>France</strong>,<br />
2 Irstea, UR TSCF Technologies <strong>et</strong> systèmes d'<strong>in</strong>formation pour les agrosystèmes, Doma<strong>in</strong>e des Palaqu<strong>in</strong>s –<br />
Montoldre, F-03150, <strong>France</strong>, 3 ARVALIS-Institut du végétal, Service Agronomie Economie Environnement,<br />
Boigneville, F-91720, <strong>France</strong>, Correspond<strong>in</strong>g author. E-mail: alice.gueud<strong>et</strong>@acta.asso.fr<br />
Allocation is a complex issue for <strong>LCA</strong> practitioners. Due to many allocation m<strong>et</strong>hods, the choice b<strong>et</strong>ween<br />
them can have a significant impact on the results. It is particularly relevant when apply<strong>in</strong>g <strong>LCA</strong> to assess<br />
fertilisation impacts as all nutrients brought by fertilisers are not all taken up by the crop <strong>in</strong> the system under<br />
study but rema<strong>in</strong> available for future crops <strong>in</strong> rotation. Crop residues also produce nutrients which r<strong>et</strong>urn to<br />
soil after harvest. Hence, these nutrients can be considered as co-products from the crop.<br />
Fertilisation contributes highly to different potential impacts for crops: it <strong>in</strong>duces <strong>in</strong> particular 30-60% of the<br />
primary energy consumption, 60-80% of the global warm<strong>in</strong>g potential, 90% of the eutrophication potential,<br />
80-90% of the acidification potential (personal communication from ARVALIS and UNIP). Thus, allocation<br />
m<strong>et</strong>hod used to allocate fertilisers to crops can be decisive for the <strong>LCA</strong> outcomes.<br />
Allocat<strong>in</strong>g burdens from fertilisation is a subject of concern s<strong>in</strong>ce the beg<strong>in</strong>n<strong>in</strong>g of agricultural <strong>LCA</strong> and<br />
different reports dealt with this issue (Audsley <strong>et</strong> al. 2003; Gac <strong>et</strong> al., 2006). Recently, a work<strong>in</strong>g group (Agri<br />
Footpr<strong>in</strong>t M<strong>et</strong>hod, Blonk 2010) made recommendations to take <strong>in</strong>to account m<strong>in</strong>eral and organic nutrients<br />
from synth<strong>et</strong>ic fertilisers, manure and crop residues. However, these references rarely lead to common accepted<br />
rules <strong>in</strong> term of m<strong>et</strong>hodology or their suggestions are not always easy to apply because of data availability.<br />
In the framework of a project aim<strong>in</strong>g at assess<strong>in</strong>g environmental impacts of crop fertilisation by <strong>LCA</strong>, a bibliography<br />
review has been conducted to identify the different solutions <strong>in</strong>volved <strong>in</strong> <strong>LCA</strong> literature regard<strong>in</strong>g<br />
allocation rules for PK nutrients <strong>in</strong> synth<strong>et</strong>ic fertilisers, N from manure and N from crop residues (Table 1).<br />
Consider<strong>in</strong>g this large range of choices, allocation rules have been selected <strong>in</strong> order to be tested on study<br />
cases which will simulate levers to reduce impacts from fertilisation such as cover crops <strong>in</strong>troduction and the<br />
use of different types of fertilisers (m<strong>in</strong>eral and organic). These simulations will assess the rules feasibility<br />
and identify the most consistent. This work will result <strong>in</strong> recommendations about cropp<strong>in</strong>g plan allocation<br />
for m<strong>in</strong>eral and organic N, P, K nutrients and for crop residues, regard<strong>in</strong>g the aim of the study and the data<br />
availability.<br />
References<br />
Audsley <strong>et</strong> al. 2003, Harmonisation of environmental life cycle assessment for agriculture, f<strong>in</strong>al report DG<br />
VI Agriculture 2003, 101p.<br />
Blonk <strong>et</strong> al. 2010, M<strong>et</strong>hodology for assess<strong>in</strong>g carbon footpr<strong>in</strong>ts of horticultural products - A study of m<strong>et</strong>hodological<br />
issues and solutions for the development of the Dutch carbon footpr<strong>in</strong>t protocol for horticultural<br />
products Blonk Milieu Advies p.36-40<br />
European Commission 2010, ILCD Handbook, General Guide for Life Cycle Assessment – d<strong>et</strong>ailed guidance,<br />
394p.<br />
Gac <strong>et</strong> al. 2006, GES’TIM Guide méthodologique pour l’estimation des impacts des activités agricoles sur<br />
l’eff<strong>et</strong> de serre, Version 1.2, 156p.<br />
William <strong>et</strong> al. 2006, D<strong>et</strong>erm<strong>in</strong><strong>in</strong>g the environmental burdens and resource use <strong>in</strong> the production of agricultural<br />
and horticultural commodities. Defra project report IS0205, 97p.<br />
831
GROUP 4, SESSION B: CROP PRODUCTION SYSTEMS 8 th Int. Conference on <strong>LCA</strong> <strong>in</strong> the<br />
Agri-<strong>Food</strong> Sector, 1-4 Oct <strong>2012</strong><br />
Table 1. Allocation rules proposed <strong>in</strong> the literature for PK nutrients <strong>in</strong> synth<strong>et</strong>ic fertilisers, N from manure<br />
and N from crop residues<br />
Reference Allocat<strong>in</strong>g PK Allocat<strong>in</strong>g N from manure Allocat<strong>in</strong>g N from crop<br />
residues<br />
ILCD Handbook Attributional or system Attributional or system Attributional or system<br />
2011<br />
832<br />
extension recommended<br />
Blonk <strong>et</strong> al. 2010 To each crop <strong>in</strong> rotation<br />
accord<strong>in</strong>g to recommended<br />
quantities<br />
Gac <strong>et</strong> al. 2006 To each crop <strong>in</strong> rotation<br />
accord<strong>in</strong>g to the requirements<br />
Williams <strong>et</strong> al.<br />
2006<br />
Audsley <strong>et</strong> al.<br />
2003<br />
To the current crop except<br />
if it is an exigent crop (ex.<br />
Potatoes). In that case: surplus<br />
P to each crop accord-<br />
<strong>in</strong>g to requirements<br />
To each crop <strong>in</strong> rotation<br />
accord<strong>in</strong>g to the recommended<br />
quantities<br />
extension recommended<br />
Slowly degradable N fraction<br />
equally to the crops <strong>in</strong><br />
rotation, quickly degradable<br />
N fraction to the current<br />
crop<br />
extension recommended<br />
Accord<strong>in</strong>g to surface areas<br />
Accord<strong>in</strong>g to degradation<br />
-<br />
dynamic or equally b<strong>et</strong>ween<br />
the crops <strong>in</strong> rotation (b<strong>et</strong>ween<br />
two applications)<br />
To the current crop -<br />
To each crop <strong>in</strong> rotation<br />
accord<strong>in</strong>g to the recommended<br />
quantities<br />
-
GROUP 4, SESSION B: CROP PRODUCTION SYSTEMS 8 th Int. Conference on <strong>LCA</strong> <strong>in</strong> the<br />
Agri-<strong>Food</strong> Sector, 1-4 Oct <strong>2012</strong><br />
119. Design<strong>in</strong>g susta<strong>in</strong>able crop rotations us<strong>in</strong>g life cycle assessment of<br />
crop sequences<br />
Frank Hayer 1 , Emmanuelle Bonn<strong>in</strong> 2 , Benoit Carrouée 3 , Gérard Gaillard 1 , Thomas Nemecek 1, , Anne<br />
Schneider 3 , and Christophe Vivier 4<br />
1 Agroscope Reckenholz-Tänikon Research Station ART, CH-8046 Zurich, Switzerland, 2 Chambre d'Agriculture<br />
de la Nièvre, F-58028 Nevers, <strong>France</strong>, 3 Union Nationale des Plantes Riches en Proté<strong>in</strong>es UNIP, F-<br />
75008 Paris, <strong>France</strong>, 4 Chambre d'Agriculture de l'Yonne, F-89015 Auxerre, <strong>France</strong>, Correspond<strong>in</strong>g author.<br />
E-mail: thomas.nemecek@art.adm<strong>in</strong>.ch<br />
The project CAS DAR PCB (Amélioration des performances économiques <strong>et</strong> environnementales de<br />
systèmes de culture avec Pois, Colza <strong>et</strong> Blé) aimed at analys<strong>in</strong>g and optimis<strong>in</strong>g crop rotations <strong>in</strong> three French<br />
regions by the selection of crops <strong>in</strong> a crop rotation, def<strong>in</strong><strong>in</strong>g their sequence and by different nitrogen fertilisation<br />
levels. An <strong>LCA</strong> study of a large number of crop rotations is very time consum<strong>in</strong>g. Therefore the different<br />
sequences of previous crop-ma<strong>in</strong> crop were def<strong>in</strong>ed and analysed by <strong>LCA</strong>, consider<strong>in</strong>g the effects of a<br />
specific previous crop on cultivation, fertilisation, yield and emissions of the ma<strong>in</strong> crop. These crop sequences<br />
were subsequently comb<strong>in</strong>ed to analyse 58 crop rotations. Two functional units were used <strong>in</strong> this<br />
analysis: hectare per year and € gross marg<strong>in</strong> II. The study focused on the effect of legumes and reduced N<br />
fertilisation on environmental impacts.<br />
Production data were collected by the Chambers of Agriculture for a typical cultivation <strong>in</strong> Burgundy,<br />
Beauce, and Moselle for the reference period 2002-2008. The yield data were taken from survey of field<br />
level by the Chambers of Agriculture. Background data describ<strong>in</strong>g <strong>in</strong>frastructure, <strong>in</strong>puts and processes<br />
stemmed from the eco<strong>in</strong>vent database version 2.01 (eco<strong>in</strong>vent Centre, 2007). The direct field emissions<br />
(NH3, N2O, P, NO 3- , heavy m<strong>et</strong>als and pesticides) were estimated by models described <strong>in</strong> the SA<strong>LCA</strong><br />
m<strong>et</strong>hod (Nemecek <strong>et</strong> al., 2010). The analysis <strong>in</strong>cluded the production from cultivation up to the delivery at<br />
farm gate, as well as the environmental impacts l<strong>in</strong>ked with <strong>in</strong>put factors and the direct field emissions. The<br />
selected rotations are given <strong>in</strong> Table 1. The gross marg<strong>in</strong> II was calculated based on mean prices <strong>in</strong> the reference<br />
period.<br />
To illustrate the results the global warm<strong>in</strong>g potential (GWP) is shown for selection crop rotations <strong>in</strong> Fig. 1.<br />
Follow<strong>in</strong>g Nemecek <strong>et</strong> al. (2008) a difference of 4% b<strong>et</strong>ween two crop rotations can be considered as significant.<br />
The same tendencies were found across all impact categories. The alternative crop rotations with pea<br />
(P1 to P3) consistently reduced the GWP as compared to the standard rotations without pea (S1 and S2), both<br />
per hectare and year and per € gross marg<strong>in</strong> II. The effect was similar wh<strong>et</strong>her barley <strong>in</strong> the standard rotation<br />
was replaced by pea (P1) or pea was added (P2 and P3). The global warm<strong>in</strong>g potential per ha and year was<br />
reduced by around 10% and per € gross marg<strong>in</strong> by around 12%. In P2 pea is <strong>in</strong>serted before the stubble<br />
wheat <strong>in</strong> rotation S2. This reduced the GWP by around 14% per ha and year and 19% per € gross marg<strong>in</strong> II<br />
compared to S2. Look<strong>in</strong>g at the second option, the reduced fertilisation, compar<strong>in</strong>g the conventional and<br />
<strong>in</strong>tegrated rotations <strong>in</strong> Beauce shows that the impact per ha is reduced, whereas the impact per € gross marg<strong>in</strong><br />
II rema<strong>in</strong>s constant due to lower revenues. Comb<strong>in</strong><strong>in</strong>g <strong>in</strong>troduction of pea with reduced N fertilisation<br />
(Beauce_Int P1-P3) seems to be the most effective way to reduce the GWP.<br />
The analysis illustrates that peas allow to decrease impacts per ha and year on a rotational level and to <strong>in</strong>crease<br />
the eco-efficiency (lower impacts per € gross marg<strong>in</strong> II). This is caused by positive rotational effects<br />
(e.g. higher yields or a lower fertilisation <strong>in</strong> succeed<strong>in</strong>g crops). Therefore this strategy is favourable compared<br />
to a reduced fertilisation <strong>in</strong> s<strong>in</strong>gle crops. Comb<strong>in</strong><strong>in</strong>g both measures is the most effective strategy when<br />
look<strong>in</strong>g at impacts, but on the other hand the gross marg<strong>in</strong> II is reduced by around 40 € compared to the<br />
standard rotations.<br />
References<br />
eco<strong>in</strong>vent Centre (2007): eco<strong>in</strong>vent Data - The Life Cycle Inventory Data. Swiss Centre for Life Cycle Inventories,<br />
Dübendorf, ISBN 3-905594-38-2 available at http://www.eco<strong>in</strong>vent.org.<br />
Nemecek, T., Freiermuth Knuchel, R., Alig, M. & Gaillard, G. (2010): The advantages of generic <strong>LCA</strong> tools<br />
for agriculture: examples SA<strong>LCA</strong>crop and SA<strong>LCA</strong>farm. In: 7th Int. Conf. on <strong>LCA</strong> <strong>in</strong> the Agri-<strong>Food</strong> Sector,<br />
Notarnicola, B. (eds.). Bari, Italy. 433-438.<br />
Nemecek, T., von Richthofen, J.-S., Dubois, G., Casta, P., Charles, R. & Pahl, H. (2008): Environmental<br />
impacts of <strong>in</strong>troduc<strong>in</strong>g gra<strong>in</strong> legumes <strong>in</strong>to European crop rotations. European Journal of Agronomy, 28:<br />
380-393.<br />
833
GROUP 4, SESSION B: CROP PRODUCTION SYSTEMS 8 th Int. Conference on <strong>LCA</strong> <strong>in</strong> the<br />
Agri-<strong>Food</strong> Sector, 1-4 Oct <strong>2012</strong><br />
Table 1. Crop rotations analysed <strong>in</strong> the regions Beauce, Burgundy and Moselle. S1 and S2 are the standard<br />
rotations without pea, P1 to P3 are the rotations with pea.<br />
Figure 1. Global warm<strong>in</strong>g potential of crop rotations analysed <strong>in</strong> Beauce, Burgundy and Moselle <strong>in</strong> kg CO2equivalents<br />
per ha*a -1 (<strong>in</strong>dicated by the columns) and per € gross marg<strong>in</strong> II (diamond symbols).<br />
Beauce_CON = conventional production <strong>in</strong> Beauce, Beauce_INT = <strong>in</strong>tegrated production with reduced nitrogen<br />
fertilisation.<br />
834<br />
per ha * a -1<br />
Beauce Int/Con<br />
Burgundy/Moselle<br />
4000<br />
3500<br />
3000<br />
2500<br />
2000<br />
1500<br />
1000<br />
S1 S2<br />
Rotation<br />
P1 P2 P3<br />
1<br />
Oilseed rape<br />
2<br />
W<strong>in</strong>ter wheat<br />
3 Malt<strong>in</strong>g barley W<strong>in</strong>ter wheat W<strong>in</strong>ter pea<br />
Malt<strong>in</strong>g barley<br />
4 Oilseed rape Malt<strong>in</strong>g barley Oilseed rape W<strong>in</strong>ter wheat W<strong>in</strong>ter pea<br />
5 W<strong>in</strong>ter wheat W<strong>in</strong>ter wheat Malt<strong>in</strong>g barley Oilseed rape<br />
6 Malt<strong>in</strong>g barley Malt<strong>in</strong>g barley W<strong>in</strong>ter wheat<br />
7 Malt<strong>in</strong>g barley<br />
1<br />
Oilseed rape<br />
2<br />
W<strong>in</strong>ter wheat<br />
3 Malt<strong>in</strong>g barley W<strong>in</strong>ter wheat Spr<strong>in</strong>g pea<br />
Malt<strong>in</strong>g barley<br />
500<br />
4 Oilseed rape Ma./Fe barley Oilseed rape W<strong>in</strong>ter wheat Spr<strong>in</strong>g pea<br />
5 W<strong>in</strong>ter wheat W<strong>in</strong>ter wheat Ma./Fe barley Oilseed rape<br />
6 Ma./Fe barley W<strong>in</strong>ter wheat<br />
7 Ma./Fe barley<br />
0<br />
€ GM II<br />
kg N<br />
ma. = malt<strong>in</strong>g <strong>in</strong> Beauce and Bourgogne ; fe. = feed en Moselle<br />
Global warm<strong>in</strong>g potential100a (IPCC 2007) [kg-eq. CO 2]<br />
S1 S2 P1 P2 P3 S1 S2 P1 P2 P3 S1 S2 P1 P2 P3 S1 S2 P1 P2 P3<br />
496 475 499 489 495 444 431 451 443 449 286 281 266 271 266 245 233 272 266 271<br />
160 172 138 134 134 137 152 118 115 114 163 171 134 132 132 160 168 132 131 129<br />
Beauce_Con Beauce_INT Bourgogne Moselle<br />
soil tillage P/K fertiliser N fertiliser<br />
field emissions gra<strong>in</strong> dry<strong>in</strong>g irrigation<br />
seed pesticides per € gross marg<strong>in</strong> II<br />
12<br />
10<br />
8<br />
6<br />
4<br />
2<br />
0<br />
per € gross marg<strong>in</strong> II * a -1
GROUP 4, SESSION B: CROP PRODUCTION SYSTEMS 8 th Int. Conference on <strong>LCA</strong> <strong>in</strong> the<br />
Agri-<strong>Food</strong> Sector, 1-4 Oct <strong>2012</strong><br />
120. Life cycle assessment of various fertilisation systems <strong>in</strong> open field<br />
veg<strong>et</strong>able production, Flanders, Belgium<br />
Re<strong>in</strong>dert F. Heuts * , Jelle Van Loon, Eddie Schrevens<br />
Katholieke Universiteit Leuven, Research group DQM, Div. M3-BIORES, Dep. of Biosystems, Celesti-<br />
<br />
jnenlaan 200E b2411, BE-3001 Heverlee, Belgium, Correspond<strong>in</strong>g author. E-mail: Re<strong>in</strong>dert.Heuts@biw.kuleuven.be<br />
In Flanders, many farmers and horticultural growers wonder how they can lower the residual nitrate on their<br />
parcels to satisfy the fertiliser regulations s<strong>et</strong> up by European legislation. Currently this threshold is s<strong>et</strong> at a<br />
residual soil nitrate value of 90 kg/ha; for many farmers a limit hard to comply. In open field veg<strong>et</strong>able production<br />
like leek and cauliflower an overuse of fertiliser is very common. In this sector, less then 40% of the<br />
cultivated parcels were found under the imposed limit (Vlaamse Milieumaatschappij (VMM) 2006). One of<br />
the reasons of this excess on fertiliser application is the need of farmers to procure a good yield with a high<br />
quality to be comp<strong>et</strong>itive on the domestic mark<strong>et</strong>. Lower<strong>in</strong>g the nitrogen application rate however, with current<br />
recommended fertiliser schemes (i.e. KNS-system (Lorenz <strong>et</strong> al. 1985)), does not y<strong>et</strong> give sufficient<br />
guaranties to uphold these demand<strong>in</strong>g standards.<br />
In 2010 an experiment has been s<strong>et</strong> up to monitor and evaluate the <strong>in</strong>fluence of different fertiliser application<br />
rates and strategies on the growth, yield and quality of a cauliflower crop, and with a special emphasis on the<br />
amount of nitrate leach<strong>in</strong>g to soil and surface water. The experiment consists of 8 plots, treated with two<br />
different fertiliser doses and two application strategies, to create a two by two compl<strong>et</strong>ely randomised factorial<br />
design, replicated <strong>in</strong> two blocks. Each plot was fitted with an impermeable foil to capture and sample the<br />
dra<strong>in</strong>age. Destructive and non-destructive plant samples were taken to follow up growth evolution of the<br />
plant and at harvest measurements were done to evaluate the overall product quality.<br />
The experiment was chosen <strong>in</strong> such a way that a comparison could be made b<strong>et</strong>ween common cultivation<br />
practices and ‘improved’ management schemes developed with the <strong>in</strong>tention of lower<strong>in</strong>g the nitrate leach<strong>in</strong>g.<br />
For the common practices a broadcast fertilisation with calcium ammonium nitrate is assumed and, based on<br />
the recommendation of the KNS-system, a split fertilisation of 150 kg N/ha at plant<strong>in</strong>g and 240 kg N/ha 7<br />
weeks later is applied (i.e. the high dose), the m<strong>in</strong>eral N present <strong>in</strong> the soil profile <strong>in</strong>cluded. In attempt to<br />
achieve lower nitrate leach<strong>in</strong>g, the improved strategies consist of: a) the same broadcast split fertiliser application<br />
but with a low dose of 50 kg N/ha at plant<strong>in</strong>g and 100 kg N/ha 7 weeks <strong>in</strong>to the grow<strong>in</strong>g season, b) a<br />
weekly fertigation of ammonium nitrate with the high dose, and c) the same fertigation scheme with the low<br />
dose.<br />
As expected, differences <strong>in</strong> yield have been found among the various tested fertilisation systems (i.e. broadcast<br />
high yielded 70,99 ton/ha, broadcast low 55.26 ton/ha, fertigation high 67.28 ton/ha and fertigation low<br />
53.44 ton/ha). When aim<strong>in</strong>g only at high productivity, one would not dist<strong>in</strong>guish b<strong>et</strong>ween the broadcast and<br />
fertigation application of fertiliser, but with current pressure on the environment more objectives come <strong>in</strong>to<br />
consideration. For this reason a life cycle assessment (<strong>LCA</strong>) has been carried out (Gu<strong>in</strong>ee <strong>et</strong> al. 2002). Compar<strong>in</strong>g<br />
each fertilisation system the <strong>LCA</strong> focuses on the differences <strong>in</strong> <strong>in</strong>put loads and their correspond<strong>in</strong>g<br />
environmental impacts <strong>in</strong> terms of resource depl<strong>et</strong>ion, global warm<strong>in</strong>g, toxicity, acidification and eutrophication<br />
with special attention to nitrate leach<strong>in</strong>g. This way policy makers and farmers can consider to what extent<br />
the quantity or quality is <strong>in</strong>fluenced by a reduction <strong>in</strong> fertilisers and/or different treatment <strong>in</strong>puts regard<strong>in</strong>g<br />
their impact on the environment. In this way, the <strong>LCA</strong> supports decision mak<strong>in</strong>g regard<strong>in</strong>g optimisation<br />
of the fertilisation system and adaptation to severe constra<strong>in</strong>ts about energy demand and emissions to air,<br />
water and soil.<br />
In contrast with expectations, no large differences <strong>in</strong> impact have been found and even more surpris<strong>in</strong>g, the<br />
fertigation treatments did not score all too well. The nature of environmental impact with respect to the used<br />
fertilisation system, however, did change. This suggest that, even though a progressive split fertiliser application<br />
and fertigation are perceived as environmental conserv<strong>in</strong>g techniques, the problem is more complex and<br />
the larger context <strong>in</strong> which the farm<strong>in</strong>g activity takes place has to be considered <strong>in</strong> first <strong>in</strong>stance before be<strong>in</strong>g<br />
able to make proper unambiguous fertiliser management recommendations.<br />
References<br />
Gu<strong>in</strong>ee, J. B., Gorrée, M., Heijungs, R., Huppes, G., Kleijn, R., de Kon<strong>in</strong>g, A., van Oers, L., Wegener<br />
Sleeswijk, A., Suh, S., Udo de Haes, H. A., de Bruijn, H., van Du<strong>in</strong>, R., Huijbregts, M. A. J., 2002.<br />
835
GROUP 4, SESSION B: CROP PRODUCTION SYSTEMS 8 th Int. Conference on <strong>LCA</strong> <strong>in</strong> the<br />
Agri-<strong>Food</strong> Sector, 1-4 Oct <strong>2012</strong><br />
Handbook on life cycle assessment. Operational guide to the ISO standards. I: <strong>LCA</strong> <strong>in</strong> perspective. IIa:<br />
Guide. IIb: Operational annex. III: Scientific background. Kluwer Academic Publishers, 692<br />
Lorenz, H., Schlaghecken, J., Engl, G., 1985. Gezielte stickstoffversorgung - Das Kulturbegeleitende Nm<strong>in</strong>-<br />
Sollwerte System., 13, 646 - 648<br />
Vlaamse Milieumaatschappij (VMM), 2006. MIRA-T 2006 Milieu<strong>in</strong>dicatoren <strong>in</strong> zakformaat.<br />
836
GROUP 4, SESSION B: CROP PRODUCTION SYSTEMS 8 th Int. Conference on <strong>LCA</strong> <strong>in</strong> the<br />
Agri-<strong>Food</strong> Sector, 1-4 Oct <strong>2012</strong><br />
121. Comparison of CO2 emissions <strong>in</strong> the w<strong>in</strong>e production from<br />
traditional and organic farm<strong>in</strong>g techniques. A Spanish case study<br />
A. Aranda * , S. Scarpell<strong>in</strong>i, G. Ferreira, D. Zambrana<br />
CIRCE - Centre of Research for Energy Resources and Consumption, University of Zaragoza, Zaragoza,<br />
Spa<strong>in</strong>, * Correspond<strong>in</strong>g author. E-mail: alaranda@unizar.es<br />
Over the last several decades there is a grow<strong>in</strong>g demand for products made <strong>in</strong> a natural way with less <strong>in</strong>tervention<br />
of chemicals. However, the concern aris<strong>in</strong>g from the generation of greenhouse gas (GHG) emissions<br />
from the different production systems entails an assessment of their energy consumption, as well as of their<br />
emissions.<br />
Nowadays, the traditional crop has a number of technological elements added by the man which has been<br />
experienc<strong>in</strong>g and acquir<strong>in</strong>g more knowledge about the process over the past decades. In this sense, the traditional<br />
crop is def<strong>in</strong>ed as an <strong>in</strong>dustrialised m<strong>et</strong>hod that currently is used by the largest systems of production<br />
of grape. However, the organic farm<strong>in</strong>g which differs from the traditional crop ma<strong>in</strong>ly because it avoids the<br />
use of agrochemicals such as fertilisers and non-organic plant protection products, is ga<strong>in</strong><strong>in</strong>g a high <strong>in</strong>terest<br />
<strong>in</strong> the last decade.<br />
This paper shows the results obta<strong>in</strong>ed by the estimation of CO2 equivalent emissions us<strong>in</strong>g SimaPro v.7.2 and<br />
eco<strong>in</strong>vent 2.1 (PRé 2007) database, <strong>in</strong> order to assess the environmental impact of the traditional and ecological<br />
w<strong>in</strong>egrow<strong>in</strong>g. Although organic farm<strong>in</strong>g has as ma<strong>in</strong> objective the obta<strong>in</strong><strong>in</strong>g of maximum quality<br />
food while respect<strong>in</strong>g the environment, preserv<strong>in</strong>g the fertility of the earth through the optimal use of resources<br />
and without the use of synth<strong>et</strong>ic chemical products; the results show that this technique has associated<br />
higher amount of CO2 equivalent emissions i.e. 22% more compared to the traditional crop.<br />
837
GROUP 4, SESSION B: CROP PRODUCTION SYSTEMS 8 th Int. Conference on <strong>LCA</strong> <strong>in</strong> the<br />
Agri-<strong>Food</strong> Sector, 1-4 Oct <strong>2012</strong><br />
838<br />
122. Grape life cycle assessment: which m<strong>et</strong>hodological choices for a<br />
comb<strong>in</strong>ed assessment with grape quality?<br />
Christel Renaud-Gentié 1,* , Frédérique Jourjon 1 , Marc Benoît 2<br />
1 PRES LUNAM , UMT VINITERA, ESA, UR GRAPPE, 55 rue Rabelais, BP 30748, 49007 Angers Cedex 01<br />
– <strong>France</strong>, 2 INRA, SAD, UR 055, Aster, 662 avenue Louis Buff<strong>et</strong> Mirecourt BP 35, 88501 Mirecourt, <strong>France</strong>,<br />
* Correspond<strong>in</strong>g author. E-mail: c.renaud@groupe-esa.com<br />
Social, mark<strong>et</strong> and <strong>in</strong>stitutional pressure is grow<strong>in</strong>g on w<strong>in</strong>e producers for more environment friendly production<br />
strategies, while high quality w<strong>in</strong>e are more than ever necessary <strong>in</strong> a very comp<strong>et</strong>itive globalised<br />
mark<strong>et</strong>. Identification of the best trade-offs b<strong>et</strong>ween environmental performance of the v<strong>in</strong>eyard management<br />
and quality of the w<strong>in</strong>es would help producers <strong>in</strong> adapt<strong>in</strong>g their technical choices to these requirements. Consequently,<br />
we are build<strong>in</strong>g a comb<strong>in</strong>ed m<strong>et</strong>hod assess<strong>in</strong>g grape production practices on qualitative and environmental<br />
aspects through the comb<strong>in</strong>ation of <strong>LCA</strong> and quality evaluation of the grapes.<br />
With<strong>in</strong> the <strong>LCA</strong> results published about w<strong>in</strong>e production (P<strong>et</strong>ti <strong>et</strong> al.,2010;Vázquez-Rowe <strong>et</strong> al.,<strong>2012</strong>), we<br />
have to improve the d<strong>et</strong>ailed analysis of the agricultural practices contributions <strong>in</strong> a wide diversity of technical<br />
management paths and tak<strong>in</strong>g <strong>in</strong>to account the entire life of the v<strong>in</strong>eyard.<br />
Grape <strong>LCA</strong> is calculated <strong>in</strong> our project for exist<strong>in</strong>g contrasted v<strong>in</strong>eyard management strategies <strong>in</strong> parallel of<br />
quality measurements on grapes. The aim of the project is to identify (i) if trade-offs are needed b<strong>et</strong>ween<br />
quality and environment and (ii) for which specific part of production process (Renaud <strong>et</strong> al.,2010). This<br />
poster presents the m<strong>et</strong>hodological choices done for <strong>LCA</strong> application to viticulture <strong>in</strong> this purpose. It exposes<br />
examples of the choices made.<br />
The ma<strong>in</strong> types of v<strong>in</strong>eyard management strategies of Chen<strong>in</strong> Blanc Grape production for dry PDO w<strong>in</strong>es <strong>in</strong><br />
the Middle Loire Valley region, <strong>France</strong> were d<strong>et</strong>erm<strong>in</strong>ed through typology m<strong>et</strong>hods applied on a d<strong>et</strong>ailed<br />
survey conducted on 77 diverse parcels. Five ma<strong>in</strong> types of v<strong>in</strong>eyard management paths were identified result<strong>in</strong>g<br />
to the choice of 5 representative w<strong>in</strong>egrowers plots used for collection of grapes and data for <strong>LCA</strong>.<br />
The key m<strong>et</strong>hodological questions about <strong>LCA</strong> that were answered concern all the steps of <strong>LCA</strong> process: (i)<br />
Goal and scope def<strong>in</strong>ition: the most suitable functional unit for grape production is not only a grape quantity<br />
but also a production surface unit because of the importance of yield <strong>in</strong> w<strong>in</strong>e quality elaboration (Renaud <strong>et</strong><br />
al., 2010).<br />
(ii) System boundaries: the entire life of the v<strong>in</strong>eyard is taken <strong>in</strong> the system, <strong>in</strong>clud<strong>in</strong>g pre and post productive<br />
phases of the v<strong>in</strong>eyard management, like v<strong>in</strong>e plant<strong>in</strong>g, nursery, uplift<strong>in</strong>g of the v<strong>in</strong>eyard.<br />
(iii) Data collection from the w<strong>in</strong>egrowers and suppliers: all data have been d<strong>et</strong>ailed (mach<strong>in</strong>es, build<strong>in</strong>gs,<br />
<strong>in</strong>frastructure, operations, fertilisers, pesticides, fuels, work<strong>in</strong>g time, transport) but some have <strong>in</strong> the future to<br />
be more lightly <strong>in</strong>formed. A data collection tool was built for LCI implementation and direct emissions calculation.<br />
(iv) Inventory: direct emissions calculation models suitable for viticulture have been identified and compared<br />
on literature basis for their choice (see an example <strong>in</strong> table 1) for pesticides, erosion, nitrogen, phosphorus,<br />
and heavy m<strong>et</strong>als. They are applied for calculation.<br />
(v) Impacts calculation: processes which need to be d<strong>et</strong>ailed and calculated specifically for viticulture are<br />
identified and relevant impacts categories for viticulture are chosen.<br />
(vi) Interpr<strong>et</strong>ation: contributions analysis, sensitivity analysis and comparisons with literature give <strong>in</strong>formation<br />
on which processes need to be more d<strong>et</strong>ailed than others through the iterative process of <strong>LCA</strong>.<br />
This poster is a contribution for <strong>LCA</strong> practitioners who want to deal with viticulture or more widely perennial<br />
plants. It proposes solutions about the ma<strong>in</strong> m<strong>et</strong>hodological choices to be made on the agricultural part<br />
of w<strong>in</strong>e production. This study gives an assessment based on d<strong>et</strong>ailed data collected on real contrasted v<strong>in</strong>eyard<br />
management systems <strong>in</strong> order to identify practices contributions for l<strong>in</strong>k<strong>in</strong>g them to grapes quality results.<br />
It needs to be confirmed by further iterative calculations and two more v<strong>in</strong>tages of observations.<br />
References<br />
Audsley E, Alber S, Clift R, Cowell S, Cr<strong>et</strong>taz P, Gaillard G, <strong>et</strong> al. Harmonisation of environmental life cycle<br />
assessment for agriculture, F<strong>in</strong>al Report Concerted Action AIR3-CT94-2028. In: Commission E, editor.<br />
Community Research and Technological Development Programme <strong>in</strong> the field of “Agriculture and<br />
Agro-Industry, <strong>in</strong>clud<strong>in</strong>g Fisheries” AIR 3: European Commission DG VI Agriculture; 2003. p. 129.<br />
Birkved M, Hauschild MZ. PestLCI--A model for estimat<strong>in</strong>g field emissions of pesticides <strong>in</strong> agricultural<br />
<strong>LCA</strong>. Ecol. Modell. 2006;198(3-4):433-51.
GROUP 4, SESSION B: CROP PRODUCTION SYSTEMS 8 th Int. Conference on <strong>LCA</strong> <strong>in</strong> the<br />
Agri-<strong>Food</strong> Sector, 1-4 Oct <strong>2012</strong><br />
Jolli<strong>et</strong> O, Cr<strong>et</strong>taz P. Fate coefficients for the toxicity assessment of air pollutants. Int. Journal of Life Cycle<br />
Assessment. 1997;2(2):104-10.<br />
Margni M, Rossier D, Cr<strong>et</strong>taz P, Jolli<strong>et</strong> O. Life cycle impact assessment of pesticides on human health and<br />
ecosystems. Agriculture, Ecosystems & Environment. 2002;93(1-3):379-92.<br />
P<strong>et</strong>ti L, Ardente F, Bosco S, De Camillis C, Masotti P, Pattara C, <strong>et</strong> al. State of the art of Life cycle Assessment<br />
(<strong>LCA</strong>) <strong>in</strong> the w<strong>in</strong>e <strong>in</strong>dustry. In: Notarnicola B, S<strong>et</strong>tani E, Tassielli G, Giungato P, editors. <strong>LCA</strong><strong>Food</strong><br />
2010. Bari (IT),: Universita degli studi di Bari; 2010. p. 493-8.<br />
Renaud C, Benoît M, Jourjon F. Trade-offs b<strong>et</strong>ween quality and environment <strong>in</strong> w<strong>in</strong>e production: presentation<br />
of a research program for their comb<strong>in</strong>ed assessment. In: Notarnicola B, S<strong>et</strong>tani E, Tassielli G, Giungato<br />
P, eds. <strong>LCA</strong> <strong>Food</strong> 2010. Bari, (IT): 2010. p. 241-6<br />
Thioll<strong>et</strong> M. Construction des <strong>in</strong>dicateurs viti-environnementaux de la méthode INDIGO. Colmar: INRA;<br />
2003.<br />
Vázquez-Rowe I, Villanueva-Rey P, Moreira MT, Feijoo G. Environmental analysis of Ribeiro w<strong>in</strong>e from a<br />
timel<strong>in</strong>e perspective: Harvest year matters when report<strong>in</strong>g environmental impacts. Journal of Environmental<br />
Management. <strong>2012</strong>;98(0):73-83.<br />
Webb J, Hutch<strong>in</strong>gs N, Amon B. Agriculture other: Use of pesticides and limestone. EMEP/EEA emission<br />
<strong>in</strong>ventory guidebook European Environmental Agency; 2009.<br />
Table 1. Comparison of five pesticide emission models and <strong>in</strong>dicators of use <strong>in</strong> <strong>LCA</strong> of w<strong>in</strong>e-grape production.<br />
Data aspects considered<br />
Model Volatilisation to air<br />
W<strong>in</strong>d drift<br />
Emissions to surface<br />
waters<br />
Leach<strong>in</strong>g to surface waters<br />
Mode of application<br />
(Audsley <strong>et</strong> al., 2003) ● ● ● ● national / regional no yes<br />
EMEP / CORINAIR (Webb <strong>et</strong><br />
al., 2009)<br />
● ● national / regional no yes<br />
PestLCI (Birkved <strong>et</strong> al., 2006) ● ● ● ● ● ● ● ● ● plot partly yes<br />
I-Phy (INDIGO) (Thioll<strong>et</strong>, 2003) ● ● ● ● ● ● ● ● ● plot yes no<br />
CST (Jolli<strong>et</strong> <strong>et</strong><br />
(Margni <strong>et</strong> al., 2002)<br />
al.,1997),<br />
● ● ● ●<br />
national / regional/<br />
plot<br />
no yes<br />
Acknowledgements: A. Alaphilippe, E Bezuidenhoud, D. Boudiaf, G. Gaillard, P. Koch, and H. Van der Werf<br />
for their contribution to the work.<br />
Active substance properties<br />
Agricultural practices<br />
Crop species<br />
Crop phenological stages<br />
Application scale<br />
Adapted to grapev<strong>in</strong>e<br />
(Yes / No)<br />
Quantitative (Yes / No)<br />
839
GROUP 5, SESSION B: FOOD PRODUCTS 8 th Int. Conference on <strong>LCA</strong> <strong>in</strong> the<br />
Group 5, Session B: <strong>Food</strong> Products<br />
Agri-<strong>Food</strong> Sector, 1-4 Oct <strong>2012</strong><br />
123. Ecodesign opportunities for a farmer’s bread. Two case studies<br />
from north-western <strong>France</strong><br />
Michal Kulak , Thomas Nemecek 1 , Emmanuel Frossard 2 , Gerard Gaillard 1<br />
1 Agroscope Reckenholz-Tänikon Research Station ART, Zurich, Switzerland, 2 Institute of Agricultural<br />
Sciences, ETH Zurich, Switzerland, Correspond<strong>in</strong>g author. E-mail: michal.kulak@art.adm<strong>in</strong>.ch<br />
Bread is a staple food item for Europeans. Its history can be traced back to the beg<strong>in</strong>n<strong>in</strong>g of our civilisation.<br />
However, due to <strong>in</strong>dustrialisation and urbanisation, its production processes have notably changed over time.<br />
Some consumers believe that organoleptic and nutritional qualities of the product were affected as a result of<br />
these changes. There are farmers <strong>in</strong> Brittany and Pays de la Loire regions, who re<strong>in</strong>troduce many of the forgotten<br />
bread production m<strong>et</strong>hods from pre-<strong>in</strong>dustrial era. They collect ancient vari<strong>et</strong>ies of cereals and cultivate<br />
them <strong>in</strong> an organic way. Some use horses for traction. The gra<strong>in</strong> is milled on-farm and the bread is<br />
baked and sold locally. This way, a unique product is created. Som<strong>et</strong>imes though, this is done at the expense<br />
of the environment as traditional m<strong>et</strong>hods are not necessarily more ecoefficient. Van Holderbeke <strong>et</strong> al.<br />
(2004) compared environmental impacts from bread production <strong>in</strong> Belgium <strong>in</strong> the year 1800, 1900 and 2000.<br />
The life cycle carbon footpr<strong>in</strong>t results were 1.2 kg CO2eq kg -1 , 1.1 kg CO2eq kg -1 and 0.6 kg CO2eq kg -1 respectively.<br />
The goal of this study was to measure environmental impacts of French farmer’s bread and explore<br />
opportunities for changes <strong>in</strong> the design of production and distribution processes that would allow<br />
m<strong>in</strong>imis<strong>in</strong>g environmental impacts while ma<strong>in</strong>ta<strong>in</strong><strong>in</strong>g the positive attributes of this dist<strong>in</strong>ctive product to the<br />
consumer.<br />
Data on farm<strong>in</strong>g practices, process<strong>in</strong>g and distribution of bread were collected from two producers <strong>in</strong> northwestern<br />
<strong>France</strong>. Recent version of Swiss Agricultural Life Cycle Assessment (Nemecek <strong>et</strong> al., 2008) tools<br />
and eco<strong>in</strong>vent database were used to assess environmental impacts from the field to the consumer’s table.<br />
The functional unit was 1 kg of bread delivered at home and ready for consumption. End-of life processes-<br />
human excr<strong>et</strong>ion and wastewater treatment were excluded from the analysis. Impact categories were selected<br />
to reflect a broad range of environmental effects, <strong>in</strong>clud<strong>in</strong>g global warm<strong>in</strong>g contribution, the use of natural<br />
resources and potential toxicity. Results of the studies were dissem<strong>in</strong>ated to the farmers. Semi-structured<br />
face-to-face <strong>in</strong>terviews were conducted to choose promis<strong>in</strong>g ecodesign strategies- ones that would be effective<br />
<strong>in</strong> reduc<strong>in</strong>g environmental impacts and also accepted by the producer and his consumers.<br />
Table 1 shows a comparison of <strong>LCA</strong> results expressed per 1 kg of bread. Factor 8 differences <strong>in</strong> total result<br />
exist b<strong>et</strong>ween the two farms for some impact categories. This suggests significant differences <strong>in</strong> ecoefficiency<br />
may be achieved with different production m<strong>et</strong>hods. Fig. 1 shows the contribution of the particular<br />
production stages <strong>in</strong>to the overall environmental impact <strong>in</strong> Case 1. Most environmental impacts come from<br />
the wheat cultivation, followed by distribution and bak<strong>in</strong>g. There are strategies that can improve the ecoefficiency<br />
and would be accepted by the producer. The first solution would be to expand the relative area with<br />
the cereals and use mechanical traction, <strong>in</strong>stead of us<strong>in</strong>g the land to produce feedstuff for horses. At the same<br />
time, wheat vari<strong>et</strong>y currently cultivated by the farmer provides relatively low yields <strong>in</strong> the given soil conditions.<br />
It is expected, that choos<strong>in</strong>g a vari<strong>et</strong>y b<strong>et</strong>ter adapted to local conditions would improve the product<br />
environmental performance. It may also be possible to change the proportion of flour <strong>in</strong> the bread recipe. A<br />
higher proportion of crops that grow b<strong>et</strong>ter than wheat, such as rye could be used. It may also be feasible to<br />
optimise bak<strong>in</strong>g and distribution processes. Fig. 2 shows results for the second producer. Chang<strong>in</strong>g the crop<br />
or vari<strong>et</strong>y can also be considered here. A large share of the impact comes from the bak<strong>in</strong>g process. This is<br />
ma<strong>in</strong>ly done <strong>in</strong> the oven at consumer’s home. Bak<strong>in</strong>g the bread on-farm <strong>in</strong> a more efficient oven or form<strong>in</strong>g<br />
a partnership with the baker could potentially add value to the sold product and at the same time reduce environmental<br />
impacts.<br />
References<br />
Nemecek, T., von Richthofen, J., S., Dubois, G., Casta, P., Charles, R, Pahl, H. 2008. Environmental impacts<br />
of <strong>in</strong>troduc<strong>in</strong>g gra<strong>in</strong> legumes <strong>in</strong>to European crop rotations. Eur. J. Agron. 28, 380-393.<br />
Van Holderbeke, M., Sanjuán, N., Geerken, T., De Vooght, D. 2004. The history of bread production. Us<strong>in</strong>g<br />
<strong>LCA</strong> <strong>in</strong> the past, <strong>in</strong>: Halberg, N. (Ed.), Life Cycle Assessment <strong>in</strong> the agri-food sector. Danish Institute of<br />
Agricultural Sciences, pp. 255-260<br />
Table 1. Selected environmental impacts from 1 kg farmer’s bread at the consumer’s table of two case study<br />
farms <strong>in</strong> North-Western <strong>France</strong>.<br />
840
GROUP 5, SESSION B: FOOD PRODUCTS 8 th Int. Conference on <strong>LCA</strong> <strong>in</strong> the<br />
Agri-<strong>Food</strong> Sector, 1-4 Oct <strong>2012</strong><br />
Impact categories Unit Total impact (per 1 kg<br />
Non-renewable resource use - fos- Case<br />
sil and nuclear<br />
1<br />
Case<br />
2<br />
Global Warm<strong>in</strong>g Potential Case<br />
1<br />
Case<br />
2<br />
Eutrophication potential (terr., Case<br />
global)<br />
1<br />
Case<br />
2<br />
Aquatic ecotoxicity Case<br />
1<br />
Case<br />
2<br />
Land comp<strong>et</strong>ition Case<br />
1<br />
Case<br />
2<br />
Total water use (blue water) Case<br />
1<br />
Case<br />
2<br />
MJ eq<br />
MJ eq<br />
kg CO2 eq<br />
kg CO2 eq<br />
m 2<br />
m 2<br />
bread)<br />
23.8<br />
14.3<br />
1.90<br />
0.61<br />
0.53<br />
0.06<br />
kg 1,4-DB<br />
eq 2.8 x 10 -4<br />
kg 1,4-DB<br />
eq 0.2 x 10 -4<br />
m 2<br />
m 2<br />
dm 3<br />
13.96<br />
4.58<br />
11.60<br />
Figure 1. Case 1 - contribution of production stages <strong>in</strong>to the environmental impacts of farmer’s bread.<br />
Figure 2. Case 2 - contribution of production stages <strong>in</strong>to the environmental impacts of farmer’s bread.<br />
dm 3<br />
5.84<br />
841
GROUP 5, SESSION B: FOOD PRODUCTS 8 th Int. Conference on <strong>LCA</strong> <strong>in</strong> the<br />
Agri-<strong>Food</strong> Sector, 1-4 Oct <strong>2012</strong><br />
842<br />
124. How to adapt generic LCI data to be reliant on the orig<strong>in</strong>al<br />
recipe: case study of a biscuit<br />
Roberto Bell<strong>in</strong>o 1 , Marie Vuaillat 1 , Stéphane Le Pochat 1,* , Laure Vidal 2 , Stéphanie Capdeville 2 , Sylvie<br />
Mart<strong>in</strong>el 3<br />
1 EVEA, 56 bd. de la Fraternité, 44100 Nantes, <strong>France</strong>, 2 Eco-Concevoir, 23 Allée des Marronniers, 34130<br />
Mauguio, <strong>France</strong>, 3 Nutrition & Santé, BP 106, 31250 Revel, <strong>France</strong>, Correspond<strong>in</strong>g author. E-mail:<br />
s.lepochat@evea-conseil.com<br />
In 2011, EVEA and Eco-Concevoir carried out an <strong>LCA</strong> study of a biscuit for NUTRITION & SANTÉ, a<br />
lead<strong>in</strong>g company <strong>in</strong> Europe for health and organic agrifood products. It engaged <strong>in</strong> a global ecodesign process,<br />
carry<strong>in</strong>g out several <strong>LCA</strong>s, of which one was the <strong>LCA</strong> of a biscuit.<br />
Input data for LCIA were the different <strong>in</strong>gredients of the recipes and <strong>LCA</strong> practitioners had to deal with the<br />
lack of data or generic or <strong>in</strong>consistent data from eco<strong>in</strong>vent and <strong>LCA</strong> about specific <strong>in</strong>gredients or processes.<br />
To make LCIA results consistent as far as possible we had to adapt data from eco<strong>in</strong>vent. For agricultural<br />
data, we developed a procedure to create the required data (Fig. 1, Table 1). Once the <strong>in</strong>ventory was performed,<br />
we conducted the life cycle impact assessment of the biscuit. We compared results of the <strong>LCA</strong> of the<br />
biscuit with generic data and adapted data.<br />
Adapt<strong>in</strong>g data for cultural processes <strong>in</strong> our case study <strong>in</strong>creased the impacts by 10-75% on 7 impact categories<br />
(Fig. 2). If we assume an average uncerta<strong>in</strong>ty of 30% on each <strong>in</strong>dicator, these <strong>in</strong>creases are significant on<br />
3 <strong>in</strong>dicators: water consumption, eutrophication and acidification. These changes are ma<strong>in</strong>ly due to adaptation<br />
of yield which is lower <strong>in</strong> organic cultures than <strong>in</strong> conventional ones and <strong>in</strong>troduction of irrigation for<br />
the specific country where sugarcane is produced. We can also note that the adaptation leads to a decrease of<br />
22% of the impact of the product on water ecotoxicity. It can be easily expla<strong>in</strong>ed by the adaptation of pesticides<br />
use that was removed for organic cultures. However, this change cannot be considered as significant<br />
regard<strong>in</strong>g the high level of uncerta<strong>in</strong>ty on this <strong>in</strong>dicator.<br />
It is <strong>in</strong>terest<strong>in</strong>g to note that even <strong>in</strong> a cradle to gate system (<strong>in</strong>clud<strong>in</strong>g packag<strong>in</strong>g fabrication and end-of-life,<br />
biscuit production, distribution, <strong>et</strong>c.) the param<strong>et</strong>ers related to agricultural step can have significant <strong>in</strong>fluence<br />
on the f<strong>in</strong>al results. In the case of generic agricultural data adaptation, <strong>LCA</strong> practitioners should pay attention<br />
with priority to ma<strong>in</strong> param<strong>et</strong>ers (here, yield, irrigation and pesticides) and ma<strong>in</strong> <strong>in</strong>gredients.<br />
References<br />
Gop<strong>in</strong>ath, K.A., 2011. Organic Sesame Production. Technical Bull<strong>et</strong><strong>in</strong>, Central Research Institute for Dryland<br />
Agriculture, Santoshnagar, Hyderabad, Andhra Pradesh, India. 34p.<br />
Gudoshnikov Organic Sugar, 2001. Niche Commodity In The Ma<strong>in</strong>stream Mark<strong>et</strong>, FO LICHT International<br />
Sugar and Swe<strong>et</strong>ener Report, Vol 133, No 22 of 24th July 2001.<br />
Nemecek, T., Kägi, T. Life cycle <strong>in</strong>ventories of agricultural production systems. Data v2.0 (2007), eco<strong>in</strong>vent<br />
report n°15, December 2007.<br />
Toolseeram Ramjeawon, 2004. Life Cycle Assessment of Cane-Sugar on the Island of Mauritius, Int J. of<br />
<strong>LCA</strong>, 9 (4), pp. 254-260.
GROUP 5, SESSION B: FOOD PRODUCTS 8 th Int. Conference on <strong>LCA</strong> <strong>in</strong> the<br />
Agri-<strong>Food</strong> Sector, 1-4 Oct <strong>2012</strong><br />
Figure 1. Process for adapt<strong>in</strong>g data<br />
Table 1. For two <strong>in</strong>gredients used <strong>in</strong> the biscuit, the processes <strong>in</strong>cluded, the generic data used, and the ma<strong>in</strong><br />
adaptations performed on these data.<br />
Ingredients<br />
Organic brown<br />
sugar<br />
Organic toasted<br />
compl<strong>et</strong>e sesame<br />
seeds<br />
Ingredients production<br />
steps<br />
Sugarcane culture<br />
Sugar production<br />
Organic sesame<br />
culture<br />
Generic data used Adaptations<br />
Eco<strong>in</strong>vent data<br />
Sugarcane, at farm/BR<br />
Eco<strong>in</strong>vent data<br />
Sugar, from sugarcane, at sugar<br />
ref<strong>in</strong>ery/BR<br />
Eco<strong>in</strong>vent data<br />
Rape seed organic, at farm/CH<br />
Toast<strong>in</strong>g Data creation<br />
Country specific yield for organic production<br />
Country specific irrigation process<br />
M<strong>in</strong>eral fertilizer substitution by organic fertilizer<br />
Fertilizer needs (N, P, K) for organic production and related field<br />
emissions adapted<br />
Removal of pesticides <strong>in</strong>puts<br />
Country specific yield for organic production<br />
Country specific yield for organic production<br />
Fertilizer needs (N, P, K) for organic production and related field<br />
emissions adapted<br />
Figure 2. Environmental impacts of a pack<strong>et</strong> of biscuit with non-adapted data or data adapted for cultural<br />
steps. LCIA performed with SimaPro 7 software, accord<strong>in</strong>g BPX30-323 guidel<strong>in</strong>es (2011)<br />
843
GROUP 5, SESSION B: FOOD PRODUCTS 8 th Int. Conference on <strong>LCA</strong> <strong>in</strong> the<br />
Agri-<strong>Food</strong> Sector, 1-4 Oct <strong>2012</strong><br />
844<br />
125. Prioritis<strong>in</strong>g r<strong>et</strong>ail food waste prevention - potatoes, tomatoes or<br />
carambolas?<br />
Ingrid Strid<br />
Swedish University of Agricultural Sciences, Dept of Energy and Technology, P.O. Box 7032, SE-750 07<br />
Uppsala, Sweden, E-mail: <strong>in</strong>grid.strid@slu.se<br />
Loss of food is a major problem world-wide with regard to the environment and to food security. To prevent<br />
waste efficiently, a b<strong>et</strong>ter understand<strong>in</strong>g of the conditions beh<strong>in</strong>d the wastage is needed. This study is part of<br />
a research project focus<strong>in</strong>g on food wastage at the r<strong>et</strong>ail level of the Swedish food supply cha<strong>in</strong>, conducted<br />
by the Swedish University of Agricultural Sciences dur<strong>in</strong>g 2010-2013 (www.slu.se/foodwastage). After<br />
identify<strong>in</strong>g the ma<strong>in</strong> products driv<strong>in</strong>g the food wastage, the question of how to prioritise prevention options<br />
arises. In the present study, the fruit and veg<strong>et</strong>able department at six Swedish r<strong>et</strong>ail stores were studied. Data<br />
on sold and wasted quantities for 2010 and 2011 were obta<strong>in</strong>ed from the r<strong>et</strong>ail company. The result<strong>in</strong>g top<br />
lists of wasted items, <strong>in</strong> tonnes and as a percentage of sold volumes, gave a quantitative background necessary<br />
for the subsequent task to priorities b<strong>et</strong>ween mitigation targ<strong>et</strong>s. Potatoes and l<strong>et</strong>tuce dom<strong>in</strong>ated the<br />
wastage by mass, while rare exotic fruits had the highest waste percentage. In the next phase, the product<br />
specific carbon footpr<strong>in</strong>ts were multiplied with the wasted amounts to quantify the carbon footpr<strong>in</strong>t of each<br />
waste fraction. These <strong>LCA</strong>-based results shifted the list, so that tomatoes and swe<strong>et</strong> peppers now dom<strong>in</strong>ated<br />
the impact. In absolute numbers, the carbon footpr<strong>in</strong>t of food wastage was highest for tomatoes and peppers,<br />
lead<strong>in</strong>g to a possible conclusion to targ<strong>et</strong> these products for waste prevention measures at the fruit and veg<strong>et</strong>able<br />
departments studied. However, an alternative evaluation m<strong>et</strong>hod was also tested <strong>in</strong> order to relate the<br />
burdens from the wasted fraction to the benefit of the respective product. The benefit of each product was<br />
<strong>in</strong>dicated with its sold volume, reflect<strong>in</strong>g the food supply capability of the product. In this additional analysis<br />
the wastage carbon footpr<strong>in</strong>t was divided by the sold quantify of each product type to give an <strong>in</strong>dex of the<br />
un-necessary environmental impact per kg sold product. The result gave that rare exotic fruits totally dom<strong>in</strong>ated<br />
this recalculated list, where the carbon footpr<strong>in</strong>t of the wastage from bulk products added grams to the<br />
total results, while the correspond<strong>in</strong>g figure for each kg sold rare exotic fruit was 7.2 kg CO2-eq extra to the<br />
(already high) product specific carbon footpr<strong>in</strong>t of 11 kg CO2-eq. When relat<strong>in</strong>g the environmental burden of<br />
the wastage to the sold quantity of products, the conclusion became that rare exotic fruits should be prioritised<br />
for waste prevention measures at the veg<strong>et</strong>able departments of the r<strong>et</strong>ail cha<strong>in</strong> studied.<br />
References<br />
Carlsson-Kanyama, A., D Gonza´lez, A., 2009. Potential contributions of food consumption patterns to climate<br />
change. The American Journal of Cl<strong>in</strong>ical Nutrition 89(5), 1704-1709.<br />
Cellula, M., Ardente, F., Longo, S., Mistr<strong>et</strong>ta, M., 2010. Life Cycle Assessment (<strong>LCA</strong>) of protected crops: an<br />
Italian case study, 449-454, <strong>in</strong>: Proceed<strong>in</strong>gs from <strong>LCA</strong>food 2010 VII International conference on Life<br />
Cycle Assessment <strong>in</strong> the agri-food sector, volume 1. Notarnicola, B., S<strong>et</strong>tanni, E., Tassielli, G., Giungato,<br />
P. (Eds.). Universita Degli Studio di Bari Aldo Moro, Bari, Italy.<br />
Davis, J., Wallman, M., Sund, V., Emanuelsson, A., Cederberg, C., Sonesson, U., 2011. SIK report 828,<br />
Emissions of Greenhouse Gases from Production of Horticultural Products. The Swedish Institute of<br />
<strong>Food</strong> and Biotechnology, Gothenburg, Sweden.<br />
Karlsson, H., 2011. Seasonal Veg<strong>et</strong>ables - An Environmental Assessment of Seasonal <strong>Food</strong>. Master Thesis,<br />
Norwegian University of Life Sciences, Department of Plant and Environmental Sciences.<br />
Müller-L<strong>in</strong>denlauf, M. and Re<strong>in</strong>hardt, G., 2010. <strong>Food</strong> import versus regional production: comparison of energy<br />
demand and greenhouse gas emissions 487-492, <strong>in</strong>: Proceed<strong>in</strong>gs from <strong>LCA</strong>food 2010 VII International<br />
conference on Life Cycle Assessment <strong>in</strong> the agri-food sector, volume 1. Notarnicola, B., S<strong>et</strong>tanni,<br />
E., Tassielli, G., Giungato, P. (Eds.). Universita Degli Studio di Bari Aldo Moro, Bari, Italy.<br />
Röös, E., Sundberg, C., Hansson, P-A., 2010. Uncerta<strong>in</strong>ties <strong>in</strong> the carbon footpr<strong>in</strong>t of food products: a case<br />
study on table potatoes. The International Journal of Life Cycle Assessment 15(5), 478-488.
GROUP 5, SESSION B: FOOD PRODUCTS 8 th Int. Conference on <strong>LCA</strong> <strong>in</strong> the<br />
Agri-<strong>Food</strong> Sector, 1-4 Oct <strong>2012</strong><br />
Table 1. Yearly sold and wasted fruit and veg<strong>et</strong>ables at six Swedish r<strong>et</strong>ail stores<br />
Product Sold Wasted<br />
Waste<br />
quota<br />
(tonne/yr) (tonne/yr) (%)<br />
Product<br />
carbon<br />
footpr<strong>in</strong>t<br />
kg CO2eq/kg<br />
product<br />
Wastage<br />
carbon<br />
footpr<strong>in</strong>t<br />
tonne CO2eq<br />
of<br />
yearly<br />
wastage<br />
Wastage carbon<br />
footpr<strong>in</strong>t per<br />
quantity sold<br />
g CO2-eq/kg<br />
product<br />
Potato 1616 10 0.62 0.12 1 1.2 0.7<br />
L<strong>et</strong>tuce 349 7.3 2.1 1.0 2 3.6 10<br />
Tomato 743 6.8 0.90 0.9 3 6.1 8.2<br />
Swe<strong>et</strong> pepper 271 5.4 1.9 1.1 4 5.9 22<br />
Carrot 439 4.5 1.0 0.18 5 0.8 1.8<br />
Banana 768 4.4 0.57 1.1 6 4.8 6.3<br />
Rare exotic fruits (Tamarillo,<br />
Pithaya, Pep<strong>in</strong>o, Prickly pear,<br />
Carambola, Rambutan)<br />
0.6 0.39 39 11 7 1<br />
Röös <strong>et</strong> al., 2010<br />
4.3 7200<br />
2<br />
Müller-L<strong>in</strong>denlauf and Re<strong>in</strong>hardt, 2010<br />
3 Karlsson, 2011<br />
4 Cellula, <strong>et</strong> al., 2010<br />
5 Davis <strong>et</strong> al., 2011<br />
6 www.dole.com (accessed <strong>2012</strong>-02-10)<br />
7 Carlsson-Kanyama and D. González<br />
845
GROUP 5, SESSION B: FOOD PRODUCTS 8 th Int. Conference on <strong>LCA</strong> <strong>in</strong> the<br />
Agri-<strong>Food</strong> Sector, 1-4 Oct <strong>2012</strong><br />
846<br />
126. <strong>LCA</strong> of waste from olive oil manufactur<strong>in</strong>g<br />
Bruno Notarnicola 1,* , Bernardo De Gennaro 2 , Giuseppe Tassielli 1 , Pi<strong>et</strong>ro Alexander Renzulli 1<br />
1 Ionian department of Law, Economics and Environment, University of Bari, Italy, 2 Department of Agro-<br />
Environmental and Territorial Sciences, University of Bari, Italy, * Correspond<strong>in</strong>g author. E-mail: brunonotarnicola@gmail.com<br />
Comp<strong>et</strong>ition on both national and <strong>in</strong>ternational olive oil mark<strong>et</strong>s is becom<strong>in</strong>g <strong>in</strong>creas<strong>in</strong>gly <strong>in</strong>tense, thus forc<strong>in</strong>g<br />
organisations to identify new and diverse comp<strong>et</strong>itive advantages, particularly by <strong>in</strong>creas<strong>in</strong>g the efficiency<br />
with<strong>in</strong> the firm. So far, the prevail<strong>in</strong>g action undertaken by firms, with regards to this, has been to<br />
search for process <strong>in</strong>novations that also entailed a reduction of unit production costs (Notarnicola <strong>et</strong> al.,<br />
2003). However, the current development paradigms show that <strong>in</strong> order to obta<strong>in</strong> the best results, the entire<br />
supply cha<strong>in</strong> must be designed as a whole, try<strong>in</strong>g to foresee the flows go<strong>in</strong>g through the whole economic<br />
system rather than just one firm or process.<br />
This aspect becomes particularly relevant for the olive oil supply cha<strong>in</strong>, <strong>in</strong> which alternative options can be<br />
found <strong>in</strong> both the cultivation stage (traditional, super-<strong>in</strong>tensive) (De Gennaro <strong>et</strong> al., <strong>2012</strong>) and the <strong>in</strong>dustrial<br />
process<strong>in</strong>g stage (two or three phases) and the alternative oil products (Nicol<strong>et</strong>ti <strong>et</strong> al., 2001). Each option<br />
generates f<strong>in</strong>al outputs tog<strong>et</strong>her with solid and liquid waste with very different characteristics.<br />
In this research a comparison b<strong>et</strong>ween various alternative options for produc<strong>in</strong>g olive oil – discont<strong>in</strong>uous,<br />
two-phase and three-phase systems – is performed by means of <strong>LCA</strong>. Particular attention is placed on the<br />
treatment of waste that is generated <strong>in</strong> each process<strong>in</strong>g stage of the olive oil supply cha<strong>in</strong>, for each alternative<br />
option.<br />
These processes differ <strong>in</strong> terms of the yields and the organoleptic quality of the f<strong>in</strong>ished product, but the<br />
pr<strong>in</strong>cipal differences regard the quantity and quality of waste: variation of the humidity levels of the pomace<br />
and the concentration of veg<strong>et</strong>ation water.<br />
The outcomes of this study show the environmental profile of the systems considered, and they are expected<br />
to contribute to the current debate on wh<strong>et</strong>her a three phases-system, which is widely adopted <strong>in</strong> some areas<br />
like the Apulia region <strong>in</strong> Italy, should be transformed <strong>in</strong> a two phases-system, by means of economic <strong>in</strong>centives<br />
support<strong>in</strong>g the replacement of the old plants too.<br />
References<br />
De Gennaro B., Notarnicola B., Roselli L., Tassielli G., 2010. Innovative olive-grow<strong>in</strong>g models: an economic<br />
and environmental assessment. J. Cleaner Production, doi:10.1016/j.jclepro.2011.11.004<br />
Nicol<strong>et</strong>ti G. M., Notarnicola B., Tassielli G., 2001. Comparative <strong>LCA</strong> of virg<strong>in</strong> olive oil vs. seed oils. The<br />
International Conference <strong>LCA</strong> <strong>in</strong> <strong>Food</strong>s, Goteborg 25-27 April 2001.<br />
Notarnicola B., Tassielli G., Nicol<strong>et</strong>ti G. M., 2003. LCC and <strong>LCA</strong> of extra-virg<strong>in</strong> olive oil: organic vs. conventional.<br />
4th International Conference: Life Cycle Assessment <strong>in</strong> the Agri-food sector, Horsens, 6-8 October<br />
2003.
GROUP 5, SESSION B: FOOD PRODUCTS 8 th Int. Conference on <strong>LCA</strong> <strong>in</strong> the<br />
Agri-<strong>Food</strong> Sector, 1-4 Oct <strong>2012</strong><br />
127. Environmental impact of animal food products and their<br />
substitutes<br />
Trudy Rood 1 , Durk Nijdam, Henk Westhoek, A. Leip 2 , J.P. Lesschen 3<br />
1 PBL N<strong>et</strong>herlands Environmental Assessment Agency, Bilthoven, The N<strong>et</strong>herlands, 2 European Commission<br />
- Jo<strong>in</strong>t Research Centre, Institute for Environment and Susta<strong>in</strong>ability, Ispra, Italy, 3 Alterra, Wagen<strong>in</strong>gen-UR,<br />
Wagen<strong>in</strong>gen, The N<strong>et</strong>herlands, Correspond<strong>in</strong>g author. E-mail: trudy.rood@pbl.nl<br />
Land use, greenhouse gas emissions (GHG) and nitrogen (N) emissions are the ma<strong>in</strong> causes of global loss of<br />
biodiversity and damage to ecosystems (Rockstrom <strong>et</strong> al., 2009). Major impacts on the environment, and<br />
thus also on biodiversity, are caused by the production of meat, dairy and fish. In this study, different prote<strong>in</strong><br />
sources, such as meat, dairy, fish, eggs and meat substitutes, are compared for their environmental impacts.<br />
In order to identify the range of impacts, their most important related factors, as well as the ma<strong>in</strong> causes of<br />
the differences b<strong>et</strong>ween products, 44 life-cycle assessment (<strong>LCA</strong>) studies were analysed, conta<strong>in</strong><strong>in</strong>g 96<br />
<strong>LCA</strong>s of animal and veg<strong>et</strong>al sources of prote<strong>in</strong>. Moreover, the results for agricultural products were compared<br />
to results from the model Miterra-Europe. The Miterra-Europe model was used to calculate greenhouse<br />
gas and nitrogen emissions from agriculture, follow<strong>in</strong>g a life-cycle approach that reached 'up to the farm<br />
gate' (Lesschen <strong>et</strong> al., 2011).<br />
Compared to other review studies, such as De Vries and De Boer (2010), Yan (2011), Roy <strong>et</strong> al. (2009), Flachowsky<br />
and Hachenberg (2009), and González <strong>et</strong> al.(2011) conta<strong>in</strong><strong>in</strong>g a selection of <strong>LCA</strong> studies on animal<br />
products and ma<strong>in</strong>ly focused on greenhouse gases, our review study presents a broader view.<br />
There are very large differences <strong>in</strong> carbon footpr<strong>in</strong>ts and land requirements b<strong>et</strong>ween the various prote<strong>in</strong><br />
sources <strong>in</strong> the human di<strong>et</strong>. Greenhouse gas emission levels from the most climate-friendly prote<strong>in</strong> sources<br />
are up to 100 times lower than those from the most climate-unfriendly prote<strong>in</strong> sources. For land use, compris<strong>in</strong>g<br />
both arable land and grasslands, this varies even more strongly. In the case of grasslands, there are<br />
also large differences <strong>in</strong> the quality of land use <strong>in</strong> terms of biodiversity. Veg<strong>et</strong>al sources, poultry products<br />
and certa<strong>in</strong> seafood have well below average environmental impacts, while those of rum<strong>in</strong>ant meat and some<br />
other types of seafood are well above the average.<br />
The impact differences b<strong>et</strong>ween the various products were found ma<strong>in</strong>ly to be due to differences <strong>in</strong> production<br />
systems. In the life cycle of prote<strong>in</strong> sources, <strong>in</strong> general, the farm phase is the most important. Further<br />
process<strong>in</strong>g, transportation and packag<strong>in</strong>g are of less importance.<br />
The differences <strong>in</strong> scores, both b<strong>et</strong>ween and with<strong>in</strong> the various product categories, offer chances for lower<strong>in</strong>g<br />
the environmental impact of our prote<strong>in</strong> consumption. Shift<strong>in</strong>g consumption towards other sources of prote<strong>in</strong><br />
has a large potential for reduc<strong>in</strong>g the impacts on biodiversity and climate change.<br />
References<br />
De Vries, M., de Boer, I.J.M., 2010. Compar<strong>in</strong>g environmental impacts for livestock products: A review of<br />
life cycle assessments. Livestock Science 128, 1-11.<br />
Flachowsky, G., Hachenberg, S., 2009. CO2 Footpr<strong>in</strong>ts for <strong>Food</strong> of Animal Orig<strong>in</strong> – Present Stage and Open<br />
Questions. Journal für Verbraucherschutz und Lebensmittelsicherheit 4, 190-198.<br />
González, A.D., Frostell, B., Carlsson-Kanyama, A., 2011. Prote<strong>in</strong> efficiency per unit energy and per unit<br />
greenhouse gas emissions. <strong>Food</strong> Policy, In Press.<br />
Lesschen, J.P., van den Berg, M., Westhoek, H.J., Witzke, H.P. and Oenema, O., 2011. Greenhouse gas<br />
emission profiles of European livestock sectors. Animal Feed Science & Technology 166-167, 16-28.<br />
Rockstrom, J., Steffen, W., Noone, K., Persson, A., Chap<strong>in</strong>, F.S., Lamb<strong>in</strong>, E.F., Lenton, T.M., Scheffer, M.,<br />
Folke, C., Schellnhuber, H.J., Nykvist, B., de Wit, C.A., Hughes, T., van der Leeuw, S., Rodhe, H., Sorl<strong>in</strong>,<br />
S., Snyder, P.K., Costanza, R., Sved<strong>in</strong>, U., Falkenmark, M., Karlberg, L., Corell, R.W., Fabry, V.J.,<br />
Hansen, J., Walker, B., Liverman, D., Richardson, K., Crutzen, P., Foley, J.A., 2009. A safe operat<strong>in</strong>g<br />
space for humanity. Nature 461, 472-475.<br />
Roy, P., Nei, D., Orikasa, T., Xu, Q., Okadome, H., Nakamura, N., Shi<strong>in</strong>a, T., 2009. A review of life cycle<br />
assessment (<strong>LCA</strong>) on some food products. Journal of <strong>Food</strong> Eng<strong>in</strong>eer<strong>in</strong>g 90, 1-10.<br />
Yan, M.J., Humphreys, J, Holden, N. M., 2011. An evaluation of life cycle assessment of European milk<br />
production. Journal of Environmental Management 92, 372-379.<br />
847
GROUP 5, SESSION B: FOOD PRODUCTS 8 th Int. Conference on <strong>LCA</strong> <strong>in</strong> the<br />
Agri-<strong>Food</strong> Sector, 1-4 Oct <strong>2012</strong><br />
848<br />
128. Industrial ecology and agri-food sector. Perspectives of<br />
implementation <strong>in</strong> an Italian regional cluster<br />
Raffaella Taddeo * , Alberto Simboli, Anna Morgante<br />
University “G. d’Annunzio”, Department of Economic Studies, V.le P<strong>in</strong>daro 42, 65127 Pescara, Italy, <br />
Correspond<strong>in</strong>g author. E-mail: r.taddeo@unich.it<br />
Over the last fifty years, the development of the agri-food sector has been characterised, <strong>in</strong> many developed<br />
countries, by significant structural, technological and organisational changes, which have led to the <strong>in</strong>volvement<br />
and <strong>in</strong>tegration, <strong>in</strong> traditional food production cha<strong>in</strong>s, of a number of activities, such as: food process<strong>in</strong>g,<br />
manufactur<strong>in</strong>g of technical equipment, packag<strong>in</strong>g <strong>in</strong>dustry, transportation, storage, distribution, mark<strong>et</strong><strong>in</strong>g,<br />
cater<strong>in</strong>g. The spontaneous agglomeration of agricultural activities <strong>in</strong> favorable geographic areas, has<br />
often led to the development of clusters of SMEs, recognised as agri-food clusters. Agri-food clusters are<br />
characterised by typical environmental impacts, such as: land use, CO2 emission, energy and water consumption,<br />
use of agricultural <strong>in</strong>puts such as fertilisers, pesticides, feed additives and irrigation water. However, the<br />
<strong>in</strong>volvement of agro-<strong>in</strong>dustrial activity <strong>in</strong> the same area highlights other significant sources of waste related<br />
to auxiliary materials and different types of packag<strong>in</strong>g used dur<strong>in</strong>g agricultural activities and food process<strong>in</strong>g<br />
(materials such as polystyrene, poly<strong>et</strong>hylene, polypropylene, wood, paper). Industrial Ecology, through a<br />
more efficient management of material and energy flows, helps to reduce loads and environmental impacts<br />
of production activities without compromis<strong>in</strong>g their comp<strong>et</strong>itiveness. Major applications of Industrial Ecology<br />
pr<strong>in</strong>ciples <strong>in</strong> the agri-food sector, concern the valorisation of animal and veg<strong>et</strong>able by-products, lead<strong>in</strong>g<br />
to the implementation of so-called Agro-Eco-Industrial Parks. The purpose of an Agro-Eco-Industrial Park is<br />
to provide a base for companies and service organisation <strong>in</strong> achiev<strong>in</strong>g a transition to susta<strong>in</strong>able farm<strong>in</strong>g,<br />
improv<strong>in</strong>g the value of their output and ga<strong>in</strong><strong>in</strong>g mark<strong>et</strong> channels. In an agri-food cluster, alternative and effective<br />
solutions can be also implemented to manage waste flows deriv<strong>in</strong>g from auxiliary materials used <strong>in</strong><br />
agro-<strong>in</strong>dustrial activities, through the adoption of closed loop approaches, especially consider<strong>in</strong>g technical<br />
features of such flows: high volumes, high percentage of non-hazardous materials, homogeneity <strong>in</strong> composition,<br />
and regular (or cyclic) flows. This paper presents a prelim<strong>in</strong>ary analysis of one of the most representative<br />
agri-<strong>in</strong>dustrial clusters <strong>in</strong> the production of horticultural products, the area of Fuc<strong>in</strong>o <strong>in</strong> Abruzzo Region<br />
(Italy). The cluster covers an area about 15,000 ha, for a total of 3,700 small and micro-sized enterprises that<br />
produce ma<strong>in</strong>ly carrots, potatoes, endive and l<strong>et</strong>tuce (Fig. 1). The study aims to analyse the ma<strong>in</strong> veg<strong>et</strong>able<br />
and not veg<strong>et</strong>able waste flows to propose alternative options for manag<strong>in</strong>g them <strong>in</strong> the perspective of an<br />
Agro-Eco-Industrial Park. The prelim<strong>in</strong>ary qualitative analysis shows that efficient solutions can be potentially<br />
implemented through recycl<strong>in</strong>g, recovery and repair activities, materials substitution and alternative<br />
energy production, exploit<strong>in</strong>g synergies of the exist<strong>in</strong>g cluster (Fig. 2).<br />
References<br />
Ayres, R., Ayres, L. W., 1996. Industrial Ecology: Towards clos<strong>in</strong>g the material cycles, first ed. Edward<br />
Elgar, Cheltenham.<br />
Indigo Development, 2005. Creat<strong>in</strong>g systems solutions for susta<strong>in</strong>able development through Industrial Ecology.<br />
Develop<strong>in</strong>g Agricultural Eco-Industrial Parks <strong>in</strong> Ch<strong>in</strong>a. Available at<br />
http://<strong>in</strong>digodev.com/AEIPwhitepaper.html. Accessed January <strong>2012</strong>.<br />
Kroyer, G. Th., 1995. Impact of food process<strong>in</strong>g on the environment – an overview. LWT – <strong>Food</strong> Science<br />
and Technology 28, 547-552.<br />
Nguyen Ngoc, U., Schnitzer, H., 2010. Environmental understand<strong>in</strong>g of agro-based <strong>in</strong>dustrial systems and<br />
susta<strong>in</strong>able development. International Journal of Environment and Susta<strong>in</strong>able Development 9, 149-180.<br />
Taddeo, R., Simboli, A., Morgante, A., 2011. Symbiotic exchanges and hazardous wastes <strong>in</strong> Chemical Industry.<br />
A “Path-Dependent” Case Study, 21 th S<strong>et</strong>ac Europe Annual Me<strong>et</strong><strong>in</strong>g, Milano Convention Centre, 15-<br />
19 May. Proceed<strong>in</strong>gs.
GROUP 5, SESSION B: FOOD PRODUCTS 8 th Int. Conference on <strong>LCA</strong> <strong>in</strong> the<br />
Agri-<strong>Food</strong> Sector, 1-4 Oct <strong>2012</strong><br />
Figure 1. The Fuc<strong>in</strong>o agri-food cluster and its ma<strong>in</strong> productions (2011).<br />
Figure 2. Potential solutions <strong>in</strong> the Fuc<strong>in</strong>o agri-food cluster.<br />
849
GROUP 5, SESSION B: FOOD PRODUCTS 8 th Int. Conference on <strong>LCA</strong> <strong>in</strong> the<br />
Agri-<strong>Food</strong> Sector, 1-4 Oct <strong>2012</strong><br />
850<br />
129. <strong>LCA</strong>s for animal products pork, beef, milk and eggs <strong>in</strong> F<strong>in</strong>land<br />
Kirsi Usva * , Jouni Nousia<strong>in</strong>en, Helena Hyvär<strong>in</strong>en, Yrjö Virtanen<br />
MTT Agrifood Research F<strong>in</strong>land, Correspond<strong>in</strong>g author. E-mail: kirsi.usva@mtt.fi<br />
This paper presents results of <strong>LCA</strong> for pork, beef, milk and eggs produced <strong>in</strong> F<strong>in</strong>land. Environmental impact<br />
categories assessed were climate change, eutrophication and acidification and, additionally, land and energy<br />
use. Several <strong>LCA</strong>s had been implemented on F<strong>in</strong>nish food products earlier, but there was a need for comprehensive<br />
environmental impact assessment of most important food products. Both plant and animal products<br />
were assessed.<br />
The functional unit of <strong>LCA</strong>s is kg of a product at the farm gate (without packag<strong>in</strong>g). System boundaries <strong>in</strong>clude<br />
animal production (heat<strong>in</strong>g, lightn<strong>in</strong>g, mechanical work) on the farm, as well as compl<strong>et</strong>e cha<strong>in</strong>s of the<br />
animal feeds, fuels and power which supply that. The supply cha<strong>in</strong>s <strong>in</strong>clude all significant <strong>in</strong>dustrial process<strong>in</strong>g,<br />
product packag<strong>in</strong>g, energy and transports. Data for the supply cha<strong>in</strong>s were obta<strong>in</strong>ed from the <strong>in</strong>dustry,<br />
which produce the majority of the <strong>in</strong>puts used <strong>in</strong> the animal production <strong>in</strong> F<strong>in</strong>land. Energy was assumed<br />
accord<strong>in</strong>g to the F<strong>in</strong>nish average grid. Data on the use of <strong>in</strong>puts at crop and grass production were based on<br />
the national agricultural database consist<strong>in</strong>g of data on the cultivation <strong>in</strong>stances of various crop species and<br />
grass, i.e. it is primary data. Data on mechanical work were based on physical models.<br />
Animal production models were used to assess partly the <strong>in</strong>ventory data and partly the impacts of animal<br />
production. Animal models consist of animal population age-classes, their specific feed consumption and<br />
di<strong>et</strong> composition. This <strong>in</strong>formation <strong>in</strong> utilised <strong>in</strong> simple balance calculations (nutrient <strong>in</strong>take <strong>in</strong> feeds – nutrient<br />
r<strong>et</strong>ention <strong>in</strong> growth and products) of nitrogen and phosphorus and gross energy <strong>in</strong>take that is necessary <strong>in</strong><br />
m<strong>et</strong>hane production estimation. Models were based on e.g. national statistics and calculation based on feed<strong>in</strong>g<br />
norms. M<strong>et</strong>hane emissions were estimated accord<strong>in</strong>g to models used <strong>in</strong> F<strong>in</strong>nish greenhouse gas <strong>in</strong>ventory.<br />
Nitrogen amount <strong>in</strong> excrement and ur<strong>in</strong>e was assessed by animal model (nitrogen balance) and assessment<br />
of NH3 and N2O emissions <strong>in</strong> animal shelter and manure storage were based on this.<br />
Emissions from manure storage were allocated to animal production. Emissions from manure spread<strong>in</strong>g on<br />
the field were allocated to the those plants the manure was used as fertiliser for. Allocations were needed<br />
also to allocate <strong>in</strong>puts and emissions especially <strong>in</strong> beef and milk –case b<strong>et</strong>ween milk and meat. In F<strong>in</strong>land<br />
most of the beef production is connected to milk production. For pork and beef allocations were done b<strong>et</strong>ween<br />
different qualities of meat. Allocations were calculated accomplished economic values of different<br />
products. In egg production all <strong>in</strong>puts and emissions were allocated to eggs.<br />
Results of <strong>LCA</strong>s <strong>in</strong> terms of climate change, eutrophication and acidification are shown <strong>in</strong> Fig. 1-3. Environmental<br />
impacts of beef are more than twice as much as impacts of pork. In case of climate change the<br />
m<strong>et</strong>hane emissions from bov<strong>in</strong>e are higher than from pigs. In terms of eutrophication, most of the impacts<br />
derive from feed production <strong>in</strong> F<strong>in</strong>land. Pigs and chickens use soy which do not cause as much eutrophication<br />
impact as F<strong>in</strong>nish feeds. NH3-emissions from manure are the ma<strong>in</strong> reason for acidification impact. An<br />
important th<strong>in</strong>g is, that feed conversion ratio of pigs and chickens are b<strong>et</strong>ter than bov<strong>in</strong>es’.<br />
<strong>Food</strong> stuffs are one of the most important consumer goods <strong>in</strong> terms of environmental impacts of consumption.<br />
Animal models are a strong base for emission assessment <strong>in</strong> animal shelters and manure storage. Mach<strong>in</strong>ery<br />
work models represent a typical situation <strong>in</strong> F<strong>in</strong>land as well as feed production models based on<br />
national agricultural data. As such the results of the <strong>LCA</strong>s represent the typical F<strong>in</strong>nish animal products.<br />
Tog<strong>et</strong>her with <strong>LCA</strong>s of plant products they are very valuable <strong>in</strong> compar<strong>in</strong>g the environmental burdens of<br />
different food stuffs <strong>in</strong> F<strong>in</strong>land. Results may be utilised <strong>in</strong> communication to consumers, political decisionmak<strong>in</strong>g<br />
and improvement of animal product supply cha<strong>in</strong>s and production systems.<br />
References<br />
Grönroos, J., Mattila, P., Reg<strong>in</strong>a, K., Nousia<strong>in</strong>en, J., Perälä, P., Saar<strong>in</strong>en, K. and Mikkola-Pusa, J. 2009. Development<br />
of the ammonia emission <strong>in</strong>ventory <strong>in</strong> F<strong>in</strong>land. pp. 15-19.<br />
Saar<strong>in</strong>en, M., Virtanen, Y. and Hyvär<strong>in</strong>en, H. <strong>2012</strong>. <strong>LCA</strong>s for a large repertoire of F<strong>in</strong>nish outdoor plant<br />
products. Abstract for <strong>LCA</strong> <strong>Food</strong> <strong>2012</strong> Conference.<br />
Statistics F<strong>in</strong>land 2011. Greenhouse Gas Emissions <strong>in</strong> F<strong>in</strong>land 1990-2009. pp. 248-253.
GROUP 5, SESSION B: FOOD PRODUCTS 8 th Int. Conference on <strong>LCA</strong> <strong>in</strong> the<br />
Agri-<strong>Food</strong> Sector, 1-4 Oct <strong>2012</strong><br />
Figure 1. Eutrophication impact of animal products (kg PO4 eq./product kg).<br />
Figure 2. Climate change impact of animal products (kg CO2 eq./product kg).<br />
Figure 3. Acidification impact of animal products (AE eq./product kg).<br />
851
GROUP 5, SESSION B: FOOD PRODUCTS 8 th Int. Conference on <strong>LCA</strong> <strong>in</strong> the<br />
Agri-<strong>Food</strong> Sector, 1-4 Oct <strong>2012</strong><br />
130. Greenhouse gas emissions related to saturated fat, sodium and<br />
di<strong>et</strong>ary fibre content of food products<br />
Corné van Dooren * , Annely Douma<br />
N<strong>et</strong>herlands Nutrition Centre (Voed<strong>in</strong>gscentrum), P.O. Box 85700, 2508 CK The Hague, The N<strong>et</strong>herlands, <br />
Correspond<strong>in</strong>g author. E-mail: dooren@voed<strong>in</strong>gscentrum.nl<br />
The Dutch Health Council concludes <strong>in</strong> her 2011 advice that a healthy di<strong>et</strong> accord<strong>in</strong>g to the Wheel of Five<br />
model is usually also environmentally friendly. Furthermore, she states that there is a strong correlation b<strong>et</strong>ween<br />
various <strong>in</strong>dicators of susta<strong>in</strong>ability, such as greenhouse gases (GHG), energy and land use (Health<br />
Council 2011). The Italian double pyramid shows that there is an <strong>in</strong>verse relationship b<strong>et</strong>ween breakdown <strong>in</strong><br />
health ga<strong>in</strong> and environmental impact, expressed as carbon, water and ecological footpr<strong>in</strong>t (Buchner, Fischler<br />
<strong>et</strong> al. 2010). Our study <strong>in</strong>vestigates and quantifies this hypothesis with Dutch data.<br />
Data sources: food composition (RIVM 2011); land use and energy use (Gerbens-Leenes 2006) water use<br />
(Hoekstra and Chapaga<strong>in</strong> 2004) and GHG (CLM, klimaatweegschaal.nl; 2009 not published). Correlation<br />
b<strong>et</strong>ween GHG, energy use, water use and land use was calculated with a Spearman rank correlation test.<br />
Further analyses were only done with the GHG data as <strong>in</strong>dicator (n=403). Products were divided <strong>in</strong>to 6 categories<br />
accord<strong>in</strong>g to the Wheel of Five education model. A Kruskal Wallis and a Mann-Withney U test were<br />
performed to d<strong>et</strong>erm<strong>in</strong>e differences b<strong>et</strong>ween groups of products (Fig. 1).<br />
To f<strong>in</strong>d wh<strong>et</strong>her a healthy food pattern could be <strong>in</strong> l<strong>in</strong>e with a susta<strong>in</strong>able food pattern, the products were<br />
divided <strong>in</strong>to a broad accepted division of Preference, Neutral and Exception, based on saturated fat, sodium,<br />
added sugar and fibre content (Voed<strong>in</strong>gscentrum 2011). Differences <strong>in</strong> GHG of these groups were explored.<br />
To further <strong>in</strong>vestigate wh<strong>et</strong>her this mentioned nutrients affects the emission of GHG, the nutrients were <strong>in</strong>cluded<br />
<strong>in</strong> a regression analysis (for this analyses GHG data was log transformed).<br />
We f<strong>in</strong>d a correlation b<strong>et</strong>ween GHG and land, energy and water use (all r>0.354, p
GROUP 5, SESSION B: FOOD PRODUCTS 8 th Int. Conference on <strong>LCA</strong> <strong>in</strong> the<br />
Agri-<strong>Food</strong> Sector, 1-4 Oct <strong>2012</strong><br />
Virtual Energy Land<br />
GHG water use use<br />
GHG 1.000 0.668 ** 0.584 ** 0.354 **<br />
Virtual water 1.000 0.132 0.794 **<br />
Energy use 1.000 0.294 *<br />
Land use 1.000<br />
** p
GROUP 5, SESSION B: FOOD PRODUCTS 8 th Int. Conference on <strong>LCA</strong> <strong>in</strong> the<br />
Agri-<strong>Food</strong> Sector, 1-4 Oct <strong>2012</strong><br />
854<br />
131. Harmonis<strong>in</strong>g <strong>LCA</strong> m<strong>et</strong>hodology: A collaborative approach <strong>in</strong> a<br />
search for allocation rules for food sector<br />
Hanna Hartika<strong>in</strong>en * , Juha-Matti Katajajuuri, Frans Silvenius<br />
MTT Agrifood Research F<strong>in</strong>land, 00790 Hels<strong>in</strong>ki, F<strong>in</strong>land,<br />
hanna.hartika<strong>in</strong>en@mtt.fi<br />
Correspond<strong>in</strong>g author. E-mail:<br />
There are several general and more specific life cycle assessment (<strong>LCA</strong>) calculation guides. However, the<br />
food sector is lack<strong>in</strong>g a common guide that is tak<strong>in</strong>g <strong>in</strong>to account the special features of the sector and, thus,<br />
giv<strong>in</strong>g practical and harmonised guidel<strong>in</strong>es for calculat<strong>in</strong>g food products’ footpr<strong>in</strong>ts. There are few <strong>in</strong>itiatives,<br />
such as, the m<strong>et</strong>hodology for food products structured by the European <strong>Food</strong> SCP Round Table. Another<br />
<strong>in</strong>itiative is the F<strong>in</strong>nish project called “<strong>Food</strong>pr<strong>in</strong>t” (2009–<strong>2012</strong>). The project’s aim is to create harmonised<br />
and practical attributional <strong>LCA</strong> m<strong>et</strong>hodology and guidel<strong>in</strong>es for, particularly F<strong>in</strong>nish, food sector. The<br />
key objectives of the project are: 1) to actively follow and <strong>in</strong>fluence the harmonisation of <strong>LCA</strong> m<strong>et</strong>hods both<br />
<strong>in</strong>ternationally and nationally, 2) to <strong>in</strong>volve F<strong>in</strong>nish food cha<strong>in</strong> actors <strong>in</strong>to the development process (via pilots,<br />
steer<strong>in</strong>g group me<strong>et</strong><strong>in</strong>gs, workshops, sem<strong>in</strong>ars), and 3) to atta<strong>in</strong> more supply cha<strong>in</strong> specific data from<br />
the entire food cha<strong>in</strong>. The last targ<strong>et</strong> is both to improve the food cha<strong>in</strong>’s operations and to give more both<br />
reliable and comparable <strong>in</strong>formation to consumers of the environmental impacts of the food product <strong>in</strong> question.<br />
When draft<strong>in</strong>g the F<strong>in</strong>nish <strong>LCA</strong> m<strong>et</strong>hodology for food products one central question found out to be the allocation<br />
rules, especially <strong>in</strong> the multi-output systems. As well known, <strong>LCA</strong>’s aim is to assess environmental<br />
impacts associated with all the stages of a product's lifecycle. The problem is that allocation is lack<strong>in</strong>g unambiguous<br />
basis and, thus, jeopardis<strong>in</strong>g the credibility of the <strong>LCA</strong> m<strong>et</strong>hodology. Allocation decisions are<br />
easily <strong>in</strong>fluenced by the analysts’ perspectives and worldviews and, thus, there are arguments from different<br />
angles wh<strong>et</strong>her, for <strong>in</strong>stance, economic, biophysical or mass-based allocations are suitable or not <strong>in</strong> different<br />
case-studies/decision-mak<strong>in</strong>g situations.<br />
The discussion about allocation m<strong>et</strong>hods has been go<strong>in</strong>g on and on <strong>in</strong> the research community but m<strong>et</strong>hods’<br />
usefulness <strong>in</strong> reality is not always fully considered. Therefore, the actual barriers for the acceptable (depends<br />
on the viewer) allocation m<strong>et</strong>hods are easily forgotten. In the <strong>Food</strong>pr<strong>in</strong>t project, besides a broad literature<br />
review and active follow<strong>in</strong>g of <strong>in</strong>ternational discussion on allocation m<strong>et</strong>hods, there have been several discussions<br />
with the F<strong>in</strong>nish food cha<strong>in</strong> actors to discover allocation m<strong>et</strong>hods that are simultaneously comprehensive,<br />
suitable and practical. In these discussions, for <strong>in</strong>stance, biophysical allocation (read e.g. IDF 2010:<br />
allocation b<strong>et</strong>ween milk and beef (Appendix B)) raised <strong>in</strong>terest but its complexity and limited use were considered<br />
its def<strong>in</strong>ite drawbacks. Additionally, <strong>in</strong>ternationally widely preferred economic allocation was seen<br />
problematic for many reasons. First of all, the mark<strong>et</strong> prices fluctuate and are easily <strong>in</strong>fluenced by various<br />
external factors. Secondly, if earlier prices (e.g. products’ values prior to any further process<strong>in</strong>g) are used,<br />
these prices depend on producers’ pric<strong>in</strong>g strategies, and thus, not on the ‘actual values’ of products. These<br />
prices are also often trade secr<strong>et</strong>s. All <strong>in</strong> all, <strong>in</strong> economic allocation the allocation proportions are usually<br />
heavily <strong>in</strong>fluenced by many factors. Therefore, <strong>in</strong> order to improve the appropriateness of the use of economic<br />
allocation one should pay more attention to its uncerta<strong>in</strong>ties and weaknesses - at least uncerta<strong>in</strong>ties<br />
should be revealed when communicat<strong>in</strong>g the results.<br />
Another important issue brought <strong>in</strong>to the discussion by the F<strong>in</strong>nish food cha<strong>in</strong> actors was that <strong>in</strong> order to<br />
receive harmonised results one needs strict allocation rules <strong>in</strong>stead of rules that are loose and open to <strong>in</strong>terpr<strong>et</strong>ations.<br />
It was stated that s<strong>in</strong>ce food sector comprises several different food products, it would be best to<br />
agree on the best allocation m<strong>et</strong>hods or on the least bad alternatives <strong>in</strong> a more case specific level. This leads<br />
us closer to the product category rules’ (PCRs’) ideology, i.e. closer to product specific rules. Furthermore, it<br />
was stated by food cha<strong>in</strong> actors that these more case specific discussions should also take <strong>in</strong>to account different<br />
types of food product cha<strong>in</strong>s <strong>in</strong> order to atta<strong>in</strong> more uniform allocation rules.<br />
Altog<strong>et</strong>her, the aim of the discussions and preferred practices <strong>in</strong> F<strong>in</strong>land is not to differentiate F<strong>in</strong>nish practices<br />
from <strong>in</strong>ternational practices. On the contrary, the aim is to strengthen the <strong>in</strong>ternational harmonisation<br />
and, thus, to share F<strong>in</strong>nish experiences and discuss them. We believe that the attempt to harmonise <strong>LCA</strong><br />
calculation, to fully understand the weaknesses of allocation practices, and to f<strong>in</strong>d more appropriate approaches<br />
requires collaboration among the research community and, moreover, strong <strong>in</strong>clusion of the food<br />
cha<strong>in</strong> actors <strong>in</strong>to these discussions.
GROUP 5, SESSION B: FOOD PRODUCTS 8 th Int. Conference on <strong>LCA</strong> <strong>in</strong> the<br />
Agri-<strong>Food</strong> Sector, 1-4 Oct <strong>2012</strong><br />
References<br />
IDF (International Dairy Federation). A common carbon footpr<strong>in</strong>t approach for dairy, The IDF guide to standard<br />
lifecycle assessment m<strong>et</strong>hodology for the dairy sector, Bull<strong>et</strong><strong>in</strong> of the International Dairy Federation<br />
445/2010.<br />
855
GROUP 5, SESSION B: FOOD PRODUCTS 8 th Int. Conference on <strong>LCA</strong> <strong>in</strong> the<br />
Agri-<strong>Food</strong> Sector, 1-4 Oct <strong>2012</strong><br />
132. Assessment of the life cycle of a Portuguese w<strong>in</strong>e: from viticulture<br />
to distribution<br />
Belmira A. F. N<strong>et</strong>o 1,* , Ana Cláudia Dias 2 , Mar<strong>in</strong>a Machado 3<br />
1 CEMUC, Faculty of Eng<strong>in</strong>eer<strong>in</strong>g, University of Porto, 4200-465 Porto, Portugal, 2 CESAM & Department<br />
of Environment and Plann<strong>in</strong>g, University of Aveiro, 3810-193 Aveiro, Portugal, 3 Faculty of Eng<strong>in</strong>eer<strong>in</strong>g,<br />
University of Porto, 4200-465 Porto, Portugal, Correspond<strong>in</strong>g author. E-mail: belmira.n<strong>et</strong>o@fe.up.pt<br />
This study assesses the life cycle assessment of a w<strong>in</strong>e produced <strong>in</strong> Portugal, i.e., the white green w<strong>in</strong>e, designated<br />
as v<strong>in</strong>ho verde branco. This is to identify the environmental impacts occurr<strong>in</strong>g along the w<strong>in</strong>e life<br />
cycle. The stages considered <strong>in</strong>clude activities tak<strong>in</strong>g place dur<strong>in</strong>g 1) Viticulture, 2) W<strong>in</strong>e production (from<br />
v<strong>in</strong>ification to storage), 3) Distribution and 4) Bottles production.<br />
Materials and energy consumption as well as the emissions to air, soil and water from the w<strong>in</strong>e campaign of<br />
2008/2009 were reported to the functional unit (0.75 litres of white green w<strong>in</strong>e). A Portuguese company,<br />
located <strong>in</strong> the northern part of Portugal, responsible for the production of about 20% of the current total production<br />
of white green w<strong>in</strong>e, supplied specific life cycle data, <strong>in</strong>clud<strong>in</strong>g <strong>in</strong>formation regard<strong>in</strong>g transportation<br />
of grapes, w<strong>in</strong>e, must and other w<strong>in</strong>e production related products. Information concern<strong>in</strong>g the distribution of<br />
this w<strong>in</strong>e consumed worldwide is also made available by the company <strong>in</strong> terms of the amount sold to each<br />
country and the transportation mode.<br />
The life cycle approach taken shows Viticulture as the stage that mostly contributes to most of the impact<br />
categories. The production of glass bottles appear as the second larger contributor and W<strong>in</strong>e Production and<br />
Distribution appeared as the third larger contributors. The Production of w<strong>in</strong>e products and the transportations<br />
of grapes, w<strong>in</strong>e products and w<strong>in</strong>e and must have a comparatively negligible effect. Sensitivity analysis<br />
results show that some param<strong>et</strong>ers are very <strong>in</strong>fluential.<br />
856
GROUP 5, SESSION B: FOOD PRODUCTS 8 th Int. Conference on <strong>LCA</strong> <strong>in</strong> the<br />
Agri-<strong>Food</strong> Sector, 1-4 Oct <strong>2012</strong><br />
133. Can you afford to make an eco-di<strong>et</strong>?<br />
Sirpa Kurppa * , Kirsi Silvenno<strong>in</strong>en<br />
MTT Biotechnology and <strong>Food</strong> Research, Team of Susta<strong>in</strong>able Bioeconomy FIN-31600 Jokio<strong>in</strong>en, F<strong>in</strong>land, <br />
Correspond<strong>in</strong>g author. E-mail: sirpa.kurppa@mtt.fi<br />
The EU Commission has s<strong>et</strong> the agricultural sector a recommended targ<strong>et</strong> of reduc<strong>in</strong>g greenhouse gas emissions<br />
by 50% by 2050, which would require a 35% reduction by 2030. Our aim was describe some possible<br />
changes <strong>in</strong> the F<strong>in</strong>nish di<strong>et</strong> that can help cut the emissions, while at same time benefitt<strong>in</strong>g public health, by<br />
e.g. prevent<strong>in</strong>g heart diseasesand overweight. Meanwhile, big changes <strong>in</strong> food patterns are usually difficult<br />
to achieve, we created several small adjustments all through the di<strong>et</strong>, keep<strong>in</strong>g all the time the nutritional recommendations<br />
<strong>in</strong> m<strong>in</strong>d. We assumed that this approach would be much more successful than recommend<strong>in</strong>g<br />
for example a vegan/veg<strong>et</strong>arian di<strong>et</strong> for everyone.<br />
Our Eco-Di<strong>et</strong>’s ma<strong>in</strong> aim is to decrease the environmental impacts of food cha<strong>in</strong>, while it simultaneously<br />
encourages healthy eat<strong>in</strong>g patterns, is more economical to the consumer, and improves animal welfare.<br />
In Eco-Di<strong>et</strong>, we propose that meals <strong>in</strong> general conta<strong>in</strong> less meat and more veg<strong>et</strong>ables, and we prefer seasonal<br />
products. Our Eco-Di<strong>et</strong> is a model that is easy to adapt to everyday life by everybody, without requir<strong>in</strong>g any<br />
specific knowledge or education, or particular motivation for shift<strong>in</strong>g towards vegan/veg<strong>et</strong>arian di<strong>et</strong>. Both of<br />
our benchmarked di<strong>et</strong>s, the eco-di<strong>et</strong> and conventional di<strong>et</strong> used as a reference <strong>in</strong>clude meat, fish and dairy<br />
products.<br />
We termed our conventional di<strong>et</strong> Basic Di<strong>et</strong>, and it was composed based on average F<strong>in</strong>nish di<strong>et</strong> with average<br />
amount of calories. The other one we termed Eco-Di<strong>et</strong>, which took <strong>in</strong>to consideration climate change,<br />
water eutrophication, nutrition recommendations <strong>in</strong>clud<strong>in</strong>g appropriate amount of calories, and food waste.<br />
Both di<strong>et</strong>s covered a full week of five work<strong>in</strong>g days and two days of weekend; each day hav<strong>in</strong>g three meals:<br />
breakfast, lunch and d<strong>in</strong>ner. Breakfast consisted of juice, bread or porridge, veg<strong>et</strong>able oil margar<strong>in</strong>e, and<br />
some veg<strong>et</strong>ables or fruit. Lunch and d<strong>in</strong>ner consisted of meat, fish or bean ma<strong>in</strong> course and a side dish such<br />
as potatoes or rice. In addition, lunch and d<strong>in</strong>ner <strong>in</strong>cluded also a salad, bread, spread and dr<strong>in</strong>k.<br />
The Eco-Di<strong>et</strong> <strong>in</strong>cluded various k<strong>in</strong>ds of meals; home cooked meals, convenience food and meals cooked <strong>in</strong><br />
school canteens <strong>in</strong> communal food services. In our model we used school meals for lunch, home cooked<br />
meal or convenience food for d<strong>in</strong>ner, and a home cooked breakfast. Here school meals were seen as an<br />
equivalent to office lunch. For the weekends, lunch and d<strong>in</strong>ner were home cooked or convenience food<br />
meals, and breakfast was made at home.<br />
We demonstrated that by follow<strong>in</strong>g Eco-Di<strong>et</strong> for one week there was ca 40% decrease <strong>in</strong> carbon footpr<strong>in</strong>t,<br />
while the impact on water eutrophication was even more significant. Differences <strong>in</strong> environmental impacts<br />
b<strong>et</strong>ween s<strong>in</strong>gle food plate portions are remarkable: the highest animal based portions can have 5 times the<br />
environmental impact when compared to the lowest veg<strong>et</strong>arian/vegan portion. In Eco-Di<strong>et</strong> we managed cut<br />
off the highest impacts of the s<strong>in</strong>gle food plates to such an extent that the difference b<strong>et</strong>ween lowest and the<br />
highest impacts was only about three times, <strong>in</strong> both carbon footpr<strong>in</strong>t and water eutrophication.<br />
We compared the cost of the Eco-Di<strong>et</strong> to the conventional di<strong>et</strong>, and found that for a consumer economy the<br />
Eco-Di<strong>et</strong> is a feasible, money sav<strong>in</strong>g alternative. Thus, we could oppose the preconception and correct the<br />
th<strong>in</strong>k<strong>in</strong>g that environmental enhancive di<strong>et</strong> would be more expensive and as such regarded as a premium<br />
di<strong>et</strong>. At the same time with sav<strong>in</strong>g the environment we can also save our money.<br />
In F<strong>in</strong>land households are wast<strong>in</strong>g about 5% of all purchased food 8 . Production of food that is lost <strong>in</strong> the<br />
food supply cha<strong>in</strong> causes remarkable, unnecessary environmental and economic impacts. We assumed that<br />
Eco-Di<strong>et</strong> does not waste any food.<br />
857
GROUP 5, SESSION B: FOOD PRODUCTS 8 th Int. Conference on <strong>LCA</strong> <strong>in</strong> the<br />
Agri-<strong>Food</strong> Sector, 1-4 Oct <strong>2012</strong><br />
858<br />
134. Value of a life cycle approach <strong>in</strong> evaluat<strong>in</strong>g the environmental<br />
impacts of packag<strong>in</strong>g for food and beverage applications<br />
Sonia Valdivia 1 , Bruce Vigon 2 , Jim Fava 3 , Laura Flanigan 3,*<br />
1 UN Environment Program, 2 Soci<strong>et</strong>y of Environmental Toxicology and Chemistry, 3 PE INTERNA-<br />
TIONAL, Inc., Correspond<strong>in</strong>g author. E-mail: l.flanigan@fivew<strong>in</strong>ds.com<br />
The nexus b<strong>et</strong>ween security and saf<strong>et</strong>y and environmental performance of packag<strong>in</strong>g <strong>in</strong> food and beverages<br />
is a key question driv<strong>in</strong>g the mark<strong>et</strong> for susta<strong>in</strong>able packag<strong>in</strong>g today. Therefore, an articulation of the benefits<br />
of the life cycle approach to design, manufactur<strong>in</strong>g, use and end of life management of packag<strong>in</strong>g for<br />
food applications is important to further exam<strong>in</strong>ation of the role of packag<strong>in</strong>g.<br />
Key items of focus for this research and analysis <strong>in</strong>cluded:<br />
What is the value of a life cycle approach for beverage and food products and packag<strong>in</strong>g?<br />
What is the value of <strong>in</strong>clud<strong>in</strong>g all life cycle stages <strong>in</strong> evaluat<strong>in</strong>g the packag<strong>in</strong>g/food systems to reduce<br />
overall life cycle impacts?<br />
What is the value of <strong>in</strong>clud<strong>in</strong>g multiple impacts <strong>in</strong> evaluat<strong>in</strong>g the packag<strong>in</strong>g/food systems to reduce<br />
overall life cycle impacts?<br />
What is the value of <strong>in</strong>clud<strong>in</strong>g the food and/or beverage <strong>in</strong>to an evaluation of the packag<strong>in</strong>g life cycle<br />
impacts?<br />
What characteristics of future <strong>LCA</strong> studies should be considered when evaluat<strong>in</strong>g the food/packag<strong>in</strong>g<br />
life cycle?<br />
Examples of how the waste management hierarchy and <strong>LCA</strong> results <strong>in</strong>terface/connect<br />
This presentation will present the results of study to exam<strong>in</strong>e the value of a life cycle approach <strong>in</strong> evaluat<strong>in</strong>g<br />
the environmental impacts of packag<strong>in</strong>g for food and beverage applications. The UNEP/SETAC Life Cycle<br />
Initiative brought to the project a unique comb<strong>in</strong>ation of benefits that cannot be obta<strong>in</strong>ed from other sources.<br />
These benefits <strong>in</strong>clude:<br />
Neutral, objective, authoritative, and recognised forum for advanc<strong>in</strong>g understand<strong>in</strong>g of packag<strong>in</strong>g life<br />
cycle for food applications<br />
Global dissem<strong>in</strong>ation of the report<br />
Proven 10-year history of solid project deliverables<br />
Acknowledgement: The authors thank the sponsor<strong>in</strong>g organisations for their support.<br />
References<br />
Valdivia, S., Vigon, B., Fava, J., Flanigan, L. Value of a Life Cycle Approach <strong>in</strong> Evaluat<strong>in</strong>g the Environmental<br />
Impacts of Packag<strong>in</strong>g for <strong>Food</strong> and Beverage Applications. UNEP/SETAC Life Cycle Initiative.<br />
Expected publication June <strong>2012</strong>.
GROUP 5, SESSION B: FOOD PRODUCTS 8 th Int. Conference on <strong>LCA</strong> <strong>in</strong> the<br />
Agri-<strong>Food</strong> Sector, 1-4 Oct <strong>2012</strong><br />
135. Spatial food-pr<strong>in</strong>t to supply livestock products to Paris, 19 th -21 st<br />
centuries<br />
P<strong>et</strong>ros Chatzimpiros<br />
Paris Interdiscipl<strong>in</strong>ary Energy Research Institute (PIERI), Université Paris Diderot, <strong>France</strong>, E-mail: p<strong>et</strong>ros.chatzimpiros@univ-paris-diderot.fr<br />
When cities import food to susta<strong>in</strong> their m<strong>et</strong>abolism, they virtually import land resources from the surround<strong>in</strong>g<br />
local and distant rural territories that generate the food. We refer to this vital physical substrate of urban<br />
m<strong>et</strong>abolism as the spatial urban food-pr<strong>in</strong>t (or food-pr<strong>in</strong>t). The food-pr<strong>in</strong>t locates where the food and animal<br />
feed crops are grown and its size depends on various param<strong>et</strong>ers that can be divided <strong>in</strong>to three categories:<br />
urban di<strong>et</strong>s, crop yields and “feed to food” conversion ratios (Chatzimpiros and Barles, 2010).<br />
In this proposal we d<strong>et</strong>erm<strong>in</strong>e the food-pr<strong>in</strong>t to supply cereals and livestock products (beef, pork, chicken,<br />
dairy products and eggs) to the Paris m<strong>et</strong>ropolitan area s<strong>in</strong>ce the early 19 th century. Over this period, the<br />
food-pr<strong>in</strong>t of fast grow<strong>in</strong>g occidental cities like Paris was the substrate of fundamental changes <strong>in</strong> the structure<br />
of agro-ecosystems and the common ground for transformations <strong>in</strong> both agricultural productivity and<br />
urban di<strong>et</strong>s. Until the early 20 th century, food supply to Paris is calculated from data records of the city’s<br />
food mark<strong>et</strong>s. After that date, data become scarce due to progressive <strong>in</strong>creases <strong>in</strong> the number of food supply<br />
cha<strong>in</strong>s and r<strong>et</strong>ail mark<strong>et</strong>s and, as for today, urban food consumption is not specifically known for any French<br />
city. S<strong>in</strong>ce the 1960s though, di<strong>et</strong>ary discrepancies across <strong>France</strong> are low enough to allow deriv<strong>in</strong>g urban<br />
food supply from data on national food availability (production, plus imports, m<strong>in</strong>us exports). We thus derived<br />
a time series of food supply to Paris s<strong>in</strong>ce the early 19 th century which we express as nitrogen (e.g.<br />
prote<strong>in</strong>) and convert <strong>in</strong>to land requirements for food production – the food-pr<strong>in</strong>t of Paris – us<strong>in</strong>g data on food<br />
and feed crop yields (Statistique agricole annuelle) and nitrogen conversion efficiencies (NCE) <strong>in</strong> livestock<br />
production. For pork, beef and dairy production we used model-derived data of NCE for the early 19 th , 20 th<br />
and 21 st centuries (Chatzimpiros, 2011). For chicken and egg production, we used data cover<strong>in</strong>g the second<br />
half of the 20 th century (Lambier and Leclercq, 1992, Smith, 1997, Smil, 2002). We <strong>in</strong>terpolated/extrapolated<br />
data on NCE over time proportionally to key variables such as biomass production rates.<br />
Fig. 1 shows Paris population and its food-pr<strong>in</strong>t s<strong>in</strong>ce the early 19 th century. B<strong>et</strong>ween 1850 and 2008, population<br />
grew 7-fold, food supply 8.5-fold and the food-pr<strong>in</strong>t 2-fold. In Fig. 2, per capita supply (kg N/cap) is<br />
plotted with land requirements for production (ha/kg N) (land requirements decrease with time). The result<strong>in</strong>g<br />
curves show <strong>in</strong>creases <strong>in</strong> the consumption of livestock products with low land requirements. As long as<br />
beef was the cornerstone of agrarian systems (
GROUP 5, SESSION B: FOOD PRODUCTS 8 th Int. Conference on <strong>LCA</strong> <strong>in</strong> the<br />
Agri-<strong>Food</strong> Sector, 1-4 Oct <strong>2012</strong><br />
1000 ha<br />
Fig 1: <strong>Food</strong>-pr<strong>in</strong>t of Paris for cereals and livestock<br />
Figure 2. Land requirements and per capita consumption<br />
860<br />
0,40<br />
4000<br />
3500<br />
3000<br />
2500<br />
2000<br />
1500<br />
1000<br />
500<br />
0<br />
1810 1850 1890 1930 1970 2010<br />
0,35<br />
Beef<br />
Pig<br />
Chicken<br />
Beef<br />
Pig<br />
Chicken<br />
Dairy and eggs<br />
Cereals<br />
Sum<br />
Paris population<br />
Dairy and eggs<br />
Cereals<br />
0,30<br />
0,25<br />
0,20<br />
ha/kg N<br />
0,15<br />
0,10<br />
0,05<br />
0,00<br />
11<br />
10<br />
9<br />
8<br />
7<br />
6<br />
5<br />
4<br />
3<br />
2<br />
1<br />
0<br />
3,5<br />
3,0<br />
2,5<br />
2,0<br />
1,5<br />
1,0<br />
0,5<br />
0,0<br />
kg N/hab<br />
million people
GROUP 5, SESSION B: FOOD PRODUCTS 8 th Int. Conference on <strong>LCA</strong> <strong>in</strong> the<br />
Agri-<strong>Food</strong> Sector, 1-4 Oct <strong>2012</strong><br />
136. Analysis of material and energy flow associated with food<br />
production and consumption <strong>in</strong> Japan<br />
Naoki Yoshikawa 1,* , Koji Amano 1 , Koji Shimada 2<br />
1 Ritsumeikan University, College of Science and Eng<strong>in</strong>eer<strong>in</strong>g, Kusatsu, Japan, 2 Ritsumeikan University,<br />
College of Economics, Kusatsu, Japan, Correspond<strong>in</strong>g author. E-mail: n-yoshik@fc.ritsumei.ac.jp<br />
The potential load on the environment due to food systems has been discussed for years. In the exist<strong>in</strong>g research<br />
(Sh<strong>in</strong>do <strong>et</strong> al., 2010; Oda, 2006) on food systems, nitrogen accumulation <strong>in</strong> Japan is attributed to <strong>in</strong>crease<br />
<strong>in</strong> food import, <strong>in</strong>crease <strong>in</strong> chemical fertiliser <strong>in</strong>put, and changes <strong>in</strong> food consumption patterns. Life<br />
cycle th<strong>in</strong>k<strong>in</strong>g plays an important role <strong>in</strong> understand<strong>in</strong>g the comprehensive flow of energy, carbon, water,<br />
and other important materials associated with the systems for food production/consumption and biomass<br />
(food waste) utilisation. Such evaluation is required for estimat<strong>in</strong>g the comprehensive effect of future<br />
changes <strong>in</strong> consumption patterns, biomass policy, and agricultural technologies.<br />
In this study, the material flow associated with food systems, <strong>in</strong>clud<strong>in</strong>g waste treatment and recycl<strong>in</strong>g, is<br />
evaluated. In particular, we focus on the energy flow, <strong>in</strong>clud<strong>in</strong>g some <strong>in</strong>dicators that reflect the energy effectiveness<br />
of food systems and the utilisation level of biomass and food waste.<br />
The energy flows <strong>in</strong>vestigated <strong>in</strong> this study are related to the follow<strong>in</strong>g types of energy:<br />
1. Cumulative non-renewable energy<br />
2. Feedstock energy related to food and biomass<br />
3. Nutritionist's calories of food<br />
In this study, we evaluated 47 commodities of food. They were evaluated on the basis of the follow<strong>in</strong>g <strong>in</strong>dicators:<br />
a. Effectiveness of utilisation of food waste and co-products (EF-w)<br />
EP AE EC FSE2<br />
( EF w)<br />
<br />
FSE1<br />
Here, FSE1: Feedstock energy before treatment/utilisation of food waste and co-products; EP: Energy production<br />
via utilisation of food waste/co-products; AE: Alternative effect of material recycl<strong>in</strong>g; EC: Energy<br />
consumption dur<strong>in</strong>g treatment/utilisation of food waste and co-products; FSE2: Feedstock energy after treatment/utilisation<br />
of food waste and co-products.<br />
b. Energy effectiveness of food supply/consumption (EF-f)<br />
FE<br />
( EF f ) <br />
TI EP AE<br />
Here, TI: Cumulative non-renewable energy used; FE: Total energy <strong>in</strong>take for a food system<br />
The data perta<strong>in</strong><strong>in</strong>g to material flow and food transportation are collected from statistics, reports, and experts.<br />
The data perta<strong>in</strong><strong>in</strong>g to energy consumption dur<strong>in</strong>g food production are collected from papers or calculated<br />
from production-cost data.<br />
Fig. 1 shows the material flow of food products <strong>in</strong> Japan <strong>in</strong> 2005. The amount of <strong>in</strong>put from crop farm<strong>in</strong>g to<br />
animal farm<strong>in</strong>g is roughly the same as that to that from food manufactur<strong>in</strong>g. The flow from food manufactur<strong>in</strong>g<br />
to animal farm<strong>in</strong>g denotes the flow of rice and wheat bran. The <strong>in</strong>ternal flow related to crop farm<strong>in</strong>g consists<br />
of the <strong>in</strong>corporation of residues. The comprehensive approach employed <strong>in</strong> this study can be used to<br />
evaluate the effect of active utilisation (for example, bio<strong>et</strong>hanol production or compost<strong>in</strong>g of straw) by consider<strong>in</strong>g<br />
alternatives for organic materials used <strong>in</strong> farmlands and future change <strong>in</strong> gra<strong>in</strong> consumption, which<br />
are necessary for decid<strong>in</strong>g long-term policies.<br />
References<br />
Sh<strong>in</strong>do J., Okamoto K., Kawashima H., Konohira E, 2010. Nitrogen flow associated with food production<br />
and consumption and its effect on water quality <strong>in</strong> Japan from 1961 to 2005. Soil Sci. Plant Nutr., 55(4),<br />
pp. 532-545<br />
Oda K., 2006. Trends <strong>in</strong> nitrogen flow s<strong>in</strong>ce the 1980s <strong>in</strong> the food and feed system <strong>in</strong> Japan. Jpn. J. Soil Sci.<br />
Plant Nutr., 77, pp. 517-524 (<strong>in</strong> Japanese with an English abstract)<br />
861
GROUP 5, SESSION B: FOOD PRODUCTS 8 th Int. Conference on <strong>LCA</strong> <strong>in</strong> the<br />
Agri-<strong>Food</strong> Sector, 1-4 Oct <strong>2012</strong><br />
5,040<br />
Figure 1. Material flow associated with food production and consumption <strong>in</strong> Japan <strong>in</strong> 2005 (Unit: thousand<br />
tonnes, w<strong>et</strong>).<br />
862<br />
Crop<br />
farm<strong>in</strong>g<br />
11,477<br />
31,211<br />
15<br />
41,684<br />
185<br />
Animal<br />
farm<strong>in</strong>g<br />
Fisheries<br />
3,698<br />
1,106<br />
4,046 30,624<br />
23<br />
<strong>Food</strong> mfg<br />
and<br />
distribution<br />
5,300<br />
2,807<br />
<strong>Food</strong><br />
consumption<br />
262<br />
2,608<br />
Recycl<strong>in</strong>g<br />
Waste<br />
treatment<br />
1,899<br />
31,529<br />
19,887
GROUP 5, SESSION B: FOOD PRODUCTS 8 th Int. Conference on <strong>LCA</strong> <strong>in</strong> the<br />
Agri-<strong>Food</strong> Sector, 1-4 Oct <strong>2012</strong><br />
137. Environmental impacts of pasta cook<strong>in</strong>g<br />
Luca Ru<strong>in</strong>i 1 , Roberto Bassi 1 , Massimo Mar<strong>in</strong>o 2 , Sonia Pignatelli 2,*<br />
1 Barilla G. R. Fratelli S.p.A, Italy, 2 Life Cycle Eng<strong>in</strong>eer<strong>in</strong>g, Correspond<strong>in</strong>g author. E-mail: pig-<br />
natelli@studiolce.it<br />
Susta<strong>in</strong>ability has now entered <strong>in</strong> the agendas of companies, policy makers and a fraction of “green consumers”.<br />
Companies work to achieve environmental impact reduction, while policy-makers work to def<strong>in</strong>e<br />
strategies aimed at improv<strong>in</strong>g the susta<strong>in</strong>ability of production and consumption cha<strong>in</strong>s. Consumers are asked<br />
to prefer products that demonstrate compliance with these requirements.<br />
Though the production phase always seems to be the most important <strong>in</strong> terms of environmental impacts, <strong>in</strong><br />
some cases the consumer use bears even more impact than production itself: pasta falls <strong>in</strong>to this case and,<br />
therefore, this paper presents elaborations aimed to the calculation of the environmental impacts of the cook<strong>in</strong>g<br />
phase.<br />
The start<strong>in</strong>g po<strong>in</strong>t is constituted by a full life cycle assessment of Barilla’s pasta production that was published<br />
<strong>in</strong> a verified Environmental Product Declaration <strong>in</strong> which the carbon, ecological and water footpr<strong>in</strong>t<br />
were illustrated <strong>in</strong> utmost clarity.<br />
Aside from this, a d<strong>et</strong>ailed study on the cook<strong>in</strong>g impacts was made, and the carbon footpr<strong>in</strong>t of different<br />
cases evaluated. Normally pasta makers recommend us<strong>in</strong>g 10 times the water <strong>in</strong> comparison to the amount of<br />
product be<strong>in</strong>g cooked: 500 g should therefore use 5 litres of water. It is <strong>in</strong>terest<strong>in</strong>g to consider how the use of<br />
different amounts of water can affect energy consumption and the relative impacts <strong>in</strong> terms of CO2 equivalents.<br />
At this po<strong>in</strong>t, it is <strong>in</strong>terest<strong>in</strong>g to exam<strong>in</strong>e how the various environmental impacts vary <strong>in</strong> relation to the<br />
amount of water used for cook<strong>in</strong>g. The diagram below represents the impacts for both a smaller and a larger<br />
amount of water used for cook<strong>in</strong>g 500 grams of pasta; some considerations were made chang<strong>in</strong>g the quantity<br />
of water used to cook pasta, mov<strong>in</strong>g from 4 to 6 litres This abstract also accounts for the Italian energy-mix<br />
for electricity production. Data about energy production and use come from eco<strong>in</strong>vent database.<br />
It is <strong>in</strong>terest<strong>in</strong>g to assess how a variation of the quantity of water used yields significant differentiations of<br />
impact: -20% water corresponds to -7% GHG emissions for gas cook<strong>in</strong>g procedures (Fig. 2).<br />
The carbon footpr<strong>in</strong>t of the pasta cook<strong>in</strong>g phase is similar to that of production. That is why correct consumer<br />
behaviour is as important as corporate efforts aimed at reduc<strong>in</strong>g impacts. In particular, it is quite important<br />
to use the right amount of water, cover the pot while wait<strong>in</strong>g for the water to boil, and add salt only<br />
when the water is boil<strong>in</strong>g. This aspect of the cook<strong>in</strong>g phase is directly l<strong>in</strong>ked to the consumer’s behaviour.<br />
That is the reason why proper consumer <strong>in</strong>formation is crucial for achiev<strong>in</strong>g susta<strong>in</strong>ability, learn<strong>in</strong>g how to<br />
avoid useless waste and be more environmentally friendly.<br />
References<br />
Baldo, GL, M. Mar<strong>in</strong>o, S. Rossi, 2008. Analisi del Ciclo di Vita <strong>LCA</strong>, nuova edizione aggiornata, Edizioni<br />
Ambiente.<br />
Barilla, 2011. Environmental Product Declaration of durum wheat semol<strong>in</strong>a dried Pasta <strong>in</strong> paperboard box<br />
(brand Barilla), Published on the International EPD system register. www.environdec.com (Rev. 2.1; approved<br />
the 10/03/2011, Reg. S-P-217).<br />
Barilla Center for <strong>Food</strong> and Nutrition (BCFN), 2011. 2011 Double Pyramid: Healthy <strong>Food</strong> for People, Susta<strong>in</strong>able<br />
for the plan<strong>et</strong>, Support<strong>in</strong>g technical paper Version 2 of 14 July 2011.<br />
Eco<strong>in</strong>vent Swiss database, v.2.0, www.eco<strong>in</strong>vent.ch<br />
Foster C., Green K., Blea m., Dewick P., Evans B., Flynn A., Mylan J., 2006. Environmental impacts of<br />
<strong>Food</strong> Production and Consumption – a Report to the Department of the Environment, <strong>Food</strong> and Rural Affairs<br />
(DEFRA), Manchester Bus<strong>in</strong>ess School, London.<br />
Nilma, Italian manufacturer data she<strong>et</strong>s, www.nilma.it<br />
863
GROUP 5, SESSION B: FOOD PRODUCTS 8 th Int. Conference on <strong>LCA</strong> <strong>in</strong> the<br />
Agri-<strong>Food</strong> Sector, 1-4 Oct <strong>2012</strong><br />
Figure 1. Footpr<strong>in</strong>t of pasta production (Barilla, 2011)<br />
Figure 2. Carbon footpr<strong>in</strong>t for cook<strong>in</strong>g 500 grams of pasta assum<strong>in</strong>g a variable pasta/water ratio of ± 20%<br />
and a cook<strong>in</strong>g time of 10 m<strong>in</strong>utes. A total of 5 litres of water were used as recommended by the producer<br />
(BCFN, 2011).<br />
864
GROUP 5, SESSION B: FOOD PRODUCTS 8 th Int. Conference on <strong>LCA</strong> <strong>in</strong> the<br />
Agri-<strong>Food</strong> Sector, 1-4 Oct <strong>2012</strong><br />
138. The development of robust Life Cycle Analysis for mycoprote<strong>in</strong><br />
and the meat free brand Quorn TM<br />
Wayne Mart<strong>in</strong>dale 1,* , Louise Neville 2 , Muyiwa Ak<strong>in</strong>toye 2 , Tim F<strong>in</strong>nigan 2<br />
1 Centre for <strong>Food</strong> Innovation, Sheffield Hallam University, Sheffield, S1 1WB UK, 2 Quorn <strong>Food</strong>s Ltd,<br />
Stokesley, UK, Correspond<strong>in</strong>g author. E-mail: w.mart<strong>in</strong>dale@shu.ac.uk<br />
The global food supply system is experienc<strong>in</strong>g <strong>in</strong>creased prote<strong>in</strong> demand pressures that are dependent on<br />
feed and livestock production systems that have received much attention <strong>in</strong> <strong>LCA</strong> research (FAO, 2006).<br />
Several <strong>in</strong>ternationally led assessments of wider impacts of livestock production raise the importance of Indirect<br />
Land Use Change (ILUC) associated with production and trade <strong>in</strong> livestock products. An area that has<br />
received less attention and one where we believe we are ready to report robust <strong>LCA</strong> data is that of <strong>in</strong>dustrially<br />
produced prote<strong>in</strong>s (F<strong>in</strong>nigan <strong>et</strong> al., 2010 and Toumisto 2010). We believe that <strong>in</strong>dustrially produced<br />
prote<strong>in</strong>s offer significant benefits to the current world prote<strong>in</strong> supply system that are currently unrealised by<br />
meat producers, food manufacturers and policy makers.<br />
To def<strong>in</strong>e the potential of meat free <strong>in</strong>gredients we have developed a <strong>LCA</strong> based approach to def<strong>in</strong><strong>in</strong>g the<br />
production impact of the mycoprote<strong>in</strong> <strong>in</strong>gredient for the Quorn TM brand of food products that is r<strong>et</strong>ailed <strong>in</strong> 22<br />
countries. Mycoprote<strong>in</strong> is produced <strong>in</strong>dustrially from the fungal fermentation of wheat derived glucose <strong>in</strong><br />
the United K<strong>in</strong>gdom. An <strong>LCA</strong> programme with<strong>in</strong> the mycoprote<strong>in</strong> and Quorn TM manufactur<strong>in</strong>g facilities<br />
provided GWP measurements of 3.1 for mycoprote<strong>in</strong> and typically 4.2 for Quorn TM products (see Table 1).<br />
This <strong>in</strong>itial <strong>LCA</strong> provided important targ<strong>et</strong>s for future <strong>in</strong>vestigation with<strong>in</strong> the Quorn TM supply cha<strong>in</strong>. These<br />
were (1) energy balance and the use of co-product steam <strong>in</strong> Quorn TM manufacture from nearby ammonia<br />
fixation plant, and, (2) the use of Egg White Prote<strong>in</strong> (EWP) <strong>in</strong> the manufacture of Quorn TM from mycoprote<strong>in</strong>.<br />
A further outcome, was a more d<strong>et</strong>ailed <strong>in</strong>vestigation of the Quorn TM <strong>in</strong>gredient supply cha<strong>in</strong> <strong>in</strong> the<br />
terms of embodied GHG’s and energy.<br />
Development and improvement of the exist<strong>in</strong>g <strong>LCA</strong> has identified GWP reductions of at least 30% over a<br />
three year period committ<strong>in</strong>g to the company to significant <strong>in</strong>vestment <strong>in</strong> <strong>LCA</strong> based on the very clear bus<strong>in</strong>ess<br />
case that implement<strong>in</strong>g <strong>LCA</strong> procedures improves production efficiencies and identifies cost reduction.<br />
Furthermore, Quorn <strong>Food</strong>s Ltd has aligned current m<strong>et</strong>hodologies with the Carbon Trust Footpr<strong>in</strong>t Expert<br />
<strong>LCA</strong> Model. This approach has further d<strong>et</strong>ailed knowledge of the mycoprote<strong>in</strong> and Quorn TM supply cha<strong>in</strong> <strong>in</strong><br />
terms of embodied resources and environmental impact associated with the product. It has further identified<br />
the reality of fix<strong>in</strong>g <strong>LCA</strong> boundaries around a brand that has over 90 discr<strong>et</strong>e Stock Keep<strong>in</strong>g Units (SKU’s).<br />
We show that align<strong>in</strong>g commercial and mark<strong>et</strong><strong>in</strong>g <strong>in</strong>formation with a <strong>in</strong>ternational standard such as<br />
PAS2050 is still <strong>in</strong> a developmental stage. There is a requirement to develop applied statistical m<strong>et</strong>hods so<br />
that companies can obta<strong>in</strong> typical data for supply cha<strong>in</strong>s that are not just ‘snapshots’ but represent <strong>in</strong>tegrative<br />
data of supply cha<strong>in</strong>s over realistic commercial time periods account<strong>in</strong>g for production, waste and proportion<br />
of product consumed by consumers. This is critical to food supply cha<strong>in</strong>s and others where there are seasonal<br />
changes <strong>in</strong> the <strong>LCA</strong> of <strong>in</strong>gredients and selective consumption of specific parts of products. We present<br />
research that def<strong>in</strong>es our approach <strong>in</strong> develop<strong>in</strong>g the functional unit of <strong>in</strong>itial <strong>LCA</strong> of 1 tonne of mycoprote<strong>in</strong><br />
to a 300g of r<strong>et</strong>ail product purchased. In achiev<strong>in</strong>g this we have identified important considerations for the<br />
global prote<strong>in</strong> production system where <strong>in</strong>dustrially produced prote<strong>in</strong>s have a critical role to play <strong>in</strong> optimis<strong>in</strong>g<br />
land use.<br />
References<br />
FAO, 2006. Livestock’s Long Shadow. ISBN 9789251055717<br />
F<strong>in</strong>nigan T., Lemon T., Allan B., and Paton I., 2010. Mycoprote<strong>in</strong>, Life Cycle Analysis and the <strong>Food</strong> 2030<br />
challenge. Aspects of Applied Biology 102, 81-90.<br />
Tuomisto H., (2010). <strong>Food</strong> security and prote<strong>in</strong> supply- cultured meat a solution? Aspects of Applied Biology<br />
102, 99-104.<br />
Table 1. The prote<strong>in</strong> and eco-system service attributes of mycoprote<strong>in</strong> compared to wheat and beef<br />
Prote<strong>in</strong> Prote<strong>in</strong> GWP Land<br />
source g/100g<br />
use<br />
Wheat 12.7 0.80 0.53<br />
Beef 22.5 15.80 3.44<br />
Mycoprote<strong>in</strong> 11.0 3.11 0.53<br />
865
GROUP 5, SESSION B: FOOD PRODUCTS 8 th Int. Conference on <strong>LCA</strong> <strong>in</strong> the<br />
Agri-<strong>Food</strong> Sector, 1-4 Oct <strong>2012</strong><br />
866<br />
139. Environmental evaluation of French olive oil production<br />
G. Buss<strong>et</strong> 1,2,3,4,* , JP Belaud 3,4 , F. Clarens 5 , J. Espi 5 , M. Montréjaud-Vignoles 1,2 , C. Sablayrolles 1,2<br />
1 Université de Toulouse, INP-ENSIACET, <strong>LCA</strong> (Laboratoire de Chimie Agro <strong>in</strong>dustrielle), Toulouse,<br />
<strong>France</strong>, 2 INRA, UMR 1010 CAI, Toulouse, <strong>France</strong>, 3 Université de Toulouse, INP-ENSIACET, LGC (Laboratoire<br />
de Génie Chimique), 4 CNRS UMR 5503, Toulouse, <strong>France</strong>, 5 CTM Centre Tecnològic, Manresa,<br />
Spa<strong>in</strong>, * Correspond<strong>in</strong>g author. E-mail: guillaume.buss<strong>et</strong>@ensiac<strong>et</strong>.fr<br />
Olive oil production is an important agro-<strong>in</strong>dustrial sector <strong>in</strong> the Mediterranean region of Europe, which has<br />
to face environmental issues. The Oi<strong>LCA</strong> (2011) research program has been elaborated partly <strong>in</strong> order to<br />
reduce the carbon footpr<strong>in</strong>t and to optimise waste management of the olive oil sector <strong>in</strong> SUDOE area (Spa<strong>in</strong>,<br />
Portugal and <strong>France</strong>). However, French production is different when compared to Spanish or Portuguese<br />
because it is more traditional. The present work proposes a life cycle assessment of the French olive oil production<br />
sector.<br />
The study is led <strong>in</strong> accordance to the ISO 14040 (2006) and ISO 14044 (2006) standards. Functional unit is<br />
the production of one litre of olive oil. Transport of workers, olive tree culture, harvest, cold extraction, solid<br />
residues (leaves, branches and grounds) management, wastewater management, storage and bottl<strong>in</strong>g are the<br />
ma<strong>in</strong> identified steps of the system. Valorisation of waste is accounted like avoided impacts of a product<br />
with the same function. Matter and flow data come from 21 French enterprises contacted for the Oi<strong>LCA</strong><br />
project. All <strong>in</strong>direct extraction and emissions is calculated with the eco<strong>in</strong>vent database. Then, impact assessment<br />
is realised with the impact m<strong>et</strong>hods Impact 2002+ and ReciPe 2008. The SimaPro® software is used<br />
for the impact calculation.<br />
First results have permitted to def<strong>in</strong>e all the scenarios for olive oil production <strong>in</strong> <strong>France</strong> based on the different<br />
olive production techniques (with or without irrigation, mechanical or not, organic or not), the different<br />
extraction processes (press<strong>in</strong>g, centrifugation two phases or centrifugation three phases) and the different<br />
waste management (<strong>in</strong>c<strong>in</strong>eration or spread<strong>in</strong>g). Raw data from enterprises have been collected. Expected<br />
results are the comparison of all the scenarios <strong>in</strong> order to identify param<strong>et</strong>ers that <strong>in</strong>fluence environmental<br />
consequences of olive oil production.<br />
References<br />
Oi<strong>LCA</strong>, 2011. Enhanc<strong>in</strong>g the comp<strong>et</strong>itiveness and reduc<strong>in</strong>g the carbon footpr<strong>in</strong>t of the olive oil sector<br />
through waste management optimization and the establishment of an ecological label,<br />
http://www.oilca.eu/<strong>in</strong>dex.htm
GROUP 5, SESSION B: FOOD PRODUCTS 8 th Int. Conference on <strong>LCA</strong> <strong>in</strong> the<br />
Agri-<strong>Food</strong> Sector, 1-4 Oct <strong>2012</strong><br />
140. <strong>LCA</strong> of food packag<strong>in</strong>g: soy-prote<strong>in</strong> based films versus PP film<br />
I. Lec<strong>et</strong>a 1 , P. Guerrero 1 , S. Cabezudo 2 , K. de la Caba 1,*<br />
1 University of the Basque Country, UPV/EHU. Chemical and Environmental Eng<strong>in</strong>eer<strong>in</strong>g Department.<br />
Polytechnic School. Donostia-San Sebastián. Spa<strong>in</strong>, 2 University of the Basque Country, UPV/EHU. Bus<strong>in</strong>ess<br />
Organization Department. Polytechnic School. Donostia-San Sebastián. Spa<strong>in</strong>, Correspond<strong>in</strong>g author.<br />
E-mail: koro.delacaba@ehu.es<br />
<strong>Food</strong> packag<strong>in</strong>g protects food aga<strong>in</strong>st external environment to ma<strong>in</strong>ta<strong>in</strong> its quality dur<strong>in</strong>g storage and extend<br />
its shelf life. Conventional packag<strong>in</strong>g plastics impact heavily on the environment because of its end of life<br />
and, furthermore, they are derived from non-renewable sources, so biobased materials could be considered<br />
friendlier for the environment than p<strong>et</strong>roleum-based materials. In this context, soy prote<strong>in</strong>s could be a potential<br />
replacement of conventional polymers because they are abundant, renewable, and biodegradable. Moreover,<br />
soy prote<strong>in</strong>-based films can be processed to exhibit good mechanical and barrier properties for food<br />
packag<strong>in</strong>g (Guerrero <strong>et</strong> al., 2011), us<strong>in</strong>g techniques such as extrusion (Guerrero <strong>et</strong> al., <strong>2012</strong>), which are employed<br />
for <strong>in</strong>dustrial applications.<br />
In this study, a comparative life cycle assessment was carried out b<strong>et</strong>ween two different food packag<strong>in</strong>g systems:<br />
a commercial food packag<strong>in</strong>g film based on polypropylene (PP) and a new biodegradable soy prote<strong>in</strong>based<br />
film manufactured <strong>in</strong> our labs. The functional unit was 1 m 2 of packag<strong>in</strong>g film. Three ma<strong>in</strong> stages were<br />
considered: resource extraction, film manufacture, and waste disposal. The data relat<strong>in</strong>g to PP packag<strong>in</strong>g<br />
films were obta<strong>in</strong>ed from Eco<strong>in</strong>vent v2.0 database. The life cycle <strong>in</strong>ventory for soy prote<strong>in</strong> production was<br />
taken from literature and film manufacture data was measured directly by our research group <strong>in</strong> the lab. The<br />
selected m<strong>et</strong>hod for comparison of the films was EcoIndicator 99. The disposal scenario considered for soy<br />
prote<strong>in</strong>-based biofilm was compost<strong>in</strong>g, due to the fact that the film is based on natural raw materials, while<br />
different waste scenarios were studied for conventional PP film: landfill<strong>in</strong>g, <strong>in</strong>c<strong>in</strong>eration, and recycl<strong>in</strong>g.<br />
As seen <strong>in</strong> Fig. 1, impact categories <strong>in</strong> which the biofilm exhibited a significant environmental charge were<br />
carc<strong>in</strong>ogens, respiratory <strong>in</strong>organics, climate change, land use, and fossil fuels. The responsible for the ma<strong>in</strong><br />
impact <strong>in</strong> carc<strong>in</strong>ogens and the high environmental burden associated to land use category was the cultivation<br />
of soybeans and the use of pesticides, fertilisers, diesel, and mach<strong>in</strong>ery associated to this cultivation. The<br />
environmental load <strong>in</strong> respiratory <strong>in</strong>organics and climate change categories were pr<strong>in</strong>cipally ow<strong>in</strong>g to the<br />
emissions from wood burn<strong>in</strong>g and clear-cutt<strong>in</strong>g for land transformation, and the fuel consumption <strong>in</strong> this<br />
land transformation was the ma<strong>in</strong> cause of the impact <strong>in</strong> fossil fuels. Regard<strong>in</strong>g to PP film, films disposed <strong>in</strong><br />
landfill exhibited higher impact <strong>in</strong> carc<strong>in</strong>ogens. Emissions of carbon dioxide, hydrocarbons, m<strong>et</strong>hane, and<br />
volatile organic compounds (VOCs) generated by waste treatment <strong>in</strong> landfill<strong>in</strong>g were the ma<strong>in</strong> responsible<br />
for this impact (Sundqvist, 1999). In addition, the environmental burden <strong>in</strong> fossil fuels impact category was<br />
also very high for landfill<strong>in</strong>g. On the other hand, when the end of life was <strong>in</strong>c<strong>in</strong>eration, the film showed high<br />
impact <strong>in</strong> climate change and fossil fuels categories, be<strong>in</strong>g raw materials extraction the stage that orig<strong>in</strong>ated<br />
this environmental burden. Recycl<strong>in</strong>g waste scenario showed the lowest impact due to the fact that raw material<br />
was considered as avoided product <strong>in</strong> the recycl<strong>in</strong>g of the film, so that the emission associated to the<br />
extraction of PP was much lower than <strong>in</strong> the emission associated to the other end of life scenarios.<br />
References<br />
Sundqvist, J.O., 1999. Life cycle assessments and solid waste – Guidel<strong>in</strong>es for solid waste treatment and<br />
disposal <strong>in</strong> <strong>LCA</strong>. F<strong>in</strong>al Report. IVL, Swedish Environmental Research Institute.<br />
Guerrero, P., Beatty, E., Kerry, J.P., de la Caba, K., <strong>2012</strong>. Extrusion of soy prote<strong>in</strong> with gelat<strong>in</strong> and sugars at<br />
low moisture content. Journal of <strong>Food</strong> Eng<strong>in</strong>eer<strong>in</strong>g, 110, 53-59.<br />
Guerrero, P., Stefani, P.M., Ruseckaite, R.A., de la Caba, K., 2011. Functional properties of films based on<br />
soy prote<strong>in</strong> isolate and gelat<strong>in</strong> processed by compression mold<strong>in</strong>g. Journal of <strong>Food</strong> Eng<strong>in</strong>eer<strong>in</strong>g, 105, 65-<br />
72.<br />
867
GROUP 5, SESSION B: FOOD PRODUCTS 8 th Int. Conference on <strong>LCA</strong> <strong>in</strong> the<br />
Agri-<strong>Food</strong> Sector, 1-4 Oct <strong>2012</strong><br />
868<br />
7e-5<br />
6,5e-5<br />
6e-5<br />
5,5e-5<br />
5e-5<br />
4,5e-5<br />
4e-5<br />
3,5e-5<br />
3e-5<br />
2,5e-5<br />
2e-5<br />
1,5e-5<br />
1e-5<br />
5e-6<br />
1,19e-20<br />
Carc<strong>in</strong>ogens Resp. organics Resp. <strong>in</strong>organics Climate change Radiation Ozone layer Ecotoxicity Acidification<br />
/ Eutrophication<br />
<strong>LCA</strong> PP film landfill <strong>LCA</strong> PP film recycl<strong>in</strong>g <strong>LCA</strong> PP film <strong>in</strong>c<strong>in</strong>eration <strong>LCA</strong> SPI biofilm<br />
Comparando 1 p (<strong>LCA</strong> PP film landfill), 1 p (<strong>LCA</strong> PP film recycl<strong>in</strong>g), 1 p (<strong>LCA</strong> PP film <strong>in</strong>c<strong>in</strong>eration) y 1 p (<strong>LCA</strong> SPI biofilm); Método: Eco-<strong>in</strong>dicator 99 (H) V2.06 / Europe EI 99 H/H / normalización<br />
Figure 1. Normalised results of the comparative environmental assessment.<br />
Land use M<strong>in</strong>erals Fossil fuels
GROUP 5, SESSION B: FOOD PRODUCTS 8 th Int. Conference on <strong>LCA</strong> <strong>in</strong> the<br />
Agri-<strong>Food</strong> Sector, 1-4 Oct <strong>2012</strong><br />
141. Comparative <strong>LCA</strong> of reconstituted milk and recomb<strong>in</strong>ed milk<br />
process<strong>in</strong>g<br />
Farroudja Younsi 1,* , Krim Louhab 2 , Chawki Belblidia 3<br />
1<br />
Laboratory of ESTs, Development, Physical Chemistry of Materials and Biodiversity, Boumerdes University,<br />
Algeria, 2 <strong>Food</strong> Technology Research Laboratory, Boumerdes University, Algeria, 3 Pasteurized Milk<br />
*<br />
Production Department LFB Boudouaou, Algeria, Correspond<strong>in</strong>g author. E-mail:<br />
younsi_umbb@yahoo.com<br />
The Algerian dairy <strong>in</strong>dustry operates ma<strong>in</strong>ly on the basis of milk powder and anhydrous milk fat (AMF).<br />
Technologically, two transformation processes allow us to obta<strong>in</strong> pasteurised milk: reconstitution and recomb<strong>in</strong>ation.<br />
The first process <strong>in</strong>volves rehydrat<strong>in</strong>g the whole milk powder while <strong>in</strong> the second process, the<br />
f<strong>in</strong>ished product is obta<strong>in</strong>ed from a mixture of reconstituted milk, based on skim milk powder and AMF.<br />
This study, carried out <strong>in</strong> a dairy process<strong>in</strong>g situated <strong>in</strong> Boudouaou (Algiers), aims to provide a comparative<br />
analysis of environmental impacts generated by these two processes. The approach used here is based on the<br />
life cycle assessment (<strong>LCA</strong>). This powerful and recognised m<strong>et</strong>hod, standardised <strong>in</strong> the International Organization<br />
for Standardization (ISO 14040 to 14043) is used <strong>in</strong> practice.<br />
Only the most significant impacts were considered <strong>in</strong> this study: Respiratory <strong>in</strong>organic, terrestrial ecotoxicity,<br />
terrestrial acidification, land occupation, global warm<strong>in</strong>g and non-renewable energy consumption. The<br />
results obta<strong>in</strong>ed demonstrate the advantage of the recomb<strong>in</strong>ation process compared to the reconstitution of<br />
milk. Indeed, the addition of AMF <strong>in</strong> the transformation process has reduced the impact by a factor of 3 to<br />
6%. These results can be expla<strong>in</strong>ed by the substitution <strong>in</strong> the scenario 2 a volume (5 tons) of milk powder by<br />
the AMF and also by its nature. S<strong>in</strong>ce it is a co-product, the impacts attributed to the AMF are negligible<br />
compared to those assigned to the milk powder, which is the ma<strong>in</strong> product. In the light of the obta<strong>in</strong>ed results,<br />
it seems more optimal to favour the recomb<strong>in</strong>ation of milk-based AMF.<br />
References<br />
Cederberg, C., Mattsson, B., 2000. Life cycle assessment of milk production- a comparison of conventional<br />
and organic farm<strong>in</strong>g. Journal of Cleaner Production 8, 49-60.<br />
Feitz, A.J, Lundie, S., Dennien, G., Mora<strong>in</strong>, M., Jones, M., 2007. Generation of an <strong>in</strong>dustry-specific physicochemical<br />
allocation matrix. Application <strong>in</strong> the dairy <strong>in</strong>dustry and implication for systems analysis. International<br />
Journal of <strong>LCA</strong> 12 (2) 109-117.<br />
Høgaas Eide, M., 2002. Life Cycle Assessment (<strong>LCA</strong>) of Industrial Milk Production. International Journal of<br />
<strong>LCA</strong> 7: 115-126.<br />
Hospido, A., Moreira, M.T., Feijoo, G., 2003. Simplified life cycle assessment of galician milk production.<br />
International Dairy Journal 13, 783-796.<br />
Jensen, G.K., Nielsen, P.M. (1982). Milk powder and recomb<strong>in</strong>ation of milk products. Reviews of the progress<br />
of Dairy Science. Journal of Dairy Research 49, 515-544.<br />
Thomassen, M.A., Van Calker, K.J., Smits, M.C.J., Iepema, G.L., De Boer, I.J.M.(2008) Life Cycle Assessment<br />
of conventional and organic milk production <strong>in</strong> The N<strong>et</strong>herlands. Agric Syst 96:95–107.<br />
Table 1. AMF contribution to different impact categories. (for 1 kg of milk)<br />
SceSceDiffer- Impact category Unit nario1nario2ence %<br />
Respiratory <strong>in</strong>or- kg PM2.5 6.93E- 6.67E- 2.64E- 3.8<br />
ganic<br />
eq 04 04 05 2<br />
Terrestrial kg TEG 2.38E+0 2.22E+0 1.59E- 6.6<br />
ecotoxicity soil 0 0 01 7<br />
Terrestrial acidi-<br />
6.39E- 6.13E- 2.58E- 4.0<br />
fication kg SO2 eq<br />
m<br />
02 02 03 4<br />
Land occupation<br />
2 org.ara 4.33E- 4.15E- 1.77E- 4.1<br />
ble 01 01 02 0<br />
5.22E- 4.96E- 2.65E- 5.0<br />
Global warm<strong>in</strong>g kg CO2 eq 01 01 02 7<br />
Non-renewable MJ pri- 3.84E+0 3.62E+0 2.18E- 5.6<br />
energy<br />
mary 0 0 01 7<br />
869
GROUP 5, SESSION B: FOOD PRODUCTS 8 th Int. Conference on <strong>LCA</strong> <strong>in</strong> the<br />
Agri-<strong>Food</strong> Sector, 1-4 Oct <strong>2012</strong><br />
100<br />
80<br />
60<br />
40<br />
20<br />
0<br />
-20<br />
Figure 1. Contribution of the two processes to various impacts<br />
870<br />
89,19<br />
0<br />
76,75<br />
10,7<br />
89,65<br />
0<br />
78,17<br />
9,56<br />
73,5<br />
0<br />
64,5<br />
5,86<br />
88,53<br />
reconstitued recomb<strong>in</strong>ed reconstitued recomb<strong>in</strong>ed reconstitued recomb<strong>in</strong>ed reconstitued recomb<strong>in</strong>ed reconstitued recomb<strong>in</strong>ed reconstitued recomb<strong>in</strong>ed<br />
respiratory <strong>in</strong>organics global warm<strong>in</strong>g non-renewable energy terrestrial ecotoxicity terrestrial acidification land occupation<br />
0<br />
78,52<br />
8,42<br />
93,49<br />
0<br />
80,65<br />
11,37<br />
95,09<br />
0<br />
82,08<br />
11,64<br />
milk powder<br />
raw milk<br />
MGLA<br />
Transport by ship<br />
Truck<strong>in</strong>g<br />
paper packag<strong>in</strong>g<br />
poly<strong>et</strong>hylene<br />
packag<strong>in</strong>g<br />
m<strong>et</strong>al drums<br />
electricity process<br />
natural gas process<br />
waste paper<br />
poly<strong>et</strong>hylene waste<br />
m<strong>et</strong>al waste<br />
DCO
GROUP 5, SESSION B: FOOD PRODUCTS 8 th Int. Conference on <strong>LCA</strong> <strong>in</strong> the<br />
Agri-<strong>Food</strong> Sector, 1-4 Oct <strong>2012</strong><br />
142. Improv<strong>in</strong>g the efficiency of agricultural and food systems by<br />
<strong>in</strong>troduc<strong>in</strong>g biodegradable and compostable products <strong>in</strong> strawberry<br />
supply cha<strong>in</strong>: experience from northern Italy<br />
<strong>France</strong>sco Razza 1,* , <strong>France</strong>sco Degli Innocenti 2 , Cristiana Peano 3 ,V<strong>in</strong>cenzo Girgenti 3 , Michele Bonous 3<br />
1 Novamont, Piazz.le Donegani 4, 05100 Terni – Italy, 2 Novamont, Via G. Fauser 8, 28100 Novara, Italy, 3<br />
Dipartimento di colture arboree Università degli Studi di Tor<strong>in</strong>o, Via Leonardo DaV<strong>in</strong>ci 44, 10095 Grugliasco<br />
(TO), Italy, Correspond<strong>in</strong>g author. E-mail: francesco.razza@novamont.com<br />
Bioplastics can be used to make biodegradable products for agriculture. Biodegradability can contribute to<br />
alleviat<strong>in</strong>g the waste problem of this sector. The FRUITGEST project aimed to <strong>in</strong>crease the efficiency of<br />
strawberry supply cha<strong>in</strong> by <strong>in</strong>troduc<strong>in</strong>g biodegradable products at different levels of the supply cha<strong>in</strong> itself.<br />
The first task <strong>in</strong>terested the strawberry agricultural phase. Here the traditional mulch film made of traditional<br />
plastic (non-biodegradable) is replaced with the biodegradable one. By do<strong>in</strong>g so the waste passes from 260<br />
kg per ha up to zero. The second task was focused on the development of <strong>in</strong>novative strawberry packag<strong>in</strong>g<br />
systems (i.e. flowpack). Aim was to <strong>in</strong>crease the shelf life of the product, thus decreas<strong>in</strong>g food losses, and to<br />
<strong>in</strong>crease the efficiency of waste management at supermark<strong>et</strong> level. As a matter of fact, the packag<strong>in</strong>g and its<br />
content (i.e. expired strawberry) are suitable to be collected along with organic fraction without any operations<br />
s<strong>in</strong>ce the packag<strong>in</strong>g is compostable accord<strong>in</strong>g to EN13432. These changes <strong>in</strong> the strawberry supply<br />
cha<strong>in</strong> were assessed by means of <strong>LCA</strong> us<strong>in</strong>g a consequential approach. Results have shown that the most<br />
important benefits were those related to the <strong>in</strong>crease of shelf life of the product; this avoids wast<strong>in</strong>g food (i.e.<br />
strawberry). Furthermore, also the use of biodegradable mulch film and packag<strong>in</strong>g has positive consequences.<br />
Basically this project has demonstrated that, <strong>in</strong> particular circumstances and applications, the use of<br />
biodegradable bioplastics is beneficial, especially for the effects <strong>in</strong> waste treatment systems.<br />
871
GROUP 5, SESSION B: FOOD PRODUCTS 8 th Int. Conference on <strong>LCA</strong> <strong>in</strong> the<br />
Agri-<strong>Food</strong> Sector, 1-4 Oct <strong>2012</strong><br />
872<br />
143. <strong>LCA</strong> of one cup of espresso coffee: how to collect and validate<br />
<strong>LCA</strong> data along the coffee supply cha<strong>in</strong><br />
Stefania Furfori 1,* , Cristiano Portis 1 , Alberto Cabilli 1 , Alfredo Vanni 1 , Leo Breedveld 2 , Rosal<strong>in</strong>a Barrale 3<br />
1 Lavazza SpA, 2 2B Srl, 3 Goglio Cofibox SpA, Correspond<strong>in</strong>g author. E-mail: s.furfori@lavazza.it<br />
The management of life-cycle <strong>in</strong>ventory data is a complex and time-consum<strong>in</strong>g task <strong>in</strong> <strong>LCA</strong>, especially due<br />
to upstream and downstream processes outside the company’s system boundaries. The data collection is often<br />
hampered by the complexity of these processes, a lack of <strong>in</strong>volvement of supply cha<strong>in</strong> stakeholders and<br />
associated confidentiality issues. Be<strong>in</strong>g a key-player <strong>in</strong> the coffee supply cha<strong>in</strong> Lavazza SpA, <strong>in</strong> collaboration<br />
with one of its suppliers, has attempted to overcome these barriers as illustrated <strong>in</strong> the <strong>LCA</strong> of espresso<br />
coffee.<br />
The <strong>LCA</strong> of espresso coffee has been conducted <strong>in</strong> order to support Lavazza’s ecodesign activities, a ma<strong>in</strong><br />
part of the corporate social responsibility strategy and <strong>in</strong> order to create a truthful and correct environmental<br />
communication. Espresso coffee is a rather elaborated food system with a diversified supply cha<strong>in</strong>, <strong>in</strong>volv<strong>in</strong>g<br />
coffee plantations around the whole world (e.g. Brazil, India, Vi<strong>et</strong>nam, Ethiopia), green coffee suppliers,<br />
packag<strong>in</strong>g suppliers (especially Goglio Cofibox SpA), the coffee manufacturer (Lavazza SpA), the distribution<br />
cha<strong>in</strong>, consumers and f<strong>in</strong>ally waste disposal management.<br />
A crucial moment of the <strong>LCA</strong> execution has been the choice of Lavazza and Goglio Cofibox to work tog<strong>et</strong>her,<br />
which has proved to be a successful partnership. The handl<strong>in</strong>g of the complexity of the multi-layer<br />
packag<strong>in</strong>g is guaranteed by the Goglio Cofibox’s packag<strong>in</strong>g experts, while Lavazza is <strong>in</strong> the position to <strong>in</strong>volve<br />
other actors <strong>in</strong> the supply cha<strong>in</strong>.<br />
The data used <strong>in</strong> the <strong>LCA</strong> comes directly from coffee manufacturers and suppliers. Energy consumption and<br />
greenhouse gases emissions impact categories are screened us<strong>in</strong>g IPCC 2007 and CED assessment m<strong>et</strong>hods,<br />
follow<strong>in</strong>g the <strong>in</strong>ternational standards ISO 14040 (2006) and ISO 14044 (2006). The results, consistent with<br />
other studies published on coffee (Humbert <strong>et</strong> al., 2009), show that about half of the environmental footpr<strong>in</strong>t<br />
occurs at a life cycle stage under the control of the coffee producer or its suppliers (coffee cultivation, treatment,<br />
process<strong>in</strong>g, packag<strong>in</strong>g up to distribution) and the other half at a stage controlled by the user (appliances<br />
manufactur<strong>in</strong>g, use and waste disposal).<br />
The success of this project depends on the company’s ability to able to <strong>in</strong>crease the awareness and commitment<br />
of the key players <strong>in</strong>volved <strong>in</strong> the entire supply cha<strong>in</strong> <strong>in</strong> support<strong>in</strong>g the improvement solutions. The<br />
validation and yearly updat<strong>in</strong>g of LCI data is also made easier <strong>in</strong> this respect, transform<strong>in</strong>g <strong>in</strong>itial barriers<br />
<strong>in</strong>to mutual opportunities to understand the potential ecological footpr<strong>in</strong>t impact of each phase and to enhance<br />
the environmental mark<strong>et</strong> position of all cha<strong>in</strong> stakeholders.<br />
References<br />
Humbert , S., Loer<strong>in</strong>cik, Y., Rossi, V., Margni, M., Jolli<strong>et</strong>, O., 2009. Life cycle assessment of spray dried<br />
soluble coffee and comparison with alternatives (drip filter and capsule espresso). Journal of Cleaner Production<br />
17, 1351-1358.<br />
ISO 14040, 2006. Environmental Management – life Cycle Assessment – Pr<strong>in</strong>ciples and Guidel<strong>in</strong>es. International<br />
Organisation for Standardisation (ISO), Geneva, Switzerland.<br />
ISO 14044, 2006. Environmental Management – life Cycle Assessment – Requirements and Guidel<strong>in</strong>es.<br />
International Organisation for Standardisation (ISO), Geneva, Switzerland.
GROUP 5, SESSION B: FOOD PRODUCTS 8 th Int. Conference on <strong>LCA</strong> <strong>in</strong> the<br />
Agri-<strong>Food</strong> Sector, 1-4 Oct <strong>2012</strong><br />
144. Life cycle assessment of an artisanal Belgian blond beer<br />
Raphaëlle Melon 1,* , Roberto Renzoni 1 , Angélique Léonard 1 , V<strong>in</strong>cianne Wergifosse 2<br />
1 Laboratory of Chemical Eng<strong>in</strong>eer<strong>in</strong>g, University of Liège, 17 allée de la Chimie, 4000 Liège, Belgium, 2<br />
Brasserie des Légendes, 19 rue du Castel, 7801 Irchonwelz, Belgium, * Correspond<strong>in</strong>g author. E-mail:<br />
raphaelle.melon@ulg.ac.be<br />
In the framework of the Wal-Aid project funded by Wallonia aim<strong>in</strong>g namely at develop<strong>in</strong>g valorisation<br />
means for co-products of the agro-food <strong>in</strong>dustry, a life cycle assessment applied to the production of artisanal<br />
Belgian blond beer of ‘ Brasserie des Légendes’ was carried out.<br />
This analysis focuses on the production of a golden triple beer and the packag<strong>in</strong>g step. The functional unit is<br />
the production of 1 litre of beer and the used m<strong>et</strong>hod is ReCiPe endpo<strong>in</strong>t. This production is carried out <strong>in</strong> six<br />
steps: (1) culture of barley, malt<strong>in</strong>g, gr<strong>in</strong>d<strong>in</strong>g and transport of malt flour at the brewery, (2) brew<strong>in</strong>g (heat<strong>in</strong>g<br />
and mix<strong>in</strong>g) of malt flour and water <strong>in</strong> two steps, heat<strong>in</strong>g at 62-63°C dur<strong>in</strong>g 70-90 m<strong>in</strong>utes, then 73°C for<br />
10-15 m<strong>in</strong>. (3) Boil<strong>in</strong>g wort at 105°C dur<strong>in</strong>g 2h30 with steam generator. Hop is added to wort but only<br />
transport of this material is considered. (4) Then beer is kept at 4°C dur<strong>in</strong>g 25 days, (5) packag<strong>in</strong>g <strong>in</strong> brown<br />
glass bottle of 33 cl with a crown cap chrome steel. The mass of steel capsule is estimated at 2 g and 0.3 g of<br />
label’s paper. (6) Wash<strong>in</strong>g of spent gra<strong>in</strong> recovered after brew<strong>in</strong>g with H2SO4.<br />
Most used data <strong>in</strong> this analysis come from the <strong>in</strong>dustrial site except for the production of barley malt and<br />
packag<strong>in</strong>g. Information about these steps are taken from the literature. Generic data come from the eco<strong>in</strong>vent<br />
v2.2 database (www.eco<strong>in</strong>vent.org). Analysis was performed us<strong>in</strong>g SIMAPRO 7.3.2 software from PRé<br />
Consultants.<br />
Electricity consumptions were calculated on the basis of energy balances and Belgian energy mix of 2008<br />
released by the International Energy Agency. This mix shows that Belgian electricity is ma<strong>in</strong>ly produced<br />
from nuclear energy (57%), gas (31%) and coal (9%).<br />
Figure 1 shows the percentage contribution of environmental impact for production’s steps of one litre beer<br />
<strong>in</strong> bottles. The most penalis<strong>in</strong>g step is glass packag<strong>in</strong>g with 74.1%; then we f<strong>in</strong>d the preparation stage of malt<br />
flour with 19.8%. This stage represents culture of barley, malt<strong>in</strong>g, malt gr<strong>in</strong>d<strong>in</strong>g and its transport at the<br />
brewery. Wash<strong>in</strong>g of spent gra<strong>in</strong> step does not appear <strong>in</strong> this table because its impact can be considered as<br />
negligible.<br />
Figure 1 shows the s<strong>in</strong>gle score results of the production of one litre of beer and compares this production<br />
with and without packag<strong>in</strong>g <strong>in</strong> glass bottle. First, we note that the packag<strong>in</strong>g step greatly <strong>in</strong>creases the overall<br />
impact of production process. Secondly, whatever the system boundaries, i.e. with or without packag<strong>in</strong>g, the<br />
most important impacts are fossil depl<strong>et</strong>ion and climate change human health due to the energy demand of<br />
packag<strong>in</strong>g step for the production of glass bottles and energy for grow<strong>in</strong>g, gr<strong>in</strong>d<strong>in</strong>g and transport<strong>in</strong>g malt<br />
flour. Impact of agricultural land occupation rema<strong>in</strong>s the same whatever the system boundaries as the packag<strong>in</strong>g<br />
step is primarily energy consumption and no culture is associated.<br />
For the rest, climate change ecosystems, particulate matter formation and human toxicity are consequences<br />
of use of fossil resource to produce electricity and fuel.<br />
This analysis shows that the most penalis<strong>in</strong>g step <strong>in</strong> the production of this artisanal beer is the packag<strong>in</strong>g.<br />
So, it is on this step we have to work to reduce the environmental impact of this beer. In this study, we consider<br />
a packag<strong>in</strong>g <strong>in</strong> brown glass bottles and it seems <strong>in</strong>terest<strong>in</strong>g to analyse a packag<strong>in</strong>g of 20 litres <strong>in</strong> a keg<br />
and compare the results.<br />
Acknowledgments: The authors gratefully acknowledge the Walloon Region of Belgium for the f<strong>in</strong>ancial<br />
support of Wal-Aid Wagralim project.<br />
References<br />
Kloverpris, J. H., N. Elvig, <strong>et</strong> al. (2009). Comparative life cycle assessment of malt-based beer and 100%<br />
barley beer, Novozymes A/S, Harboes Bryggeri.<br />
873
GROUP 5, SESSION B: FOOD PRODUCTS 8 th Table 1. Environmental contribution of production stages.<br />
Int. Conference on <strong>LCA</strong> <strong>in</strong> the<br />
Agri-<strong>Food</strong> Sector, 1-4 Oct <strong>2012</strong><br />
Step Contribution<br />
(%)<br />
Production of 19.8<br />
874<br />
malt flour<br />
Brew<strong>in</strong>g 0.1<br />
Boil<strong>in</strong>g wort 3.9<br />
Keep at 4°C 2.1<br />
Glass packag<strong>in</strong>g 74.1<br />
Figure 1. S<strong>in</strong>gle score results of 1 litre of beer production.
GROUP 5, SESSION B: FOOD PRODUCTS 8 th Int. Conference on <strong>LCA</strong> <strong>in</strong> the<br />
Agri-<strong>Food</strong> Sector, 1-4 Oct <strong>2012</strong><br />
145. Track<strong>in</strong>g environmental impact of food production cha<strong>in</strong>: a case<br />
study on fresh carrot cha<strong>in</strong> <strong>in</strong> Italy<br />
Simona Bosco 1,* , Giorgio Ragagl<strong>in</strong>i 1 , Giuseppe Garcea 2 , Roberta De Natale 3 , Enrico Bonari 1<br />
1 Institute of Life Sciences, Scuola Superiore Sant’Anna, Pisa, Italy, 2 CCPB Srl, Bologna, Italy, 3 Auchan<br />
SpA, Rozzano Milanofiori, Italy, Correspond<strong>in</strong>g author. E-mail: s.bosco@sssup.it<br />
It is recognised that food product supply cha<strong>in</strong>s contribute to the environmental impact of goods production<br />
and consumption. In the last years, an <strong>in</strong>creas<strong>in</strong>g number of food cha<strong>in</strong> partners and public authorities have<br />
promoted many <strong>in</strong>itiatives to provide <strong>in</strong>formation about the environmental performance of food products<br />
(Peacock <strong>et</strong> al., 2011), with an <strong>in</strong>itial <strong>in</strong>terest focused only on the carbon footpr<strong>in</strong>t analysis (Hillier <strong>et</strong> al.,<br />
2009; BSI 2011). Adoption of differences approaches, m<strong>et</strong>hodologies and objectives could confuse consumers<br />
and stakeholders, while scientifically defensible <strong>in</strong>formation concern<strong>in</strong>g food production and food product<br />
and production systems are required by policymaker and producers (Schau and F<strong>et</strong> 2008).<br />
Here we proposed a new m<strong>et</strong>hod specific for food products and production cha<strong>in</strong>s eco-labell<strong>in</strong>g based on<br />
LCI built on modular phases <strong>in</strong>tegrated with<strong>in</strong> questionnaires. The food cha<strong>in</strong> system boundary was def<strong>in</strong>ed<br />
so as to <strong>in</strong>clude four ma<strong>in</strong> phase: agricultural phase, process<strong>in</strong>g and packag<strong>in</strong>g, delivery to platform and to<br />
r<strong>et</strong>ail store. Consumer phase was not <strong>in</strong>cluded, except for waste management. The LCI considered all the<br />
<strong>in</strong>puts, both energy and material, <strong>in</strong>volved <strong>in</strong> the production process, and the outputs for each phase of the<br />
food cha<strong>in</strong>, <strong>in</strong>clud<strong>in</strong>g all transports until the supermark<strong>et</strong>. Special attention was devoted to the agricultural<br />
phase, for all field operations data were tracked <strong>in</strong> a field trial notebook and all the direct field emissions<br />
were <strong>in</strong>cluded. This m<strong>et</strong>hod was applied to a complex food product cha<strong>in</strong> of a large-scale r<strong>et</strong>ail trade company.<br />
The exam<strong>in</strong>ed production was fresh carrot with<strong>in</strong> a real case study <strong>in</strong> Italy, us<strong>in</strong>g an approach similar<br />
to that of food traceability. 1 kg fresh carrot packed <strong>in</strong> a plastic tray was chosen as functional unit (FU), and<br />
the production cha<strong>in</strong> was organised <strong>in</strong> farm production, process<strong>in</strong>g and packag<strong>in</strong>g <strong>in</strong> Abruzzo Region, delivery<br />
to distribution platform <strong>in</strong> Lombardy Region and to one s<strong>in</strong>gle r<strong>et</strong>ail store located <strong>in</strong> the same region<br />
(Fig. 1). The data collection was referred to 2009; primary data were collected by questionnaires, filled out<br />
by farmers or technicians responsible of each phase. Secondary data were from GaBi embedded database and<br />
literature (GaBi, <strong>2012</strong>). CML 2001 m<strong>et</strong>hod was used for impact assessment for seven ma<strong>in</strong> impact categories<br />
(IC): Global Warm<strong>in</strong>g (GWP), Acidification (AP), Eutrophication (EP), Freshwater Aquatic Ecotoxicity<br />
(FAETP), Terrestric Ecotoxicity (TETP), Photochem. Ozone Creation (POCP), Human Toxicity (HTP).<br />
Results presented <strong>in</strong> Fig. 2 show that packag<strong>in</strong>g and stor<strong>in</strong>g phases were responsible of the largest impact<br />
level <strong>in</strong> each considered ICs, ma<strong>in</strong>ly due to the estimated electricity consumption for refrigeration. It is important<br />
to notice that also the distribution at platform, rarely <strong>in</strong>cluded <strong>in</strong> the literature, could significantly<br />
affect the results <strong>in</strong> some IC, 33% <strong>in</strong> FAETP and 27.5% <strong>in</strong> HTP. On the contrary, the cultivation phase<br />
showed low impact levels <strong>in</strong> average, with exception for EP, where it was responsible for the 39% of the<br />
estimated impact. The proposed approach was able to describe and analyse the impact of a real food production<br />
cha<strong>in</strong>. The questionnaires allowed build<strong>in</strong>g a simple and clear m<strong>et</strong>hod for a d<strong>et</strong>ailed data collection. This<br />
approach helped to develop a standardised system boundary for food products and subsequently to carry out<br />
robust and easily comparable <strong>LCA</strong> analyses.<br />
References<br />
BSI, 2011 PAS 2050:2011 - Specification for the assessment of the life cycle greenhouse gas emissions of<br />
goods and services. BSI British Standards, London.<br />
GaBi, <strong>2012</strong>. GaBi software. http://gabi-software.com<br />
Hillier, J., Hawes, C., Squire, G., Hilton, A., Wale, S., Smith, P., 2009. The carbon footpr<strong>in</strong>ts of food crop<br />
production. Int J Agric Susta<strong>in</strong>, 7(2), 107-118.<br />
Peacock, N., Camillis, C., Penn<strong>in</strong>gton, D., Aich<strong>in</strong>ger, H., Parenti, A., Rennaud, J.-P., <strong>et</strong> al., 2011. Towards a<br />
harmonised framework m<strong>et</strong>hodology for the environmental assessment of food and dr<strong>in</strong>k products. Int J<br />
Life Cycle Ass, 16(3), 189-197.<br />
Schau, E. M., F<strong>et</strong>, A. M. 2008. <strong>LCA</strong> Studies of <strong>Food</strong> Products as Background for Environmental Product<br />
Declarations Int J Life Cycle Ass, 13, 255-264.<br />
875
GROUP 5, SESSION B: FOOD PRODUCTS 8 th Int. Conference on <strong>LCA</strong> <strong>in</strong> the<br />
Agri-<strong>Food</strong> Sector, 1-4 Oct <strong>2012</strong><br />
Production<br />
Area 1<br />
Distribution<br />
Platform 1<br />
System boundaries<br />
Production<br />
Area 2<br />
Process<strong>in</strong>g and<br />
packag<strong>in</strong>g centre<br />
Distribution<br />
Platform 2<br />
Production<br />
Area 3<br />
Figure 1. System boundaries of 1 kg fresh carrot plastic tray production cha<strong>in</strong>. The black arrow identifies the<br />
system analysed.<br />
100%<br />
90%<br />
80%<br />
70%<br />
60%<br />
50%<br />
40%<br />
30%<br />
20%<br />
10%<br />
0%<br />
6.9<br />
Figure 2. Impact assessment for 1 kg fresh carrot plastic tray for food cha<strong>in</strong> phase.<br />
876<br />
Agricultural phase<br />
Production<br />
Area 4<br />
Process<strong>in</strong>g and packag<strong>in</strong>g phase<br />
Distribution<br />
Platform 3<br />
Distribution platform phase<br />
Distribution<br />
Platform 4<br />
Supermark<strong>et</strong> phase<br />
Store 1 Store 2 Store 3 Store 4 Store 5 Store ...n<br />
41.5 43.5<br />
8.0<br />
37.4 31.5<br />
20.8<br />
7.0<br />
32.8<br />
33.9<br />
33.0<br />
52.6<br />
14.6<br />
31.0<br />
35.4<br />
14 17<br />
39<br />
32.7<br />
0<br />
24.1<br />
9<br />
25<br />
31.1<br />
1<br />
GWP AP EP FAETP TETP POCP HTP<br />
8.2<br />
40.2<br />
27.5<br />
Waste Management<br />
Supermark<strong>et</strong><br />
Distribution platform<br />
Packag<strong>in</strong>g<br />
Process<strong>in</strong>g<br />
Cultivation
GROUP 5, SESSION B: FOOD PRODUCTS 8 th Int. Conference on <strong>LCA</strong> <strong>in</strong> the<br />
Agri-<strong>Food</strong> Sector, 1-4 Oct <strong>2012</strong><br />
146. Life cycle assessment of an Italian sparkl<strong>in</strong>g w<strong>in</strong>e production<br />
Paola Masotti 1,* , Luigia P<strong>et</strong>ti 2 , Serena Melchiori 3<br />
1 Department of Economics, University of Trento, Via Inama 5, 38122 Trento, Italy, 2 DASTA Department,<br />
“G. d’Annunzio” University, 65127 Pescara, Italy, 3 University of Trento, Via Inama 5, 38122 Trento, Italy ,<br />
Correspond<strong>in</strong>g author. E-mail: paola.masotti@unitn.it<br />
The environmental impacts of food products and m<strong>et</strong>hods to identify and m<strong>in</strong>imise those impacts are draw<strong>in</strong>g<br />
the attention of producers. W<strong>in</strong>e produc<strong>in</strong>g firms are particularly <strong>in</strong>terested <strong>in</strong> these topics <strong>in</strong> order to<br />
demonstrate that along with the quality of the product they are also committed <strong>in</strong> develop<strong>in</strong>g a proper environmental<br />
management of the production cha<strong>in</strong>. To me<strong>et</strong> the requirements of an important Italian w<strong>in</strong>e producer<br />
the environmental performance of a sparkl<strong>in</strong>g w<strong>in</strong>e made by a w<strong>in</strong>ery of a Trent<strong>in</strong>o prov<strong>in</strong>ce, has been<br />
<strong>in</strong>vestigated.<br />
This paper presents the results of the a life cycle assessment (<strong>LCA</strong>) applied to an Italian sparkl<strong>in</strong>g w<strong>in</strong>e from<br />
v<strong>in</strong>eyard operations, w<strong>in</strong>ery activities from grape crush<strong>in</strong>g to bottl<strong>in</strong>g, and to packag<strong>in</strong>g.<br />
The ma<strong>in</strong> objective of the study was to quantify <strong>in</strong>put flows of raw materials and energy <strong>in</strong> order to d<strong>et</strong>ect<br />
the environmental impacts associated with output flows and releases at any stage, from cradle to gate, of<br />
w<strong>in</strong>e to evaluate the environmental performance. Furthermore, quantification of environmental impacts enables<br />
the identification of the hot spots of the activities and stages and the def<strong>in</strong>ition of management practices<br />
to improve environmental performance.<br />
Foreground data were collected from Cant<strong>in</strong>a Rotari (Gruppo Mezzacorona) and refer to production year<br />
2005. Background data were derived from different databases such as EcoInvent and Cor<strong>in</strong>air. The <strong>in</strong>ventory<br />
table was constructed for one bottle of w<strong>in</strong>e (0.75 L) us<strong>in</strong>g the <strong>LCA</strong> software SimaPro and data were<br />
assessed us<strong>in</strong>g the Eco-Indicator 99 m<strong>et</strong>hod.<br />
The characterisation result graph shows that bottle production contributes to all the 11 impact categories<br />
considered with high percentage values for Ecotoxicity (88%) and Acidification (55%). A further step to<br />
b<strong>et</strong>ter understand the magnitude of the category <strong>in</strong>dicator results is normalisation, which shows (Fig. 1) that<br />
fossil-fuel extraction is the prom<strong>in</strong>ent impact category be<strong>in</strong>g bottle production and pesticides the major contributors.<br />
As regards the s<strong>in</strong>gle process contribute to the three damage categories (Human Health, HH; Ecosystem<br />
Quality, EQ; Resources, R) glass production is the first process for both HH and EQ whereas crude oil utilisation<br />
is the first process for R followed by glass production.<br />
F<strong>in</strong>ally, the Eco<strong>in</strong>dicator s<strong>in</strong>gle score assessment (Fig. 2) shows the impact of each process to all the damage<br />
categories be<strong>in</strong>g the glass production and the crude oil utilisation the ones that more contribute to the damage<br />
categories considered.<br />
This <strong>LCA</strong> study po<strong>in</strong>ted out that <strong>in</strong> this specific sparkl<strong>in</strong>g w<strong>in</strong>e production there are two processes that<br />
ma<strong>in</strong>ly affect the overall environmental impact: the bottle production that accounts for 36% of the total impact<br />
and the pesticides production and utilisation that account for 27.3%.<br />
877
GROUP 5, SESSION B: FOOD PRODUCTS 8 th Int. Conference on <strong>LCA</strong> <strong>in</strong> the<br />
Agri-<strong>Food</strong> Sector, 1-4 Oct <strong>2012</strong><br />
Figure 1. Sparkl<strong>in</strong>g w<strong>in</strong>e production – Impact assessment normalisation.<br />
Figure 2. Sparkl<strong>in</strong>g w<strong>in</strong>e production - Process contribution, s<strong>in</strong>gle score.<br />
878
GROUP 5, SESSION B: FOOD PRODUCTS 8 th Int. Conference on <strong>LCA</strong> <strong>in</strong> the<br />
Agri-<strong>Food</strong> Sector, 1-4 Oct <strong>2012</strong><br />
147. Influence of transport on environmental impacts of the<br />
production cha<strong>in</strong> of poultry <strong>in</strong> Brazil<br />
Sebastião Roberto Soares 1,* , Vamilson Prudêncio da Silva Junior 2 , Edivan Cherub<strong>in</strong>i 1 , Marco Antônio<br />
Santos 3<br />
1 Universidade Federal de Santa Catar<strong>in</strong>a, Florianópolis, Brazil, 2 Empresa de Pesquisa Agropecuária e Extensão<br />
Rural de Santa Catar<strong>in</strong>a, 3 Eng. Agrônomo - Especialista em Gestão Ambiental Agro<strong>in</strong>dustrial, Correspond<strong>in</strong>g<br />
author. E-mail: soares@ens.ufsc.br<br />
Brazil is among the five largest exporters of poultry meat (Burnquist <strong>et</strong> al., 2011, USDA, 2011) solidify<strong>in</strong>g<br />
as one of the majors exporter of livestock products, Brazilian’s production is benefited by favourable climatic<br />
conditions and its vast territory, besides the high government <strong>in</strong>vestment <strong>in</strong> the sector. These production<br />
cha<strong>in</strong>s, such as poultry, pigs and cattle, <strong>in</strong> particular, are able to produce all raw materials that it’s used<br />
<strong>in</strong> animal feed. That feature br<strong>in</strong>gs <strong>in</strong>terest<strong>in</strong>g advantages for Brazilian companies when evaluated the environmental<br />
impacts of its products s<strong>in</strong>ce livestock production is responsible for a major impact on the environment<br />
as noted by de Vries and de Boer (2010), so the choice for a more susta<strong>in</strong>able product can mitigate<br />
some of these impacts. Although the cha<strong>in</strong> can be self-sufficient <strong>in</strong> production of gra<strong>in</strong>s, the large distances<br />
of a cont<strong>in</strong>ental country b<strong>et</strong>ween the stages <strong>in</strong> the life cycle added to the lack of k<strong>in</strong>ds of transportations may<br />
eventually supplant that environmental ga<strong>in</strong>. Thus the aim of this paper is to evaluate from the environmental<br />
po<strong>in</strong>t of view, different k<strong>in</strong>ds of transportation and their <strong>in</strong>fluences on the productive cha<strong>in</strong> of frozen chicken<br />
for export. We evaluated two scenarios: (A) Poultry produced and exported <strong>in</strong> South with the gra<strong>in</strong>s com<strong>in</strong>g<br />
from the Central West; and (B) Poultry and gra<strong>in</strong>s produced <strong>in</strong> Central West with the exportation placed <strong>in</strong><br />
South East. The functional unit is a ton of poultry delivered <strong>in</strong> the port for exportation. The m<strong>et</strong>hod used<br />
through the software SimaPro® was the CML 2000 with modifications, from where we choose by the easier<br />
level of communication with the stakeholders, the impact categories of global warm<strong>in</strong>g and total cumulative<br />
energy demand. The results of the <strong>LCA</strong> of the usual scenarios, <strong>in</strong>dicates South Poultry as that with the worse<br />
environmental performance, due the transportation of gra<strong>in</strong>s. For the category of global warm<strong>in</strong>g the difference<br />
b<strong>et</strong>ween the South and the Central West, <strong>in</strong> tons of CO2 equivalent emitted, only from the transportation<br />
of gra<strong>in</strong>s and the f<strong>in</strong>al product are about 49.6%, with the possibility of this difference decrease 19%.<br />
References<br />
Burnquist, H. L., da Costa, C. C., de Souza, M. J. P., Fassarella, L. M., 2011. Composite Index of Mark<strong>et</strong><br />
Access for the Export of Poultry from Brazil. International Centre for Trade and Susta<strong>in</strong>able Development<br />
(ICTSD), Geneva, Switzerland.<br />
United States Department of Agriculture (USDA), 2011. Livestock and Poultry: World Mark<strong>et</strong>s and Trade.<br />
Foreign Agricultural Service.<br />
de Vries, M., de Boer, I.J.M., 2010. Compar<strong>in</strong>g environmental impacts for livestock products: A review of<br />
life cycle assessments. Livestock Science 128, 1-11.<br />
879
GROUP 5, SESSION B: FOOD PRODUCTS 8 th Int. Conference on <strong>LCA</strong> <strong>in</strong> the<br />
Agri-<strong>Food</strong> Sector, 1-4 Oct <strong>2012</strong><br />
880<br />
148. A m<strong>et</strong>hodological comparison of Life Cycle Susta<strong>in</strong>ability<br />
Assessment of fruit and veg<strong>et</strong>able logistics<br />
Pere Fullana i Palmer 1,* , Alba Bala 1 , Tabea Beck 2 , Stefan Albrecht 2<br />
1 UNESCO Chair <strong>in</strong> Life Cycle and Climate Change, Escola Superior de Comerç International (Universitat<br />
Pompeu Fabra); Passeig Pujades 1, 08003 Barcelona, Spa<strong>in</strong>, 2 Department Life Cycle Eng<strong>in</strong>eer<strong>in</strong>g, Chair of<br />
Build<strong>in</strong>g Physics (University of Stuttgart); Hauptstrasse 113, 70771 Echterd<strong>in</strong>gen, Germany, Correspond<strong>in</strong>g<br />
author. E-mail: pere.fullana@esci.upf.edu<br />
For packag<strong>in</strong>g fruit or veg<strong>et</strong>ables, wooden boxes, cardboard boxes and plastic crates are most commonly<br />
used. While the first two are non-r<strong>et</strong>urnable packag<strong>in</strong>g systems and normally disposed of or partly recycled<br />
after one use, plastic crates as a rule are r<strong>et</strong>urnable packag<strong>in</strong>g, washed and reused many times.<br />
The environmental impacts of the European wide fruit and veg<strong>et</strong>able distribution have been analysed by<br />
different <strong>in</strong>stitutions <strong>in</strong> different countries dur<strong>in</strong>g the last decade. Some studies have analysed different<br />
transport packag<strong>in</strong>g systems, but their understand<strong>in</strong>g of the important life-cycle aspects and the sensitivity of<br />
the param<strong>et</strong>ers with<strong>in</strong> the life-cycles of the different packag<strong>in</strong>g solutions is not homogeneous.<br />
In this review, we analyse ma<strong>in</strong>ly the reports of three studies performed by Ecobilan (2000), ITENE (2005)<br />
and University of Stuttgart (2009). It is very <strong>in</strong>terest<strong>in</strong>g to note the differences from the commission<strong>in</strong>g organisation<br />
to how the study has been communicated. In b<strong>et</strong>ween, m<strong>et</strong>hodological differences can be found <strong>in</strong><br />
relation to each m<strong>et</strong>hodological step. Differences can be found <strong>in</strong>: the goal and scope of the study; how susta<strong>in</strong>ability<br />
is addressed; the assumptions to key param<strong>et</strong>ers (such as number of rotations of plastic crates,<br />
from 10 to 100); how complex and close to reality is logistics taken (from s<strong>in</strong>gle trips to <strong>in</strong>ternational n<strong>et</strong>works);<br />
how open-loop recycl<strong>in</strong>g is calculated; which comb<strong>in</strong>ation of data sources is used, the treatment of<br />
biogenic CO2; the extend of the sensitivity analysis or the <strong>in</strong>clusion of different scenarios and, <strong>in</strong> fact, how<br />
the <strong>in</strong>terpr<strong>et</strong>ation phase of <strong>LCA</strong> is addressed; who and how performed a critical review; <strong>et</strong>c.<br />
As per the results and the ones from the Fenix project, it is relevant to see that LCSA does not give a unique<br />
and static answer. While the study <strong>in</strong> 2000 showed that the multiple-use option was environmental preferable<br />
to the cardboard format for most of the environmental impact categories assessed and quite similar to the<br />
wooden study, the study <strong>in</strong> 2005 showed the opposite, i.e. that the environmental impact of s<strong>in</strong>gle use cardboard<br />
boxes is always lower than that of reusable plastic <strong>in</strong> six of the 10 categories analysed. F<strong>in</strong>ally, the<br />
study <strong>in</strong> 2009 shows a very similar result (with not totally equal numbers) than the first one.<br />
Will a new study arise soon to balance the match scores? Is this a game or is it a serious matter with millions<br />
at stage? How should scientists respond to mark<strong>et</strong> pressure? Is <strong>LCA</strong> still be<strong>in</strong>g used as a throw<strong>in</strong>g weapon<br />
nowadays? We are look<strong>in</strong>g forward to a “fruit”-full discussion.<br />
References<br />
Ecobilan, 2000 (<strong>in</strong> French). Life cycle assessment of wood, corrugated board and plastic crates for apples.<br />
ITENE, 2005 (<strong>in</strong> Spanish). A comparative study of the environmental and economic characteristics of corrugated<br />
board boxes and reusable plastic crates <strong>in</strong> the long distance transport of fruit and veg<strong>et</strong>ables, Universitat<br />
Politècnica de València.<br />
University of Stuttgart, 2009 (<strong>in</strong> English). The Susta<strong>in</strong>ability of Packag<strong>in</strong>g Systems for Fruit and Veg<strong>et</strong>able<br />
Transport <strong>in</strong> Europe based on Life-Cycle-Analysis – Update 2009.
GROUP 5, SESSION B: FOOD PRODUCTS 8 th Int. Conference on <strong>LCA</strong> <strong>in</strong> the<br />
Agri-<strong>Food</strong> Sector, 1-4 Oct <strong>2012</strong><br />
149. Comprehensive life cycle assessment for cheese and whey<br />
products <strong>in</strong> the U.S.<br />
Greg Thoma 1,* , Dar<strong>in</strong> Nutter 2 , Rick Ulrich 1 , Dae-Soo Kim 1 , Greg Norris 3 , Franco Milani 4 , Dean Sommer 4<br />
1 Ralph E. Mart<strong>in</strong> Department of Chemical Eng<strong>in</strong>eer<strong>in</strong>g, University of Arkansas, Fay<strong>et</strong>teville, AR, USA, 2<br />
Department of Mechanical Eng<strong>in</strong>eer<strong>in</strong>g, University of Arkansas, Fay<strong>et</strong>teville, AR, USA, 3 Walton College of<br />
Bus<strong>in</strong>ess, University of Arkansas, Fay<strong>et</strong>teville, AR, USA, 4 Department of <strong>Food</strong> Science, University of Wiscons<strong>in</strong><br />
– Madison, Madison, WI, USA, * Correspond<strong>in</strong>g author. E-mail: gthoma@uark.edu<br />
A comprehensive life cycle assessment (<strong>LCA</strong>) has been carried out to d<strong>et</strong>erm<strong>in</strong>e a benchmark for the environmental<br />
impacts associated with cheddar and mozzarella cheese consumption <strong>in</strong> the United States. This<br />
<strong>in</strong>cludes specifically product loss at various stages of the supply cha<strong>in</strong>, as well as consumer transport and<br />
storage of products. The scope of this study was a cradle-to-grave assessment with particular emphasis on the<br />
unit operations of typical cheese process<strong>in</strong>g plants.<br />
A functional unit of 1 m<strong>et</strong>ric ton of cheese consumed (dry solids basis), or 1 m<strong>et</strong>ric ton of whey delivered<br />
(dry basis) was adopted. The eco<strong>in</strong>vent database was used for ‘upstream’ unit processes. Operational data<br />
from 17 cheese manufactur<strong>in</strong>g plants represent<strong>in</strong>g 24% of mozzarella production and 35% of cheddar production<br />
<strong>in</strong> the US. Allocation procedures follow the ISO 14044 hierarchy. System separation was used when<br />
sufficient <strong>in</strong>formation was available, primarily as plant-specific eng<strong>in</strong>eer<strong>in</strong>g estimates. Incom<strong>in</strong>g raw milk,<br />
cream or dry milk solids are allocated us<strong>in</strong>g a milk solids mass balance. Revenue-based allocation was used<br />
for rema<strong>in</strong><strong>in</strong>g <strong>in</strong>-plant processes.<br />
Life cycle impact assessment was conducted us<strong>in</strong>g the ReCiPe and USEtox frameworks. Greenhouse gas<br />
(GHG) emissions are of significant <strong>in</strong>terest, and on a dry milk solids basis, the carbon footpr<strong>in</strong>t of both cheddar<br />
and mozzarella is approximately 13.0 m<strong>et</strong>ric tons CO2e (IPCC 2007 factors) per m<strong>et</strong>ric ton of cheese<br />
consumed (<strong>in</strong>clusive of product loss across the supply cha<strong>in</strong>). The 95% confidence <strong>in</strong>terval ranges from 9 to<br />
18 m<strong>et</strong>ric tons CO2e per m<strong>et</strong>ric ton of cheddar cheese (dry solids basis) consumed. For an average solids<br />
content of 63.2% for cheddar as sold at r<strong>et</strong>ail, the cumulative GHG emissions are 8.5 kg CO2e per kg cheddar<br />
cheese consumed, and for an average solids content of 51.4% for mozzarella, the GHG emissions are 7.3 kg<br />
CO2e/kg consumed. Fig. 1 shows the relative contribution from different supply cha<strong>in</strong> stages to both the cradle<br />
to grave impacts and the post-farm gate impacts (that is impacts exclud<strong>in</strong>g milk).<br />
This study provides a benchmark for the US cheese manufactur<strong>in</strong>g <strong>in</strong>dustry to gauge improvement over time<br />
and showed that energy use, especially electricity, across the supply cha<strong>in</strong> is relevant to several impact categories,<br />
<strong>in</strong>clud<strong>in</strong>g climate change, cumulative energy demand, photochemical oxidant formation, and human<br />
toxicity (USEtox). The impacts to ecosystems (ReCiPe) are driven almost exclusively by agricultural land<br />
occupation (63%) while the aquatic ecotoxicity (USEtox) impacts are driven significantly by fly control pesticides<br />
which are used <strong>in</strong> dairy operations and to lesser extent crop protection chemicals. Improvement opportunities<br />
focused on reduc<strong>in</strong>g energy consumption will have broad beneficial impacts, both economic<br />
through cost sav<strong>in</strong>gs, as well as environmental due to the emissions reduction.<br />
881
GROUP 5, SESSION B: FOOD PRODUCTS 8 th Int. Conference on <strong>LCA</strong> <strong>in</strong> the<br />
Agri-<strong>Food</strong> Sector, 1-4 Oct <strong>2012</strong><br />
Figure 1. Summary of cradle-to-grave and farm gate-to-grave life cycle impact assessment results for<br />
cheddar cheese supply cha<strong>in</strong>.<br />
882
GROUP 5, SESSION B: FOOD PRODUCTS 8 th Int. Conference on <strong>LCA</strong> <strong>in</strong> the<br />
Agri-<strong>Food</strong> Sector, 1-4 Oct <strong>2012</strong><br />
150. Comprehensive life cycle assessment of fluid milk delivery<br />
systems<br />
Greg Thoma 1,* , Dar<strong>in</strong> Nutter 1 , Jasm<strong>in</strong>a Burek 1 , Dae-Soo Kim 1 , Susan Selke 2 , Rafael Auras 2 , Bev Sauer 3 ,<br />
Sarah Cashman 3<br />
1 University of Arkansas, Fay<strong>et</strong>teville, AR, USA, 2 Michigan State University, East Lans<strong>in</strong>g, MI, USA, 3<br />
Frankl<strong>in</strong> Associates, Kansas City, MO, USA, * Correspond<strong>in</strong>g author. E-mail: gthoma@uark.edu<br />
In 2009 U.S. Dairy Management Inc. has s<strong>et</strong> up a targ<strong>et</strong> to reduce greenhouse gas emissions of fluid milk<br />
supply cha<strong>in</strong> of 25 percent by 2020, as a part of U.S. Dairy Susta<strong>in</strong>ability Commitment. The focus of this<br />
research is the <strong>LCA</strong> of fluid milk delivery systems emphasis<strong>in</strong>g assessment of environmental impacts of 18<br />
fluid milk packag<strong>in</strong>g and delivery options. The study provides results of the life cycle impact assessment for<br />
various standard and emerg<strong>in</strong>g fluid milk packag<strong>in</strong>g options.<br />
The objective of this project was to conduct a cradle-to-grave <strong>LCA</strong> of fluid milk delivery systems focused on<br />
quantify<strong>in</strong>g use of non-renewable energy sources, emissions to air, water, and land, consumption of water<br />
and other natural resources; and assessment of the impacts of these <strong>in</strong>ventory flows on climate change, resource<br />
depl<strong>et</strong>ion, human health, and ecosystems. The <strong>LCA</strong> provides data for the dairy <strong>in</strong>dustry enabl<strong>in</strong>g the<br />
<strong>in</strong>dustry to identify and engage <strong>in</strong> more susta<strong>in</strong>able approaches and identify opportunities for improvements<br />
lead<strong>in</strong>g to mitigation of environmental impacts across the dairy delivery life cycle.<br />
The ma<strong>in</strong> goal of this work was to equip milk delivery <strong>in</strong>dustry stakeholders (milk processors, packag<strong>in</strong>g<br />
material manufacturers and r<strong>et</strong>ailers) with timely, science-based <strong>in</strong>formation <strong>in</strong> order to <strong>in</strong>corporate environmental<br />
performance <strong>in</strong>to decision-mak<strong>in</strong>g and drive <strong>in</strong>novative new products, processes, and services.<br />
Fluid milk delivery systems can be dist<strong>in</strong>guished by their f<strong>in</strong>al consumption, delivery type, conta<strong>in</strong>er material<br />
composition and size. The life cycle impact assessment m<strong>et</strong>hods chosen <strong>in</strong>clude: ReCiPe Midpo<strong>in</strong>t,<br />
ReCiPe Endpo<strong>in</strong>t, and USEtox. They were used to create results that <strong>in</strong>clude the relevant <strong>in</strong>ventory <strong>in</strong>dicators<br />
and range of midpo<strong>in</strong>t/impact and endpo<strong>in</strong>t/damage categories. The selection <strong>in</strong>cludes two <strong>in</strong>ventory<br />
<strong>in</strong>dicators: ReCiPe’s Water depl<strong>et</strong>ion [m 3 ] and Cumulative Energy Demand Non-renewable, fossil [MJ]. For<br />
the purpose of result <strong>in</strong>terpr<strong>et</strong>ation and clarification of the importance of certa<strong>in</strong> impact category <strong>in</strong> the context<br />
of dairy delivery systems, each system was analysed us<strong>in</strong>g normalisation step of the IMPACT 2002+<br />
M<strong>et</strong>hod for U.S., and World ReCiPe normalisation.<br />
A summary of the fluid milk delivery systems under study based on their f<strong>in</strong>al consumption function, delivery<br />
option, conta<strong>in</strong>er composition, size, and total weight is presented <strong>in</strong> Fig. 1. Fig. 2 presents the overall<br />
results for gallon sized HDPE conta<strong>in</strong>er based delivery, as this represents approximately 65% of fluid milk<br />
consumption <strong>in</strong> the United States.<br />
Fluid Milk Delivery Systems<br />
In-Home-Consumption On-The-Go Consumption<br />
Chilled Ambient<br />
Chilled<br />
Ambient<br />
1 gal 1/2 gal 4 L 1 L 16 oz 1/2 gal 1 L 500 mL 8 oz 250 mL 8 oz 250 mL<br />
HDPE, LLDPE, LDPE, Paperboard, HDPE, LDPE, LLDPE, PET, HDPE, LDPE, LLDPE,<br />
CaCO3<br />
Paperboard, CaCO3 Paperboard, CaCO3<br />
Figure 1. Summary of fluid milk delivery systems under study.<br />
HDPE, PET, Paperboard,<br />
CaCO3<br />
883
GROUP 5, SESSION B: FOOD PRODUCTS 8 th Int. Conference on <strong>LCA</strong> <strong>in</strong> the<br />
Agri-<strong>Food</strong> Sector, 1-4 Oct <strong>2012</strong><br />
Figure 2. Cradle-to-grave and farm-gate-to-grave life cycle impact assessment results [%] of mono-layer<br />
HDPE fluid milk delivery system for n<strong>in</strong>e impact categories<br />
884
GROUP 6, SESSION B: METHODS, TOOLS, DATABASES 8 th Int. Conference on <strong>LCA</strong> <strong>in</strong> the<br />
Agri-<strong>Food</strong> Sector, 1-4 Oct <strong>2012</strong><br />
151. AusAgLCI – build<strong>in</strong>g national lifecycle <strong>in</strong>ventory for Australian<br />
agriculture<br />
Sandra Eady 1,* , Tim Grant 2 , Simon W<strong>in</strong>ter 3<br />
Group 6, Session B: M<strong>et</strong>hods, Tools, Databases<br />
1 CSIRO, Locked Bag 1, Armidale NSW 2350, Australia, 2 Lifecycle Strategies, Swanston Stre<strong>et</strong>, Melbourne<br />
VIC 3000, 3 Rural Industries Research and Development Corporation, Canberra ACT 2600, Australia, Correspond<strong>in</strong>g<br />
author. E-mail: sandra.eady@csiro.au<br />
There has been substantial growth <strong>in</strong> the development of Life Cycle Assessment (<strong>LCA</strong>) <strong>in</strong> agriculture <strong>in</strong><br />
Australia and globally over the past five years. A recent survey of activity by University of Queensland<br />
identified more than 20 <strong>LCA</strong>s of Australian agricultural commodities; many of these sponsored by <strong>in</strong>dustry<br />
associations. However, the consistency of these studies is low <strong>in</strong> terms of their system boundaries, impact<br />
categories, modell<strong>in</strong>g of co-products and data quality. There is a need to develop a national life cycle <strong>in</strong>ventory<br />
(LCI) for agricultural products to support environmental impact studies and to provide data for important<br />
export commodities, so that importers of Australian agricultural commodities can access representative<br />
data to compl<strong>et</strong>e <strong>LCA</strong>s.<br />
The Rural Industries Research and Development Corporation has <strong>in</strong>itiated a project to develop an agricultural<br />
LCI database (AusAgLCI) <strong>in</strong> alignment with the Australian Life Cycle Assessment Database Initiative<br />
(AusLCI). The project began <strong>in</strong> December 2011 and will run for 20 months. The project will draw on the<br />
extensive research and data collection undertaken <strong>in</strong> Australia by <strong>in</strong>dustry research bodies, state departments<br />
of <strong>in</strong>dustry, universities and CSIRO. The first task will be to def<strong>in</strong>e important <strong>in</strong>dustry sub-sectors to give<br />
appropriate representation of agricultural products that reflect differences <strong>in</strong> environmental impact and mark<strong>et</strong><br />
segments required by downstream users of the data. Us<strong>in</strong>g exist<strong>in</strong>g data, the project will align data quality,<br />
breadth of data coverage <strong>in</strong> terms of the impact categories <strong>in</strong>cluded (global warm<strong>in</strong>g, water and land use,<br />
eutrophication, ecotoxicity) and standardise the documentation of <strong>in</strong>ventories. Result<strong>in</strong>g unit processes from<br />
cradle-to-farm gate will be reviewed and published. As part of the project, approaches to key m<strong>et</strong>hodological<br />
issues are be<strong>in</strong>g resolved such as jo<strong>in</strong>t production from mixed farm<strong>in</strong>g systems, scope of water flows to be<br />
<strong>in</strong>cluded, carbon fluxes and land use for future impact assessment developments. At the compl<strong>et</strong>ion of the<br />
project priority areas for additional data collection will be identified.<br />
The project will assess and develop tools to quickly and accurately d<strong>et</strong>erm<strong>in</strong>e flows to the environment and<br />
<strong>in</strong>puts from the techno sphere. These will explore the use of spatial data to <strong>in</strong>form <strong>in</strong>ventory development,<br />
such as spatial layers for nitrogen and phosphors flows from agricultural land use and spatial layers for soil<br />
type for d<strong>et</strong>erm<strong>in</strong><strong>in</strong>g fuel consumption for land cultivation.<br />
885
GROUP 6, SESSION B: METHODS, TOOLS, DATABASES 8 th Int. Conference on <strong>LCA</strong> <strong>in</strong> the<br />
Agri-<strong>Food</strong> Sector, 1-4 Oct <strong>2012</strong><br />
886<br />
152. The French agricultural <strong>LCA</strong> platform<br />
Anne Bouter 3,4,5 , Armelle Gac 1 , Aurélie Tailleur 2,* , Sandr<strong>in</strong>e Espagnol 5 , Aurélie Wilfart 3,4<br />
1 Institut de l’Elevage, Monvois<strong>in</strong>, F-35652 Le Rheu cedex, <strong>France</strong>, 2 ARVALIS-Institut du veg<strong>et</strong>al, Service<br />
Agronomie Economie Environnement, Boigneville, F-91720, <strong>France</strong>, 3 INRA, UMR1069 Sol Agro <strong>et</strong> hydrosystème<br />
Spatialisation, F-35000 Rennes, <strong>France</strong>, 4 AGROCAMPUS OUEST, F-35000 Rennes,<strong>France</strong>, 5 IFIP<br />
- Institut du Porc, La Motte au vicomte BP35104, F-35651 Le Rheu cedex, <strong>France</strong>, Correspond<strong>in</strong>g author.<br />
E-mail: a.tailleur@arvalis<strong>in</strong>stitutduveg<strong>et</strong>al.fr<br />
The French Agricultural <strong>LCA</strong> Platform has been created <strong>in</strong> 2009 under the imp<strong>et</strong>us of the French technological<br />
mixed n<strong>et</strong>work on Livestock and Environment (Réseaux Mixte Technologique Elevage <strong>et</strong> Environnement).<br />
This n<strong>et</strong>work gathers research, technical and education <strong>in</strong>stitutes and aims at diffus<strong>in</strong>g management<br />
tools for animal production systems to improve their environmental performances. This open <strong>LCA</strong> platform<br />
is gather<strong>in</strong>g among 40 Agricultural <strong>LCA</strong>-practitioners from different <strong>in</strong>stitutes (agricultural research <strong>in</strong>stitutes,<br />
agricultural technical <strong>in</strong>stitutes, agriculture council <strong>in</strong>stitutes, professional organisations). The platform<br />
purpose is shar<strong>in</strong>g collectively knowledge, data and m<strong>et</strong>hodological positions to manage <strong>LCA</strong> on agricultural<br />
products and systems, <strong>in</strong> tak<strong>in</strong>g <strong>in</strong>to account French specificities of this sector. This <strong>in</strong>cludes actions to ensure<br />
common knowledge among the members by tra<strong>in</strong><strong>in</strong>g organisation session and experiences shar<strong>in</strong>g, to<br />
mutualise material resources (Us<strong>in</strong>g Simapro Multiuser license) and to validate collectively m<strong>et</strong>hodological<br />
choices (organisation of workshops about allocations, references for imported products <strong>in</strong> particular concern<strong>in</strong>g<br />
land use, biodiversity and water impacts, and watch on <strong>in</strong>ternational <strong>in</strong>itiatives of mutualis<strong>in</strong>g <strong>LCA</strong> data).<br />
A specific action is to mutualise <strong>LCA</strong> and LCI data from 8 partners <strong>in</strong> a common database, and to work for<br />
the recognition of LCI data <strong>in</strong>to <strong>in</strong>ternational databases. This implies first collect<strong>in</strong>g data among partners,<br />
describ<strong>in</strong>g precisely the m<strong>et</strong>hodology that has been <strong>in</strong>volved, qualify<strong>in</strong>g data quality and assess<strong>in</strong>g their limits.<br />
This m<strong>et</strong>hodology will allow identify<strong>in</strong>g the best references for users’ purpose.
GROUP 6, SESSION B: METHODS, TOOLS, DATABASES 8 th Int. Conference on <strong>LCA</strong> <strong>in</strong> the<br />
Agri-<strong>Food</strong> Sector, 1-4 Oct <strong>2012</strong><br />
153. A software and database platform for multi-criteria assessment of<br />
agri-food systems<br />
Hayo van der Werf 1,2,* , Julie Auberger 1,2 , Coralie Haese 1,2 , Geneviève Gésan-Guiziou 2,3 , Joël Aub<strong>in</strong> 1,2<br />
1 INRA, UMR1069 Sol, Agro and hydroSystem, 35000 Rennes, <strong>France</strong>, 2 Agrocampus Ouest, 35000 Rennes,<br />
<strong>France</strong>, 3 INRA, UMR1253 Science <strong>et</strong> Technologie du Lait <strong>et</strong> de l’Œuf, 35042 Rennes, <strong>France</strong>, Correspond<strong>in</strong>g<br />
author. E-mail: hayo.vanderwerf@rennes.<strong>in</strong>ra.fr<br />
INRA, the French National Institute for Agricultural Research, aims to improve the environmental, soci<strong>et</strong>al<br />
and economic performances of agriculture, and to favour healthy and susta<strong>in</strong>able food systems. Research<br />
conducted to reach these objectives should consider and <strong>in</strong>tegrate many criteria. The development of tools<br />
for the multi-criteria assessment of the production and transformation of agricultural products is of strategic<br />
importance, to guide the evolution towards susta<strong>in</strong>able agri-food systems. INRA has therefore decided to<br />
develop an <strong>in</strong>-house platform for the multi-criteria susta<strong>in</strong>ability assessment of agri-food systems. The objectives<br />
of the platform are:<br />
To develop user-friendly multi-criteria assessment tools and associated databases for agri-food systems,<br />
To tra<strong>in</strong> future users, give support to users<br />
To provide a science and technology watch on multi-criteria assessment<br />
Many m<strong>et</strong>hods have been proposed for the multi-criteria assessment of the environmental, soci<strong>et</strong>al and economic<br />
impacts of farm<strong>in</strong>g systems (van der Werf and P<strong>et</strong>it, 2002; Bockstaller <strong>et</strong> al., 2008). These m<strong>et</strong>hods<br />
present a similar structure, often consist<strong>in</strong>g of eight stages (Acosta-Alba and van der Werf, 2011): 1) Def<strong>in</strong>ition<br />
of the susta<strong>in</strong>ability dimensions to be assessed, 2) Identification of objectives for each dimension, 3)<br />
Selection or conception of <strong>in</strong>dicators for each objective, 4) System def<strong>in</strong>ition, 5) Def<strong>in</strong>ition of calculation<br />
algorithms for each <strong>in</strong>dicator, 6) Technical description of the system, 7) Calculation of <strong>in</strong>dicator values, 8)<br />
Interpr<strong>et</strong>ation of results, identification of improvement options (Table 1).<br />
In spite of their similar structure, these m<strong>et</strong>hods present an amaz<strong>in</strong>g diversity <strong>in</strong> their implementation, and<br />
the outcome of studies us<strong>in</strong>g different m<strong>et</strong>hods to assess contrast<strong>in</strong>g systems depends to a large extent on the<br />
characteristics of the m<strong>et</strong>hods used (van der Werf <strong>et</strong> al., 2007). M<strong>et</strong>hods differ amongst others with respect<br />
to system def<strong>in</strong>ition (<strong>in</strong>clusion of <strong>in</strong>puts to the system assessed), issues of concern considered, type of <strong>in</strong>dicators<br />
(means-based vs effect-based) and expression of results (per ha or per kg of product) depend<strong>in</strong>g on identified<br />
functions.<br />
Initially the platform will focus on the multi-criteria assessment of environmental impacts through Life Cycle<br />
Assessment (<strong>LCA</strong>). The implementation of soci<strong>et</strong>al and economic dimensions <strong>in</strong> m<strong>et</strong>hods for multicriteria<br />
assessment will be pursued, <strong>in</strong> particular, but not exclusively, via the concept of Life Cycle Susta<strong>in</strong>ability<br />
Assessment. The platform will allow the implementation of both <strong>LCA</strong>-type m<strong>et</strong>hods and other m<strong>et</strong>hods<br />
for the multi-criteria assessment of agri-food systems (e.g. Ecological Footpr<strong>in</strong>t, Emergy). This will be<br />
done by conform<strong>in</strong>g the architecture of the platform to the eight stages of multi-criteria assessment m<strong>et</strong>hods<br />
outl<strong>in</strong>ed above (Fig. 1).The platform will be complementary to other INRA software platforms, and <strong>in</strong> particular<br />
to the RECORD platform (http://www4.<strong>in</strong>ra.fr/record), for the modell<strong>in</strong>g and simulation of crop and<br />
farm systems.<br />
References<br />
Acosta-Alba, I., van der Werf, H.M.G., 2011. The use of reference values <strong>in</strong> <strong>in</strong>dicator-based m<strong>et</strong>hods for the<br />
environmental assessment of agricultural systems. Susta<strong>in</strong>ability, 3, 424-442.<br />
Bockstaller, C., Guichard, L., Makowski, D., Avel<strong>in</strong>e, A., Girard<strong>in</strong>, P., Plantureux, S., 2008. Agrienvironmental<br />
<strong>in</strong>dicators to assess cropp<strong>in</strong>g and farm<strong>in</strong>g systems. A review. Agron. Susta<strong>in</strong>. Dev. 28,<br />
139-149.<br />
Van der Werf, H.M.G., P<strong>et</strong>it, J., 2002. Evaluation of the environmental impact of agriculture at the farm<br />
level: a comparison and analysis of 12 <strong>in</strong>dicator-based m<strong>et</strong>hods. Agr., Ecosyst. Environ., 93, 131-145.<br />
Van der Werf, H.M.G., Tzilivakis, J., Lewis, K., Bass<strong>et</strong>-Mens, C, 2007. Environmental impacts of farm scenarios<br />
accord<strong>in</strong>g to five assessment m<strong>et</strong>hods. Agr., Ecosyst. Environ., 118: 327-338.<br />
887
GROUP 6, SESSION B: METHODS, TOOLS, DATABASES 8 th Table 1. Stages of multi-criteria assessment m<strong>et</strong>hods for farm<strong>in</strong>g systems<br />
Int. Conference on <strong>LCA</strong> <strong>in</strong> the<br />
Agri-<strong>Food</strong> Sector, 1-4 Oct <strong>2012</strong><br />
Stage Description<br />
1 Susta<strong>in</strong>ability di- Some m<strong>et</strong>hods only assess environmental impacts; other m<strong>et</strong>hods also assess<br />
mensions def<strong>in</strong>ed soci<strong>et</strong>al and/or economic impacts and/or overall susta<strong>in</strong>ability.<br />
2 Objectives identi- Dimensions of susta<strong>in</strong>ability cannot be directly quantified; a s<strong>et</strong> of more specific<br />
fied<br />
objectives (issues of concern) for each dimension is required.<br />
3 Indicators def<strong>in</strong>ed To quantify the extent to which objectives are atta<strong>in</strong>ed, <strong>in</strong>dicators serv<strong>in</strong>g as assessment<br />
criteria are required. This stage may <strong>in</strong>volve the def<strong>in</strong>ition of thresholds<br />
or reference values, which help to <strong>in</strong>terpr<strong>et</strong> <strong>in</strong>dicator values.<br />
4 System def<strong>in</strong>ition The system is characterised, its boundaries and functions are def<strong>in</strong>ed.<br />
5 Calculation algo- This stage <strong>in</strong>volves the d<strong>et</strong>erm<strong>in</strong>ation of calculation algorithms for the <strong>in</strong>dicators.<br />
rithms def<strong>in</strong>ed Calculation algorithms can be very simple (e.g. emission factors) or much more<br />
sophisticated (dynamic simulation models).<br />
6 System technical Farmer production practices <strong>in</strong>clud<strong>in</strong>g amounts and tim<strong>in</strong>g of <strong>in</strong>puts used are<br />
description described, technical param<strong>et</strong>ers (feed efficiencies, crop yields) are quantified,<br />
pedoclimatic conditions are def<strong>in</strong>ed.<br />
7 Indicators calcu- Indicator values are calculated for each of the systems or scenarios to be comlatedpared.<br />
A partial or total aggregation of <strong>in</strong>dicator values may facilitate their <strong>in</strong>terpr<strong>et</strong>ation.<br />
8 Interpr<strong>et</strong>ation Interpr<strong>et</strong>ation of results, identification of improvement options. This stage obviously<br />
is crucial; unfortunately few m<strong>et</strong>hods explicitly <strong>in</strong>clude this stage.<br />
888<br />
Figure 1. Representation of the platform’s architecture and tools, allow<strong>in</strong>g the implementation of different<br />
m<strong>et</strong>hods for the multi-criteria assessment of agri-food systems.
GROUP 6, SESSION B: METHODS, TOOLS, DATABASES 8 th Int. Conference on <strong>LCA</strong> <strong>in</strong> the<br />
Agri-<strong>Food</strong> Sector, 1-4 Oct <strong>2012</strong><br />
154. Availability and compl<strong>et</strong>eness of LCI of cereal products and<br />
related databases<br />
Evelyne Laurent, Roberto Bell<strong>in</strong>o, Stéphane Le Pochat *<br />
EVEA, 56 Bd de la Fraternité, 44100 Nantes, <strong>France</strong>, Correspond<strong>in</strong>g author. E-mail: s.lepochat@eveaconseil.com<br />
In 2011, EVEA carried out a study on behalf of Intercéréales (Inter-branch association of the French cereal<br />
sector). The aim of this study was first to analyse the different product labell<strong>in</strong>g systems of cereals products<br />
around the world, and second to analyse available data <strong>in</strong> exist<strong>in</strong>g LCI databases, regard<strong>in</strong>g cereals (wheat,<br />
barley, maize, sorghum, rice and rye) and cereal-conta<strong>in</strong><strong>in</strong>g products.<br />
The study provided <strong>in</strong>formation on the exist<strong>in</strong>g databases that conta<strong>in</strong> LCI of cereals and cereals-conta<strong>in</strong><strong>in</strong>g<br />
products. The analysis was conducted on ten French and <strong>in</strong>ternational databases, eight of which <strong>in</strong>clude cereals-related<br />
data (eco<strong>in</strong>vent, DiaTerre, <strong>LCA</strong> <strong>Food</strong>, Bilan Carbone ® , AUSLCI, CPM Database, USLCI, and<br />
Agri-Footpr<strong>in</strong>t; Probas and BUWAL 250 do not <strong>in</strong>clude cereals-related data).<br />
Each database was analysed by gather<strong>in</strong>g general <strong>in</strong>formation (country, public or private status) and a description<br />
of the available data <strong>in</strong> the cereals sector. The follow<strong>in</strong>g data are to be found <strong>in</strong> the databases: raw<br />
materials, <strong>in</strong>puts, processes, and cereal-based f<strong>in</strong>ished products (Table 1, Fig. 1).<br />
The eco<strong>in</strong>vent Database is by far the most compl<strong>et</strong>e database, with Swiss and European data for agricultural<br />
raw materials, <strong>in</strong>puts and processes. Data about some cereals-based f<strong>in</strong>ished products can be found <strong>in</strong> the<br />
<strong>LCA</strong> <strong>Food</strong> Database (wheat, bread, pastries, oat flakes) and <strong>in</strong> the French Bilan Carbone ® database. However,<br />
very little data can be found <strong>in</strong> the databases about agricultural processes, food <strong>in</strong>dustry processes, storage<br />
or mass-mark<strong>et</strong> r<strong>et</strong>ail<strong>in</strong>g, and the lack of data makes it difficult to implement an environmental labell<strong>in</strong>g<br />
of cereal-based products based on present data available. Only eco<strong>in</strong>vent Database and <strong>LCA</strong> <strong>Food</strong> Database<br />
provide specific geographic data: Swiss data <strong>in</strong> eco<strong>in</strong>vent and Danish data <strong>in</strong> the <strong>LCA</strong> <strong>Food</strong> Database. The<br />
exist<strong>in</strong>g databases lack specific French data.<br />
The study raised the issue of m<strong>et</strong>hodological comparability: all databases s<strong>et</strong> their own hypothesis and m<strong>et</strong>hodological<br />
rules (allocation, cut-off rules…) and major differences can be found b<strong>et</strong>ween data from different<br />
databases.<br />
For example, the allocation m<strong>et</strong>hod is not the same <strong>in</strong> all major databases. Among two of the ma<strong>in</strong> databases<br />
for cereals products, the eco<strong>in</strong>vent database resorts to economic allocation whereas the <strong>LCA</strong> <strong>Food</strong> Database<br />
uses substitution (avoided impacts). As a consequence, for example, the impact of one kg of wheat, which is<br />
evaluated <strong>in</strong> 5 different databases, ranges from 0,401 kg CO2 eq. (USLCI) to 0,959 kg CO2 eq. (CPM Database),<br />
but this variability cannot be expla<strong>in</strong>ed solely by obvious differences <strong>in</strong> yield, agricultural techniques<br />
or climate. This variability makes it difficult to implement an environmental labell<strong>in</strong>g of cereal-based products<br />
with sufficient accuracy and comparability.<br />
This study lead to the conclusion that exist<strong>in</strong>g databases cannot be used as a strong and d<strong>et</strong>ailed basis about<br />
cereal product environmental labell<strong>in</strong>g. Two major programs have been launched <strong>in</strong> <strong>France</strong> <strong>in</strong> order to collect<br />
data for the environmental assessment of agricultural-based products:<br />
Agri-Balyse for the creation of French average data about the environmental impacts of agricultural<br />
productions.<br />
Acyvia about the impacts of agri-food transformation processes.<br />
The conclusion of the Intercéréales study is that its members should take part <strong>in</strong> the Acyvia project <strong>in</strong> order<br />
to improve the compl<strong>et</strong>eness of the data about their products.<br />
References<br />
Abelmann, A. 2005. Environmental Potential of Increased Human Consumption of Gra<strong>in</strong> Legumes: An <strong>LCA</strong><br />
of food products. Report No. 2005:10.<br />
Blonk, H. <strong>et</strong> al. 2011. The Agri-footpr<strong>in</strong>t m<strong>et</strong>hod M<strong>et</strong>hodological <strong>LCA</strong> framework - assumptions and applied<br />
data. Report Agri FootPr<strong>in</strong>t<br />
Nemecek, T., Kägi, T., 2007. Life Cycle Inventories of Swiss and European Agricultural Production Systems.<br />
F<strong>in</strong>al report, Eco<strong>in</strong>vent v2.0, No. 15a, September 2007.<br />
<strong>LCA</strong> <strong>Food</strong> Database, 2007. www.lcafood.dk.<br />
889
GROUP 6, SESSION B: METHODS, TOOLS, DATABASES 8 th Int. Conference on <strong>LCA</strong> <strong>in</strong> the<br />
Agri-<strong>Food</strong> Sector, 1-4 Oct <strong>2012</strong><br />
Table 1. Data availability for cereals and cereal-based products <strong>in</strong> 8 LCI databases<br />
Generic<br />
F<strong>in</strong>-<br />
or speishedcific<br />
to<br />
Other<br />
prod- Total<br />
the agriAgriculagriculuctsnum- Country cultur<strong>et</strong>ural raw Fertilistural<strong>in</strong>Proc(cerealber of<br />
Database of orig<strong>in</strong> sector? materials ersputsessesbased) data<br />
eco<strong>in</strong>vent Switzerland<br />
Generic 21 25 110 3 1 160<br />
DiaTerre <strong>France</strong> Specific 10 10 24 0 3 47<br />
<strong>LCA</strong> <strong>Food</strong> Denmark Specific 10 7 5 0 11 33<br />
Bilan Car- <strong>France</strong> Generic 2 8 3 0 9 22<br />
bone ®<br />
AUSLCI Australia Generic 1 18 1 0 0 20<br />
CPM Database<br />
Sweden Generic 1 8 0 0 3 12<br />
USLCI United<br />
States<br />
Generic 3 2 0 0 0 5<br />
AGRI N<strong>et</strong>her- Specific 0 0 0 0 2 2<br />
FOOT-<br />
PRINT<br />
lands<br />
Total 48 78 143 3 29 301<br />
Figure 1. Data availability for cereals and cereal-based products <strong>in</strong> 8 LCI databases<br />
890
GROUP 6, SESSION B: METHODS, TOOLS, DATABASES 8 th Int. Conference on <strong>LCA</strong> <strong>in</strong> the<br />
Agri-<strong>Food</strong> Sector, 1-4 Oct <strong>2012</strong><br />
155. The <strong>LCA</strong> world food database project: towards more accurate<br />
<strong>LCA</strong>s on agricultural and food products<br />
Laura Peano 1,* , Yves Loer<strong>in</strong>cik 1 , Sebastien Humbert 1 , Gérard Gaillard 2 , Thomas Nemecek 2<br />
1 Quantis, Parc scientifique EPFL, Bât. D, 1015 Lausanne, Switzerland, 2 Agroscope Reckenholz-Tänikon<br />
Research Station ART, Reckenholzstrasse 191, 8046 Zürich, Switzerland, Correspond<strong>in</strong>g author. E-mail:<br />
laura.peano@quantis-<strong>in</strong>tl.com<br />
The food and beverage sector is mov<strong>in</strong>g rapidly regard<strong>in</strong>g susta<strong>in</strong>ability issues (such as labell<strong>in</strong>g purposes or<br />
“food eco-design”). This concerns both <strong>in</strong>stitutional and private organisations; consumers and environmental<br />
organisations also claim for more transparency on the environmental performance of food and beverage<br />
products. Life cycle assessment (<strong>LCA</strong>) has proven to be an effective m<strong>et</strong>hod to assess the environmental<br />
impact of a product or service throughout its life cycle. However, currently, major limitations <strong>in</strong> do<strong>in</strong>g such<br />
analyses are the lack of <strong>in</strong>ventory data on food products and processes and a lack of consistency b<strong>et</strong>ween<br />
exist<strong>in</strong>g food datas<strong>et</strong>s. Therefore, there is a need to develop d<strong>et</strong>ailed, transparent, well documented and reliable<br />
data <strong>in</strong> order to <strong>in</strong>crease accuracy of food <strong>LCA</strong>.<br />
In this context, Quantis, the Agroscope Reckenholz-Tänikon Research Station ART and some lead<strong>in</strong>g companies<br />
<strong>in</strong> the food sector have decided to launch <strong>in</strong> <strong>2012</strong> the <strong>LCA</strong> world food database project.<br />
The database will <strong>in</strong>clude datas<strong>et</strong>s concern<strong>in</strong>g agricultural raw materials (<strong>in</strong>clud<strong>in</strong>g, when possible and relevant,<br />
differences b<strong>et</strong>ween production systems such as organic or non organic, <strong>in</strong>tensive or extensive), <strong>in</strong>puts<br />
(such as pesticides and fertilisers), <strong>in</strong>frastructures (agricultural build<strong>in</strong>gs, equipment and mach<strong>in</strong>ery), processes,<br />
processed food products, food storage, food transportation and food packag<strong>in</strong>g. A consistent, but<br />
transparent, consideration of deforestation will also be <strong>in</strong>cluded giv<strong>in</strong>g the possibility to assess it us<strong>in</strong>g different<br />
allocation rules. The data will come from exist<strong>in</strong>g <strong>LCA</strong>s on food products (partners’ <strong>LCA</strong>, ART and<br />
Quantis exist<strong>in</strong>g databases), literature review on <strong>LCA</strong> of food products, statistical databases of governments<br />
and <strong>in</strong>ternational organisations (such as FAO), environmental reports from companies, technical reports on<br />
food and agriculture, partners’ <strong>in</strong>formation on food processes as well as collected primary data. Background<br />
datas<strong>et</strong>s from the eco<strong>in</strong>vent database will be used and new datas<strong>et</strong>s will be compatible with eco<strong>in</strong>vent.<br />
To guarantee its transparency, the database will be fully documented, unit processes will be visible (except<br />
for confidential data provided by the companies) and <strong>in</strong>formation sources identified. The user will be able to<br />
differentiate among different stages of the process (e.g. agricultural production vs. food product manufactur<strong>in</strong>g)<br />
and to identify the ma<strong>in</strong> contributors of a specific datas<strong>et</strong> (e.g. irrigation, fertiliser use, <strong>et</strong>c.).<br />
The food database will be updated each year and will be compliant with quality requirements from major<br />
standards (ILCD Handbook, Susta<strong>in</strong>ability Consortium, United Nations Environment Programme (UNEP),<br />
<strong>et</strong>c.) as well as with eco<strong>in</strong>vent.<br />
The project will start <strong>in</strong> March <strong>2012</strong> and will be compl<strong>et</strong>ed <strong>in</strong> March 2015. The presentation will present the<br />
project (results of the literature review of the exist<strong>in</strong>g food datas<strong>et</strong>s, <strong>in</strong>volved companies, time schedule) as<br />
well as current state of the results (exist<strong>in</strong>g and new datas<strong>et</strong>s, <strong>in</strong>fluence of consistent <strong>in</strong>corporation of deforestation,<br />
results and challenges associated with organic and non organic as well as extensive and <strong>in</strong>tensive<br />
agricultural and animal systems).<br />
References<br />
Eco<strong>in</strong>vent, 2010. eco<strong>in</strong>vent database v 2.2. Available at www.eco<strong>in</strong>vent.ch<br />
Jolli<strong>et</strong>, O., Margni, M., Charles, R., Humbert, S., Pay<strong>et</strong>, J., Rebitzer, G., 2003. IMPACT 2002+: a new life<br />
cycle impact assessment m<strong>et</strong>hod. International Journal of Life Cycle Assessment 8 (6), 324–30. Version<br />
adapted by Quantis (http://www.quantis-<strong>in</strong>tl.com).<br />
European Commission, Jo<strong>in</strong>t Research Centre, Institute for Environment and Susta<strong>in</strong>ability, 2010. International<br />
Reference Life Cycle Data System (ILCD) Handbook, General guide for Life Cycle Assessment,<br />
D<strong>et</strong>ailed guidance. Publications Office of the European Union.<br />
891
GROUP 6, SESSION B: METHODS, TOOLS, DATABASES 8 th Int. Conference on <strong>LCA</strong> <strong>in</strong> the<br />
Agri-<strong>Food</strong> Sector, 1-4 Oct <strong>2012</strong><br />
892<br />
156. Seeds4green, a collaborative platform for <strong>LCA</strong><br />
Hélène Teulon * , Benjam<strong>in</strong> Canaguier<br />
G<strong>in</strong>gko 21, Paris, <strong>France</strong>, * Correspond<strong>in</strong>g author. E-mail: helene.teulon@g<strong>in</strong>gko21.com<br />
In 2009 and 2010, DEFRA (UK) jo<strong>in</strong>ed forces with ADEME (French Environmental and Energy Management<br />
Agency) to sponsor the development of a collaborative <strong>LCA</strong> website with the technical support of the<br />
EU’s Jo<strong>in</strong>t Research Centre. Seeds4Green is a wiki platform that aims to provide an easy way gather and<br />
share documents l<strong>in</strong>ked to environmental susta<strong>in</strong>ability. Both agencies support the transparency and shar<strong>in</strong>g<br />
of data and view this as a one of the solutions that allows a wider range of users to acquire <strong>LCA</strong> <strong>in</strong>formation<br />
more easily and promote susta<strong>in</strong>able goods and services.<br />
We anticipate that the <strong>in</strong>formation stored here could be used by many audiences - from purchasers to ecodesigners,<br />
bus<strong>in</strong>esses, eco-labell<strong>in</strong>g teams with<strong>in</strong> public authorities as well as <strong>LCA</strong> practitioners, researchers<br />
and students throughout the world. Currently summaries are <strong>in</strong> both French and English.<br />
The purpose of the platform is to collaboratively build knowledge on the environmental quality of goods and<br />
to diffuse the results of <strong>LCA</strong> studies. It provides purchas<strong>in</strong>g guidel<strong>in</strong>es and systemised criteria mak<strong>in</strong>g<br />
green purchas<strong>in</strong>g operational and eco-labels even more transparent and comprehensive. Seeds4green <strong>in</strong>tends<br />
to cover all product categories. Several <strong>LCA</strong> studies are available for agriculture goods. The platform provides<br />
a large range of topics such as organic vs conventional product or l<strong>in</strong>ks towards food product <strong>LCA</strong><br />
database.<br />
The presentation/poster will expla<strong>in</strong> the features of the platform <strong>in</strong>clud<strong>in</strong>g d<strong>et</strong>ailed examples of data summary<br />
she<strong>et</strong>s mak<strong>in</strong>g it immediate accessible and show<strong>in</strong>g its ease of <strong>in</strong>tegration <strong>in</strong> <strong>in</strong>dividual work habits.<br />
http://seeds4green.n<strong>et</strong>/<br />
Figure 1. Extract of the available studies for the food-related products
GROUP 6, SESSION B: METHODS, TOOLS, DATABASES 8 th Int. Conference on <strong>LCA</strong> <strong>in</strong> the<br />
Agri-<strong>Food</strong> Sector, 1-4 Oct <strong>2012</strong><br />
157. ACYVIA: creation of a public LCI/LCIA database of the French<br />
food <strong>in</strong>dustry<br />
F. Bosque 1 , O.Réthoré 2 , S. Kerner 3 , H. Bortoli 2 , Laura Peano 4 , Sébastien Humbert 4,5 , G. Gaillard 6 , J.<br />
Lansche 6<br />
1 ITERG, rue Monge, 33600 Pessac, <strong>France</strong>, 2 ADEME, 27 rue Louis Vicat, 75737 Paris Cedex 15, <strong>France</strong>, 3<br />
IFV, Doma<strong>in</strong>e de l’Espigu<strong>et</strong>te, 30240 Le Grau-du-Roi, <strong>France</strong>, 4 Quantis, Parc scientifique EPFL, Bât. D –<br />
CH-1015 Lausanne, Switzerland, 5 Quantis, 42 boulevard de Sebastopol, 75003 Paris, <strong>France</strong>, 6 Agroscope<br />
Reckenholz-Tänikon Research Station ART, CH-8046 Zürich, Switzerland, Correspond<strong>in</strong>g author. E-mail:<br />
f.bosque@iterg.com<br />
In the context of the Grenelle laws aim<strong>in</strong>g at an environmental labell<strong>in</strong>g on consumer goods, the ADEME,<br />
the French Environment and Energy Management Agency, has been mandated to s<strong>et</strong> up a national LCI/LCIA<br />
database, <strong>in</strong> parallel with the development of Product Category Rules by the ADEME/AFNOR platform<br />
(Fig. 1). In terms of format, ADEME’s database is based on the ILCD Datas<strong>et</strong> format def<strong>in</strong>ed by the JRC. In<br />
terms of content, three m<strong>et</strong>hods will be used to feed the database. The first and ma<strong>in</strong> one relies on the adaptation<br />
of exist<strong>in</strong>g processes and on the purchase of the requisite rights from data developers through framework<br />
contracts. For sectors with lacks of data, the ADEME is s<strong>et</strong>t<strong>in</strong>g up collaborative projects to develop<br />
sectorial databases that will be merged to ADEME’s database. The third mode will allow third-parties to<br />
propose the <strong>in</strong>tegration of isolated supplementary data.<br />
A first three years collaborative project called Agri-BALYSE has been launched <strong>in</strong> 2010 with INRA, ART,<br />
CIRAD and ten agricultural <strong>in</strong>stitutes to develop a public LCI/LCIA database for the ma<strong>in</strong> French agricultural<br />
productions as well as some importations (see http://www2.ademe.fr/servl<strong>et</strong>/KBaseShow?sort=-<br />
1&cid=96&m=3&catid=12908). ACYVIA is a similar project aim<strong>in</strong>g to deal with the next step of the food<br />
supply cha<strong>in</strong>: transformation.<br />
ACYVIA will apply a consistent m<strong>et</strong>hodology for the establishment of life cycle <strong>in</strong>ventories of food transformation<br />
processes from the farm gate to the exit gate of the transformation plant. The m<strong>et</strong>hods used and the<br />
data format will be <strong>in</strong> accordance with ISO norms, the ILCD handbook and the general m<strong>et</strong>hodology adopted<br />
for the environmental labell<strong>in</strong>g of consumer goods <strong>in</strong> <strong>France</strong> (BPX 30-323). The <strong>in</strong>ventory data should allow<br />
the calculation of the <strong>in</strong>dicators identified for environmental labell<strong>in</strong>g, but also of other frequently used <strong>LCA</strong><br />
impact categories.<br />
The project will be carried out <strong>in</strong> collaboration by the follow<strong>in</strong>g partners:<br />
- ADEME will fund the project and assure its leadership and co-ord<strong>in</strong>ation.<br />
- <strong>Food</strong> technological <strong>in</strong>stitutes (w<strong>in</strong>e, spirits, dairy products, fats and oils, bak<strong>in</strong>g and pastry, meat <strong>in</strong>dustry,<br />
appertised or dehydrated food) will collect representative data and contribute to the m<strong>et</strong>hodological<br />
developments and the establishment of the <strong>in</strong>ventories.<br />
- Quantis and ART will lead the m<strong>et</strong>hodological developments and the computations of the life cycle<br />
<strong>in</strong>ventories.<br />
ACYVIA will systematically look for a consensus among the concerned experts, not only for the data used to<br />
produce the LCI, but also about major m<strong>et</strong>hodological questions such as allocation procedures. This is seen<br />
as a prerequisite for the success of the database: the <strong>in</strong>volvement of <strong>in</strong>terested stakeholders should favour the<br />
broad adoption of ACYVIA across the food cha<strong>in</strong>. ACYVIA’s database will be made of three levels of deliverables,<br />
correspond<strong>in</strong>g to the needs of each partner:<br />
- aggregated and averaged processes for ADEME’s database;<br />
- disaggregated and un-averaged processes to help the technical <strong>in</strong>stitutes assess<strong>in</strong>g and lower<strong>in</strong>g the<br />
environmental impacts of their supply cha<strong>in</strong>;<br />
- disaggregated and averaged processes.<br />
This “vertical” construction of the database will be compl<strong>et</strong>ed by a “horizontal” one consist<strong>in</strong>g <strong>in</strong> the generation<br />
of “child” processes based on “parent” processes and ensur<strong>in</strong>g a greater level of homogeneity for the<br />
database. For each child process, the values and relative proportions of the param<strong>et</strong>ers of a given parent<br />
process are adapted to fit with the technical, geographical and temporal representativeness of the child process.<br />
For <strong>in</strong>stance, a “parent” process “process<strong>in</strong>g and packag<strong>in</strong>g of milk” can be decl<strong>in</strong>ed <strong>in</strong> several “child”<br />
processes specifically constructed to represent the geographical and/or technological specificities of a producer<br />
(e.g. PAST vs. UHT dur<strong>in</strong>g sterilisation process)<br />
The presentation will show the latest developments and the architecture of the database, the structure of the<br />
collaboration, and the ma<strong>in</strong> features of the database, such as:<br />
893
GROUP 6, SESSION B: METHODS, TOOLS, DATABASES 8 th Int. Conference on <strong>LCA</strong> <strong>in</strong> the<br />
Agri-<strong>Food</strong> Sector, 1-4 Oct <strong>2012</strong><br />
- the expected processes to be <strong>in</strong>cluded <strong>in</strong> the database<br />
- the public availability;<br />
- the homogeneity;<br />
- the l<strong>in</strong>k with the ADEME database<br />
- the wide range of usage: support<strong>in</strong>g the environmental labell<strong>in</strong>g for customers and help<strong>in</strong>g producers<br />
to decrease their impacts.<br />
Figure 1. Overall context of ADEME’s database<br />
894
GROUP 6, SESSION B: METHODS, TOOLS, DATABASES 8 th Int. Conference on <strong>LCA</strong> <strong>in</strong> the<br />
Agri-<strong>Food</strong> Sector, 1-4 Oct <strong>2012</strong><br />
158. <strong>LCA</strong> as an evaluation tool for new food preservation techniques<br />
Anna Aronsson * , Kar<strong>in</strong> Östergren, Christoffer Krewer<br />
Swedish Institute for <strong>Food</strong>s and Biotechnology (SIK),<br />
anna.aronsson@sik.se<br />
Correspond<strong>in</strong>g author. E-mail:<br />
Alongside with new technology development it is becom<strong>in</strong>g more common to evaluate the environmental<br />
impact us<strong>in</strong>g <strong>LCA</strong>. (e.g. Hospido <strong>et</strong> al., 2010, Sonesson, 2010).The demand for environmentally susta<strong>in</strong>able<br />
food products is <strong>in</strong>creas<strong>in</strong>g and it is a challenge for the food and dr<strong>in</strong>k sector to reduce environmental impact<br />
along the food cha<strong>in</strong> while at the same time ma<strong>in</strong>ta<strong>in</strong><strong>in</strong>g and improv<strong>in</strong>g quality. These demands have resulted<br />
<strong>in</strong> an <strong>in</strong>creased focus on environmental quality aspects dur<strong>in</strong>g the development of new food products<br />
and new technologies. Freeze protection with anti-freeze prote<strong>in</strong> (AFP) (Phoon <strong>et</strong> al., 2008) and carbon dioxide<br />
(CO2) dry<strong>in</strong>g (Agterof <strong>et</strong> al., 2005) are new preservation technologies under development. Soft veg<strong>et</strong>ables<br />
and fruits such as strawberries (Fragaria ananassa) are suitable for both preservation m<strong>et</strong>hods. Both<br />
technologies lead to compl<strong>et</strong>e new products as freeze protected fruits can be thawed without cell damage<br />
and can be used as fresh fruits and dried fruits can be rehydrated result<strong>in</strong>g <strong>in</strong> recovered natural turgor. The<br />
environmental benefits of the new preservation technologies is the possibility of extend<strong>in</strong>g shelf life and<br />
substitution of imported fresh fruit and veg<strong>et</strong>ables when out of season. The aims of this study were to (1)<br />
compare the environmental impact from cradle to r<strong>et</strong>ail of fresh, AFP freeze protected and CO2-dried strawberries<br />
and (2) identify the key environmental issues after “farm-gate” to be able to evaluate the supply cha<strong>in</strong><br />
from process<strong>in</strong>g to r<strong>et</strong>ail to support the technology development. Frozen / CO2-dried and fresh strawberries<br />
were assumed to be cultivated and processed <strong>in</strong> Sweden and Egypt respectively. The study was performed<br />
us<strong>in</strong>g <strong>LCA</strong> m<strong>et</strong>hodology with a functional unit of 1 kg of ready to use strawberries. Global warm<strong>in</strong>g potential<br />
(GWP) and fossil energy use (MJ, data not shown) per functional unit <strong>in</strong> terms of primary energy was<br />
calculated. The result<strong>in</strong>g prelim<strong>in</strong>ary GWP for fresh, freeze protected and CO2-dried strawberries after <strong>LCA</strong><br />
was carried out were 4.6, 0.63, and 2 kg CO2eq/kg strawberry respectively. The novel preservation technologies<br />
emitted less greenhouse gas emissions than the current m<strong>et</strong>hod of freez<strong>in</strong>g and the fresh imported strawberries<br />
(Fig. 1). The energy required for the novel technologies at the process<strong>in</strong>g step accounted for 60-80%<br />
of the total GWP post-farm (Fig. 1). The results also demonstrate the importance of tak<strong>in</strong>g the full cha<strong>in</strong> <strong>in</strong>to<br />
account when evaluat<strong>in</strong>g new process technologies. An <strong>in</strong>creased impact <strong>in</strong> one step may still lead to an<br />
overall improvement of the cha<strong>in</strong> under given conditions. This study demonstrates how <strong>LCA</strong> can be applied<br />
to support the development of new technologies for food process<strong>in</strong>g <strong>in</strong> an early stage by identify<strong>in</strong>g potential<br />
hot spots early the development phase and by p<strong>in</strong>po<strong>in</strong>t<strong>in</strong>g suitable applications <strong>in</strong> relation to choice of<br />
<strong>in</strong>puts and production site.<br />
References<br />
Agterof, W.G. M., Bhatia R., Hofland G. W., 2005.Dehydration m<strong>et</strong>hod. Feyecon Development & Implementation<br />
December 2005: WO 2005/122776<br />
Hospido, A., Davis, J., Berl<strong>in</strong>, J. & Sonesson, U. 2010, <strong>LCA</strong> of novel products – Application to food process<strong>in</strong>g,<br />
Int. J. Life Cycle Assess. 15, 44–52<br />
Phoon, P.Y., Gomez Gal<strong>in</strong>do, F., Vicente, A., Dejmek, P., 2008. Pulsed electric field <strong>in</strong> comb<strong>in</strong>ation with<br />
vacuum impregnation with trehalose improves the freez<strong>in</strong>g tolerance of sp<strong>in</strong>ach leaves. J. <strong>Food</strong> Eng. 88,<br />
144-148<br />
Sonesson, U., Novel Process<strong>in</strong>g and Susta<strong>in</strong>ability – a perfect match or not? New <strong>Food</strong>, Issue 5, 2010<br />
895
GROUP 6, SESSION B: METHODS, TOOLS, DATABASES 8 th Int. Conference on <strong>LCA</strong> <strong>in</strong> the<br />
Agri-<strong>Food</strong> Sector, 1-4 Oct <strong>2012</strong><br />
Figure 1. The GWP (secondary y-axis) and the contribution of packag<strong>in</strong>g, transport and process<strong>in</strong>g <strong>in</strong> percentage<br />
to the GWP (primary y-axis) of post-farm fresh, frozen, freeze protected and CO2-dried strawberries.<br />
896
GROUP 6, SESSION B: METHODS, TOOLS, DATABASES 8 th Int. Conference on <strong>LCA</strong> <strong>in</strong> the<br />
Agri-<strong>Food</strong> Sector, 1-4 Oct <strong>2012</strong><br />
159. Ecodesign of plant-based build<strong>in</strong>g materials us<strong>in</strong>g <strong>LCA</strong>: crop<br />
production and primary transformation of hemp<br />
Andrianandra<strong>in</strong>a 1,* , Hayo van der Werf 2,3 , Anne Ventura 4 , Rachida Idir 5<br />
1 Université Nantes-Angers-Le Mans (LUNAM), Agence de l’Environnement <strong>et</strong> de la Maîtrise de l’Energie<br />
(ADEME), Institut Français Sciences <strong>et</strong> Technologies Transport Aménagement Réseaux (IFSTTAR), Département<br />
Matériaux, F-44341 Bouguenais, <strong>France</strong>, 2 INRA, UMR1069 Sol, Agro and hydroSystem, F-35000<br />
Rennes, <strong>France</strong>, 3 Agrocampus Ouest, F-35000 Rennes, <strong>France</strong>, 4 Université Nantes-Angers-Le Mans (LU-<br />
NAM), Institut Français Sciences <strong>et</strong> Technologies Transport Aménagement Réseaux (IFSTTAR), Département<br />
Matériaux, F-44341 Bouguenais, <strong>France</strong>, 5 Laboratoire Eco-Matériaux, CETE Ile de <strong>France</strong>, Paris,<br />
<strong>France</strong>, Correspond<strong>in</strong>g author. E-mail: andy.andrianandra<strong>in</strong>a@ifsttar.fr<br />
<strong>France</strong> has ambitious environmental goals regard<strong>in</strong>g climate change and energy use, <strong>in</strong> particular s<strong>in</strong>ce the<br />
so-called Grenelle de l’Environnement laws were passed. The build<strong>in</strong>g and hous<strong>in</strong>g sector is a major contributor<br />
to these impacts. New build<strong>in</strong>g materials, <strong>in</strong> particular thermal <strong>in</strong>sulators, us<strong>in</strong>g plants like hemp as a<br />
raw material as presented by Korjenic <strong>et</strong> al. (2011) and Kymala<strong>in</strong>en and Sjoberg (2008), have appeared <strong>in</strong><br />
the build<strong>in</strong>g materials mark<strong>et</strong> <strong>in</strong> recent years. These new products are often qualified as "green" low-impact<br />
materials because of their renewable orig<strong>in</strong>.<br />
A full life cycle assessment (<strong>LCA</strong>) of the material will be made for the follow<strong>in</strong>g stages: crop production,<br />
<strong>in</strong>dustrial transformations, use and end-of-life. The environmental assessment of these materials us<strong>in</strong>g <strong>LCA</strong><br />
is however complex, due to their multi functionality <strong>in</strong> build<strong>in</strong>gs, and the lack of data on major life cycle<br />
stages, such as their behaviour <strong>in</strong> the use phase.<br />
One of the ma<strong>in</strong> scientific challenges of this work is to develop and implement an <strong>LCA</strong> approach comb<strong>in</strong>ed<br />
with a sensitivity analysis, <strong>in</strong> order to quantify the contribution and variability of technological, environmental<br />
and m<strong>et</strong>hodological factors to life cycle impacts (Fig. 1). This <strong>in</strong>formation will then be used to ecodesign<br />
scenarios for the production, use, and end-of-life stages of plant-based build<strong>in</strong>g materials. The aim is<br />
to highlight the environmental hotspots of the life cycle of these materials and to re<strong>in</strong>force the robustness of<br />
results of the <strong>LCA</strong> results by test<strong>in</strong>g several scenarios.<br />
The present article is focused on the production step of hemp fibres and shives: the agricultural system and<br />
primary transformation. Several scenarios are compared. Various sources of variability are taken <strong>in</strong>to account:<br />
(i) technological variables such as the hemp cultivar, the various crop production modes (tillage <strong>in</strong>tensity,<br />
harvest of seed and fibre or fibre only), primary <strong>in</strong>dustrial processes; (ii) environmental variables such<br />
as the soil type and the climate, (iii) as well as <strong>LCA</strong> m<strong>et</strong>hodological variables such as models (emission factors<br />
vs. dynamic simulation models) used to estimate direct emissions (e.g. nitrate) dur<strong>in</strong>g crop production<br />
and allocation m<strong>et</strong>hods (based on mass, economic value or plant physiological mechanisms).<br />
The repercussions of the variability of these <strong>in</strong>put param<strong>et</strong>ers are exam<strong>in</strong>ed at the output i.e. the life cycle<br />
impact assessment. Us<strong>in</strong>g these results, eco-design scenarios for hemp fibres and shives production <strong>in</strong>clud<strong>in</strong>g<br />
crop production and primary transformation are proposed us<strong>in</strong>g processes which present <strong>in</strong>terest<strong>in</strong>g environmental<br />
potentials, and future improvements for each process are proposed.<br />
Acknowledgments: The authors acknowledge the f<strong>in</strong>ancial support of the French Agency for Environment<br />
and Energy Management (ADEME) and the Pays de la Loire region.<br />
References<br />
Korjenic, A., P<strong>et</strong>ranek, V., Zach, J., Hroudova, J., 2011. Development and performance evaluation of natural<br />
thermal-<strong>in</strong>sulation materials composed of renewable resources. Energy and Build<strong>in</strong>gs 43:2518-2523.<br />
Kymala<strong>in</strong>en, H.R., Sjoberg, A.M., 2008. Flax and hemp fibres as raw materials for thermal <strong>in</strong>sulations.<br />
Build<strong>in</strong>g and Environment 43:1261-1269.<br />
897
GROUP 6, SESSION B: METHODS, TOOLS, DATABASES 8 th Int. Conference on <strong>LCA</strong> <strong>in</strong> the<br />
Agri-<strong>Food</strong> Sector, 1-4 Oct <strong>2012</strong><br />
Figure 1. The life cycle of hemp-based build<strong>in</strong>g materials and major technological, environmental and m<strong>et</strong>hodological<br />
variables affect<strong>in</strong>g life cycle impacts. This paper focuses on crop production and primary transformation.<br />
898
GROUP 6, SESSION B: METHODS, TOOLS, DATABASES 8 th Int. Conference on <strong>LCA</strong> <strong>in</strong> the<br />
Agri-<strong>Food</strong> Sector, 1-4 Oct <strong>2012</strong><br />
160. Comparison of two milk prote<strong>in</strong> separation processes:<br />
chromatography vs. filtration<br />
Sophie Omont 1 , Daniel Froelich 2,* , François Thueux 3 , Murielle Rabiller-Baudry 4 , Didier Beudon 5 , Lionel<br />
Tregr<strong>et</strong> 6 , Christian Buson 7 , David Auffr<strong>et</strong> 7 , Geneviève Gésan-Guiziou 8,9<br />
1 ARTS, laboratoire MAPIE Chambéry, <strong>France</strong>, 2 Arts <strong>et</strong> Métiers ParisTech, laboratoire MAPIE, Chambéry,<br />
<strong>France</strong>, 3 ECOBILAN SA, Neuilly-sur-Se<strong>in</strong>e, <strong>France</strong>, 4 Université Rennes 1, UMR 6226 «Institut des sciences<br />
chimiques de Rennes» CNRS; Rennes, <strong>France</strong>, 5 SOREDAB SA, Boissière, <strong>France</strong>, 6 Novasep Process,<br />
Sa<strong>in</strong>t Maurice de Beynost, <strong>France</strong>, 7 GES, Noyal sur Vila<strong>in</strong>e, <strong>France</strong>, 8 INRA, UMR1253 STLO, Rennes,<br />
<strong>France</strong>, 9 Agrocampus Ouest, UMR1253 STLO Rennes, <strong>France</strong>, Correspond<strong>in</strong>g author. E-mail:<br />
daniel.froelich@ensam.eu<br />
Chromatography is the reference technology for prote<strong>in</strong> fractionation at a large scale when high purity and<br />
targ<strong>et</strong>ed functionality are required. Fractionation of prote<strong>in</strong>s by membrane operations such as micro- and<br />
ultrafiltration has however deserved a high attention over the last years, ma<strong>in</strong>ly due to their acceptable <strong>in</strong>vestment<br />
and operat<strong>in</strong>g costs. The aim of this study is to compare the environmental performances of two<br />
ways of fractionat<strong>in</strong>g whey prote<strong>in</strong>s (chromatography and membrane filtration) <strong>in</strong>to the two follow<strong>in</strong>g added<br />
value products: powder of α-lactalbum<strong>in</strong> with a 70% purity and powder of β-lactoglobul<strong>in</strong> with high purity<br />
(> 95%) and high foam<strong>in</strong>g properties. The study consists <strong>in</strong> a comparative attributional <strong>LCA</strong>, conducted<br />
with<strong>in</strong> the context of the ECOPROM project (Eco-design of membrane processes). Project carried out with<br />
the f<strong>in</strong>ancial support of the French national Research agency (ANR) under the Programme National de Recherche<br />
en Alimentation <strong>et</strong> Nutrition Huma<strong>in</strong>e (Project ANR-06-PNRA-015”).<br />
The whey comes from processes commonly performed <strong>in</strong> a classical dairy: it corresponds to the aqueous<br />
phase of milk, obta<strong>in</strong>ed after microfiltration of skimmed milk (Omont <strong>et</strong> al., 2010). The whey is concentrated<br />
before its transportation <strong>in</strong>to the upgrad<strong>in</strong>g plant where prote<strong>in</strong>s will be purified and dehydrated. The system<br />
studied <strong>in</strong>cludes the entire process implemented, from the entry of the whey <strong>in</strong>to the upgrad<strong>in</strong>g plant to the<br />
production of the two dehydrated fractions of purified prote<strong>in</strong>s. The system takes <strong>in</strong>to account all the<br />
process<strong>in</strong>g operations, the clean<strong>in</strong>g phases and the associated equipment. It excludes the facilities (build<strong>in</strong>gs,<br />
light<strong>in</strong>g, <strong>et</strong>c.). Its geographic scope is <strong>France</strong>. In this country, electricity is ma<strong>in</strong>ly produced by nuclear<br />
power and has a low CO2 impact. As membrane processes are high electricity consumers (Notarnicola <strong>et</strong> al.<br />
2008, European Commission 2006, Omont <strong>et</strong> al. 2010), a sensitivity analysis has been tested b<strong>et</strong>ween French<br />
and European electricity mixes. The <strong>in</strong>ventory of the foreground system was carried out with specific data<br />
given by the <strong>in</strong>dustrial partners of the project. Generic data derived from the eco<strong>in</strong>vent V2.2 data base. The<br />
impact assessment was calculated by the IMPACT 2002+ m<strong>et</strong>hod us<strong>in</strong>g the Simapro 7.2 software. A water<br />
flow <strong>in</strong>dicator was def<strong>in</strong>ed for the first level processes. The “chromatography system” and the “membrane<br />
filtration system” are described on the Table 1. The fractions outgo<strong>in</strong>g from the chromatography are more<br />
diluted. In order to generate the same concentrated α-lactalbum<strong>in</strong> and β-lactoglobul<strong>in</strong> fractions before<br />
dry<strong>in</strong>g, the ultrafiltration concentrations follow<strong>in</strong>g chromatography were resized.<br />
Dry<strong>in</strong>g steps consume the same amount of natural gas for the two processes. The environmental load of the<br />
"chromatography separation process" is ma<strong>in</strong>ly attributed to the ultrafiltration operations which consume<br />
more electricity due to the resize. The Chemical Oxygen Demand conta<strong>in</strong>ed <strong>in</strong> the non-regenerated br<strong>in</strong>e and<br />
<strong>in</strong> the column clean<strong>in</strong>g wastewater contributes to this load too, because their wastewater treatment consumes<br />
electricity. It is noticeable that sodium chloride is not decomposed by the wastewater treatment plant; its<br />
discharge <strong>in</strong>to the water is then not assessed by the m<strong>et</strong>hod IMPACT 2002+, which results <strong>in</strong> an underestimation<br />
of the environmental load of the chromatography process. The environmental impact of the<br />
"membrane filtration process" is ma<strong>in</strong>ly l<strong>in</strong>ked to the heat<strong>in</strong>g, the microfiltration and the ultrafiltration which<br />
consume natural gas, electricity and water due to diafiltration. As shown <strong>in</strong> Figures 1 & 2, the environmental<br />
load of chromatography tends to be higher than the membrane filtration. But the highest difference does not<br />
exceed 15%. The water consumption directly l<strong>in</strong>ked to the processes is 25% higher <strong>in</strong> case of chromatography.<br />
References<br />
European Commission, 2006. Intergrated Pollution Prevention and Control, reference Document on Best<br />
Available Techniques <strong>in</strong> the <strong>Food</strong>, Dr<strong>in</strong>k and Milk Industries<br />
899
GROUP 6, SESSION B: METHODS, TOOLS, DATABASES 8 th Int. Conference on <strong>LCA</strong> <strong>in</strong> the<br />
Agri-<strong>Food</strong> Sector, 1-4 Oct <strong>2012</strong><br />
Notarnicola B., Tassielli G., Renzulli P., S<strong>et</strong>tanni E., 2008. Life cycle assessment of a pilot plant for the must<br />
enrichment by reverse osmosis, Proc. of the 6 th Int. Conf. on <strong>LCA</strong> <strong>in</strong> the Agri-<strong>Food</strong> Sector, Zurich, Nov.<br />
12–14, 2008, pp.115-122.<br />
Omont S., Froelich D., Oss<strong>et</strong> P., Thueux F., Rabiller-Baudry M., Beudon D., Tregr<strong>et</strong> L., Buson C., Auffr<strong>et</strong><br />
D., Gésan-Guiziou G., Eco-design of cascade membrane processes for the preparation of milk prote<strong>in</strong><br />
fractions: Approach and <strong>LCA</strong> results, Proc. of the 7 th Int. Conf. on <strong>LCA</strong> <strong>in</strong> the Agri-<strong>Food</strong> Sector, Bari,<br />
Sept. 22-24, 2010, pp.197-202.<br />
Table 1. The two systems studied.<br />
Processes Chromatography system Membrane filtration system<br />
1- Separation of the two Heat<strong>in</strong>g to 10°C, Chromatography Heat<strong>in</strong>g to 50°C, Acidification, Dilu-<br />
prote<strong>in</strong>s<br />
separation, Br<strong>in</strong>e recycl<strong>in</strong>g (Nano<br />
filtration and reverse osmosis)<br />
tion, Microfiltration<br />
2- Concentration of α- Ultrafiltration of the α-lactalbum<strong>in</strong> Cool<strong>in</strong>g, Re-solubilisation, Ultrafiltralactalbum<strong>in</strong><br />
fraction<br />
tion, Cool<strong>in</strong>g, Ultrafiltration<br />
3- Concentration of β- Ultrafiltration of the β-lactoglobul<strong>in</strong> n/a<br />
lactoglobul<strong>in</strong><br />
fraction<br />
4- Powder formation Dry<strong>in</strong>g of the α-lactalbum<strong>in</strong>; Dry<strong>in</strong>g of<br />
the β lactoglobul<strong>in</strong><br />
n/a<br />
Figure 1. Chromatography and dry<strong>in</strong>g vs. Filtration and dry<strong>in</strong>g: LCIA with the French electricity mix, impact<br />
2002+ m<strong>et</strong>hod, SimaPro 7.2.<br />
Figure 2. Chromatography and dry<strong>in</strong>g vs. Filtration and dry<strong>in</strong>g: LCIA with the European electricity mix,<br />
impact 2002+ m<strong>et</strong>hod, SimaPro 7.2.<br />
900
GROUP 6, SESSION B: METHODS, TOOLS, DATABASES 8 th Int. Conference on <strong>LCA</strong> <strong>in</strong> the<br />
Agri-<strong>Food</strong> Sector, 1-4 Oct <strong>2012</strong><br />
161. Design of a model for estimat<strong>in</strong>g LCI data by means of the Farm<br />
Accountancy Data N<strong>et</strong>work. A citrus case study<br />
J. Ribal 1,* , N. Sanjuan 2 , G. Clemente 2 , M.L. Fenollosa 1<br />
1 Departamento de Economía y Ciencias Sociales. Universitat Politecnica de Valencia. Camí de Vera s/n<br />
46022 València. Spa<strong>in</strong>, 2 ASPA Group. <strong>Food</strong> Technology Department. Universitat Politecnica de Valencia.<br />
Camí de Vera s/n 46022 València. Spa<strong>in</strong>, Correspond<strong>in</strong>g author. E-mail: frarisan@esp.upv.es<br />
To carry out a Life Cycle Assessment means collect<strong>in</strong>g a large amount of data. In agricultural production<br />
systems gather<strong>in</strong>g of LCI data is specific for each study by survey<strong>in</strong>g farmers or build<strong>in</strong>g scenarios after<br />
<strong>in</strong>terviews with experts. Accord<strong>in</strong>g to Roches <strong>et</strong> al. (2010) different strategies are used to overcome the lack<br />
of relevant LCI and LCIA data: use of proxy data and generalisation, streaml<strong>in</strong>ed <strong>LCA</strong> and adaptation/extrapolation<br />
of <strong>in</strong>ventories. In this work we have used a proxy m<strong>et</strong>hodology <strong>in</strong> order to obta<strong>in</strong> a<br />
straightforward procedure so as to estimate the order of magnitude of <strong>in</strong>ventory data <strong>in</strong> agricultural systems<br />
The ma<strong>in</strong> source of the model is the Farm Accountancy Data N<strong>et</strong>work (FADN). FADN is an <strong>in</strong>strument for<br />
evaluat<strong>in</strong>g the <strong>in</strong>come of agricultural hold<strong>in</strong>gs and the impacts of the Common Agricultural Policy. It gathers<br />
accountancy data from farms, ma<strong>in</strong>ly production costs and revenues. In each country a structured cost she<strong>et</strong><br />
is available for each family crop, region and economic size. Each cost she<strong>et</strong> represents the average farm <strong>in</strong><br />
each group. Additionally our model uses specific data of each crop and geographical area. Fig. 1 shows the<br />
outl<strong>in</strong>e of the model.<br />
Thus the objective of the model is to estimate the LCI from the data of the FADN and then to carry out an<br />
impact assessment. To test and contrast the model a case study <strong>in</strong> orange citrus has been built compar<strong>in</strong>g the<br />
results with Ribal <strong>et</strong> al. (2010).<br />
This model would allow obta<strong>in</strong><strong>in</strong>g environmental impacts at a macro level <strong>in</strong> order to quantify eco-efficiency<br />
of crop production or to measure the value added <strong>in</strong>tegrat<strong>in</strong>g environmental impacts.<br />
References<br />
Ribal, J.; Sanjuan, N.; Clemente, G.; Fenollosa, M.L. 2009. Medición de la eco-eficiencia en procesos productivos<br />
en el sector agrario. Caso de estudio sobre producción de cítricos. Economía agraria y recursos<br />
naturales. 9, 125-148.<br />
Roches, A.; Nemececk, T.; Gaillard, G.;Plassman, K.; Sim, S.; K<strong>in</strong>g, H.; Milà i Canals, L. 2010. MEX-<br />
A<strong>LCA</strong>: a modular m<strong>et</strong>hod for the extrapolation of crop <strong>LCA</strong>. International Journal of Life Cycle Assessment.<br />
15,842-854.<br />
901
GROUP 6, SESSION B: METHODS, TOOLS, DATABASES 8 th Int. Conference on <strong>LCA</strong> <strong>in</strong> the<br />
Agri-<strong>Food</strong> Sector, 1-4 Oct <strong>2012</strong><br />
MODEL<br />
INPUTS<br />
MODEL<br />
OUTPUTS<br />
902<br />
LCIA<br />
Total cost of fertilisers<br />
Needs of N, P, K, Ca, S<br />
Fertiliser prices<br />
Fertiliser consumption<br />
NO -<br />
3 leach<strong>in</strong>g N2O emission<br />
NH3 emissions<br />
Abiotic depl<strong>et</strong>ion<br />
Global warm<strong>in</strong>g<br />
L<strong>in</strong>ear<br />
Programm<strong>in</strong>g<br />
Acidification<br />
Eutrophication<br />
Figure 1. Outl<strong>in</strong>e of the LCI-FADN proxy model.<br />
Fuel consumption<br />
Water<br />
consumption<br />
Ozone layer<br />
depl<strong>et</strong>ion<br />
Total cost of energy<br />
Mach<strong>in</strong>ery needs<br />
Electricity consumption<br />
Ecotoxicity<br />
Photochemical<br />
ozone creation
GROUP 6, SESSION B: METHODS, TOOLS, DATABASES 8 th Int. Conference on <strong>LCA</strong> <strong>in</strong> the<br />
Agri-<strong>Food</strong> Sector, 1-4 Oct <strong>2012</strong><br />
162. A simple model to assess nitrate leach<strong>in</strong>g from annual crops for<br />
life cycle assessment at different spatial scales<br />
Aurélie Tailleur * , Jean-Pierre Cohan, François Laurent, Afsaneh Lellahi<br />
ARVALIS – Institut du végétal, Service Agronomie Economie Environnement, Boigneville, F-91720,<br />
<strong>France</strong>, Correspond<strong>in</strong>g author. E-mail: a.tailleur@arvalis<strong>in</strong>stitutduveg<strong>et</strong>al.fr<br />
Life cycle assessment of food products show that nitrate leach<strong>in</strong>g dur<strong>in</strong>g crop production contributes significantly<br />
to their eutrophication potential (Xue X, Landis AE, 2010). Different dynamic field-scale models enable<br />
<strong>LCA</strong>-practitioners to estimate nitrate leach<strong>in</strong>g tak<strong>in</strong>g <strong>in</strong>to account d<strong>et</strong>ailed data about agricultural practices,<br />
soil type and climatic conditions. In the meantime, their use at a higher spatial scale (production area,<br />
region) requires collect<strong>in</strong>g a high number of data on a representative sample of fields. In this study, we estimate<br />
average potential nitrate emissions for twenty annual French crops, us<strong>in</strong>g an easy to perform m<strong>et</strong>hod<br />
based on the COMIFER (French Committee for the Development of Rational Fertilisation) m<strong>et</strong>hodology.<br />
This m<strong>et</strong>hodology was previously established from experimental results to diagnose nitrate leach<strong>in</strong>g risk at<br />
different scales (watershed, small agricultural region, production area) and allows to classify the risk consider<strong>in</strong>g<br />
agricultural practices (from a very low to a very high level <strong>in</strong> function of duration without N absorption,<br />
absorption capacity of the follow<strong>in</strong>g crops, slurry and dropp<strong>in</strong>gs spread<strong>in</strong>g <strong>in</strong> autumn, N <strong>in</strong>put from<br />
crop residues, Fig. 1) and some important site-specific related soil param<strong>et</strong>ers (water r<strong>et</strong>ention capacity, volume<br />
of dra<strong>in</strong>ed water and soil organic matter content). The nitrate leach<strong>in</strong>g amounts were attributed to each<br />
risk level (Fig. 2), based on results from the experimental database of the <strong>in</strong>stitute. Statistical data from the<br />
French M<strong>in</strong>istry of Agriculture about agricultural practices and our soil database were used to assess, at the<br />
region scale, percentages of crop area correspond<strong>in</strong>g to each risk level and then to estimate an average regional<br />
nitrate leach<strong>in</strong>g amount. Results will be compared with experimental results on particular sites and<br />
model results on watershed scale provided by bibliography.<br />
This work shows that we can easily use this m<strong>et</strong>hodology <strong>in</strong> the framework of <strong>LCA</strong> to provide potential nitrate<br />
emission estimations at a regional scale. While these estimations may be less precise at smaller scale<br />
than those from dynamic field-scale models as the comparison with experimental results could show it, it<br />
requires collect<strong>in</strong>g much less data and it takes <strong>in</strong>to account the most impact<strong>in</strong>g param<strong>et</strong>ers to differentiate<br />
contrast<strong>in</strong>g situations.<br />
Different emissions (N-gases, plant protection products) from crop production are very variable due to conditions<br />
and practices. To estimate precisely these emissions, <strong>LCA</strong>-practitioners have often to face with an important<br />
need for data. In the meantime, our work suggests that it is possible to establish structured and simplified<br />
m<strong>et</strong>hods that can quickly and pert<strong>in</strong>ently discrim<strong>in</strong>ate situations.<br />
This work contributes to the Agri-BALYSE project which is aimed at provid<strong>in</strong>g a Life Cycle Inventory<br />
(LCI) database for agricultural products. Average LCI representative of the French production will be supplied<br />
for around twenty annual crops.<br />
References<br />
COMIFER, 2001. Lessivage des nitrates en systèmes de cultures annuelles. Diagnostic du risque <strong>et</strong> proposition<br />
de gestion de l’<strong>in</strong>terculture. COMIFER Ed. 41 p.<br />
CORPEN, 1991. Interculture. CORPEN Ed. 40 p.<br />
Cohan J.P., Laurent F., Champolivier L., Duval R., 2011. Diagnostic du risque de lixiviation du nitrate <strong>et</strong><br />
leviers d’actions. In « Cultures <strong>in</strong>termédiaires: enjeux <strong>et</strong> conduite ». Ed. ARVALIS-CETIOM-ITB-ITL ;<br />
pp. 128-136.<br />
Xue X, Landis AE, 2010. Eutrophication Potential of <strong>Food</strong> Consumption Patterns. Environmental Science<br />
and Technology 2010, 44, 6450-6456.<br />
903
GROUP 6, SESSION B: METHODS, TOOLS, DATABASES 8 th Int. Conference on <strong>LCA</strong> <strong>in</strong> the<br />
Agri-<strong>Food</strong> Sector, 1-4 Oct <strong>2012</strong><br />
Figure 1. System of classify<strong>in</strong>g risk <strong>in</strong>herent to agricultural practices established on the basis of COMIFER’s<br />
m<strong>et</strong>hod and the database of the <strong>in</strong>stitute (1: very low risk, 5: very high risk), example of cereals.<br />
Figure 2. Nitrate leach<strong>in</strong>g amount (kg N-NO3 - /ha) regard<strong>in</strong>g risks (1: very low risk, 5: very high risk) <strong>in</strong>herent<br />
to practices (Fig. 1) and to soil param<strong>et</strong>ers (water r<strong>et</strong>ention capacity, volume of dra<strong>in</strong>ed water and soil<br />
organic matter content).<br />
904
GROUP 6, SESSION B: METHODS, TOOLS, DATABASES 8 th Int. Conference on <strong>LCA</strong> <strong>in</strong> the<br />
Agri-<strong>Food</strong> Sector, 1-4 Oct <strong>2012</strong><br />
163. Life cycle susta<strong>in</strong>ability assessment of fertilis<strong>in</strong>g options<br />
Julia Martínez-Blanco 1,* , Annekatr<strong>in</strong> Lehmann 2,3 , Pere Muñoz 4 , Assumpció Antón 5 , Marzia Traverso 2 , Joan<br />
Rieradevall 1,6 , Matthias F<strong>in</strong>kbe<strong>in</strong>er 2<br />
1 Institute of Environmental Science and Technology (ICTA), Universitat Autònoma de Barcelona (UAB),<br />
08193 Bellaterra, Barcelona, Spa<strong>in</strong>, 2 Department of Environmental Technology, Technische Universität<br />
Berl<strong>in</strong>, Office Z1, 10623 Berl<strong>in</strong>, Germany, 3 Institute for Technology Assessment and Systems Analysis,<br />
Karlsruhe Institute for Technology, 76021 Karlsruhe, Germany, 4 Institute of Research and Technology <strong>in</strong><br />
Agrifood Sector (IRTA), Environmental Horticulture, 08348 Cabrils, Barcelona, Spa<strong>in</strong>, 5 Departament<br />
d’Eng<strong>in</strong>yeria Química, Universitat Rovira i Virgili (URV), 43007 Tarragona, Spa<strong>in</strong>, 6 Chemical Eng<strong>in</strong>eer<strong>in</strong>g<br />
Department, Universitat Autònoma de Barcelona (UAB), 08193 Bellaterra, Barcelona, Spa<strong>in</strong>, Correspond<strong>in</strong>g<br />
author. E-mail: julia.mart<strong>in</strong>ez@uab.cat<br />
Susta<strong>in</strong>ability describes a development that me<strong>et</strong>s the needs of the present without compromis<strong>in</strong>g the ability<br />
of future generations to me<strong>et</strong> their own needs (Brutland report, 1987). It comprises three “pillars” – environment,<br />
economy and soci<strong>et</strong>y– which are addressed by Life Cycle Susta<strong>in</strong>ability Assessment, LCSA,<br />
(F<strong>in</strong>kbe<strong>in</strong>er <strong>et</strong> al., 2010). The study aims to overview the three dimensions related to m<strong>in</strong>eral fertilisers and<br />
compost, from a life cycle perspective and consider<strong>in</strong>g a real case study –the tomato production <strong>in</strong> the Mediterranean<br />
region (Martínez-Blanco <strong>et</strong> al., 2011).<br />
The unit of available nitrogen <strong>in</strong> the short-medium term (1kg N) from the applied fertilisers to the tomato<br />
crops is the functional unit considered here. Fig. 1 shows the system boundaries of the two systems compared:<br />
compost and two m<strong>in</strong>eral fertilisers (nitric acid and potassium nitrate). For the present study, fertiliser<br />
production and transport are taken <strong>in</strong>to account as well as those stages of the cultivation be<strong>in</strong>g different b<strong>et</strong>ween<br />
the two fertilis<strong>in</strong>g options, i.e. fertirrigation emissions and application works.<br />
Data sources for the environmental and the economic assessment are ma<strong>in</strong>ly referred <strong>in</strong> previous works from<br />
the authors, whereas social evaluation uses sector data from Social Hotspot DataBase, Gabi 5, governmental<br />
and non-governmental organisations (such as ILO and OECD), corporate websites, susta<strong>in</strong>ability reports,<br />
national statistics and literature.<br />
Environmental Life Cycle Assessment (<strong>LCA</strong>) is follow<strong>in</strong>g the obligatory classification and characterisation<br />
phases def<strong>in</strong>ed by the ISO 14044. Ten mid-po<strong>in</strong>t impact categories are considered as well as an energy flow<br />
<strong>in</strong>dicator. For Life Cycle cost<strong>in</strong>g (LCC) we select three <strong>in</strong>ternal costs, which are <strong>in</strong>volv<strong>in</strong>g all the cha<strong>in</strong> process<br />
costs. Regard<strong>in</strong>g Social Life Cycle Assessment (S<strong>LCA</strong>), upstream processes and ma<strong>in</strong>stream processes<br />
of the production cha<strong>in</strong> are taken <strong>in</strong>to account. For the former, the <strong>in</strong>dicators are referred to the stakeholder<br />
“worker”, “local community”, “soci<strong>et</strong>y” and “consumer” – as proposed <strong>in</strong> the S-<strong>LCA</strong> guidel<strong>in</strong>es (UNEP,<br />
2009) – as well as a specific stakeholder related to the citizens collect<strong>in</strong>g the waste. Social impacts related to<br />
upstream processes have so far not been considered <strong>in</strong> the few exist<strong>in</strong>g S<strong>LCA</strong> case studies. In our study some<br />
social <strong>in</strong>dicators address<strong>in</strong>g the stakeholder “worker” are <strong>in</strong>cluded for the upstream processes <strong>in</strong> the life cycle<br />
of compost and m<strong>in</strong>eral fertiliser production (such as transport, energy, water, <strong>et</strong>c.). The number of work<strong>in</strong>g<br />
time which is spent on each unit process is used to score the relevance of each process <strong>in</strong> the product<br />
cha<strong>in</strong>.<br />
Life Cycle Susta<strong>in</strong>ability Dashboard (LCSD) – an adaptation of the Dashboard of Susta<strong>in</strong>ability, developed<br />
to assess environmental, economic and social life cycle impacts of a product (F<strong>in</strong>kbe<strong>in</strong>er <strong>et</strong> al., 2010) - was<br />
here selected to present and to compare the susta<strong>in</strong>ability performance of the case studies. LCSD is us<strong>in</strong>g<br />
software that allows represent a certa<strong>in</strong> number of <strong>in</strong>dicators for <strong>LCA</strong>, LCC and S<strong>LCA</strong>, and their values, <strong>in</strong><br />
order to be able to <strong>in</strong>terpr<strong>et</strong> the results.<br />
References<br />
F<strong>in</strong>kbe<strong>in</strong>er, M., Schau, E.M., Lehmann, A., Traverso, M., 2010. Towards life cycle susta<strong>in</strong>ability assessment.<br />
Susta<strong>in</strong>ability 2, 3309-3322.<br />
Martínez-Blanco, J., Muñoz, P., Antón, A., Rieradevall, R., 2011. Assessment of tomato Mediterranean production<br />
<strong>in</strong> open-field and <strong>in</strong> standard multi-tunnel greenhouse with compost or m<strong>in</strong>eral fertilisers from an<br />
agricultural and environmental standpo<strong>in</strong>t. J. Clean. Prod. 19, 985-997.<br />
UNEP, 2009. Guidel<strong>in</strong>es for Social Life Cycle Assessment of Products, UNEP-SETAC Life-Cycle Initiative,<br />
Paris.<br />
905
GROUP 6, SESSION B: METHODS, TOOLS, DATABASES 8 th Int. Conference on <strong>LCA</strong> <strong>in</strong> the<br />
Agri-<strong>Food</strong> Sector, 1-4 Oct <strong>2012</strong><br />
17<br />
Figure 1. Compost and m<strong>in</strong>eral fertiliser system boundaries for the three <strong>LCA</strong> approaches.<br />
a Dotted arrows are <strong>in</strong>volv<strong>in</strong>g transport processes/companies/costs.<br />
b Capital goods <strong>in</strong>clude mach<strong>in</strong>ery, build<strong>in</strong>gs and <strong>in</strong>frastructures.<br />
c For fertiliser production, emissions are <strong>in</strong>cluded <strong>in</strong> costs as technologies to reduce emissions, while no real<br />
money flows are occurr<strong>in</strong>g for emissions produced dur<strong>in</strong>g fertiliser application.<br />
d Sylvite is only <strong>in</strong>cluded for KNO3 production. HFO, Heavy fuel oil, HDPE, high density poly<strong>et</strong>hylene.<br />
906
GROUP 6, SESSION B: METHODS, TOOLS, DATABASES 8 th Int. Conference on <strong>LCA</strong> <strong>in</strong> the<br />
Agri-<strong>Food</strong> Sector, 1-4 Oct <strong>2012</strong><br />
164. G<strong>et</strong> SET, an <strong>in</strong>novative holistic approach to implement more<br />
susta<strong>in</strong>able nutrition<br />
Georg Schöner * , Christoph Günther, Cristian Barcan, Krist<strong>in</strong>a Gräper<br />
Global SET Initiative Nutrition & Health, BASF, G-ENL/MS, Correspond<strong>in</strong>g author. E-mail:<br />
georg.schoener@basf.com<br />
Feed<strong>in</strong>g the world 2050 and beyond is a challenge particularly, when it comes to susta<strong>in</strong>able nutrition. It is<br />
now time for the <strong>in</strong>dustry to optimise the susta<strong>in</strong>ability of their products step by step. To succeed, it is necessary<br />
to have a holistic, “cradle-to-grave” approach which <strong>in</strong>volves stakeholders throughout the entire value<br />
cha<strong>in</strong> while focus<strong>in</strong>g on consumer goods. This paper shows how applied science and value cha<strong>in</strong> management<br />
through BASF’s SET Initiative me<strong>et</strong>s those needs.<br />
In pr<strong>in</strong>ciple, today SET is built on three pillars:<br />
1. Hot Spot Analysis, a qualitative assessment tool, which helps identify major concerns and perceptions<br />
related to the susta<strong>in</strong>ability of a product based on structured stakeholder <strong>in</strong>terviews and relevant<br />
publications deal<strong>in</strong>g with the entire value cha<strong>in</strong>.<br />
2. Eco-Efficiency Analysis, a life cycle assessment approach for measur<strong>in</strong>g a product’s environmental<br />
impact from cradle to grave. It <strong>in</strong>cludes at least 11 impact categories, such as greenhouse gas emissions,<br />
resource consumption, photochemical ozone formation or land use and transformation. Tradeoffs<br />
b<strong>et</strong>ween different impact categories can only be overcome by assess<strong>in</strong>g all possible param<strong>et</strong>ers,<br />
not only one aspect such as global warm<strong>in</strong>g potential, reflected with a product’s carbon footpr<strong>in</strong>t.<br />
The identified impact is then contrasted with the f<strong>in</strong>al product’s economic value and reveals the parts<br />
of the value cha<strong>in</strong> that respond most sensitively to greater susta<strong>in</strong>ability.<br />
3. A whole cha<strong>in</strong> traceability program that helps companies to make their supply cha<strong>in</strong> more transparent<br />
– a prerequisite for manag<strong>in</strong>g susta<strong>in</strong>ability. Traceability not only helps trace all of the components<br />
that lead up to a f<strong>in</strong>al product through the value cha<strong>in</strong>, but also – and more importantly –<br />
makes it possible to follow a tailored plan of action and track the progress made over time.<br />
Multiple projects have been carried out <strong>in</strong> the food- and feed <strong>in</strong>dustry, which show how current and future<br />
susta<strong>in</strong>ability opportunities can be leveraged for everybody’s benefit. Examples for the three pillars mentioned<br />
above are presented from studies on the susta<strong>in</strong>ability optimisation <strong>in</strong> feed/food value cha<strong>in</strong>s. All<br />
stages of a life cycle are considered, for example for the production of pork: all aspects of the feed production<br />
phase, the animal breed<strong>in</strong>g/fatten<strong>in</strong>g, meat/carcass process<strong>in</strong>g, distribution, r<strong>et</strong>ail display, as well as<br />
consumption and disposal. Us<strong>in</strong>g BASF’s SET Initiative, the dynamic and different perceptions of several<br />
supply cha<strong>in</strong> actors are understood. The <strong>in</strong>volvement of suppliers and customers up and down the value<br />
cha<strong>in</strong> enables the producers to counter current hot spots and to drive towards more susta<strong>in</strong>able nutrition<br />
products. The value cha<strong>in</strong> partners and customers can benefit through a proof of susta<strong>in</strong>able practices, susta<strong>in</strong>ability<br />
optimisation and product or brand reposition<strong>in</strong>g and differentiation <strong>in</strong> the mark<strong>et</strong>. SET also identifies<br />
potential for product <strong>in</strong>novation and generates additional brand equity. Along the way, this value add<strong>in</strong>g<br />
partnership program enables the customers to ga<strong>in</strong> a higher reputation <strong>in</strong> the mark<strong>et</strong> as a susta<strong>in</strong>able act<strong>in</strong>g<br />
bus<strong>in</strong>ess.<br />
907
GROUP 6, SESSION B: METHODS, TOOLS, DATABASES 8 th Int. Conference on <strong>LCA</strong> <strong>in</strong> the<br />
Agri-<strong>Food</strong> Sector, 1-4 Oct <strong>2012</strong><br />
908<br />
165. Subcategory assessment m<strong>et</strong>hod: stakeholder workers<br />
Paola Kar<strong>in</strong>a Sánchez Ramirez 1,* , Luigia P<strong>et</strong>ti 1 , Cássia Maria Lie Ugaya 2<br />
1 Department of Economic Studies, Università degli Studi "G. D'Annunzio", Pescara, Italy, 2 Technological<br />
Federal University of Parana, Curitiba, Brazil, * Correspond<strong>in</strong>g author. E-mail: p.sanchez@unich.it<br />
Social Life Cycle Assessment (S-<strong>LCA</strong>) is a technique to evaluate potential positive and negative impacts<br />
along the life cycle of a product (UNEP and SETAC 2009). S-<strong>LCA</strong> follows four phases, similarly to an (environmental)<br />
<strong>LCA</strong>: goal and scope def<strong>in</strong>ition, <strong>in</strong>ventory analysis, impact assessment and <strong>in</strong>terpr<strong>et</strong>ation; nevertheless<br />
it requires adaptations (Grießhammer, Benoît <strong>et</strong> al. 2006). Go<strong>in</strong>g from data to impact assessment <strong>in</strong><br />
S-<strong>LCA</strong> is still a challenge. UNEP and SETAC (2009) have presented a contribution by provid<strong>in</strong>g a list of 31<br />
subcategories related to 5 stakeholders (workers, consumers, local community, soci<strong>et</strong>y and value cha<strong>in</strong> actors)<br />
that can be either aggregated to impact categories or modelled, through pathways, to endpo<strong>in</strong>ts. Thereafter,<br />
m<strong>et</strong>hodological she<strong>et</strong>s for each of the subcategories were elaborated, <strong>in</strong>clud<strong>in</strong>g def<strong>in</strong>ition, contribution<br />
for the susta<strong>in</strong>able development, unit and even possible data sources (UNEP and SETAC 2010). Some Life<br />
Cycle Impact Assessment m<strong>et</strong>hods, to subcategory level, were also proposed (Dreyer, Hauschild and Schierbeck<br />
(2006); Ciroth and Franze (2011)). The first one is limited to worker stakeholder and the second is not<br />
clear how to evaluate from data to the subcategory and how to aggregate subcategories <strong>in</strong>to impact categories.<br />
The aim of this study is to propose a Subcategory Assessment M<strong>et</strong>hod (SAM) to decrease the variability<br />
of the evaluation of subcategories <strong>in</strong> S-<strong>LCA</strong> studies. A proposal for stakeholder worker and a case study to<br />
test it are presented. SAM <strong>in</strong>cludes 8 subcategories (freedom of association and collective barga<strong>in</strong><strong>in</strong>g, child<br />
labor, fair salary, work<strong>in</strong>g hours, forced labour, equal opportunities/discrim<strong>in</strong>ation, health and saf<strong>et</strong>y, social<br />
benefits/social security) from the stakeholder worker of UNEP and SETAC (2009). SAM enables the analysis<br />
of the organisation <strong>in</strong> four classes (A, B, C and D) for each subcategory. Fulfill<strong>in</strong>g Class A means that the<br />
organisation shows a proactive behaviour compared to the basic requirement. The basic requirement is def<strong>in</strong>ed<br />
for each subcategory, based on International Agreements. Class B means that the organisation follows<br />
the basic requirement. Classes C and D identifies the organisation which does not me<strong>et</strong> the basic requirement<br />
and are differentiated due to generic data which provides background <strong>in</strong>formation concern<strong>in</strong>g the possibility<br />
of the environment to have a positive outlook to social issues. SAM was applied <strong>in</strong> a small w<strong>in</strong>ery to evaluate<br />
stakeholder worker. The case study showed that it was possible to collect data and evaluate a company<br />
us<strong>in</strong>g SAM. Results show that S-<strong>LCA</strong> is as time and work demand<strong>in</strong>g as (environmental) <strong>LCA</strong>, s<strong>in</strong>ce the<br />
issues are specific and change from company to company, sector to sector, and region to region. SAM may<br />
also be implemented for the whole product life cycle. Future development of SAM will <strong>in</strong>clude the other<br />
subcategories, adapt<strong>in</strong>g the basic requirement for each one.<br />
References<br />
Ciroth, A., Franze, J., 2011. <strong>LCA</strong> of an Ecolabeled Notebook – Consideration of Social and Environmental<br />
Impacts along the entire Life Cycle, Berl<strong>in</strong>.<br />
Dreyer, L.C, Hauschild, M., Schierbeck ,J., 2006. A framework for social life cycle impact assessment. Int J<br />
Life Cycle Assess. 11, 2, 88–97.<br />
Grießhammer, R., C. Benoît, <strong>et</strong> al., 2006. Feasibility study: <strong>in</strong>tegration of social aspects <strong>in</strong>to <strong>LCA</strong>. Available<br />
from http://www.saiplatform.org/uploads/Library/UNEP-SETACLifeCycleInitiativeTFonSocialIssues-<br />
FeasibilityStudy.pdf Last visited on 13/01/<strong>2012</strong>.<br />
UNEP and SETAC, 2009. Guidel<strong>in</strong>es for social life cycle assessment of products, United Nations Environment<br />
Program, Paris SETAC Life Cycle Initiative United Nations Environment Programme.<br />
UNEP and SETAC, 2010. Social Life Cycle Assessment: M<strong>et</strong>hodological She<strong>et</strong>s of Sub-Categories of Impact<br />
for Social <strong>LCA</strong>. Available from http://fr1.estis.n<strong>et</strong>/builder/<strong>in</strong>cludes/page.asp?site=lc<strong>in</strong>it&page_id=<br />
D45A9A8F-10FA-4501-BF93-FB9AEAE4D163 Last visited on 23/01/<strong>2012</strong>
GROUP 6, SESSION B: METHODS, TOOLS, DATABASES 8 th Int. Conference on <strong>LCA</strong> <strong>in</strong> the<br />
Agri-<strong>Food</strong> Sector, 1-4 Oct <strong>2012</strong><br />
166. Supply-demand balances of food and energy <strong>in</strong> mounta<strong>in</strong>ous<br />
rural areas to help ensure regional susta<strong>in</strong>ability<br />
Kazutoshi Tsuda 1,* , Keishiro Hara 2 , Mich<strong>in</strong>ori Uwasu 2<br />
1 Creative Design Studio on Technology, Osaka University, Osaka, Japan, 2 Center for Environmental Innovation<br />
Design for Susta<strong>in</strong>ability, Osaka University, Osaka, Japan, Correspond<strong>in</strong>g author. E-mail: tsudakazutoshi@lce.mech.eng.osaka-u.ac.jp<br />
Regional susta<strong>in</strong>ability with resilience is becom<strong>in</strong>g an important concept. In particular, secur<strong>in</strong>g potential of<br />
self supply for food and energy with<strong>in</strong> local communities, tog<strong>et</strong>her with local <strong>in</strong>dependence, is one of the<br />
essential conditions for realis<strong>in</strong>g regional susta<strong>in</strong>ability. In order to discuss such potential of self supply for<br />
food and energy, re-valu<strong>in</strong>g local natural resources and enhanc<strong>in</strong>g a proper balance b<strong>et</strong>ween supply and demand<br />
of renewable resources with<strong>in</strong> a region is of critical importance. However, studies which address this<br />
aspect are very scant. In addition, <strong>in</strong> an attempt to achiev<strong>in</strong>g regional susta<strong>in</strong>ability, it is essential to provide<br />
<strong>in</strong>formation useful and practical enough for mak<strong>in</strong>g action plans or policy mak<strong>in</strong>g for local governments. For<br />
this purpose, it is required to understand the causal relations among susta<strong>in</strong>ability <strong>in</strong>dicators and materials<br />
and energy flow with<strong>in</strong> a certa<strong>in</strong> boundary, <strong>in</strong> addition to the construction of database.<br />
In Japan, hilly and mounta<strong>in</strong>ous areas are approximately three-quarters of the total land areas, and cover the<br />
forty percent of the total cultivated areas. These areas hold the key to regional susta<strong>in</strong>ability <strong>in</strong> Japan. Sh<strong>in</strong>jo<br />
village is located <strong>in</strong> the mounta<strong>in</strong>ous area <strong>in</strong> western Japan. The village is a unique municipality try<strong>in</strong>g to<br />
enhance self-reliance <strong>in</strong> terms of food, energy and f<strong>in</strong>ancial conditions, aim<strong>in</strong>g to avoid a possible merger<br />
with other bigger cities. Unique visions and proper measures are needed for the village to keep the selfreliance<br />
viable and to pursue regional susta<strong>in</strong>ability especially at a time when the labor force is shr<strong>in</strong>k<strong>in</strong>g due<br />
to the ag<strong>in</strong>g population and resultant decl<strong>in</strong><strong>in</strong>g local economy.<br />
In this study, we aim to discuss the outlooks of self-reliance level for Sh<strong>in</strong>jo village from the viewpo<strong>in</strong>t of<br />
supply and demand of food and renewable energy, especially biomass energy such as firewood and<br />
wood/rice husk charcoal. We first looked <strong>in</strong>to geographical data and exam<strong>in</strong>ed ecological conditions and<br />
local landscapes, which serve as the basis for evaluat<strong>in</strong>g local natural resources. We then developed <strong>in</strong>ventory<br />
data of food and renewable energy available with<strong>in</strong> the region by apply<strong>in</strong>g material flow analysis and<br />
life cycle assessment m<strong>et</strong>hodology. Based upon the <strong>in</strong>formation we demonstrated the assessment of the regional<br />
susta<strong>in</strong>ability from the viewpo<strong>in</strong>t of demand and supply balance for food and energy as well as selfreliance<br />
of economic conditions.<br />
Figure 1 illustrates the natural resources flow <strong>in</strong> Sh<strong>in</strong>jo village. The flow chart consists of forestry, agriculture,<br />
livelihood, and compost<strong>in</strong>g process. We found that Sh<strong>in</strong>jo village has sufficient food production while<br />
it heavily relies on energy <strong>in</strong>flow for fossil fuels. On the other hand, the village has large supply potentials<br />
for renewable materials and energy. We proposed <strong>in</strong>stitutional and technical options as well as policy measures,<br />
which utilise these rich resources, to further enhance regional susta<strong>in</strong>ability of the village.<br />
We conclude this paper by propos<strong>in</strong>g the follow<strong>in</strong>g as key research questions for this regional susta<strong>in</strong>ability:<br />
conduct<strong>in</strong>g assessment of ecosystem services <strong>in</strong> a rigorous and comprehensive way, which <strong>in</strong>cludes a compl<strong>et</strong>ion<br />
of a material flow chart for the entire region, and explor<strong>in</strong>g the ways to utilise those ecosystem services<br />
along with the establishment of systems to mobilise human resources, money, and materials b<strong>et</strong>ween<br />
the rural and urban areas.<br />
References<br />
Tsuda, K., Nakakubo, T., Umeda, Y., Morioka, T., 2011. Potential account<strong>in</strong>g of regional urban-rural partnership<br />
for construct<strong>in</strong>g resource-circulat<strong>in</strong>g systems, <strong>in</strong>: Morioka, T., Hanaki, K., Moriguchi, Y. (Eds),<br />
Establish<strong>in</strong>g a resource-circulat<strong>in</strong>g soci<strong>et</strong>y <strong>in</strong> Asia: Challenges and opportunities. United Nations University<br />
Press, Tokyo, pp. 184-200.<br />
909
GROUP 6, SESSION B: METHODS, TOOLS, DATABASES 8 th Int. Conference on <strong>LCA</strong> <strong>in</strong> the<br />
Agri-<strong>Food</strong> Sector, 1-4 Oct <strong>2012</strong><br />
energy<br />
food<br />
Figure 1. Natural-resource flows of Sh<strong>in</strong>jo village, Okayama, Japan.<br />
910<br />
INPUT<br />
chemicalfertilizer<br />
10 N<br />
purchasedfeed<br />
1020 TDN<br />
forestry<br />
natural forests<br />
(2,344 ha)<br />
planted forests<br />
(3,118 ha)<br />
crop<br />
field<br />
(201 ha)<br />
* breakdown of veg<strong>et</strong>ables:<br />
daikon radish 27<br />
nappa cabbages 16<br />
tomatoes 15<br />
naganegi onions 7<br />
eggplants 7<br />
cabbages 7<br />
potatoes 7<br />
cucumbers 4<br />
onions 4<br />
sp<strong>in</strong>ach 2<br />
green peppers 1<br />
carrots 1<br />
manure 900<br />
103<br />
paddy rice 507 (<strong>in</strong>cl. Himenomochi 224)<br />
soy beans 3, azuki beans 1<br />
veg<strong>et</strong>ables * 98<br />
flower<strong>in</strong>g plants<br />
fodder<br />
compost<strong>in</strong>g<br />
ECONOMY<br />
wood (4,140 m 3 ) 1,620<br />
system boundary raw materials /<br />
products<br />
pasture 262<br />
field corn 240<br />
sorghum 51<br />
straws<br />
feed<br />
88 TDN<br />
sawdust 1,000<br />
cattle faeces 2,500<br />
by-products /<br />
environmental loads<br />
livestock<br />
energy<br />
livelihood<br />
human be<strong>in</strong>gs<br />
(957 people)<br />
dairy<br />
(X head)<br />
beef<br />
(180 head)<br />
unit: tons<br />
nightsoil<br />
(440 kl)<br />
milk 1,030<br />
meat 29.8<br />
(70 head)<br />
(160 head)<br />
OUTPUT<br />
solid residue<br />
25<br />
waste 164<br />
(<strong>in</strong>cl. food waste)<br />
cattle faces<br />
CO2, CH4, N2O, NH3…<br />
(underl<strong>in</strong>ed: estimated by authors)
GROUP 6, SESSION B: METHODS, TOOLS, DATABASES 8 th Int. Conference on <strong>LCA</strong> <strong>in</strong> the<br />
Agri-<strong>Food</strong> Sector, 1-4 Oct <strong>2012</strong><br />
167. AgBalance – holistic susta<strong>in</strong>ability assessment of agricultural<br />
production<br />
Jan Schöneboom 1,* , P<strong>et</strong>er Sal<strong>in</strong>g 1 , Richard van Gelder 1 , Markus Frank 2 , Dirk Voeste 2 , Martijn Gipmans 3<br />
1 Susta<strong>in</strong>ability Centre, BASF SE, GU/NE – Z7, 67056 Ludwigshafen, Germany, 2 Crop Protection Division,<br />
BASF SE, Limburgerhof, Germany, 3 BASF Plant Science Tegeler Weg 33, 10589, Berl<strong>in</strong>, Germany, Correspond<strong>in</strong>g<br />
author. E-mail: jan.schoeneboom@basf.com<br />
Life Cycle Assessment (<strong>LCA</strong>) and approaches based thereon, e.g., Eco-Efficiency Analysis and SEEBAL-<br />
ANCE, have proven useful tools for quantitative susta<strong>in</strong>ability assessment along value cha<strong>in</strong>s and across<br />
<strong>in</strong>dustry sectors, particularly for <strong>in</strong>dustrial manufactur<strong>in</strong>g and consumption. While these approaches are<br />
commonly also applied to assess the susta<strong>in</strong>ability of agricultural products or production systems, there is a<br />
need for further development <strong>in</strong> order to adequately evaluate specific impacts of agricultural activity, particularly<br />
relat<strong>in</strong>g to biodiversity and soil quality.<br />
Here<strong>in</strong>, we present a new m<strong>et</strong>hod for susta<strong>in</strong>ability assessment <strong>in</strong> agriculture, named AgBalance. Based on<br />
the environmental impacts and life cycle costs assessed <strong>in</strong> BASF’s Eco-Efficiency Analysis, and the social<br />
impact <strong>in</strong>dicators <strong>in</strong> SEEBALANCE, AgBalance additionally serves to record and evaluate a range of specific<br />
agricultural management <strong>in</strong>dicators. AgBalance thus comb<strong>in</strong>es environmental <strong>LCA</strong>, social <strong>LCA</strong> and life<br />
cycle costs with ecological, economic and social susta<strong>in</strong>ability <strong>in</strong>dicators related to agricultural production,<br />
which are generalised to vary<strong>in</strong>g spatial scales. Its flexibility allows consideration of variable upstream and<br />
downstream processes, <strong>in</strong>cludes all three dimensions of susta<strong>in</strong>ability <strong>in</strong> an <strong>in</strong>tegrated approach, and is suitable<br />
for application <strong>in</strong> different regions.<br />
AgBalance comprises up to 70 <strong>in</strong>dicators, based on a significantly larger number of <strong>in</strong>put data and param<strong>et</strong>ers.<br />
The <strong>in</strong>dicators show different impacts and are grouped <strong>in</strong>to 16 categories. They are then aggregated <strong>in</strong><br />
the three dimensions environment, soci<strong>et</strong>y and economy. Specific impacts on biodiversity <strong>in</strong> agricultural<br />
areas are assessed by a s<strong>et</strong> of <strong>in</strong>dicators: biodiversity state/endangered species, protected area coverage, agrienvironmental<br />
schemes, pesticide eco-toxicity potential, nitrogen surplus, <strong>in</strong>termix<strong>in</strong>g potential, crop rotation<br />
elements, and farm<strong>in</strong>g <strong>in</strong>tensity. Impacts on soil quality <strong>in</strong> agricultural areas evaluate the <strong>in</strong>dicators nutrient<br />
balances, soil organic matter balance, compaction potential and erosion potential. Social <strong>in</strong>dicators <strong>in</strong>clude,<br />
<strong>in</strong> addition to those covered <strong>in</strong> SEEBALANCE, soci<strong>et</strong>al representation of agriculture, observation of food<br />
law requirements, access to land, trade balances and fair trade benefits for producers. Economic <strong>in</strong>dicators<br />
cover farm profitability and productivity, <strong>in</strong> addition to life-cycle costs.<br />
Both, d<strong>et</strong>ailed <strong>in</strong>-depth results of <strong>in</strong>dividual impact <strong>in</strong>dicators, as well as aggregated results and a s<strong>in</strong>gle susta<strong>in</strong>ability<br />
evaluation score are output of AgBalance. Sensitivity analyses can be employed to study the robustness<br />
of the model results, and to <strong>in</strong>vestigate trade-offs or the response to external <strong>in</strong>fluences. Scenario<br />
Analyses can model different situations by simulat<strong>in</strong>g new s<strong>et</strong>s of <strong>in</strong>puts followed by an assessment of improvement<br />
potentials of the analysed system. AgBalance is useful for assess<strong>in</strong>g and manag<strong>in</strong>g susta<strong>in</strong>able<br />
development <strong>in</strong> agriculture for farmers, bus<strong>in</strong>ess <strong>in</strong> the food value cha<strong>in</strong>, decision mak<strong>in</strong>g and policy mak<strong>in</strong>g<br />
and for public communication.<br />
References<br />
Sal<strong>in</strong>g P., Kicherer A., Dittrich-Kraemer B., Wittl<strong>in</strong>ger R., Zombik W., Schmidt I., Schrott W., Schmidt S.,<br />
2002. Eco-efficiency Analysis by BASF: The M<strong>et</strong>hod. Int. J. Life Cyle Assess. 7, 203-218.<br />
Kölsch, D., Sal<strong>in</strong>g P., Kicherer A., Grosse-Sommer A., Schmidt I, 2008. How to measure social impacts? A<br />
socio-eco-efficiency analysis by the SEEBALANCE® m<strong>et</strong>hod. Int. J. Susta<strong>in</strong>. Dev. 11, 1 – 23.<br />
Schöneboom J.C., Sal<strong>in</strong>g P., van Gelder R. <strong>2012</strong>. AgBalance – holistic assessment of susta<strong>in</strong>ability <strong>in</strong> agriculture.<br />
Submitted to Int. J. Life Cycle Assess.<br />
911
GROUP 6, SESSION B: METHODS, TOOLS, DATABASES 8 th Int. Conference on <strong>LCA</strong> <strong>in</strong> the<br />
Agri-<strong>Food</strong> Sector, 1-4 Oct <strong>2012</strong><br />
912<br />
168. Social life cycle assessment of milk production <strong>in</strong> Canada<br />
Jean-Michel Couture 1,* , Cather<strong>in</strong>e Brodeur 1 , Julie Parent 2 , Jean-Pierre Revér<strong>et</strong> 1,2 , Mia Lafonta<strong>in</strong>e 3<br />
1 Groupe AGECO, 2014 Cyrille-Duqu<strong>et</strong> suite 307, Quebec, QC, G1N 4N6, Canada, 2 UQAM, Department of<br />
Strategy, Social and Environmental Responsibility, Suite R-3555, École des sciences de la gestion, QC, H2X<br />
3X2, Canada, and Groupe AGECO, 3 Quantis, 395 Laurier Ouest, Montreal, QC, H2V 2K3, Canada, Correspond<strong>in</strong>g<br />
author. E-mail: jean-michel.couture@groupeageco.ca<br />
The agricultural sector <strong>in</strong> general and the livestock and dairy sectors <strong>in</strong> particular have been over the years<br />
<strong>in</strong>creas<strong>in</strong>gly blamed for their environmental impacts, especially <strong>in</strong> regards to their greenhouse gases emissions<br />
(Ste<strong>in</strong>feld <strong>et</strong> al. 2006). In the same time, there has been a grow<strong>in</strong>g awareness that farm<strong>in</strong>g activities<br />
equally <strong>in</strong>duce significant social and economic impacts over a wide range of stakeholders (Van Calker <strong>et</strong> al.<br />
2005). As new challenges arise from this context, the sector needs to improve his susta<strong>in</strong>ability level to respond<br />
to critics.<br />
In this regards, the Life Cycle Assessment (<strong>LCA</strong>) approach, which addresses the environmental impacts<br />
throughout a product's life cycle, has become a widely used tool to identify hotspots and to foster actions to<br />
improve a product’ environmental susta<strong>in</strong>ability. With the recent development of the Socio-economic Life<br />
Cycle Assessment (S-<strong>LCA</strong>) m<strong>et</strong>hodology, this approach now also enables to assess, <strong>in</strong> an <strong>in</strong>tegrated way, for<br />
the social and economic aspects of susta<strong>in</strong>ability. In order to document the Canadian milk sector’ susta<strong>in</strong>ability,<br />
this <strong>in</strong>tegrated <strong>LCA</strong> framework has thus been used <strong>in</strong> this project to comprehensively def<strong>in</strong>e the environmental<br />
and socio-economic impacts of the sector’s whole life cycle.<br />
However, whereas E-<strong>LCA</strong> now relies on a well-def<strong>in</strong>ed m<strong>et</strong>hodology, S-<strong>LCA</strong> is a new technique whose<br />
m<strong>et</strong>hodological underp<strong>in</strong>n<strong>in</strong>gs have only been recently specified <strong>in</strong> the UNEP’s Guidel<strong>in</strong>es for Social Assessment<br />
of Products released <strong>in</strong> June 2009 (UNEP 2009). Based on those Guidel<strong>in</strong>es, this project has developed<br />
a fully operational assessment m<strong>et</strong>hodology adjusted to the Canadian milk sector’ specificities. More<br />
specifically, two assessment frameworks have been used to assess the social and economic impacts <strong>in</strong>duced<br />
all along the Canadian milk sector’s life cycle. For enterprises found with<strong>in</strong> dairy farms’ sphere of <strong>in</strong>fluence,<br />
a Specific Analysis has been performed by us<strong>in</strong>g a s<strong>et</strong> of <strong>in</strong>dicators related to the sector’ specific issues of<br />
concern and stakeholders categories. A Potential Hotspot Analysis has been used <strong>in</strong>stead to assess, outside<br />
the dairy farms’ sphere of <strong>in</strong>fluence, the potential misbehaviours of enterprises <strong>in</strong> regards to acknowledged<br />
social norms.<br />
In addition of offer<strong>in</strong>g a d<strong>et</strong>ailed s<strong>et</strong> of socio-economic <strong>in</strong>dicators reflect<strong>in</strong>g the particular social issues of<br />
concern found with<strong>in</strong> the agricultural sector, this project contributed to the advancement of the S-<strong>LCA</strong> m<strong>et</strong>hodology<br />
by clarify<strong>in</strong>g the steps to conduct such an assessment <strong>in</strong> practice, <strong>in</strong> particular <strong>in</strong> regards to the two<br />
unique and complementary assessment frameworks. It proposes furthermore to <strong>in</strong>tegrate to the social and<br />
economic dimensions of susta<strong>in</strong>ability with the environmental one <strong>in</strong> one broad assessment m<strong>et</strong>hodology.<br />
References<br />
UNEP/SETAC, 2009. Guidel<strong>in</strong>es for Social Life Cycle Assessment of Products. United Nations Environment<br />
Programme. Paris.<br />
Ste<strong>in</strong>feld, H., Gerber, P., Wassenaar, T., Castel, V., Rosales, M., De Haan, C., 2006. Livestock's long<br />
shadow: Environmental issues and options. FAO [<strong>Food</strong> and Agriculture Organization of the United Nations],<br />
Rome, 391 p.<br />
Van Calker, K.J., Berentsen, P.B.M., Giesen, G.W.J., Huirne, R.B.M., 2005. Identify<strong>in</strong>g and rank<strong>in</strong>g attributes<br />
that d<strong>et</strong>erm<strong>in</strong>e susta<strong>in</strong>ability <strong>in</strong> Dutch dairy farm<strong>in</strong>g. J. Agri., <strong>Food</strong>, and Human Values Soci<strong>et</strong>y 22,<br />
53-63
GROUP 6, SESSION B: METHODS, TOOLS, DATABASES 8 th Int. Conference on <strong>LCA</strong> <strong>in</strong> the<br />
Agri-<strong>Food</strong> Sector, 1-4 Oct <strong>2012</strong><br />
169. Environmental impact and social attributes of small- and largescale<br />
dairy farms<br />
Luciana Bava, Matteo Guerci * , Anna Sandrucci, Alberto Tambur<strong>in</strong>i, Maddalena Zucali<br />
Dipartimento di Scienze Agrarie e Ambientali, Università degli Studi di Milano, via Celoria 2 , 20133 Milano,<br />
Italy, Correspond<strong>in</strong>g author. E-mail: matteo.guerci@unimi.it<br />
In recent years a grow<strong>in</strong>g <strong>in</strong>terest was observed from public op<strong>in</strong>ion <strong>in</strong> the concept of “susta<strong>in</strong>ability” of<br />
farm<strong>in</strong>g systems (Van Calker <strong>et</strong> al., 2005). A common perception is that a dairy farm based on pasture, with<br />
low-<strong>in</strong>put and low number of cows is more respectful from the environmental po<strong>in</strong>t of view than an <strong>in</strong>tensive<br />
and large dairy farm (Capper <strong>et</strong> al., 2009). The aim of this work is to study the environmental impact and the<br />
social attributes of <strong>in</strong>tensive dairy farms characterised by different scale <strong>in</strong> terms of number of lactat<strong>in</strong>g<br />
cows. We selected 22 dairy farms located <strong>in</strong> the Po valley <strong>in</strong> the North of Italy. All the farms were members<br />
of the same cooperative feed <strong>in</strong>dustry and belonged to one of the two groups: ≤ 70 or ≥ 150 lactat<strong>in</strong>g cows.<br />
The environmental impact of each dairy farm was calculated with a d<strong>et</strong>ailed ‘‘cradle-to-farm-gate’’ <strong>LCA</strong>.<br />
All the processes related to the farm activity (i.e. forage and crop production, energy use, fuel consumption,<br />
manure and livestock management), and all external factors or <strong>in</strong>puts (i.e. production of fertilisers, pesticides,<br />
feed, energy and fuels, litter materials, replac<strong>in</strong>g animals) were considered as part of the system. The<br />
functional unit chosen was 1 kg fat and prote<strong>in</strong> corrected milk (FPCM, 4.0% of fat and 3.3% of prote<strong>in</strong> content).<br />
<strong>LCA</strong> was carried out with SimaPro 7.3.2 (PRé Consultants bv., 2011). Gross marg<strong>in</strong>, i.e. revenues<br />
m<strong>in</strong>us direct production costs, exclud<strong>in</strong>g labour cost (€/t FPCM) was used as economic <strong>in</strong>dicator. The social<br />
attributes of the farm<strong>in</strong>g systems were studied us<strong>in</strong>g an on-l<strong>in</strong>e questionnaire sent to a large sample of stakeholders<br />
with different age (18 to more than 60). Daily milk production, stock<strong>in</strong>g density and feed selfsufficiency<br />
were not significantly different b<strong>et</strong>ween the two group of farms; also the production efficiency<br />
and economic performance, expressed as dairy efficiency and gross marg<strong>in</strong>, were similar (Table 1). Large<br />
scale farms had higher percentage of farm land sown with maize for silage, lower percentage of grassland <strong>in</strong><br />
comparison with the other group. Nitrogen and phosphorus balances at farm level did not show any significant<br />
difference among farms. Climate change and acidification potentials per kg FPCM showed significantly<br />
lower value <strong>in</strong> the large scale farms (P < 0.05) compared with smaller ones (Table 2). The results <strong>in</strong> terms of<br />
climate change potential were <strong>in</strong> agreement with previous studies of Rotz <strong>et</strong> al. (2010); this could be due to<br />
the reduction of m<strong>et</strong>hane emission d<strong>et</strong>erm<strong>in</strong>ed by the higher <strong>in</strong>take of maize silage and high moisture maize<br />
silage of cows <strong>in</strong> large scale farms <strong>in</strong> comparison with the other group (9.7 vs 7.7 kg DM) (Cedeberg and<br />
Flysiö, 2004). Energy use was higher <strong>in</strong> small dairy farms compared to large ones. The results of the survey<br />
(n=479) showed that common perception of some aspects of farm<strong>in</strong>g systems susta<strong>in</strong>ability is frequently far<br />
from our data, <strong>in</strong> particular for climate change, eutrophication potential and energy use most of the people<br />
considered that large farm impact more than small ones. The results showed that <strong>in</strong>tensive dairy farms with a<br />
high number of lactat<strong>in</strong>g cows fed with maize-based di<strong>et</strong> reduced the environmental impact of milk production<br />
particularly for greenhouse emission, energy use and land occupation compared with similar <strong>in</strong>tensive<br />
farms but with lower number of cows. The study suggests that ecological susta<strong>in</strong>ability is not compromised<br />
by <strong>in</strong>creas<strong>in</strong>g farm scale.<br />
References<br />
Capper, J.L., Cady, R.A., Bauman, D.E., 2009. The environmental impact of dairy production: 1944 compared<br />
with 2007. J. Anim. Sci. 87, 216-217.<br />
Cederberg C., Flysjö A., 2004. Life cycle <strong>in</strong>ventory of 23 dairy farms <strong>in</strong> South-Western Sweden. SIK report<br />
no. 728.<br />
Rotz, C.A., Montes, F., Chianese, D.S., 2010. The carbon footpr<strong>in</strong>t of dairy production systems through partial<br />
life cycle assessment. J. Dairy Sci. 93, 1266-1282.<br />
Van Calker K.J., Ber<strong>et</strong>sen, P.B.M., Giesen, G.W.J., Huirne R.B.M., 2005. Identify<strong>in</strong>g and rank<strong>in</strong>g attributes<br />
that d<strong>et</strong>erm<strong>in</strong>e susta<strong>in</strong>ability <strong>in</strong> Dutch dairy farm<strong>in</strong>g. Agr. Human Values 22, 53-63.<br />
913
GROUP 6, SESSION B: METHODS, TOOLS, DATABASES 8 th Table 1. Characteristics of two group of farms (least squares means)<br />
Int. Conference on <strong>LCA</strong> <strong>in</strong> the<br />
Agri-<strong>Food</strong> Sector, 1-4 Oct <strong>2012</strong><br />
≤ 70 milk<strong>in</strong>g ≥ 150 milk<strong>in</strong>g<br />
cows cows SE P<br />
N observations<br />
Daily milk production, kg<br />
11 11<br />
FPCM/cow 28.0 29.2 1.02 0.413<br />
Stock<strong>in</strong>g density, LU/ha 4.40 5.83 0.68 0.150<br />
<<br />
Farm land, ha 25.1 78.0 7.5 0.001<br />
Feed self-sufficiency,%<br />
Production <strong>in</strong>tensity,<br />
63.6 61.8 4.72 0.790<br />
GJoule/ha 98.4 120 8.87 0.105<br />
Gross marg<strong>in</strong>, €/t FPCM<br />
Dairy efficiency, kg milk/kg<br />
209 175 19.0 0.224<br />
DMI 1.29 1.34 0.04 0.433<br />
Lucerne,% farm land 16.9 18.0 3.66 0.833<br />
Grass,% farm land<br />
Maize for silage,% farm<br />
23.1 8.5 6.89 0.149<br />
land 15.7 25.6 3.98 0.097<br />
N balance, kg/ha 431 547 62.4 0.206<br />
P balance kg/ha 54.3 54.9 10.40 0.968<br />
N farm efficiency,% 27.3 28.0 0.78 0.555<br />
P farm efficiency,% 28.3 31.2 0.95 0.044<br />
Table 2. Environmental impact of the two groups of farms, expressed for kg of fat-and-prote<strong>in</strong>-corrected<br />
milk (least squares means)<br />
≤ 70 milk<strong>in</strong>g ≥ 150 milk<strong>in</strong>g<br />
cows cows SE P<br />
No. observations 11 11<br />
Climate change, kg Co2eq.<br />
1.35 1.18 0.050 0.036<br />
Acidification, g SO2-eq.<br />
per kg<br />
21.10 17.90 1.05 0.042<br />
Eutrophication, g PO -3 4eq.<br />
per kg<br />
9.74 8.15 0.590 0.072<br />
Energy use, MJ 6.52 5.23 0.300 0.006<br />
Land occupation, m 2 1.56 1.35 0.070 0.045<br />
914
GROUP 6, SESSION B: METHODS, TOOLS, DATABASES 8 th Int. Conference on <strong>LCA</strong> <strong>in</strong> the<br />
Agri-<strong>Food</strong> Sector, 1-4 Oct <strong>2012</strong><br />
170. Guidel<strong>in</strong>es for address<strong>in</strong>g environmental and social <strong>LCA</strong> with<strong>in</strong><br />
Quebec’s food process<strong>in</strong>g <strong>in</strong>dustry – Part 1: environmental aspects<br />
Julie-Anne Chayer 1,* , Rosie Saad 1 , Cather<strong>in</strong>e Brodeur 2 , Jean-Pierre Revérêt 2<br />
1 Quantis, 395 Laurier Ouest, Montreal, QC, H2V 2K3, Canada, 2 Groupe AGéco, Correspond<strong>in</strong>g author.<br />
E-mail: julie-anne.chayer@quantis-<strong>in</strong>tl.com<br />
Many food <strong>in</strong>dustries are now develop<strong>in</strong>g responsible purchas<strong>in</strong>g policies and challeng<strong>in</strong>g their suppliers by<br />
ask<strong>in</strong>g for guarantees with regards to their environmental and social practices. In response to such product<br />
and company-specific needs, life cycle assessment (<strong>LCA</strong>) is becom<strong>in</strong>g a fundamental m<strong>et</strong>hod widely used to<br />
support <strong>in</strong>formed decisions with<strong>in</strong> a broader susta<strong>in</strong>able management. Based on a holistic approach, <strong>LCA</strong> is<br />
a decision-support tool used for the assessment of potential environmental impacts of a product over its entire<br />
life cycle. Such a mean<strong>in</strong>gful assessment helps to identify environmental hotspots where actions can be<br />
taken to reduce <strong>in</strong>efficiencies and energy cost while develop<strong>in</strong>g greener and socially acceptable products.<br />
In an effort to provide a beneficial and comp<strong>et</strong>itive advantage for the food process<strong>in</strong>g sector <strong>in</strong>dustries located<br />
<strong>in</strong> Québec (Canada), a framework is be<strong>in</strong>g developed address<strong>in</strong>g both environmental and social aspects.<br />
On one level, the outcome of this project encourages and facilitates the implementation and the<br />
achievement of a company and/or product <strong>LCA</strong>s from SME’s to larger companies. Additionally, it can help<br />
position both product and company <strong>in</strong> a green mark<strong>et</strong> <strong>in</strong>fluenced by the <strong>in</strong>creas<strong>in</strong>g demands of consumers.<br />
However, s<strong>in</strong>ce <strong>LCA</strong> results are conditioned by several choices to be taken from the very beg<strong>in</strong>n<strong>in</strong>g of a<br />
project, it is necessary to ref<strong>in</strong>e the scope and boundaries. This aspect is quite unique <strong>in</strong> this approach as only<br />
few studies have considered both aspects of susta<strong>in</strong>able development, up until now. In addition, the framework<br />
provided establishes a series of guidel<strong>in</strong>es and rules that are built accord<strong>in</strong>g to the ISO standards<br />
(14040-14044), the guidel<strong>in</strong>es for social life cycle assessment of products (UNEP, 2009) and Product Category<br />
Rules (PCRs) development.<br />
Such guidel<strong>in</strong>es allow for an <strong>in</strong>tegrated and standardised approach for implement<strong>in</strong>g a comprehensive <strong>LCA</strong>,<br />
<strong>in</strong> order to ensure quality, consistency and comparability among studies for various food process<strong>in</strong>g sectors.<br />
In addition to provid<strong>in</strong>g <strong>in</strong>formation on how to def<strong>in</strong>e the functional unit, data quality requirements and other<br />
requirements of the <strong>LCA</strong>, the guidel<strong>in</strong>es help to f<strong>in</strong>d the best data available for a specific sector <strong>in</strong> a specific<br />
region. The latter <strong>in</strong>clude sectors such as dairy products, poultry, juice and dr<strong>in</strong>ks, food packag<strong>in</strong>g and many<br />
others.<br />
The process of develop<strong>in</strong>g such an <strong>in</strong>itiative for the sector as well as the guidel<strong>in</strong>es' environmental requirements<br />
will be presented. This <strong>in</strong>cludes a list of stakeholders who participated <strong>in</strong> the guidel<strong>in</strong>es' development<br />
and the <strong>in</strong>tegration process of the socio-economic and environmental issues. Ga<strong>in</strong>s made by food processors<br />
will also be shared.<br />
References<br />
UNEP/SETAC (2009). Guidel<strong>in</strong>es for Social Life Cycle Assessment of Products. United Nations Environment<br />
Programme. Paris.<br />
915
GROUP 6, SESSION B: METHODS, TOOLS, DATABASES 8 th Int. Conference on <strong>LCA</strong> <strong>in</strong> the<br />
Agri-<strong>Food</strong> Sector, 1-4 Oct <strong>2012</strong><br />
171. Guidel<strong>in</strong>es for address<strong>in</strong>g environmental and social <strong>LCA</strong> with<strong>in</strong><br />
Quebec’s food process<strong>in</strong>g <strong>in</strong>dustry – Part 2: socio-economic aspects<br />
Jean-Michel Couture 1,* , Cather<strong>in</strong>e Brodeur 1 , Jean-Pierre Revér<strong>et</strong> 1,2 , Julie-Anne Chayer 3 , Rosie Saad 3<br />
1 Groupe AGECO, 2014 Cyrille-Duqu<strong>et</strong> suite 307, Quebec, QC, G1N 4N6, Canada, 2 UQAM, Department of<br />
Strategy, Social and Environmental Responsibility, Suite R-3555, École des sciences de la gestion, QC, H2X<br />
3X2, Canada, and Groupe AGECO, 3 Quantis, 395 Laurier Ouest, Montreal, QC, H2V 2K3, Canada, Correspond<strong>in</strong>g<br />
author E-mail: jean-michel.couture@groupeageco.ca<br />
The grow<strong>in</strong>g demand of consumers for environmentally friendly products and socially responsible practices<br />
is becom<strong>in</strong>g a major issue for the food process<strong>in</strong>g <strong>in</strong>dustry. As new regulations are enacted and responsible<br />
procurement practices policies become widespread among large r<strong>et</strong>ailers, processors have to adapt and provide<br />
credible <strong>in</strong>formation on the environmental and social impacts <strong>in</strong>duced by their products and activities.<br />
In order to support the Quebec’s (Canada) food process<strong>in</strong>g <strong>in</strong>dustry fac<strong>in</strong>g these new challenges, guidel<strong>in</strong>es<br />
have been produced to allow processors operat<strong>in</strong>g <strong>in</strong> one of the five participat<strong>in</strong>g sectors (dairy, poultry,<br />
juice and dr<strong>in</strong>ks, processed veg<strong>et</strong>ables and animal feed) to conduct Life Cycle Assessment (<strong>LCA</strong>) over their<br />
enterprise.<br />
Although the <strong>LCA</strong> approach has become to be known as one of the most effective and rigorous m<strong>et</strong>hod to<br />
assess the impacts of a product over its entire life-cycle, it traditionally focuses on environmental impacts,<br />
thus fail<strong>in</strong>g to provide a compl<strong>et</strong>e assessment of the product’ susta<strong>in</strong>ability. Do<strong>in</strong>g so would require tak<strong>in</strong>g<br />
also <strong>in</strong>to account it social and economic impacts. Based on recent theor<strong>et</strong>ical developments, these guidel<strong>in</strong>es<br />
propose a Susta<strong>in</strong>ability-<strong>LCA</strong> framework to assess the social and economic impacts as well as the environmental<br />
ones.<br />
Drawn from the UNEP’s Guidel<strong>in</strong>es for social life cycle assessment of products (UNEP 2009), the Social-<br />
<strong>LCA</strong> part of these Guidel<strong>in</strong>es provides a fully operational framework <strong>in</strong> which impact sub-categories have<br />
been related to a s<strong>et</strong> of readily measurable socio-economic <strong>in</strong>dicators. Although the framework relies on a<br />
common and standardised assessment m<strong>et</strong>hodology, it also allows for adaptations to take place <strong>in</strong> order to<br />
take <strong>in</strong>to account sectors’ specificities. More fundamentally, by clarify<strong>in</strong>g the S-<strong>LCA</strong>’s term<strong>in</strong>ology, steps of<br />
realisation and the <strong>in</strong>dicators’ selection criteria, these Guidel<strong>in</strong>es enhanced this tool’s m<strong>et</strong>hodological foundations<br />
to facilitate its use <strong>in</strong> other contexts and for other subjects.<br />
In sum, <strong>in</strong> addition of be<strong>in</strong>g one of the first attempts to develop an <strong>in</strong>tegrated assessment framework to perform<br />
a Social and Environmental <strong>LCA</strong>, these Guidel<strong>in</strong>es propose a practical, simplified and sector-oriented<br />
S-<strong>LCA</strong> m<strong>et</strong>hodology that will facilitate the conduct of such an assessment <strong>in</strong> the participat<strong>in</strong>g food process<strong>in</strong>g<br />
sectors and beyond.<br />
References<br />
UNEP/SETAC, 2009. Guidel<strong>in</strong>es for Social Life Cycle Assessment of Products. United Nations Environment<br />
Programme. Paris.<br />
916
GROUP 6, SESSION B: METHODS, TOOLS, DATABASES 8 th Int. Conference on <strong>LCA</strong> <strong>in</strong> the<br />
Agri-<strong>Food</strong> Sector, 1-4 Oct <strong>2012</strong><br />
172. Aggregated <strong>in</strong>dicators of susta<strong>in</strong>able agricultural production and<br />
food security <strong>in</strong> the Central Maghreb<br />
J. Soler-Rovira 1,* , J.M. Arroyo-Sanz 1 , F. González-Torres 1 , C. Rojo-Hernández 1 , A. Marqu<strong>in</strong>a Barrio 2 .<br />
1 Escuela Universitaria de Ingeniería Técnica Agrícola, Universidad Politécnica de Madrid, Ciudad Universitaria,<br />
s/n 28040 Madrid, Spa<strong>in</strong>, 2 Facultad de Ciencias Políticas y Sociología, Universidad Complutense de<br />
Madrid, Campus de Somosaguas, 28223 Pozuelo de Alarcón, Spa<strong>in</strong>, Correspond<strong>in</strong>g author. E-mail:<br />
jose.soler@upm.es<br />
A susta<strong>in</strong>able food production and supply for a grow<strong>in</strong>g human population is a major challenge for the next<br />
years and decades. <strong>Food</strong> security, <strong>in</strong>clud<strong>in</strong>g supply and demand factors as physical and economic access and<br />
wealth and assimilation of nutrients, must be performed by a susta<strong>in</strong>able agricultural production that ensures<br />
the long term agricultural productivity and ecosystem services. The region called the Central Maghreb <strong>in</strong>cludes<br />
Algeria, Morocco and Tunisia <strong>in</strong> the North of Africa. In these countries, despite the great economic<br />
differences, the agro-ecological characteristics are homogenous and are limit<strong>in</strong>g productivity: arid and semiarid<br />
climates, with low ra<strong>in</strong>fall values along the year and concentrated <strong>in</strong> the sea-side land stripe, where are<br />
located also the most suitable farm<strong>in</strong>g soils. These ecological constra<strong>in</strong>ts are aggravated with political and<br />
socioeconomic ones that have resulted <strong>in</strong> a dual agricultural structure: high yield export-oriented veg<strong>et</strong>able<br />
and fruit farm<strong>in</strong>g systems and low-yield <strong>in</strong>ner-consumption-oriented cereal farm<strong>in</strong>g systems. In these low<br />
<strong>in</strong>put systems the technological use is scarce and there is an important yield gap b<strong>et</strong>ween actual yields and<br />
potential ones. The production and <strong>in</strong>ner supply of basic products as cereals or milk is ma<strong>in</strong>ly supplied by<br />
external imports from <strong>in</strong>ternational mark<strong>et</strong>s, whereas veg<strong>et</strong>ables and fruits are exported to foreign countries.<br />
In both cases, Spa<strong>in</strong> and the EU are key actors <strong>in</strong> trade, agriculture, food, health and development policies.<br />
This multidimensional challenge must be studied with a holistic approach, where susta<strong>in</strong>ability and food<br />
security may be assessed by a number of <strong>in</strong>dicators that reveal the strengths and weaknesses, as well barriers<br />
and drivers operat<strong>in</strong>g <strong>in</strong> each country <strong>in</strong> a mult<strong>in</strong>ational scenario and a multilevel assessment. This assortment<br />
of <strong>in</strong>dicators should be synthesised <strong>in</strong>to an appropriate unique <strong>in</strong>dicator that <strong>in</strong> spite of conta<strong>in</strong><strong>in</strong>g much<br />
<strong>in</strong>formation, is easy to understand by the end-users (policy-makers, scientific, technicians, <strong>et</strong>c.). Aggregated<br />
<strong>in</strong>dicators help to communicate the <strong>in</strong>formation succ<strong>in</strong>ctly and to make easier to dist<strong>in</strong>guish patterns <strong>in</strong> the<br />
data by formalis<strong>in</strong>g the aggregation process that is often done implicitly, subjectively and <strong>in</strong>tuitively. Indicator<br />
s<strong>et</strong>s may be built up with<strong>in</strong> a framework accord<strong>in</strong>g to two conceptions of susta<strong>in</strong>ability: goal or property<br />
oriented. The latter is based on systemic properties, such as existence or effectiveness, <strong>et</strong>c. The aim of this<br />
work is to assess the susta<strong>in</strong>ability of the agricultural production and food security <strong>in</strong> the Central Maghreb<br />
mak<strong>in</strong>g operational the systemic framework and <strong>in</strong>corporat<strong>in</strong>g multivariate statistical tools.<br />
The hierarchical structure of the framework was based upon three subsystems: human (food security and<br />
social dimension), natural (environmental dimension) and support (production and economic dimension).<br />
Indicators were organised accord<strong>in</strong>g to Bossel´s seven basic orientors (Table 1). The m<strong>et</strong>hodology was an<br />
iterative process consist<strong>in</strong>g on several steps: system def<strong>in</strong>ition, selection of <strong>in</strong>dicators and aggregation of<br />
<strong>in</strong>dicators. This analysis was mult<strong>in</strong>ational, <strong>in</strong>clud<strong>in</strong>g Mediterranean countries, Middle East countries and<br />
others with ecological, sociological or economic similarities, such as South Africa, Norway and Iran. These<br />
countries were selected as the observation s<strong>et</strong>. For each country, 21 <strong>in</strong>dicators were computed (7 orientors x<br />
3 subsystems). The data were obta<strong>in</strong>ed from FAO, United Nations, Worldwatch Institute, World Resources<br />
Institute and other <strong>in</strong>ternational organisations. <strong>LCA</strong> was performed with some of the basic data.<br />
Synth<strong>et</strong>ic <strong>in</strong>dicators were calculated by pr<strong>in</strong>cipal components analysis, us<strong>in</strong>g STATGRAPHICS software.<br />
The aggregation of data <strong>in</strong>to s<strong>in</strong>gle <strong>in</strong>dices was done us<strong>in</strong>g coord<strong>in</strong>ates of the countries with the pr<strong>in</strong>cipal<br />
components and the eigenvalues from the analysis. The <strong>in</strong>dicator s<strong>et</strong> considered for the selected countries is<br />
shown <strong>in</strong> Table 1. The selected <strong>in</strong>dicators expla<strong>in</strong>ed with good agreement the differences <strong>in</strong> susta<strong>in</strong>ability<br />
and food security b<strong>et</strong>ween the different countries and the synth<strong>et</strong>ic <strong>in</strong>dices ranked them all. The specific <strong>in</strong>dexes<br />
that characterised the countries from the Central Maghreb were analysed <strong>in</strong> order to evaluate present<br />
and short term strengths and weaknesses to propose a development strategy.<br />
917
GROUP 6, SESSION B: METHODS, TOOLS, DATABASES 8 th Table 1. Indicator s<strong>et</strong> for each selected country.<br />
Int. Conference on <strong>LCA</strong> <strong>in</strong> the<br />
Agri-<strong>Food</strong> Sector, 1-4 Oct <strong>2012</strong><br />
Basic orientor Natural system Human system Support system<br />
Existence Impact of agricultural pro- %energy per capita <strong>in</strong>take by Production per capita<br />
duction per ha<br />
m<strong>in</strong>imum requirements<br />
Effectiveness Eco-efficiency of agriculture Agricultural production vs<br />
rural population<br />
Cereal yield -1<br />
Freedom of Water footpr<strong>in</strong>t vs ra<strong>in</strong>fall <strong>Food</strong> consumption diversity N<strong>et</strong> food imports per cap-<br />
action<br />
ita<br />
Security Anthropogenic nitrogen <strong>in</strong>puts<br />
Basic food supply Cereal yield stability<br />
Adaptability Rate of EF trend M<strong>in</strong>imum food requirements Slope of cereal yield trend<br />
over time<br />
Coexistence Share of basic and technical Undernourished population Cereal yield gap<br />
Psychological<br />
needs<br />
918<br />
energy use<br />
EF vs. biocapacity Life satisfaction Input productivity
GROUP 6, SESSION B: METHODS, TOOLS, DATABASES 8 th Int. Conference on <strong>LCA</strong> <strong>in</strong> the<br />
Agri-<strong>Food</strong> Sector, 1-4 Oct <strong>2012</strong><br />
173. Consistent <strong>in</strong>clusion of deforestation <strong>in</strong> food life cycle assessment<br />
Sebastien Humbert * , V<strong>in</strong>cent Rossi<br />
Quantis, Parc scientifique EPFL, Bât. D, 1015 Lausanne, Switzerland, Correspond<strong>in</strong>g author. E-mail: sebastien.humbert@quantis-<strong>in</strong>tl.com<br />
Deforestation is recognised as be<strong>in</strong>g one of the major cause of greenhouse gas (GHG) emissions and destruction<br />
of ecosystems. It is also recognised that the majority of deforestation of natural ecosystems is associated<br />
with agriculture and agroforestry. On a world scale, GHG emissions from deforestation associated with agriculture<br />
and agroforestry are of the same order of magnitude as all other GHG emissions associated with agriculture<br />
and agroforestry production systems. The sector of food and beverage is rapidly <strong>in</strong>corporat<strong>in</strong>g the<br />
m<strong>et</strong>hod of life cycle assessment (<strong>LCA</strong>) to address issues such as labell<strong>in</strong>g, “food eco-design” but also to<br />
<strong>in</strong>form consumers and non-governmental organisations ask<strong>in</strong>g for more transparency on the environmental<br />
performance of food and beverage products.<br />
However, among major limitations <strong>in</strong> do<strong>in</strong>g <strong>LCA</strong>s on food and beverage products is the lack of consistent<br />
consideration of impacts associated with deforestation <strong>in</strong> <strong>in</strong>ventory database and impact assessment results.<br />
Therefore, there is a need to develop and <strong>in</strong>corporate transparent and reliable data on deforestation <strong>in</strong> <strong>in</strong>ventory<br />
databases and impact assessment results <strong>in</strong> order to <strong>in</strong>crease accuracy of food and beverage <strong>LCA</strong>s.<br />
Different approaches exist to address deforestation <strong>in</strong> <strong>LCA</strong>: the most common approach is to actually neglect<br />
this issue; the GHG protocol suggests to allocate deforestation to the cultures that have grown <strong>in</strong> the country<br />
where deforestation occurs; another approach is to allocate deforestation equally to all land cultivated <strong>in</strong> a<br />
specific area (normally the country); f<strong>in</strong>ally, another approach is to allocate deforestation to the culture on<br />
the boarder of the forest be<strong>in</strong>g deforested, assum<strong>in</strong>g that it is this culture that causes deforestation.<br />
In any cases, deforestation is most of the time not considered, which can be a significant bias for products<br />
produced <strong>in</strong> countries experienc<strong>in</strong>g significant deforestation such as those <strong>in</strong> the tropics. In this context, at<br />
Quantis, we are evaluat<strong>in</strong>g the <strong>in</strong>fluence of <strong>in</strong>corporat<strong>in</strong>g deforestation consistently <strong>in</strong> <strong>in</strong>ventory databases<br />
and impact assessment results, us<strong>in</strong>g the different approaches as sensitivity studies.<br />
The presentation will show the contribution of deforestation <strong>in</strong> overall food and beverage <strong>LCA</strong> studies, us<strong>in</strong>g<br />
different allocation systems.<br />
Results show that neglect<strong>in</strong>g deforestation can cause a major underestimation of GHG emissions and other<br />
ecosystem impacts associated with products produced <strong>in</strong> tropical countries, such as palm oil, coffee, sugar<br />
cane, soybean or beef. In some cases, deforestation can double the GHG and ecosystem impacts as compared<br />
to when deforestation is neglected. For example, if consider<strong>in</strong>g the average annual Brazilian deforestation<br />
rate of 0.8% (<strong>in</strong> ha deforested/ha used for farm<strong>in</strong>g), the GHG emissions associated with green coffee production<br />
can double.<br />
In addition - and this is som<strong>et</strong>h<strong>in</strong>g even more neglected <strong>in</strong> most <strong>LCA</strong> food studies - to be consistent, impacts<br />
of deforestation should also be considered <strong>in</strong> studies <strong>in</strong>directly us<strong>in</strong>g such products, as for example, potential<br />
impacts from deforestation <strong>in</strong> <strong>LCA</strong>s of European milk production where part of the dairy cows fodder is<br />
based on soybean produced <strong>in</strong> regions where deforestation occurs.<br />
This presentation will highlight the cases when deforestation should be considered with care to evaluate the<br />
actually potential environmental impacts of food and beverage products.<br />
919
GROUP 6, SESSION B: METHODS, TOOLS, DATABASES 8 th Int. Conference on <strong>LCA</strong> <strong>in</strong> the<br />
Agri-<strong>Food</strong> Sector, 1-4 Oct <strong>2012</strong><br />
920<br />
174. Comparison of current guidel<strong>in</strong>es to calculate the carbon<br />
footpr<strong>in</strong>t of carrots<br />
Svanes, Erik<br />
Ostfold Research, Fredrikstad Norway, E-mail: erik.svanes@yahoo.no<br />
The Carbon Footpr<strong>in</strong>t of carrots grown <strong>in</strong> South-Eastern Norway was calculated us<strong>in</strong>g a calculation m<strong>et</strong>hod<br />
follow<strong>in</strong>g the pr<strong>in</strong>ciples of ISO 14067 and harmonised with the PAS 2050 and GHG Protocol Products<br />
Guidel<strong>in</strong>e. No calculation m<strong>et</strong>hod for the CFP of carrots exists but some guidel<strong>in</strong>es for veg<strong>et</strong>ables do: The<br />
“Fruit and Veg<strong>et</strong>ables” PCR from the Japanese CFP Pilot Programme, the “Veg<strong>et</strong>ables” PCR from the International<br />
EPD system and the guidel<strong>in</strong>e for calculat<strong>in</strong>g CFP of Horticultural Products from Productschap<br />
Tu<strong>in</strong>bow. In addition the sector guidance for horticultural products PAS 2050-2 was evaluated. These guidel<strong>in</strong>es<br />
are not identical.<br />
The Carbon Footpr<strong>in</strong>t was found to be 0.38 kg CO2-eq./kg carrot sold to consumer. The product system<br />
stopped at r<strong>et</strong>ail but <strong>in</strong>cluded the waste handl<strong>in</strong>g for the materials wasted <strong>in</strong> the consumption stage. The total<br />
Cradle-to-Grave carbon Footpr<strong>in</strong>t was 0.55 kg CO2-eq./kg carrot, but there are large uncerta<strong>in</strong>ties <strong>in</strong> the calculations<br />
of emissions from the consumer stage.<br />
The effect of apply<strong>in</strong>g different m<strong>et</strong>hodological choices <strong>in</strong> the calculation of Carbon Footpr<strong>in</strong>ts was exam<strong>in</strong>ed<br />
us<strong>in</strong>g the abovementioned PCR and Horticultural guidel<strong>in</strong>e as example. All guidel<strong>in</strong>es excluded Capital<br />
Goods on the basis that the impact is low but for carrots the effect was found to be >1% of the cradle-to-gate<br />
CFP. Some issues are not adequately addressed <strong>in</strong> the guidel<strong>in</strong>es. Emissions from electricity can be very<br />
different depend<strong>in</strong>g on wh<strong>et</strong>her the national grid or some mult<strong>in</strong>ational is considered, and wh<strong>et</strong>her or not<br />
green electricity schemes such as the European Guarantee of Emissions scheme is be<strong>in</strong>g accounted for. In<br />
some cases the guidel<strong>in</strong>es give different recommendations. The allocation <strong>in</strong> recycl<strong>in</strong>g and recovery is a<br />
prime example.<br />
This study shows that there is a need for more harmonisation b<strong>et</strong>ween CFP and EPD schemes around the<br />
world. It also shows that it might be necessary with more d<strong>et</strong>ailed guidance than guidel<strong>in</strong>es cover<strong>in</strong>g a whole<br />
sector or a whole range of products (“Horticulture products”, “Veg<strong>et</strong>ables” or “Veg<strong>et</strong>ables and fruits”). The<br />
study has resulted <strong>in</strong> recommendations for a standard m<strong>et</strong>hod for carrots and similar products.<br />
References<br />
Blonk, H, Kool A, Luske B, Ponsioen T and Scholten J, 2010. M<strong>et</strong>hodology for assess<strong>in</strong>g carbon footpr<strong>in</strong>ts<br />
of horticultural products. A study of m<strong>et</strong>hodological issues and solutions for the development of the<br />
Dutch carbon footpr<strong>in</strong>t protocol for horticultural products. Blonk Milieuadvies.<br />
http://www.blonkmilieuadvies.nl/en/pdf/engels%20rapport%20pt%202010.pdf<br />
ISO DIS 14067. International Standards Organisation <strong>2012</strong>.<br />
http://www.iso.org/iso/iso_catalogue/catalogue_tc/catalogue_d<strong>et</strong>ail.htm?csnumber=59521<br />
BSI (British Standards Institute) (2011). Publicly Available Specification 2050.<br />
http://www.bsigroup.com/en/Standards-and-Publications/How-we-can-help-you/Professional-Standards-<br />
Service/PAS-2050/PAS-2050/<br />
WBSCD (World Bus<strong>in</strong>ess Council for Susta<strong>in</strong>able Development) and WRI (World Resources Institute)<br />
(2011): Greenhouse Gas Protocol. Product Life Cycle Account<strong>in</strong>g and Report<strong>in</strong>g Standard.<br />
http://www.ghgprotocol.org/standards/product-standard<br />
The International EPD system (2011): Product Category Rules for CPC Group 012: Veg<strong>et</strong>ables.<br />
http://www.environdec.com/en/Product-Category-Rules/D<strong>et</strong>ail/?Pcr=8074<br />
The Japanese Carbon Footpr<strong>in</strong>t Pilot Project. Product Category Rules for Veg<strong>et</strong>ables and Fruits (approved<br />
PCR ID:PA-BF-02). http://pcr-library.edf.org.tw/data/japan/Veg<strong>et</strong>ables%20and%20Fruits.pdf
GROUP 6, SESSION B: METHODS, TOOLS, DATABASES 8 th Int. Conference on <strong>LCA</strong> <strong>in</strong> the<br />
Agri-<strong>Food</strong> Sector, 1-4 Oct <strong>2012</strong><br />
175. Establish<strong>in</strong>g a reference carbon calculator and policy options to<br />
promote low carbon farm<strong>in</strong>g practices <strong>in</strong> the EU<br />
Hanna L. Tuomisto * , V<strong>in</strong>cenzo Angileri, Camillo De Camillis, Adrian Leip, Nathan Pell<strong>et</strong>ier, Fabien Ramos,<br />
Palle Haastrup<br />
European Commission, Jo<strong>in</strong>t Research Centre (JRC), Institute for Environment and Susta<strong>in</strong>ability, Via Enrico<br />
Fermi 2749, 21027 Ispra, Italy, Correspond<strong>in</strong>g author. E-mail: hanna.tuomisto@jrc.ec.europa.eu<br />
The direct emissions of greenhouse gases (GHG) from agriculture accounted for around 10% of total European<br />
Union (EU) emissions <strong>in</strong> 2010. It has been estimated that <strong>in</strong> the United K<strong>in</strong>gdom the agri-food sector as<br />
whole contributes around 19% of GHG emissions when life cycle emissions are taken <strong>in</strong>to account. To reduce<br />
the farm<strong>in</strong>g-related GHG emissions appropriate policy <strong>in</strong>struments and support<strong>in</strong>g tools that promote<br />
low carbon farm<strong>in</strong>g practices must be developed. This paper describes an on-go<strong>in</strong>g project that aims at assess<strong>in</strong>g<br />
the policy options to promote low carbon farm<strong>in</strong>g practices <strong>in</strong> the EU. The project <strong>in</strong>cludes: i) a review<br />
of exist<strong>in</strong>g climate-related certification and labell<strong>in</strong>g schemes <strong>in</strong> agri-food sector, ii) the development<br />
of a user friendly open-source carbon calculator suitable for assess<strong>in</strong>g the life cycle GHG emissions from<br />
different types of farm<strong>in</strong>g systems across the whole EU, and iii) the design/assessment of policy options for<br />
promot<strong>in</strong>g low carbon farm<strong>in</strong>g practices. The carbon calculator quantifies direct and <strong>in</strong>direct GHG emissions<br />
accord<strong>in</strong>g to the general-level and sector-specific <strong>in</strong>ternational standards and guidel<strong>in</strong>es on Life Cycle Assessment<br />
and carbon footpr<strong>in</strong>t. In addition to the GHG emission quantification, the tool also proposes mitigation<br />
options and sequestration actions suitable for s<strong>in</strong>gle farms. The recommendations of the specific farm<strong>in</strong>g<br />
practices are based on emission reduction potential, potential leakage effects, <strong>in</strong>herent costs of implementation,<br />
and impact on other environmental issues. The practicality and acceptability of the carbon calculator<br />
has been tested on around a hundred farms across the EU. F<strong>in</strong>ally, a range of options for mak<strong>in</strong>g widespread<br />
use of the carbon calculator will be outl<strong>in</strong>ed, <strong>in</strong>clud<strong>in</strong>g e.g. public or private certification schemes, <strong>in</strong>centive<br />
payments to farmers, and legal obligations for farmers to reduce GHG emissions.<br />
References<br />
European Environment Agency, Approximate EU GHG <strong>in</strong>ventory, Early estimates for 2010, <strong>in</strong> EEA Technical<br />
report No 11/2011.<br />
Garn<strong>et</strong>t, T., Cook<strong>in</strong>g up a storm – <strong>Food</strong>, greenhouse gas emissions and our chang<strong>in</strong>g climate. 2008. <strong>Food</strong><br />
Climate Research N<strong>et</strong>work, Centre for Environmental Strategy, University of Surrey. p. 155.<br />
European Commission, Jo<strong>in</strong>t Research Centre, International Reference Life Cycle Data System (ILCD)<br />
Handbook – General guide for Life Cycle Assessment – D<strong>et</strong>ailed guidance (2010) Luxembourg: Publication<br />
Office of the European Union.<br />
921
GROUP 6, SESSION B: METHODS, TOOLS, DATABASES 8 th Int. Conference on <strong>LCA</strong> <strong>in</strong> the<br />
Agri-<strong>Food</strong> Sector, 1-4 Oct <strong>2012</strong><br />
922<br />
176. Survey<strong>in</strong>g tools and m<strong>et</strong>hods for <strong>LCA</strong> <strong>in</strong> the agri-food sector<br />
Ricardo Teixeira * , Lori Gustavus, Anne Himeno, Sara Pax<br />
Bluehorse Associates, 12 rue Soyer, 92200 Neuilly-sur-Se<strong>in</strong>e, <strong>France</strong>, Correspond<strong>in</strong>g author. E-mail: ricardo.teixeira@bluehorseassociates.com<br />
The objective of the present paper is to understand how Life Cycle Assessment (<strong>LCA</strong>) practitioners make<br />
choices b<strong>et</strong>ween different tools, depend<strong>in</strong>g on their objectives. In order to do so, we divided our work <strong>in</strong> two<br />
stages:<br />
1. The first state was mak<strong>in</strong>g a review of how many tools are <strong>in</strong> the <strong>LCA</strong> mark<strong>et</strong>, and which are their ma<strong>in</strong><br />
characteristics. We reviewed 63 tools out of more than 100 that are available, 11 of which we tested to some<br />
extent.<br />
2. The second part was conduct<strong>in</strong>g a survey on <strong>LCA</strong> practitioners, try<strong>in</strong>g to understand how those tools are<br />
used and to what end. The basis for this work was an adaptation of the questions by Cooper and Fava (2006).<br />
The survey was announced <strong>in</strong> the PRe Consultants <strong>LCA</strong> discussion list, and sent by e-mail to the Bluehorse<br />
Associates (BHA) mail<strong>in</strong>g list. A total of 117 <strong>LCA</strong> practitioners answered at least one question <strong>in</strong> the survey.<br />
S<strong>in</strong>ce BHA is a susta<strong>in</strong>ability m<strong>et</strong>rics company specialised <strong>in</strong> the food <strong>in</strong>dustry, there was a high share of<br />
replies by <strong>LCA</strong> practitioners <strong>in</strong> agriculture and food. This <strong>in</strong>herent bias was <strong>in</strong>tended for this study. Our objective<br />
is to understand, from the standpo<strong>in</strong>t of an <strong>in</strong>formed <strong>LCA</strong> practitioner, which solutions are available,<br />
what differentiates them, and how they adapt to each specific objective of the studies.<br />
Our first f<strong>in</strong>d<strong>in</strong>g was that the frontier b<strong>et</strong>ween “full <strong>LCA</strong>” (ISO compliant) tools and simplified, nonstandardised<br />
tools (simplified <strong>LCA</strong>) is now much fuzzier. Simplified tools are becom<strong>in</strong>g more accurate,<br />
while full <strong>LCA</strong> tool developers are com<strong>in</strong>g up with their own simplified tool versions. Simplification is today<br />
a synonym with user-friendl<strong>in</strong>ess and practicality, not necessarily lack of rigor.<br />
Part of the explanation for this has to do with political context. There is now a need for more practical, bus<strong>in</strong>ess-oriented<br />
tools that respond to the high demand created by the generalisation of product <strong>LCA</strong>. Other part<br />
of the explanation was found dur<strong>in</strong>g the survey (Teixeira and Pax, 2011). Even though most respondents<br />
claim to follow some k<strong>in</strong>d of standard, they do not always submit their studies to peer review (Table 1). Research<br />
and development, <strong>in</strong>novation and eco-design are the most mentioned objectives of <strong>LCA</strong> studies today,<br />
and all of these are <strong>in</strong>ternal to companies. In fact, almost all tool providers organise sem<strong>in</strong>ars, web<strong>in</strong>ars or<br />
some other forum to communicate with users. Learn<strong>in</strong>g and knowledge transmission from developers to<br />
users is now a key concern, as many companies do not have <strong>in</strong>-house <strong>LCA</strong> expertise, but <strong>LCA</strong> is progressively<br />
done <strong>in</strong>-house. S<strong>in</strong>ce the focus is no longer on communication, simplification has ga<strong>in</strong>ed <strong>in</strong> importance<br />
aga<strong>in</strong>st standardisation.<br />
Still, practitioners quote data availability as their ma<strong>in</strong> challenge. Simplified m<strong>et</strong>hods, for example those<br />
based on large quantities of secondary data, address this concern. The tool review confirmed that the number<br />
of data providers is still very low, and data availability is a fair concern.<br />
Another <strong>in</strong>terest<strong>in</strong>g f<strong>in</strong>d<strong>in</strong>g was that most tools do not easily display trial versions or disclose much <strong>in</strong>formation<br />
about the tool and databases <strong>in</strong>cluded. In many cases pric<strong>in</strong>g models are either very complex or absent<br />
from public display. So, the task of a practitioner select<strong>in</strong>g the best-suited tool for the project’s objectives is<br />
difficult, due to the disappear<strong>in</strong>g frontier b<strong>et</strong>ween full <strong>LCA</strong> and simplified <strong>LCA</strong>, the many similar options<br />
available, and the lack of transparency <strong>in</strong> price and use. Unless the practitioner has previous po<strong>in</strong>ters or welldef<strong>in</strong>ed<br />
targ<strong>et</strong>s to start with, it is very difficult to make an <strong>in</strong>formed choice without spend<strong>in</strong>g time and resources<br />
survey<strong>in</strong>g the mark<strong>et</strong> for a long period of time. In the future, it is highly recommendable that tools<br />
become transparent about what they can deliver to clients and how they are different from their comp<strong>et</strong>itors.<br />
References<br />
Cooper, J.S., Fava, J., 2006. Life-Cycle Assessment Practitioner Survey Summary of Results. Journal of<br />
Industrial Ecology, 10, 12-14.<br />
Teixeira, R., Pax, S., 2011. A Survey of Life Cycle Assessment Practitioners with a Focus on the Agri-<strong>Food</strong><br />
Sector. Journal of Industrial Ecology, 15, 817-820.
GROUP 6, SESSION B: METHODS, TOOLS, DATABASES 8 th Table 1. Answer to the multiple-choice question “Are your <strong>LCA</strong>s peer-reviewed?”.<br />
Int. Conference on <strong>LCA</strong> <strong>in</strong> the<br />
Agri-<strong>Food</strong> Sector, 1-4 Oct <strong>2012</strong><br />
Are your <strong>LCA</strong>s peer- Number of practireviewed?tioners<br />
Yes, always 6<br />
Yes, som<strong>et</strong>imes 35<br />
Yes, occasionally 24<br />
No 26<br />
Total 91<br />
923
GROUP 6, SESSION B: METHODS, TOOLS, DATABASES 8 th Int. Conference on <strong>LCA</strong> <strong>in</strong> the<br />
Agri-<strong>Food</strong> Sector, 1-4 Oct <strong>2012</strong><br />
177. PISC’n’TOOL: an operational tool for assess<strong>in</strong>g susta<strong>in</strong>ability <strong>in</strong><br />
aquaculture systems<br />
Aurélie Wilfart 1,2,* , Thomas Merle, Syndhia Mathé 3 , Joël Aub<strong>in</strong> 1,2<br />
1 INRA, UMR1069 Sol Agro <strong>et</strong> hydrosystème Spatialisation, F-35000 Rennes, <strong>France</strong>, 2 AGROCAMPUS<br />
OUEST, F-35000 Rennes, <strong>France</strong>, 3 University of Montpellier 1 (UM1), Faculté d'Economie, Av. Raymond<br />
DUGRAND C.S. 79606 F- 34960 Montpellier, <strong>France</strong>, Correspond<strong>in</strong>g author. E-mail: aurelie.wilfart@rennes.<strong>in</strong>ra.fr<br />
To me<strong>et</strong> challenges of produc<strong>in</strong>g more while lower<strong>in</strong>g impacts on ecosystems, new fish-farm<strong>in</strong>g systems<br />
have to be designed. The first step before any changes <strong>in</strong> farm<strong>in</strong>g systems is to make a diagnosis on environmental<br />
impacts, economic viability and social aspects of the activity. The assessment step has to be as<br />
compl<strong>et</strong>e as possible, adapted to the system and scientifically robust, but also convenient for the user. To<br />
fulfil this complex comb<strong>in</strong>ation, we designed an operational tool for fish-farm systems assessment based on<br />
<strong>LCA</strong> conceptual framework and Emergy account<strong>in</strong>g: PISC’n’TOOL. This tool was created <strong>in</strong> the PISCEnLit<br />
project (Ecologically Intensive PISciculture project) funded by the French National Research Agency.<br />
PISC’n’TOOL aims to analyse environmental farm scale impacts of a fish farm accord<strong>in</strong>g to <strong>LCA</strong> attributional<br />
approach, to d<strong>et</strong>erm<strong>in</strong>e the contribution of the farm’s components and environmental <strong>in</strong>tervention to<br />
its impacts and also to analyse farm’s performances (zootechnical, economical, and social). The targ<strong>et</strong>ed<br />
users are researchers and agricultural advisors for fish farm<strong>in</strong>g <strong>in</strong> <strong>France</strong>, Indonesia and Brazil.<br />
PISC’n’TOOL applies a cradle to farm gate analysis; the farm<strong>in</strong>g system evaluated focuses on the fish farms<br />
and its ma<strong>in</strong> <strong>in</strong>puts (Fig. 1). For fish farms associated to livestock (i.e. <strong>in</strong>tegrated pig -fish farm<strong>in</strong>g system),<br />
the terrestrial production are outside of the system boundaries, mean<strong>in</strong>g manure/slurry used for fish production<br />
is considered as an <strong>in</strong>put with specific allocation rules. Temporal coverage of PISC’n’TOOL is a period<br />
of 1 year or one production cycle <strong>in</strong> order to be adapted to the evaluated system. Accord<strong>in</strong>g to the multiple<br />
functions of a farm, PISC’n’TOOL def<strong>in</strong>es 5 functional units: one tonne of fish produced, one m 3 of water<br />
used, one on-farm hectare, one human labour unit, and 1000 $ of farm <strong>in</strong>come, calculation depend<strong>in</strong>g on<br />
specific user’s data or <strong>in</strong>cremented data base. The farm’s environmental <strong>in</strong>ventory is based on tables of energy<br />
carriers, <strong>in</strong>frastructures, equipments, vehicles, chemicals and v<strong>et</strong>er<strong>in</strong>ary products, water consumption,<br />
feeds (up to 10 different feeds with 15 <strong>in</strong>gredients are allowed) and fry/f<strong>in</strong>gerl<strong>in</strong>gs. These data stem from<br />
previous aquaculture <strong>LCA</strong> studies or new data collected dur<strong>in</strong>g PISCEnLIT project. Farm emissions (N, P,<br />
solids emissions) are calculated us<strong>in</strong>g mass balance modell<strong>in</strong>g (Cho <strong>et</strong> al., 1990). Emission and consumption<br />
data are aggregated <strong>in</strong>to midpo<strong>in</strong>t <strong>in</strong>dicators (<strong>in</strong>cluded also N<strong>et</strong> Primary Production Use) accord<strong>in</strong>g to CML<br />
2 basel<strong>in</strong>e 2001 (version 2.04) m<strong>et</strong>hod and endpo<strong>in</strong>t <strong>in</strong>dicators (human health, Ecosystem and resources)<br />
accord<strong>in</strong>g to Recipe endpo<strong>in</strong>t H Eur H/A m<strong>et</strong>hod.<br />
PISC’n’TOOL allows also to provide Emergy <strong>in</strong>dicators (based on <strong>LCA</strong> data), but also zootechnical, economic<br />
efficiency level and social <strong>in</strong>dicators (Fig. 2). Results are systematically given <strong>in</strong> tables for each functional<br />
unit or <strong>in</strong> graphical form. The resultants ensure an easy comparison b<strong>et</strong>ween different runn<strong>in</strong>g scenarios<br />
for one farm or for different systems as well. Despite a large <strong>in</strong>terne database, this tool requires additional<br />
data from the users to perform the <strong>LCA</strong>.<br />
PISC’n’TOOL is a practical tool for the multidimensional evaluation of farm<strong>in</strong>g system. The tool allows the<br />
identification of the environmental, economical and social hotspots of fish farm, and thus can help to def<strong>in</strong>e<br />
improved strategies and scenarios for farm evolution.<br />
References<br />
Cho CY, Kaushik SJ. Nutritional energ<strong>et</strong>ics <strong>in</strong> fish: energy and prote<strong>in</strong> utilization <strong>in</strong> ra<strong>in</strong>bow trout (Salmo<br />
gairdneri). World Rev Nutr Di<strong>et</strong>. 1990;61:132-72.<br />
924
GROUP 6, SESSION B: METHODS, TOOLS, DATABASES 8 th Int. Conference on <strong>LCA</strong> <strong>in</strong> the<br />
Agri-<strong>Food</strong> Sector, 1-4 Oct <strong>2012</strong><br />
Figure 1. Fish farm system boundaries<br />
Figure 2. Simplified representation of PISC’n’TOOL framework<br />
925
GROUP 6, SESSION B: METHODS, TOOLS, DATABASES 8 th Int. Conference on <strong>LCA</strong> <strong>in</strong> the<br />
Agri-<strong>Food</strong> Sector, 1-4 Oct <strong>2012</strong><br />
178. <strong>Food</strong> and climate change: FOODpr<strong>in</strong>t as a tool to support GHG<br />
reduction <strong>in</strong> the Thai agri-food sector<br />
Shabbir H. Gheewala 1,2,* , Rattanawan Mungkung 3<br />
1 The Jo<strong>in</strong>t Graduate School of Energy and Environment (JGSEE), K<strong>in</strong>g Mongkut’s University of Technology<br />
Thonburi, Bangkok, Thailand, 2 Center for Energy Technology and Environment, M<strong>in</strong>istry of Education,<br />
Thailand, 3 Centre of Excellence on enVironmental strategy for GREEN bus<strong>in</strong>ess (VGREEN) and Department<br />
of Environmental Science, Faculty of Science, Kas<strong>et</strong>sart University (KU), Bangkok, Thailand, Correspond<strong>in</strong>g<br />
author. E-mail: shabbir_g@jgsee.kmutt.ac.th<br />
As a lead<strong>in</strong>g food producer and a major exporter, Carbon Footpr<strong>in</strong>t<strong>in</strong>g (CF) and Labell<strong>in</strong>g are seen as useful<br />
tools <strong>in</strong> Thailand to quantify GHG emissions and identify the priority areas for GHG reduction for climate<br />
change mitigation and to stimulate the development of <strong>in</strong>novative technology/management to produce lowercarbon<br />
food products. CF was <strong>in</strong>itiated through academic-<strong>in</strong>dustrial collaborative projects and national pilot<br />
projects lead<strong>in</strong>g to the development of the national CF guidel<strong>in</strong>e as well as carbon footpr<strong>in</strong>t labell<strong>in</strong>g<br />
scheme. Though it has been well taken by the Thai agri-food <strong>in</strong>dustry for a few years already, it is still very<br />
difficult for them to identify the required data, data sources and collection m<strong>et</strong>hods particularly for background<br />
and secondary data. More importantly, they echoed the need for quick CF calculation for effective<br />
bus<strong>in</strong>ess decisions which was limited by their lack of understand<strong>in</strong>g of the underly<strong>in</strong>g scientific background<br />
and m<strong>et</strong>hodological issues (Mungkung <strong>et</strong> al., 2010). These issues are critical especially for small and medium<br />
enterprises (SMEs) who do not always have the necessary comp<strong>et</strong>ence. This has led to the <strong>in</strong>itiative <strong>in</strong><br />
develop<strong>in</strong>g a carbon footpr<strong>in</strong>t calculation tool so called “FOODpr<strong>in</strong>t”, for the Thai agri-food <strong>in</strong>dustry, which<br />
will serve as a means for capacity build<strong>in</strong>g. The development of FOODpr<strong>in</strong>t is be<strong>in</strong>g carried out by<br />
VGREEN-KU, JGSEE and the Federation of Thai Industries tog<strong>et</strong>her with 40 Thai food companies; the studied<br />
products cover<strong>in</strong>g different sectors: agriculture, livestock, fisheries and aquaculture. FOODpr<strong>in</strong>t is based<br />
on spreadshe<strong>et</strong>s, with the flexibility to add on new s<strong>et</strong>s of databases specific to a supply cha<strong>in</strong>. The data requirements<br />
and calculation m<strong>et</strong>hods are based on PAS 2050: 2011 (BSI, 2011). Specific templates for data<br />
<strong>in</strong>put and for CF calculation for plant/animal-based production systems, process<strong>in</strong>g, packag<strong>in</strong>g, transport of<br />
<strong>in</strong>puts/distribution, sales, pre-consumption, and post-consumption waste management are <strong>in</strong>cluded. A user<br />
guidel<strong>in</strong>e of FOODpr<strong>in</strong>t provides the pr<strong>in</strong>ciples, m<strong>et</strong>hodology and practical approach for data collection,<br />
transformation and <strong>in</strong>put. The CF results are illustrated <strong>in</strong> tables and graphs show<strong>in</strong>g contribution analysis,<br />
<strong>in</strong>clud<strong>in</strong>g comparison with similar products from previous studies for benchmark<strong>in</strong>g. Possible strategies to<br />
reduce GHG emissions are suggested for further analysis and the high-level analysis of each option is calculated<br />
and compared for management decisions. This also fits well for develop<strong>in</strong>g Nationally Appropriate<br />
Mitigation Actions (NAMA), support<strong>in</strong>g wider application of carbon footpr<strong>in</strong>t<strong>in</strong>g and labell<strong>in</strong>g, as well as to<br />
anticipate the mark<strong>et</strong> requirement of carbon labell<strong>in</strong>g both for domestic and export products, which will contribute<br />
to climate change mitigation and promote low-carbon trade b<strong>et</strong>ween Thailand and EU. This will also<br />
lead to a synergistic effect of this project with the EU's exist<strong>in</strong>g Integrated Product Policy (IPP) which aims<br />
to improve the environmental performance of products along their life cycle. As Thailand is the very first<br />
country <strong>in</strong> ASEAN tak<strong>in</strong>g <strong>in</strong>itiative on carbon footpr<strong>in</strong>t<strong>in</strong>g and labell<strong>in</strong>g, the knowledge and experiences<br />
ga<strong>in</strong>ed from this project can be shared with other ASEAN countries through the collaborative framework of<br />
“ASEAN Climate Change Initiative: ACCI” for jo<strong>in</strong>t response and efforts to combat climate change.<br />
References<br />
Mungkung R., Gheewala, S., Bonn<strong>et</strong>, S., Hospido, A., Kanyarushoki, C., van der Werf, H. and Poovarodom,<br />
N. 2010. Carbon Footpr<strong>in</strong>t<strong>in</strong>g and Labell<strong>in</strong>g: Experiences from the Thai food <strong>in</strong>dustry Available onl<strong>in</strong>e:<br />
http://www.thaicarbonlabel.sci.ku.ac.th/<br />
BSI, 2011. PAS 2050:2011. Specification for the assessment of the life cycle greenhouse gas emissions of<br />
goods and services. British Standards Institution<br />
926
GROUP 6, SESSION B: METHODS, TOOLS, DATABASES 8 th Int. Conference on <strong>LCA</strong> <strong>in</strong> the<br />
Agri-<strong>Food</strong> Sector, 1-4 Oct <strong>2012</strong><br />
179. D<strong>et</strong>erm<strong>in</strong><strong>in</strong>g greenhouse gas emissions profiles for Australian<br />
agricultural products at a regional scale: m<strong>et</strong>hodological opportunities<br />
and obstacles<br />
Philippa M Brock 1,* , Phillip Graham 1 , David F Herridge 2 , Patrick Madden 1 , Graeme D Schwenke 1<br />
1 Department of Primary Industries, New South Wales, Australia, 2 University of New England, New South<br />
Wales, Australia, Correspond<strong>in</strong>g author. E-mail: pip.brock@<strong>in</strong>dustry.nsw.gov.au<br />
Life Cycle Assessments (<strong>LCA</strong>s) of greenhouse gas emissions associated with agriculture have commonly<br />
been conducted at a farm scale (case study) or emissions are calculated at a national scale. However, until<br />
recently, there has tended to be a scarcity of regionally-applicable assessments. This may be partly due to<br />
difficulties <strong>in</strong> obta<strong>in</strong><strong>in</strong>g representative data that account for variability <strong>in</strong> agricultural production systems.<br />
However, for national policies to be regionally applicable and for landholders to identify opportunities for<br />
practice change, it is essential that <strong>in</strong>ter- and <strong>in</strong>tra-regional differences be b<strong>et</strong>ter understood. We contend that<br />
by accommodat<strong>in</strong>g variability, highly robust regional <strong>LCA</strong>s can be built and that this broader analysis will<br />
improve our understand<strong>in</strong>g about the representativeness of exist<strong>in</strong>g case-studies.<br />
We have found the greatest opportunity for emissions reduction <strong>in</strong> cropp<strong>in</strong>g systems to be replac<strong>in</strong>g synth<strong>et</strong>ic<br />
nitrogenous fertilisers with biologically fixed N, with emissions from a legume-based system found to be<br />
33% of those from a non-legume system (Fig. 1; Table 1). Other factors which greatly <strong>in</strong>fluence calculated<br />
emissions per unit of product are yield variation across seasons and the choice of direct nitrous oxide emissions<br />
factor (Brock <strong>et</strong> al. accepted; Herridge <strong>et</strong> al. 2011; Schwenke <strong>et</strong> al. 2011). We have also found variability<br />
<strong>in</strong> emissions from sheep enterprises, rang<strong>in</strong>g from 39% reduction for change <strong>in</strong> enterprise emphasis from<br />
wool to meat production (Table 2), to approximately 28% variability for change <strong>in</strong> wool price or calculation<br />
m<strong>et</strong>hod, to 23% variability for change <strong>in</strong> fibre diam<strong>et</strong>er, to 10% variability for change <strong>in</strong> fleece weight<br />
(Brock <strong>et</strong> al. <strong>in</strong> preparation.; Graham <strong>et</strong> al. 2010).<br />
To account for this variability, we are:<br />
1. obta<strong>in</strong><strong>in</strong>g regional-level data, <strong>in</strong>clud<strong>in</strong>g measures of variability, from research and extension staff<br />
2. provid<strong>in</strong>g d<strong>et</strong>ailed documentation about the variables and discuss<strong>in</strong>g other environmental effects<br />
3. test<strong>in</strong>g the sensitivity of the emissions profile by chang<strong>in</strong>g the param<strong>et</strong>er values for formulas constructed<br />
<strong>in</strong> SimaPro and checked aga<strong>in</strong>st FarmGAS<br />
4. apply<strong>in</strong>g data from <strong>in</strong>strumented regional field trials<br />
5. test<strong>in</strong>g the effect of changes <strong>in</strong> economic allocation <strong>in</strong> animal production systems<br />
6. us<strong>in</strong>g data from modell<strong>in</strong>g packages, such as GrassGro, to compare long and short term variability.<br />
The variability associated with many <strong>LCA</strong> <strong>in</strong>puts and lack of enterprise-level seasonally-specific data makes<br />
farm-scale (case-study) assessment problematic. It seems highly desirable for there to be greater focus on<br />
regional-scale <strong>LCA</strong>, to support both test<strong>in</strong>g of national policies and on-farm emissions reduction.<br />
References<br />
Brock, P., Madden, P., Schwenke, G., Herridge, D. Greenhouse gas emissions profile for 1 tonne of wheat<br />
produced <strong>in</strong> Central Zone (East) New South Wales: A Life Cycle Assessment approach. Crop and Pasture<br />
Science, accepted.<br />
Brock, P., Graham, P., Madden, P. Greenhouse gas emissions profile for 1 kg of wool produced <strong>in</strong> the Yass<br />
Region, New South Wales: A Life Cycle Assessment approach. Animal Production Science, <strong>in</strong> prep.<br />
Graham, P. 2010. Bookham Graz<strong>in</strong>g Demonstration Results. Department of Primary Industries, Yass NSW.<br />
Herridge, D., Schwenke, G., Brock, P. 2011. Nitrogen-fix<strong>in</strong>g chickpea underp<strong>in</strong> productive, susta<strong>in</strong>able<br />
farm<strong>in</strong>g systems <strong>in</strong> Australia’s Northern Gra<strong>in</strong>s Region. Proceed<strong>in</strong>gs of the 25th Lat<strong>in</strong> American Conference<br />
on Rhizobiology, 9 Sep 2011, Uruguay.<br />
Schwenke, G., Brock, P., Herridge, D. 2011. Nitrogen-fix<strong>in</strong>g legumes <strong>in</strong> farm<strong>in</strong>g systems reduce greenhouse<br />
gas emissions. Proceed<strong>in</strong>gs of the 17th International Congress on Nitrogen Fixation, 27 Nov - 1 Dec,<br />
Fremantle, Western Australia.<br />
927
GROUP 6, SESSION B: METHODS, TOOLS, DATABASES 8 th Int. Conference on <strong>LCA</strong> <strong>in</strong> the<br />
Agri-<strong>Food</strong> Sector, 1-4 Oct <strong>2012</strong><br />
Table 1. Total greenhouse gas emissions for canola-wheat and chickpea-wheat production systems with different<br />
levels of fertiliser N, i.e. zero (0N) or 80 kg N/ha (80N)<br />
928<br />
Pre-farm and on-farm<br />
emissions year 1 (kg<br />
CO2-e/ha)<br />
Pre-farm and on-farm<br />
emissions year 2 (kg<br />
CO2-e/ha)<br />
Rotation A<br />
Total emissions per ha<br />
over 2 years (kg CO2-e)<br />
Canola (80N)–wheat<br />
(80N)<br />
896 908 1804<br />
Chickpea<br />
wheat (80N)<br />
(0N)–<br />
306 848 1154<br />
Chickpea<br />
wheat (0N)<br />
(0N)–<br />
306 297 603 B<br />
A B<br />
The canola and chickpea crops yielded 1.8 t/ha; the three wheat crops yielded 3.0 t/ha; Total emissions<br />
from chickpea (0N)–wheat (0N) are 33% of those from canola (80N)–wheat (80N); us<strong>in</strong>g eco<strong>in</strong>vent and the<br />
Australasian LCI database updated May <strong>2012</strong>.<br />
Table 2. Sensitivity of the emissions profile for sheep enterprises to changes <strong>in</strong> enterprise from wool dom<strong>in</strong>ance<br />
to the production of first-cross lambs<br />
Total emis-<br />
Value Value Value of<br />
sions (kg<br />
of wool of mut- lamb/live Enteric m<strong>et</strong>hane (kg CO2-e/kg<br />
Enterprise type (%) ton (%) animal (%)<br />
/ha)<br />
greasy wool)<br />
19-micron wool production 56 32 12 99.1 A 25.6<br />
19-micron ewes jo<strong>in</strong>ed to 30 11 60 94.0 + emissions from 15.5<br />
Dors<strong>et</strong> rams for meat pro-<br />
production of feed and<br />
duction<br />
replacement ewes<br />
B,C<br />
A Based on daily modell<strong>in</strong>g for the 51-year long-term average period; B Includes emissions from the production<br />
of wheat (0.157 kg CO2-e) and replacement ewes (2.29 kg CO2-e); C Emissions decreased by 39% due to<br />
change <strong>in</strong> enterprise emphasis.<br />
Figure 1. Greenhouse gas emissions (kg CO2-e) from the production of 1 tonne of wheat <strong>in</strong> Central Zone<br />
(East) NSW, Australia.
GROUP 6, SESSION B: METHODS, TOOLS, DATABASES 8 th Int. Conference on <strong>LCA</strong> <strong>in</strong> the<br />
Agri-<strong>Food</strong> Sector, 1-4 Oct <strong>2012</strong><br />
180. Energy analysis of agricultural systems: uncerta<strong>in</strong>ty associated<br />
with energy coefficients non-adapted to local conditions<br />
Mathieu Vigne * , Philippe Faverd<strong>in</strong>, Jean-Louis Peyraud<br />
1 INRA, UMR PEGASE, Doma<strong>in</strong>e de la Prise, 35590 Sa<strong>in</strong>t-Gilles, <strong>France</strong>, Correspond<strong>in</strong>g author. E-mail:<br />
mathieu.vigne@rennes.<strong>in</strong>ra.fr<br />
Among studied impacts <strong>in</strong> Life Cycle Analysis, fossil energy use has been widely considered. But choice of<br />
energy coefficients from the literature and their ability to express accurately local conditions is questioned<br />
for territories where references for <strong>in</strong>puts life-cycle are lack<strong>in</strong>g. This study measured fossil energy use <strong>in</strong><br />
dairy farms and assessed uncerta<strong>in</strong>ty associated to energy coefficients <strong>in</strong> order to improve energy analysis<br />
m<strong>et</strong>hodology of agricultural systems.<br />
Fossil energy use for forty two dairy farms from Poitou-Charentes (PC) and thirty from Reunion Island (RI)<br />
have been analysed us<strong>in</strong>g PLANETE for PC (Bochu, 2002) and PLANETE MASCAREIGNES for RI<br />
(Thevenot <strong>et</strong> al., 2010). Uncerta<strong>in</strong>ty analysis and sensitivity analysis has been conducted through the SIM-<br />
LAB tool (Saltelli <strong>et</strong> al., 2004). Uncerta<strong>in</strong>ty analysis consisted <strong>in</strong> a Monte-Carlo m<strong>et</strong>hodology: 30,000 s<strong>et</strong>s of<br />
energy coefficients have been randomly drawn from a uniform law b<strong>et</strong>ween m<strong>in</strong>imum and maximum values<br />
found <strong>in</strong> the literature for each energy coefficients. Uncerta<strong>in</strong>ty is expressed by 95% confidence <strong>in</strong>terval of<br />
average fossil energy use <strong>in</strong> megajoule per litre of milk produced (MJ.l -1 ). Estimation of sensitivity of energy<br />
coefficients is based on similar drawn and has been studied through the calculation of the Standardised Regression<br />
Coefficient (SRC).<br />
Estimated probability distribution is reported <strong>in</strong> Fig. 1. M<strong>in</strong>imum and maximum values for 95% confidence<br />
<strong>in</strong>terval are respectively 3.6 and 5.0MJ.l -1 for PC and 5.8 to 8.2MJ.l -1 for Run. The correspond<strong>in</strong>g variabilities<br />
from mean were ±16% and ±17% respectively for PC and RI. Whereas they could appear low, these<br />
values question comparison of systems from different territories. Among the s<strong>et</strong> of coefficients chosen, difference<br />
b<strong>et</strong>ween the territories could appear large or conversely equal when consider<strong>in</strong>g higher values for PC<br />
and lower values for RI. This results highlights need for a common m<strong>et</strong>hodology for calculation of energy<br />
coefficients. This could enable to calculate energy coefficients adapted to local conditions and to produce<br />
accurate values of energy use of agricultural systems. Such m<strong>et</strong>hod should concern clear def<strong>in</strong>ition of system<br />
boundaries <strong>in</strong> <strong>in</strong>direct energy assessment and promote precise <strong>in</strong>vestigation of the technology used <strong>in</strong> the<br />
different processes.<br />
SRCs obta<strong>in</strong>ed for the different energy coefficients (Table 1) showed that the most sensitive energy coefficients<br />
are not the same <strong>in</strong> the two territories. Energy coefficient for concentrate feeds is ma<strong>in</strong>ly responsible<br />
of this uncerta<strong>in</strong>ty for RI farms whereas it is a comb<strong>in</strong>ation of several energy coefficients for PC farms (electricity,<br />
concentrate feeds, animal build<strong>in</strong>gs, fuel, N fertiliser). Calculation of adapted energy coefficients<br />
could be associated to a prelim<strong>in</strong>ary sensitivity analysis through m<strong>in</strong>imum and maximum values of energy<br />
coefficients found <strong>in</strong> the literature <strong>in</strong> order to focus on the most <strong>in</strong>fluential energy coefficients and to fit an<br />
appropriate value for them. This will avoid adapt<strong>in</strong>g all energy coefficients which could be time-consumer.<br />
Non<strong>et</strong>heless, energy coefficients do not represent the only source of uncerta<strong>in</strong>ty <strong>in</strong> energy analysis. Uncerta<strong>in</strong>ty<br />
related to <strong>in</strong>puts data could be decrease as done <strong>in</strong> our study with large surveys of real farms and <strong>in</strong>dividual<br />
economic follow-up surveys based on representative years. Uncerta<strong>in</strong>ty related to the m<strong>et</strong>hodology<br />
could be decrease, <strong>in</strong> addition to common m<strong>et</strong>hodology for energy coefficients, by common choice of allocation<br />
m<strong>et</strong>hod.<br />
References<br />
Bochu, J.L., 2002. PLANETE: Méthode pour l’analyse énergétique des exploitations agricoles <strong>et</strong><br />
l’évaluation des émissions de gaz à eff<strong>et</strong> de serre. Colloque national: Quels diagnostics pour quelles actions<br />
agroenvironnementales? Toulouse, <strong>France</strong>.<br />
Saltelli, A. Tarantola, S., Campolongo, F., Ratto, M., 2004. Sensitivity Analysis <strong>in</strong> Practice. A Guide to Assess<strong>in</strong>g<br />
Scientific Models. Probability and Statistics Series, John Wiley & Sons Publishers.<br />
Thévenot A., Vigne M., Vayssières J., 2011. Référentiel pour l’analyse énergétique <strong>et</strong> l’analyse du pouvoir<br />
de réchauffement global des exploitations d’élevage à La Réunion. CIRAD-FRCA, Sa<strong>in</strong>t-Pierre, <strong>France</strong>.<br />
929
GROUP 6, SESSION B: METHODS, TOOLS, DATABASES 8 th Int. Conference on <strong>LCA</strong> <strong>in</strong> the<br />
Agri-<strong>Food</strong> Sector, 1-4 Oct <strong>2012</strong><br />
Probability<br />
3 4 5 6 7 8 9<br />
Fossil Energy Use (MJ.L<br />
Figure 1. Probability distribution of energy use for dairy farms from (a) Poitou-Charentes and (b) Reunion<br />
Island calculated with the 30,000 s<strong>et</strong>s of energy coefficients<br />
-1 of raw milk)<br />
Table 1. Standardised Regression Coefficients (SRC) of the five most <strong>in</strong>fluential energy coefficients for Poitou-Charentes<br />
and Reunion Island dairy farms<br />
Poitou-Charentes Reunion Island<br />
930<br />
0.12<br />
0.10<br />
0.08<br />
0.06<br />
0.04<br />
0.02<br />
0.00<br />
Energy coefficients SRC Energy coefficients SRC<br />
Electricity<br />
Concentrate feeds<br />
Animal build<strong>in</strong>gs<br />
Fuel<br />
N fertiliser<br />
0.53<br />
0.51<br />
0.47<br />
0.38<br />
0.27<br />
Concentrate feeds<br />
Tractor<br />
Fuel<br />
Electricity<br />
Animal build<strong>in</strong>gs<br />
0.91<br />
0.25<br />
0.17<br />
0.15<br />
0.14<br />
Poitou-Charentes<br />
Reunion Island
GROUP 6, SESSION B: METHODS, TOOLS, DATABASES 8 th Int. Conference on <strong>LCA</strong> <strong>in</strong> the<br />
Agri-<strong>Food</strong> Sector, 1-4 Oct <strong>2012</strong><br />
181. Uncerta<strong>in</strong>ty analysis <strong>in</strong> a comparative <strong>LCA</strong> b<strong>et</strong>ween organic and<br />
conventional farm<strong>in</strong>g of soybean and barley<br />
Monia Niero * , Alessandro Manzardo, Sara Toniolo, Filippo Zuliani, Antonio Scipioni<br />
CESQA (Quality and Environmental Research Centre), University of Padova, Department of Industrial Eng<strong>in</strong>eer<strong>in</strong>g,<br />
Via Marzolo 9, 35131 Padova, Italy, * Correspond<strong>in</strong>g author. E-mail: monia.niero@unipd.it<br />
There are several m<strong>et</strong>hods based on different approaches to quantify and analyse uncerta<strong>in</strong>ty (Lloyd and<br />
Ries, 2007). One of the ma<strong>in</strong> advantages of the uncerta<strong>in</strong>ty analysis m<strong>et</strong>hod used with<strong>in</strong> Eco<strong>in</strong>vent database<br />
(Frischknecht <strong>et</strong> al., 2005) is to d<strong>et</strong>erm<strong>in</strong>e a correlation b<strong>et</strong>ween data quality and the uncerta<strong>in</strong>ty of LCIA<br />
results (Cooper and Kahn, <strong>2012</strong>).<br />
The objective of this research is to test the effectiveness of the uncerta<strong>in</strong>ty analysis m<strong>et</strong>hodology developed<br />
by Scipioni <strong>et</strong> al. (2009) <strong>in</strong> the case of a comparative Life Cycle Assessment. The uncerta<strong>in</strong>ties on the <strong>LCA</strong><br />
<strong>in</strong>put come from a qualitative assessment by data quality <strong>in</strong>dicators based on the pedigree matrix. The research<br />
considered two different cultivation techniques: organic (system A) and conventional (system B)<br />
farm<strong>in</strong>g of a 3-year crop cycle for the production of soybean <strong>in</strong> the first and third year and barley <strong>in</strong> the second<br />
year of the triennial crop. The <strong>LCA</strong> study was conducted <strong>in</strong> accordance with the ISO 14040 standards<br />
(ISO 2006a,b), us<strong>in</strong>g the ReCiPe 2008 m<strong>et</strong>hodology for the LCIA step (Goedkoop <strong>et</strong> al., 2008). The functional<br />
unit was 1 kg of seeds, composed respectively by 2/3 kg of soybean from first and third years of the 3year<br />
cycle and 1/3 kg of barley from second production year. The results of the comparison b<strong>et</strong>ween the two<br />
farm<strong>in</strong>g systems at damage category level (Fig. 1.)<br />
Concern<strong>in</strong>g the damage category resources, conventional farm<strong>in</strong>g presents higher impacts than organic, because<br />
of the resources (oil and gas) used <strong>in</strong> the production of triple superphosphate and urea fertilisers. On<br />
the other hand the damage to ecosystems is higher for organic farm<strong>in</strong>g, because of the lower crop yields.<br />
With<strong>in</strong> human health end-po<strong>in</strong>t category results, it is controversial to d<strong>et</strong>erm<strong>in</strong>e which is the best option,<br />
because of the m<strong>in</strong>or differences among the two farm<strong>in</strong>g systems. The first step of the uncerta<strong>in</strong>ty analysis<br />
allowed the selection of the ma<strong>in</strong> param<strong>et</strong>ers contribut<strong>in</strong>g to the uncerta<strong>in</strong>ty for both the systems under study,<br />
through a contribution analysis at the damage assessment level, with 1% cut-off and the assignment of a<br />
probability distribution. The most <strong>in</strong>fluenc<strong>in</strong>g <strong>in</strong>put data for the human health category are shown <strong>in</strong> Table 1.<br />
The second step <strong>in</strong>cluded the quantitative uncerta<strong>in</strong>ty analysis through Monte Carlo simulation (10 3 iterations),<br />
consider<strong>in</strong>g the number of comparison runs <strong>in</strong> which organic farm<strong>in</strong>g (A) is larger than conventional<br />
farm<strong>in</strong>g (B) (Fig. 2).<br />
The m<strong>et</strong>hods developed by Scipioni <strong>et</strong> al. (2009) showed its effectiveness when applied to comparative <strong>LCA</strong>.<br />
The results confirmed that for human health there are no significant differences among the two farm<strong>in</strong>g systems.<br />
F<strong>in</strong>ally, the application of the two step m<strong>et</strong>hodology for the quantification of uncerta<strong>in</strong>ty connected<br />
with the results allowed to def<strong>in</strong>e to which extent the LCIA results at damage level are reliable.<br />
References<br />
Cooper, J.S., Kahn E., <strong>2012</strong>. Commentary on issues <strong>in</strong> data quality analysis <strong>in</strong> life cycle assessment. Int J<br />
Life Cycle Assess doi10.1007/s11367-011-0371-x.<br />
Frischknecht, R., Jungbluth, N., Althaus, H.J., Doka, G., Dones, R., Heck, T., Hellweg, S., Hischer, R., Nemecek,<br />
T., Rebitzer, G., Spielmann, M., 2005. The eco<strong>in</strong>vent database: overview and m<strong>et</strong>hodological<br />
framework. Int J Life Cycle Assess 10 (1), 3–9.<br />
Goedkoop, M., Heijungs, R., Huijbregts M, De Schryver, A., Struje, J., van Zelm, R., 2009. ReCiPe 2008. A<br />
life cycle impact assessment m<strong>et</strong>hod which comprises harmonised category <strong>in</strong>dicators at the midpo<strong>in</strong>t and<br />
then endpo<strong>in</strong>t level. First edition, Report I: Characterisation.<br />
ISO, 2006a. Environmental management. Life cycle assessment. Pr<strong>in</strong>ciple and Framework. ISO 14040:2006.<br />
International Organization for Standardisation, Geneva, CH.<br />
ISO, 2006b. Environmental management. Life cycle assessment. Requirements and Guidel<strong>in</strong>es. ISO<br />
14044:2006. International Organization for Standardisation (ISO), Geneva, CH.<br />
Lloyd, S.M., Ries, R., 2007. Characteriz<strong>in</strong>g, Propagat<strong>in</strong>g, and Analyz<strong>in</strong>g Uncerta<strong>in</strong>ty <strong>in</strong> Life-Cycle Assessment.<br />
A Survey of Quantitative Approaches. J of Ind Ecol 11(1), 161-179.<br />
Scipioni, A., Mazzi, A., Niero, M., Boatto, T., 2009. <strong>LCA</strong> to choose among alternative design solutions: The<br />
case study of a new Italian <strong>in</strong>c<strong>in</strong>eration l<strong>in</strong>e. Waste Manege 29, 2462–2474.<br />
931
GROUP 6, SESSION B: METHODS, TOOLS, DATABASES 8 th Int. Conference on <strong>LCA</strong> <strong>in</strong> the<br />
Agri-<strong>Food</strong> Sector, 1-4 Oct <strong>2012</strong><br />
Table 1. Contribution analysis for the damage category Human health.<br />
Inventory data Organic<br />
%<br />
932<br />
100<br />
90<br />
80<br />
70<br />
60<br />
50<br />
40<br />
30<br />
20<br />
10<br />
0<br />
(A)<br />
Conventional<br />
(B)<br />
Emission from soil management (N2O,<br />
NOx) - soybean<br />
63.2% 43.9%<br />
Emission from soil management (N2O,<br />
NOx) - barley<br />
21.5% 22.0%<br />
Diesel consumption 8.8% 6.3%<br />
Organic compost 2.9% -<br />
Triple superphosphate - 20.0%<br />
Soybean seed 1.7 2.4%<br />
Urea - 3.3%<br />
Other processes 2.0% 1.5%<br />
Human Health Ecosystems Resources<br />
Damage category<br />
Organic (A)<br />
Conventional (B)<br />
Figure 1. LCIA results from the comparative <strong>LCA</strong> b<strong>et</strong>ween organic and conventional farm<strong>in</strong>g of soybean<br />
and barley<br />
Figure 2. Monte Carlo results of the comparison b<strong>et</strong>ween organic (left) and conventional (right) farm<strong>in</strong>g of<br />
soybean and barley
GROUP 6, SESSION B: METHODS, TOOLS, DATABASES 8 th Int. Conference on <strong>LCA</strong> <strong>in</strong> the<br />
Agri-<strong>Food</strong> Sector, 1-4 Oct <strong>2012</strong><br />
182. Analysis and propagation of uncerta<strong>in</strong>ty <strong>in</strong> agricultural <strong>LCA</strong><br />
Xiaobo Chen 1,2,* , Michael Corson 1,2<br />
1 INRA, UMR1069 Sol Agro <strong>et</strong> hydrosystème Spatialisation, F-35000 Rennes, <strong>France</strong>, 2 Agrocampus Ouest,<br />
F-35000 Rennes, <strong>France</strong>, Correspond<strong>in</strong>g author. E-mail: xiaobo.chen@rennes.<strong>in</strong>ra.fr<br />
The confidence <strong>in</strong> <strong>LCA</strong> results depends primarily on the quality of source data and their pert<strong>in</strong>ence for the<br />
system studied. However, the need for large amounts of data leads to much uncerta<strong>in</strong>ty <strong>in</strong> impact estimates<br />
due to the data themselves: measurement, use <strong>in</strong> calculations, and f<strong>in</strong>al transformation <strong>in</strong>to impact estimates.<br />
The ma<strong>in</strong> sources of uncerta<strong>in</strong>ty <strong>in</strong> the data cha<strong>in</strong> <strong>in</strong>clude not only statistical uncerta<strong>in</strong>ty (mean and standard<br />
deviation) of the data, but also m<strong>et</strong>hodological choices <strong>in</strong> <strong>LCA</strong>, such as hypotheses made to represent the<br />
system of <strong>in</strong>terest, data representativeness, impact assessment m<strong>et</strong>hods, and allocation of impacts b<strong>et</strong>ween<br />
co-products. Therefore, consideration of uncerta<strong>in</strong>ty <strong>in</strong> <strong>LCA</strong> would provide more scientific <strong>in</strong>formation for<br />
decision mak<strong>in</strong>g. This topic is the focus of doctoral research recently begun at INRA that aims to (1) identify<br />
sources of uncerta<strong>in</strong>ty <strong>in</strong> agricultural-production systems, (2) analyse their propagation, and (3) estimate<br />
their relative contributions to the overall uncerta<strong>in</strong>ty <strong>in</strong> calculated impacts.<br />
Although some texts describe uncerta<strong>in</strong>ty generally as a lack of knowledge, its def<strong>in</strong>ition may change depend<strong>in</strong>g<br />
on the <strong>LCA</strong> steps <strong>in</strong> which it occurs (Huijbregts, 1998). Therefore, uncerta<strong>in</strong>ty is often classified<br />
accord<strong>in</strong>g to its nature and source (e.g., “natural” (i.e., variability) vs. “epistemic”; Van Asselt and Rotmans,<br />
2002). Epistemic uncerta<strong>in</strong>ty has been subdivided <strong>in</strong>to three sources: scenario, model and param<strong>et</strong>er (Fig. 1).<br />
This first step allows uncerta<strong>in</strong>ties from each source to be evaluated by correspond<strong>in</strong>g approaches.<br />
Monte-Carlo analysis is used most frequently to evaluate uncerta<strong>in</strong>ty <strong>in</strong> <strong>LCA</strong> (Bass<strong>et</strong>-Mens, 2009). With it<br />
one can estimate the <strong>in</strong>fluence of uncerta<strong>in</strong>ties <strong>in</strong> <strong>in</strong>put variables (us<strong>in</strong>g their probability distributions) on<br />
predicted potential impacts. However, this approach suffers some m<strong>et</strong>hodological bias due to correlations<br />
b<strong>et</strong>ween variables and poorly-known response rules. For example, the selection of appropriate distributions<br />
is usually based on literature, expert judgment, or empirical studies <strong>in</strong> other systems, which may <strong>in</strong>crease the<br />
complexity of model and param<strong>et</strong>er uncerta<strong>in</strong>ty. Moreover, Monte-Carlo simulation is commonly used for<br />
assess<strong>in</strong>g the <strong>in</strong>fluence of uncerta<strong>in</strong>ty <strong>in</strong> emission factors <strong>in</strong> LCIA, but it may not be appropriate for uncerta<strong>in</strong>ty<br />
<strong>in</strong> other steps, such as the def<strong>in</strong>ition of scope or functional unit or the <strong>in</strong>terpr<strong>et</strong>ation of results that consist<br />
of both subjective and objective uncerta<strong>in</strong>ty (Fig. 2). Although it is not necessary or possible to consider<br />
all uncerta<strong>in</strong>ties <strong>in</strong> <strong>LCA</strong>, subjective uncerta<strong>in</strong>ty should not be overlooked. More complex approaches (e.g.,<br />
fuzzy logic) exist, but their use rema<strong>in</strong>s marg<strong>in</strong>al. Currently, the m<strong>et</strong>hods used to describe uncerta<strong>in</strong>ty propagation<br />
<strong>in</strong> <strong>LCA</strong> have not tried to differentiate the various types of uncerta<strong>in</strong>ty but rather to aggregate them.<br />
Thus, more research is necessary to overcome barriers to analys<strong>in</strong>g uncerta<strong>in</strong>ty <strong>in</strong> <strong>LCA</strong>.<br />
Thesis work will beg<strong>in</strong> by identify<strong>in</strong>g and classify<strong>in</strong>g uncerta<strong>in</strong>ty <strong>in</strong> each <strong>LCA</strong> step, especially uncerta<strong>in</strong>ties<br />
frequently encountered when assess<strong>in</strong>g agricultural systems. With case studies, the research will identify the<br />
most important uncerta<strong>in</strong>ties, develop m<strong>et</strong>hods to categorise them, and work to estimate the contribution of<br />
each source of uncerta<strong>in</strong>ty to the overall uncerta<strong>in</strong>ty <strong>in</strong> output. By consider<strong>in</strong>g uncerta<strong>in</strong>ty <strong>in</strong> agricultural<br />
<strong>LCA</strong>, more compl<strong>et</strong>e <strong>in</strong>formation about environmental impacts can be given to decision-makers, who should<br />
consider uncerta<strong>in</strong>ty as an important part of decision analysis.<br />
References<br />
Bass<strong>et</strong>-Mens, C., Kelliher, F.M., Ledgard, S., Cox, N., 2009. Uncerta<strong>in</strong>ty of global warm<strong>in</strong>g potential for<br />
milk production on a New Zealand farm and implications for decision mak<strong>in</strong>g. Int. J.<strong>LCA</strong> 14, 630-638.<br />
IPCS, 2008. Uncerta<strong>in</strong>ty and Data Quality <strong>in</strong> Exposure Assessment. Geneva, World Health Organization,<br />
International Programme on Chemical Saf<strong>et</strong>y (Harmonization Project Document No. 6).<br />
Huijbregts, M.A.J., 1998. Application of uncerta<strong>in</strong>ty and variability <strong>in</strong> <strong>LCA</strong>. Part I: a general framework for<br />
the analysis of uncerta<strong>in</strong>ty and variability <strong>in</strong> life cycle assessment. Int. J. <strong>LCA</strong> 3, 273-280.<br />
Van Asselt, M.B.A., Rotmans, J., 2002. Uncerta<strong>in</strong>ty <strong>in</strong> <strong>in</strong>tegrated assessment modell<strong>in</strong>g. Int. J. <strong>LCA</strong> 54, 75-<br />
105.<br />
933
GROUP 6, SESSION B: METHODS, TOOLS, DATABASES 8 th Int. Conference on <strong>LCA</strong> <strong>in</strong> the<br />
Agri-<strong>Food</strong> Sector, 1-4 Oct <strong>2012</strong><br />
Figure 1. Classification of uncerta<strong>in</strong>ty types (Van Asselt and Rotmans, 2002; IPCS, 2008).<br />
Figure 2. Uncerta<strong>in</strong>ties <strong>in</strong> different steps of <strong>LCA</strong>.<br />
934
GROUP 6, SESSION B: METHODS, TOOLS, DATABASES 8 th Int. Conference on <strong>LCA</strong> <strong>in</strong> the<br />
Agri-<strong>Food</strong> Sector, 1-4 Oct <strong>2012</strong><br />
183. Quantify<strong>in</strong>g the impact of <strong>in</strong>-data variability and uncerta<strong>in</strong>ty on<br />
the life cycle assessment of dairy products<br />
Jacob Fels<br />
University of Witten/Herdecke, Center for Susta<strong>in</strong>able Leadership, Alfred-Herrhausen-Str. 50, 58448 Witten,<br />
Germany, E-mail: jacob.fels@uni-wh.de<br />
Calculat<strong>in</strong>g the Carbon Footpr<strong>in</strong>t (CF) of consumer goods is of <strong>in</strong>creas<strong>in</strong>g importance. Many “cradle-tor<strong>et</strong>ail”<br />
CFs are dom<strong>in</strong>ated by the climate impact result<strong>in</strong>g from the production of raw materials especially<br />
animal based raw materials. In many cases process<strong>in</strong>g, transportation and production processes are play<strong>in</strong>g<br />
m<strong>in</strong>or roles. With<strong>in</strong> this context, the ratio of animal raw materials to the overall recipe weight is of particular<br />
relevance. Given the current degree of standardisation <strong>in</strong> CF calculations and the accuracy of exist<strong>in</strong>g Product<br />
Category Rules (PCR), differences, variability and uncerta<strong>in</strong>ty of CFs is highly cont<strong>in</strong>gent on assertions,<br />
m<strong>et</strong>hodological choices, different assumptions, geographical and temporal scopes, data selection and data<br />
aggregation. For <strong>in</strong>stance, as Henriksson <strong>et</strong> al. (2011) have shown, the CF of milk varied b<strong>et</strong>ween -17% and<br />
+17% from the mean due to management differences b<strong>et</strong>ween Swedish dairy farms. The present study contributes<br />
to the quantification and analysis of the uncerta<strong>in</strong>ty <strong>in</strong> CFs. The study’s f<strong>in</strong>d<strong>in</strong>gs concern<strong>in</strong>g the<br />
causes, magnitude and sources of variability and uncerta<strong>in</strong>ty <strong>in</strong> CFs can provide the basis for the def<strong>in</strong>ition of<br />
PCRs and contribute to the overall understand<strong>in</strong>g of CFs.<br />
This study exam<strong>in</strong>es the <strong>in</strong>fluence of different assumptions perta<strong>in</strong><strong>in</strong>g to the dairy sector on the results of a<br />
CF for 1kg energy-corrected milk (ECM). This study concentrates on <strong>in</strong>-data variability and uncerta<strong>in</strong>ty concern<strong>in</strong>g<br />
the pre-farm-gate phase. Besides focus<strong>in</strong>g on <strong>in</strong>-data variability a param<strong>et</strong>er relat<strong>in</strong>g to m<strong>et</strong>hodological<br />
choices is <strong>in</strong>cluded by analys<strong>in</strong>g the <strong>in</strong>fluence of economic allocation. (For param<strong>et</strong>ers see Table 1.) To<br />
quantify the uncerta<strong>in</strong>ty <strong>in</strong> the CF and to identify a realistic range of results, empirical boundary values are<br />
identified and assigned to each param<strong>et</strong>er. The subsequent multi-scenario-analysis exam<strong>in</strong>es the impact of<br />
these param<strong>et</strong>ers on the uncerta<strong>in</strong>ty <strong>in</strong> the CF.<br />
While keep<strong>in</strong>g the output data like GHG emissions per kWh electricity <strong>et</strong>c. on a constant level the CF for 1<br />
kg ECM is 1.11kg CO2e without allocation. From all 6 exam<strong>in</strong>ed param<strong>et</strong>ers, the assumed average milk yield<br />
has the greatest <strong>in</strong>fluence on the end-result CF. While us<strong>in</strong>g an empirically supported upper and lower<br />
threshold for the milk yield, the CF of the 1 kg ECM varies b<strong>et</strong>ween -17% and +15% (Table 1).<br />
The f<strong>in</strong>d<strong>in</strong>gs from this study can contribute to the def<strong>in</strong>ition of PCRs <strong>in</strong> the dairy sector. Relatedly, the study<br />
emphasises that PCRs should be evaluated with regard to their potential for reduc<strong>in</strong>g the volatility of CFs.<br />
The study identifies the crucial <strong>in</strong>fluenc<strong>in</strong>g param<strong>et</strong>ers for this purpose. Particular emphasis is given to d<strong>et</strong>erm<strong>in</strong><strong>in</strong>g<br />
the impact of the assumptions concern<strong>in</strong>g the average milk yield on the CF.<br />
References<br />
Belitz, Hans-Di<strong>et</strong>er, Hrsg. (2010) Calculations of emissions from German agriculture 2010/2008. Braunschweig:<br />
vTI, Johann-He<strong>in</strong>rich-von-Thünen-Institut.<br />
Ciroth, A., Fleischer, G., Ste<strong>in</strong>bach, J. (2004). Uncerta<strong>in</strong>ty calculation <strong>in</strong> life cycle assessments. Int J <strong>LCA</strong>,<br />
9(4).<br />
Dorfner, Gerhard, und Guido Hofmann. (2011). Milchreport Bayern 2010 Ergebnisse der B<strong>et</strong>riebszweigabrechnung<br />
Milchproduktion 2009/10. Bayerische Landesanstalt für Landwirtschaft.<br />
Flachowsky, G., Brade, W. (2007). Potenziale zur Reduzierung der M<strong>et</strong>han-Emissionen bei Wiederkäuern.<br />
Züchtungskunde, 79(6), 417–465.<br />
Hirschfeld, Jesko, Weiß, J., Preidl, M., Korbun, T. (2008). Klimawirkungen der Landwirtschaft <strong>in</strong> Deutschland.<br />
Berl<strong>in</strong>: IÖW.<br />
Huijbregts, M. A. J., Gilijamse, W., Ragas, A. M. J., & Reijnders, L. (2003). Evaluat<strong>in</strong>g Uncerta<strong>in</strong>ty <strong>in</strong> Environmental<br />
Life-Cycle Assessment. Environmental Science & Technology, 37(11), 2600-2608.<br />
Henriksson, M., A. Flysjö, C. Cederberg, und C. Swensson. (2011). Variation <strong>in</strong> carbon footpr<strong>in</strong>t of milk due<br />
to management differences b<strong>et</strong>ween Swedish dairy farms. animal 5, 1474-1484.<br />
Statistisches Bundesamt (2009), Milcherzeugung und –verwendung, Fachserie 3 Reihe 4.2.2.<br />
935
GROUP 6, SESSION B: METHODS, TOOLS, DATABASES 8 th Table 1. Param<strong>et</strong>ers, boundary values, and change <strong>in</strong> carbon footpr<strong>in</strong>t (CF).<br />
Int. Conference on <strong>LCA</strong> <strong>in</strong> the<br />
Agri-<strong>Food</strong> Sector, 1-4 Oct <strong>2012</strong><br />
Param<strong>et</strong>er Boundary values Change of CF <strong>in</strong>%<br />
Milk yield (kg ECM/cow and year) 6072 6977 8446 15% -17%<br />
Feed DMI (kg DMI(cow and year) 5653 6242 6830 -6% 6%<br />
Share of concentrated feed <strong>in</strong> DMI (% per kg DMI) 0,18 0,32 0,46 -2% 2%<br />
Lifespan (years) 3,10 3,60 4,10 3% -2%<br />
Quantities of enteric fermentation (kg CH4 per kg DMI) 0,02 0,02 0,03 -7% 3%<br />
Allocation% to milk (based on economic values) 100% 85% 0% -12%<br />
936