Konzern in Zahlen 2004 - hauptversammlung.at
Konzern in Zahlen 2004 - hauptversammlung.at
Konzern in Zahlen 2004 - hauptversammlung.at

Sie wollen auch ein ePaper? Erhöhen Sie die Reichweite Ihrer Titel.
YUMPU macht aus Druck-PDFs automatisch weboptimierte ePaper, die Google liebt.
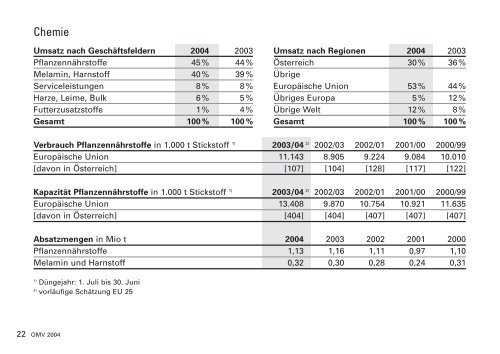
ChemieUms<strong>at</strong>z nach Geschäftsfeldern <strong>2004</strong> 2003 Ums<strong>at</strong>z nach Regionen <strong>2004</strong> 2003Pflanzennährstoffe 45 % 44 % Österreich 30 % 36 %Melam<strong>in</strong>, Harnstoff 40 % 39 % ÜbrigeServiceleistungen 8 % 8 % Europäische Union 53 % 44 %Harze, Leime, Bulk 6 % 5 % Übriges Europa 5 % 12 %Futterzus<strong>at</strong>zstoffe 1 % 4 % Übrige Welt 12 % 8 %Gesamt 100 % 100 % Gesamt 100 % 100 %Verbrauch Pflanzennährstoffe <strong>in</strong> 1.000 t Stickstoff 1) 2003/04 2) 2002/03 2002/01 2001/00 2000/99Europäische Union 11.143 8.905 9.224 9.084 10.010[davon <strong>in</strong> Österreich] [107] [104] [128] [117] [122]Kapazität Pflanzennährstoffe <strong>in</strong> 1.000 t Stickstoff 1) 2003/04 2) 2002/03 2002/01 2001/00 2000/99Europäische Union 13.408 9.870 10.754 10.921 11.635[davon <strong>in</strong> Österreich] [404] [404] [407] [407] [407]Abs<strong>at</strong>zmengen <strong>in</strong> Mio t <strong>2004</strong> 2003 2002 2001 2000Pflanzennährstoffe 1,13 1,16 1,11 0,97 1,10Melam<strong>in</strong> und Harnstoff 0,32 0,30 0,28 0,24 0,311)Düngejahr: 1. Juli bis 30. Juni2)vorläufige Schätzung EU 2522 OMV <strong>2004</strong>