0,1 % = 0,5 % – Stimmt das so? - WIKA Alexander Wiegand SE & Co ...
0,1 % = 0,5 % – Stimmt das so? - WIKA Alexander Wiegand SE & Co ...
0,1 % = 0,5 % – Stimmt das so? - WIKA Alexander Wiegand SE & Co ...

Erfolgreiche ePaper selbst erstellen
Machen Sie aus Ihren PDF Publikationen ein blätterbares Flipbook mit unserer einzigartigen Google optimierten e-Paper Software.
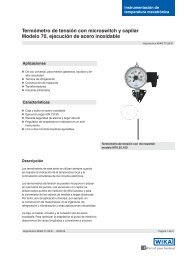
0,1 % = 0,5 % <strong>–</strong> <strong>Stimmt</strong> <strong>das</strong> <strong>so</strong>?<br />
Beherrschen Sie <strong>das</strong> Einmaleins<br />
der Genauigkeitsangaben bei Drucksen<strong>so</strong>ren?<br />
Genauigkeit hat ihren Preis. Je genauer eine Messung sein <strong>so</strong>ll, desto<br />
teurer ist die Messtechnik. Noch teurer aber wird es, wenn durch mangelnde<br />
Genauigkeit des Sen<strong>so</strong>rs die Qualität des damit hergestellten Produktes<br />
leidet. Bei der Auswahl des richtigen Sen<strong>so</strong>rs <strong>so</strong>llte daher auch die<br />
Genauigkeit eine entscheidende Rolle spielen. Dazu muss man sich aber<br />
erst einmal in dem Wirrwarr der Genauigkeitsangaben zurechtfi nden.<br />
Der Begriff »Genauigkeit« existiert<br />
lediglich im Sprachgebrauch der<br />
Anwender. Er ist in keiner Norm defi -<br />
niert. Dennoch ist er in vielen Datenblättern<br />
von Sen<strong>so</strong>ren zu fi nden. Leider<br />
gibt es kein gemeinsames Verständnis<br />
darüber, was Genauigkeit<br />
bedeutet. Es gibt nicht »die Genauigkeit«,<br />
<strong>so</strong>ndern eine Vielzahl von genauigkeitsrelevanten<br />
Angaben. Alle zu -<br />
sammen beschreiben die »Genauigkeit«<br />
eines Gerätes.<br />
Die genauigkeitsrelevanten Faktoren<br />
für Drucksen<strong>so</strong>ren sind normenübergreifend<br />
einheitlich defi niert. Dennoch<br />
lassen sich die Herstellerangaben<br />
kaum miteinander vergleichen,<br />
denn welche und wie Genauigkeitsangaben<br />
im Datenblatt spezifi ziert werden,<br />
ist Herstellersache.<br />
50 <strong>SE</strong>NSOR MAGAZIN 4/2008 <strong>SE</strong>NSOR MARKT<br />
Selbst wenn zwei Hersteller die<br />
gleichen Begriffe verwenden, <strong>so</strong> ist<br />
leider nicht sichergestellt, <strong>das</strong>s auch<br />
<strong>das</strong> Gleiche damit gemeint ist. Häufi g<br />
werden wichtige Zusätze einfach<br />
weggelassen. In der Praxis bedeutet<br />
dies: Zwei Geräte, die auf den ersten<br />
Blick die gleiche »Genauigkeit« zu<br />
haben scheinen, können sich bei<br />
näherer Betrachtung drastisch unterscheiden.<br />
Entsprechend gibt es natürlich<br />
auch den umgekehrten Fall, wie<br />
Abb. 1 zeigt.<br />
Warum zwei Sen<strong>so</strong>ren, die scheinbar<br />
derart unterschiedlichen Genauigkeitsklassen<br />
angehören, in Wirklichkeit<br />
eine nahezu identische Genauigkeit<br />
haben, wird in den folgenden<br />
Abschnitten erläutert.<br />
Die übliche Angabe<br />
Quelle: panthermedia<br />
Für viele Praktiker ist die aussagekräftigste<br />
und daher am häufi gsten<br />
genannte Genauigkeitsangabe die<br />
Nichtlinearität. Fälschlicherweise wird<br />
die Nichtlinearität häufi g als Linearität<br />
bezeichnet. Die Nichtlinearität be -<br />
schreibt, wie »krumm« oder wie »nichtlinear«<br />
eine Kennlinie ist. Sie beschreibt<br />
die größtmögliche Abweichung der<br />
Kennlinie von einer Referenzgeraden.<br />
Es gibt prinzipiell drei Methoden, diese<br />
Referenzgerade zu ermitteln: die<br />
Grenzpunkteinstellung, die Kleinstwerteinstellung<br />
(BFSL) und die Anfangspunkteinstellung.<br />
Wobei letztere aber<br />
eher selten anzutreffen ist.<br />
Bei der Nichtlinearität nach Grenzpunkteinstellung<br />
geht die Referenzgerade<br />
durch den Kennlinienanfang und -ende;<br />
während bei der BFSL-Methode (Best<br />
Fit Straight Line) die Referenzgerade <strong>so</strong><br />
gelegt wird, <strong>das</strong>s die maximale positive<br />
und negative Abweichung gleich groß<br />
ist. Die Nichtlinearität nach Grenzpunkteinstellung<br />
liefert im Vergleich
zur Kleinstwerteinstellung deshalb den<br />
betragsmäßig größeren Fehler. Sie ist<br />
jedoch für den Anwender messtechnisch<br />
am leichtesten nachvollziehbar.<br />
Die Nichtlinearität nach Kleinstwerteinstellung<br />
hingegen ist in vielen<br />
Fällen der aussagekräftigere Wert. Er<br />
be schreibt <strong>das</strong> Potenzial der Kennlinie.<br />
Wie groß der Unterschied zwischen<br />
der Nichtlinearität nach Grenzpunkteinstellung<br />
und nach der BFSL-Methode<br />
tatsächlich ist, hängt allerdings von<br />
der typischen Form der Kennlinie des<br />
jeweiligen Drucksen<strong>so</strong>rs ab. Die Nichtlinearität<br />
nach Grenzpunkteinstellung<br />
kann dabei bis zu Faktor zwei größer<br />
sein.<br />
Leider ist vielen Datenblättern nicht<br />
eindeutig zu entnehmen, nach welcher<br />
Methode die Nichtlinearität ermittelt<br />
wurde. Eine Vergleichbarkeit der Angaben<br />
ist deshalb häufi g nur nach Rücksprache<br />
mit dem Hersteller möglich.<br />
Die Nichtlinearität lässt sich aus<br />
Anwendersicht häufi g nur mit entsprechendem<br />
Aufwand minimieren. Zum<br />
Beispiel, indem in der nachgeschalteten<br />
Elektronik an Hand von Stützpunkten<br />
die Fehler herausgerechnet<br />
werden. Hierzu ist ein hoch präzises<br />
Normal notwendig (Abb. 2).<br />
Die typische Angabe<br />
Kein Gerät ist wie <strong>das</strong> andere. Das gilt<br />
auch für die Genauigkeit von Drucksen<strong>so</strong>ren.<br />
Tatsächlich wird bei einer<br />
Vielzahl von Geräten die Nichtlinearität<br />
deutlich besser sein, als der im<br />
Datenblatt spezifizierte maximale<br />
Wert. Nur <strong>so</strong> ist sichergestellt, <strong>das</strong>s<br />
� Abb. 1: Vergleich<br />
die durch Toleranzen und Streuungen<br />
bedingte Abweichung einen be -<br />
stimmten Maximalwert sicher nicht<br />
überschreitet. Diese (bessere) Genauigkeit<br />
wird als typischer Wert bezeichnet.<br />
Entsprechende Genauigkeiten<br />
werden deshalb bei vielen Exemplaren<br />
mit »typ.« gekennzeichnet (Abb. 3).<br />
Wie viele Geräte diese »typische<br />
Genauigkeit« tatsächlich einhalten,<br />
wird von fast keinem Hersteller eindeutig<br />
spezifi ziert. Man kann aber üblicherweise<br />
davon ausgehen, <strong>das</strong>s eine<br />
PRAXIS APPLICATION<br />
0,1 % ? 0,5 %<br />
=<br />
0,1 %<br />
0,25 %<br />
0,5 %<br />
Abb. 2: Nichtlinearität Abb. 3: Typische Werte<br />
Typische Nichtlinearität<br />
nach Best Fit Straight Line Methode<br />
entspricht<br />
maximale Nichtlinearität<br />
nach Best Fit Straight Line Methode<br />
entspricht<br />
maximale Nichtlinearität<br />
nach Grenzpunkteinstellung<br />
»typische Genauigkeit« dem 1-Sigma-<br />
Wert nach der Gauß’schen Normalverteilung<br />
entspricht. Das heißt: ca. 68,27 %<br />
der Geräte halten den typischen<br />
Wert ein.<br />
Für den Anwender bedeutet al<strong>so</strong> die<br />
Angabe einer typischen Genauigkeit,<br />
<strong>das</strong>s der Hersteller nicht garantiert,<br />
<strong>das</strong>s 100 % der ausgelieferten Geräte<br />
die angegebene Genauigkeit einhalten.<br />
Je nach Streuung der Messwerte kann<br />
der maximale Wert um <strong>das</strong> zwei- bis<br />
dreifache größer sein als der typische<br />
<strong>SE</strong>NSOR MAGAZIN 4/2008 <strong>SE</strong>NSOR MARKT 51
PRAXIS APPLICATION<br />
Wert. Typische Werte sind im Übrigen<br />
nicht nur bei Nichtlinearitäten, <strong>so</strong>ndern<br />
auch bei vielen anderen Genauigkeitsangaben<br />
anzutreffen.<br />
Die ehrlichste Angabe<br />
Der wohl »ehrlichste« Wert ist die Messabweichung.<br />
Sie ist ohne Aufwand direkt<br />
aus der Kennlinie ablesbar und be -<br />
inhaltet alle relevanten Fehler bei Raumtemperatur<br />
wie Nichtlinearität, Hysterese,<br />
Nichtwiederholbarkeit und Messabweichung<br />
am Messbereichsanfang und<br />
-ende. Wenn der Anwender sein Gerät<br />
bei Raumtemperatur be treibt, ist dies<br />
der Fehler, mit dem er tatsächlich seinen<br />
Druck erfasst (Abb. 4).<br />
Die Messabweichung ist die größte<br />
Abweichung der tatsächlichen Kennlinie<br />
von der idealen Kennlinie. Die<br />
Hysterese ist defi niert als die maximale<br />
Abweichung der Kennlinien im Aufwärts-<br />
und Abwärtsgang. Unter Nichtwiederholbarkeit<br />
versteht man die<br />
größte Abweichung aus drei Messungen<br />
unter identischen Bedingungen.<br />
Von Herstellerseite wird die Messabweichung<br />
leider nur selten spezifi ziert,<br />
weil sie verständlicherweise größer ist<br />
als die Nichtlinearität. In der Regel<br />
wird die Nichtlinearität angegeben und<br />
die Messabweichung im Messbereichanfang<br />
und -ende separat aufgeführt.<br />
Letztere werden in der Praxis als Nullpunkt-<br />
und Spannefehler bezeichnet,<br />
wobei die Spanne die Differenz aus<br />
Messbereichsanfang und -endwert ist.<br />
Die Hysterese und die Nichtwiederholbarkeit<br />
sind <strong>so</strong> ziemlich die einzigen<br />
52 <strong>SE</strong>NSOR MAGAZIN 4/2008 <strong>SE</strong>NSOR MARKT<br />
Fehler, mit denen man leben muss.<br />
Alle anderen Fehler lassen sich mit<br />
entsprechendem Aufwand minimieren<br />
oder gar eliminieren.<br />
Am einfachsten und anschaulichsten<br />
funktioniert dies beim Nullpunktfehler.<br />
Der Anwender kann ohne großen Aufwand<br />
im drucklosen Zustand den Nullpunktfehler<br />
ab lesen und als Offset in<br />
seine Auswerteeinheit einpfl egen.<br />
Um den Spannefehler zu eliminieren,<br />
muss der Druck am Messbereichsende<br />
exakt angefahren werden. Das ist häufi<br />
g nicht möglich, da keine entsprechende<br />
Druckreferenz zur Verfügung<br />
steht. Damit der Drucksen<strong>so</strong>r am Ende<br />
nicht schlechter misst als zuvor, <strong>so</strong>llte<br />
der Referenzdruck mindestens dreimal<br />
genauer sein als die angestrebte<br />
Genauigkeit.<br />
Die Gradangabe<br />
Egal ob Nichtlinearität oder Messabweichung:<br />
all diese Genauigkeitsangaben<br />
beschreiben einen Drucksen<strong>so</strong>r<br />
bei Raumtemperatur. Liegt jedoch die<br />
Arbeitstemperatur höher oder niedriger,<br />
<strong>so</strong> muss man mit einem zusätzlichen<br />
Temperaturfehler rechnen.<br />
Der Temperaturfehler wird häufi g als<br />
Temperaturkoeffi zient angegeben, be -<br />
zogen auf ein Intervall von 10 K. Dabei<br />
werden die Fehler des Nullpunktes<br />
und der Spanne getrennt aufgeführt.<br />
Ein Gerät, <strong>das</strong> bei Raumtemperatur<br />
noch eine ausreichende Genauigkeit<br />
bietet, kann bereits bei 10 K Abweichung<br />
einen doppelt <strong>so</strong> großen Fehler<br />
haben (Abb. 5).<br />
� Abb. 5: Temperaturfehler<br />
Was viele nicht wissen: Um den Fehler<br />
im Endwert zu berechnen, müssen die<br />
Temperaturkoeffi zienten von Nullpunkt<br />
und Spanne aufaddiert werden.<br />
Temperaturfehler entstehen übrigens<br />
durch Abweichungen der Mediums-<br />
aber auch der Umgebungstemperatur.<br />
Der Temperaturfehler lässt sich bei<br />
konstanten Arbeitstemperaturen noch<br />
relativ einfach abschätzen, <strong>so</strong>fern<br />
aber Ihre Anwendung einen größeren<br />
Temperaturbereich abdeckt, wird der<br />
Aufwand erheblich größer. Leider<br />
gehen noch immer sehr viele Anwender<br />
davon aus, <strong>das</strong>s Drucksen<strong>so</strong>ren<br />
innerhalb des Bemessungstemperaturbereichs<br />
gar keinen zusätzlichen<br />
Temperaturfehler haben. Dabei ist der<br />
Bemessungstemperaturbereich lediglich<br />
der Bereich, in dem die spezifi -<br />
zierten Temperaturkoeffi zienten gelten<br />
<strong>–</strong> aber keinesfalls gleich Null<br />
sind.<br />
Die langfristige Angabe<br />
� Abb. 4: Messabweichung und Hysterese<br />
Die Genauigkeitsangaben in Datenblättern<br />
beschreiben üblicherweise<br />
den Zustand des Gerätes am Ende<br />
des Produktionsprozesses. Bereits<br />
beim Verlassen des Herstellers, seines<br />
Lagers, beim Transport etc. kann<br />
<strong>das</strong> Gerät Bedingungen ausgesetzt<br />
werden, die seine Genauigkeit nachhaltig<br />
beeinfl ussen.<br />
Jedes auch noch <strong>so</strong> präzise und hochwertige<br />
Gerät ändert im Laufe seines<br />
Lebens seine Genauigkeit. Diese Ver-
änderung bezeichnet man als Langzeitdrift<br />
bzw. Langzeitstabilität. Die<br />
Größenordnung dieser Drift wird maßgeblich<br />
durch die Einsatzbedingungen<br />
bestimmt, d. h. den Drücken, Temperaturen<br />
und anderen Einflüssen,<br />
denen <strong>das</strong> Gerät ausgesetzt wird. In<br />
manchen Fällen trägt die Stabilität<br />
wesentlich mehr zum Gesamtfehler<br />
bei als z. B. die Nichtlinearität. Werte<br />
die zwei- bis dreimal höher liegen sind<br />
nicht unüblich.<br />
Angaben zur Stabilität in den Herstellerdatenblättern<br />
sind <strong>so</strong> gut wie nicht<br />
vergleichbar. Die unterschiedlichen<br />
Normen beschreiben zum Teil sehr<br />
unterschiedliche Tests zur Ermittlung<br />
der Stabilität. Zudem ist keiner dieser<br />
Tests ein wirkliches Abbild der reellen<br />
Einsatzbedingungen. Kann es auch<br />
nicht sein, denn diese sind von Anwendung<br />
zu Anwendung viel zu unterschiedlich.<br />
Die Stabilitätsangaben gelten<br />
folglich nur für den Einsatz unter<br />
Laborbedingungen bzw. Referenzbedingungen.<br />
Doch selbst für den Einsatz bei Referenzbedingungen<br />
ist es kaum möglich,<br />
zu vergleichbaren Aussagen zu<br />
kommen. Zeit lässt sich nun mal leider<br />
nicht raffen. Und alle Bemühungen,<br />
durch Temperaturschocks und andere<br />
Methoden einen Zeitraffereffekt zu<br />
simulieren, sind und bleiben Bemühungen.<br />
Von Herstellerseite wird meistens<br />
empfohlen, Drucksen<strong>so</strong>ren einmal<br />
pro Jahr zu kalibrieren, d. h. auf die<br />
Einhaltung ihrer Spezifi kation zu überprüfen.<br />
Dabei geht es weniger darum,<br />
<strong>das</strong> Gerät nachzujustieren als die tatsächlich<br />
erfolgte Veränderung des<br />
Gerätes, sprich die Drift, zu erfassen.<br />
Fällt diese größer aus als der vom<br />
Hersteller spezifi zierte Wert, <strong>so</strong> ist<br />
dies ein Indiz dafür, <strong>das</strong>s ein Gerätefehler<br />
vorliegt. Es versteht sich, je größer<br />
die Instabilität ausfällt, desto<br />
wahrscheinlicher ist der Sen<strong>so</strong>r<br />
defekt. In diesem Fall kann bei weiterer<br />
Verwendung die Sicherheit des<br />
Prozesses nicht länger ge währleistet<br />
werden.<br />
Für diese Überprüfung muss kein großer<br />
Aufwand getrieben werden, oft<br />
reicht es schon, den Nullpunkt im<br />
drucklosen Zustand auf eventuelle<br />
Veränderungen zu überprüfen. Sind<br />
weder die Überprüfung in der Anlage<br />
noch der Ausbau des Gerätes möglich,<br />
<strong>so</strong> <strong>so</strong>llten Sie wenigstens Wert<br />
auf eine sehr gute Stabilität legen und<br />
diese in Ihrer Genauigkeitsanforderung<br />
mit berücksichtigen.<br />
Immer noch unsicher?<br />
Leider sind <strong>das</strong> noch längst nicht alle<br />
möglichen Fehlerquellen. Vibrationen,<br />
elektromagnetische Störungen, die<br />
Einbaulage des Sen<strong>so</strong>rs, die Hilfsenergie<br />
und <strong>so</strong>gar die Bürde der Auswerteeinheit<br />
können zusätzlich die<br />
Flexibel und voller Energie<br />
DuraAct ist eine flexible Keramik die als Aktor, Sen<strong>so</strong>r oder Energieerzeuger<br />
arbeiten kann. Sie wird beispielsweise zur aktiven Schwingungs- und<br />
Schalli<strong>so</strong>lation eingesetzt oder zur Deformationskontrolle und Stabilisierung<br />
<strong>so</strong>wie in der Adaptronik.<br />
■ Große Verformung möglich<br />
■ Struktur Integration<br />
■ Kostengünstig, robust<br />
■ Energieautarke Systeme<br />
Für weitere Infos sind wir für Sie da: Electronica · Halle A2, Stand 412<br />
PI Ceramic GmbH · Tel. +49 36604 882-0 · www.piceramic.de<br />
PRAXIS APPLICATION<br />
Genauigkeit Ihres Drucksen<strong>so</strong>rs negativ<br />
beeinfl ussen. Deshalb ist in vielen<br />
Fällen eine individuelle Beratung<br />
durch einen Fachmann sinnvoll.<br />
Wie genau ist Ihr Drucksen<strong>so</strong>r wirklich?<br />
Ist er <strong>so</strong> gut wie Sie erwartet<br />
haben? Oder ist er zu gut? Welche<br />
Fehler für Sie relevant sind und<br />
welche nicht, können letztendlich nur<br />
Sie beurteilen. Welche Produkteigenschaften<br />
dafür entscheidend sind und<br />
wie diese in Ihre Anwendung optimal<br />
zur Geltung kommen, erklären gerne<br />
die Anwendungsberater der Hersteller.<br />
Das stellt sicher, <strong>das</strong>s Sie Ihre Prozessziele<br />
mit optimalem Einsatz erreichen.<br />
Wir beraten Sie gerne, um<br />
herauszufi nden, welche Genauigkeit<br />
sie heute haben und welche Sie wirklich<br />
benötigen.<br />
� INFO<br />
Autor:<br />
Michèle Beyer (Dipl.-Ing. FH)<br />
Produktmanagement<br />
<strong>WIKA</strong> <strong>Alexander</strong> <strong>Wiegand</strong> GmbH & <strong>Co</strong>. KG<br />
Geschäftsbereich TRONIC<br />
Kontakt:<br />
Monika Adrian<br />
Marketing Vertriebs Service<br />
<strong>WIKA</strong> <strong>Alexander</strong> <strong>Wiegand</strong> GmbH & <strong>Co</strong>. KG<br />
<strong>Alexander</strong>-<strong>Wiegand</strong>-Str. 30<br />
63911 Klingenberg<br />
Phone: +49 9372 132-9972<br />
Fax: +49 9372 132-423<br />
E-Mail: m.adrian@wika.de<br />
www.wika.de<br />
<strong>SE</strong>NSOR MAGAZIN 4/2008 <strong>SE</strong>NSOR MARKT 53
PRAXIS APPLICATION<br />
Do You Know the Accuracy<br />
of your Pressure Sen<strong>so</strong>r?<br />
Find your Way Out of the Waze of Accuracy Data?<br />
Accuracy has its price: The more accurate measurement, the more expensive<br />
the measuring instruments. On the other hand, a lack of accuracy<br />
might cost even more, in particular if the product quality suffers because<br />
of it. Therefore accuracy should play an important role when deciding<br />
upon a sen<strong>so</strong>r. However, you can only make the right choice if you fi nd your<br />
way in the “maze” of accuracy data. Here the author explains the most<br />
important parameters and selection criteria using the example of an industrial<br />
pressure sen<strong>so</strong>r.<br />
0,1 % ?<br />
0,5 %<br />
=<br />
0,1 %<br />
0,25 %<br />
0,5 %<br />
� Fig. 1: <strong>Co</strong>mpari<strong>so</strong>n<br />
The term “Accuracy” exists only in the<br />
users' language. It is not defi ned in any<br />
standard. Nevertheless, it can be found<br />
in many data sheets for sen<strong>so</strong>rs. Unfortunately,<br />
there is no common idea of<br />
what accuracy means. There is not ”one<br />
accuracy“ but a large number of different<br />
specifi cations with regard to accuracy,<br />
all of them together describe the<br />
“accuracy” of a device.<br />
The relevant factors for pressure sen<strong>so</strong>rs<br />
with regard to accuracy are defi ned<br />
uniquely across all standards. Yet<br />
manufacturers' data can hardly be compared<br />
to each other as the manufacturers<br />
decide for themselves what<br />
information is specifi ed in the data<br />
sheet and how.<br />
Even if two manufacturers use the same<br />
terms, it cannot be guaranteed that<br />
Typical non-linearity<br />
according to the Best Fit Straight Line Method<br />
corresponds to<br />
Maximum non-linearity<br />
according to the Best Fit Straight Line Method<br />
corresponds to<br />
Maximum non-linearity<br />
according to limit point adjustment<br />
54 <strong>SE</strong>NSOR MAGAZIN 4/2008 <strong>SE</strong>NSOR MARKT<br />
they both mean the same. Frequently,<br />
important additions are just left out.<br />
This means: Two devices having the<br />
same “accuracy” at fi rst sight might<br />
differ considerably if looked at more<br />
closely. The same applies for the opposite<br />
case as the example in fi gure 1<br />
demonstrates.<br />
The following sections explain the<br />
rea<strong>so</strong>n why two different sen<strong>so</strong>rs presumably<br />
belonging to different accuracy<br />
classes have almost identical<br />
accuracy.<br />
Non-linearity<br />
For many users, non-linearity is the<br />
most signifi cant and therefore most<br />
often used accuracy datum. However,<br />
non-linearity is often incorrectly referred<br />
to as linearity. Non-linearity<br />
de scribes how “curved” or “nonlinear” a<br />
characteristic curve is. It describes the<br />
highest possible deviation between<br />
characteristic curve and ideal straight<br />
line.<br />
Generally, there are three methods for<br />
determining this ideal straight line:<br />
Limit point adjustment, minimum value<br />
ad justment (BFSL) and origin adjustment,<br />
with the last being the most unusual.<br />
In the case of non-linearity according to<br />
limit point adjustment, the ideal straight<br />
line goes through the initial and end<br />
point of the curve; with the BFSL<br />
method (Best Fit Straight Line), the reference<br />
line is selected in a way that the<br />
maximum positive deviation and the<br />
maximum negative deviation are identical.<br />
Non-linearity according to limit<br />
point adjustment gives the largest ab<strong>so</strong>lute<br />
value compared to minimum value<br />
adjustment but is most comprehensible<br />
for the user. Non-linearity according to<br />
minimum value adjustment is the more<br />
signifi cant value in many cases because<br />
It describes the potential of the characteristic<br />
curve.<br />
The actual degree of difference between<br />
non-linearity according to limit<br />
point adjustment and according to<br />
BFSL method, depends on the typical<br />
form of the characteristic curve of a<br />
particular pressure sen<strong>so</strong>r. Non-linearity<br />
may be twice that according to limit<br />
point adjustment.<br />
Unfortunately, it is impossible in many<br />
data sheets to recognise according to<br />
which method non-linearity has been<br />
determined. Data can often only be<br />
compared after having consulted the<br />
manufacturer (fi gure 2).<br />
Typical Values<br />
There are no two the same products.<br />
This al<strong>so</strong> applies to the accuracy of<br />
pressure sen<strong>so</strong>rs. Actually, non-lineari-
� Fig. 2: Non-linearity � Fig. 3: Typical values<br />
ty of a large number of devices will be<br />
considerably better than the maximum<br />
value specifi ed in the data sheet. Only<br />
this way it can be ensured that the deviation<br />
does not exceed a certain maximum<br />
value due to tolerances or variations.<br />
This (improved) accuracy is described<br />
as typical value. Therefore such<br />
accuracies are often marked with “typ.”<br />
(fi gure 3).<br />
However, hardly any manufacturer specifi<br />
es clearly how many devices actually<br />
fulfi l this “typical accuracy”. Generally,<br />
you can assume that a “typical accuracy”<br />
corresponds to 1 sigma of the Gaussian<br />
distribution, i.e. about 68.27 % of<br />
the devices comply with this typical<br />
value.<br />
If a typical accuracy is given, the user<br />
knows that the manufacturer does not<br />
guarantee that 100 % of the delivered<br />
devices comply with the given accuracy.<br />
Depending on the spread of the measured<br />
values, the maximum value can<br />
be twice or three times as high as the<br />
typical value.<br />
By the way, typical values can be found<br />
not only with non-linearity but al<strong>so</strong> with<br />
other accuracy specifi cations.<br />
Measurement Error<br />
Probably the most “reliable” value is the<br />
measurement error. It can be determined<br />
without any extra effort directly<br />
from the characteristic curve and contains<br />
all relevant errors at room temperature,<br />
such as non-linearity, hysteresis,<br />
non-repeatability and error of measurement<br />
at the beginning and end of the<br />
measuring range. If the user operates<br />
the device at room temperature, this is<br />
the actual error with which the pressure<br />
is measured (fi gure 4).<br />
The measurement error is the largest<br />
deviation between actual characteristic<br />
curve and ideal straight line. Hysteresis<br />
is defi ned as maximum deviation of the<br />
characteristic curve in descent and<br />
ascent. Non-repeatability is the largest<br />
deviation obtained in three measurements<br />
under identical conditions.<br />
Unfortunately, the manufacturer specifi -<br />
es the measurement error very seldom<br />
because <strong>–</strong> understandably <strong>–</strong> it is always<br />
greater than non-linearity. Generally,<br />
non-linearity is given, and the measurement<br />
error at beginning and end of the<br />
measurement range is stated separately.<br />
The last two in practise are refered to<br />
as zero point error and span error with<br />
the span being the difference between<br />
lower end of scale and full scale value.<br />
Temperature Error<br />
No matter whether non-linearity or<br />
measurement error are used: All these<br />
accuracy specifi cations describe a pressure<br />
sen<strong>so</strong>r at room temperature. If the<br />
working temperature is higher or lower,<br />
� Fig. 4: Measurement error and hysteresis<br />
PRAXIS APPLICATION<br />
a temperature error must be al<strong>so</strong> considered.<br />
The temperature error is often indicated<br />
as temperature co-effi cient based<br />
on an interval of 10 K. The zero point<br />
co-effi cient and gain co-effi cient are<br />
indicated separately. A device having<br />
suffi cient accuracy at room temperature<br />
might have an error twice as large<br />
at 10K deviation (fi gure 5).<br />
Many people do not know that they<br />
have to add the temperature co-effi cients<br />
of zero point and span to calculate<br />
the error of the full scale value.<br />
Temperature errors might al<strong>so</strong> result<br />
from deviations of the medium or ambient<br />
temperature.<br />
Stability<br />
The accuracy given in data sheets usually<br />
describes the condition of a device<br />
at the end of the production process.<br />
The device can already be exposed to<br />
environmental conditions affecting its<br />
accuracy negatively from the moment<br />
of leaving the manufacturer's company<br />
or warehouse or during transport.<br />
It is not important how accurate the<br />
device is or if it is of a<br />
very high quality, every<br />
device changes its accuracy<br />
du ring its service<br />
life. This change is called<br />
long-term drift or longterm<br />
stability. The dimension<br />
of this drift is largely<br />
infl uenced by the operating<br />
conditions, i.e. pressures,<br />
temperatures and<br />
other infl uences to which<br />
the device is exposed. In<br />
<strong>SE</strong>NSOR MAGAZIN 4/2008 <strong>SE</strong>NSOR MARKT 55
PRAXIS APPLICATION<br />
� Fig. 5: Temperature error<br />
many cases, stability has a larger infl uence<br />
on the overall deviation than e.g.<br />
non-linearity. Values twice or three<br />
times as high are not unusual.<br />
Stability data stated by the manufacturer<br />
can hardly be compared. Different<br />
standards describe very different tests<br />
for determining stability. Furthermore,<br />
none of these tests is an actual copy of<br />
the real conditions of use. This is not<br />
possible because the conditions vary<br />
too much from application to application.<br />
<strong>Co</strong>nsequently, stability data are<br />
only valid for uses in laboratories or<br />
under reference conditions.<br />
However, even if used under reference<br />
conditions, it is almost impossible to<br />
obtain comparable data. You cannot<br />
make time go faster. And all attempts to<br />
simulate a time lapse effect by means<br />
of thermal shocks and other methods<br />
are just attempts.<br />
In Practice<br />
Hysteresis and non-repeatability are<br />
pretty much the only errors you have to<br />
live with. All other errors can be minimised<br />
or even eliminated with <strong>so</strong>me<br />
effort.<br />
This works easiest and clearest using<br />
the offset error. The user can read the<br />
offset error hassle-free in unpressurised<br />
condition and enter it as offset in<br />
the corresponding evaluation instrument.<br />
In order to eliminate the span error, the<br />
pressure must be regulated exactly at<br />
full scale value. This is often not possible<br />
as there is no reference value for the<br />
56 <strong>SE</strong>NSOR MAGAZIN 4/2008 <strong>SE</strong>NSOR MARKT<br />
pressure. In order to make the pressure<br />
sen<strong>so</strong>r not to measure worse than<br />
before, the reference pressure should<br />
be three times more accurate than the<br />
intended accuracy.<br />
Non-linearity can only be minimised<br />
with certain effort by the user, for example,<br />
by deducting it in the connected<br />
electronic system based on points.<br />
Even in this case, a highly accurate<br />
standard of measurement is required.<br />
Nevertheless, these errors are completely<br />
irrelevant in <strong>so</strong>me applications,<br />
and only non-repeatability is important.<br />
If, for example, the task consists of<br />
always regulating the same pressure,<br />
the error can be compensated easily if<br />
it is known; the rest is non-repeatability<br />
and long-term stability.<br />
The temperature error can be estimated<br />
quite easily at constant working<br />
temperatures but if your application<br />
covers a larger temperature range, it is<br />
much more diffi cult. Unfortunately,<br />
many users still assume that pressure<br />
sen<strong>so</strong>rs do not have an extra temperature<br />
error within the nominal temperature<br />
range. However, the nominal temperature<br />
range is just the range for<br />
which the temperature coeffi cients are<br />
valid.<br />
Most manufacturers recommend to<br />
calibrate the pressure sen<strong>so</strong>rs once a<br />
year, to control whether they still meet<br />
their specifi cations. The device is not<br />
readjusted but the actual change, i.e.<br />
the drift, is analysed. If the drift is higher<br />
than the value specifi ed by the<br />
manufacturer, this might be an indica-<br />
tion for a defective device. The higher<br />
the instability, the more probability that<br />
the sen<strong>so</strong>r is defective. In this case, process<br />
reliability can no longer be guaranteed<br />
if the device is still being used.<br />
This check does not require much effort.<br />
Often it is suffi cient to check if the zero<br />
point of the unpressurised device has<br />
changed. If the device can neither be<br />
checked in the system nor dismounted<br />
for examination, you should at least set<br />
a high value on a very good stability<br />
and respect it in your accuracy specifi -<br />
cations.<br />
Unfortunately, these are not the only<br />
possible <strong>so</strong>urces of error. Vibrations,<br />
electromagnetic interferences, mounting<br />
position of the sen<strong>so</strong>r, power supply<br />
and even the load of the evaluation<br />
instrument might affect the accuracy of<br />
your pressure sen<strong>so</strong>r. Therefore, individual<br />
consulting by a specialist is recommended<br />
in many cases.<br />
<strong>Co</strong>nclusion<br />
Do you know the exact accuracy of your<br />
sen<strong>so</strong>r? Is it as good as you have<br />
expected? Or is it too good? You are<br />
the only per<strong>so</strong>n to decide which errors<br />
are relevant for you and which are not.<br />
The manufacturers' application consultants<br />
explain which product characteristics<br />
are important for it and how they<br />
can be implemented in your application.<br />
This ensures that you reach your<br />
targets with optimum input. We would<br />
be glad to advice you in fi nding out<br />
which is the accuracy you presently<br />
have and which is the one you actually<br />
need.<br />
� INFO<br />
Author:<br />
Michèle Beyer (Dipl.-Ing. FH)<br />
Product Management<br />
<strong>WIKA</strong> <strong>Alexander</strong> <strong>Wiegand</strong> GmbH & <strong>Co</strong>. KG<br />
Division TRONIC<br />
<strong>Co</strong>ntact:<br />
Monika Adrian<br />
Marketing Services<br />
<strong>WIKA</strong> <strong>Alexander</strong> <strong>Wiegand</strong> GmbH & <strong>Co</strong>. KG<br />
<strong>Alexander</strong>-<strong>Wiegand</strong>-Str. 30<br />
63911 Klingenberg<br />
Phone: +49 9372 132-9972<br />
Fax: +49 9372 132-423<br />
E-Mail: m.adrian@wika.de<br />
www.wika.de