Survey of Free Speed 2006 - Road Safety Authority
Survey of Free Speed 2006 - Road Safety Authority
Survey of Free Speed 2006 - Road Safety Authority
You also want an ePaper? Increase the reach of your titles
YUMPU automatically turns print PDFs into web optimized ePapers that Google loves.
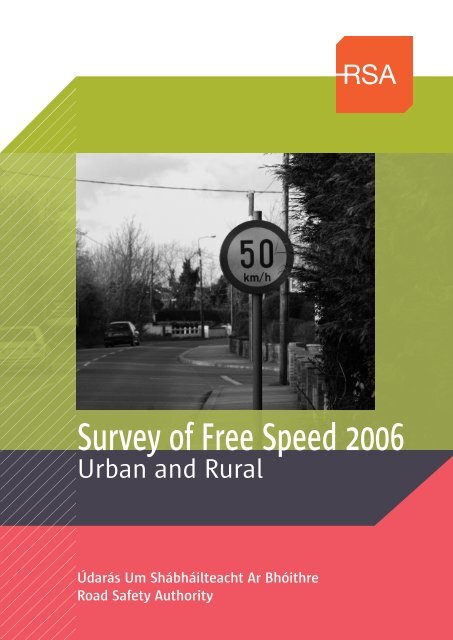
<strong>Survey</strong> <strong>of</strong> <strong>Free</strong> <strong>Speed</strong> <strong>2006</strong><br />
Urban and Rural<br />
Údarás Um Shábháilteacht Ar Bhóithre<br />
<strong>Road</strong> <strong>Safety</strong> <strong>Authority</strong>
<strong>2006</strong> SURVEY OF FREE SPEED (URBAN AND RURAL)<br />
<strong>2006</strong> <strong>Survey</strong> <strong>of</strong> <strong>Free</strong> <strong>Speed</strong><br />
(Urban and Rural)<br />
Published by<br />
The <strong>Road</strong> <strong>Safety</strong> <strong>Authority</strong><br />
Moy Valley Business Park, Primrose Hill,<br />
Dublin <strong>Road</strong>, Ballina, Co. Mayo.<br />
1
Contents<br />
Contents 2<br />
Definitions 3<br />
<strong>Speed</strong> Limits 5<br />
<strong>Free</strong> <strong>Speed</strong> <strong>Survey</strong> - Background 7<br />
<strong>Free</strong> <strong>Speed</strong> <strong>Survey</strong> – Methodology 9<br />
Main Findings 11<br />
Detailed Tables 17<br />
Appendix 1: Sample free speed survey sheet 21<br />
Appendix 2: <strong>Free</strong> speed (rural) survey procedures 22<br />
Appendix 3: <strong>Free</strong> speeds (urban) survey locations 24<br />
2 <strong>2006</strong> SURVEY OF FREE SPEED (URBAN AND RURAL)<br />
Page
Definitions<br />
<strong>Free</strong> <strong>Speed</strong><br />
<strong>Free</strong> speed is defined as the speed at which drivers choose to travel when unconstrained by road geometry<br />
(e.g. sharp bends), weather conditions (e.g. rain) or traffic conditions (e.g. congestion).<br />
<strong>Free</strong> speeds only are measured in this survey, and therefore the average speed computed from these<br />
surveys would considerably overestimate the speed on the road network as constrained vehicles tend to<br />
travel at lower speeds.<br />
85th Percentile<br />
The 85th percentile speed is the speed at or below which 85 percent <strong>of</strong> the motorists drive on a given road<br />
unaffected by slower traffic or poor weather. This speed indicates the speed that most motorists on the<br />
road consider safe and reasonable under ideal conditions. It is a good guideline for the appropriate speed<br />
limit for that road.<br />
<strong>Road</strong> Classifications in the Republic <strong>of</strong> Ireland<br />
<strong>Road</strong>s are the dominant mode <strong>of</strong> transport in Ireland accounting for 96% <strong>of</strong> passenger traffic and 89% <strong>of</strong><br />
freight transport.<br />
National roads consist <strong>of</strong> National Primary and National Secondary roads and while they account for only<br />
6% <strong>of</strong> the total road network, they carry over 45% <strong>of</strong> traffic. A national road (including a motorway) is<br />
denoted by the letter N or M (e.g. N7, M50).<br />
National Primary roads are major long distance through-roads linking the principal ports/airports,<br />
cities and large towns.<br />
National Secondary roads are medium distance through-roads connecting important towns and<br />
linking up to the national primary roads.<br />
Non-national roads consist <strong>of</strong> regional roads and local roads which are important as our low density <strong>of</strong><br />
population creates a high dependence on the local roads system. A non-national road is denoted by the<br />
letter L or R (e.g. L3421, R416).<br />
Regional roads provide the main links between national roads. Local roads include all other urban and<br />
rural roads. Regional and local roads account for 94% <strong>of</strong> the total road network and they carry over 55% <strong>of</strong><br />
traffic.<br />
An arterial road is a moderate or high-capacity road usually on the approach to urban areas. For this study<br />
they can be regarded as the stretch <strong>of</strong> roads before entering towns and villages. They are generally<br />
identified by either a 50 km/h or a 60 km/h speed limit.<br />
Residential roads are roads which go through business, shopping and residential areas <strong>of</strong> cities and towns.<br />
A default speed limit <strong>of</strong> 50 km/h applies to such roads and is sometimes referred to as a “built up speed<br />
limit”. As these are default speed limits on these roads, they are not always indicated by a speed limit<br />
sign.<br />
<strong>2006</strong> SURVEY OF FREE SPEED (URBAN AND RURAL)<br />
3
<strong>Speed</strong> Limits<br />
All public roads have speed limits. In most cases, a ‘default’ speed limit applies. This automatically applies<br />
to a particular type <strong>of</strong> road if there is no speed limit sign to show otherwise. The table below sets down<br />
the default speed limits for different roads under the <strong>Road</strong> Traffic Act 2004.<br />
Local authorities can apply special speed limits to any <strong>of</strong> these roads, for example: at particular times,<br />
such as<br />
when children are entering or leaving schools<br />
on different sides on a dual carriageway<br />
at selected locations such as a tunnel, where the limit may be lowered if one lane must be closed<br />
where there is a series <strong>of</strong> bends<br />
at road works<br />
Type <strong>of</strong> road <strong>Speed</strong> limit<br />
Motorway,<br />
(Blue Signs - M numbers)<br />
National roads (primary<br />
and secondary)<br />
(Green Signs - N numbers)<br />
Non-national roads<br />
(regional and local)<br />
(White Signs - R or L numbers)<br />
<strong>Road</strong>s in built-up areas,<br />
such as cities, towns<br />
and boroughs<br />
120km/h<br />
100km/h<br />
80km/h<br />
50km/h<br />
4 <strong>2006</strong> SURVEY OF FREE SPEED (URBAN AND RURAL)
If the local authority sets a special speed limit, you will see one <strong>of</strong> the signs below.<br />
<strong>Speed</strong> limits for vehicles<br />
Some drivers must obey speed limits for their vehicles as well as speed limits for the roads on which they<br />
are travelling. The table below outlines the speed limits that apply to different vehicles.<br />
Vehicle speed<br />
limit<br />
80 kilometres<br />
an hour<br />
(80km/h)<br />
80 kilometres<br />
an hour<br />
(80km/h)<br />
80 kilometres<br />
an hour<br />
(80km/h)<br />
65 kilometres<br />
an hour<br />
(65km/h)<br />
65 kilometres<br />
an hour<br />
(65km/h)<br />
<strong>2006</strong> SURVEY OF FREE SPEED (URBAN AND RURAL)<br />
30km/h 50km/h 60km/h<br />
80km/h 100km/h 120km/h<br />
Type <strong>of</strong> vehicle to which it applies<br />
• A vehicle that can carry more than 8<br />
passengers, apart from the driver, but does not<br />
carry any standing passengers<br />
• A goods vehicle with a design gross vehicle<br />
weight <strong>of</strong> more than 3,500 kilograms<br />
• Any vehicle towing a trailer, caravan, horsebox<br />
or other attachment<br />
• Any double-deck bus or double-deck coach<br />
• A single deck bus carrying standing passengers<br />
5
<strong>Free</strong> <strong>Speed</strong> <strong>Survey</strong>s - Background<br />
The conversion to a metric speed system (km/h) in January 2005 from the old imperial system (mph)<br />
resulted in a major change in speed limits in the state. As well as the change to kilometres, the specific<br />
speed limits and vehicle-specific speed limits were amended to reflect the changing road transport system.<br />
The speed limit on motorways changed from 70 mph to 120km/h (equivalent to 75 mph); on dual<br />
carriageways and national roads from 60 mph to 100 km/h (62 mph); on inter-urban regional and local<br />
roads from 60 mph to 80 km/h (50 mph). In terms <strong>of</strong> urban areas, the 30 mph speed limit was changed to<br />
50 km/h (equivalent to 31 mph), and the 40 mph speed limit to 60 km/h (37 mph).<br />
In addition to these road type specific speed limit changes, vehicle-specific speed limits were also changed<br />
to km/h. The speed limits applying to single-deck buses, towing vehicles and trucks (over 3,500 kg gross<br />
weights) were changed from 50 mph to 80 km/h, while the speed limit applicable to double deck buses<br />
went from 40 mph to 65 km/h.<br />
This survey was taken a full 18 months after the date <strong>of</strong> the metric introduction and drivers would be<br />
expected to more familiar and more used to the new limits in <strong>2006</strong> than they were in 2005.<br />
In 1999 the National <strong>Road</strong>s <strong>Authority</strong> commissioned ARUP Consulting Engineers and Pavement<br />
Management Services (PMS) to undertake separate surveys <strong>of</strong> free speeds in rural areas and in urban areas<br />
and also seat-belt wearing rates. Three reports were subsequently published (<strong>Free</strong> <strong>Speed</strong>s on Rural <strong>Road</strong>s<br />
1999; <strong>Free</strong> <strong>Speed</strong>s on Urban <strong>Road</strong>s 1999 and Seat-belt Wearing Rates 1999).<br />
The National <strong>Road</strong>s <strong>Authority</strong> in 2002, 2003 and 2005 carried out nationwide surveys <strong>of</strong> free speeds (Urban<br />
and Rural) and seat-belt wearing rates which were based on the methodology outlined in the 1999<br />
reports.<br />
The <strong>Road</strong> <strong>Safety</strong> <strong>Authority</strong> carried out national surveys in relation to seat belt wearing and traffic speeds<br />
for the first time in <strong>2006</strong>. The methodology developed for and used by the National <strong>Road</strong>s <strong>Authority</strong> in all<br />
previous surveys are applied to this survey except that observations for motorcycles are now included for<br />
the first time. <strong>Survey</strong> results are used to monitor trends, determine the effectiveness <strong>of</strong> safety initiatives<br />
and to inform the on-going review <strong>of</strong> public policy in relation to road safety.<br />
6 <strong>2006</strong> SURVEY OF FREE SPEED (URBAN AND RURAL)
The findings <strong>of</strong> this survey have an added value in that it is the basis for benchmarking the targets set for<br />
speeding in the <strong>Road</strong> <strong>Safety</strong> Strategy 2007-2012.<br />
SPECIFIC TARGET<br />
Cars and Motorcycles<br />
■ To increase compliance with speed limits on urban national roads (at 50 km/h sign) from 18% to 60% or better by 2012.<br />
■ To increase speed limit compliance on urban arterial roads from 14% to 60% or better in 50 km/h zones and from 11%<br />
to 60% or better in 60 km/h zones by 2012.<br />
■ To increase speed limit compliance on regional roads from 84% to 90% or better by 2012.<br />
■ To increase compliance on 2-lane national primary roads from 74% to 90% or better by 2012.<br />
Heavy Goods Vehicles and Buses<br />
■ To increase articulated vehicles’ compliance with speed limits on urban national roads (at 50 km/h sign) from 33% to<br />
70% or better by 2012 and to increase rigid vehicles’ compliance on the same roads from 23% to 70% or better.<br />
■ To increase speed limit compliance by articulated vehicles on 2-lane national roads from 13% to 60% or better by 2012<br />
and to increase compliance <strong>of</strong> rigid vehicles from 24% to 60% or better over the same time period.<br />
■ To increase both rigid and articulated vehicles’ compliance with speed limits on regional roads to 95% or better by<br />
2012.<br />
■ To increase the percentage <strong>of</strong> single deck buses complying with speed limits on 2-lane national roads to 85% or better<br />
by 2012.<br />
<strong>2006</strong> SURVEY OF FREE SPEED (URBAN AND RURAL)<br />
7
<strong>Free</strong> <strong>Speed</strong> <strong>Survey</strong>s - Methodology<br />
The free speeds surveys were carried out during June, July and August <strong>2006</strong>. The locations chosen and<br />
methodology used were similar to those used in the equivalent 1999, 2002, 2003 and 2005 surveys. The<br />
speeds measured again for this survey reflect free speeds.<br />
The surveys were carried out at the designated locations during working hours (9.30 am to 5.30 pm)<br />
Monday to Friday. Only speeds <strong>of</strong> vehicles that were unconstrained - meaning speeds derived from vehicles<br />
with a headway / gap <strong>of</strong> at least 200 meters on roads where it was possible to exceed the speed limit -<br />
were recorded.<br />
On urban arterial roads, speeds were measured early in the morning between 5.30 and 7.30 am, although<br />
in some locations in Dublin few readings <strong>of</strong> vehicles were taken after 7.00am, as the traffic conditions<br />
could not be described as free-flowing. The speed measurements on residential roads were carried out in<br />
normal daylight hours (typically between 9.30 a.m. and 5.30 p.m.).<br />
The road classes surveyed were:<br />
Urban national at the 50 km/h speed limit;<br />
arterial in 50 km/h speed zones;<br />
arterial in 60 km/h zones,<br />
residential in 50 km/h zones,<br />
motorways,<br />
dual carriageways<br />
national single lane (primary and secondary)<br />
regional, and<br />
local.<br />
<strong>Free</strong> speeds were only measured for cars on arterial and residential roads (due to a relative shortage <strong>of</strong><br />
single / double deck buses, rigid or articulated vehicles on these roads during surveying hours).<br />
For urban national roads the speeds <strong>of</strong> cars, single deck buses, double deck buses, rigid and articulated<br />
vehicles were recorded separately with measurements taken at the 50 km/h sign on inbound traffic only.<br />
Due to low sample sizes, no figures are provided for double deck buses; caution should be taken in the<br />
interpretation <strong>of</strong> results provided for single deck buses, as they are based on very limited sample sizes.<br />
All surveys were carried out in dry conditions and surveyors were instructed to choose vehicles in a<br />
random manner to avoid bias. Where a cluster <strong>of</strong> vehicles arrived together only the speed <strong>of</strong> the first<br />
vehicle was taken.<br />
<strong>2006</strong> SURVEY OF FREE SPEED (URBAN AND RURAL)<br />
8
The same sites were chosen as in previous surveys, where the sites were chosen according to the<br />
following criteria:<br />
long, straight sections <strong>of</strong> roadway;<br />
carriageway <strong>of</strong> at least 7 meters (except for urban residential);<br />
sites where speed is relatively unaffected by geometry, traffic, traffic lights, traffic calming<br />
measures, junctions, road works or parking and<br />
sites where it is feasible to drive faster than the speed limit<br />
<strong>Speed</strong> was measured with radar meters. Effort was made for surveyors to be as inconspicuous as possible.<br />
For national roads the speeds <strong>of</strong> cars, rigid and articulated vehicles were recorded separately.<br />
The target sample size for surveys on urban national roads was: 140 cars, 90 rigid vehicles and 30<br />
articulated vehicles [no quotas were allocated for either type <strong>of</strong> bus surveyed]. The target sample size for<br />
urban residential and urban arterial roads was 140 cars (no buses, rigid or articulated vehicles were<br />
surveyed for these roads). <strong>Survey</strong>ors were instructed to continue until the target for each vehicle class was<br />
reached or for a maximum <strong>of</strong> 2.5 hours, whichever occured earlier.<br />
<strong>2006</strong> SURVEY OF FREE SPEED (URBAN AND RURAL)<br />
9
Main Findings<br />
The <strong>2006</strong> free speeds survey gives a mixed result when compared to 2005. In rural areas there was a<br />
significant reduction in speeding rates on regional and local roads in <strong>2006</strong> (Figure 1)<br />
Figure 1<br />
Improvements in speed compliance -<br />
percentage <strong>of</strong> cars in excess <strong>of</strong> posted speed limits<br />
Local <strong>Road</strong>s (80km/h)<br />
Regional <strong>Road</strong>s (80km/h)<br />
However, on motorways, national primary and national secondary roads the proportion <strong>of</strong> cars complying<br />
with speed limits decreased (Figure 2).<br />
Figure 2<br />
Decreases in speed compliance -<br />
percentage <strong>of</strong> cars in excess <strong>of</strong> posted speed limits<br />
Dual carriageways (100km/h)<br />
National Secondary (100km/h)<br />
National Primary (100km/h)<br />
Motorways (120km/h)<br />
19<br />
26<br />
9<br />
37<br />
0 10 20 30 40 50 60 70 80<br />
13<br />
2005 <strong>2006</strong><br />
0 5 10 15 20 25 30<br />
15<br />
20<br />
63<br />
2005 <strong>2006</strong><br />
23<br />
27<br />
28<br />
30<br />
Significant<br />
improvement in<br />
speed<br />
compliance for<br />
car drivers on<br />
regional roads in<br />
80 km/h limits<br />
<strong>Speed</strong> for car<br />
drivers increased<br />
on better quality<br />
road types<br />
10 <strong>2006</strong> SURVEY OF FREE SPEED (URBAN AND RURAL)
In urban areas the proportion <strong>of</strong> cars exceeding the speed limit on arterial roads with a 50 km/h limit fell<br />
by 5% to 86% in <strong>2006</strong> and on national roads with a 50km/h speed limit by 7% to 82%. There was a<br />
significant increase in the percentage <strong>of</strong> cars exceeding the 50 km/h speed limit in residential areas –<br />
from 20% in 2005 to 47% in <strong>2006</strong> (Figure 3).<br />
Figure 3<br />
Percentage <strong>of</strong> cars driving in excess <strong>of</strong> speed limits on urban roads<br />
Residential (50km/h)<br />
Urban National (50km/h)<br />
Arterial (60km/h)<br />
Arterial (50km/h)<br />
There was an improvement in the level <strong>of</strong> compliance for drivers <strong>of</strong> articulated vehicles on<br />
motorways/dual carriageways (80km/h for these type <strong>of</strong> vehicles) and on regional roads, where a<br />
reduction from 45% <strong>of</strong>fending to 9% was significant (Figure 4). However on two lane national primary and<br />
secondary roads, speeds for articulated vehicles increased.<br />
Figure 4<br />
Percentage <strong>of</strong> Articulated Vehicles in excess <strong>of</strong> Vehicle-specific speed limits<br />
Regional<br />
National Secondary<br />
National Primary<br />
Dual Carriageway<br />
Motorway<br />
0 20 40 60 80 100<br />
9<br />
45<br />
48<br />
2005 <strong>2006</strong><br />
0 20 40 60 80 100<br />
<strong>2006</strong> SURVEY OF FREE SPEED (URBAN AND RURAL)<br />
20<br />
47<br />
58<br />
69<br />
80<br />
2005 <strong>2006</strong><br />
82<br />
86<br />
83<br />
87<br />
87<br />
89<br />
89<br />
89<br />
91<br />
94<br />
Significant<br />
increase in speed<br />
<strong>of</strong>fending by car<br />
drivers on urban<br />
residential roads<br />
in 50 km/h<br />
limits<br />
Significant<br />
improvement in<br />
speed<br />
compliance for<br />
articulated<br />
drivers on<br />
regional roads<br />
11
For the drivers <strong>of</strong> rigid trucks, there was an improvement in speed compliance on all roads except two<br />
lane national roads (Figure 5) (a speed limit <strong>of</strong> 80km/h applies to these vehicle types).<br />
Figure 5<br />
Percentage <strong>of</strong> Rigid Trucks in excess <strong>of</strong> Vehicle-specific speed limits<br />
Regional (80km/h)<br />
National Secondary (100km/h)<br />
National Primary (100km/h)<br />
Dual Carriageway (100km/h)<br />
Motorway (120km/h)<br />
However in urban areas, for vehicles other than cars, the average speed was significantly above the speed<br />
limit (Figure 6) and this was particularly high for rigid trucks where the average speed was in the region <strong>of</strong><br />
78 kilometres per hour.<br />
Figure 6<br />
Comparsion between average free speed limits for cars on urban roads<br />
Residential<br />
Urban National<br />
Arterial<br />
Arterial<br />
22<br />
30<br />
41<br />
0 20 40 60 80 100<br />
Average<br />
<strong>Free</strong> <strong>Speed</strong><br />
0 10 20 30 40 50 60 70 80<br />
45<br />
<strong>Speed</strong> Limit<br />
For the first time data is available about the average speed <strong>of</strong> motorcycles. On urban roads the average<br />
free speed for motor cycles was significantly above the speed limit.<br />
51<br />
50<br />
50<br />
50<br />
68<br />
60<br />
60<br />
76<br />
76<br />
78<br />
2005 <strong>2006</strong><br />
71<br />
88<br />
85<br />
75<br />
Significant<br />
improvement in<br />
speed<br />
compliance for<br />
rigid trucks on<br />
regional roads<br />
Significant levels<br />
<strong>of</strong> non<br />
compliance by<br />
vehicles (other<br />
than cars) with<br />
speed limits on<br />
national roads in<br />
urban areas<br />
12 <strong>2006</strong> SURVEY OF FREE SPEED (URBAN AND RURAL)
On rural roads the average free speed <strong>of</strong> cars was below the speed limit on all roads type (Figure 7)<br />
Figure 7<br />
Comparsion between average speed for vehicles (other than cars) on national<br />
roads in urban areas with a 50km/h speed limit<br />
Single deck buses<br />
Motor Cycles<br />
Rigid<br />
Articulated<br />
In contrast with cars on rural roads, the average free speed for articulated trucks was above the speed<br />
limits on all road types except dual carriageways and regional roads. It should be remembered that speed<br />
limits <strong>of</strong> 80 km/h apply to such vehicles rather than the speed limit applicable to the road (Figure 9). A<br />
similar finding resulted for rigid trucks except that the average free speed was below the speed limit on<br />
national secondary roads as well as regional roads (Figure 10)<br />
Figure 8<br />
Cars on Rural <strong>Road</strong>s - average free speed<br />
Local <strong>Road</strong>s<br />
Regional <strong>Road</strong>s<br />
National Secondary<br />
National Primary<br />
Dual Carriageways<br />
Motorways<br />
0 10 20 30 40 50 60 70 80<br />
Average<br />
<strong>Free</strong> <strong>Speed</strong><br />
0 20 40 60 80 100 120<br />
<strong>2006</strong> SURVEY OF FREE SPEED (URBAN AND RURAL)<br />
67<br />
72<br />
50<br />
50<br />
50<br />
50<br />
80<br />
80<br />
87<br />
90<br />
Average<br />
<strong>Free</strong> <strong>Speed</strong><br />
65<br />
66<br />
68<br />
100<br />
95<br />
100<br />
100<br />
110<br />
Vehicle Specific<br />
<strong>Speed</strong> Limit<br />
78<br />
<strong>Speed</strong> Limit<br />
120<br />
Significant<br />
improvement in<br />
speed<br />
compliance for<br />
cars on all roads<br />
in rural areas<br />
13
Figure 9<br />
Articulated Vehicles - average free speed on rural roads<br />
Regional<br />
National Secondary<br />
National Primary<br />
Dual Carriageway<br />
Motorway<br />
Figure 10<br />
Rigid Vehicles - average free speed on rural roads<br />
Regional<br />
National Secondary<br />
National Primary<br />
Dual Carriageway<br />
Motorway<br />
0 20 40 60 80 100<br />
Average<br />
<strong>Free</strong> <strong>Speed</strong><br />
0 20 40 60 80 100<br />
Vehicle Specific<br />
<strong>Speed</strong> Limit<br />
The average free speed <strong>of</strong> single deck buses on national roads in rural areas differed in relation to the<br />
quality <strong>of</strong> the road. On the better primary roads the average free speed was higher than the 80 km/h<br />
permitted for such a vehicle while on national secondary roads the speeds were lower that the speed<br />
limit.<br />
68<br />
72<br />
80<br />
77<br />
80<br />
Average<br />
<strong>Free</strong> <strong>Speed</strong><br />
80<br />
81<br />
80<br />
80<br />
79<br />
80<br />
80<br />
80<br />
81<br />
80<br />
80<br />
86<br />
87<br />
86<br />
92<br />
Vehicle Specific<br />
<strong>Speed</strong> Limit<br />
14 <strong>2006</strong> SURVEY OF FREE SPEED (URBAN AND RURAL)
Figure 11<br />
Single deck buses - average speed on rural roads<br />
National Secondary<br />
National Primary<br />
Average<br />
<strong>Free</strong> <strong>Speed</strong><br />
0 20 40 60 80 100<br />
Vehicle Specific<br />
<strong>Speed</strong> Limit<br />
Details <strong>of</strong> the distribution rates <strong>of</strong> observed free speeds for urban and rural roads are shown in Tables 3<br />
and 4 in chapter 6 (page 19).<br />
Distribution rates refer to the speed at which drivers were travelling at relevant to the speed limit.<br />
On urban residential roads, within a 50km/h speed limit, 48% <strong>of</strong> cars are travelling under the speed limit.<br />
Thirty per cent are travelling at speeds between 50 and 60 km/h and the remaining 22% speed in excess <strong>of</strong><br />
60 km/h.<br />
On arterial roads in urban areas, a total <strong>of</strong> 47% <strong>of</strong> free speeding cars in 50 km/h zones travel between 60-<br />
80km/h, while 68% travel at the same speed when in 60 km/h zones.<br />
On rural roads the modal (more frequent) car speed range is between 100-120km/h on motorways, 80-100<br />
km on dual carriageways, national primary, national secondary and regional roads and 60-80 km/h on<br />
regional roads.<br />
<strong>2006</strong> SURVEY OF FREE SPEED (URBAN AND RURAL)<br />
73<br />
80<br />
80<br />
84<br />
Single deck<br />
buses travelled<br />
at speed above<br />
or below the<br />
applicable speed<br />
limit dependent<br />
on quality <strong>of</strong> the<br />
road<br />
15
Detailed Tables<br />
1. Percentage exceeding speed limits on urban roads, <strong>2006</strong>.<br />
<strong>Road</strong> Type and Vehicle Class<br />
Arterial - 50 km/h<br />
Avg. <strong>Speed</strong><br />
(km/h)<br />
Number<br />
<strong>Speed</strong>ing<br />
Number in<br />
Sample<br />
% <strong>Speed</strong>ing<br />
85th<br />
Percentile<br />
<strong>Free</strong> <strong>Speed</strong><br />
(km/h)<br />
- Cars 60 378 438 86 68<br />
Arterial – 60 km/h<br />
- Cars 71 529 591 89 82<br />
National – 50 km/h<br />
Articulated Vehicle 65 116 172 67 80<br />
Cars 75 880 1079 82 92<br />
Motor Cycles 78 29 33 88 91<br />
Rigid Vehicles 68 170 211 77 82<br />
Single Deck Buses 66 42 57 74 77<br />
Residential – 50 km/h<br />
- Cars 51 434 926 47 63<br />
16 <strong>2006</strong> SURVEY OF FREE SPEED (URBAN AND RURAL)
2. Percentage exceeding speed limits on rural roads, <strong>2006</strong><br />
Motorway<br />
Dual Carriageway<br />
National Primary<br />
National Secondary<br />
Regional <strong>Road</strong><br />
Local <strong>Road</strong><br />
<strong>Road</strong> Type and Vehicle Class<br />
<strong>Speed</strong> Limit<br />
(km/h)<br />
Avg. <strong>Speed</strong><br />
(km/h)<br />
Number<br />
<strong>Speed</strong>ing<br />
Number in<br />
Sample<br />
% <strong>Speed</strong>ing<br />
- Articulated Vehicle 80 87 218 246 89<br />
- Cars 120 110 190 953 20<br />
- Rigid Vehicles 80 92 151 178 85<br />
- Single Decker Buses - - - - -<br />
- Articulated Vehicle 80 79 142 207 69<br />
- Cars 100 90 349 1162 30<br />
- Rigid Vehicles 80 81 251 368 68<br />
- Single Decker Buses - - - - -<br />
- Articulated Vehicle 80 86 243 279 87<br />
- Cars 100 95 272 1027 27<br />
- Rigid Vehicles 80 86 250 330 76<br />
- Single Decker Buses 80 84 19 28 68<br />
- Articulated Vehicle 80 81 42 72 58<br />
- Cars 100 87 171 1351 13<br />
- Rigid Vehicles 80 77 63 155 41<br />
- Single Decker Buses 80 73 3 15 20<br />
- Articulated Vehicle 80 68 3 33 9<br />
- Cars 80 72 195 747 26<br />
- Rigid Vehicles 80 72 20 90 22<br />
- Single Decker Buses - - - - -<br />
- Cars 80 67 137 724 19<br />
<strong>2006</strong> SURVEY OF FREE SPEED (URBAN AND RURAL)<br />
17
3. Distribution <strong>of</strong> free speeds (%) on urban roads, <strong>2006</strong><br />
<strong>Road</strong> Type and Vehicle Class<br />
Arterial - 50 km/h<br />
< 50<br />
km/h<br />
50-60<br />
km/h<br />
60-80<br />
km/h<br />
80-100<br />
km/h<br />
100-120<br />
km/h<br />
120-140<br />
km/h<br />
- Cars 10 39 47 4 0 0 0<br />
Arterial – 60 km/h<br />
- Cars 4 8 68 20 0 0 0<br />
National – 50 km/h<br />
Articulated Vehicle 10 24 51 15 0 0 0<br />
Cars 5 14 43 32 6 0 0<br />
Rigid Vehicles 4 20 58 16 2 0 0<br />
Single Deck Buses 2 23 65 10 0 0 0<br />
Residential – 50 km/h<br />
- Cars 48 30 16 5 1 0 0<br />
140 +<br />
km/h<br />
18 <strong>2006</strong> SURVEY OF FREE SPEED (URBAN AND RURAL)
4. Distribution <strong>of</strong> free speeds (%) on rural roads, <strong>2006</strong><br />
Motorway<br />
<strong>Road</strong> Type and Vehicle Class<br />
<strong>Speed</strong><br />
Limit<br />
(km/h)<br />
< 50<br />
km/h<br />
50-60<br />
km/h<br />
60-80<br />
km/h<br />
80-100<br />
km/h<br />
100-120<br />
km/h<br />
120-140<br />
km/h<br />
- Articulated Vehicle 80 0 0 11 85 4 0 0<br />
- Cars 120 0 0 1 19 60 18 2<br />
- Rigid Vehicles 80 1 1 11 60 23 4 0<br />
- Single Decker Buses - - - - - - - -<br />
Dual Carriageway<br />
- Articulated Vehicle 80 2 7 34 57 0 0 0<br />
- Cars 100 1 2 16 58 20 1 0<br />
- Rigid Vehicles 80 1 6 32 57 4 0 0<br />
- Single Decker Buses - 0 0 - - - - -<br />
National Primary<br />
- Articulated Vehicle 80 0 0 13 86 1 0 0<br />
- Cars 100 0 0 5 69 25 1 0<br />
- Rigid Vehicles 80 0 0 24 71 5 0 0<br />
- Single Decker Buses 80 0 0 32 68 0 0 0<br />
National Secondary<br />
- Articulated Vehicle 80 0 2 40 58 0 0 0<br />
- Cars 100 0 2 29 55 12 1 0<br />
- Rigid Vehicles 80 2 5 45 46 2 0 0<br />
- Single Decker Buses 80 0 0 69 31 0 0 0<br />
Regional <strong>Road</strong><br />
Local <strong>Road</strong><br />
- Articulated Vehicle 80 6 12 61 21 0 0 0<br />
- Cars 80 3 14 57 23 3 0 0<br />
- Rigid Vehicles 80 0 11 66 20 3 0 0<br />
- Single Decker Buses - 0 0 100 0 0 0 0<br />
- Cars 80 8 23 50 16 2 0 0<br />
<strong>2006</strong> SURVEY OF FREE SPEED (URBAN AND RURAL)<br />
140 +<br />
km/h<br />
19
5. <strong>Free</strong> speed (urban): Comparison <strong>of</strong> results for <strong>2006</strong> and 2005.<br />
Urban Arterial - 50 km/h zone<br />
<strong>Road</strong> Type and Vehicle Class<br />
2005 Exceeding<br />
<strong>2006</strong> Exceeding<br />
<strong>Speed</strong> Limit<br />
<strong>Speed</strong> Limit (%)<br />
(%)*<br />
<strong>2006</strong> average<br />
<strong>Free</strong> <strong>Speed</strong><br />
(km/h)<br />
2005 average<br />
<strong>Free</strong> <strong>Speed</strong><br />
(km/h)<br />
- Cars 86 91 60 62<br />
Urban Arterial – 60 km/h zone<br />
- Cars 89 80 71 69<br />
Urban National – 50 km/h sign<br />
- Articulated Vehicle 67 89 65 61<br />
- Cars 82 89 75 65<br />
- Motor Cycle 88 - 78 -<br />
- Rigid Vehicles 77 80 68 58<br />
- Single Decker Buses 74 79 67 56<br />
Urban Residential – 50 km/h zone<br />
- Cars 47 20 51 43<br />
20 <strong>2006</strong> SURVEY OF FREE SPEED (URBAN AND RURAL)
6. <strong>Free</strong> speed (Rural): Comparison <strong>of</strong> results for <strong>2006</strong> and 2005.<br />
Motorway<br />
Dual Carriageway<br />
National Primary<br />
National Secondary<br />
Regional <strong>Road</strong><br />
Local <strong>Road</strong>s<br />
<strong>Road</strong> Type and Vehicle Class<br />
2005 Exceeding<br />
<strong>2006</strong> Exceeding<br />
<strong>Speed</strong> Limit<br />
<strong>Speed</strong> Limit (%)<br />
(%)*<br />
<strong>2006</strong> average<br />
<strong>Free</strong> <strong>Speed</strong><br />
(km/h)<br />
2005 average<br />
<strong>Free</strong> <strong>Speed</strong><br />
(km/h)<br />
- Articulated Vehicle 89 94 87 86<br />
- Cars 20 15 110 109<br />
- Rigid Vehicles 85 88 92 89<br />
- Single Decker Buses 0 100 80 95<br />
- Articulated Vehicle 56 87 79 85<br />
- Cars 22 28 90 96<br />
- Rigid Vehicles 58 78 81 84<br />
- Single Decker Buses 12 77 82 85<br />
- Articulated Vehicle 87 83 86 85<br />
- Cars 27 23 95 94<br />
- Rigid Vehicles 76 76 86 86<br />
- Single Decker Buses 0 76 84 85<br />
- Articulated Vehicle 58 48 81 76<br />
- Cars 13 9 87 85<br />
- Rigid Vehicles 41 30 77 74<br />
- Single Decker Buses 0 38 73 75<br />
- Articulated Vehicle 9 45 68 76<br />
- Cars 16 63 72 84<br />
- Rigid Vehicles 22 45 72 77<br />
- Single Decker Buses 0 9 60 65<br />
- Cars 22 37 67 75<br />
<strong>2006</strong> SURVEY OF FREE SPEED (URBAN AND RURAL)<br />
21
7. <strong>Free</strong> speed percentiles on rural roads, <strong>2006</strong><br />
Motorway<br />
Dual Carriageway<br />
National Primary<br />
National Secondary<br />
Regional <strong>Road</strong><br />
Local <strong>Road</strong>s<br />
<strong>Road</strong> Type and Vehicle Class<br />
<strong>Speed</strong> Limit<br />
(Km/h)<br />
50th Percentile<br />
<strong>Speed</strong> (km/h)<br />
85th Percentile<br />
<strong>Speed</strong> (km/h)<br />
- Articulated Vehicle 80 86 91<br />
- Cars 120 110 123<br />
- Rigid Vehicles 80 89 109<br />
- Single Decker Buses 80 80 80<br />
- Articulated Vehicle 80 82 89<br />
- Cars 100 92 103<br />
- Rigid Vehicles 80 84 93<br />
- Single Decker Buses 80 83 91<br />
- Articulated Vehicle 80 86 90<br />
- Cars 100 95 104<br />
- Rigid Vehicles 80 86 93<br />
- Single Decker Buses 80 84 97<br />
- Articulated Vehicle 80 83 88<br />
- Cars 100 86 100<br />
- Rigid Vehicles 80 79 89<br />
- Single Decker Buses 80 75 86<br />
- Articulated Vehicle 80 69 80<br />
- Cars 80 70 86<br />
- Rigid Vehicles 80 71 84<br />
- Single Decker Buses - 60 60<br />
- Cars 80 66 82<br />
22 <strong>2006</strong> SURVEY OF FREE SPEED (URBAN AND RURAL)
Appendix 1:<br />
Sample free speed survey sheet<br />
FREE SPEED SURVEY <strong>2006</strong><br />
Site Information<br />
Code<br />
Location<br />
Date<br />
Target Sample Size<br />
Actual Sample Size<br />
Weather<br />
Start Time<br />
Finish Time<br />
<strong>Speed</strong> Limit<br />
<strong>Survey</strong>ed By<br />
Number Car Rigid Artic<br />
1<br />
2<br />
3<br />
4<br />
5<br />
6<br />
7<br />
8<br />
9<br />
10<br />
11<br />
12<br />
13<br />
14<br />
15<br />
16<br />
17<br />
18<br />
19<br />
20<br />
<strong>2006</strong> SURVEY OF FREE SPEED (URBAN AND RURAL)<br />
Type<br />
Single<br />
Decker Bus<br />
Double<br />
Decker Bus<br />
<strong>Speed</strong> (mph)<br />
23
Appendix 2:<br />
<strong>Free</strong> speeds (urban) survey locations<br />
Table A5.1 - Urban national – 50 km/h sign<br />
IDCODE ROUTE LOCAL DESCRIPTION<br />
NPU01 N17 Sligo At 50 km/h SL Curry – Southside<br />
NPU02 N18 Galway At 50 km/h SL north side <strong>of</strong> Gort town<br />
NPU03 N8 Cork<br />
NPU04 N3 Meath<br />
NPU05 N8 Laois<br />
Table A5.2 - Urban arterial – 60 km/h speed limit zone<br />
IDCODE ROUTE LOCAL DESCRIPTION<br />
At Fitzpatrick’s Hotel, between the junctions <strong>of</strong> N8/R635 &<br />
N8/R639<br />
Kells, on the east approach from Navan before the junction <strong>of</strong><br />
N3/R163<br />
Durrow, at the north approach to Durrow, before the junction <strong>of</strong><br />
N8/R434<br />
NSU01 N78 Kildare Athy, at the north-eastern approach from Kilcullen<br />
NSU04 N71 Cork West <strong>of</strong> Bandon, between the junctions <strong>of</strong> N71/R603 & N71/R602<br />
NSU05 N69 Limerick Tarbert on the N69, to the east <strong>of</strong> the junction <strong>of</strong> N69/N67<br />
NSU07 N63 Galway At 50 km/h SL eastside <strong>of</strong> Moylough<br />
ART1 N/A Dublin Rock road north <strong>of</strong> St. Helens <strong>Road</strong><br />
ART4 N/A Dublin Chapelizod road at the sports grounds<br />
ART6 N/A Dublin James Larkin road slightly <strong>of</strong>f Watermill road<br />
ART10 N/A Dublin Clonkeen road south <strong>of</strong> Beach Park <strong>Road</strong><br />
ART11 N/A Dublin Naas road midway between Club road and Turnpike road<br />
ART13 N/A Dublin Finglas road after Ballybogan road and north <strong>of</strong> Slaney road<br />
ART14 N/A Dublin N11 Belfield just south <strong>of</strong> Belfield flyover<br />
ART15 N/A Dublin Malahide road slightly north <strong>of</strong> Greencastle road<br />
24 <strong>2006</strong> SURVEY OF FREE SPEED (URBAN AND RURAL)
Table A5.3 Urban arterial – 50 km/h speed limit zone<br />
IDCODE ROUTE LOCAL DESCRIPTION<br />
ART2 N/A Dublin Morehampton road at Sachs Hotel<br />
ART3 N/A Dublin Cabra road east <strong>of</strong> Annamoe road<br />
ART5 N/A Dublin Templeogue road at Bushy Park<br />
ART7 N/A Dublin N3 Navan road east <strong>of</strong> Kinvara avenue<br />
ART8 N/A Dublin Dodder Park road north <strong>of</strong> Rathfarnham road<br />
ART9 N/A Dublin Lower Kilmacud road near junction with Kilmacud road<br />
Table A5.4 Urban residential –50 km/h zone<br />
IDCODE ROUTE LOCAL DESCRIPTION<br />
RES01 N/A Dublin Brian <strong>Road</strong> Marino<br />
RES02 N/A Dublin Broombridge <strong>Road</strong><br />
RES03 N/A Dublin Lorcan Avenue Santry, slightly to the west <strong>of</strong> Coolgariff road<br />
RES04 N/A Dublin Brookwood Rise, between Gracefield and Rosemount Avenues<br />
RES05 N/A Dublin Annamoe <strong>Road</strong><br />
RES06 N/A Dublin Glasilawn road, Griffith Avenue area<br />
RES07 N/A Dublin Charlemont, at the missionary College<br />
RES08 N/A Dublin Delwood road Blanchardstown, between Delwood walk and drive<br />
RES11 N/A Dublin Abbey Park, just south <strong>of</strong> the Grange road<br />
<strong>2006</strong> SURVEY OF FREE SPEED (URBAN AND RURAL)<br />
25
Appendix 3:<br />
<strong>Free</strong> speeds (rural) survey locations<br />
Table A6.1 Motorway<br />
IDCODE ROUTE LOCAL DESCRIPTION<br />
Myr01 M04 Kildare Just south <strong>of</strong> Maynooth exit<br />
Myr02 M07 Kildare 1 mile west <strong>of</strong> M9 interchange<br />
Myr03 M01 Louth Just south <strong>of</strong> R170 Ardee junction<br />
Myr04 M04 Kildare 1 mile south <strong>of</strong> Maynooth exit<br />
Myr05 M07 Kildare 1 mile north <strong>of</strong> Naas/Allenwood junction<br />
Myr06 M11 Dublin 1 mile south <strong>of</strong> roundabout at Shankill<br />
Myr07 M07 Laois Portlaoise bypass<br />
Myr08 M07 Laois Portlaoise bypass<br />
Myr09 M01 Dublin Balbriggan bypass<br />
Myr10 M01 Dublin Balbriggan bypass<br />
Table A6.2 Dual carriageway<br />
IDCODE ROUTE LOCAL DESCRIPTION<br />
DCR01 N18 Clare 1 mile west <strong>of</strong> R463 Cratloe junction<br />
DCR02 N03 Meath Close to Trim junction, R154<br />
DCR03 N03 Meath Close to Trim junction, R154<br />
DCR04 N03 Dublin 3 miles north <strong>of</strong> Clonsilla junction<br />
DCR05 N11 Wicklow South <strong>of</strong> Newtownmountkennedy junction<br />
DCR06 N18 Clare 2.5 miles east <strong>of</strong> R462 junction<br />
DCR07 N18 Clare 1 mile west <strong>of</strong> R462 Cratloe junction<br />
DCR08 N11 Wicklow South <strong>of</strong> Newtownmountkennedy junction<br />
DCR09 N11 Wicklow Arklow by-pass<br />
DCR10 N25 Cork Lower Glanmire road, Cork<br />
26 <strong>2006</strong> SURVEY OF FREE SPEED (URBAN AND RURAL)
Table A6.3 National Primary (2-Lane)<br />
IDCODE ROUTE LOCAL DESCRIPTION<br />
NPR01 N25 Waterford 5 miles west <strong>of</strong> Dungarvan<br />
NPR02 N08 Tipperary Between Horse & Jockey and Turnpike junctions<br />
NPR03 N02 Monaghan 2 miles north <strong>of</strong> Carrickmacross<br />
NPR04 N03 Cavan 2 miles south <strong>of</strong> Baeilieboro junction<br />
NPR05 N04 Sligo 6 miles north <strong>of</strong> Boyle<br />
NPR06 N22 Cork 1 mile east <strong>of</strong> R590/N22 junction<br />
NPR07 N04 Leitrim Drumsna bypass<br />
NPR08 N05 Longford 2 miles west <strong>of</strong> Longford<br />
NPR09 N05 Mayo Swinford bypass<br />
NPR10 N06 Offaly 1.5 miles west <strong>of</strong> Horseleap<br />
Table A6.4 National Secondary (2-Lane)<br />
IDCODE ROUTE LOCAL DESCRIPTION<br />
NSR01 N60 Mayo 2 miles west <strong>of</strong> Claremorris<br />
NSR02 N84 Mayo Just north <strong>of</strong> Partry<br />
NSR03 N67 Galway Kinvara to Kilcolgan<br />
NSR04 N78 Kilkenny North <strong>of</strong> Castlecomer<br />
NSR05 N58 Mayo Bellavary to Foxford<br />
NSR06 N56 Donegal 2.5 miles south <strong>of</strong> Dunfanghy<br />
NSR07 N60 Mayo 4 miles south <strong>of</strong> Castlebar<br />
NSR08 N62 Tipperary 5 miles north <strong>of</strong> Templemore<br />
NSR09 N59 Mayo 6 miles west <strong>of</strong> Newport<br />
NSR10 N72 Kerry 3 miles east <strong>of</strong> N72/N22 junction near 4-arm junction<br />
<strong>2006</strong> SURVEY OF FREE SPEED (URBAN AND RURAL)<br />
27
Table A6.5 Regional road (2-Lane)<br />
IDCODE ROUTE LOCAL DESCRIPTION<br />
NNR01 R352 Galway From R353 to Powers Cross<br />
NNR03 R178 Louth Between Carrickmacross and Dundalk<br />
NNR05 R515 Tipperary<br />
NNR06 R438 Offaly 1 mile north <strong>of</strong> Taylor’s Cross<br />
NNR07 R499 Tipperary East <strong>of</strong> Dolla & Silvermines<br />
NNR08 R403 Kildare Allenwood side <strong>of</strong> Prosperous<br />
NNR09 R629 Cork South <strong>of</strong> Midleton.<br />
NNR10 R742 Wexford Wexford to Curracloe<br />
Table A6.6 Local road (2-Lane)<br />
IDCODE ROUTE LOCAL DESCRIPTION<br />
NNL01 LP3210 Galway 2.4 miles from R358 at Mountbellew to Ballyforan<br />
NNL02 LP111 Kildare Timahoe to R402<br />
NNL03 LP333 Kildare South east <strong>of</strong> Naas R410 to north N7<br />
NNL04 LP999 Wicklow Between R760 and Sraghmore<br />
NNL06 L41 Offaly Tullamore - Ballinagar,2km east <strong>of</strong> Tullamore<br />
NNL08 L34 Cork Ballynoe to R627 Ballyknock<br />
NNL09 L35 Cork North Midleton<br />
NNL10 L7 Wexford Enniscorthy <strong>Road</strong> to Ferns<br />
Lattin, west <strong>of</strong> Tipperary town between Clashdrumsmith and<br />
Shronell<br />
28 <strong>2006</strong> SURVEY OF FREE SPEED (URBAN AND RURAL)
Working To Save Lives<br />
Údarás Um Shábháilteacht Ar Bhóithre<br />
<strong>Road</strong> <strong>Safety</strong> <strong>Authority</strong><br />
Páirc Ghnó Ghleann na Muaidhe, Cnoc an tSabhaircín,<br />
Bóthar Bhaile Átha Cliath, Béal an Átha, Co. Mhaigh Eo.<br />
Moy Valley Business Park, Primrose Hill,<br />
Dublin <strong>Road</strong>, Ballina, Co. Mayo.<br />
locall: 1890 50 60 80 fax: (096) 25 252<br />
email: info@rsa.ie website: www.rsa.ie


