Ap* (“ApSTAR”) Major Magnetic Storms Index (1932-present)
Ap* (“ApSTAR”) Major Magnetic Storms Index (1932-present)
Ap* (“ApSTAR”) Major Magnetic Storms Index (1932-present)
You also want an ePaper? Increase the reach of your titles
YUMPU automatically turns print PDFs into web optimized ePapers that Google loves.
The <strong>Ap*</strong> <strong>Index</strong> of Maximum 24-Hour Disturbance for Storm Events:<br />
An index description and personal reminiscence by its author, J.H.Allen<br />
18 January 2004<br />
<strong>Ap*</strong> is defined as the earliest occurring maximum 24-hour value obtained by computing<br />
an 8-point running average of successive 3-hour ap indices during a geomagnetic storm<br />
event without regard to the starting and ending times of the UT-day. It is uniquely<br />
associated with the storm event. Over many years, values of <strong>Ap*</strong> provide a maximum<br />
disturbance measure useful to identify major geomagnetic storms chronologically (by<br />
date and start time) and by amplitude from largest to the smallest. The earliest possible<br />
values are for <strong>1932</strong>, because that is the first year for which the standard Kp and ap indices<br />
were produced. As NGDC staff or others have time to update <strong>Ap*</strong>, tables of values are<br />
available from <strong>1932</strong> to recent times. They are available by FTP transfer from the NGDC<br />
website.<br />
Often for current storms of special interest, <strong>Ap*</strong> values are derived by hand in order to<br />
compare their maximum 24-hour intensities with values for historic storms. For example,<br />
artificial satellites have been in orbit since about 1960. The top ten <strong>Ap*</strong> values from<br />
1960 through 2003 are given in the table below. Values from 1960 through 2001 were<br />
taken directly from the on-line <strong>Ap*</strong> values at NGDC. Several large solar eruptions in<br />
October 2003 directed streams of energetic particles toward Earth and resulted in large<br />
geomagnetic storms. These were unusual because they happened several years after the<br />
peak of activity around sunspot maximum in 2000. Many satellites in orbit were affected<br />
by the disturbed magnetospheric conditions. A prompt value of <strong>Ap*</strong> was hand-calculated<br />
for the most disturbed 24-hours. The maximum 24-hour disturbance began at 0600 UT<br />
on 29 October 2003. The storm event lasted several days. It had <strong>Ap*</strong> = 204. As shown<br />
in the table below, this new storm entered the “Top Ten” list in the ninth position for the<br />
current era when most artificial satellites have been in orbit.<br />
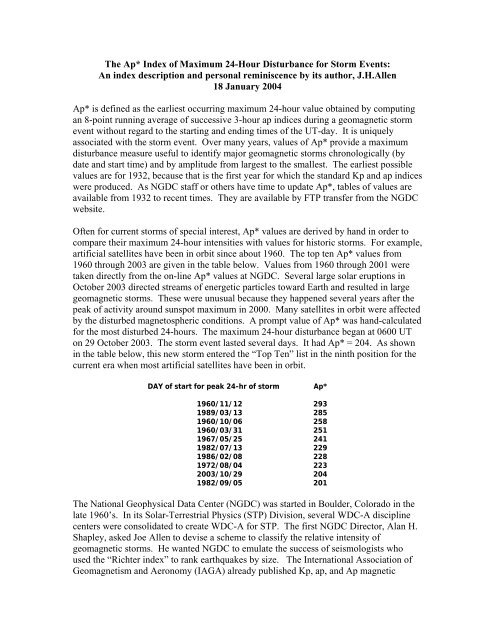
DAY of start for peak 24-hr of storm <strong>Ap*</strong><br />
1960/11/12 293<br />
1989/03/13 285<br />
1960/10/06 258<br />
1960/03/31 251<br />
1967/05/25 241<br />
1982/07/13 229<br />
1986/02/08 228<br />
1972/08/04 223<br />
2003/10/29 204<br />
1982/09/05 201<br />
The National Geophysical Data Center (NGDC) was started in Boulder, Colorado in the<br />
late 1960’s. In its Solar-Terrestrial Physics (STP) Division, several WDC-A discipline<br />
centers were consolidated to create WDC-A for STP. The first NGDC Director, Alan H.<br />
Shapley, asked Joe Allen to devise a scheme to classify the relative intensity of<br />
geomagnetic storms. He wanted NGDC to emulate the success of seismologists who<br />
used the “Richter index” to rank earthquakes by size. The International Association of<br />
Geomagnetism and Aeronomy (IAGA) already published Kp, ap, and Ap magnetic
activity indices in a series of annual books for years since <strong>1932</strong>, and in cumulative<br />
volumes for multiple years. For over 40 years they have provided tables of 3-hourly Kp<br />
and ap indices, and daily average Ap indices for each UT-day. These are derived from<br />
disturbance values scaled from magnetograms recorded at twelve or more different<br />
magnetic observatories distributed around the world. Kp, ap and Ap were essential tools<br />
for comparison of geomagnetic storms, along with other indices and physical parameters<br />
of the disturbed Sun-Earth system. However, they had a problem that is solved with the<br />
introduction of <strong>Ap*</strong>.<br />
In early 1974, Allen noted with interest the difference between the yearly number of<br />
magnetic storm days (Ap ≥ 40) and the smoothed annual sunspot number (see figure for<br />
years from <strong>1932</strong>-2000).<br />
The 11-year cycles of the familiar sunspot number (yellow) are reasonably uniform in<br />
shape although they vary in maximum amplitude and cycle length. Some have broad,<br />
multi-year peaks while others are sharper. The annual magnetic storm days pattern (red)<br />
is much more variable, although there are some persistent features. For example, at least<br />
one peak in the number of magnetic storms happens during the declining years of each<br />
solar cycle, and sometimes more than one. A part of the study involved counting the<br />
published number of days per year having daily Ap≥100, 80, 60 and 40. This effort<br />
revealed the interesting pattern shown above for Ap≥40, but also it also illustrated the<br />
problem with the regular Ap index. Ap is the 8-value average of only the 3-hourly ap
values for each UT-day. However, some storms begin sharply in mid-day and their<br />
maximum disturbed period extends into the middle of the next UT-day. The Sun appears<br />
not to be aware of the location of the Greenwich Meridian and so doesn’t organize storm<br />
events by UT-days. The result is that values of Ap on successive days regularly under<br />
rate the peak size of geomagnetic storms.<br />
It seemed reasonable to compute an Ap-like index from the original ap values, but to do<br />
so without regard to the UT-day, i.e. to compute an 8-point running average and look for<br />
maxima. If one defined a storm starting and ending average value, then these would<br />
establish the timing and duration of storm events. The maximum 8-point average during<br />
the event is a measure of the storm’s peak intensity. It provides a value comparable to<br />
the regular Ap, but more useful for relative classification of different storms. In this way<br />
the <strong>Ap*</strong> index emerged from the initial study of Ap storm-days. For storm events when<br />
the most disturbed 24-hours also begins with the start of the UT-day, then Ap = <strong>Ap*</strong>.<br />
This happens for about 1/8 th of all classified storms. Thus, the historical Ap index<br />
undervalues about 7/8ths of all storms.<br />
<strong>Ap*</strong> has been tabulated at WDC-A for STP since it was devised in 1974. It was first<br />
<strong>present</strong>ed in a paper given by J.H. Allen at the IAGA Scientific Assembly in Seattle,<br />
Washington. Graphs and tables of these indices and explanations of their simple<br />
derivation have been published in various papers and proceedings. The earliest published<br />
description of <strong>Ap*</strong> and a list of key dates of major storms, was in "Solar-Terrestrial<br />
Physics and Meteorology: A Working Document," edited by A.H. Shapley, H.W.<br />
Kroehl, and J.H. Allen, SCOSTEP, July 1975.<br />
The index is more fully described and related to satellite anomalies in the papers:<br />
“Some Commonly Used <strong>Magnetic</strong> Activity Indices: Their Derivation, Meaning, and<br />
Use” J. H. Allen (pages 114-134) in “Proceedings of a Workshop on Satellite Drag”,<br />
March 18-19, 1982, Boulder, Colorado, Edited by Jo Ann C. Joselyn; and in<br />
“Solar-Terrestrial Activity Affecting Systems in Space and on Earth”, by J.H. Allen and<br />
D.C. Wilkinson (pages 75-107) in “Solar-Terrestrial Predictions-IV: Proceedings of a<br />
Workshop at Ottawa, Canada May 18-22, 1992”, Edited by J. Hruska, M.A. Shea, D.F.<br />
Smart, and G. Heckman. The indices have been available on-line since 1994.<br />
The standard computer output from the <strong>Ap*</strong> program appears in the on-line file. It gives<br />
the values used to identify the storm periods’ start and end times (usually 40 and 40), the<br />
number of major storms in each month for all years surveyed, the total number of major<br />
storms per year, and the total number of major storms per month over all years. These<br />
statistical values provide information about the year-to-year pattern of major geomagnetic<br />
storm events and their seasonal distribution. Figures published in the referenced papers<br />
and in the on-line printout show the bimodal annual distribution of major magnetic<br />
storms. There are peak storm times each yearduring the weeks around the spring and<br />
autumn equinoxes. Fewer storms happen during winter and summer seasons, although a<br />
major geomagnetic storm can occur anytime during any given year without regard to<br />
season or phase of the sunspot cycle.
The <strong>Ap*</strong> index has been used to look for trends in the geoeffectiveness of solar Coronal<br />
Mass Ejections and flare-related events, to compare with the size of solar proton events,<br />
and to compare with reported anomalies of operational satellites and other technology.<br />
For many modern problems, it is not important that the <strong>Ap*</strong> index only begins with <strong>1932</strong>,<br />
the earliest date to which S. Chapman and J. Bartels extended their indices. However, for<br />
comparisons between geomagnetic storms and other, longer running measures of<br />
geophysical and Solar-Terrestrial phenomena, it is interesting to find some means of<br />
extending this concept to earlier years. This was possible using the aa-index compiled by<br />
Fr. P. Mayaud. He obtained copies of magnetograms from a pair of magnetic<br />
observatories on roughly opposite sides of the world, i.e. “antipodal” sites. From their<br />
individual sets of 3-hourly local K indices, he obtained equivalent a-indices and averaged<br />
them to produce the “antipodal a-index”, aa, from 1868 up to more recent years. Since<br />
Fr. Mayaud retired, his associate Michelle Menvielle has continued to produce aa indices<br />
for each 3-hour interval of the UT-day.<br />
The aa-index, as defined by Mayaud, has the same problem as Ap with respect to its<br />
existing only for each UT-day. It artificially divides the peak disturbance intervals of<br />
many storms. This has been overcome by producing the similar AA* index from the<br />
8-point running mean of aa-indices. The units are different from those of <strong>Ap*</strong>, but the<br />
two maximum disturbance indices were calibrated by comparison over the years since<br />
<strong>1932</strong>, when both could be computed. The threshold values for beginning and ending<br />
times of storm events are different using aa, but they were adjusted until the identified<br />
overall list of storm intervals are about the same according to both indices. Then, AA*<br />
was computed for each storm interval since 1868, and compared with smoothed annual<br />
sunspot numbers. These results also are available on-line from NGDC/WDC-A for STP.<br />
Both <strong>Ap*</strong> and AA* serve useful purposes and neither replaces the other. The rank order<br />
of some of the largest, most significant great geomagnetic storms is different between<br />
<strong>Ap*</strong> and AA*. As Mayaud has pointed out, the aa index is derived from records of only<br />
two observatories and may be more easily affected by local, nearby overhead electrojet<br />
currents in the ionosphere above either of the two observatories whose records of local<br />
magnetic variations are used. In contrast, the averaged disturbance record of twelve or<br />
more observatories used for Ap is a more stable, truly global index of geomagnetic<br />
storms. Hence, <strong>Ap*</strong> is to be preferred when it is used for classifying storm events during<br />
the years for which it exists.


