The link between supply chain fit and financial - MBA, Supply Chain ...
The link between supply chain fit and financial - MBA, Supply Chain ...
The link between supply chain fit and financial - MBA, Supply Chain ...

You also want an ePaper? Increase the reach of your titles
YUMPU automatically turns print PDFs into web optimized ePapers that Google loves.
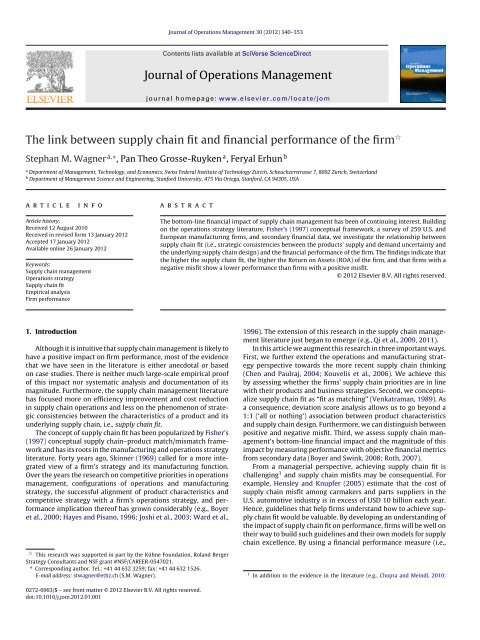
Journal of Operations Management 30 (2012) 340–353<br />
Contents lists available at SciVerse ScienceDirect<br />
Journal of Operations Management<br />
jo ur n al homep a ge: www.elsevier.com/locate/jom<br />
<strong>The</strong> <strong>link</strong> <strong>between</strong> <strong>supply</strong> <strong>chain</strong> <strong>fit</strong> <strong>and</strong> <strong>financial</strong> performance of the firm �<br />
Stephan M. Wagner a,∗ , Pan <strong>The</strong>o Grosse-Ruyken a , Feryal Erhun b<br />
a Department of Management, Technology, <strong>and</strong> Economics, Swiss Federal Institute of Technology Zurich, Scheuchzerstrasse 7, 8092 Zurich, Switzerl<strong>and</strong><br />
b Department of Management Science <strong>and</strong> Engineering, Stanford University, 475 Via Ortega, Stanford, CA 94305, USA<br />
a r t i c l e i n f o<br />
Article history:<br />
Received 12 August 2010<br />
Received in revised form 13 January 2012<br />
Accepted 17 January 2012<br />
Available online 26 January 2012<br />
Keywords:<br />
<strong>Supply</strong> <strong>chain</strong> management<br />
Operations strategy<br />
<strong>Supply</strong> <strong>chain</strong> <strong>fit</strong><br />
Empirical analysis<br />
Firm performance<br />
1. Introduction<br />
a b s t r a c t<br />
Although it is intuitive that <strong>supply</strong> <strong>chain</strong> management is likely to<br />
have a positive impact on firm performance, most of the evidence<br />
that we have seen in the literature is either anecdotal or based<br />
on case studies. <strong>The</strong>re is neither much large-scale empirical proof<br />
of this impact nor systematic analysis <strong>and</strong> documentation of its<br />
magnitude. Furthermore, the <strong>supply</strong> <strong>chain</strong> management literature<br />
has focused more on efficiency improvement <strong>and</strong> cost reduction<br />
in <strong>supply</strong> <strong>chain</strong> operations <strong>and</strong> less on the phenomenon of strategic<br />
consistencies <strong>between</strong> the characteristics of a product <strong>and</strong> its<br />
underlying <strong>supply</strong> <strong>chain</strong>, i.e., <strong>supply</strong> <strong>chain</strong> <strong>fit</strong>.<br />
<strong>The</strong> concept of <strong>supply</strong> <strong>chain</strong> <strong>fit</strong> has been popularized by Fisher’s<br />
(1997) conceptual <strong>supply</strong> <strong>chain</strong>–product match/mismatch framework<br />
<strong>and</strong> has its roots in the manufacturing <strong>and</strong> operations strategy<br />
literature. Forty years ago, Skinner (1969) called for a more integrated<br />
view of a firm’s strategy <strong>and</strong> its manufacturing function.<br />
Over the years the research on competitive priorities in operations<br />
management, configurations of operations <strong>and</strong> manufacturing<br />
strategy, the successful alignment of product characteristics <strong>and</strong><br />
competitive strategy with a firm’s operations strategy, <strong>and</strong> performance<br />
implication thereof has grown considerably (e.g., Boyer<br />
et al., 2000; Hayes <strong>and</strong> Pisano, 1996; Joshi et al., 2003; Ward et al.,<br />
� This research was supported in part by the Kühne Foundation, Rol<strong>and</strong> Berger<br />
Strategy Consultants <strong>and</strong> NSF grant #NSF/CAREER-0547021.<br />
∗ Corresponding author. Tel.: +41 44 632 3259; fax: +41 44 632 1526.<br />
E-mail address: stwagner@ethz.ch (S.M. Wagner).<br />
0272-6963/$ – see front matter © 2012 Elsevier B.V. All rights reserved.<br />
doi:10.1016/j.jom.2012.01.001<br />
<strong>The</strong> bottom-line <strong>financial</strong> impact of <strong>supply</strong> <strong>chain</strong> management has been of continuing interest. Building<br />
on the operations strategy literature, Fisher’s (1997) conceptual framework, a survey of 259 U.S. <strong>and</strong><br />
European manufacturing firms, <strong>and</strong> secondary <strong>financial</strong> data, we investigate the relationship <strong>between</strong><br />
<strong>supply</strong> <strong>chain</strong> <strong>fit</strong> (i.e., strategic consistencies <strong>between</strong> the products’ <strong>supply</strong> <strong>and</strong> dem<strong>and</strong> uncertainty <strong>and</strong><br />
the underlying <strong>supply</strong> <strong>chain</strong> design) <strong>and</strong> the <strong>financial</strong> performance of the firm. <strong>The</strong> findings indicate that<br />
the higher the <strong>supply</strong> <strong>chain</strong> <strong>fit</strong>, the higher the Return on Assets (ROA) of the firm, <strong>and</strong> that firms with a<br />
negative mis<strong>fit</strong> show a lower performance than firms with a positive mis<strong>fit</strong>.<br />
© 2012 Elsevier B.V. All rights reserved.<br />
1996). <strong>The</strong> extension of this research in the <strong>supply</strong> <strong>chain</strong> management<br />
literature just began to emerge (e.g., Qi et al., 2009, 2011).<br />
In this article we augment this research in three important ways.<br />
First, we further extend the operations <strong>and</strong> manufacturing strategy<br />
perspective towards the more recent <strong>supply</strong> <strong>chain</strong> thinking<br />
(Chen <strong>and</strong> Paulraj, 2004; Kouvelis et al., 2006). We achieve this<br />
by assessing whether the firms’ <strong>supply</strong> <strong>chain</strong> priorities are in line<br />
with their products <strong>and</strong> business strategies. Second, we conceptualize<br />
<strong>supply</strong> <strong>chain</strong> <strong>fit</strong> as “<strong>fit</strong> as matching” (Venkatraman, 1989). As<br />
a consequence, deviation score analysis allows us to go beyond a<br />
1:1 (‘all or nothing’) association <strong>between</strong> product characteristics<br />
<strong>and</strong> <strong>supply</strong> <strong>chain</strong> design. Furthermore, we can distinguish <strong>between</strong><br />
positive <strong>and</strong> negative mis<strong>fit</strong>. Third, we assess <strong>supply</strong> <strong>chain</strong> management’s<br />
bottom-line <strong>financial</strong> impact <strong>and</strong> the magnitude of this<br />
impact by measuring performance with objective <strong>financial</strong> metrics<br />
from secondary data (Boyer <strong>and</strong> Swink, 2008; Roth, 2007).<br />
From a managerial perspective, achieving <strong>supply</strong> <strong>chain</strong> <strong>fit</strong> is<br />
challenging 1 <strong>and</strong> <strong>supply</strong> <strong>chain</strong> mis<strong>fit</strong>s may be consequential. For<br />
example, Hensley <strong>and</strong> Knupfer (2005) estimate that the cost of<br />
<strong>supply</strong> <strong>chain</strong> mis<strong>fit</strong> among carmakers <strong>and</strong> parts suppliers in the<br />
U.S. automotive industry is in excess of USD 10 billion each year.<br />
Hence, guidelines that help firms underst<strong>and</strong> how to achieve <strong>supply</strong><br />
<strong>chain</strong> <strong>fit</strong> would be valuable. By developing an underst<strong>and</strong>ing of<br />
the impact of <strong>supply</strong> <strong>chain</strong> <strong>fit</strong> on performance, firms will be well on<br />
their way to build such guidelines <strong>and</strong> their own models for <strong>supply</strong><br />
<strong>chain</strong> excellence. By using a <strong>financial</strong> performance measure (i.e.,<br />
1 In addition to the evidence in the literature (e.g., Chopra <strong>and</strong> Meindl, 2010;
Return on Assets, ROA) as an outcome of <strong>supply</strong> <strong>chain</strong> <strong>fit</strong> (or mis<strong>fit</strong>)<br />
– as we do in this research – we speak in the language of managers<br />
who are more familiar with such measures than with subjective,<br />
perceptual performance measures. Relating <strong>supply</strong> <strong>chain</strong> <strong>fit</strong> to ROA<br />
will result in a higher impact of our research in corporate practice.<br />
<strong>The</strong> rest of the paper is organized as follows. In Section 2, we<br />
begin by providing the theoretical <strong>and</strong> conceptual background from<br />
the operations strategy literature in support of our hypothesis.<br />
We then present our study’s methodology, introduce the measures<br />
used in our study, <strong>and</strong> describe the sample in Section 3. Section 4<br />
assesses the reliability <strong>and</strong> validity of our measures, followed by<br />
regression analyses in Section 5, <strong>and</strong> two post hoc analyses in Section<br />
6. In Section 7 we discuss our results <strong>and</strong> provide theoretical<br />
<strong>and</strong> managerial implications. Finally, we conclude in Section 8 with<br />
limitations <strong>and</strong> suggestions for future research.<br />
2. Background <strong>and</strong> hypothesis<br />
<strong>The</strong> operations strategy literature is an important starting point<br />
for this study’s main argument that an alignment of product <strong>and</strong><br />
<strong>supply</strong> <strong>chain</strong> priorities will be positively related to performance.<br />
<strong>The</strong>refore, we briefly discuss the operations management/strategy<br />
literature which is relevant for our study.<br />
2.1. Competitive priorities of the <strong>supply</strong> <strong>chain</strong><br />
A fundamental element of operations strategy is the definition<br />
of the firm’s competitive priorities. <strong>The</strong>se may include the basic<br />
priorities cost, quality, delivery, <strong>and</strong> flexibility (Boyer <strong>and</strong> Lewis,<br />
2002; Ward et al., 1998), as well as additional ones such as innovation<br />
(Hayes <strong>and</strong> Pisano, 1996; Krause et al., 2001; Kroes <strong>and</strong><br />
Ghosh, 2010). A firm has to make trade-offs <strong>between</strong> these priorities<br />
while allocating its limited resources (Skinner, 1969), at least<br />
with respect to the relative rates of improvement of the different<br />
priorities (Hayes <strong>and</strong> Pisano, 1996). In their study of 110 manufacturing<br />
plants, Boyer <strong>and</strong> Lewis (2002) found that trade-offs <strong>between</strong><br />
cost <strong>and</strong> flexibility, delivery <strong>and</strong> flexibility, <strong>and</strong> delivery <strong>and</strong> quality<br />
exist. This trade-off is also reflected in the distinction <strong>between</strong> lean<br />
vs. agile manufacturing (e.g., Inman et al., 2011; Narasimhan et al.,<br />
2006) <strong>and</strong> <strong>supply</strong> <strong>chain</strong> strategies (Qi et al., 2009, 2011), as well as<br />
the efficiency–responsiveness dichotomy in <strong>supply</strong> <strong>chain</strong> priorities,<br />
where efficient <strong>supply</strong> <strong>chain</strong>s aim for the cost-efficient fulfillment<br />
of predictable dem<strong>and</strong>, <strong>and</strong> responsive <strong>supply</strong> <strong>chain</strong>s for the quick<br />
response to unpredictable dem<strong>and</strong> (Fisher, 1997; Parmigiani et al.,<br />
2011; R<strong>and</strong>all et al., 2003) (Table 1).<br />
2.2. Product characteristics<br />
<strong>The</strong>re is a common underst<strong>and</strong>ing that the nature of products<br />
<strong>and</strong> product dem<strong>and</strong> are related to operational processes <strong>and</strong><br />
<strong>supply</strong> <strong>chain</strong>s (Skinner, 1969; Utterback <strong>and</strong> Abernathy, 1975).<br />
Hayes <strong>and</strong> Wheelwright (1979) proposed a product–process matrix<br />
suggesting a <strong>link</strong> <strong>between</strong> a firm’s products <strong>and</strong> its process<br />
Fisher, 1997; Lee, 2002), our survey respondents, <strong>supply</strong> <strong>chain</strong> executives <strong>and</strong> board<br />
members from leading manufacturing firms around the globe, also emphasize this<br />
fact:<br />
• “<strong>The</strong> integrated oil & gas <strong>supply</strong> <strong>chain</strong> shows two characteristics. Upstream is<br />
driven by flexibility, downstream by efficiency <strong>and</strong> flexibility. We face big problems<br />
as a leading oil company to find the optimal <strong>fit</strong>.”<br />
• “We have worked with our customers to align production <strong>and</strong> sales dem<strong>and</strong>. We<br />
have also extended this to our critical suppliers to gain cost reductions, however we<br />
are still far away from a high degree of <strong>fit</strong>.”<br />
• “We have increased our <strong>supply</strong> <strong>chain</strong> awareness as an integrated approach, being<br />
more than the sum of individual activities, but <strong>supply</strong> <strong>chain</strong> excellence in terms of<br />
matching products <strong>and</strong> <strong>supply</strong> <strong>chain</strong> design is challenging.”<br />
S.M. Wagner et al. / Journal of Operations Management 30 (2012) 340–353 341<br />
life-cycle stages. Based on the product–process matrix, Hayes <strong>and</strong><br />
Wheelwright (1979, p. 134) argued that process choice should<br />
support the firm’s products <strong>and</strong> conclude that “a certain kind of<br />
product structure is matched with its ‘natural’ process structure.<br />
On one end, firms with highly st<strong>and</strong>ardized, high volume commodity<br />
products should rely on efficient continuous flow shop<br />
processes; on the other end, firms with unst<strong>and</strong>ardized, low volume<br />
customer-specific products should rely on flexible job shop<br />
processes. <strong>The</strong> concept that a match <strong>between</strong> product structures<br />
<strong>and</strong> manufacturing process structures is related to performance<br />
found also empirical support (e.g., Miller <strong>and</strong> Roth, 1994; Safizadeh<br />
et al., 1996).<br />
From a <strong>supply</strong> <strong>chain</strong> perspective <strong>and</strong> based on characteristics<br />
such as product life-cycle, margin, product variety, forecasting<br />
error, stock-out rate, markdown or distribution intensity, products<br />
can be characterized as being either certain/predictable (also<br />
called ‘functional’) or uncertain/unpredictable (also called ‘innovative’)<br />
(Table 2) (Fisher, 1997; Qi et al., 2009; Selldin <strong>and</strong> Olhager,<br />
2007).<br />
2.3. <strong>Supply</strong> <strong>chain</strong> <strong>fit</strong><br />
In general, firms are expected to achieve better performance<br />
with environmental <strong>and</strong> internal consistency, or <strong>fit</strong>, among strategic,<br />
structural, <strong>and</strong> contextual variables (Alex<strong>and</strong>er <strong>and</strong> R<strong>and</strong>olph,<br />
1985; Burton et al., 2002; Gresov, 1989; He <strong>and</strong> Wong, 2004). In<br />
the operations management literature, there is also a long history<br />
of studying internal <strong>fit</strong>, environmental <strong>fit</strong>, <strong>and</strong> equifinality<br />
(Boyer et al., 2000; Bozarth <strong>and</strong> McDermott, 1998). For example,<br />
Skinner (1969) advocated the alignment of a firm’s strategy with<br />
its manufacturing function. <strong>The</strong> product–process matrix research<br />
argues that a firm’s processes must match the characteristics of<br />
its products (Hayes <strong>and</strong> Wheelwright, 1979). Ward et al. (1996,<br />
p. 602) observed that “manufacturing strategy, competitive strategy,<br />
environment, <strong>and</strong> structure are configured or inter<strong>link</strong>ed such<br />
that there are natural congruences <strong>between</strong> these elements” <strong>and</strong><br />
hypothesized “that business units which conform to one of the configurations<br />
will be more likely to perform well than those which are<br />
not aligned.” (Ward et al., 1996, p. 623)<br />
Extending the concept of <strong>fit</strong> to the <strong>supply</strong> <strong>chain</strong> strategy context,<br />
we conceptualize <strong>supply</strong> <strong>chain</strong> <strong>fit</strong> based on the framework of<br />
Fisher (1997) who formalizes <strong>fit</strong> by characterizing products as being<br />
either certain/predictable or uncertain/unpredictable (Table 2), <strong>and</strong><br />
<strong>supply</strong> <strong>chain</strong>s as being either efficient or responsive (Table 1). In<br />
our research, <strong>supply</strong> <strong>chain</strong> <strong>fit</strong> is defined as the perfect strategic<br />
consistency <strong>between</strong> a product’s <strong>supply</strong> <strong>and</strong> dem<strong>and</strong> characteristics<br />
(such as dem<strong>and</strong> predictability, life-cycle length, product<br />
variety, service, lead-times, <strong>and</strong> specific market requirements)<br />
<strong>and</strong> <strong>supply</strong> <strong>chain</strong> design characteristics (such as inventory strategy,<br />
product design strategy, <strong>and</strong> supplier selection aspects). For<br />
certain/predictable [uncertain/unpredictable] products the perfect<br />
strategic consistency is achieved with an efficient [responsive]<br />
<strong>supply</strong> <strong>chain</strong> (Chopra <strong>and</strong> Meindl, 2010; Fisher, 1997; Lee, 2002)<br />
(Fig. 1).<br />
In summary, based on the arguments that firms’ competitive<br />
priorities <strong>and</strong> processes must support <strong>and</strong> match its product structures<br />
<strong>and</strong> characteristics (Hayes <strong>and</strong> Wheelwright, 1979; Ward<br />
et al., 1996), <strong>and</strong> the above discussion that firms achieving a high<br />
degree of <strong>supply</strong> <strong>chain</strong> <strong>fit</strong> excel firms with a low degree of <strong>supply</strong><br />
<strong>chain</strong> <strong>fit</strong> through higher <strong>supply</strong> <strong>chain</strong> <strong>and</strong> <strong>financial</strong> performance<br />
(Chopra <strong>and</strong> Meindl, 2010; Fisher, 1997), we hypothesize the following:<br />
Hypothesis. <strong>Supply</strong> <strong>chain</strong> <strong>fit</strong> is positively associated with <strong>financial</strong><br />
performance of the firm.
342 S.M. Wagner et al. / Journal of Operations Management 30 (2012) 340–353<br />
Table 1<br />
Generic <strong>supply</strong> <strong>chain</strong> priorities (adapted from Fisher, 1997).<br />
Efficient <strong>supply</strong> <strong>chain</strong> Responsive <strong>supply</strong> <strong>chain</strong><br />
Primary purpose <strong>Supply</strong> predictable dem<strong>and</strong> efficiently at the<br />
Respond quickly to unpredictable dem<strong>and</strong> to minimize<br />
lowest possible cost<br />
stock-outs, obsolete inventory, <strong>and</strong> forced markdowns<br />
Manufacturing focus Maintain high average utilization rate Deploy excess buffer capacity<br />
Inventory strategy Generate high turns <strong>and</strong> minimize inventory<br />
throughout the <strong>chain</strong><br />
Deploy significant stocks of parts or finished goods<br />
Lead-time focus Shorten lead-time for cost <strong>and</strong> quality Invest aggressively to reduce lead-time<br />
Approach to choosing suppliers Select primarily for cost <strong>and</strong> quality Select primarily for speed, flexibility, <strong>and</strong> quality<br />
Product-design strategy Maximize performance <strong>and</strong> minimize cost Use modular design to postpone product differentiation as<br />
long as possible<br />
Table 2<br />
Generic product characteristics (adapted from Fisher, 1997).<br />
Certain/predictable products<br />
(“functional products”)<br />
Uncertain/unpredictable products<br />
(“innovative products”)<br />
Product life-cycle More than 2 years 3 months to 1 year<br />
Contribution margin 5–20% 20–60%<br />
Product variety Low (10–20 variants per<br />
High (often millions of variants per<br />
category)<br />
category)<br />
Average margin of error in the forecast at the time production is committed 10% 40–100%<br />
Average stock-out rate 1–2% 10–40%<br />
Average forced end-of-season markdown as percentage of full price 0% 10–25%<br />
Lead-time required for made-to-order products 6 months to 1 year 1 day to 2 weeks<br />
Note. <strong>The</strong> contribution margin equals price minus variable cost divided by price <strong>and</strong> is described as a percentage.<br />
3. Methodology<br />
3.1. Questionnaire design <strong>and</strong> data collection<br />
To test our hypothesis, we drafted a questionnaire in English<br />
<strong>and</strong> pretested it with executives <strong>and</strong> managers who were asked<br />
to review the questionnaire for readability, ambiguity, <strong>and</strong> completeness<br />
(Dillman, 2007). <strong>The</strong> questionnaire was also critiqued<br />
by several academics who were asked to review survey items<br />
(statements) for ambiguity <strong>and</strong> clarity, <strong>and</strong> to evaluate whether<br />
individual items appeared to be appropriate measures of their<br />
respective constructs (DeVellis, 2003). Minor changes were made<br />
based on these pretests. <strong>The</strong> English questionnaire was then translated<br />
into German <strong>and</strong> French by two native speakers <strong>and</strong> translated<br />
back into English by two other individuals to ensure similarity of<br />
meaning <strong>and</strong> semantic equivalence across the countries (Schaffer<br />
<strong>and</strong> Riordan, 2003).<br />
Responsive<br />
<strong>Supply</strong> <strong>chain</strong><br />
responsiveness<br />
(SCR)<br />
Efficient<br />
Certain/<br />
predictable<br />
Negative<br />
mis<strong>fit</strong><br />
<strong>Supply</strong> <strong>and</strong> dem<strong>and</strong><br />
uncertainty<br />
(SDU)<br />
Positive<br />
mis<strong>fit</strong><br />
Uncertain/<br />
unpredictable<br />
Fig. 1. <strong>Supply</strong> <strong>chain</strong> <strong>fit</strong>: match <strong>between</strong> <strong>supply</strong> <strong>and</strong> dem<strong>and</strong> uncertainty (SDU) <strong>and</strong><br />
<strong>supply</strong> <strong>chain</strong> responsiveness (SCR) (adapted from Chopra <strong>and</strong> Meindl, 2010 <strong>and</strong><br />
Fisher, 1997).<br />
From September 2007 to April 2008 we collected data from managers<br />
of manufacturing firms in the U.S., the UK, Germany, Austria,<br />
Switzerl<strong>and</strong>, <strong>and</strong> France. More specifically, we contacted 1834 <strong>supply</strong><br />
<strong>chain</strong>, logistics, <strong>and</strong> purchasing executives at the 1000 largest<br />
manufacturing firms in these countries. Following Dillman’s Total<br />
Design Method (Dillman, 2007), initial mailings were followed by<br />
second mailings <strong>and</strong> follow-up phone calls if necessary, resulting in<br />
336 responses (18.3%). Out of our sample, we obtained secondary<br />
data for 259 firms, yielding an effective response rate of 14.1%<br />
(259/1834).<br />
3.2. Measures<br />
<strong>The</strong> constructs of interest in this study were measured either<br />
using objective secondary data from Bloomberg or multiple items<br />
from the questionnaire survey. For the latter multi-item scales,<br />
respondents had to indicate the extent to which they agreed or disagreed<br />
with the statement on a five-point scale (1 – low, 5 – high)<br />
with higher scores reflecting increases in underlying constructs.<br />
<strong>The</strong> items used to measure each scale were adapted based on existing<br />
scales from the literature. Translations of the individual scale<br />
items, response cues for each measure, <strong>and</strong> descriptive statistics<br />
are detailed in Table 3.<br />
3.2.1. <strong>Supply</strong> <strong>chain</strong> <strong>fit</strong><br />
<strong>Supply</strong> <strong>chain</strong> <strong>fit</strong> requires a match <strong>between</strong> the two dimensions<br />
of <strong>supply</strong> <strong>and</strong> dem<strong>and</strong> uncertainty of a product <strong>and</strong> <strong>supply</strong> <strong>chain</strong><br />
design characteristics. <strong>The</strong> respondents had to answer items for<br />
these two dimensions with respect to their firms’ main product line,<br />
which was defined as the current sales (revenue) driver of the firm,<br />
i.e., the product line with the largest contribution to sales/revenues.<br />
This is also our unit of analysis.<br />
<strong>The</strong> measures of <strong>supply</strong> <strong>and</strong> dem<strong>and</strong> uncertainty (SDU) are<br />
rooted in the conceptualization of the product structures in the<br />
product–process matrix (Hayes <strong>and</strong> Wheelwright, 1979), the measures<br />
used for its empirical tests (Safizadeh et al., 1996), <strong>and</strong><br />
in particular the conceptualization used by Fisher (1997) <strong>and</strong><br />
subsequent empirical applications of Fisher’s work (Qi et al.,<br />
2009; Selldin <strong>and</strong> Olhager, 2007). We transformed five SDU measures<br />
that capture the uncertainty aspects of the product into a
Table 3<br />
Measures of multi-item constructs.<br />
S.M. Wagner et al. / Journal of Operations Management 30 (2012) 340–353 343<br />
Constructs <strong>and</strong> Items<br />
Mean SD<br />
<strong>Supply</strong> <strong>and</strong> Dem<strong>and</strong> Uncertainty<br />
(SDU)<br />
(based<br />
on Fisher,<br />
1997) 2.45 0.83<br />
Please evaluate<br />
the following characteristics<br />
for the main product line:<br />
SDU1 How long is the average<br />
life-cycle<br />
of the products<br />
in the main product<br />
line?<br />
*<br />
< 6 months 6 – 12 months 1 – 2 years 2 – 5 years<br />
> 5 years<br />
1.95 1.27<br />
SDU2 How many<br />
different<br />
variants<br />
are available for the main product<br />
line?<br />
2.79 1.32<br />
< 20 20 – 49 50 – 99<br />
100 – 999 1000 or more<br />
SDU3 What is the average<br />
margin of error in the forecast<br />
based on units<br />
at the time production<br />
is committed?<br />
2.59 1.01<br />
0% – 9% 10% – 19% 20% – 39% 40% – 59% 60% – 100%<br />
SDU4 What is the number<br />
of sales locations<br />
for the main product line? 2.39 1.43<br />
< 100<br />
100 – 499 500 – 999 1000 – 1499 1500 or more<br />
SDU5 What is the frequency of change in order content<br />
for the main product<br />
line? 2.56 0.94<br />
extremely low<br />
low medium<br />
high<br />
extremely high<br />
<strong>Supply</strong> <strong>Chain</strong><br />
Responsiveness<br />
(SCR)<br />
(based<br />
on Fisher,<br />
1997)<br />
Please indicate<br />
the strategic<br />
<strong>supply</strong><br />
<strong>chain</strong><br />
priorities for the main product line<br />
(1: not important<br />
at all – 5: extremely<br />
important):<br />
3.40 0.61<br />
SCR1 Improve<br />
delivery<br />
reliability<br />
3.91 0.84<br />
SCR2 Maintain<br />
buffer inventory<br />
of parts or finished goods 3.34 0.87<br />
SCR3 Retain buffer<br />
capacity<br />
in manufacturing 3.17 0.92<br />
SCR4 Respond quickly to unpredictable dem<strong>and</strong> 3.56 0.88<br />
SCR5 Increase frequency<br />
of new product<br />
introductions<br />
3.05 0.86<br />
Competitive Intensity<br />
(CI)<br />
(based<br />
on Jaworski<br />
<strong>and</strong> Kohli, 1993)<br />
Please indicate<br />
the competitive<br />
intensity<br />
of your main product<br />
line<br />
(1: strongly disagree – 5: strongly<br />
agree):<br />
3.48 0.75<br />
CI1 Cutthroat<br />
competition<br />
3.73 1.00<br />
CI2 Anything that one competitor<br />
can offer,<br />
others<br />
can match<br />
readily<br />
3.03 1.11<br />
CI3 Price competition<br />
is a hallmark<br />
of your industry 3.28 1.12<br />
CI4 Relatively<br />
weak competitors<br />
*<br />
3.90 0.96<br />
Note. Construct<br />
mean is calculated<br />
*<br />
Item scale<br />
was reverse-scored.<br />
as (arithmetic)<br />
mean.<br />
SD refers<br />
to st<strong>and</strong>ard<br />
deviation.<br />
five-point Likert scale where the specific numerical targets appear<br />
at the respective endpoints of the five-point scale. <strong>The</strong> product<br />
life-cycle (SDU1) is the length of time <strong>between</strong> the introduction<br />
of the product to the market <strong>and</strong> its removal from the market.<br />
For firms it is often necessary to stretch the product line into a<br />
“product family” of a significant number of variants (SDU2) with<br />
respect to changing customer requirements <strong>and</strong> market segmentation.<br />
<strong>The</strong> average forecast error (SDU3) of the main product line<br />
is defined as the deviation <strong>between</strong> the forecasted quantity (units)<br />
<strong>and</strong> the actual quantity needed at the time production is committed:<br />
forecast error = absolute value of (actual quantity − forecasted<br />
quantity). Next, sales locations (SDU4) are trading platforms in<br />
which goods <strong>and</strong>/or services reach customers <strong>and</strong> potential customers.<br />
It is assumed that the higher the number of sales locations,<br />
the better the firm’s ability to provide widespread <strong>and</strong>/or intensive<br />
sales (<strong>and</strong> distribution) coverage. Changes in order content (SDU5)<br />
take place if the order is changed in terms of content, size, delivery<br />
time, or other patterns.<br />
<strong>The</strong> <strong>supply</strong> <strong>chain</strong> responsiveness (SCR) measures, which are theoretically<br />
grounded in the empirical work on competitive priorities<br />
in operations management (Boyer <strong>and</strong> Lewis, 2002; Ward et al.,<br />
1998) <strong>and</strong> were applied in a <strong>supply</strong> <strong>chain</strong> context (Fisher, 1997; Lo<br />
<strong>and</strong> Power, 2010; Selldin <strong>and</strong> Olhager, 2007), capture the strategic<br />
priorities of the firm’s <strong>supply</strong> <strong>chain</strong> strategy. Respondents were<br />
asked to assess five SCR measures with regard to the needs of the<br />
main product (line) on a five-point scale: delivery reliability (SCR1),<br />
buffer inventory of parts or finished goods (SCR2), buffer capacity<br />
in manufacturing (SCR3), quick response to unpredictable dem<strong>and</strong><br />
(SCR4), <strong>and</strong> frequency of new product introductions (SCR5).<br />
Since our <strong>fit</strong> concept is “a theoretically defined match <strong>between</strong><br />
two related variables” (Venkatraman, 1989, p. 430), namely SDU<br />
<strong>and</strong> SCR, we operationalize <strong>fit</strong> within a matching perspective. This<br />
method has previously been employed in empirical studies of <strong>fit</strong> in<br />
the management (e.g., He <strong>and</strong> Wong, 2004) <strong>and</strong> operations management<br />
(e.g., Stock <strong>and</strong> Tatikonda, 2008) literature. Following the<br />
perspective of “<strong>fit</strong> as matching” (Venkatraman, 1989), we calculate<br />
<strong>supply</strong> <strong>chain</strong> <strong>fit</strong> (SCF) for firm i as SCF i = |SDU i − SCR i|. <strong>The</strong> deviation<br />
score captures the degree of mis<strong>fit</strong> on a continuum <strong>between</strong><br />
a total mis<strong>fit</strong> <strong>and</strong> a perfect <strong>fit</strong>, where lower values indicate greater<br />
<strong>fit</strong>. When SCF i = 0, perfect <strong>supply</strong> <strong>chain</strong> <strong>fit</strong> is achieved.<br />
3.2.2. Financial performance of the firm<br />
<strong>The</strong> <strong>financial</strong> ratio Return on Assets (ROA) was used to tap<br />
the <strong>financial</strong> performance of the firm. ROA as the net income<br />
divided by total assets shows how effectively a firm utilizes its<br />
assets in generating pro<strong>fit</strong>s. This secondary data was obtained from<br />
Bloomberg.<br />
3.2.3. Control variables<br />
To eliminate undesirable sources of variance, we included control<br />
variables which may influence <strong>and</strong> confound the relationships<br />
of the key variable in our model. First, we eliminated country effects<br />
(e.g., Bozarth et al., 2009; Huang et al., 2008). Economic, political,<br />
<strong>and</strong> cultural differences influence the strategic <strong>and</strong> operational<br />
possibilities of firms <strong>and</strong> therefore might influence pro<strong>fit</strong>ability.<br />
Following the procedure suggested by Cohen et al. (2003, pp.<br />
303–307), responses from the UK were coded as the variable<br />
“Country UK,” responses from France were coded as the variable
344 S.M. Wagner et al. / Journal of Operations Management 30 (2012) 340–353<br />
Table 4<br />
Sample demographics.<br />
Industry sector N % N %<br />
Aerospace & defense 24 9.27 Number of employees<br />
Automotive & parts 29 11.20 < 100 3 1.16<br />
Chemicals 16 6.18 100–499 20 7.72<br />
Construction & materials 14 5.41 500–999 17 6.56<br />
Electricity 4 1.54 1000–4999 52 20.08<br />
Electronic & electrical equipment 28 10.81 5000–9999 40 15.44<br />
Food & beverages 19 7.34 > 10,000 127 49.04<br />
Forestry & paper 5 1.93 Respondent job title<br />
Household goods & personal goods 25 9.65 CxO/vice president 37 14.29<br />
Industrial metals 10 3.86 Director/department head 122 47.10<br />
Machinery & plant construction 24 9.27 Manager 64 24.71<br />
Medical equipment 10 3.86 Team leader 18 6.95<br />
Mining 4 1.54 Others 18 6.95<br />
Oil & gas 6 2.32 Respondent function<br />
Pharmaceuticals & biotechnology 12 4.63 <strong>Supply</strong> <strong>chain</strong> management 106 40.93<br />
Technology hardware & equipment 17 6.56 General management 27 10.42<br />
Textiles & apparel 12 4.63 Logistics 48 18.53<br />
Total 259 Purchasing 24 9.27<br />
Production/manufacturing 20 7.72<br />
Others 34 13.13<br />
“Country France,” <strong>and</strong> responses from German-speaking countries<br />
were coded as the variable “Country Germany.” Finally, responses<br />
from the U.S. were used as the baseline.<br />
Second, firm age is an important structural variable. In general,<br />
firm age might be related to firm performance, <strong>and</strong> in particular,<br />
firm age might influence the status of implementation of <strong>supply</strong><br />
<strong>chain</strong> management practices (e.g., Amburgey et al., 1993; White<br />
et al., 1999). As such, we followed the recommendation to control<br />
for firm age (e.g., Park <strong>and</strong> Ro, 2011; Terjesen et al., 2011) <strong>and</strong><br />
calculated firm age as the number of years since firm foundation<br />
(logarithmized).<br />
Third <strong>and</strong> similar, firm size might be related to firm performance.<br />
Larger firms might have more market penetration power<br />
than smaller firms <strong>and</strong> thus might be more pro<strong>fit</strong>able. Smaller<br />
firms, in contrast, might be more innovative, <strong>and</strong> therefore more<br />
pro<strong>fit</strong>able. Smaller firms might have fewer <strong>financial</strong> <strong>and</strong> managerial<br />
resources than larger firms for the implementation of <strong>supply</strong><br />
<strong>chain</strong> management practices (e.g., Cao <strong>and</strong> Zhang, 2011; Prater<br />
<strong>and</strong> Ghosh, 2006). In sum, in order to eliminate these potential<br />
confounds, we followed the recommendation to control for<br />
firm size (e.g., Ettlie, 1998; Park <strong>and</strong> Ro, 2011; Terjesen et al.,<br />
2011). Firm size is measured as the number of employees (logarithmized).<br />
Fourth, competitive intensity, the extent to which a firm perceives<br />
its competition to be intense <strong>and</strong> the extent to which it<br />
competes to retain its market share, is another important structural<br />
variable with potential impact on <strong>financial</strong> performance (e.g.,<br />
Barnett, 1997; Jermias, 2008). It was captured by four items asking<br />
respondents for the amount of rivalry among firms in the industry.<br />
We employed the scale used by Jaworski <strong>and</strong> Kohli (1993).<br />
Fifth, since there are likely industry effects with respect to <strong>supply</strong><br />
<strong>chain</strong> priorities <strong>and</strong> practices (e.g., Bozarth et al., 2009; Miller<br />
<strong>and</strong> Roth, 1994) which are beyond the scope of our current study,<br />
we control for industry as recommended in previous studies (e.g.,<br />
Huang et al., 2008; Rungtusanatham et al., 2005). We again followed<br />
the procedure suggested by Cohen et al. (2003, pp. 303–307),<br />
dummy-coded all industries <strong>and</strong> used the industry “aerospace &<br />
defense” as the baseline.<br />
Sixth, since <strong>financial</strong> performance can be greatly influenced by<br />
previous <strong>financial</strong> performance, it is vital to control for this so called<br />
“halo effect” (Brown <strong>and</strong> Perry, 1994; Rosenzweig, 2007). To do<br />
so, we included the prior three years’ <strong>financial</strong> performance (i.e.,<br />
ROA t−1, ROA t−2 <strong>and</strong> ROA t−3) as controls in our regression model<br />
(e.g., Shah <strong>and</strong> Shin, 2007).<br />
3.3. Sample<br />
Table 4 provides a detailed breakdown of the sample <strong>and</strong><br />
respondents. Approximately 61.39% of respondents are C-level<br />
executives, vice presidents, directors, or department heads, mainly<br />
in <strong>supply</strong> <strong>chain</strong> management (40.93%), logistics (18.53%), production<br />
<strong>and</strong> procurement (16.99%), general management (10.42%),<br />
<strong>and</strong> closely related logistics fields (13.13%). <strong>The</strong>se respondents<br />
are likely to possess an overarching, boundary-spanning view of<br />
their firms’ upstream <strong>and</strong> downstream activities pertaining to their<br />
firms’ main product lines. <strong>The</strong> average respondent has worked<br />
in procurement, logistics, <strong>supply</strong> <strong>chain</strong>, production, or another<br />
related field for 13.2 years, has been in his/her position for 3.9<br />
years, <strong>and</strong> has been with the firm for 9.9 years, yielding a very<br />
good knowledge of the underlying main product line, the <strong>supply</strong><br />
<strong>chain</strong> structure, <strong>and</strong> supplier <strong>and</strong> customer base of his/her<br />
firm.<br />
<strong>The</strong> firms’ annual sales range from USD 18.1 million to USD 219.9<br />
billion (mean = USD 19.75 billion), <strong>and</strong> the number of employees<br />
ranges from less than 100 to 398,200 (mean = 52,031). In terms of<br />
annual sales <strong>and</strong> retained employees, the sample is thus heterogeneous.<br />
<strong>The</strong> range <strong>and</strong> size of the included firms <strong>and</strong> the diversity<br />
of industries represented suggest that any systematic bias can be<br />
excluded.<br />
3.4. Non-response bias<br />
To verify that our results are not subject to non-response bias,<br />
we applied two techniques (Wagner <strong>and</strong> Kemmerling, 2010). First,<br />
we organized the data set into two groups of equal size, one<br />
group with the earlier respondents <strong>and</strong> one group with the later<br />
respondents. To assess whether there are statistically significant<br />
differences <strong>between</strong> these two groups, we performed t-tests on<br />
the respective responses of the two groups. <strong>The</strong> t-tests (p < .05)<br />
yielded no statistically significant mean differences among all items<br />
used in the estimated models. In addition, we tested for differences<br />
<strong>between</strong> firm size <strong>and</strong> industry clusters. Again, no significant statistical<br />
differences were found. Second, we contacted a sample of<br />
non-respondents by phone <strong>and</strong> asked them to complete the survey.<br />
Responses from 52 non-respondents were compared to the<br />
data of respondents; t-test results did not show statistical differences.<br />
Based on these analyses, we concluded that non-response<br />
bias does not pose a problem in our study.
Table 5<br />
Evaluation of reflective constructs.<br />
Constructs <strong>and</strong> Items Cronbach<br />
alpha<br />
S.M. Wagner et al. / Journal of Operations Management 30 (2012) 340–353 345<br />
Total variance<br />
explained<br />
Commonalities Item-to-total<br />
correlation<br />
Composite<br />
reliability<br />
AVE Factor<br />
loading<br />
t-Value SE IR<br />
<strong>Supply</strong> <strong>and</strong> dem<strong>and</strong><br />
uncertainty (SDU)<br />
.718 .482 .860 .566<br />
SDU1 .385 .424 .621 – a – b .457<br />
SDU2 .364 .398 .603 5.373 .178 .395<br />
SDU3 .511 .524 .715 6.357 .147 .667<br />
SDU4 .630 .573 .794 6.186 .278 .628<br />
SDU5 .523 .518 .723 5.805 .171 .748<br />
<strong>Supply</strong> <strong>chain</strong><br />
responsiveness (SCR)<br />
.744 .499 .874 .597<br />
SCR1 .253 .329 .503 – a – b .269<br />
SCR2 .521 .516 .722 4.862 .382 .624<br />
SCR3 .654 .622 .809 5.035 .475 .726<br />
SCR4 .580 .575 .762 5.075 .377 .647<br />
SCR5 .487 .500 .698 4.841 .344 .553<br />
Competitive intensity<br />
(CI)<br />
.686 .518 .810 .536<br />
CI1 .553 .497 .847 – a – b .520<br />
CI2 .613 .533 .931 7.024 .200 .598<br />
CI3 .616 .541 .404 6.887 .219 .576<br />
CI4 .289 .312 .904 4.709 .134 .298<br />
Note. SE refers to st<strong>and</strong>ard error from the unst<strong>and</strong>ardized solution, AVE refers to average variance extracted, <strong>and</strong> IR refers to indicator reliability (Fornell <strong>and</strong> Larcker, 1981).<br />
a t-Values are from the unst<strong>and</strong>ardized solution; all are significant at the .001 level (two-tailed).<br />
b Factor loading was fixed at 1.0 for identification purposes.<br />
4. Reliability <strong>and</strong> validity<br />
Before testing our core hypothesis, we first assessed the reliability<br />
<strong>and</strong> validity of the reflective constructs <strong>and</strong> the underlying<br />
items. <strong>The</strong> independent variable <strong>supply</strong> <strong>chain</strong> <strong>fit</strong> builds on two<br />
reflective constructs (<strong>supply</strong> <strong>and</strong> dem<strong>and</strong> uncertainty <strong>and</strong> <strong>supply</strong><br />
<strong>chain</strong> responsiveness). We assessed the reliability <strong>and</strong> validity of<br />
these reflective constructs using confirmatory factor analysis (CFA)<br />
(Bagozzi et al., 1991). Hereby <strong>supply</strong> <strong>and</strong> dem<strong>and</strong> uncertainty, <strong>supply</strong><br />
<strong>chain</strong> responsiveness, <strong>and</strong> the control variable competitive intensity<br />
were included into a CFA model estimated with Amos 16.0 using<br />
the maximum likelihood estimation method.<br />
<strong>The</strong> CFA results depicted in Table 5 indicate acceptable psychometric<br />
properties for all constructs. Composite reliabilities <strong>and</strong><br />
average variances extracted for all constructs reach the common<br />
cut-off values of .70 (Nunnally <strong>and</strong> Bernstein, 1994) <strong>and</strong><br />
.50 (Bagozzi <strong>and</strong> Yi, 1988; Fornell <strong>and</strong> Larcker, 1981), indicating<br />
construct validity. Without exception, each item loaded on its<br />
hypothesized construct with large loadings, significant at the 99%<br />
confidence interval, which represents a high level of item validity.<br />
This high level of item reliability implies that the items are strongly<br />
influenced by the construct they measure <strong>and</strong> indicates that sets of<br />
items used to capture the construct are unidimensional. <strong>The</strong> CFA<br />
indicated an acceptable <strong>fit</strong> ( 2 /df = 1.998; GFI = .922; RMSEA = .062;<br />
SRMR = .053) (Hair et al., 2010; Steiger, 2007).<br />
<strong>The</strong> estimates of the CFA model also allow us to assess convergent<br />
<strong>and</strong> discriminant validity. Inter-construct correlations <strong>and</strong><br />
squared correlations are provided in Table 6. All the results are<br />
within acceptable ranges, indicating convergent <strong>and</strong> discriminant<br />
validity of our reflective constructs as measured by their items<br />
(Fornell <strong>and</strong> Larcker, 1981).<br />
As the dependent variable is based on objective secondary data,<br />
the concern regarding common method bias can be discarded<br />
(Craighead et al., 2011).<br />
5. Analysis <strong>and</strong> results<br />
We scrutinized the hypothesis with a series of regression models.<br />
All models were estimated using ordinary least squares (OLS)<br />
estimation in the R system for statistical computing version 2.13.0<br />
(R Development Core Team, 2010). <strong>The</strong> critical assumptions underlying<br />
OLS regression analysis were checked; i.e., (1) the residuals<br />
are normally distributed; (2) the residuals are of constant variance<br />
(homoskedasticity) over sets of values of the independent<br />
construct; <strong>and</strong> (3) multicollinearity of the independent construct<br />
is within an acceptable range (Cohen et al., 2003). To this end, the<br />
regression model was subjected to a visual residual analysis using<br />
normal Q–Q plots. No obvious outliers were detected <strong>and</strong> residuals<br />
appeared to be approximately normally distributed. Homoskedasticity<br />
was checked using the Breusch–Pagan test (p > .05), which<br />
did not indicate a serious problem with heteroskedasticity. <strong>The</strong><br />
bivariate correlations <strong>between</strong> the independent variables as well<br />
as variance inflation factors (VIF) were within acceptable ranges,<br />
indicating that multicollinearity did not pose a serious problem to<br />
the regression analysis. In summary, the conducted tests provided<br />
no grounds to assume the inappropriateness of the chosen method.<br />
Nevertheless, to correct for possible heteroskedasticity <strong>and</strong> obtain<br />
correct st<strong>and</strong>ard error estimates, we used the Huber–White correction<br />
(Huber, 1967; White, 1980) implemented in the package<br />
s<strong>and</strong>wich in R (Zeileis, 2004).<br />
<strong>The</strong> performance variable ROA was first regressed on the control<br />
variables (Model 1) <strong>and</strong> then the independent variable SCF was<br />
entered (Model 2). Table 7 reports the regression results including<br />
the increments to adjusted R 2 <strong>and</strong> the significance of the regression<br />
equations. <strong>The</strong> baseline regression models with all 259 firms<br />
included show that mis<strong>fit</strong> has a negative impact on performance<br />
(ˇ = −1.268, p < .001), providing support for our hypothesis that<br />
<strong>supply</strong> <strong>chain</strong> <strong>fit</strong> is positively associated with performance. <strong>The</strong> average<br />
ROA for the 259 firms was 6.49%.<br />
6. Post hoc analysis<br />
6.1. Negative <strong>and</strong> positive mis<strong>fit</strong><br />
To derive additional insights, we conducted post hoc analyses in<br />
order to be able to differentiate <strong>between</strong> groups of firms with <strong>supply</strong><br />
<strong>chain</strong> <strong>fit</strong>, with negative mis<strong>fit</strong> <strong>and</strong> with positive mis<strong>fit</strong>. 2 First,<br />
we plotted the <strong>supply</strong> <strong>and</strong> dem<strong>and</strong> uncertainty (SDU) scores <strong>and</strong><br />
<strong>supply</strong> <strong>chain</strong> responsiveness (SCR) scores of all firms in order to<br />
2 We thank the anonymous associate editor <strong>and</strong> a reviewer for the comment that<br />
positive <strong>and</strong> negative mis<strong>fit</strong> might have different performance implications which<br />
instigated the development of this section.
Table 6<br />
Descriptive statistics <strong>and</strong> variable correlations.<br />
Variable Mean SD (1) (2) (3) (4) (5) (6) (7) (8) (9) (10) (11) (12) (13) (14) (15) (16) (17) (18) (19) (20) (21) (22) (23) (24) (25) (26) (27)<br />
(1) Country France .19 .39 .02 .18 .00 .01 .00 .00 .03 .00 .01 .01 .00 .00 .01 .00 .01 .00 .00 .00 .02 .02 .00 .00 .00 .01 .00 .00<br />
(2) Country UK .06 .24 −.12 * .05 .00 .02 .01 .00 .00 .01 .00 .00 .01 .00 .01 .00 .01 .00 .00 .00 .00 .00 .00 .01 .00 .00 .00 .00<br />
(3) Country Germany .43 .50 −.42 ** −.22 ** .04 .00 .01 .02 .02 .00 .00 .00 .02 .00 .00 .00 .04 .00 .01 .00 .01 .00 .00 .01 .00 .00 .00 .00<br />
(4) Firm age 84.01 54.16 −.04 .02 .20 ** .02 .01 .01 .00 .00 .02 .02 .02 .00 .00 .00 .03 .00 .00 .00 .00 .03 .02 .02 .00 .01 .01 .00<br />
(5) Firm size 52,031 88,308 .10 −.14 * .01 .15 * .04 .07 .01 .01 .00 .00 .02 .00 .00 .00 .01 .01 .00 .00 .00 .01 .01 .00 .00 .02 .01 .00<br />
(6) Competitive<br />
intensity<br />
3.49 .76 .03 −.10 −.07 .09 .21 ** .00 .02 .00 .00 .00 .02 .00 .01 .00 .03 .00 .00 .00 .04 .01 .01 .01 .03 .01 .01 .01<br />
(7) Automotive &<br />
parts<br />
.11 .32 .02 .06 .14 * .07 .26 ** .05 .01 .01 .00 .02 .01 .00 .01 .01 .01 .01 .00 .00 .01 .01 .01 .00 .01 .02 .01 .01<br />
(8) Chemicals .06 .24 .16 ** −.07 −.13 * .04 −.08 .13 * −.09 .00 .00 .01 .01 .00 .01 .00 .01 .00 .00 .00 .00 .00 .00 .01 .00 .00 .00 .00<br />
(9) Construction &<br />
materials<br />
.05 .23 −.03 .08 .03 .03 −.08 .02 −.08 −.06 .00 .01 .00 .00 .01 .00 .01 .00 .00 .00 .00 .00 .00 .00 .00 .00 .01 .00<br />
(10) Electricity .02 .12 .10 −.03 .02 −.12 * −.02 −.02 −.04 −.03 −.03 .00 .00 .00 .00 .00 .00 .00 .00 .00 .00 .00 .00 .01 .01 .00 .00 .00<br />
(11) Electronic &<br />
electrical<br />
equipment<br />
.11 .31 −.10 .01 .05 −.16 * −.06 −.03 −.12 * −.09 −.08 −.04 .01 .00 .01 .00 .01 .00 .00 .00 .01 .01 .01 .00 .02 .00 .00 .01<br />
(12) Food &<br />
beverages<br />
.07 .26 .05 −.07 −.12 * .15 * .16 * .15 * −.10 −.07 −.07 −.04 −.10 .00 .01 .00 .01 .00 .00 .00 .00 .01 .00 .01 .01 .00 .00 .00<br />
(13) Forestry & paper .02 .14 .00 −.04 −.06 −.02 −.07 −.03 −.05 −.04 −.03 −.02 −.05 −.04 .00 .00 .00 .00 .00 .00 .00 .00 .00 .01 .02 .00 .01 .00<br />
(14) Household<br />
goods & personal<br />
goods<br />
.10 .30 −.09 .08 .03 .05 −.02 .08 −.12 −.08 −.08 −.04 −.11 −.09 −.05 .00 .01 .00 .00 .00 .01 .01 .01 .01 .00 .00 .01 .01<br />
(15) Industrial metals .04 .19 −.05 .03 −.05 .01 −.02 −.05 −.07 −.05 −.05 −.03 −.07 −.06 −.03 −.07 .00 .00 .00 .00 .00 .00 .00 .01 .01 .00 .00 .00<br />
(16) Machinery &<br />
plant construction<br />
.09 .29 −.09 .08 .21 ** .17 ** −.10 −.18 ** −.11 −.08 −.08 −.04 −.11 −.09 −.04 −.10 −.06 .00 .00 .00 .00 .01 .00 .00 .00 .00 .02 .01<br />
(17) Medical<br />
equipment<br />
.04 .19 .06 −.05 .03 .06 −.09 .05 −.07 −.05 −.05 −.03 −.07 −.06 −.03 −.07 −.04 −.06 .00 .00 .00 .00 .00 .00 .01 .00 .00 .00<br />
(18) Mining .02 .12 −.06 −.03 .08 .06 −.05 .06 −.04 −.03 −.03 −.02 −.04 −.04 −.02 −.04 −.03 −.04 −.03 .00 .00 .00 .00 .00 .01 .01 .01 .00<br />
(19) Oil & gas .02 .15 −.01 −.04 −.03 .01 −.03 .01 −.05 −.04 −.04 −.02 −.05 −.04 −.02 −.05 −.03 −.05 −.03 −.02 .00 .00 .00 .03 .05 .04 .01 .04<br />
(20) Pharmaceuticals<br />
& biotechnology<br />
.05 .21 .13 * .02 −.08 .02 −.03 −.21 ** −.08 −.06 −.05 −.03 −.08 −.06 −.03 −.07 −.04 −.07 −.04 −.03 −.03 .00 .00 .00 .01 .01 .01 .01<br />
(21) Technology<br />
hardware &<br />
equipment<br />
.07 .25 −.13 * −.07 −.04 −.17 ** .09 −.11 −.09 −.07 −.06 −.03 −.09 −.07 −.04 −.09 −.05 −.08 −.05 −.03 −.04 −.06 .00 .00 .01 .00 .00 .00<br />
(22) Textiles &<br />
apparel<br />
.05 .21 −.06 −.06 .03 −.14 * −.09 .11 −.08 −.06 −.05 −.03 −.08 −.06 −.03 −.07 −.04 −.07 −.04 −.03 −.03 −.05 −.06 .00 .00 .00 .05 .00<br />
(23) ROA 2004 5.41 7.54 −.01 −.08 −.10 −.14 * −.01 −.10 −.05 −.08 .00 −.11 .03 .10 −.10 −.10 .11 −.04 .03 .03 .18 ** .05 .05 .05 .57 .38 .00 .38<br />
(24) ROA 2005 5.36 8.09 −.04 −.04 −.02 −.06 −.05 −.16 ** −.07 −.06 .01 −.07 −.16 * .09 −.13 * −.06 .08 −.03 .07 .09 .22 ** .10 .11 .04 .75 ** .53 .00 .52<br />
(25) ROA 2006 6.68 7.56 −.12 .02 .00 −.07 −.13 * −.09 −.14 * −.07 −.01 .02 −.01 .01 −.03 −.07 .06 .07 .07 .11 .19 ** .12 −.01 .06 .61 ** .73 ** .01 .66<br />
(26) <strong>Supply</strong> <strong>chain</strong> <strong>fit</strong> 1.06 .62 .04 .00 .07 .09 −.08 −.12 .08 .02 .10 −.02 −.04 .03 −.09 −.10 −.05 .15 * .02 −.09 .07 −.08 −.04 −.21 ** −.07 −.05 −.09 .02<br />
(27) ROA 2007 6.49 7.64 −.04 −.06 −.06 −.02 −.06 −.10 −.09 −.03 −.01 −.04 −.10 .07 −.07 −.08 .05 .09 .07 −.02 .20 ** .10 −.01 .03 .62 ** .72 ** .81 ** −.13 *<br />
Note. Pearson correlation coefficients are below the diagonal <strong>and</strong> squared correlations (shared variance) are above the diagonal.<br />
** Significant at the .01 level (two-tailed).<br />
* Significant at the .05 level (two-tailed).<br />
346 S.M. Wagner et al. / Journal of Operations Management 30 (2012) 340–353
Table 7<br />
Average ROA <strong>and</strong> OLS regression results for different degrees of “<strong>fit</strong>”.<br />
All firms Firms with <strong>fit</strong> Firms with negative mis<strong>fit</strong> Firms with positive mis<strong>fit</strong><br />
Number of firms 259 9 180 70<br />
Average ROA 6.49 10.57 5.80 7.73<br />
Independent variables Model 1 Model 2 a Model 1 Model 2 Model 1 Model 2<br />
Intercept<br />
Control variables<br />
−.369 (2.475) 2.299 (2.407) −.278 (2.779) 3.136 (2.736) −.103 (5.214) −.485 (4.808)<br />
Country France −.373 (.581) −.283 (.584) −.960 (.748) −.834 (.762) 2.047 (1.200) 2.078 † (1.157)<br />
Country UK −2.963 * (1.288) −3.198 * (1.274) −3.859 * (1.676) −4.404 ** (1.667) .300 (1.733) .277 (1.691)<br />
Country Germany −1.451 † (.802) −1.380 † (.790) −1.763 † (1.027) −1.870 † (1.030) .118 (1.240) .058 (1.216)<br />
Firm age 1.740 † (.979) 1.702 † (.972) 2.092 * (1.060) 2.157 * (1.082) −1.902 (2.423) −2.117 (2.585)<br />
Firm size −.001 (.267) −.160 (.260) .218 (.289) .014 (.276) .232 (.680) .322 (.672)<br />
Competitive intensity −.136 (.346) −.228 (.339) −.542 (.390) −.696 † (.383) 1.076 (.647) .963 (.661)<br />
Automotive & parts −.072 (.892) −.116 (.878) −.077 (1.045) .238 (1.051) .337 (1.662) .502 (1.664)<br />
Chemicals .016 (.829) −.192 (.855) .128 (.812) −.083 (.880) .599 (1.841) .772 (1.688)<br />
Construction & materials −.350 (.803) −.295 (.788) .257 (1.024) .468 (1.010) −1.542 (1.143) −1.426 (1.332)<br />
Electricity −1.492 (2.638) −1.979 (2.457) −1.450 (2.731) −2.065 (2.520)<br />
Electronic & electrical equipment −1.654 (1.463) −2.051 (1.472) −1.632 (1.993) −1.824 (1.976) −2.284 (1.789) −2.275 (1.737)<br />
Food & beverages −.571 (.686) −.609 (.668) −.049 (.772) −.074 (.770) −.519 (1.267) −.509 (1.367)<br />
Forestry & paper −1.756 (1.519) −2.607 † (1.577) −3.501 (2.327) −4.103 (2.522) 1.202 (1.174) 1.677 (1.346)<br />
Household goods & personal goods −.868 (.820) −1.383 † (.788) .205 (1.119) −.092 (1.036) −1.172 (1.291) −.994 (1.339)<br />
Industrial metals −1.413 (.958) −1.814 † (1.084) −.529 (.948) −.975 (.979) −.089 (1.544) −.172 (1.388)<br />
Machinery & plant construction 1.059 (1.224) 1.108 (1.203) .880 (1.405) 1.127 (1.375) 3.901 † (2.039) 4.270 † (2.200)<br />
Medical equipment −.512 (.807) −.697 (.752) −.401 (.701) −.298 (.699) .661 (2.283) 1.104 (2.398)<br />
Mining −7.373 ** (2.405) −8.135 *** (2.252) −8.142 * (3.164) −8.982 ** (2.988) −6.518 *** (.980) −5.879 *** (1.136)<br />
Oil & gas −.196 (1.186) .048 (1.103) −.179 (1.285) −.014 (1.129) 3.997 * (1.701) 4.020 * (1.770)<br />
Pharmaceuticals & biotechnology −.994 (1.067) −1.549 (1.020) −2.106 † (1.260) −2.703 * (1.291) 1.346 (2.106) 1.047 (2.025)<br />
Technology hardware & equipment −1.480 (1.204) −1.854 (1.201) −2.115 (2.173) −2.065 (2.201) −.147 (1.123) −.036 (1.168)<br />
Textiles & apparel −1.052 (1.115) −2.097 † (1.093) .189 (.876) −1.354 (.833) −3.292 † (1.930) −3.016 † (1.821)<br />
ROA 2004 .069 (.078) .063 (.074) .078 (.112) .076 (.103) .124 (.095) .143 (.106)<br />
ROA 2005 .208 † (.122) .208 † (.116) .129 (.146) .128 (.134) .281 * (.132) .280 * (.127)<br />
ROA 2006 .636 *** (.123) .631 *** (.120) .680 *** (.151) .683 *** (.146) .513 *** (.079) .493 *** Predictor variable<br />
(.080)<br />
<strong>Supply</strong> <strong>chain</strong> <strong>fit</strong> −1.268 *** (.359) −1.640 *** (.451) 1.044 (1.175)<br />
R2 .735 .743 .714 .728 .834 .837<br />
Adjusted R2 .706 .715 .668 .681 .746 .744<br />
R2 change .009 ** .013 ** .003<br />
F 25.803 *** 25.852 *** 15.409 *** 15.723 *** 9.430 *** 9.018 ***<br />
Note. Robust (Huber–White) st<strong>and</strong>ard errors are in parentheses.<br />
a Regression analysis not conducted due to small number of observations.<br />
*** Significant at the .001 level (one-tailed).<br />
** Significant at the .01 level (one-tailed).<br />
* Significant at the .05 level (one-tailed).<br />
† Significant at the .1 level (one-tailed).<br />
S.M. Wagner et al. / Journal of Operations Management 30 (2012) 340–353 347
348 S.M. Wagner et al. / Journal of Operations Management 30 (2012) 340–353<br />
Fig. 2. Scatter plot of <strong>supply</strong> <strong>and</strong> dem<strong>and</strong> uncertainty (SDU) vs. <strong>supply</strong> <strong>chain</strong> responsiveness<br />
(SCR) scores for all firms.<br />
visualize the distribution of the firms along the two dimensions that<br />
determine <strong>supply</strong> <strong>chain</strong> <strong>fit</strong> (Fig. 2). Second, we calculated the average<br />
ROA <strong>and</strong> calculated separate regression models when possible<br />
(given the size of the groups).<br />
Consistent with our previous discussion, we define firms with<br />
<strong>supply</strong> <strong>chain</strong> <strong>fit</strong> as firms where the products’ <strong>supply</strong> <strong>and</strong> dem<strong>and</strong><br />
uncertainty <strong>and</strong> <strong>supply</strong> <strong>chain</strong> responsiveness perfectly match (position<br />
on the diagonal in Fig. 1). Nine firms in total are firms with<br />
<strong>supply</strong> <strong>chain</strong> <strong>fit</strong>, <strong>and</strong> their average ROA is 10.57%.<br />
Firms with negative mis<strong>fit</strong> are defined as firms that designed<br />
their <strong>supply</strong> <strong>chain</strong>s to support responsiveness while the products’<br />
<strong>supply</strong> <strong>and</strong> dem<strong>and</strong> is quite certain <strong>and</strong> the products are predictable<br />
(position above the diagonal in Fig. 1). From the 259 firms in our<br />
sample, 180 firms do achieve a negative mis<strong>fit</strong> <strong>and</strong> their average<br />
ROA is 5.80%. <strong>The</strong> regression results depicted in Table 7 for the<br />
180 firms with negative mis<strong>fit</strong> show that this type of mis<strong>fit</strong> has<br />
a stronger negative impact on performance (ˇ = −1.640, p < .001)<br />
compared to mis<strong>fit</strong> in general (as shown in the baseline regression<br />
model with all 259 firms where ˇ = −1.268, p < .001).<br />
In contrast, firms with positive mis<strong>fit</strong> are defined as firms that<br />
designed their <strong>supply</strong> <strong>chain</strong>s to support efficiency while the products’<br />
<strong>supply</strong> <strong>and</strong> dem<strong>and</strong> is rather uncertain <strong>and</strong> the products are<br />
unpredictable (positions below the diagonal in Fig. 1). From the 259<br />
firms in our sample, 70 firms do achieve a positive mis<strong>fit</strong> <strong>and</strong> their<br />
average ROA is 7.73%.<br />
While the baseline regression model with all firms included<br />
shows that mis<strong>fit</strong> has a negative impact on <strong>financial</strong> performance,<br />
firms with zero mis<strong>fit</strong> show the highest performance (10.57%),<br />
firms with a negative mis<strong>fit</strong> are worse in terms of <strong>financial</strong><br />
performance (5.80%) as compared to firms with positive mis<strong>fit</strong><br />
(7.73%).<br />
To assess the robustness of our findings, the firms were grouped<br />
as follows: Firms with a mis<strong>fit</strong> within one st<strong>and</strong>ard deviation (SD)<br />
from the perfect <strong>fit</strong> were compared to firms with negative mis<strong>fit</strong><br />
beyond one SD <strong>and</strong> positive mis<strong>fit</strong> beyond one SD. This definition<br />
follows the idea of the “zone of strategic <strong>fit</strong>” (Chopra <strong>and</strong> Meindl,<br />
2010). <strong>The</strong> results summarized in Appendix A are largely consistent<br />
with the findings above: Mis<strong>fit</strong> significantly reduces performance<br />
(ˇ = −2.001 with p < .05 for the 138 firms with <strong>fit</strong> within one SD),<br />
<strong>and</strong> the average ROA of the 109 firms with negative mis<strong>fit</strong> beyond<br />
one SD (5.58%) is lower than the average ROA of the 12 firms with<br />
positive mis<strong>fit</strong> beyond 1 SD (7.41%).<br />
6.2. Industry differences<br />
Given the discussion in this paper on the product–process<br />
matrix (e.g., Hayes <strong>and</strong> Wheelwright, 1979; Safizadeh et al., 1996)<br />
<strong>and</strong> the <strong>link</strong> <strong>between</strong> certain, predictable, or ‘functional’ products<br />
<strong>and</strong> efficient <strong>supply</strong> <strong>chain</strong>s, <strong>and</strong> uncertain, unpredictable, or ‘innovative’<br />
products <strong>and</strong> responsive <strong>supply</strong> <strong>chain</strong>s (e.g., Chopra <strong>and</strong><br />
Meindl, 2010; Fisher, 1997; Qi et al., 2009), this research started<br />
out with the premise that different types of products need to be<br />
treated differently in terms of processes to produce the products.<br />
To shed further light into the relationship <strong>between</strong> product characteristics<br />
<strong>and</strong> <strong>supply</strong> <strong>chain</strong> priorities, we conducted another post<br />
hoc analysis with the goal to answer the questions: Does the <strong>supply</strong><br />
<strong>chain</strong>–product match/mismatch framework make sense? Do<br />
we find support in the real world beyond the conceptual, anecdotal,<br />
<strong>and</strong> case study-based insights (e.g., Chopra <strong>and</strong> Meindl, 2010;<br />
Fisher, 1997; Wong et al., 2006)?<br />
We selected firms in two industries to exemplify how the primary<br />
product types which they have to h<strong>and</strong>le are related to the<br />
<strong>supply</strong> <strong>chain</strong> priorities <strong>and</strong> analyzed the firms in the food & beverages<br />
industry <strong>and</strong> the textiles & apparel industry. <strong>The</strong> primary<br />
reason for selecting these industries was that we could expect that<br />
the products of food & beverage firms are more on the ‘functional’<br />
side, <strong>and</strong> products of textile & apparel firms are more on the ‘innovative’<br />
side of the <strong>supply</strong> <strong>and</strong> dem<strong>and</strong> uncertainty spectrum (Lee,<br />
2002). In addition, our sample contained at least more than ten<br />
firms in each of these industries. Fig. 3 depicts the plot of the <strong>supply</strong><br />
<strong>and</strong> dem<strong>and</strong> uncertainty (SDU) <strong>and</strong> <strong>supply</strong> <strong>chain</strong> responsiveness<br />
(SCR) scores of the firms in these two industries.<br />
6.2.1. Textiles & apparel industry<br />
<strong>The</strong> problem of uncertainty in matching product <strong>supply</strong> with<br />
customer dem<strong>and</strong> is particularly pervasive in the apparel industry<br />
due to ever more frequently requested product changes <strong>and</strong><br />
introductions, unprecedented levels of product variety, weatherdependency<br />
<strong>and</strong> seasonality, necessary markdowns, <strong>and</strong> write-offs<br />
on excess inventory (Fisher et al., 1994). Compared to other industries,<br />
time delays <strong>between</strong> <strong>supply</strong> <strong>chain</strong> <strong>link</strong>s have been reported to<br />
be very high in the apparel industry (<strong>between</strong> 1 year <strong>and</strong> 66 weeks)<br />
(Blackburn, 1991). <strong>The</strong>se delays are a major reason for the bullwhip<br />
effect <strong>and</strong> also increase unpredictability <strong>and</strong> therefore uncertainty<br />
in dem<strong>and</strong> (Metters, 1997).<br />
To cope with the challenges of unpredictability <strong>and</strong> uncertainty,<br />
firms in the textiles & apparel industry have increasingly<br />
upgraded their <strong>supply</strong> <strong>chain</strong> strategies <strong>and</strong> practices to reduce<br />
the time required to respond to the market (e.g., postponement,<br />
quick response), virtually integrated flexible subcontractors, faster<br />
introduced new products, improved the coordination <strong>between</strong><br />
firms (e.g., information technology <strong>link</strong>s <strong>between</strong> manufacturers<br />
<strong>and</strong> distributors), <strong>and</strong> strived for continuous improvement<br />
of product <strong>and</strong> process quality (Fisher <strong>and</strong> Raman, 1996; Fisher<br />
et al., 1997; MacCarthy <strong>and</strong> Jayarathne, 2010; Tatsiopoulos et al.,<br />
2002).<br />
<strong>The</strong> 12 firms in our sample from this industry demonstrate to<br />
follow this pattern. With an average SDU of 3.90, the firms’ main<br />
product lines are positioned on the higher end of the SDU-spectrum<br />
(i.e., hold the characteristics of ‘innovative’ products). As theory<br />
suggests, higher SDU should go along with higher SCR. This is also<br />
the case with an average SCR of 4.20 for this industry. <strong>The</strong>se firms<br />
from the textiles & apparel industry have done their <strong>supply</strong> <strong>chain</strong><br />
management homework rather well, with a negative mis<strong>fit</strong> of only<br />
−.30 as an industry average.<br />
6.2.2. Food & beverages industry<br />
In contrary to the textiles & apparel industry, the products that<br />
<strong>supply</strong> <strong>chain</strong>s in the food & beverages industry have to h<strong>and</strong>le
Negative mis<strong>fit</strong> of –1.07<br />
(industry average)<br />
S.M. Wagner et al. / Journal of Operations Management 30 (2012) 340–353 349<br />
Food & beverages Textiles & apparel<br />
Negative mis<strong>fit</strong><br />
of –.30<br />
(industry average)<br />
"Functional products"<br />
"Innovative products"<br />
Fig. 3. Scatter plot of <strong>supply</strong> <strong>and</strong> dem<strong>and</strong> uncertainty (SDU) vs. <strong>supply</strong> <strong>chain</strong> responsiveness (SCR) scores for two industries.<br />
are easier to predict. Product life-cycles are longer <strong>and</strong> stock-out<br />
rates <strong>and</strong> product variety are lower. In the food processing industry,<br />
Van Wezel et al. (2006, p. 290) observe, that “[f]or the most<br />
part, customer orders can be predicted with high certainty.”<br />
<strong>The</strong> <strong>supply</strong> <strong>chain</strong> management of firms in the food & beverages<br />
industry has different priorities. <strong>Supply</strong> <strong>chain</strong> responsiveness<br />
has to match the requirements of the more predictable, functional<br />
products. Flexibility, i.e., <strong>supply</strong> <strong>chain</strong> responsiveness, in the<br />
food processing industry is limited due to the production processes,<br />
organizational procedures, <strong>and</strong> rigid planning processes<br />
(Van Wezel et al., 2006), indicating that <strong>supply</strong> <strong>chain</strong> responsiveness<br />
is more on the low end. <strong>The</strong> primary focus of continuous<br />
replenishment (CR) processes <strong>and</strong> interorganizational systems in<br />
grocery/food <strong>supply</strong> <strong>chain</strong>s is to “dramatically reduce inventory<br />
levels <strong>and</strong> costs across the entire value <strong>chain</strong>” (Clark <strong>and</strong> Hammond,<br />
1997, p. 249). For example, for Campbell Soup, a producer of canned<br />
soups <strong>and</strong> related products, the goal of implementing CR programs<br />
<strong>and</strong> vendor managed inventories (VMI) in the <strong>supply</strong> <strong>chain</strong> was<br />
to increase average fill rates, to lower inventories, <strong>and</strong> to reduce<br />
cost of goods sold (Cachon <strong>and</strong> Fisher, 1997). Likewise, in process<br />
industries – including food <strong>and</strong> beverages – a key production<br />
planning task is to match <strong>supply</strong> <strong>and</strong> dem<strong>and</strong> “in the most costeffective<br />
manner.” (Rajaram <strong>and</strong> Karmarkar, 2002, p. 680). In sum,<br />
the primary competitive priority of the <strong>supply</strong> <strong>chain</strong>s in this industry<br />
is on efficiency enhancement leading to lower costs <strong>and</strong> lower<br />
inventories.<br />
<strong>The</strong> 19 firms in our sample also largely follow this pattern. With<br />
an average SDU of 2.34, the firms’ main product lines are positioned<br />
on the lower end of the SDU-spectrum (i.e., hold the characteristics<br />
of ‘functional’ products). With an average SCR of 3.41, their <strong>supply</strong><br />
<strong>chain</strong> priorities focus more on efficiency than the firms in the textiles<br />
& apparel industry. However, with a negative mis<strong>fit</strong> of −1.07<br />
as an industry average, the <strong>supply</strong> <strong>chain</strong>s of the firms from the food<br />
& beverages industry do not match the product characteristics as<br />
well.<br />
Summarizing this post hoc analysis, we can see that these two<br />
industries are very good exemplars of the expected product categorizations<br />
as proposed in the <strong>supply</strong> <strong>chain</strong>–product match/mismatch<br />
framework. However, the firms in our sample from the textiles &<br />
apparel industry have done a better job of adjusting their <strong>supply</strong><br />
<strong>chain</strong>s to their products than the firms from the food & beverages<br />
industry. <strong>The</strong> latter have a greater improvement potential by<br />
making their <strong>supply</strong> <strong>chain</strong>s more efficient.<br />
7. Discussion <strong>and</strong> implications<br />
<strong>The</strong> purpose of this study was to investigate <strong>and</strong> quantify the<br />
impact of <strong>supply</strong> <strong>chain</strong> <strong>fit</strong> on the <strong>financial</strong> performance of the<br />
firm. To achieve <strong>supply</strong> <strong>chain</strong> <strong>fit</strong>, firms must consider three basic<br />
steps (Chopra <strong>and</strong> Meindl, 2010; Lee, 2002): First, they need to<br />
underst<strong>and</strong> dem<strong>and</strong> <strong>and</strong> <strong>supply</strong> uncertainty of their products <strong>and</strong><br />
associated customer needs. Second, they need to underst<strong>and</strong> the<br />
characteristics <strong>and</strong> capabilities of their <strong>supply</strong> <strong>chain</strong>, that is, the<br />
position along the efficiency–responsiveness continuum. Third,<br />
they need to ensure that the degree of <strong>supply</strong> <strong>chain</strong> responsiveness<br />
(<strong>supply</strong> <strong>chain</strong> design characteristics <strong>and</strong> capabilities) is consistent<br />
with the products’ <strong>supply</strong> <strong>and</strong> dem<strong>and</strong> uncertainty. With such a<br />
match, “[t]he goal is to target high responsiveness for a <strong>supply</strong> <strong>chain</strong><br />
facing high implied uncertainty, <strong>and</strong> efficiency for a <strong>supply</strong> <strong>chain</strong><br />
facing low implied uncertainty.” (Chopra <strong>and</strong> Meindl, 2010, p. 45)<br />
With a multi-country, multi-industry survey sample of 259 U.S.<br />
<strong>and</strong> Western European manufacturing firms <strong>and</strong> secondary <strong>financial</strong><br />
data, our research is – to the best of our knowledge – the first<br />
to empirically validate the impact of (or the lack of) <strong>supply</strong> <strong>chain</strong><br />
<strong>fit</strong> on the <strong>financial</strong> performance of the firm.<br />
7.1. Contributions to the literature<br />
This research makes several noteworthy contributions to the<br />
existing literature. First, it tests Fisher’s (1997) conceptual <strong>supply</strong><br />
<strong>chain</strong> <strong>fit</strong> model <strong>and</strong> relates the basic tenet of the model –<br />
namely that a match <strong>between</strong> the <strong>supply</strong> <strong>and</strong> dem<strong>and</strong> uncertainty<br />
(SDU) of the products <strong>and</strong> <strong>supply</strong> <strong>chain</strong> responsiveness (SCR) is<br />
admirable – to a <strong>financial</strong> performance measure of the firm. While<br />
several prior studies have borrowed some elements of Fisher’s<br />
(1997) <strong>supply</strong> <strong>chain</strong>–product match/mismatch framework, they<br />
have either investigated the antecedents or consequences of efficient<br />
vs. responsive <strong>supply</strong> <strong>chain</strong>s instead of both dimensions of<br />
the framework (R<strong>and</strong>all et al., 2003), not established a <strong>link</strong> of the<br />
match/mismatch to performance at all (e.g., Aitken et al., 2003;<br />
Holmström et al., 2006), or used operational performance outcomes,<br />
such as inventory, time, order fulfillment, quality, customer<br />
focus, or customer satisfaction (e.g., Ramdas, 2003).<br />
Second, since “<strong>supply</strong> <strong>chain</strong> research is in many ways an outgrowth<br />
of operations strategy research” (Boyer <strong>and</strong> Pagell, 2000, p.<br />
370), we built our study on an established foundation <strong>and</strong> extended<br />
the operations <strong>and</strong> manufacturing towards a <strong>supply</strong> <strong>chain</strong> strategy
350 S.M. Wagner et al. / Journal of Operations Management 30 (2012) 340–353<br />
research. As such, we augment some recently published empirical<br />
work on <strong>supply</strong> <strong>chain</strong> strategy (Qi et al., 2009, 2011).<br />
Third, by employing multivariate analysis techniques to test the<br />
core hypothesis <strong>and</strong> further deriving groups of firms with <strong>supply</strong><br />
<strong>chain</strong> <strong>fit</strong>, with negative mis<strong>fit</strong> <strong>and</strong> with positive mis<strong>fit</strong>, we developed<br />
replicable taxonomies of configurations (Miller, 1996). Since<br />
this taxonomy is firmly grounded in the operations management<br />
literature on the product–process matrix (Hayes <strong>and</strong> Wheelwright,<br />
1979; Safizadeh et al., 1996) <strong>and</strong> competitive priorities (Boyer <strong>and</strong><br />
Lewis, 2002; Ward et al., 1998), as well as Fisher’s (1997) practically<br />
relevant <strong>supply</strong> <strong>chain</strong>–product match/mismatch framework,<br />
it overcomes the critique of some taxonomies that they lack theoretical<br />
significance, are arbitrary <strong>and</strong> narrow, or unreliable <strong>and</strong><br />
unstable (Ketchen et al., 1993; Miller, 1996).<br />
Fourth, we found that the better the <strong>supply</strong> <strong>chain</strong> <strong>fit</strong>, the<br />
higher the ROA of the firm. We defined <strong>supply</strong> <strong>chain</strong> <strong>fit</strong> within<br />
a matching perspective <strong>and</strong> employed a deviation score analysis<br />
(Venkatraman, 1989). While this method has previously been<br />
employed in empirical studies of <strong>fit</strong> in management (e.g., He<br />
<strong>and</strong> Wong, 2004) <strong>and</strong> operations management (e.g., Stock <strong>and</strong><br />
Tatikonda, 2008), our research is the first study based on Fisher’s<br />
(1997) framework to go beyond a four-cell typology respectively<br />
a 1:1 matching of product characteristics <strong>and</strong> <strong>supply</strong> <strong>chain</strong> strategies<br />
or designs (Lee, 2002; Lo <strong>and</strong> Power, 2010; Parmigiani et al.,<br />
2011; Selldin <strong>and</strong> Olhager, 2007; Wong et al., 2006). In contrary, it<br />
measures the degree of <strong>fit</strong> respectively mis<strong>fit</strong> <strong>and</strong> generates more<br />
realistic <strong>and</strong> practically relevant insights.<br />
Fifth, concerning the deviation from the “perfect <strong>fit</strong>,” we differentiate<br />
<strong>between</strong> negative mis<strong>fit</strong> <strong>and</strong> positive mis<strong>fit</strong>, <strong>and</strong> show that<br />
firms with a negative mis<strong>fit</strong> have a lower <strong>financial</strong> performance<br />
(ROA = 5.80%) than firms with a positive mis<strong>fit</strong> (ROA = 7.73%). As<br />
such, while our results confirm that “[d]eviations in either direction<br />
reduce effectiveness” (Venkatraman, 1989, p. 431), we also show<br />
that the result of the deviation is contingent upon the direction of<br />
the deviation score.<br />
Sixth, we provide empirical validity for the existing theoretical<br />
models that focus on underst<strong>and</strong>ing how alternative <strong>supply</strong> <strong>chain</strong><br />
management strategies impact performance metrics such as capital<br />
<strong>and</strong> operating costs, service, <strong>and</strong> inventory levels (e.g., Aviv, 2001;<br />
Erhun et al., 2008; Taylor, 2002). By relating the firms’ degree of<br />
<strong>supply</strong> <strong>chain</strong> <strong>fit</strong> to their ROA we contribute to the growing stream<br />
of research that investigates the relationship of <strong>supply</strong> <strong>chain</strong> management<br />
practices <strong>and</strong> subjective (e.g., Cao <strong>and</strong> Zhang, 2011; Flynn<br />
et al., 2010; Vickery et al., 2003) or objective (e.g., Dehning et al.,<br />
2007; Lanier et al., 2010; Mitra <strong>and</strong> Singhal, 2008) <strong>financial</strong> performance<br />
metrics.<br />
Finally, we make two methodological contributions that will<br />
help to advance <strong>supply</strong> <strong>chain</strong> management research in the future.<br />
By combining multiple methods with data collected through a<br />
questionnaire survey in multiple countries <strong>and</strong> multiple industries<br />
with secondary <strong>financial</strong> data from an independent source<br />
(Boyer <strong>and</strong> Swink, 2008) we help to overcome the frequent criticism<br />
of common method bias (Craighead et al., 2011). Furthermore,<br />
we built the proposed construct items for SDU <strong>and</strong> SCR on the<br />
operations strategy literature which led to more reliable <strong>and</strong> valid<br />
constructs (Boyer <strong>and</strong> Pagell, 2000).<br />
7.2. Managerial implications<br />
Corporate practice can bene<strong>fit</strong> from the results of our research.<br />
First, <strong>supply</strong> <strong>chain</strong> <strong>fit</strong>, that is, the match <strong>between</strong> the products’ <strong>supply</strong><br />
<strong>and</strong> dem<strong>and</strong> uncertainty <strong>and</strong> <strong>supply</strong> <strong>chain</strong> responsiveness, is<br />
significantly related to the <strong>financial</strong> performance of the firm. Since<br />
only a small number of firms in our sample achieve a perfect <strong>fit</strong><br />
<strong>between</strong> these two dimensions, most firms have the potential to<br />
initiate the alignment of their <strong>supply</strong> <strong>chain</strong>s with their products. To<br />
do so, firms need to underst<strong>and</strong> the <strong>supply</strong> <strong>and</strong> dem<strong>and</strong> characteristics<br />
of the products they offer, the characteristics <strong>and</strong> capabilities<br />
of their <strong>supply</strong> <strong>chain</strong>s, <strong>and</strong> ensure that the degree of <strong>supply</strong> <strong>chain</strong><br />
responsiveness is consistent with the products’ <strong>supply</strong> <strong>and</strong> dem<strong>and</strong><br />
uncertainty (Chopra <strong>and</strong> Meindl, 2010). <strong>The</strong> product characteristics<br />
<strong>and</strong> <strong>supply</strong> <strong>chain</strong> designs summarized in Tables 1 <strong>and</strong> 2 can be a<br />
starting point for such an initiative.<br />
Second, while unquestionable that firms should strive to design<br />
their <strong>supply</strong> <strong>chain</strong>s to ideally match their products’ <strong>supply</strong> <strong>and</strong><br />
dem<strong>and</strong> uncertainty, they should also take into account that<br />
negative mis<strong>fit</strong> is less desirable than positive mis<strong>fit</strong>. Instead of<br />
overinvesting into measures to increase the responsiveness of the<br />
<strong>supply</strong> <strong>chain</strong> (e.g., through postponement), they should rather<br />
invest into measures to increase the efficiency of the <strong>supply</strong> <strong>chain</strong><br />
(e.g., through inventory reductions). <strong>The</strong> resulting positive mis<strong>fit</strong><br />
will be related to higher ROA than a potential negative mis<strong>fit</strong>.<br />
Third, Davis (2005, p. 18), former CFO <strong>and</strong> now Chairman <strong>and</strong><br />
CEO of UPS remarked that “aligning <strong>supply</strong> <strong>chain</strong> strategy to business<br />
strategy continues to be a slow process that often misses the<br />
mark. Part of the problem lies with <strong>supply</strong> <strong>chain</strong> professionals who<br />
need to put themselves in their CFO’s shoes <strong>and</strong> ask themselves,<br />
how can I speak the CFO’s language?” Our study provides good<br />
arguments for <strong>supply</strong> <strong>chain</strong> <strong>and</strong> operations managers that <strong>supply</strong><br />
<strong>chain</strong> management is not confined to operational issues (such as<br />
lead time reduction, capacity utilization, etc.), but that it has tangible,<br />
bottom-line <strong>financial</strong> implications <strong>and</strong> therefore has a strategic<br />
role to play. <strong>The</strong>refore, our study will help managers to underline<br />
the strategic relevance of <strong>supply</strong> <strong>chain</strong> management in the firm.<br />
8. Limitations <strong>and</strong> future research directions<br />
In our effort to investigate the <strong>financial</strong> impact of <strong>supply</strong><br />
<strong>chain</strong> <strong>fit</strong>, we encountered several limitations that are common in<br />
survey-based research. First, due to the difficulty of generating a<br />
sufficiently large sample, we used the same data to purify <strong>and</strong><br />
validate our measures <strong>and</strong> then to test the hypothesis. This is a<br />
common compromise adopted by many researchers (e.g., Cao <strong>and</strong><br />
Zhang, 2011; Vickery et al., 2003). Second, we did not survey multiple<br />
key informants per firm (i.e., to establish inter-rater reliability)<br />
(Wagner et al., 2010). Given the background of the respondents<br />
<strong>and</strong> the usage of objective secondary data, we believe that this is<br />
not problematic. Third, for cross-cultural/cross-national research,<br />
measurement equivalence is a critical methodological concern<br />
(Malhotra <strong>and</strong> Sharma, 2008; Rungtusanatham et al., 2005). As<br />
our UK sample is too small, we could not conduct a measurement<br />
equivalence assessment using either a multi-country CFA<br />
or using the generalizability theory approach (therefore, we controlled<br />
for country effects). Dealing with measurement equivalence<br />
in this manner would be a strong way to address the issue for<br />
future research. Fourth, as this research is cross-sectional, it cannot<br />
establish causality <strong>between</strong> variables. Only a longitudinal research<br />
design could confirm causality or evolutions of key variables over<br />
time, which would further allow investigating the dynamic nature<br />
of <strong>supply</strong> <strong>chain</strong>s towards achieving a <strong>fit</strong> along the product lifecycle.<br />
Fifth, while low coefficients of determination (R 2 ) are not<br />
uncommon in the literature (e.g., Lanier et al., 2010; Singer et al.,<br />
2008) the low R 2 values indicate that partial models were investigated.<br />
Obviously, various other factors hold predictive power for<br />
the investigated dependent variable that were omitted in our conceptual<br />
framework, such as sales <strong>and</strong> marketing efforts, the political<br />
<strong>and</strong> economical situation, as well as br<strong>and</strong> image <strong>and</strong> customer loyalty.<br />
Also, the firms’ main product lines do not represent 100% of<br />
the firms’ sales. This fact must be taken into consideration while<br />
interpreting the results. Finally, in a cross-sectional study such as<br />
ours, <strong>supply</strong> <strong>chain</strong> <strong>fit</strong> is difficult to measure due to its normative
overtones. Thus, our <strong>supply</strong> <strong>chain</strong> <strong>fit</strong> measure serves as an acceptable<br />
approximation, but it is only a proxy <strong>and</strong> cannot measure the<br />
exact current amount of <strong>supply</strong> <strong>chain</strong> <strong>fit</strong> that a firm achieves due to<br />
consistencies <strong>between</strong> its <strong>supply</strong> <strong>chain</strong> design <strong>and</strong> the underlying<br />
product. It would be desirable to explore <strong>fit</strong> directly.<br />
<strong>The</strong>se limitations highlight several additional directions for<br />
future research. First, it is generally difficult to determine the root<br />
cause of a transformational change. As lack of <strong>supply</strong> <strong>chain</strong> <strong>fit</strong> does<br />
not appear overnight but evolves over time, there is a constant<br />
threat that <strong>supply</strong> <strong>chain</strong> <strong>fit</strong> does not receive sufficient management<br />
attention. Managers generally do not get credit for preventing<br />
potential mis<strong>fit</strong>s, especially since the potential consequences are<br />
not known in advance. <strong>The</strong>refore, it can be estimated that over the<br />
course of time firms simply neglect the <strong>supply</strong> <strong>chain</strong> design aspects<br />
<strong>and</strong> underestimate both the tangible <strong>and</strong> intangible bene<strong>fit</strong>s of<br />
achieving <strong>supply</strong> <strong>chain</strong> <strong>fit</strong>. Thus, longitudinal studies analyzing root<br />
causes of <strong>supply</strong> <strong>chain</strong> mis<strong>fit</strong>s would be beneficial. Secondly, selecting<br />
an ideal configuration is a complex balancing act <strong>and</strong> depends<br />
on underlying uncertainties in the system. <strong>The</strong> more changing <strong>and</strong><br />
uncertain the environment is, the more loosely coupled the elements<br />
of a firm’s <strong>supply</strong> <strong>chain</strong> may have to be (Miller, 1993). Note<br />
that our research focuses on <strong>supply</strong> <strong>chain</strong> design issues in which<br />
<strong>supply</strong> <strong>and</strong> dem<strong>and</strong> uncertainty is the key challenge. In addition<br />
S.M. Wagner et al. / Journal of Operations Management 30 (2012) 340–353 351<br />
to further investigating additional dem<strong>and</strong> uncertainties (such as<br />
volume <strong>and</strong> mix), it would be useful to underst<strong>and</strong> process (such<br />
as yield, machine downtimes, <strong>and</strong> transportation reliabilities) <strong>and</strong><br />
<strong>supply</strong> (such as quality <strong>and</strong> delivery reliability) uncertainties of the<br />
products as well as <strong>supply</strong> <strong>chain</strong> responsiveness to be able to better<br />
measure <strong>fit</strong> from a holistic point of view. Thirdly, a set of dimensions<br />
<strong>and</strong> variables for the description of configurations which take<br />
all aspects of <strong>supply</strong> <strong>chain</strong> management into account must be further<br />
elaborated; i.e., better <strong>supply</strong> <strong>chain</strong> <strong>fit</strong> predictors <strong>and</strong> scales<br />
to identify determinants based on specified industry requirements<br />
should be developed <strong>and</strong> continuously updated in order to maintain<br />
a high level of <strong>supply</strong> <strong>chain</strong> <strong>fit</strong>. For this reason, a more complete<br />
set of factors should be included in future analyses of <strong>supply</strong> <strong>chain</strong><br />
<strong>fit</strong> <strong>and</strong> performance (Miller, 1986).<br />
While this study contains its own limitations, it is, to the best of<br />
our knowledge, the first to establish a relationship <strong>between</strong> <strong>supply</strong><br />
<strong>chain</strong> <strong>fit</strong> <strong>and</strong> a firm’s <strong>financial</strong> success; i.e., it underlines the bottomline<br />
impact of <strong>supply</strong> <strong>chain</strong> management. At the very least, this<br />
pattern of results should stimulate future research for the investigated<br />
<strong>link</strong>.<br />
Appendix A. Average ROA <strong>and</strong> OLS regression results for<br />
different degrees of “<strong>fit</strong>” (within 1 SD, beyond 1 SD)<br />
Firms with <strong>fit</strong> (within 1 SD) Firms with negative mis<strong>fit</strong> (> 1 SD) Firms with positive<br />
mis<strong>fit</strong> (> 1 SD)<br />
Number of firms 138 109 12<br />
Average ROA 7.12 5.58 7.41<br />
Independent variables Model 1 Model 2 Model 1 Model 2 a<br />
Intercept 3.340 (2.885) 4.775 † Control variables<br />
(2.797) −1.545 (3.271) .122 (3.383)<br />
Country France .761 (.724) .766 (.728) −2.663 * (1.128) −2.636 * (1.103)<br />
Country UK −2.500 (1.530) −2.597 † (1.478) −6.302 * (2.672) −6.401 * (2.635)<br />
Country Germany −.531 (.648) −.515 (.624) −3.277 † (1.718) −3.280 † (1.702)<br />
Firm age .341 (.894) .244 (.874) 2.349 (1.491) 2.512 (1.566)<br />
Firm size −.459 (.319) −.445 (.310) .204 (.462) .170 (.457)<br />
Competititive intensity .154 (.486) .109 (.467) −.060 (.615) −.062 (.607)<br />
Automotive & parts −.037 (1.393) .116 (1.400) −.804 (1.159) −.646 (1.161)<br />
Chemicals −.485 (1.241) −.430 (1.290) .609 (1.389) .535 (1.407)<br />
Construction & materials −.872 (1.069) −.381 (1.050) .251 (1.412) .190 (1.339)<br />
Electricity .217 (1.371) −.263 (1.298) −3.863 (5.343) −4.091 (5.270)<br />
Electronic & electrical equipment .026 (1.412) .060 (1.394) −4.245 (3.147) −4.086 (3.173)<br />
Food & beverages −.442 (1.130) −.225 (1.088) −.536 (1.154) −.757 (1.140)<br />
Forestry & paper −3.007 † (1.643) −3.184 * (1.450) 2.124 * (1.074) 1.849 † (1.039)<br />
Household goods & personal goods −1.111 (.999) −.949 (.990) −2.038 (1.999) −1.806 (2.030)<br />
Industrial metals −2.436 * (1.064) −2.504 * (1.171) −.223 (1.231) −.511 (1.246)<br />
Machinery & plant construction 1.472 (1.472) 1.791 (1.466) 1.286 (1.729) 1.274 (1.677)<br />
Medical equipment −.511 (1.312) −.314 (1.220) −1.641 (1.224) −1.741 (1.241)<br />
Mining −7.241 ** (2.295) −7.211 *** (2.065)<br />
Oil & gas 1.396 (1.798) 2.013 (1.982) −3.040 * (1.415) −3.116 * (1.424)<br />
Pharmaceuticals & biotechnology −.978 (1.414) −1.421 (1.246) −2.127 (1.955) −2.250 (1.895)<br />
Technology hardware & equipment .179 (1.063) −.219 (1.060) −2.980 (2.106) −3.280 (2.092)<br />
Textiles & apparel −1.542 (1.438) −2.015 (1.405)<br />
ROA 2004 .008 (.053) .003 (.053) −.026 (.156) −.039 (.156)<br />
ROA 2005 .240 * (.114) .241 * (.107) .354 ** (.133) .363 ** (.134)<br />
ROA 2006 .561 *** (.114) .565 *** (.110) .666 *** (.162) .665 *** Predictor variable<br />
(.162)<br />
<strong>Supply</strong> <strong>chain</strong> <strong>fit</strong> −2.001 * (.829) −1.069 (.792)<br />
R2 .798 .806 .752 .754<br />
Adjusted R2 .753 .761 .685 .684<br />
R2 change .008 * .002<br />
F 17.739 *** 17.770 *** 11.224 *** 10.750 ***<br />
Note. Robust (Huber–White) st<strong>and</strong>ard errors are in parentheses.<br />
a Regression analysis not conducted due to small number of observations.<br />
*** Significant at the .001 level (one-tailed).<br />
** Significant at the .01 level (one-tailed).<br />
* Significant at the .05 level (one-tailed).<br />
† Significant at the .1 level (one-tailed).
352 S.M. Wagner et al. / Journal of Operations Management 30 (2012) 340–353<br />
References<br />
Aitken, J., Childerhouse, P., Towill, D.R., 2003. <strong>The</strong> impact of product life cycle on<br />
<strong>supply</strong> <strong>chain</strong> strategy. International Journal of Production Economics 85 (2),<br />
127–140.<br />
Alex<strong>and</strong>er, J.W., R<strong>and</strong>olph, W.A., 1985. <strong>The</strong> <strong>fit</strong> <strong>between</strong> technology <strong>and</strong> structure as a<br />
predictor of performance in nursing subunits. Academy of Management Journal<br />
28 (4), 844–859.<br />
Amburgey, T., Kelly, D., Barnett, W., 1993. Resetting the clock: the dynamics of<br />
organizational change <strong>and</strong> failure. Administrative Science Quarterly 38 (1),<br />
51–73.<br />
Aviv, Y., 2001. <strong>The</strong> effect of collaborative forecasting on <strong>supply</strong> <strong>chain</strong> performance.<br />
Management Science 47 (10), 1326–1343.<br />
Bagozzi, R.P., Yi, W., Phillips, L.W., 1991. Assessing construct validity in organizational<br />
research. Administrative Science Quarterly 36 (3), 421–458.<br />
Bagozzi, R.P., Yi, Y., 1988. On the evaluation of structural equation models. Journal<br />
of the Academy of Marketing Science 16 (1), 74–97.<br />
Barnett, W.P., 1997. <strong>The</strong> dynamics of competitive intensity. Administrative Science<br />
Quarterly 42 (1), 128–160.<br />
Blackburn, J.D., 1991. Time-Based Competition: <strong>The</strong> Next Battleground in American<br />
Manufacturing (Business One Irwin/APICS Series in Production Management).<br />
Business One Irwin, Homewood, IL.<br />
Boyer, K.K., Bozarth, C., McDermott, C., 2000. Configurations in operations: an emerging<br />
area of study. Journal of Operations Management 18 (6), 601–604.<br />
Boyer, K.K., Lewis, M.W., 2002. Competitive priorities: investigating the need for<br />
trade-offs in operations strategy. Production <strong>and</strong> Operations Management 11<br />
(1), 9–20.<br />
Boyer, K.K., Pagell, M., 2000. Measurement issues in empirical research: improving<br />
measures of operations strategy <strong>and</strong> advanced manufacturing technology.<br />
Journal of Operations Management 18 (3), 361–374.<br />
Boyer, K.K., Swink, M.L., 2008. Empirical elephants—why multiple methods are<br />
essential to quality research in operations <strong>and</strong> <strong>supply</strong> <strong>chain</strong> management. Journal<br />
of Operations Management 26 (3), 338–344.<br />
Bozarth, C.C., McDermott, C., 1998. Configurations in manufacturing strategy: a<br />
review <strong>and</strong> directions for future research. Journal of Operations Management<br />
16 (4), 427–439.<br />
Bozarth, C.C., Warsing, D.P., Flynn, B.B., Flynn, E.J., 2009. <strong>The</strong> impact of <strong>supply</strong> <strong>chain</strong><br />
complexity on manufacturing plant performance. Journal of Operations Management<br />
27 (1), 78–93.<br />
Brown, B., Perry, S., 1994. Removing the <strong>financial</strong> performance halo from Fortune’s<br />
most admired companies. Academy of Management Journal 37 (5), 1347–1359.<br />
Burton, R.M., Lauridsen, J., Obel, B., 2002. Return on assets loss from situational <strong>and</strong><br />
contingency mis<strong>fit</strong>s. Management Science 48 (11), 1461–1485.<br />
Cachon, G., Fisher, M.L., 1997. Campbell Soup’s continuous replenishment program:<br />
evaluation <strong>and</strong> enhanced inventory decision rules. Production <strong>and</strong> Operations<br />
Management 6 (3), 266–276.<br />
Cao, M., Zhang, Q., 2011. <strong>Supply</strong> <strong>chain</strong> collaboration: impact on collaborative advantage<br />
<strong>and</strong> firm performance. Journal of Operations Management 29 (3), 163–180.<br />
Chen, I.J., Paulraj, A., 2004. Towards a theory of <strong>supply</strong> <strong>chain</strong> management: the constructs<br />
<strong>and</strong> measurements. Journal of Operations Management 22 (2), 119–150.<br />
Chopra, S., Meindl, P., 2010. <strong>Supply</strong> <strong>Chain</strong> Management: Strategy, Planning, <strong>and</strong><br />
Operation, 4th ed. Pearson Education, Upper Saddle River, NY.<br />
Clark, T.H., Hammond, J.H., 1997. Reengineering channel reordering processes to<br />
improve total <strong>supply</strong>-<strong>chain</strong> performance. Production <strong>and</strong> Operations Management<br />
6 (3), 248–265.<br />
Cohen, J., Cohen, P., West, S.G., Aiken, L.S., 2003. Applied Multiple Regression/Correlation<br />
Analysis for the Behavioral Sciences, 3rd ed. Erlbaum, Hillsdale,<br />
NJ.<br />
Craighead, C.W., Ketchen Jr., D.J., Dunn, K.S., Hult, G.T.M., 2011. Addressing common<br />
method variance: guidelines for survey research on information technology,<br />
operations, <strong>and</strong> <strong>supply</strong> <strong>chain</strong> management. IEEE Transactions on Engineering<br />
Management 58 (3), 578–588.<br />
Davis, S., 2005. Showing C-level executives from CEOs to COOs the ways to find value<br />
in logistics <strong>and</strong> <strong>supply</strong> <strong>chain</strong> management. Logistics Quarterly 2 (2), 1–30.<br />
Dehning, B., Richardson, V.J., Zmud, R.W., 2007. <strong>The</strong> <strong>financial</strong> performance effects of<br />
IT-based <strong>supply</strong> <strong>chain</strong> management systems in manufacturing firms. Journal of<br />
Operations Management 25 (4), 806–824.<br />
DeVellis, R.F., 2003. Scale Development: <strong>The</strong>ory <strong>and</strong> Applications, 2nd ed. Sage Publications,<br />
Thous<strong>and</strong> Oaks, CA.<br />
Dillman, D.A., 2007. Mail <strong>and</strong> Internet Surveys: <strong>The</strong> Tailored Design Method<br />
2007—Update with New Internet, Visual, <strong>and</strong> Mixed-mode Guide, 2nd ed. John<br />
Wiley & Sons, New York.<br />
Erhun, F., Keskinocak, P., Tayur, S., 2008. Dynamic procurement, quantity discounts,<br />
<strong>and</strong> <strong>supply</strong> <strong>chain</strong> efficiency. Production <strong>and</strong> Operations Management 17 (5),<br />
1–8.<br />
Ettlie, J.E., 1998. R&D <strong>and</strong> global manufacturing performance. Management Science<br />
44 (1), 1–11.<br />
Fisher, M.L., Hammond, J.H., Obermeyer, W.R., Raman, A., 1994. Making <strong>supply</strong> meet<br />
dem<strong>and</strong> in an uncertain world. Harvard Business Review 72 (3), 83–93.<br />
Fisher, M.L., 1997. What is the right <strong>supply</strong> <strong>chain</strong> for your product? Harvard Business<br />
Review 75 (2), 105–116.<br />
Fisher, M.L., Hammond, J.H., Obermeyer, W.R., Raman, A., 1997. Configuring a <strong>supply</strong><br />
<strong>chain</strong> to reduce the cost of dem<strong>and</strong> uncertainty. Production <strong>and</strong> Operations<br />
Management 6 (3), 211–225.<br />
Fisher, M.L., Raman, A., 1996. Reducing the cost of dem<strong>and</strong> uncertainty through<br />
accurate response to early sales. Operations Research 44 (1), 87–99.<br />
Flynn, B.B., Huo, B., Zhao, X., 2010. <strong>The</strong> impact of <strong>supply</strong> <strong>chain</strong> integration on performance:<br />
a contingency <strong>and</strong> configuration approach. Journal of Operations<br />
Management 28 (1), 58–71.<br />
Fornell, C., Larcker, D.F., 1981. Evaluating structural equation models with unobservable<br />
variables <strong>and</strong> measurement error. Journal of Marketing Research 18<br />
(1), 39–50.<br />
Gresov, C., 1989. Exploring <strong>fit</strong> <strong>and</strong> mis<strong>fit</strong> with multiple contingencies. Administrative<br />
Science Quarterly 34 (3), 431–453.<br />
Hair Jr., J.F., Black, W.C., Babin, B.J., Anderson, R.E., 2010. Multivariate Data Analysis,<br />
7th ed. Prentice Hall, Upper Saddle River, NJ.<br />
Hayes, R.H., Pisano, G.P., 1996. Manufacturing strategy: at the intersection of two<br />
paradigm shifts. Production <strong>and</strong> Operations Management 5 (1), 25–41.<br />
Hayes, R.H., Wheelwright, S.C., 1979. Link manufacturing process <strong>and</strong> product life<br />
cycles. Harvard Business Review 57 (1), 133–140.<br />
He, Z.-L., Wong, P.-K., 2004. Exploration vs. exploitation: an empirical test of the<br />
ambidexterity hypothesis. Organization Science 15 (4), 481–494.<br />
Hensley, R., Knupfer, S.M., 2005. Reducing waste in the auto industry: carmakers<br />
<strong>and</strong> parts suppliers can capture huge savings, but only by working together<br />
more closely. McKinsey Quarterly 42 (3), 115.<br />
Holmström, J., Korhonen, H., Laiho, A., Hartiala, H., 2006. Managing product introductions<br />
across the <strong>supply</strong> <strong>chain</strong>: findings from a development project. <strong>Supply</strong><br />
<strong>Chain</strong> Management: An International Journal 11 (2), 121–130.<br />
Huang, X., Kristal, M.M., Schroeder, R.G., 2008. Linking learning <strong>and</strong> effective process<br />
implementation to mass customization capability. Journal of Operations<br />
Management 26 (6), 714–729.<br />
Huber, P.J., 1967. <strong>The</strong> behavior of maximum likelihood estimates under nonst<strong>and</strong>ard<br />
conditions. Fifth Berkeley Symposium on Mathematical Statistics <strong>and</strong> Probability<br />
1, 221–233.<br />
Inman, R.A., Sale, R.S., Green Jr., K.W., Whitten, D., 2011. Agile manufacturing: relation<br />
to JIT, operational performance <strong>and</strong> firm performance. Journal of Operations<br />
Management 29 (4), 343–355.<br />
Jaworski, B.J., Kohli, A.K., 1993. Market orientation: antecedents <strong>and</strong> consequences.<br />
Journal of Marketing 57 (3), 53–70.<br />
Jermias, J., 2008. <strong>The</strong> relative influence of competitive intensity <strong>and</strong> business strategy<br />
on the relationship <strong>between</strong> <strong>financial</strong> leverage <strong>and</strong> performance. British<br />
Accounting Review 40 (1), 71–86.<br />
Joshi, M.P., Kathuria, R., Porth, S.J., 2003. Alignment of strategic priorities <strong>and</strong> performance:<br />
an integration of operations <strong>and</strong> strategic management perspectives.<br />
Journal of Operations Management 21 (3), 353–369.<br />
Ketchen Jr., D.J., Thomas, J.B., Snow, C.C., 1993. Organizational configuration <strong>and</strong><br />
performance: a comparison of theoretical approaches. Academy of Management<br />
Journal 36 (6), 1278–1313.<br />
Kouvelis, P., Chambers, C., Wang, H., 2006. <strong>Supply</strong> <strong>chain</strong> management research <strong>and</strong><br />
Production <strong>and</strong> Operations Management: review, trends, <strong>and</strong> opportunities.<br />
Production <strong>and</strong> Operations Management 15 (3), 449–469.<br />
Krause, D.R., Pagell, M., Curkovic, S., 2001. Toward a measure of competitive priorities<br />
for purchasing. Journal of Operations Management 19 (4), 497–512.<br />
Kroes, J.R., Ghosh, S., 2010. Outsourcing congruence with competitive priorities:<br />
impact on <strong>supply</strong> <strong>chain</strong> <strong>and</strong> firm performance. Journal of Operations Management<br />
28 (2), 124–143.<br />
Lanier Jr., D., Wempe, W.F., Zacharia, Z.G., 2010. Concentrated <strong>supply</strong> <strong>chain</strong> membership<br />
<strong>and</strong> <strong>financial</strong> performance: <strong>chain</strong>- <strong>and</strong> firm-level perspectives. Journal<br />
of Operations Management 28 (1), 1–16.<br />
Lee, H.L., 2002. Aligning <strong>supply</strong> <strong>chain</strong> strategies with product uncertainties. California<br />
Management Review 44 (3), 105–119.<br />
Lo, S.M., Power, D., 2010. An empirical investigation of the relationship <strong>between</strong><br />
product nature <strong>and</strong> <strong>supply</strong> <strong>chain</strong> strategy. <strong>Supply</strong> <strong>Chain</strong> Management: An International<br />
Journal 15 (2), 139–153.<br />
MacCarthy, B.L., Jayarathne, P.G.S.A., 2010. Fast fashion: achieving global quick<br />
response (GQR) in the internationally dispersed clothing industry. In: Cheng,<br />
T.C.E., Choi, T.-M. (Eds.), Innovative Quick Response Programs in Logistics <strong>and</strong><br />
<strong>Supply</strong> <strong>Chain</strong> Management (International H<strong>and</strong>books on Information Systems).<br />
Springer, Berlin, pp. 37–60.<br />
Malhotra, M.K., Sharma, S., 2008. Measurement equivalence using generalizability<br />
theory: an examination of manufacturing flexibility dimensions. Decision<br />
Sciences 39 (4), 643–669.<br />
Metters, R., 1997. Quantifying the bullwhip effect in <strong>supply</strong> <strong>chain</strong>s. Journal of Operations<br />
Management 15 (2), 89–100.<br />
Miller, D., 1986. Configurations of strategy <strong>and</strong> structure: towards a synthesis.<br />
Strategic Management Journal 7 (3), 233–249.<br />
Miller, D., 1993. <strong>The</strong> architecture of simplicity. Academy of Management Review 18<br />
(1), 116–138.<br />
Miller, D., 1996. Configurations revisited. Strategic Management Journal 17 (1),<br />
505–512.<br />
Miller, J.G., Roth, A.V., 1994. A taxonomy of manufacturing strategies. Management<br />
Science 40 (3), 285–304.<br />
Mitra, S., Singhal, V., 2008. <strong>Supply</strong> <strong>chain</strong> integration <strong>and</strong> shareholder value: evidence<br />
from consortium based industry exchanges. Journal of Operations Management<br />
26 (1), 96–114.<br />
Narasimhan, R., Swink, M., Kim, S.W., 2006. Disentangling leanness <strong>and</strong> agility:<br />
an empirical investigation. Journal of Operations Management 24 (5),<br />
440–457.<br />
Nunnally, J.C., Bernstein, I.H., 1994. Psychometric <strong>The</strong>ory, 3rd ed. McGraw Hill, New<br />
York.<br />
Park, J.-K., Ro, Y.K., 2011. <strong>The</strong> impact of a firm’s make, pseudo-make, or buy strategy<br />
on product performance. Journal of Operations Management 29 (4), 289–304.
Parmigiani, A., Klassen, R.D., Russo, M.V., 2011. Efficiency meets accountability: performance<br />
implications of <strong>supply</strong> <strong>chain</strong> configuration, control, <strong>and</strong> capabilities.<br />
Journal of Operations Management 29 (3), 212–223.<br />
Prater, E., Ghosh, S., 2006. A comparative model of firm size <strong>and</strong> the global operational<br />
dynamics of U.S. firms in Europe. Journal of Operations Management 24<br />
(5), 511–529.<br />
Qi, Y., Boyer, K.K., Zhao, X., 2009. <strong>Supply</strong> <strong>chain</strong> strategy, product characteristics, <strong>and</strong><br />
performance impact: evidence from Chinese manufacturers. Decision Sciences<br />
40 (4), 667–695.<br />
Qi, Y., Zhao, X., Sheu, C., 2011. <strong>The</strong> impact of competitive strategy <strong>and</strong> <strong>supply</strong> <strong>chain</strong><br />
strategy on business performance: the role of environmental uncertainty. Decision<br />
Sciences 42 (2), 371–389.<br />
R Development Core Team, 2010. <strong>The</strong> R Manuals, Version 2.13.0 (2011-04-13).<br />
http://www.r-project.org.<br />
Rajaram, K., Karmarkar, U.S., 2002. Product cycling with uncertain yields: analysis<br />
<strong>and</strong> application to the process industry. Operations Research 50 (4),<br />
680–691.<br />
Ramdas, K., 2003. Managing product variety: an integrative review <strong>and</strong> research<br />
directions. Production <strong>and</strong> Operations Management 12 (1), 79–101.<br />
R<strong>and</strong>all, T.R., Morgan, R.M., Morton, A.R., 2003. Efficient versus responsive <strong>supply</strong><br />
<strong>chain</strong> choice: an empirical examination of influential factors. Journal of Product<br />
Innovation Management 20 (6), 430–443.<br />
Rosenzweig, P., 2007. Misunderst<strong>and</strong>ing the nature of company performance: the<br />
halo effect <strong>and</strong> other business delusions. California Management Review 49 (4),<br />
6–20.<br />
Roth, A.V., 2007. Applications of empirical science in manufacturing <strong>and</strong> service<br />
operations. Manufacturing & Service Operations Management 9 (4),<br />
353–367.<br />
Rungtusanatham, M., Forza, C., Koka, B.R., Salvador, F., Nie, W., 2005. TQM across<br />
multiple countries: convergence hypothesis versus national specificity arguments.<br />
Journal of Operations Management 23 (1), 43–63.<br />
Safizadeh, M.H., Ritzman, L.P., Sharma, D., Wood, C., 1996. An empirical analysis of<br />
the product–process matrix. Management Science 42 (11), 1576–1591.<br />
Schaffer, B.S., Riordan, C.M., 2003. A review of cross-cultural methodologies for<br />
organizational research: a best-practices approach. Organizational Research<br />
Methods 6 (2), 169–215.<br />
Selldin, E., Olhager, J., 2007. Linking products with <strong>supply</strong> <strong>chain</strong>s: testing Fisher’s<br />
model. <strong>Supply</strong> <strong>Chain</strong> Management: An International Journal 12 (1), 42–51.<br />
Shah, R., Shin, H., 2007. Relationships among information technology, inventory, <strong>and</strong><br />
pro<strong>fit</strong>ability: an investigation of level invariance using sector level data. Journal<br />
of Operations Management 25 (4), 768–784.<br />
Singer, M., Donoso, P., Rodríguez-Sickert, C., 2008. A static model of cooperation for<br />
group-based incentive plans. International Journal of Production Economics 115<br />
(2), 492–501.<br />
Skinner, W., 1969. Manufacturing—missing <strong>link</strong> in corporate strategy. Harvard Business<br />
Review 47 (3), 136–145.<br />
S.M. Wagner et al. / Journal of Operations Management 30 (2012) 340–353 353<br />
Steiger, J.H., 2007. Underst<strong>and</strong>ing the limitations of global <strong>fit</strong> assessment in<br />
structural equations modeling. Personality <strong>and</strong> Individual Differences 42 (5),<br />
893–898.<br />
Stock, G.N., Tatikonda, M.V., 2008. <strong>The</strong> joint influence of technology uncertainty<br />
<strong>and</strong> interorganizational interaction on external technology integration success.<br />
Journal of Operations Management 26 (1), 65–80.<br />
Tatsiopoulos, I.P., Ponis, S.T., Hadzilias, E.A., Panayiotou, N.A., 2002. Realization of<br />
the virtual enterprise paradigm in the clothing industry through e-business<br />
technology. Production <strong>and</strong> Operations Management 11 (4), 516–530.<br />
Taylor, T.A., 2002. <strong>Supply</strong> <strong>chain</strong> coordination under channel rebates with sales effort<br />
effects. Management Science 48 (8), 992–1007.<br />
Terjesen, S., Patel, P.C., Covin, J.G., 2011. Alliance diversity, environmental context<br />
<strong>and</strong> the value of manufacturing capabilities among new high technology ventures.<br />
Journal of Operations Management 29 (1-2), 105–115.<br />
Utterback, J.M., Abernathy, W.J., 1975. A dynamic model of process <strong>and</strong> product<br />
innovation. Omega, <strong>The</strong> International Journal of Management Sciences 3 (6),<br />
639–656.<br />
Van Wezel, W., Van Donk, D.P., Gaalman, G., 2006. <strong>The</strong> planning flexibility bottleneck<br />
in food processing industries. Journal of Operations Management 24 (3),<br />
287–300.<br />
Venkatraman, N., 1989. <strong>The</strong> concept of <strong>fit</strong> in strategy research: toward verbal <strong>and</strong><br />
statistical correspondence. Academy of Management Review 14 (1), 423–444.<br />
Vickery, S.K., Jayaram, J., Droge, C., Calantone, R., 2003. <strong>The</strong> effects of an integrative<br />
<strong>supply</strong> <strong>chain</strong> strategy on customer service <strong>and</strong> <strong>financial</strong> performance: an analysis<br />
of direct versus indirect relationships. Journal of Operations Management<br />
21 (5), 523–539.<br />
Wagner, S.M., Kemmerling, R., 2010. H<strong>and</strong>ling nonresponse in logistics research.<br />
Journal of Business Logistics 31 (2), 357–381.<br />
Wagner, S.M., Rau, C., Lindemann, E., 2010. Multiple informant methodology: a<br />
critical review <strong>and</strong> recommendations. Sociological Methods & Research 38 (4),<br />
582–618.<br />
Ward, P.T., Bickford, D.J., Leong, G.K., 1996. Configurations of manufacturing strategy,<br />
business strategy, environment, <strong>and</strong> structure. Journal of Management 22 (4),<br />
597–626.<br />
Ward, P.T., McCreery, J.K., Ritzman, L.P., Sharma, D., 1998. Competitive priorities in<br />
operations management. Decision Sciences 29 (4), 1035–1046.<br />
White, H., 1980. A heteroskedasticity-consistent covariance matrix <strong>and</strong> a direct test<br />
for heteroskedasticity. Econometrica 48 (4), 817–838.<br />
White, R.E., Pearson, J.N., Wilson, J.R., 1999. JIT manufacturing: a survey of implementations<br />
in small <strong>and</strong> large U.S. manufacturers. Management Science 45 (1),<br />
1–15.<br />
Wong, C.Y., Arlbjørn, J.S., Hvolby, H.-H., Johansen, J., 2006. Assessing responsiveness<br />
of a volatile <strong>and</strong> seasonal <strong>supply</strong> <strong>chain</strong>: a case study. International Journal of<br />
Production Economics 104 (2), 709–721.<br />
Zeileis, A., 2004. Econometric computing with HC <strong>and</strong> HAC covariance matrix estimators.<br />
Journal of Statistical Software 11 (10), 1–17, http://www.jstatsoft.org.