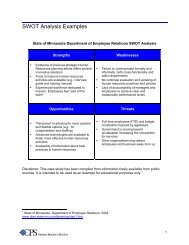
Doddington's Zoo and Fingerprint System Security - Noblis
Doddington's Zoo and Fingerprint System Security - Noblis
Doddington's Zoo and Fingerprint System Security - Noblis

You also want an ePaper? Increase the reach of your titles
YUMPU automatically turns print PDFs into web optimized ePapers that Google loves.
<strong>Doddington's</strong> <strong>Zoo</strong> <strong>and</strong> <strong>Fingerprint</strong><br />
<strong>System</strong> <strong>Security</strong><br />
Ron Sutton<br />
BearingPoint, Inc<br />
April 19, 2007
This Presentation is BearingPoint Proprietary Information © 2007 BearingPoint, LLC. LLC<br />
1
Overview<br />
– MINEX04 results imply low expectations for FMR (~1%) using<br />
interoperable minutiae templates at a reasonable FNMR.<br />
– Biometric practitioners believe that biometrics are stronger than<br />
these numbers imply but no analytical methods are available to prove<br />
this<br />
We need a better approach to evaluating biometric algorithm performance<br />
This Presentation is BearingPoint Proprietary Information © 2007 BearingPoint, LLC.<br />
2
What is FMR?<br />
– FMR is the False Match Rate<br />
– Typically computed by cross-comparing biometric samples from<br />
distinct individuals <strong>and</strong> analyzing the results<br />
FMR<br />
=<br />
N<br />
∑<br />
i=<br />
1<br />
# FalseMatches<br />
N(<br />
N<br />
−1)<br />
– This represents average performance over an entire population<br />
– But are populations really uniform with respect to FMR?<br />
This Presentation is BearingPoint Proprietary Information © 2007 BearingPoint, LLC.<br />
i<br />
3
What does FMR really tell us?<br />
FMR represents the average probability of a false match of any r<strong>and</strong>omly<br />
selected individual against any other. But this is not how credentialing<br />
systems work.<br />
This Presentation is BearingPoint Proprietary Information © 2007 BearingPoint, LLC.<br />
4
Applying FMR to Credentialing <strong>System</strong>s<br />
FMR does not tell us the probability of a false match of any<br />
r<strong>and</strong>omly selected individual against a specific other<br />
This Presentation is BearingPoint Proprietary Information © 2007 BearingPoint, LLC.<br />
5
Doddington’s <strong>Zoo</strong><br />
– Doddington, et al, says,<br />
─ “In our model, sheep dominate the population <strong>and</strong> systems<br />
perform nominally well for them.”<br />
─ “Goats tend to adversely affect the performance of systems by<br />
accounting for a disproportionate share of the missed<br />
detections. The goat population can be an especially important<br />
problem for entry control systems, where it is important that all<br />
users be reliably accepted.”<br />
─ “Lambs, in our model, are those speakers who are particularly<br />
easy to imitate.”<br />
─ “Wolves, in our model, are those speakers who are particularly<br />
successful at imitating other speakers.”<br />
This Presentation is BearingPoint Proprietary Information © 2007 BearingPoint, LLC.<br />
6
Doddington’s <strong>Zoo</strong> & <strong>Fingerprint</strong>s<br />
– Sheep – persons whose biometric perform well but are not<br />
necessarily more likely to match non-mates<br />
FNMR sheep < FNMR MINEX<br />
FMR sheep = ~FMR MINEX<br />
– Goats – persons whose biometric performs poorly but are not<br />
necessarily more likely to match non-mates<br />
FNMR goats >> FNMR MINEX<br />
FMR goats = ~FMR MINEX<br />
– Lambs & Wolves – persons whose biometric is more likely than<br />
those of others to match or be matched by non-mates<br />
FNMR lambs/wolves FMR MINEX<br />
This Presentation is BearingPoint Proprietary Information © 2007 BearingPoint, LLC.<br />
7
<strong>Zoo</strong> Population Sizes<br />
– What percentage of the transportation worker population falls into each ‘species’ of<br />
Doddington’s <strong>Zoo</strong>?<br />
In NISTIR 7271, “The Myth of Goats:How many people have fingerprints that<br />
are hard to match?” (13 September 2005) researchers Austin Hicklin, Craig Watson<br />
<strong>and</strong> Brad Ulery conclude:<br />
“The definition of a Goat, or person whose fingerprints are intrinsically hard<br />
to match, varies. However, results clearly show that the proportion of Goats<br />
is very small, regardless of the definition. None of the 6,000 subjects had<br />
fingers that were always hard to match (with single-finger mate scores<br />
worse than a threshold corresponding to a verification False Accept Rate of<br />
1%); less than 0.05% of the subjects had fingers that were usually hard to<br />
match; less than 0.3% of the subjects had fingers that were hard to match<br />
even a quarter of the time.<br />
Many individuals were particularly easy to match: for 77% to 81% of<br />
subjects, every fingerprint comparison had mate scores better than a<br />
threshold corresponding to a verification False Accept Rate of 10-6<br />
(0.0001%).”<br />
(Emphasis added by presentation author)<br />
This Presentation is BearingPoint Proprietary Information © 2007 BearingPoint, LLC.<br />
8
Applying the “<strong>Zoo</strong>” to <strong>System</strong> Design<br />
– If the ‘zoo’ concept really applies to fingerprints, then the ROC<br />
curves for various subpopulations are not identical. For example,<br />
some hypothetical algorithm may perform as shown below.<br />
W/L<br />
Sheep <strong>and</strong> Goats – 90% of population<br />
FNMR = 0.001 at FMR of 0.000001<br />
Wolves <strong>and</strong> Lambs – 10%<br />
FNMR=0.2 at FMR of 0.001<br />
This Presentation is BearingPoint Proprietary Information © 2007 BearingPoint, LLC.<br />
9
Applying the “<strong>Zoo</strong>” to <strong>System</strong> Design<br />
If Sheep/Goat <strong>and</strong> Wolf/Lamb subpopulations are disjoint <strong>and</strong><br />
subpopulation membership can be determined at time of credential<br />
issuance, it can be recorded on the credential <strong>and</strong> used to establish a<br />
variable matching threshold.<br />
─ Credentials marked as Sheep or Goat would have lower matching<br />
threshold<br />
─ Credentials marked as Wolf/Lamb would have higher matching<br />
threshold<br />
─ Credentials marked as ‘Indeterminate’ would have higher matching<br />
threshold<br />
This approach produces a lower system FNMR at a given FMR.<br />
FMR<br />
<strong>System</strong><br />
= +<br />
N<br />
S/G<br />
* FMR<br />
N<br />
S/G<br />
S/G<br />
+ N<br />
+ N<br />
This Presentation is BearingPoint Proprietary Information © 2007 BearingPoint, LLC.<br />
W/L<br />
W/L<br />
* FMR<br />
W / L<br />
10
What more do we need to know?<br />
– Anecdotal evidence supports <strong>Zoo</strong> application to fingerprints<br />
– Population topology is unknown<br />
─ Are sheeps/goats <strong>and</strong> wolves/lambs disjoint sets?<br />
─ Is there a single wolf/lamb subpopulation, or many?<br />
─ Are there any persons who tend to match everyone more<br />
frequently?<br />
– Hard data will allow more definitive statements about true<br />
strength of biometric security solutions <strong>and</strong> provide architects<br />
with additional tools to meet system requirements<br />
– Reanalysis of MINEX results could produce data needed<br />
– Applicable to TWIC, RT, HSPD-12, others<br />
This Presentation is BearingPoint Proprietary Information © 2007 BearingPoint, LLC.<br />
11
Analysis of NIST IAD Biometric Scores Set<br />
Dataset properties<br />
– 6000 subjects<br />
– Left & Right index fingers<br />
– Each subject is matched against himself <strong>and</strong> all others<br />
– Scores for each compare included in dataset<br />
Problems with this dataset<br />
– Not enough data to assess ‘Goat’ population<br />
– No multiple sample compares<br />
– No images or image quality scores<br />
– Algorithm is not particularly strong<br />
This Presentation is BearingPoint Proprietary Information © 2007 BearingPoint, LLC.<br />
12
Performance data – Left Index only<br />
Mate Score Mate Scores Non-Mate Score<br />
Non-Mate<br />
Scores<br />
Non-Mates with<br />
scores below FNMR FMR<br />
False Matches at<br />
this threshold<br />
10 72 10 1893647 31748647 5.3% 17.06% 6,139,000<br />
11 50 11 1298575 33047222 6.5% 11.79% 4,245,353<br />
12 60 12 893047 33940269 7.4% 8.19% 2,946,778<br />
13 54 13 615514 34555783 8.4% 5.71% 2,053,731<br />
14 53 14 426652 34982435 9.3% 4.00% 1,438,217<br />
15 53 15 297757 35280192 10.1% 2.81% 1,011,565<br />
16 47 16 208379 35488571 11.0% 1.98% 713,808<br />
17 56 17 146547 35635118 11.8% 1.40% 505,429<br />
18 61 18 103996 35739114 12.7% 1.00% 358,882<br />
19 40 19 73938 35813052 13.8% 0.71% 254,886<br />
20 57 20 52221 35865273 14.4% 0.50% 180,948<br />
21 64 21 37412 35902685 15.4% 0.36% 128,727<br />
22 45 22 27006 35929691 16.4% 0.25% 91,315<br />
23 53 23 18836 35948527 17.2% 0.18% 64,309<br />
24 46 24 13399 35961926 18.1% 0.13% 45,473<br />
25 56 25 9597 35971523 18.8% 0.09% 32,074<br />
26 62 26 6823 35978346 19.8% 0.06% 22,477<br />
27 41 27 4764 35983110 20.8% 0.04% 15,654<br />
28 58 28 3318 35986428 21.5% 0.03% 10,890<br />
29 56 29 2352 35988780 22.5% 0.02% 7,572<br />
30 65 30 1599 35990379 23.4% 0.01% 5,220<br />
This Presentation is BearingPoint Proprietary Information © 2007 BearingPoint, LLC.<br />
13
Score Frequencies<br />
Frequency<br />
2000000<br />
1800000<br />
1600000<br />
1400000<br />
1200000<br />
1000000<br />
800000<br />
600000<br />
400000<br />
200000<br />
0<br />
Mate & Non-Mate Score Frequencies<br />
0 50 100 150 200 250 300 350 400<br />
Score<br />
Non-Mate Scores Mate Scores<br />
This Presentation is BearingPoint Proprietary Information © 2007 BearingPoint, LLC.<br />
80<br />
70<br />
60<br />
50<br />
40<br />
30<br />
20<br />
10<br />
0<br />
14
Analysis Methodology<br />
Based on score frequency analysis, a base threshold of 20.0 was<br />
selected. This yields overall performance statistics of:<br />
FNMR = 14.4%<br />
FMR = 0.5%<br />
This threshold was used to count the number of times each<br />
subject matched, or was matched by another subject.<br />
This Presentation is BearingPoint Proprietary Information © 2007 BearingPoint, LLC.<br />
15
Lamb & Wolf Analysis<br />
Rather than FNMR & FMR, this analysis examined performance<br />
characteristics that could be measured <strong>and</strong> controlled for in a<br />
credentialing system.<br />
– Lambs – subjects who were matched by others at a rate 4x the mean<br />
FMR for the overall population (characterized by False Match By Others<br />
Rate)<br />
– Wolves – subjects who matched others at a rate 4x the mean FMR for<br />
the overall population (characterized by False Match Of Others Rate)<br />
– The analysis identified 318 Wolves <strong>and</strong> 314 Lambs.<br />
– These groups had 80 members in common.<br />
This Presentation is BearingPoint Proprietary Information © 2007 BearingPoint, LLC.<br />
16
Using FMBOR <strong>and</strong> FMOOR in a system<br />
In a credentialing system, the only points at which decisions can<br />
be made are at card personalization <strong>and</strong> at the point of use.<br />
When anyone attempts to match a Lamb, credential consumers<br />
can detect a ‘Lamb’ indicator on the credential <strong>and</strong> raise the<br />
matching threshold. Lambs can be identified empirically in a<br />
credentialing system.<br />
Wolves are a bit more difficult; since they tend to match others<br />
we would need to identify them at the point of use based on<br />
image characteristics. Whether this is possible is not yet known.<br />
This Presentation is BearingPoint Proprietary Information © 2007 BearingPoint, LLC.<br />
17
Application of higher thresholds<br />
Once Wolf <strong>and</strong> Lamb groups were identified, data was reanalyzed using<br />
higher thresholds when the person in the role of a credential holder was a<br />
Lamb or the person attempting to use the credential was a Wolf. Other<br />
subjects were considered to be Sheep, <strong>and</strong> the original threshold was used<br />
for them. Although the same threshold was used for Lambs <strong>and</strong> Wolves in<br />
this analysis, preliminary data suggests that if different thresholds are used,<br />
the Lamb threshold should be used for a person is both a Lamb <strong>and</strong> a Wolf.<br />
Base<br />
Threshold<br />
#<br />
Sheep<br />
#<br />
Wolves<br />
#<br />
Lambs<br />
Sheep<br />
Threshold<br />
Wolf<br />
Thresh<br />
old<br />
Lamb<br />
Thres<br />
hold<br />
20 5368 318 314 20 20 20<br />
20 5368 318 314 20 25 25<br />
Sheep<br />
FNMR<br />
15.44<br />
%<br />
15.44<br />
%<br />
Wolf<br />
FNMR<br />
2.20<br />
%<br />
3.14<br />
%<br />
Lamb<br />
FNMR Sheep FMR<br />
This Presentation is BearingPoint Proprietary Information © 2007 BearingPoint, LLC.<br />
Wolf<br />
FMOOR<br />
Lamb<br />
FMBOR<br />
5.41<br />
% 0.36% 1.40% 2.73%<br />
7.32<br />
% 0.36% 0.29% 0.63%<br />
18
Varying the Thresholds<br />
20.00%<br />
18.00%<br />
16.00%<br />
14.00%<br />
12.00%<br />
10.00%<br />
8.00%<br />
6.00%<br />
4.00%<br />
2.00%<br />
0.00%<br />
Lamb FNMR & FMBOR vs Threshold<br />
10 12 14 16 18 20 22 24 26 28 30<br />
Threshold<br />
20.00%<br />
18.00%<br />
16.00%<br />
14.00%<br />
12.00%<br />
10.00%<br />
8.00%<br />
6.00%<br />
4.00%<br />
2.00%<br />
Lamb FNMR Lamb FMBOR<br />
Sheep FNMR & FMR vs Threshold<br />
0.00%<br />
10 12 14 16 18 20 22 24 26 28 30<br />
Threshold<br />
Sheep FNMR Sheep FMR<br />
Wolf FNMR & FMOOR vs Threshold<br />
This Presentation is BearingPoint Proprietary Information © 2007 BearingPoint, LLC.<br />
20.00%<br />
18.00%<br />
16.00%<br />
14.00%<br />
12.00%<br />
10.00%<br />
8.00%<br />
6.00%<br />
4.00%<br />
2.00%<br />
0.00%<br />
10 12 14 16 18 20 22 24 26 28 30<br />
Threshold<br />
Wolf FNMR Wolf FMOOR<br />
19
Impact on Overall <strong>System</strong> FMR<br />
All matched against threshold of 20.0<br />
Matched Sheep Wolves Lambs Totals<br />
Sheep 80,149 7,520 29,936 117,605<br />
Wolves 30,896 4,116 18,367 53,379<br />
Lambs 13,787 1,812 7,895 23,494<br />
Wolves & Lambs matched against threshold of 25.0<br />
Matched Sheep Wolves Lambs Totals<br />
Sheep 80,051 7,518 5,682 93,251<br />
Wolves 6,023 920 5,496 12,439<br />
Lambs 2,375 382 2,097 4,854<br />
194,478 FMs using uniform threshold of 20.0<br />
110,544 FMs when FMBOR <strong>and</strong> FMOOR used to apply a higher threshold<br />
Quick estimate of system FMR ceiling = 0.31%, versus 0.5%<br />
This Presentation is BearingPoint Proprietary Information © 2007 BearingPoint, LLC.<br />
20
Observations<br />
– Wolves <strong>and</strong> Lambs are not the same group, though they do<br />
overlap (by ~25% in this dataset)<br />
– Wolves <strong>and</strong> Lambs had significantly lower FNMRs than Sheep<br />
at the same threshold<br />
– If a person is both a Wolf <strong>and</strong> a Lamb, more advantage is<br />
obtained by treating the person as a Lamb<br />
– It appears that this may be a fruitful approach to improving<br />
the security of credential-based access control systems<br />
This Presentation is BearingPoint Proprietary Information © 2007 BearingPoint, LLC.<br />
21
Caveats<br />
– Parameter selections were arbitrary; further analysis may<br />
reveal greater benefits at other settings<br />
– Analysis was based on a single dataset using a single matching<br />
algorithm; the effect discerned may not be present in the real<br />
world<br />
– The relatively weak discriminative powers of the algorithm<br />
used to generate the scores tends to disguise the quantitative<br />
possibilities of this approach<br />
– Note that system FMR calculation is complicated by the fact<br />
that FMs by subjects who are both Lamb <strong>and</strong> Wolf are counted<br />
twice<br />
This Presentation is BearingPoint Proprietary Information © 2007 BearingPoint, LLC.<br />
22
Current Work<br />
– Defining what a ‘subpopulation’ means in rigorous<br />
mathematical terms<br />
– Determining whether Lamb & Wolf populations have further<br />
subdivisions<br />
– Determining whether there are ‘Wolfs at Large’; these are<br />
persons who tend to match r<strong>and</strong>om individuals in the Sheep<br />
population<br />
This Presentation is BearingPoint Proprietary Information © 2007 BearingPoint, LLC.<br />
23
Next Steps<br />
– Acquire dataset that lends itself better to broader analysis<br />
� Images would allow evaluation with a variety of algorithms <strong>and</strong><br />
analysis of pattern class correlation with subpopulations<br />
� Multiple samples from each subject would allow goat analysis<br />
<strong>and</strong> improve confidence in other subpopulation identification<br />
– Determine whether effect is present in other populations <strong>and</strong><br />
with other matching algorithms<br />
– Determine whether subpopulation membership varies with<br />
matching algorithm<br />
– Seek common image characteristics that could be used to<br />
algorithmically identify subpopulation membership<br />
– Quantify benefits, if any, with matching algorithms that might<br />
be deployed in the real world<br />
This Presentation is BearingPoint Proprietary Information © 2007 BearingPoint, LLC.<br />
24
Want to help?<br />
– Seeking significant sets of fingerprint image data<br />
� Multiple samples from each finger<br />
� Multiple samples from each individual (ideally, 10 prints)<br />
� Largest populations possible<br />
� Prefer high quality data for concept evaluation<br />
� Mixed quality data for real-world performance analysis<br />
This Presentation is BearingPoint Proprietary Information © 2007 BearingPoint, LLC.<br />
25
This Presentation is BearingPoint Proprietary Information © 2007 BearingPoint, LLC.<br />
26