REGIONAL ECONOMIC SITUATIONER Western ... - NEDA-RDC VI
REGIONAL ECONOMIC SITUATIONER Western ... - NEDA-RDC VI
REGIONAL ECONOMIC SITUATIONER Western ... - NEDA-RDC VI

Create successful ePaper yourself
Turn your PDF publications into a flip-book with our unique Google optimized e-Paper software.
12.0<br />
10.0<br />
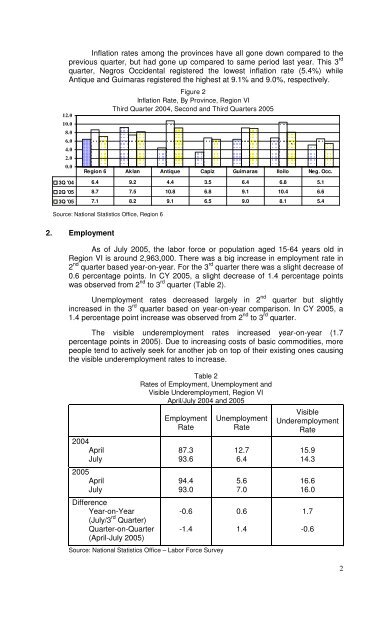
Inflation rates among the provinces have all gone down compared to the<br />
previous quarter, but had gone up compared to same period last year. This 3 rd<br />
quarter, Negros Occidental registered the lowest inflation rate (5.4%) while<br />
Antique and Guimaras registered the highest at 9.1% and 9.0%, respectively.<br />
8.0<br />
6.0<br />
4.0<br />
2.0<br />
0.0<br />
Figure 2<br />
Inflation Rate, By Province, Region <strong>VI</strong><br />
Third Quarter 2004, Second and Third Quarters 2005<br />
Region 6 Aklan Antique Capiz Guimaras Iloilo Neg. Occ.<br />
3Q '04 6.4 9.2 4.4 3.5 6.4 6.8 5.1<br />
2Q '05 8.7 7.5 10.8 6.8 9.1 10.4 6.6<br />
3Q '05 7.1 8.2 9.1 6.5 9.0 8.1 5.4<br />
Source: National Statistics Office, Region 6<br />
2. Employment<br />
As of July 2005, the labor force or population aged 15-64 years old in<br />
Region <strong>VI</strong> is around 2,963,000. There was a big increase in employment rate in<br />
2 nd quarter based year-on-year. For the 3 rd quarter there was a slight decrease of<br />
0.6 percentage points. In CY 2005, a slight decrease of 1.4 percentage points<br />
was observed from 2 nd to 3 rd quarter (Table 2).<br />
Unemployment rates decreased largely in 2 nd quarter but slightly<br />
increased in the 3 rd quarter based on year-on-year comparison. In CY 2005, a<br />
1.4 percentage point increase was observed from 2 nd to 3 rd quarter.<br />
The visible underemployment rates increased year-on-year (1.7<br />
percentage points in 2005). Due to increasing costs of basic commodities, more<br />
people tend to actively seek for another job on top of their existing ones causing<br />
the visible underemployment rates to increase.<br />
2004<br />
April<br />
July<br />
2005<br />
April<br />
July<br />
Difference<br />
Year-on-Year<br />
(July/3 rd Quarter)<br />
Quarter-on-Quarter<br />
(April-July 2005)<br />
Table 2<br />
Rates of Employment, Unemployment and<br />
Visible Underemployment, Region <strong>VI</strong><br />
April/July 2004 and 2005<br />
Employment<br />
Rate<br />
87.3<br />
93.6<br />
94.4<br />
93.0<br />
-0.6<br />
-1.4<br />
Source: National Statistics Office – Labor Force Survey<br />
Unemployment<br />
Rate<br />
12.7<br />
6.4<br />
5.6<br />
7.0<br />
0.6<br />
1.4<br />
`<br />
Visible<br />
Underemployment<br />
Rate<br />
15.9<br />
14.3<br />
16.6<br />
16.0<br />
1.7<br />
-0.6<br />
2