REGIONAL ECONOMIC SITUATIONER Western ... - NEDA-RDC VI
REGIONAL ECONOMIC SITUATIONER Western ... - NEDA-RDC VI
REGIONAL ECONOMIC SITUATIONER Western ... - NEDA-RDC VI

Create successful ePaper yourself
Turn your PDF publications into a flip-book with our unique Google optimized e-Paper software.
I. <strong>ECONOMIC</strong> PERFORMANCE<br />
1. Prices<br />
<strong>REGIONAL</strong> <strong>ECONOMIC</strong> <strong>SITUATIONER</strong><br />
<strong>Western</strong> Visayas Region<br />
Third Quarter 2005<br />
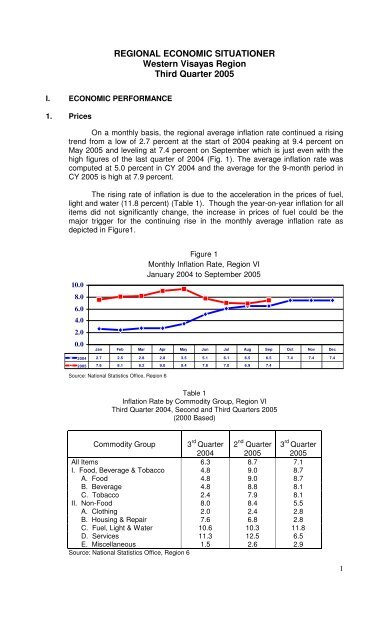
On a monthly basis, the regional average inflation rate continued a rising<br />
trend from a low of 2.7 percent at the start of 2004 peaking at 9.4 percent on<br />
May 2005 and leveling at 7.4 percent on September which is just even with the<br />
high figures of the last quarter of 2004 (Fig. 1). The average inflation rate was<br />
computed at 5.0 percent in CY 2004 and the average for the 9-month period in<br />
CY 2005 is high at 7.9 percent.<br />
The rising rate of inflation is due to the acceleration in the prices of fuel,<br />
light and water (11.8 percent) (Table 1). Though the year-on-year inflation for all<br />
items did not significantly change, the increase in prices of fuel could be the<br />
major trigger for the continuing rise in the monthly average inflation rate as<br />
depicted in Figure1.<br />
10.0<br />
8.0<br />
6.0<br />
4.0<br />
2.0<br />
0.0<br />
Figure 1<br />
Monthly Inflation Rate, Region <strong>VI</strong><br />
January 2004 to September 2005<br />
Jan Feb Mar Apr May Jun Jul Aug Sep Oct Nov Dec<br />
2004 2.7 2.5 2.8 2.8 3.5 5.1 6.1 6.5 6.5 7.4 7.4 7.4<br />
2005 7.6 8.1 8.2 9.0 9.4 7.8 7.0 6.9 7.4<br />
Source: National Statistics Office, Region 6<br />
Table 1<br />
Inflation Rate by Commodity Group, Region <strong>VI</strong><br />
Third Quarter 2004, Second and Third Quarters 2005<br />
(2000 Based)<br />
Commodity Group 3 rd Quarter 2<br />
2004<br />
nd Quarter 3<br />
2005<br />
rd Quarter<br />
2005<br />
All Items 6.3 8.7 7.1<br />
I. Food, Beverage & Tobacco 4.8 9.0 8.7<br />
A. Food 4.8 9.0 8.7<br />
B. Beverage 4.8 8.8 8.1<br />
C. Tobacco 2.4 7.9 8.1<br />
II. Non-Food 8.0 8.4 5.5<br />
A. Clothing 2.0 2.4 2.8<br />
B. Housing & Repair 7.6 6.8 2.8<br />
C. Fuel, Light & Water 10.6 10.3 11.8<br />
D. Services 11.3 12.5 6.5<br />
E. Miscellaneous 1.5 2.6 2.9<br />
Source: National Statistics Office, Region 6<br />
1
12.0<br />
10.0<br />
Inflation rates among the provinces have all gone down compared to the<br />
previous quarter, but had gone up compared to same period last year. This 3 rd<br />
quarter, Negros Occidental registered the lowest inflation rate (5.4%) while<br />
Antique and Guimaras registered the highest at 9.1% and 9.0%, respectively.<br />
8.0<br />
6.0<br />
4.0<br />
2.0<br />
0.0<br />
Figure 2<br />
Inflation Rate, By Province, Region <strong>VI</strong><br />
Third Quarter 2004, Second and Third Quarters 2005<br />
Region 6 Aklan Antique Capiz Guimaras Iloilo Neg. Occ.<br />
3Q '04 6.4 9.2 4.4 3.5 6.4 6.8 5.1<br />
2Q '05 8.7 7.5 10.8 6.8 9.1 10.4 6.6<br />
3Q '05 7.1 8.2 9.1 6.5 9.0 8.1 5.4<br />
Source: National Statistics Office, Region 6<br />
2. Employment<br />
As of July 2005, the labor force or population aged 15-64 years old in<br />
Region <strong>VI</strong> is around 2,963,000. There was a big increase in employment rate in<br />
2 nd quarter based year-on-year. For the 3 rd quarter there was a slight decrease of<br />
0.6 percentage points. In CY 2005, a slight decrease of 1.4 percentage points<br />
was observed from 2 nd to 3 rd quarter (Table 2).<br />
Unemployment rates decreased largely in 2 nd quarter but slightly<br />
increased in the 3 rd quarter based on year-on-year comparison. In CY 2005, a<br />
1.4 percentage point increase was observed from 2 nd to 3 rd quarter.<br />
The visible underemployment rates increased year-on-year (1.7<br />
percentage points in 2005). Due to increasing costs of basic commodities, more<br />
people tend to actively seek for another job on top of their existing ones causing<br />
the visible underemployment rates to increase.<br />
2004<br />
April<br />
July<br />
2005<br />
April<br />
July<br />
Difference<br />
Year-on-Year<br />
(July/3 rd Quarter)<br />
Quarter-on-Quarter<br />
(April-July 2005)<br />
Table 2<br />
Rates of Employment, Unemployment and<br />
Visible Underemployment, Region <strong>VI</strong><br />
April/July 2004 and 2005<br />
Employment<br />
Rate<br />
87.3<br />
93.6<br />
94.4<br />
93.0<br />
-0.6<br />
-1.4<br />
Source: National Statistics Office – Labor Force Survey<br />
Unemployment<br />
Rate<br />
12.7<br />
6.4<br />
5.6<br />
7.0<br />
0.6<br />
1.4<br />
`<br />
Visible<br />
Underemployment<br />
Rate<br />
15.9<br />
14.3<br />
16.6<br />
16.0<br />
1.7<br />
-0.6<br />
2
The Department of Labor and Employment, Region <strong>VI</strong> reported that<br />
during the 3rd Quarter of 2005 a total of 80 establishments had either closed<br />
shop or trimmed down the workforce. As a result, some 792 workers lost their<br />
jobs. This number, though is slightly lower (3.4%) than in the same quarter last<br />
year. Out of the 80 establishments that shut down, 27 were in the wholesale and<br />
retail trade sector. Financial problems caused the closure and/or retrenchment of<br />
the majority (58) of these establishments.<br />
Table 3<br />
Number of Shutdowns and Retrenchments<br />
and Number of Employees Affected, Region <strong>VI</strong><br />
Third Quarter 2004 and 2005<br />
3rd Quarter<br />
2004<br />
3rd Quarter<br />
2005<br />
Percent<br />
Change<br />
RETRENCHMENT<br />
No. of Establishments 38 61 60.5<br />
No. of Employees Affected<br />
SHUTDOWN<br />
485 494 1.9<br />
No. of Establishments 9 19 111.1<br />
No. of Employees Affected<br />
TOTAL<br />
335 298 -11.0<br />
No. of Establishments 47 80 70.2<br />
No. of Employees Affected 820 792 -3.4<br />
Source: Department of Labor and Employment, Region 6<br />
3. Agriculture Production<br />
A. Major Crops<br />
A year-on-year comparison is relevant for agriculture production because<br />
seasonality affects the quarter-on-quarter analysis. A three-year analysis is shown<br />
in Table 4.<br />
Palay production in 3 rd quarter 2005 is lower compared to the previous two<br />
years, i.e., 24% lower than Q3-04 and 10% less than Q3-03. July-September is<br />
the normal harvest season for first cropping of palay in the region. The negative<br />
production performance can be attributed to lack of water (less rain) especially<br />
during the flowering stage resulting to a low yield. Lack of water also resulted to<br />
stunted growth and proliferation of tungro and heat-induced plant diseases.<br />
Corn production, on the other hand, increased significantly, i.e., 25% higher<br />
than Q3-04 and 44% greater than Q3-03. Lack of water for palay production<br />
probably pushed farmers to plant corn resulting to higher corn production for this<br />
year.<br />
Sugarcane production showed a decreasing trend of around 18%<br />
compared to the past two years. Crop diversification and conversion of sugar lands<br />
to other crops, especially in Negros Occidental mainly caused this declining<br />
sugarcane output in the region.<br />
Banana production is on the uptrend. Despite the lack of water this year,<br />
there was a modest 2% increase over 2004 level and a respectable 6% increase<br />
over 2003 level. Banana production (especially the high valued lakatan variety) has<br />
replaced sugarcane in some parts of central Iloilo as plantations also continued to<br />
expand in the provinces of Capiz, Negros Occidental and Aklan.<br />
3
Table 4<br />
Selected Production Indicators, Region <strong>VI</strong><br />
Third Quarter 2003, 2004 and 2005<br />
3rd 3rd 3rd Percent Percent<br />
INDICATOR Quarter Quarter Quarter Change Change<br />
2003 2004 2005 Over '03 Over '04<br />
A. Crops (MT)<br />
Palay 687,299 806,341 617,232 -10.2 -23.5<br />
Corn 67,896 78,276 97,831 44.1 25.0<br />
Sugarcane 390,692 390,848 321,412 -17.7 -17.8<br />
Banana 39,234 40,533 41,467 5.7 2.3<br />
Mango 3,810 3,252 3,754 -1.5 15.4<br />
Coconuts ('000 nuts) 125,972 124,009 124,358 -1.3 0.3<br />
B. Animal Slaughtering<br />
(MT-Liveweight)<br />
Carabao 4,500 4,532 4,087 -9.2 -9.8<br />
Cattle 6,538 6,092 5,711 -12.6 -6.3<br />
Swine 33,710 35,820 41,513 23.1 15.9<br />
Goat 1,532 1,514 1,281 -16.4 -15.4<br />
Chicken 14,261 15,155 16,446 15.3 8.5<br />
Duck 1,362 1,021 902 -33.8 -11.7<br />
C. Fisheries (MT)<br />
Commercial 34,639 30,457 29,794 -14.0 -2.2<br />
Municipal 28,611 29,755 31,317 9.5 5.2<br />
Aquaculture 39,299 39,102 38,383 -2.3 -1.8<br />
Source: Bureau of Agricultural Statistics, Region 6<br />
Mango production in the region ranges between 3-4 million MT. For this<br />
period, output increased by 15% compared last year, but lower by 1% compared to<br />
2003 level. Mango production may be expected to increase over time as<br />
plantations expand as a result of crop diversification from sugarcane.<br />
Coconut production, on the other hand, widely ranges between 124-126<br />
million nuts for whole region. This period’s output increased insignificantly (0.3%)<br />
compared last year and decreased, also insignificantly (1%), compared to 2003<br />
level. Coconut output may not be expected to dramatically increase over time<br />
considering the continuous increasing demand for the cheap coconut lumber vis-àvis<br />
efforts of the government to expand planting of high yielding varieties all over<br />
the region.<br />
B. Animal Slaughtering<br />
Livestock and poultry production based on number slaughtered for<br />
consumption during this period, generally decreased compared to the previous<br />
two years, except for swine and chicken.<br />
Carabao and cattle slaughtering declined even as demand is increasing<br />
due to population. Factors like declining pastures and low incomes may be the<br />
main causes of this trend. Likewise, goat production also showed a steady<br />
decline. On the other hand, swine production steadily increased as, probably, it<br />
represents the cheaper alternative for meat and fish consumption. Moreover,<br />
backyard swine production has become a steady source of income for<br />
households as it is not affected by shrinking and drying pastures.<br />
Chicken slaughtering showed an increasing trend over the last two years.<br />
A bumper corn production in the region could have significantly contributed to the<br />
increase of chicken production. In contrast, duck production showed a<br />
dramatically decreasing trend. This could be largely due to drying up of irrigation<br />
canals and paddy fields – the main support system of duck-raising.<br />
4
C. Fishery<br />
Commercial fishing, allowed beyond the 15-km-from-shore municipal<br />
fishing boundary, showed a declining trend over the three-year period. Declining<br />
fish catch could be the result of unsustainable practices such as the use of fine<br />
mesh nets and coral destroying gears.<br />
On the other hand, municipal fishing has an increasing trend. The<br />
resurgence of shellfish production, especially angel wings or diwal in Capiz over<br />
the last two years, could have contributed to this increased output.<br />
Aquaculture output in the region, which is mainly production from inland or<br />
river-based ponds, ranged between 38,000-40,000 MT. The slight production<br />
decline over three years could be contributed by pollution and constriction of<br />
river flows due to siltation.<br />
4. Investments<br />
Total private investments through the Business Name Registration (BNR)<br />
for 3rd quarter 2005 increased by 13.4% compared to the same quarter last<br />
year. A total of 414 firms registered during the quarter compared to 494 firms<br />
registered on the previous quarter. Capiz posted the highest increase of 292%<br />
followed by Negros Occidental with 31% and by Aklan with 26%. Guimaras had<br />
the biggest decrease in investments of 42.5%. The registration of a memorial<br />
park, commercial establishment and a rice mill contributed to the high investment<br />
level in Capiz for this quarter.<br />
Table 5<br />
Private Investment, Region <strong>VI</strong><br />
Third Quarter 2004, Second and Third Quarters 2005<br />
3rd 2nd 3rd Percent Percent<br />
INDICATOR Quarter Quarter Quarter Change Change<br />
2004 2005 2005 Over Q2 '05 Over Q3 '04<br />
Business Name Registration 1,846.1 1,791.3 2,093.0 16.8 13.4<br />
(In Million Pesos)<br />
Aklan 80.0 137.0 100.8 -26.4 26.0<br />
Antique 46.9 40.5 38.2 -5.7 -18.6<br />
Capiz 66.1 85.5 258.9 203.0 291.4<br />
Guimaras 39.5 25.3 22.7 -10.4 -42.5<br />
Iloilo 892.8 378.7 727.8 92.2 -18.5<br />
Negros Occidental 720.8 1,124.3 944.6 -16.0 31.0<br />
Source: Department of Trade and Industry, Region 6<br />
5. Tourist Arrival and Receipts<br />
Seasonal differences also affect tourism. Compared to 2004 levels, tourist<br />
arrivals and receipts in 2005 increased by around 13% and 29%, respectively.<br />
However, this is lower than the previous quarter of same year. While foreign<br />
tourists increased from 2 nd to 3 rd quarter probably due to vacation timing (July-<br />
August is school break in the USA), domestic tourists largely declined because<br />
3 rd quarter is already a rainy season. Domestic tourists comprise the bulk of<br />
tourism in the region, about 84% and 72% of arrivals in the 2 nd and 3 rd quarters<br />
of 2005, respectively.<br />
5
Table 6<br />
Tourist Arrivals and Receipts, Region <strong>VI</strong><br />
Third Quarter 2004, Second and Third Quarters 2005<br />
3rd 2nd 3rd Percent Percent<br />
INDICATOR Quarter Quarter Quarter Change Change<br />
2004 2005 2005 Over Q2 '05 Over Q3 '04<br />
Total Tourist Arrivals 173,695 297,752 197,085 -33.8 13.5<br />
Domestic 101,003 249,281 141,519 -43.2 40.1<br />
Foreign 66,871 39,591 48,624 22.8 -27.3<br />
OFW 5,821 8,880 6,942 -21.8 19.3<br />
Receipts (Billion Pesos) 2.4 5.5 3.1 -42.5 29.3<br />
Source: Department of Tourism, Region 6<br />
II. DEVELOPMENT OUTLOOK<br />
1. Development Issues<br />
The discussion of potential and/or unique industries that may influence<br />
regional economic development has been revived in this issue of the QRES. This<br />
was made possible partly through the assistance of the GTZ for dovetailing of<br />
monitoring and evaluation efforts toward the regional development plan<br />
implementation and partly through the <strong>NEDA</strong> initiatives at the regional and<br />
national levels to improve the quarterly assessment of economic performance.<br />
Seven (7) commodities/industries are featured this quarter. From personal<br />
interviews with key informants and secondary data, a brief background is<br />
presented followed by the identification of development issues relative to the<br />
industry and the regional economy.<br />
A. Abalone<br />
The researchers of Southeast Asian Fisheries Development Center<br />
(SEAFDEC) based in Tigbauan, Iloilo have successfully spawned abalone (Haliotis<br />
Asinina) in captivity in 1994. This species is called by Australian scientists as the<br />
“fastest growing abalone in the world” and was proved here in the Philippines, in<br />
contrast to other countries like Australia, Japan, Mexico and New Zealand where<br />
similar species had been cultured.<br />
Local market demand for abalone has tremendously increased since<br />
1994. Most buyers are from Negros Occidental and high-end Chinese<br />
restaurants in Manila where abalone sells at P2,000 to P2,500 per plate.<br />
Like other fish stocks, however, abalone suffers from heavy fishing<br />
pressure and SEAFDEC needs to refine its existing breeding and hatchery<br />
techniques to produce sufficient seeds for re-stocking and to help restore the<br />
natural abalone population in the region. SEAFDEC has very limited resources to<br />
directly disseminate the technology to small fisherfolk. Hence, it banks on the<br />
cooperation of BFAR and interested private groups and local government units<br />
for partnering. Currently, several municipalities in the region have started<br />
abalone production with the help of some business groups or non-government<br />
organizations.<br />
6
B. Angel Wings Shellfish (Diwal)<br />
This delectable and high value shellfish, locally called Diwal due to its<br />
tongue-like projection and scientifically known as Pholas orientalis, has a long<br />
and dramatic history in the region, especially in Roxas City - the Seafood Capital<br />
of <strong>Western</strong> Visayas, where it abounds.<br />
The 1970s are considered the years of abundance of angel wings<br />
specifically growing in the inter-tidal zone (Barra) near the mouth of Palina and<br />
Panay rivers. Production was year-round at average selling price of 5 centavos<br />
per piece. In 1980-1986, harvesting became seasonal, May-August only, at<br />
average selling price of 25 centavos per piece. In 1987, angel wings started to<br />
disappear at a time when prawn became a sunrise industry. After a 5-year<br />
hiatus, a 1-ha angel wings population was found in an area (Punta Cogon) very<br />
far from its original growing site. Seasonal harvesting of limited quantity ensued<br />
until 1998. A study for policy and management purposes was conducted by UP<br />
Visayas with the support of the provincial government, PCAMRD and BFAR in<br />
1996. Transplantation was done to complete the one year intensive research. In<br />
1999, the city and provincial governments imposed the ban for collection of angel<br />
wings and Kapis – another valuable shellfish in Roxas City. In 2003, angel wings<br />
re-appeared in Barra. Production and collection of angel wings under the city’s<br />
Coastal Resource Management (CRM) Program highlighted the lifting of the ban<br />
in 2004. In July 2005, Roxas City successfully conducted the first Diwal Harvest<br />
Seafood Festival. In 2004, around 15 MT was harvested. In 2005, it reached<br />
almost 64 MT and sold at an average of P150/kg. According to Ms. Belinda<br />
Garrido, the CRMP Coordinator, God replenished Roxas City waters with<br />
abundant growth of diwal, so they are duty and faith bound to protect it.<br />
The following causes were cited for the disappearance of angel wings: 1)<br />
pollution from chemical discharges of prawn ponds; 2) trawling in traditional<br />
growing areas; 3) over-harvesting of undersized angel wings; 4) strong waves<br />
and current covered growing areas with sand leading to death of species; 5)<br />
diseases and predators; 6) use of cyanide and dynamite in municipal fishing; 7)<br />
siltation due to upland erosion and proliferation of structures in riverine areas.<br />
The re-appearance of angel wings are attributed to these factors: 1) use<br />
of chemicals abated when most fishpond owners went back to traditional bangus<br />
culture when the prawn industry got to losing end; and 2) LGU efforts to<br />
rehabilitate the resource through transplantation, moratorium on shellfish<br />
gathering in 1999-2003, and establishment of shellfish reservation zone with the<br />
passing of a new CRM ordinance and guidelines on angel wings management.<br />
In order to sustain the increase in annual harvest of angel wings, the city<br />
government resolves to: 1) encourage divers to become responsible stewards<br />
through continuous advocacy and education campaign; 2) strengthen and widen<br />
the multi-sectoral participation in the CRM program; 3) address siltation problem<br />
in Barra area through a comprehensive approach involving the upland<br />
communities; 4) ensure that enough volume of breeders are left in growing areas<br />
after harvest season; and 5) strict implementation of applicable fishery and<br />
environmental laws and rules.<br />
C. Furniture<br />
Production of furniture in the region this year was estimated to be about<br />
25% less than last year. The number of buyers also decreased by about 35%<br />
based on bookings and negotiated sales during local furniture shows. This is the<br />
general status of the regional furniture industry according to Ms. Marianne<br />
Tajanlangit, Executive Director of the Iloilo Furniture Manufacturing Association.<br />
7
The rising cost of oil prices caused raw materials to increase making the<br />
country, in general, less competitive with other furniture manufacturing countries<br />
like China and Vietnam. Political instability and the worldwide economic slump<br />
were also cited as factors affecting the industry.<br />
Iloilo could be as competitive as Cebu in terms of product development<br />
and design. It has an advantage over the latter in the availability of local<br />
materials for furniture development such as bamboo and rattan. Joining<br />
internationally organized furniture shows (especially the rich European Union<br />
market) would boost the sales of Iloilo furniture producers. Along this line,<br />
government assistance is vital not just for the furniture industry, but also for<br />
handicrafts export industry.<br />
D. Gamefowl<br />
The gamefowl industry contributes around P8-10 billion annually to the<br />
national economy. If feeds and veterinary products supporting the gamefowl<br />
industry are included, the national economic contribution could reach up to P30-<br />
40 billion per year. This is the significance of gamefowls to the economy<br />
according to Mr. Ricardo Palmares, President of the National Federation of<br />
Gamefowl Breeders Associations and the Panay-Guimaras Gamefowl Breeders<br />
Association.<br />
Production of gamefowls from commercial farms (>100 fowls) in Region<br />
<strong>VI</strong> has decreased by half (50%) over the last 2 years. This was mainly due to<br />
the proliferation of small and backyard breeders now comprising around 90% of<br />
regional and national breeders. Likewise, cockers who are normally buyers of<br />
ready-to-fight fowls started to breed their own fowls. Industry-wide, though<br />
gamefowl production is increasing every year. As a result there are more<br />
cockfights but lesser sales of gamefowls.<br />
A commercial farm economically supports 3-4 families on the average.<br />
The Federation has now 1,500 individual members representing 12 associations<br />
all over the country.<br />
The ban of gamefowl breeding in the USA, save for just two states, opens<br />
an export potential for local breeders to markets like Malaysia, Indonesia, Macau<br />
and Mexico. In order to promote this, the government should lift restrictions on<br />
gamefowl exports. On the other hand, the local feeds and veterinary businesses<br />
like Thunderbird have already started exporting their products.<br />
Gamefowls breeding and cockfighting to remain as a decent and viable<br />
industry should be promoted, as being done by the Federation, as a sport and<br />
tourist-attracting industry and not as a mere gambling industry. The Federation<br />
strives to encourage breeders, big or small, to formally join the associations<br />
where teachings of good values and attitudes formation are promoted.<br />
E. Handmade Paper<br />
There is a pioneering handmade paper industry in the region - Creative<br />
Paper, owned by Mr. Davy John Barlin based in San Miguel, Iloilo. The business<br />
started operating in 1993 with 40 personnel. Raw materials used are abaca and<br />
salago, a weed mostly found in Aklan province.<br />
Production peaked to almost 20,000 sheets in 2004, but it produced only<br />
half in 2005. Demand for handmade paper declined with the emergence of<br />
fancy paper. In order to stay competitive in the industry, a foreign-made<br />
8
machine costing around P150 million is needed by Creative Paper to produce<br />
fancy paper which is currently growing in demand.<br />
The export potential of handmade or fancy paper is great considering the<br />
quality and uniqueness of the product made from locally available materials<br />
providing a backward linkage to abaca farming and production of other local<br />
fibers.<br />
F. Muscovado<br />
G. Silk<br />
In 1970s Antique is one of the leading producers of muscovado sugar in the<br />
Philippines. The muscovado producers formed the Antique Muscovado Sugar<br />
Producers Association which was later reorganized into the Antique Livelihood<br />
Development, Inc. with assistance from DTI. A grant from DTI-SMED Project<br />
made possible the implementation of a two-year Antique Muscovado Sugar<br />
Industry Assistance Program.<br />
In 2001, the Antique Muscovado Sugar Producers Marketing Cooperative<br />
was organized with the installation of a marketing system, again with the help of<br />
DTI. The cooperative was strengthened in 2004 with the help of the Provincial<br />
Cooperative Development Office. There are eight (8) municipalities that are into<br />
muscovado sugar production. The Municipality of Laua-an is the leading producer<br />
with the most number of milling facilities that are all village type sugar mills and<br />
small processing facilities directly employing the local people.<br />
Muscovado production is increasing with 35 MT in 2003, 40 MT in 2004<br />
and more expected in 2005. However, it is still insufficient to meet the growing<br />
domestic and foreign market demands. El Maestro is a company in Antique now<br />
packaging high quality muscovado for export to California, USA. Only 3 out of<br />
112 mills are producing export grade muscovado for this venture. Alter Trade of<br />
Bacolod City buys most of the sugars produced by other millers. There is also a<br />
growing demand for organically produced muscovado.<br />
The provincial government of Antique provides financial and marketing<br />
assistance to the industry, making it the banner project/commodity of Antique.<br />
Agencies like the DTI, DOST and SRA continue to assist the industry. However,<br />
upgrading of old mills, technology dissemination and insufficient financial<br />
assistance to planters and millers remain as priority areas of support for the<br />
muscovado industry in Antique.<br />
<strong>Western</strong> Visayas is the largest silk producing region in the country today<br />
contributing 80-85% of annual supply according to Mrs. Thelma Watanabe,<br />
Manager of the Organization for Industrial, Spiritual and Cultural Advancement<br />
(OISCA), a Japanese-assisted NGO based in Bago City, Negros Occidental.<br />
OISCA supplied almost all the silk used in the Philippine Pavilion that won in the<br />
2005 World Expo in Aichi, Japan.<br />
In 2004, OISCA produced 1.7 MT compared to almost 4 MT in 2003. Two<br />
big local cocoon producers laid low when OISCA technicians assisting them<br />
transferred to other groups. Coupled with unfavorable weather, it led to low<br />
production in 2004. A 5 MT production is expected next year. Silk thread and<br />
yarn demands are strong within Region <strong>VI</strong> itself. About 90% of OISCA silk goes<br />
to Aklan and 3% to Iloilo for weaving into textiles in combination with husi, piña,<br />
hablon and other materials. Only 7% is sold to Jeanne Goulbourne in Manila.<br />
The demand for silk dramatically increased after OISCA participated in the<br />
WOW Philippines exposition held in Intramuros, Manila in 2003.<br />
9
The industry has strong support from the city of Bago and the province of<br />
Negros Occidental. The Governor of Negros Occidental gave OISCA a P3 million<br />
soft loan for silkworm farmers. An earlier loan of P7 million from JICA enabled<br />
OISCA to expand assistance from 50 to 120 farmers. With the continuous<br />
support of the LGU and the right attitude of the farmers, the industry could really<br />
improve the lives of silkworm farmers.<br />
Sericulture should be promoted as a priority industry in the region. A JICA<br />
study found that OISCA silk could compete with Japanese silk in Japan market.<br />
Importing silk worm eggs from Japan would facilitate expansion of local silk<br />
production possibilities.<br />
2. Recommendations<br />
The following policy recommendations were derived during key<br />
informants’ interviews about the national economy and as a follow through of<br />
issues on the development of potential/unique commodities/industries in the<br />
region for this quarter.<br />
Generally, it is recommended that government financial and technical<br />
support should be focused more into ventures that promote high value<br />
agriculture and agriculture-based products for domestic and foreign markets.<br />
Political problems should not serve as hindrance to the development of national<br />
or local economies. Hence, it should not be the main focus of governance.<br />
Region <strong>VI</strong> has distinct advantages with the commodities/industries<br />
featured in this report. Silk could be produced anywhere in the country, but<br />
OISCA had established the local silkworm breeding technology in Bago City<br />
producing quality silk that could even be exported to Japan. The expansion of<br />
this venture into adjacent areas in Negros Occidental should be given priority<br />
over other areas. In support of the sericulture industry, the DA and DTI may look<br />
into liberalization of silkworm breeders trading especially between the Philippines<br />
and Japan.<br />
Muscovado maybe produced in any sugarmill across the country today,<br />
but the sugar base in Antique has unique qualities that pull traders toward the<br />
province. The Sugar Regulatory Agency is currently stationed in Bacolod City<br />
which is far away from Laua-an where most muscovado mills are located.<br />
Besides financial and marketing support, Antique needs technicians to improve<br />
its sugar output from the cane to muscovado with a quality that is specially<br />
acceptable in the international markets.<br />
Local weaving materials are abundant in the region and their potentials<br />
should be fully harnessed in fashion, handicrafts and furniture industries. A set of<br />
clear and attractive investment incentives package by local governments for the<br />
private sector could readily give impetus for these ventures. Government support<br />
should be continued and intensified in the fields of technology, marketing and<br />
enterprise development. Trade liberalization should facilitate lowering of input<br />
costs in these industries while at the same time strengthening the country’s<br />
position in the world market for the products.<br />
The region, particularly Roxas City has a clear comparative advantage on<br />
angel wings production. With SEAFDEC’s presence in the region, we have a<br />
competitive advantage in abalone production. These two products could make<br />
the economy shine even with just local efforts, especially if government and<br />
business sectors put their heads and resources together on this matter.<br />
10
The gamefowl industry should be allowed to emerge and promoted as a<br />
tourist attraction venture. It has a very strong and wide backward linkage to<br />
agriculture and industrial sectors. Production of feed components should be<br />
import-substituting; veterinary products developed locally could be exported; and<br />
amenities offer a wide range of possibilities like fruit production complementing<br />
gamefowl breeding farms enhancing forestry areas for eco- or farm-tourism. This<br />
industry should be looked more closely by government agencies like the DOT,<br />
DOST, DENR, DA and DLR, among others.<br />
The LGUs with the support of business and private groups should take the<br />
opportunity with these commodities/industries to prove to the national<br />
government that they could initiate and manage viable enterprises toward<br />
greater decentralization.<br />
11