2006 Annual Report - Lopez Holdings Corporation
2006 Annual Report - Lopez Holdings Corporation
2006 Annual Report - Lopez Holdings Corporation

Create successful ePaper yourself
Turn your PDF publications into a flip-book with our unique Google optimized e-Paper software.
48<br />
A n n u a l R e p o r t 2 0 0 6<br />
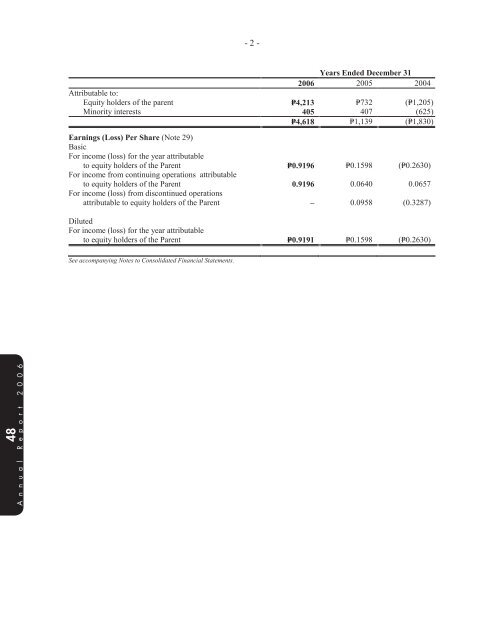
- 2 -<br />
<strong>2006</strong><br />
Years Ended December 31<br />
2005 2004<br />
Attributable to:<br />
Equity holders of the parent P=4,213 P=732 (P=1,205)<br />
Minority interests 405 407 (625)<br />
P=4,618 P=1,139 (P=1,830)<br />
Earnings (Loss) Per Share (Note 29)<br />
Basic<br />
For income (loss) for the year attributable<br />
to equity holders of the Parent P=0.9196 P=0.1598 (P=0.2630)<br />
For income from continuing operations attributable<br />
to equity holders of the Parent 0.9196 0.0640 0.0657<br />
For income (loss) from discontinued operations<br />
attributable to equity holders of the Parent – 0.0958 (0.3287)<br />
Diluted<br />
For income (loss) for the year attributable<br />
to equity holders of the Parent P=0.9191 P=0.1598 (P=0.2630)<br />
See accompanying Notes to Consolidated Financial Statements.<br />
*SGVMC209576*<br />
BENPRES HOLDINGS CORPORATION AND SUBSIDIARIES<br />
CONSOLIDATED STATEMENTS OF CHANGES IN EQUITY<br />
(Amounts in Millions)<br />
Capital<br />
Stock<br />
(Note 31)<br />
Total Equity Attributable to Equity Holders of the Parent<br />
Additional<br />
Paid-In<br />
Share in<br />
Equity<br />
Adjustment<br />
from<br />
Translation<br />
Unrealized<br />
Gain on<br />
Fair Value<br />
Adjustments<br />
of Availablefor-sale<br />
Investments Deficit Total<br />
Minority Total<br />
Capital<br />
Interests Equity<br />
At December 31, 2005<br />
Equity adjustment from<br />
P=4,581 P=6,766 P=233 P=396 (P=9,239) P=2,737 P=5,946 P=8,683<br />
translation during the year<br />
Adjustment for unrealized gain<br />
on fair value adjustment of<br />
– – (722) – – (722) (132) (854)<br />
available-for-sale investments<br />
Total expense for the year<br />
– – – 635 – 635 – 635<br />
directly recognized in equity – – (722) 635 – (87) (132) (219)<br />
Net income for the year – – – – 4,213 4,213 405 4,618<br />
Issuance of treasury shares<br />
Total income and expense<br />
– – – – – – 22 22<br />
for the year – – ( 722) 635 4,213 4,126 295 4,421<br />
At December 31, <strong>2006</strong> P=4,581 P=6,766 (P=489) P=1,031 (P=5,026) P=6,863 P=6,241 P=13,104<br />
At December 31, 2004, as<br />
reported P=4,581 P=6,766 P=820 P=– (P=10,214) P=1,953 P=6,030 P=7,983<br />
Effect of adoption of PAS 39<br />
(Note 4) – – 77 1,044 243 1,364 29 1,393<br />
At December 31, 2004, as<br />
restated 4,581 6,766 897 1,044 (9,971) 3,317 6,059 9,376<br />
Equity adjustment from<br />
translation during the year – – (664) – – (664) (43) (707)<br />
Adjustment for unrealized gain<br />
on fair value adjustment of<br />
available-for-sale investments – – – (648) – (648) – (648)<br />
Total expense for the year<br />
directly recognized in equity – – (664) (648) – (1,312) (43) (1,355)<br />
Net income for the year – – – – 732 732 407 1,139<br />
Total income and expense<br />
for the year – – (664) (648) 732 (580) 364 ( 216)<br />
Minority interest attributable to<br />
deconsolidated subsidiary – – – – – – (477) (477)<br />
At December 31, 2005 P=4,581 P=6,766 P=233 P=396 (P=9,239) P=2,737 P=5,946 P=8,683<br />
At December 31, 2003 P=4,581 P=6,766 P=53 P=– (P=9,009) P=2,391 P=6,489 P=8,880<br />
Equity adjustment from<br />
translation during the year – – 767 – – 767 3 770<br />
Net loss for the year – – – – (1,205) (1,205) (625) (1,830)<br />
Total income and expense<br />
for the year – – 767 – (1,205) (438) (622) (1,060)<br />
Minority interest – – – – – – 88 88<br />
Deposit for future stock<br />
subscription – – – – – – 287 287<br />
Dividends – – – – – – (212) (212)<br />
At December 31, 2004 P=4,581 P=6,766 P=820 P=– (P=10,214) P=1,953 P=6,030 P=7,983<br />
See accompanying Notes to Consolidated Financial Statements.<br />
A n n u a l R e p o r t 2 0 0 6<br />
49