

CITIC Securities (600030; RMB29
CITIC Securities (600030; RMB29
CITIC Securities (600030; RMB29

You also want an ePaper? Increase the reach of your titles
YUMPU automatically turns print PDFs into web optimized ePapers that Google loves.
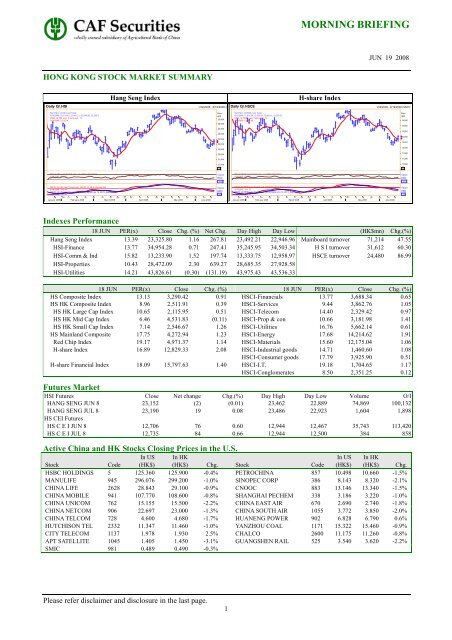
HONG KONG STOCK MARKET SUMMARY<br />
Hang Seng Index H-share Index<br />
MORNING BRIEFING<br />
JUN 19 2008<br />
Daily Q/.HSI 1/22/2008 - 6/19/2008 (G Daily Q/.HSCE 1/22/2008 - 6/19/2008 (GMT)<br />
BarOHLC, Q/.HSI, Last Trade<br />
6/18/2008, 23,114.45, 23,492.21, 22,946.96, 23,325.8<br />
WMA, Q/.HSI, Last Trade(Last), 10<br />
6/18/2008, 23,223.4<br />
RSI, Q/.HSI, Last Trade(Last), 14, Wilder Smoothing<br />
6/18/2008, 40.318<br />
MACD, Q/.HSI, Last Trade(Last), MACD 12, 26, 9, Exponential<br />
6/18/2008, -500.42<br />
MACD, Q/.HSI, Last Trade(Last), MACD Signal Line 12, 26, 9, Exponential<br />
6/18/2008, -382.41<br />
28 04 11 18 25 03 10 17 25 31 07 14 21 28 05 13 19 26 02 10 16<br />
January 2008 February 2008 March 2008 April 2008 May 2008 June 2008<br />
Please refer disclaimer and disclosure in the last page.<br />
Price<br />
HKD<br />
25,500<br />
25,000<br />
24,500<br />
24,000<br />
23,500<br />
23,000<br />
22,500<br />
22,000<br />
21,500<br />
21,000<br />
.12<br />
Value<br />
HKD<br />
.123<br />
Value<br />
HKD<br />
.12<br />
1<br />
BarOHLC, Q/.HSCE, Last Trade<br />
Price<br />
6/18/2008, 12,616.58, 12,935.24, 12,480.42, 12,829.33<br />
HKD<br />
WMA, Q/.HSCE, Last Trade(Last), 10<br />
6/18/2008, 12,687.49 14,000<br />
13,600<br />
13,200<br />
12,800<br />
12,400<br />
12,000<br />
11,600<br />
11,200<br />
10,800<br />
.12<br />
RSI, Q/.HSCE, Last Trade(Last), 14, Wilder Smoothing<br />
6/18/2008, 43.465<br />
MACD, Q/.HSCE, Last Trade(Last), MACD 12, 26, 9, Exponential<br />
6/18/2008, -301.33<br />
MACD, Q/.HSCE, Last Trade(Last), MACD Signal Line 12, 26, 9, Exponential<br />
6/18/2008, -211.03<br />
28 04 11 18 25 03 10 17 25 31 07 14 21 28 05 13 19 26 02 10 16<br />
January 2008 February 2008 March 2008 April 2008 May 2008 June 2008<br />
Indexes Performance<br />
18 JUN PER(x) Close Chg. (%) Net Chg. Day High Day Low (HK$mn) Chg.(%)<br />
Hang Seng Index 13.39 23,325.80 1.16 267.81 23,492.21 22,946.96 Mainboard turnover 71,214 47.55<br />
HSI-Finance 13.77 34,954.28 0.71 247.41 35,245.95 34,503.34 H S I turnover 31,612 60.30<br />
HSI-Comm & Ind 15.82 13,233.90 1.52 197.74 13,333.75 12,958.97 HSCE turnover 24,480 86.99<br />
HSI-Properties 10.43 28,472.09 2.30 639.27 28,685.35 27,928.58<br />
HSI-Utilities 14.21 43,826.61 (0.30) (131.19) 43,975.43 43,536.33<br />
18 JUN PER(x) Close Chg. (%) 18 JUN PER(x) Close Chg. (%)<br />
HS Composite Index 13.13 3,290.42 0.91 HSCI-Financials 13.77 3,688.34 0.65<br />
HS HK Composite Index 8.96 2,511.91 0.39 HSCI-Services 9.44 3,862.76 1.05<br />
HS HK Large Cap Index 10.65 2,115.95 0.51 HSCI-Telecom 14.40 2,329.42 0.97<br />
HS HK Mid Cap Index 6.46 4,531.83 (0.11) HSCI-Prop & con 10.66 3,181.98 1.41<br />
HS HK Small Cap Index 7.14 2,546.67 1.26 HSCI-Utilities 16.76 5,662.14 0.61<br />
HS Mainland Composite 17.75 4,272.94 1.23 HSCI-Energy 17.68 14,214.62 1.91<br />
Red Chip Index 19.17 4,971.37 1.14 HSCI-Materials 15.60 12,175.04 1.06<br />
H-share Index 16.89 12,829.33 2.08 HSCI-Industrial goods 14.71 1,460.60 1.08<br />
HSCI-Consumer goods 17.79 3,925.90 0.51<br />
H-share Financial Index 18.09 15,797.63 1.40 HSCI-I.T. 19.18 1,704.65 1.17<br />
HSCI-Conglomerates 8.50 2,351.25 0.12<br />
Futures Market<br />
HSI Futures Close Net change Chg.(%) Day High Day Low Volume O/I<br />
HANG SENG JUN 8 23,152 (2) (0.01) 23,462 22,889 74,869 100,132<br />
HANG SENG JUL 8 23,190 19 0.08 23,486 22,923 1,604 1,898<br />
HS CEI Futures<br />
HS C E I JUN 8 12,706 76 0.60 12,944 12,467 35,743 113,420<br />
HS C E I JUL 8 12,735 84 0.66 12,944 12,500 384 858<br />
Active China and HK Stocks Closing Prices in the U.S.<br />
In US In HK In US In HK<br />
Stock Code (HK$) (HK$) Chg. Stock Code (HK$) (HK$) Chg.<br />
HSBC HOLDINGS 5 125.360 125.900 -0.4% PETROCHINA 857 10.498 10.660 -1.5%<br />
MANULIFE 945 296.076 299.200 -1.0% SINOPEC CORP 386 8.143 8.320 -2.1%<br />
CHINA LIFE 2628 28.843 29.100 -0.9% CNOOC 883 13.146 13.340 -1.5%<br />
CHINA MOBILE 941 107.770 108.600 -0.8% SHANGHAI PECHEM 338 3.186 3.220 -1.0%<br />
CHINA UNICOM 762 15.155 15.500 -2.2% CHINA EAST AIR 670 2.690 2.740 -1.8%<br />
CHINA NETCOM 906 22.697 23.000 -1.3% CHINA SOUTH AIR 1055 3.772 3.850 -2.0%<br />
CHINA TELCOM 728 4.600 4.680 -1.7% HUANENG POWER 902 6.828 6.790 0.6%<br />
HUTCHISON TEL 2332 11.347 11.460 -1.0% YANZHOU COAL 1171 15.322 15.460 -0.9%<br />
CITY TELECOM 1137 1.978 1.930 2.5% CHALCO 2600 11.175 11.260 -0.8%<br />
APT SATELLITE 1045 1.405 1.450 -3.1% GUANGSHEN RAIL 525 3.540 3.620 -2.2%<br />
SMIC 981 0.489 0.490 -0.3%<br />
Value<br />
HKD<br />
.123<br />
Value<br />
HKD<br />
.12
MORNING BRIEFING<br />
CHINA STOCK MARKET SUMMARY<br />
CSI 300 Index SSEC Index (left) vs H-share Index (right)<br />
Daily Q/.CSI300 1/21/2008 - 6/19/2008 (GMT)<br />
BarOHLC, Q/.CSI300, Last Trade<br />
6/18/2008, 2,820.237, 3,007.18, 2,759.107, 2,991.273<br />
WMA, Q/.CSI300, Last Trade(Last), 10<br />
6/18/2008, 3,055.342<br />
RSI, Q/.CSI300, Last Trade(Last), 14, Wilder Smoothing<br />
6/18/2008, 30.435<br />
MACD, Q/.CSI300, Last Trade(Last), MACD 12, 26, 9, Exponential<br />
6/18/2008, -217.567<br />
MACD, Q/.CSI300, Last Trade(Last), MACD Signal Line 12, 26, 9, Exponential<br />
6/18/2008, -158.213<br />
21 28 04 13 18 25 03 10 17 24 31 07 14 21 28 05 12 19 26 02 10 16<br />
January 2008 February 2008 March 2008 April 2008 May 2008 June 2008<br />
Please refer disclaimer and disclosure in the last page.<br />
Price<br />
CNY<br />
5,000<br />
4,800<br />
4,600<br />
4,400<br />
4,200<br />
4,000<br />
3,800<br />
3,600<br />
3,400<br />
3,200<br />
3,000<br />
.123<br />
Value<br />
CNY<br />
.123<br />
Value<br />
CNY<br />
.123<br />
2<br />
JUN 19 2008<br />
Daily Q/.HSCE, Q/.SSEC 1/22/2008 - 6/19/2008 (GMT)<br />
Price<br />
CNY<br />
Line, Q/.HSCE, Last Trade(Last)<br />
6/18/2008, 12,829.33<br />
Line, Q/.SSEC, Last Trade(Last)<br />
6/18/2008, 2,941.115<br />
4,600<br />
4,500<br />
4,400<br />
HSCE (R)<br />
4,300<br />
4,200<br />
4,100<br />
4,000<br />
3,900<br />
3,800<br />
3,700<br />
3,600<br />
SSEC (L)<br />
3,500<br />
3,400<br />
3,300<br />
3,200<br />
3,100<br />
3,000<br />
2,900<br />
.123<br />
28 04 11 18 25 03 10 17 25 31 07 14 21 28 05 13 19 26 02 10 16<br />
January 2008 February 2008 March 2008 April 2008 May 2008 June 2008<br />
18 JUN Turnover(mn) Chg. 18 JUN Close Chg.<br />
Shanghai A share RMB68,695 57.6% CSI300 ENERGY 4,097.71 6.75%<br />
Shenzhen A share RMB33,555 43.1% CSI300 FINANCIAL 4,317.76 4.49%<br />
Total A-share RMB102,250 52.5% CSI300 MATERIAL 3,042.43 5.78%<br />
Shanghai B share US$48.5 39.3% CSI300 INDUSTRY 2,508.43 5.61%<br />
Shenzhen B share HK$246 1.3% CSI300 CD 2,650.57 4.74%<br />
Close Chg. CSI300 CS 4,383.85 4.55%<br />
CSI300 INDEX 2,991.27 5.23% CSI300 HEALTH C 3,243.50 4.89%<br />
SSE COMPOSITE 2,941.12 5.24% CSI300 IT 1,415.83 5.19%<br />
SSE A SHARE INDEX 3,085.44 5.24% CSI300 TS 2,747.33 4.84%<br />
SSE B SHARE INDEX 218.32 4.81% CSI300 UTILITIES 2,001.46 4.81%<br />
SZSE A SHARE INDEX 883.09 5.19%<br />
SZSE B SHARE INDEX 493.15 2.86%<br />
MARKET OVERVIEW:<br />
Major indices in the US tumbled on Wednesday due to concerns on financial sector and FedEx Corps’s warning of<br />
weakening demand. Morgan Stanley’s Q2 earnings fell 61%YoY while the regional bank Fifth Third Bancorp<br />
plans to raise US$1bn capital; the financial sector dropped by 1.21%. FedEx reported worse-than-expected Q2<br />
earnings citing slowing demand and surging energy price. Crude oil for July delivery rose and was trading at<br />
US$136.26/barrel this morning.<br />
The Dow and S&P dropped 131.24 and 13.12 to 12,029 and 1,338 respectively. Comparing ADR to HK’s last<br />
closing price, HSBC, China Life and China Mobile dropped 0.4%, 0.9% and 0.8% respectively. We expect the<br />
HSI will open lower this morning to test 23,100.<br />
EIA reported that oil and gasoline inventories fell for the fifth week, which leads to a climb in oil price in the<br />
Nymex. The 200 days MV of crude oil for July delivery reached over 100 for the first time. But we also notice<br />
that it has failed to breakthrough US$140/barrel for 4 times; while oil prices volatility increased. Oil price will<br />
find support at US$132/barrel in the short term and strong resistance at US$140/barrel. Since oil price will<br />
fluctuate at high levels, it will provide certain support to oil producers but it also adds volatility to these shares.<br />
Oil price (30 days) Oil price (180 days)<br />
Price<br />
HKD<br />
14,400<br />
14,200<br />
14,000<br />
13,800<br />
13,600<br />
13,400<br />
13,200<br />
13,000<br />
12,800<br />
12,600<br />
12,400<br />
12,200<br />
12,000<br />
11,800<br />
11,600<br />
11,400<br />
11,200<br />
11,000<br />
.12<br />
Analyst: Lee Oi Yee, Lisa
MORNING BRIEFING<br />
JUN 19 2008<br />
AH SHARE SECTOR:<br />
The A-share market rebounded as expected yesterday. The CSI 300 Index rallied 5.23% to 2,991, snapping<br />
record decline. And the H-share index also was boosted up 2.08% to 12,829.The CSI 300 energy sector was the<br />
top gainer due to the surge of heavily weighted Sinopec on the speculation that the government will ease the oil<br />
price control soon.<br />
Warning: Sinopec H-share (386; HK$8.32) surged 14.6% within this week, against the 3.25% gain of H-share<br />
Index and 0.41% gain of CSI 300 Index during the same period. However we notice that short selling turnover of<br />
Sinopec H-share accounted for 15.57% of its intraday turnover, increased from 6.57% on Wednesday and<br />
accounted for 9.9% of the total short selling turnover yesterday. We expect the short-term investors to take profit<br />
first if the news cannot realize soon. The short-term support of Sinopec H-share is at HK$7.7.<br />
H-share On 18/6 This week A-share On 18/6 This week<br />
Price H-share H-share Price A-share A-share<br />
(HK$) Price Chg(%) Price Chg(%) (RMB) Price Chg(%) Price Chg(%)<br />
857 601857 Petro China 10.66 3.50 6.92% 16.09 5.58 7.34%<br />
386 600028 Sinopec 8.32 7.77 14.60% 13.01 9.97 15.54%<br />
338 600688 Shanghai Pechem 3.22 4.89 9.90% 7.55 5.01 -2.45%<br />
Sinopec H-share(386)vs A-share(600028) Sinopec H-share (386) Bollinger Chart<br />
Although the CSI 300 Index rallied 5.23% yesterday, the largest intraday gain from 24 April and with the<br />
turnover surging 47.1%, we still concern on the momentum of the rebound. We expect that it is hard for the<br />
rebound to sustain without no new measures to boost the market as the liquidity problem and high CPI are<br />
concerned by the government. We do a statistical analysis about the technical rebound of CSI300 Index in 2008 as<br />
following.<br />
14-day RSI level 1 st rebounding day Trading days 14-day RSI level Total percentage of<br />
Date When rebound Price chg of Rebounding After rebound rebound<br />
22/1 30.4 4.7% 3 43.7 6.8%<br />
18/3 22.2 3.3% 3 35.6 7.3%<br />
27/3 30.1 4.5% 1 38.0 4.5%<br />
2/4 29.7 2.9% 3 44.0 9.7%<br />
17/6 20.3 5.2% - - -<br />
It showed that the technical rebound of CSI300 Index sustained no more than 3 trading days in the history and the<br />
biggest percentage of rebound was at 9.7%. If the market will follow its history we expect that 3,050 will be short<br />
term resistant level for the CSI300 Index. As for H-share index we see downside risk today with support level at<br />
12,400 as the June future of the H-share index was at 123 points lower than the spot.<br />
Please refer disclaimer and disclosure in the last page.<br />
3<br />
Analyst: Li Hong-ying, Vivian
MORNING BRIEFING<br />
JUN 19 2008<br />
Recap: The Index funds WISE CSI300 ETF (2827;HK$33.45) and A50 ChinaTracker (2823; HK$15.48),<br />
tracking CSI 300 Index and FTSE/Xinhua China A50 Index respectively, both rallied with surging turnover<br />
yesterday.<br />
Comment: We recommended above two index funds to speculate the technical rebound of the two<br />
underlying indexes. However we are concerned on the rebound momentum of A-shares. We calculate the<br />
Beta between the two index funds and the underlying indexes to try to find the linear relationship of them.<br />
If the short term resistant level for CSI300 is at 3,050 we expect the corresponding resistance level for<br />
CSI300 ETF to be at HK$34.4.If the short term resistant level for FTSE/Xinhua China A50 Index is at<br />
11,443 we expect the corresponding resistance for the A50 ChinaTracker to be at HK$15.9.<br />
On 17/6 Price premium to Underlying index Underlying index Corresponding<br />
Code Name Price chg N.A.V 30-day Beta Price chg(17/6) Short term resistance Index fund<br />
2823 A50 China Tracker 4.2% 7.8% 63.9% 4.7% 11,443 HK$15.9<br />
2827 WISE CSI300 ETF 4.0% 5.3% 72.2% 5.2% 3,050 HK$34.4<br />
CSI300 ETF (2827) vs CSI300 A50 ChinaTracker (2823) vs FTSE/Xinhua China A50 index<br />
Daily Q.CSI300, Q/2827.HK 2/4/2008 - 6/19/2008 (SHA)<br />
Price<br />
HKD<br />
46<br />
45<br />
44<br />
43<br />
42<br />
41<br />
40<br />
39<br />
38<br />
37<br />
36<br />
35<br />
34<br />
33<br />
.123<br />
Line, Q.CSI300, Last Trade(Last)<br />
6/18/2008, 2,991.273<br />
Line, Q/2827.HK, Last Quote(Last)<br />
6/18/2008, 33.45<br />
RSI, Q.CSI300, Last Trade(Last), 14, Wilder Smoothing<br />
6/18/2008, 30.435<br />
Vol, Q/2827.HK, Last Quote<br />
6/18/2008, 695,800<br />
04 13 18 25 03 10 17 24 31 07 14 21 28 05 12 19 26 02 10 16<br />
February 2008 March 2008 April 2008 May 2008 June 2008<br />
Please refer disclaimer and disclosure in the last page.<br />
Price<br />
CNY<br />
4,600<br />
4,400<br />
4,200<br />
4,000<br />
3,800<br />
3,600<br />
3,400<br />
3,200<br />
3,000<br />
.123<br />
Value<br />
CNY<br />
40<br />
20<br />
.123<br />
Volume<br />
HKD<br />
5M<br />
.1234<br />
4<br />
Daily Q.FTXIN9C, Q/2823.HK<br />
Price<br />
11/6/2007 - 6/19/2008 (BEI)<br />
HKD Line, Q.FTXIN9C, Last Trade(Last)<br />
Price<br />
25<br />
6/18/2008, 11,143.81<br />
Line, Q/2823.HK, Last Trade(Last)<br />
6/18/2008, 15.48<br />
CNY<br />
20,000<br />
24<br />
23<br />
22<br />
21<br />
20<br />
19<br />
18<br />
17<br />
19,000<br />
18,000<br />
17,000<br />
16,000<br />
15,000<br />
14,000<br />
13,000<br />
16<br />
12,000<br />
11,000<br />
.123<br />
.12<br />
RSI, Q.FTXIN9C, Last Trade(Last), 14, Wilder Smoothing<br />
6/18/2008, 32.131<br />
Vol, Q/2823.HK, Last Trade<br />
6/18/2008, 3.1408M<br />
12 19 26 03 10 17 24 02 07 14 21 28 04 18 25 03 10 17 24 31 07 14 21 28 05 12 19 26 02 10 16<br />
Nov 07 Dec 07 Jan 08 Feb 08 Mar 08 Apr 08 May 08 Jun 08<br />
Value<br />
CNY<br />
40<br />
20<br />
.123<br />
Volume<br />
HKD<br />
100M<br />
.1234<br />
Analyst: Li Hong-ying, Vivian<br />
Event: China and Japan made an agreement on Chunxiao field of East China Sea<br />
Comment: It is reported that China will allow Japan to invest in and share the profits from Chunxiao field, which<br />
has already explored by China. Although the Chunxiao field holds only 92 mn barrels of oil equivalent (20 days of<br />
CNOOC’s production), the agreement made a first step for further joint development of oil fields around the<br />
median line and are positive news to China Oilfield (2883; HK14.1) and CNOOC(883; HK13.34).<br />
An area east of a median line between the two nations holds about 3,260mn BOE, which are 1.25x BOE reserves<br />
that CNOOC holds. We have mentioned yesterday that the news has not yet realized; while China Oilfield<br />
followed by CNOOC will benefit from the news as there is high potential demand for deep sea drilling services on<br />
the dissolved oilfields,. China Oilfield rose 3.07% yesterday and we maintain our view that it will trade within<br />
HK13.1-14.8; while CNOOC rose 1.21% and will trade within HK13.0-14.2.<br />
Inpex (1605 JP) vs CNOOC (883 HK) China Oilfield (2883) vs CNOOC (883 HK)<br />
*Note: Inpex is the Japanese company with the right to explore East China Se<br />
Analyst: Lee Oi Yee, Lisa
MORNING BRIEFING<br />
JUN 19 2008<br />
Event: Ping An (2318:601318) posted a 28.9%YoY growth in life insurance premiums income to<br />
Rmb44.5bn for the first five months this year. During the same period, its P&C insurance premiums<br />
income increased by 31.3%YoY to Rmb12.0bn.<br />
Comment: We summarize the business performances of major listed insurers for the first five months this<br />
year in the following table.<br />
The life insurance premiums income growth of China Life and Ping An picked up in May. In contrast, life<br />
premiums income growth of China Pacific slowed down in May. As China Life and Ping An are the first<br />
and second largest life insurers in China, their strong performances for the first five months indicated that<br />
the life insurance sector keeps booming. However, the life insurance premiums growth rates of Ping An for<br />
the first five months this year or May are lower than its two peers China Life and China Pacific.<br />
In P&C insurance sector, Ping An achieved higher premiums income growth rate than its two peers PICC<br />
and China Pacific for the first five months this year or in May. If the growth rate of Ping An’s P&C business<br />
sustain, it will catch up China Pacific’s P&C business in coming months.<br />
As Ping An H-share (2318;61.25) is trading at 5.7% premium to the A-share (601318; Rmb51.07),<br />
short-term performance of Ping An H-share will be affected by the weak performance of Ping An A-share.<br />
Short-term major resistance of the H-share is at HK$68 with support at HK$55.5.<br />
Ping An (2318) Monthly Life Premiums Income (RMBmn)<br />
11,000<br />
10,000<br />
Ping An (2318)<br />
9,000<br />
12-month moving average<br />
8,000<br />
7,000<br />
6,000<br />
5,000<br />
4,000<br />
3,000<br />
Aug-04<br />
Dec-04<br />
Apr-05<br />
Aug-05<br />
Dec-05<br />
Apr-06<br />
Aug-06<br />
Dec-06<br />
Apr-07<br />
Aug-07<br />
Dec-07<br />
Apr-08<br />
3,500<br />
3,300<br />
3,100<br />
2,900<br />
2,700<br />
2,500<br />
2,300<br />
2,100<br />
1,900<br />
1,700<br />
1,500<br />
1,300<br />
1,100<br />
900<br />
700<br />
500<br />
Aug-04<br />
Ping An (2318) Monthly P&C Premiums Income (RMBmn)<br />
Dec-04<br />
Apr-05<br />
Ping An (2318)<br />
12-month moving average<br />
Premiums Income of Major Listed Insurers<br />
Jan-May 08 Chg May 08 Chg<br />
(Rmb bn) (YoY) (Rmb bn) (YoY)<br />
Life insurance:<br />
2628,601628 China Life 151.5 48.1% 23.5 82.4%<br />
2318,601318 Ping An 44.5 28.9% 9.4 34.1%<br />
601601 China Pacific 32.8 61.6% 5.0 41.6%<br />
P&C insurance:<br />
2328 PICC 47.1 19.8% 8.4 21.3%<br />
2318,601318 Ping An 12.0 31.3% 2.2 43.3%<br />
601601 China Pacific 12.8 20.4% 2.3 25.1%<br />
Performances of Insurance Stocks since May 9<br />
Code Stock Closing at May 9 Closing at Jun 18 Change<br />
2628 China Life H-share HK$32.70 HK$29.10 -11.0%<br />
601628 China Life A-share Rmb33.43 Rmb25.96 -22.3%<br />
2318 Ping An H-share HK$69.90 HK$61.25 -12.4%<br />
601318 Ping An A-share Rmb64.08 Rmb51.07 -20.3%<br />
2328 PICC H-share HK$7.23 HK$5.84 -19.2%<br />
601601 China Pacific A-share Rmb26.87 Rmb19.61 -27.0%<br />
Price/Embedded Value Ratio<br />
H-share A-share<br />
P/EBV P/EBV<br />
2628, 601628 China Life 2.87 2.91<br />
2318, 601318 Ping An 2.64 2.50<br />
601601 China Pacific - 2.02<br />
Please refer disclaimer and disclosure in the last page.<br />
5<br />
Aug-05<br />
Dec-05<br />
Apr-06<br />
Aug-06<br />
Dec-06<br />
Apr-07<br />
Aug-07<br />
Dec-07<br />
Apr-08<br />
Analyst: Chan Sung-yan, Philip
Please refer disclaimer and disclosure in the last page.<br />
6<br />
MORNING BRIEFING<br />
JUN 19 2008<br />
Appendix: H and A-share Price Comparison Table (18 JUN)<br />
H-share price A-share price H share H-share<br />
H-share A-share Stock Price change Price change / A-share (discount)<br />
Code Code Name (HK$) (%) (RMB) (%) (X) to A-share<br />
939 601939 CCB 6.48 0.78 6.30 3.62 90.7% -9.3%<br />
1398 601398 ICBC 5.58 1.64 5.29 4.96 93.0% -7.0%<br />
3988 601988 BANK OF CHINA 3.84 1.05 4.30 3.12 78.7% -21.3%<br />
3328 601328 BANKCOMM 9.46 1.83 8.02 3.22 104.0% 4.0%<br />
3968 600036 CM BANK 26.15 -0.19 24.88 4.14 92.7% -7.3%<br />
998 601998 <strong>CITIC</strong> BANK 5.03 0.40 5.54 4.92 80.0% -20.0%<br />
2628 601628 CHINA LIFE 29.10 1.57 25.96 4.01 98.8% -1.2%<br />
2318 601318 PING AN 61.25 3.11 51.07 3.95 105.7% 5.7%<br />
857 601857 PETROCHINA 10.66 3.50 16.09 5.58 58.4% -41.6%<br />
386 600028 SINOPEC CORP 8.32 7.77 13.01 9.97 56.4% -43.6%<br />
338 600688 SHANGHAI PECHEM 3.22 4.89 7.55 5.01 37.6% -62.4%<br />
1033 600871 YIZHENG CHEM 1.57 2.61 5.09 4.95 27.2% -72.8%<br />
2883 601808 CHINA OILFIELD 14.10 3.07 22.29 4.06 55.8% -44.2%<br />
1088 601088 SHENHUA ENERGY 33.40 1.83 40.94 4.63 71.9% -28.1%<br />
1898 601898 CHINA COAL 15.20 1.20 17.16 6.19 78.1% -21.9%<br />
1171 600188 YANZHOU COAL 15.46 -1.90 20.59 9.99 66.2% -33.8%<br />
902 600011 HUANENG POWER 6.79 4.95 8.39 8.96 71.3% -28.7%<br />
991 601991 DATANG POWER 5.80 3.94 10.41 6.01 49.1% -50.9%<br />
1071 600027 HUADIAN POWER 2.63 1.54 5.20 5.69 44.6% -55.4%<br />
670 600115 CHINA EAST AIR 2.74 2.24 7.27 5.67 33.2% -66.8%<br />
1055 600029 CHINA SOUTH AIR 3.85 -1.53 7.84 6.09 43.3% -56.7%<br />
753 601111 AIR CHINA 4.92 1.44 8.99 6.77 48.2% -51.8%<br />
390 601390 CHINA RAILWAY 6.43 1.90 5.44 4.62 104.2% 4.2%<br />
1186 601186 CHINA RAIL CONS 11.98 6.02 9.69 5.90 109.0% 9.0%<br />
525 601333 GUANGSHEN RAIL 3.62 2.55 4.21 5.78 75.8% -24.2%<br />
177 600377 JIANGSU EXPRESS 5.96 -0.67 6.31 2.77 83.3% -16.7%<br />
548 600548 SHENZHENEXPRESS 4.49 2.05 5.66 4.24 69.9% -30.1%<br />
995 600012 ANHUIEXPRESSWAY 5.50 1.48 5.33 4.51 91.0% -9.0%<br />
1065 600874 TIANJIN CAPITAL 2.43 0.83 8.33 5.31 25.7% -74.3%<br />
2338 000338 WEICHAI POWER 36.45 4.14 44.25 8.70 72.6% -27.4%<br />
187 600860 BEIREN PRINTING 1.44 0.00<br />
300 600806 JIAODA HIGHTECH 8.17 3.68 14.02 6.29 51.4% -48.6%<br />
42 000585 NE ELECTRIC 1.13 14.14 3.52 5.39 28.3% -71.7%<br />
1072 600875 DONGFANG ELEC 25.00 6.38 27.09 5.57 81.4% -18.6%<br />
2727 600627 SH ELECTRIC 3.95 0.51 33.94 3.70 75.1% -24.9%<br />
350 000666 JINGWEI TEXTILE 1.84 2.79 5.02 4.58 32.3% -67.7%<br />
168 600600 TSINGTAO BREW 18.72 -0.95 20.88 5.24 79.0% -21.0%<br />
719 000756 SHANDONG XINHUA 1.84 4.55 5.08 7.40 31.9% -68.1%<br />
874 600332 GUANGZHOU PHAR 5.75 1.23 10.92 6.23 46.4% -53.6%<br />
347 000898 ANGANG STEEL 16.60 -0.36 17.03 5.45 85.9% -14.1%<br />
323 600808 MAANSHAN IRON 5.19 2.17 6.40 4.40 71.5% -28.5%<br />
1053 601005 CHONGQING IRON 3.29 2.17 5.85 7.54 49.6% -50.4%<br />
2600 601600 CHALCO 11.26 -0.53 14.31 9.91 69.4% -30.6%<br />
358 600362 JIANGXI COPPER 16.50 2.61 22.13 9.99 65.7% -34.3%<br />
2899 601899 ZIJIN MINING 6.88 2.08 8.19 5.41 74.1% -25.9%<br />
914 600585 ANHUI CONCH 58.50 -2.09 49.33 3.11 104.5% 4.5%<br />
588 601588 BEIJING N STAR 2.52 0.40 6.31 9.55 35.2% -64.8%<br />
763 000063 ZTE 36.00 4.35 59.13 6.54 53.7% -46.3%<br />
553 600775 NANJING PANDA 1.79 1.70 6.49 4.85 24.3% -75.7%<br />
317 600685 GUANGZHOU SHIP 22.65 7.86 25.63 10.00 77.9% -22.1%<br />
1919 601919 CHINA COSCO 19.68 3.58 19.77 10.02 87.8% -12.2%<br />
2866 601866 CSCL 3.36 3.70 4.89 6.77 60.6% -39.4%<br />
1138 600026 CHINA SHIP DEV 23.05 2.90 21.56 7.64 94.2% -5.8%<br />
921 000921 HISENSE KELON 4.02 -1.23<br />
1108 600876 LUOYANG GLASS 3.62 3.13<br />
1812 000488 CHENMING PAPER 7.50 0.00 11.80 7.27 56.0% -44.0%<br />
1812 200488^ CHENMING PAPER 7.50 0.00 HK$7.35^ 2.37 102.0%^ 2.0%^<br />
Note #: Each Shanghai Power A-share (600627) will be swapped with 7.32 shares of Shanghai Electric A-share<br />
Note ^: H-share vs B-share price; Shenzhen B-share quoted in HK$ term
HS China AH Premium Index<br />
Daily Q/.HSCAHPI 7/9/2007 - 6/18/2008 (GMT)<br />
BarOHLC, Q/.HSCAHPI, Last Trade<br />
6/18/2008, 122.5, 127.75, 121.64, 127.36<br />
SMA, Q/.HSCAHPI, Last Trade(Last), 10<br />
Price<br />
USD<br />
205<br />
6/18/2008, 130.06<br />
200<br />
195<br />
190<br />
185<br />
180<br />
175<br />
170<br />
165<br />
160<br />
155<br />
150<br />
145<br />
140<br />
135<br />
130<br />
125<br />
.12<br />
16 01 16 03 17 02 16 01 16 03 17 02 16 01 18 03 17 01 16 02 16 02 16<br />
Jul 07 Aug 07 Sep 07 Oct 07 Nov 07 Dec 07 Jan 08 Feb 08 Mar 08 Apr 08 May 08 Jun 08<br />
Top 10 Percentage Gainers and Losers (18 JUN)<br />
Please refer disclaimer and disclosure in the last page.<br />
7<br />
MORNING BRIEFING<br />
JUN 19 2008<br />
AH Shares Premium Index, which consists of 39 H-share stocks<br />
with A-share listing in China, monitors the ratio of A-share<br />
prices against corresponding H-share prices.<br />
Hang Seng Index stocks<br />
Top 10 percent gain stocks Top 10 percent loss stocks<br />
Rank Code Stock Price (HK$) Change Code Stock Price (HK$) Change<br />
1 0386 SINOPEC CORP 8.32 7.77% 0017 NEW WORLD DEV 17.76 -1.88%<br />
2 0700 TENCENT 66.00 4.76% 0004 WHARF HOLDINGS 35.75 -1.65%<br />
3 0688 CHINA OVERSEAS 14.16 3.66% 0551 YUE YUEN IND 21.65 -1.59%<br />
4 0016 SHK PPT 118.40 3.59% 0006 HK ELECTRIC 46.95 -1.16%<br />
5 0857 PETROCHINA 10.66 3.50% 0291 CHINA RESOURCES 24.25 -0.61%<br />
6 2318 PING AN 61.25 3.11% 2600 CHALCO 11.26 -0.53%<br />
7 0012 HENDERSON LAND 52.45 2.14% 2388 BOC HONG KONG 20.40 -0.49%<br />
8 0388 HKEX 127.70 1.92% 2038 FIH 9.89 -0.40%<br />
9 3328 BANKCOMM 9.46 1.83% 0011 HANG SENG BANK 155.50 -0.32%<br />
10 1088 CHINA SHENHUA 33.40 1.83% 0005 HSBC HOLDINGS 125.90 -0.16%<br />
H-share Index stocks<br />
Top 10 percent gain stocks Top 10 percent loss stocks<br />
Rank Code Stock Price (HK$) Change Code Stock Price (HK$) Change<br />
1 0386 SINOPEC CORP 8.32 7.77% 0914 ANHUI CONCH 58.50 -2.09%<br />
2 0576 ZHEJIANGEXPRESS 6.32 4.98% 1171 YANZHOU COAL 15.46 -1.90%<br />
3 0902 HUANENG POWER 6.79 4.95% 0168 TSINGTAO BREW 18.72 -0.95%<br />
4 0338 SHANGHAI PECHEM 3.22 4.89% 0177 JIANGSU EXPRESS 5.96 -0.67%<br />
5 3323 CNBM 17.98 4.66% 2600 CHALCO 11.26 -0.53%<br />
6 0991 DATANG POWER 5.80 3.94% 0347 ANGANG STEEL 16.60 -0.36%<br />
7 2866 CSCL 3.36 3.70% 0489 DONGFENG GROUP 3.30 -0.30%<br />
8 1919 CHINA COSCO 19.68 3.58% 3993 CMOC 26.15 -0.19%<br />
9 0857 PETROCHINA 10.66 3.50% 3968 CM BANK 26.15 -0.19%<br />
10 2318 PING AN 61.25 3.11%<br />
Red Chip Index stocks<br />
Top 10 percent gain stocks Top 10 percent loss stocks<br />
Rank Code Stock Price (HK$) Change Code Stock Price (HK$) Change<br />
1 2380 CHINA POWER 2.73 6.23% 1052 GZI TRANSPORT 3.89 -1.27%<br />
2 1114 BRILLIANCE CHI 1.24 5.98% 0604 SHENZHEN INVEST 3.15 -0.63%<br />
3 0152 SHENZHEN INT'L 0.76 4.11% 0291 CHINA RESOURCES 24.25 -0.61%<br />
4 0203 DENWAY MOTORS 3.27 3.81%<br />
5 0688 CHINA OVERSEAS 14.16 3.66%<br />
6 0270 GUANGDONG INV 3.32 3.11%<br />
7 1205 <strong>CITIC</strong> RESOURCES 3.64 2.82%<br />
8 0297 SINOFERT 5.75 2.68%<br />
9 0308 CHINA TRAVEL HK 2.55 2.00%<br />
10 0124 KINGWAY BREW 1.06 1.92%
Please refer disclaimer and disclosure in the last page.<br />
8<br />
MORNING BRIEFING<br />
JUN 19 2008<br />
Analyst Certification<br />
I, Chan Sung-yan, Philip , being the person primarily responsible for the content of this research report, in whole or in part, hereby<br />
certify that all of the views expressed in this report accurately reflect my personal view about the subject company or companies and<br />
its or their securities. I also certify that no part of my compensation was, is, or will be, directly or indirectly, related to the specific<br />
recommendations or views expressed in this report. CAF <strong>Securities</strong> Company Limited and its member companies will pursue<br />
financial interests to the companies mentioned in the report in the future.<br />
Chan Sung-yan, Philip has financial interest in Ping An H-share.<br />
I, Li Hong-ying, Vivian , being the person primarily responsible for the content of this research report, in whole or in part, hereby<br />
certify that all of the views expressed in this report accurately reflect my personal view about the subject company or companies and<br />
its or their securities. I also certify that no part of my compensation was, is, or will be, directly or indirectly, related to the specific<br />
recommendations or views expressed in this report. CAF <strong>Securities</strong> Company Limited and its member companies will pursue<br />
financial interests to the companies mentioned in the report in the future.<br />
I, Lee Oi Yee, Lisa, being the person primarily responsible for the content of this research report, in whole or in part, hereby certify<br />
that all of the views expressed in this report accurately reflect my personal view about the subject company or companies and its or<br />
their securities. I also certify that no part of my compensation was, is, or will be, directly or indirectly, related to the specific<br />
recommendations or views expressed in this report. CAF <strong>Securities</strong> Company Limited and its member companies will pursue<br />
financial interests to the companies mentioned in the report in the future.<br />
Disclaimer<br />
This report is for our clients only and is for distribution only under such circumstances as may be permitted by applicable law. It has<br />
no regard to the specific investment objectives, financial situation or particular needs of any specific recipient. It is published solely<br />
for informational purposes and is not to be construed as a solicitation or an offer to buy or sell any securities or related financial<br />
instruments. No representation or warranty, either expresses or implied, is provided in relation to the accuracy, completeness or<br />
reliability of the information contained herein. This report should not be regarded by recipients as a substitute for the exercise of their<br />
own judgment. Any opinions expressed in this report are subject to change without notice and may differ or be contrary to opinions<br />
expressed by other business areas as a result of using different assumptions and criteria. The analysis contained herein is based on<br />
numerous assumptions. Different assumptions could result in materially different results. The analyst(s) responsible for the<br />
preparation of this report may interact with trading desk personnel, sales personnel and other constituencies for the purpose of<br />
gathering, synthesizing and interpreting market information. CAF <strong>Securities</strong> Company Limited is under no obligation to update or<br />
keep current the information contained herein. CAF <strong>Securities</strong> Company Limited relies on information barriers to control the flow of<br />
information contained in one or more areas within CAF <strong>Securities</strong> Company Limited, into other areas, units, groups or affiliates of<br />
CAF <strong>Securities</strong> Company Limited. The compensation of the analyst who prepared this report is determined exclusively by research<br />
management and senior management (not including investment banking). Analyst compensation is not based on investment banking<br />
revenues, however, compensation may relate to the revenues of CAF <strong>Securities</strong> Company Limited as a whole, of which investment<br />
banking, sales and trading are a part. The securities described herein may not be eligible for sale in all jurisdictions or to certain<br />
categories of investors. The price and value of the investments referred to in this research and the income from them may fluctuate.<br />
Past performance is not necessarily indicative of future results. Foreign currency rates of exchange may adversely affect the value,<br />
price or income of any security or related instrument mentioned in this report. For investment advice, trade execution or other<br />
enquiries, clients should contact their local sales representative. Neither CAF <strong>Securities</strong> Company Limited nor any of its affiliates,<br />
directors, employees or agents accepts any liability for any loss or damage arising out of the use of all or any part of this report.<br />
Additional information will be made available upon request.<br />
Copyright 2007 CAF <strong>Securities</strong> Company Limited<br />
No part of this material may be (i) copied, photocopied or duplicated in any form by any means or (ii) redistributed without the prior<br />
written consent of CAF <strong>Securities</strong> Company Limited.<br />
Office address: CAF <strong>Securities</strong> Company Limited, 13/F Fairmont House, 8 Cotton Tree Drive, Central, Hong Kong.<br />
Tel: (852) 2868 2183