Revenue Forecasting Practices: Differences across Countries and ...
Revenue Forecasting Practices: Differences across Countries and ...
Revenue Forecasting Practices: Differences across Countries and ...

You also want an ePaper? Increase the reach of your titles
YUMPU automatically turns print PDFs into web optimized ePapers that Google loves.
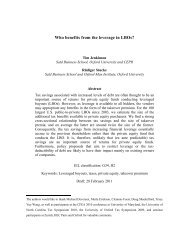
Table 6: Determinants of <strong>Forecasting</strong> Precision <strong>and</strong> Accuracy, Disaggregated <strong>Revenue</strong>s<br />
Dependent variable SDFE RMSFE<br />
(1) (2) (3) (4) (5) (6) (7) (8)<br />
Time span .985 ⋆⋆ 1.08 ⋆⋆ -.014 .055 -.153 .015 -.172 .035<br />
(.130) (.243) (.284) (.351) (.345) (.382) (.338) (.367)<br />
Time span × Tax type 1 1.54 ⋆⋆ 1.45 ⋆⋆ 1.54 ⋆⋆ 1.28 ⋆⋆ 1.51 ⋆⋆ 1.21 ⋆⋆<br />
(.484) (.555) (.491) (.522) (.441) (.473)<br />
Time span × Tax type 2 1.95 ⋆⋆ 1.88 ⋆⋆ 1.95 ⋆⋆ 1.75 ⋆⋆ 1.83 ⋆⋆ 1.59 ⋆⋆<br />
(.730) (.765) (.742) (.729) (.733) (.707)<br />
Time span × Tax type 3 .512 .469 .512 .391 .604 ⋆ .462<br />
(.339) (.360) (.344) (.360) (.335) (.336)<br />
SDFE for GDP 3.68 ⋆⋆ 5.38 ⋆⋆ 3.68 ⋆⋆ 4.02 ⋆⋆ 3.01 ⋆⋆ 3.84 ⋆⋆<br />
(1.06) (1.82) (1.10) (1.25) (.610) (1.32)<br />
RMSFE for GDP 3.09 ⋆⋆ 4.23 ⋆⋆<br />
(.484) (1.31)<br />
log No. of taxes 2.09 .419 1.18 1.39<br />
for 50% of revenue (1.41) (.950) (1.10) (1.06)<br />
Independence -4.87 ⋆⋆ -4.89 ⋆ -4.87 ⋆ -4.87 ⋆ -3.57 ⋆⋆ -3.33 ⋆ -2.82 ⋆⋆ -2.46 ⋆<br />
(2.15) (2.60) (2.23) (2.32) (1.48) (1.58) (1.34) (1.34)<br />
EU-SGP -2.65 ⋆⋆ -3.17 ⋆⋆ -2.68 ⋆⋆ -3.25 ⋆⋆<br />
(.641) (.958) (.509) (.812)<br />
Tax type 1 (Income taxes) 2.45 -2.66 2.44 1.42 4.21 ⋆⋆ 1.67 4.00 ⋆⋆ .763<br />
(2.15) (3.87) (2.16) (2.63) (1.38) (3.38) (1.12) (3.24)<br />
Tax type 2 (Corporation taxes) 11.0 ⋆⋆ 6.13 11.0 ⋆⋆ 10.0 ⋆⋆ 12.7 ⋆⋆ 10.3 ⋆⋆ 12.5 ⋆⋆ 9.38 ⋆⋆<br />
(2.68) (3.43) (2.61) (2.50) (2.04) (3.19) (1.85) (3.11)<br />
Tax type 3 (Sales taxes) .782 -8.21 .788 -1.01 2.56 ⋆ -2.18 2.50 ⋆⋆ -3.32<br />
(2.07) (6.59) (2.08) (3.99) (1.20) (5.13) (.939) (5.04)<br />
Tax type 4 (Others) .868 -6.04 .880 -.504 2.65 ⋆⋆ -.911 2.41 ⋆⋆ -2.02<br />
(2.41) (5.50) (2.25) (3.30) (1.07) (3.98) (.933) (3.94)<br />
24<br />
R2 0.862 0.874 0.916 0.916 0.925 0.928 0.928 0.932<br />
Observations 48 48 48 48 48 48 48 48<br />
Dependent variable in Columns (1)-(6) is the st<strong>and</strong>ard deviation of one-year-ahead forecast error (SDFE) for tax revenues grouped into four types of<br />
taxes. Columns (7) <strong>and</strong> (8) focus on the root-mean-squared forecast error (RMSFE). Robust st<strong>and</strong>ard errors in parentheses take account of possible<br />
correlation between the forecasts for different groups of taxes. One star denotes significance at the 10 % level, two stars at 5% level.