Revenue Forecasting Practices: Differences across Countries and ...
Revenue Forecasting Practices: Differences across Countries and ...
Revenue Forecasting Practices: Differences across Countries and ...
You also want an ePaper? Increase the reach of your titles
YUMPU automatically turns print PDFs into web optimized ePapers that Google loves.
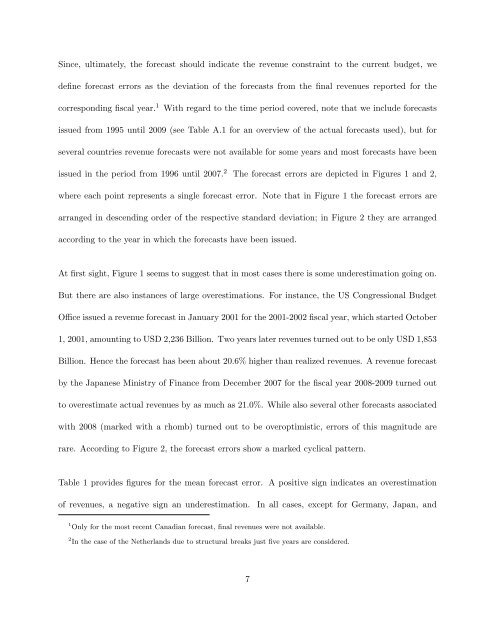
Since, ultimately, the forecast should indicate the revenue constraint to the current budget, we<br />
define forecast errors as the deviation of the forecasts from the final revenues reported for the<br />
corresponding fiscal year. 1 With regard to the time period covered, note that we include forecasts<br />
issued from 1995 until 2009 (see Table A.1 for an overview of the actual forecasts used), but for<br />
several countries revenue forecasts were not available for some years <strong>and</strong> most forecasts have been<br />
issued in the period from 1996 until 2007. 2 The forecast errors are depicted in Figures 1 <strong>and</strong> 2,<br />
where each point represents a single forecast error. Note that in Figure 1 the forecast errors are<br />
arranged in descending order of the respective st<strong>and</strong>ard deviation; in Figure 2 they are arranged<br />
according to the year in which the forecasts have been issued.<br />
At first sight, Figure 1 seems to suggest that in most cases there is some underestimation going on.<br />
But there are also instances of large overestimations. For instance, the US Congressional Budget<br />
Office issued a revenue forecast in January 2001 for the 2001-2002 fiscal year, which started October<br />
1, 2001, amounting to USD 2,236 Billion. Two years later revenues turned out to be only USD 1,853<br />
Billion. Hence the forecast has been about 20.6% higher than realized revenues. A revenue forecast<br />
by the Japanese Ministry of Finance from December 2007 for the fiscal year 2008-2009 turned out<br />
to overestimate actual revenues by as much as 21.0%. While also several other forecasts associated<br />
with 2008 (marked with a rhomb) turned out to be overoptimistic, errors of this magnitude are<br />
rare. According to Figure 2, the forecast errors show a marked cyclical pattern.<br />
Table 1 provides figures for the mean forecast error. A positive sign indicates an overestimation<br />
of revenues, a negative sign an underestimation. In all cases, except for Germany, Japan, <strong>and</strong><br />
1 Only for the most recent Canadian forecast, final revenues were not available.<br />
2 In the case of the Netherl<strong>and</strong>s due to structural breaks just five years are considered.<br />
7


