Industrial Hygiene Exposure Assessment: The Good, Bad, and
Industrial Hygiene Exposure Assessment: The Good, Bad, and
Industrial Hygiene Exposure Assessment: The Good, Bad, and

You also want an ePaper? Increase the reach of your titles
YUMPU automatically turns print PDFs into web optimized ePapers that Google loves.
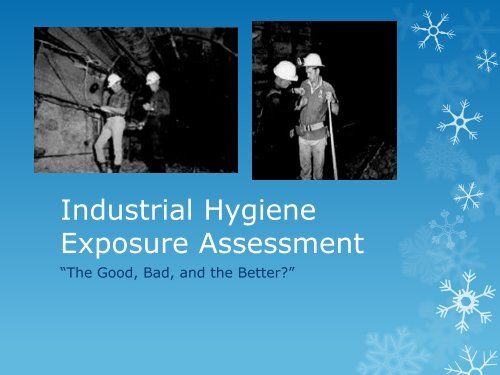
<strong>Industrial</strong> <strong>Hygiene</strong><br />
<strong>Exposure</strong> <strong>Assessment</strong><br />
“<strong>The</strong> <strong>Good</strong>, <strong>Bad</strong>, <strong>and</strong> the Better?”
<strong>Exposure</strong> <strong>Assessment</strong>s<br />
� An Introduction<br />
� What is <strong>Exposure</strong> <strong>Assessment</strong>?<br />
� Why is <strong>Exposure</strong> <strong>Assessment</strong> Important?<br />
� “One of the most important objectives of an industrial hygiene<br />
program is to accurately assess employees’ occupational<br />
exposure to airborne contaminants, where necessary by<br />
exposure measurements.” - Leidel<br />
� A Common <strong>Industrial</strong> <strong>Hygiene</strong> Encounter
<strong>Exposure</strong> <strong>Assessment</strong><br />
� Do we do a good job of assessing occupational exposures?<br />
� How many follow the AIHA <strong>Exposure</strong> <strong>Assessment</strong> Strategy? Or<br />
know what it is?<br />
� How many follow NIOSH/OSHA guidance? Or know what it is?<br />
� How many make <strong>Exposure</strong> <strong>Assessment</strong> judgments on fewer<br />
than 6 samples on a regular basis?<br />
� How many apply statistics to exposure measurements on a<br />
regular basis? And report the results?
<strong>Exposure</strong> <strong>Assessment</strong><br />
� Do we do a good job of assessing occupational exposures?<br />
� Do you ever use area samples to assess employee exposure?<br />
� Do you always make exposure assessments with quantitative<br />
measurements?<br />
� Have you ever made an exposure assessment judgment with<br />
just one quantitative sample?<br />
� How many sell equipment that performs area samples as a way<br />
to assess employees’ occupational exposure?
Where we Started<br />
� 1977 NIOSH<br />
Document<br />
� Leidel,<br />
Busch, &<br />
Lynch
1977 NIOSH <strong>Exposure</strong> <strong>Assessment</strong> Strategy<br />
� Identify Contaminants<br />
� Materials<br />
� Process<br />
� Observations<br />
� Calculate Potential <strong>Exposure</strong><br />
� Modeling<br />
� Steady State Model<br />
ppm = 403(sp. gv)(pts/hr.)(10 6 )(K) / (Mole Wt.)(CFM)<br />
� K Factor<br />
� Sample Workers<br />
� Which One?
1977 NIOSH Guidance
1977 NIOSH Guidance<br />
� Why Highest Risk Employee (Worst Case Scenario)<br />
� <strong>Exposure</strong> is Variable<br />
� 95 % confident captured highest 10% of <strong>Exposure</strong><br />
� Example of a 20 person SEG<br />
� Need to sample 13 employees
1977 NIOSH Guidance<br />
� What is the overall purpose of the NIOSH guidance?<br />
� OSHA Compliance - 95 %Confidence Interval<br />
� Decision Making<br />
� Violation<br />
� No Violation<br />
� Possible Over <strong>Exposure</strong><br />
� Coefficient of Variation<br />
� Error in method <strong>and</strong> analysis<br />
� Sampling Period effects CVtotal<br />
� Full Period Single least error
1977 NIOSH Guidance<br />
� LCL95% <strong>and</strong> UCL95%<br />
� LCL95% =Mean/PEL -1.645* CVtotal/√n<br />
� UCL95% =Mean/PEL +1.645* CVtotal/√n<br />
� UCL ≤ 1 – No violation<br />
� LCL > 1 – Violation<br />
� LCL ≤ 1 <strong>and</strong> UCL > 1 – Possible Overexposure<br />
� Xylene Example
<strong>Exposure</strong> <strong>Assessment</strong><br />
<strong>The</strong> <strong>Good</strong>
AIHA <strong>Exposure</strong> <strong>Assessment</strong> Strategy<br />
� 3 rd Edition – Published 2006
AIHA <strong>Exposure</strong> <strong>Assessment</strong> Strategy<br />
o <strong>Exposure</strong> <strong>Assessment</strong><br />
Strategy Flow Chart
AIHA <strong>Exposure</strong> <strong>Assessment</strong> Strategy<br />
� Basic Characterization<br />
� Gather Information<br />
� Workplace<br />
� Workforce<br />
� Agents
Example Basic Characterization Spreadsheet<br />
Department<br />
Material Hazard / Agent /<br />
OEL<br />
Department Number Equipment Employee Job Title Task Description Material ID Description Agent Chemical CAS# OEL Units<br />
Adhesives 105 Blender Filters Adhesive Operator Change filter media, bleed <strong>and</strong> flush pumps<br />
Using pneumatic pump to charge 700 liters of<br />
Chemical Cyclohexanone 110-82-7 100 ppm<br />
Adhesives 105 Blender Pumps Adhesive Operator cyclohexanone from drums into reactor Chemical Cyclohexanone 110-82-7 100 ppm<br />
Adhesives 105 Blender General Area Maintenance Employee Viscosensor rebuild welding Chemical Nickel 7440-02-0 1.5 mg/m^3<br />
Adhesives 105 Blender General Area Maintenance Employee Paint area & parts clean up<br />
Charging latex super mix from storage tank (watching<br />
Chemical MEK 78-93-3 200 ppm<br />
Adhesives 105 Blender Tank Adhesive Operator level through open manhole) Chemical Cyclohexanone 110-82-7 200 ppm<br />
Adhesives 105 Blender Tank Adhesive Operator Package final product through filter system Chemical Cyclohexanone 110-82-7 200 ppm<br />
Adhesives 105 General Equipment Maintenance Employee Calibration & repair of viscosity meters Chemical Cyclohexanone 110-82-7 200 ppm<br />
Adhesives 105 Blender Tank Maintenance Employee Reactor equipment maintenance Chemical Cyclohexanone 110-82-7 200 ppm<br />
Charging 20 - 10 kg bags of TiOx into Reactor w/ local<br />
Titamium<br />
Adhesives 105 Blender Tank Adhesive Operator exhaust Chemical Dioxide 13463-67-7 10 mg/m^3<br />
Adhesives 105 Blender Tank Adhesive Operator Collect a 200 ml QC samples (6) through h<strong>and</strong>hole Chemical Cyclohexanone 110-82-7 200 ppm<br />
Adhesives 105 Blender Tank Adhesive Operator Monitoring process at control panel Chemical Cyclohexanone 110-82-7 200 ppm<br />
Adhesives 105 Blender Tank Adhesive Operator Monitoring process at control panel Noise Noise 85 dBA<br />
Adhesives 105 Blender Tank Adhesive Operator Monitoring process at control panel Noise Noise 85 dBA<br />
Adhesives 105 Blender Tank Adhesive Operator Monitoring process at control panel Noise Noise 85 dBA<br />
Chemical<br />
Noise<br />
Physical<br />
Other
Example Basic Characterization Spreadsheet<br />
0 (
AIHA <strong>Exposure</strong> <strong>Assessment</strong> Strategy<br />
� Basic Characterization<br />
� Define Similar <strong>Exposure</strong> Groups (SEGs) by:<br />
� Agent / Contaminant <strong>and</strong>/or a combination of:<br />
� Process<br />
� Task<br />
� Job Classification/Description<br />
� Define by Observation<br />
� Define by Sampling
AIHA <strong>Exposure</strong> <strong>Assessment</strong> Strategy<br />
� <strong>Exposure</strong> <strong>Assessment</strong><br />
� Defining <strong>Exposure</strong> Profile<br />
� Prioritizing
<strong>Exposure</strong> Point Inventories<br />
Mark Betz
AIHA <strong>Exposure</strong> <strong>Assessment</strong> Strategy<br />
� <strong>Exposure</strong> <strong>Assessment</strong><br />
� Defining <strong>Exposure</strong> Profile<br />
� Prioritizing<br />
� Initial <strong>Exposure</strong> Estimates
<strong>The</strong> AIHA Model<br />
<strong>Exposure</strong> Control<br />
Ratings *<br />
Cutoff (%OEL)<br />
1 X 0.95 < 10%<br />
� AIHA <strong>Exposure</strong> Control Ratings for TWA<br />
OELs 2 10% < X0.95 < 50%<br />
� Which<br />
3<br />
control<br />
50%<br />
zone<br />
<<br />
is<br />
X<br />
appropriate?<br />
0.95 < 100%<br />
4 X 0.95 > 100%<br />
Confidence level<br />
High<br />
Medium<br />
Low
AIHA <strong>Exposure</strong> <strong>Assessment</strong> Strategy<br />
� Initial <strong>Exposure</strong> Estimates<br />
� Qualitative <strong>Exposure</strong>s<br />
� Semi-Quantitative <strong>Exposure</strong>s – Modeling<br />
� Quantitative <strong>Exposure</strong> <strong>Assessment</strong>s
AIHA <strong>Exposure</strong> <strong>Assessment</strong> Strategy<br />
� Qualitative <strong>Exposure</strong> <strong>Assessment</strong>s<br />
� Are we good at this?<br />
� Not much better than chance (Logan 2009) & (Valadi 2012)<br />
� Estimates of the 95%tile
AIHA <strong>Exposure</strong> <strong>Assessment</strong> Strategy<br />
� Qualitative <strong>Exposure</strong> <strong>Assessment</strong>s<br />
� How do we do this?<br />
� Results of a recent survey of CIHs
Ranking Qualitative <strong>Exposure</strong> Determinants
16.0<br />
14.0<br />
12.0<br />
10.0<br />
8.0<br />
6.0<br />
4.0<br />
2.0<br />
0.0<br />
Forced Selection Choices<br />
Toxicity Phy/Chm<br />
Prop<br />
Percent of Time <strong>Exposure</strong> Determinant Ranked in Top 5<br />
Time Exp. Quanity LEV How<br />
H<strong>and</strong>led<br />
Wkr Tech PPE Housekpg Maint.<br />
Gas/Vapor<br />
Particulate
Statistical Analysis of the Selections<br />
<strong>Exposure</strong> Determinant Likert Ranking<br />
Differences*<br />
Toxicity<br />
Gas/Vapor Ranked Higher<br />
Z = -3.146, p = .002, r = -<br />
.16<br />
Forced (Top 5)<br />
Selection<br />
Differences**<br />
Quantity H<strong>and</strong>led NSD Gas/Vapor Selected More<br />
Often<br />
McN X 2 =36.6, p
Qualities that Effect Choice – Gas Vapor<br />
Determinant # of Exp.<br />
Assmts.<br />
Toxicity<br />
Χ 2 = 12.68, p = .027<br />
Cramer’s V = .16<br />
Freq. of Qual.<br />
Exp. Assmts.<br />
Χ 2 = 15.37, p = .004<br />
Cramer’s V = .18<br />
Χ 2 = 14.18, p = .007<br />
� Quantity Pertinent Chi Square Findings Cramer’s – Gas V = .17 <strong>and</strong> Vapor<br />
<strong>Assessment</strong>s<br />
Time Exp.<br />
How H<strong>and</strong>led<br />
Phy/Chm Prop<br />
LEV<br />
Χ 2 = 14.85, p = .013<br />
Cramer’s V = .17<br />
Χ 2 = 11.10, p = .05<br />
Cramer’s V = .15<br />
Χ 2 = 20.01, p < .001<br />
Cramer’s V = .21<br />
Pharmaceutical<br />
Industry<br />
Χ2 = 10.30, p = .001<br />
Odds Ratio = 2.95<br />
Χ 2 = 6.33, p = .012<br />
Odds Ratio = 2.05<br />
Χ 2 = 5.77, p = .016<br />
Odds Ratio = 2.04
Qualities that Effect Choice – Particulate<br />
Determinant # of Exp.<br />
Assmts.<br />
Toxicity<br />
Quantity<br />
Χ 2 = 13.33, p = .020<br />
Cramer’s V = .17<br />
Freq. of Qual.<br />
Exp. Assmts.<br />
Χ 2 = 21.49, p
AIHA <strong>Exposure</strong> <strong>Assessment</strong> Strategy<br />
� Semi -Quantitative <strong>Exposure</strong> <strong>Assessment</strong>s<br />
� Modeling<br />
� Physical <strong>and</strong> Chemical Properties<br />
� Simple<br />
� Very Complex
AIHA <strong>Exposure</strong> <strong>Assessment</strong> Strategy<br />
� Quantitative <strong>Exposure</strong> <strong>Assessment</strong>s<br />
� Purpose of Monitoring:<br />
� Baseline<br />
� Compliance<br />
� Diagnostic/Evaluation<br />
� Route of <strong>Exposure</strong>s Accounted for:<br />
� Inhalation<br />
� Dermal<br />
� Ingestion
AIHA <strong>Exposure</strong> <strong>Assessment</strong> Strategy<br />
� Quantitative <strong>Exposure</strong> <strong>Assessment</strong>s<br />
� Number or Measurements<br />
� 6 – Estimate of Means<br />
� 10 – Estimate of Variation
AIHA <strong>Exposure</strong> <strong>Assessment</strong> Strategy<br />
� Quantitative <strong>Exposure</strong> <strong>Assessment</strong>s<br />
� Applying Statistics<br />
� Log Normal Distributions – More on this in the “<strong>Bad</strong>”<br />
� Mean vs. Upper Tail<br />
� 95% confident below 95%tile estimate<br />
� Uncertainty<br />
� Uncertainty in measurement<br />
� Uncertainty in OELS<br />
� Statistics should aid judgment not make the judgment
<strong>Exposure</strong> <strong>Assessment</strong><br />
<strong>The</strong> <strong>Bad</strong>
West Michigan <strong>Industrial</strong><br />
<strong>Hygiene</strong> Society<br />
<strong>Industrial</strong> <strong>Hygiene</strong> <strong>Exposure</strong><br />
<strong>Assessment</strong>s for Small Employers:<br />
How Many Samples?<br />
Tuesday, December 4, 2012<br />
James R. Strobridge, CIH<br />
36
<strong>Exposure</strong> <strong>Assessment</strong>s<br />
<strong>The</strong> <strong>Bad</strong> – “STATISTICS”
<strong>The</strong> <strong>Bad</strong> - Statistics<br />
� What do think of or feel when you hear Statistics?<br />
� Confusion<br />
� Fear<br />
� Huh?<br />
� Confidence?
What is a Log Normal Distribution?
Distributions with a Mean=1, Are they the Same?
Example: Welding fume data -<br />
estimate m <strong>and</strong> s
Example: Welding fume data -<br />
estimate m <strong>and</strong> s<br />
Case xi (mg/m3 ) ( xi-x ) 2<br />
_<br />
1 0.84 0.157344<br />
2 0.98 0.065878<br />
3 0.42 0.666944<br />
4 1.16 0.005878<br />
5 1.36 0.015211<br />
6 2.66 2.025878<br />
Sum = 7.42 2.937133<br />
_<br />
x =<br />
1.24<br />
sd = 0.77
Sample geometric mean (gm) &<br />
geometric st<strong>and</strong>ard deviation (gsd)
Example: Welding fume data -<br />
estimate GM <strong>and</strong> GSD<br />
Case xi (mg/m3 ) yi=ln(xi) (yi-y) 2 _<br />
1 0.84 -0.1744 0.055877<br />
2 0.98 -0.0202 0.006762<br />
3 0.42 -0.8675 0.864025<br />
4 1.16 0.1484 0.007463<br />
5 1.36 0.3075 0.060248<br />
6 2.66 0.9783 0.839600<br />
Sum = 0.3722 1.833976<br />
_<br />
y = 0.0620<br />
gm = 1.06<br />
gsd = 1.83
Example: Welding fume data -<br />
estimate GM <strong>and</strong> GSD
Sample 95 th Percentile <strong>Exposure</strong><br />
� <strong>The</strong> focus is on the upper tail of the<br />
exposure profile.<br />
� <strong>The</strong> sample 95 th percentile can be<br />
considered a “compliance statistic”.<br />
� <strong>The</strong> (usual) goal is to determine which<br />
category the 95 th Percentile most likely falls.<br />
� It is used to assist in reaching a decision<br />
that the exposure profile is<br />
� “Controlled” or “Acceptable”<br />
� “Unacceptable”<br />
� or falls in a “Control Category”
Example<br />
� A sample of six full-shift TWA welding fume<br />
measurements resulted in the following statistics:<br />
� (sample) geometric mean is 1.06 mg/m 3<br />
� (sample) geometric st<strong>and</strong>ard deviation is 1.83<br />
� What is the point estimate (i.e., best estimate) of the<br />
true 95 th percentile?
90 th , 95 th , <strong>and</strong> 99 th Percentiles
95 th Percentile
Alternative upper percentile<br />
formula
Focus on Upper Tail
Upper Confidence Limit – 95%<br />
Confident<br />
� Concept<br />
� Calculate the 95% upper confidence interval for the<br />
95th percentile statistic (upper tolerance limit)<br />
� Application<br />
� 95%UCL can be used to test the following<br />
hypotheses:<br />
� H o: 95th percentile > OEL<br />
� H a: 95th percentile < OEL<br />
� Interpretation<br />
� If the 95%UCL is less than the OEL, then we can<br />
say that we are at least 95% confident that the true<br />
95th percentile is less than the OEL
95%UCL for the 95 th Percentile<br />
� Procedure:<br />
� Calculate the gm <strong>and</strong> gsd<br />
� Using n, read the UCL K-value from the appropriate<br />
table<br />
�g = confidence level, e.g., 0.95<br />
�p = proportion, e.g., 0.95<br />
�n = sample size<br />
� Using gm, gsd, <strong>and</strong> k, calculate the 95%UCL<br />
_<br />
�y = ln( gm )<br />
�s y = ln( gsd )
Statistical Analysis of <strong>Exposure</strong> Data<br />
� <strong>The</strong>re is help to do this automatically with IH-MOD
<strong>Industrial</strong> <strong>Hygiene</strong> Statistics<br />
OEL<br />
0.15<br />
Sample<br />
data<br />
0.06 Descriptive statistics<br />
0.1 Number of samples (n) 15<br />
0.05 Maximum (max) 0.2<br />
0.1 Minimum (min) 0.01<br />
0.01 Range 0.19<br />
0.09 Mean 0.0713<br />
0.04 Median 0.07<br />
0.2 St<strong>and</strong>ard deviation (s) 0.0453<br />
0.04 Geometric mean 0.0584<br />
0.08 Geometric st<strong>and</strong>ard deviation 2.03<br />
0.08 Percent above OEL 6.7%<br />
0.03<br />
0.09 Test for distribution fit<br />
0.03 W-test of log-transformed data 0.932<br />
0.07 Lognormal (α = 0.05) ? Yes<br />
W-test of data 0.870<br />
Normal (α = 0.05) ? No<br />
Lognormal parametric statistics<br />
Estimated Arithmetic Mean - AM est. 0.074<br />
LCL1,95% - L<strong>and</strong>'s "Exact" 0.055<br />
UCL1,95% - L<strong>and</strong>'s "Exact" 0.116<br />
95th Percentile 0.187<br />
UTL95%,95% 0.359<br />
Percent above OEL 9.1%<br />
LCL1,95% %>OEL 2.82<br />
UCL1,95% %>OEL 23.4<br />
Normal parametric statistics<br />
Mean 0.0713<br />
LCL1,95% - t statistics 0.051<br />
UCL1,95% - t statistics 0.092<br />
95th Percentile - Z 0.146<br />
UTL95%,95% 0.188<br />
Percent above OEL 4.1%<br />
C<br />
D<br />
Concentration<br />
0.25<br />
0.2<br />
0.15<br />
0.1<br />
0.05<br />
0<br />
0<br />
14<br />
2 4 6 8 10 12 14<br />
n<br />
16<br />
12<br />
10<br />
8<br />
6<br />
4<br />
2<br />
0<br />
LCL<br />
est. AM<br />
UCL<br />
OEL<br />
Idealized Lognormal Distribution<br />
95%ile<br />
Sequential Data Plot<br />
0 0.05 0.1 0.15 0.2 0.25 0.3 0.35 0.4<br />
Concentration<br />
UTL
Statistical Analysis of <strong>Exposure</strong> Data<br />
� What is the problem with the Upper Tolerance Limit?<br />
� 95% Confidence limit of the 95%tile point estimate
<strong>Exposure</strong> <strong>Assessment</strong><br />
<strong>The</strong> Better?
<strong>Exposure</strong> <strong>Assessment</strong>s – <strong>The</strong><br />
Better?<br />
� How do we make good estimates of exposure with a<br />
small data sets?<br />
� Less than 6 samples<br />
� Statistical Rules of Thumb
R.O.T. for Estimating the 95 th Percentile<br />
1. If n is small (i.e., OEL, then decision = Category 4.<br />
2. Estimate the median <strong>and</strong> use it as a surrogate of<br />
the sample GM:<br />
- Sort the data<br />
- If n is odd the median is the middle value.<br />
- If n is even the median is the average of two<br />
middle values.<br />
3. Multiply the median by 2, 4, <strong>and</strong> 6<br />
- <strong>The</strong> results comprise an approximate low,<br />
middle, <strong>and</strong> high estimate of X 0.95.
<strong>The</strong> AIHA Model<br />
<strong>Exposure</strong> Control<br />
Ratings *<br />
Cutoff (%OEL)<br />
1 < X 0.95 < 10%<br />
� AIHA 2 <strong>Exposure</strong> 10% Control < X Ratings for TWA<br />
0.95 < 50%<br />
OELs<br />
3 50% < X0.95 < 100%<br />
� Which control zone is appropriate?<br />
4 X 0.95 > 100%<br />
Confidence level<br />
High<br />
Medium<br />
Low
Examples (assume OEL=100)<br />
a. X = {5}<br />
b. X = {68}<br />
c. X = {7, 34, 57}<br />
d. X = {1, 1, 2, 5}<br />
e. X = {4, 5, 8, 23}<br />
f. X = {0.3, 1, 2, 3, 4, 22}<br />
g. X = {10, 10, 10, 20, 50, 105}<br />
h. X = {7, 10, 16, 21, 45, 53}<br />
For each dataset, determine the appropriate <strong>Exposure</strong><br />
Category – 1, 2, 3, or 4 – using the above Rule-ofthumb.
R.O.T. for Estimating the 95 th Percentile<br />
� AIHA Moblie App<br />
� IH Digg - “Game” format to make estimates of exposure<br />
� https://itunes.apple.com/us/app/ih-dig/id433823028?mt=8
Control B<strong>and</strong>ing<br />
� <strong>Exposure</strong> <strong>Assessment</strong> Bypassed<br />
� Measurements not needed<br />
� Chemical Agent <strong>and</strong> associated hazards drive controls<br />
� Pharma System<br />
� B<strong>and</strong> 1-5 – based on exposure limits<br />
� COSHH Essentials<br />
� http://www.coshh-essentials.org.uk/help/Introduction6.htm
Bayesian Decision Analysis - BDA<br />
� <strong>The</strong> Promise<br />
<strong>The</strong> Prior<br />
Bayesian<br />
Calc.<br />
<strong>The</strong> Posterior<br />
<strong>The</strong><br />
Likelihood
Bayesian Decision Analysis - BDA<br />
� <strong>The</strong> Reality<br />
� What did we say about IHs ability to estimate 95 %tile with<br />
no measurements?<br />
� Current Recommendations of a Flat Prior<br />
� What does that mean?<br />
� Example IHDataAnalyst
AIHA <strong>Exposure</strong> <strong>Assessment</strong> Strategy<br />
� Other tools from AIHA -EASC<br />
� http://www.aiha.org/INSIDEAIHA/VOLUNTEERGROUPS/EAS<br />
C/Pages/EASCTopics.aspx<br />
� Baysian Decision Analysis Tool<br />
� http://www.oesh.com/