Statistical Inference After an Adaptive Group Sequential Design: A ...
Statistical Inference After an Adaptive Group Sequential Design: A ...
Statistical Inference After an Adaptive Group Sequential Design: A ...

Create successful ePaper yourself
Turn your PDF publications into a flip-book with our unique Google optimized e-Paper software.
594 b i o s t a t i s t i c s<br />
Tremmel<br />
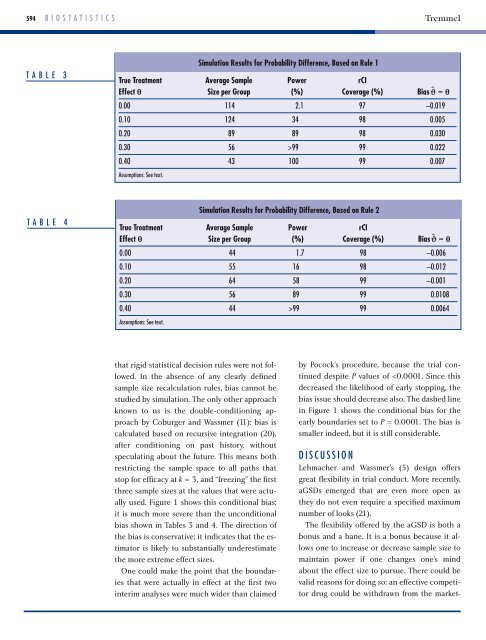
t a b L E 3<br />
t a b L E 4<br />
True Treatment Average Sample Power rCI<br />
Effect θ Size per <strong>Group</strong> (%) Coverage (%) Bias ˆ ϑ – θ<br />
0.00 114 2.1 97 –0.019<br />
0.10 124 34 98 0.005<br />
0.20 89 89 98 0.030<br />
0.30 56 >99 99 0.022<br />
0.40 43 100 99 0.007<br />
assumptions: see text.<br />
that rigid statistical decision rules were not followed.<br />
In the absence of <strong>an</strong>y clearly defined<br />
sample size recalculation rules, bias c<strong>an</strong>not be<br />
studied by simulation. The only other approach<br />
known to us is the double-conditioning approach<br />
by Coburger <strong>an</strong>d Wassmer (11): bias is<br />
calculated based on recursive integration (20),<br />
after conditioning on past history, without<br />
speculating about the future. This me<strong>an</strong>s both<br />
restricting the sample space to all paths that<br />
stop for efficacy at k = 3, <strong>an</strong>d “freezing” the first<br />
three sample sizes at the values that were actually<br />
used. Figure 1 shows this conditional bias;<br />
it is much more severe th<strong>an</strong> the unconditional<br />
bias shown in Tables 3 <strong>an</strong>d 4. The direction of<br />
the bias is conservative; it indicates that the estimator<br />
is likely to subst<strong>an</strong>tially underestimate<br />
the more extreme effect sizes.<br />
One could make the point that the boundaries<br />
that were actually in effect at the first two<br />
interim <strong>an</strong>alyses were much wider th<strong>an</strong> claimed<br />
Simulation Results for Probability Difference, Based on Rule 1<br />
True Treatment Average Sample Power rCI<br />
Effect θ Size per <strong>Group</strong> (%) Coverage (%) Bias ˆ ϑ – θ<br />
0.00 44 1.7 98 –0.006<br />
0.10 55 16 98 –0.012<br />
0.20 64 58 99 –0.001<br />
0.30 56 89 99 0.0108<br />
0.40 44 >99 99 0.0064<br />
assumptions: see text.<br />
Simulation Results for Probability Difference, Based on Rule 2<br />
by Pocock’s procedure, because the trial continued<br />
despite P values of