2011 Registration Document - Imerys
2011 Registration Document - Imerys
2011 Registration Document - Imerys

You also want an ePaper? Increase the reach of your titles
YUMPU automatically turns print PDFs into web optimized ePapers that Google loves.
As of December 31, 2010<br />
(€ millions)<br />
Financial liabilities<br />
at amortized cost<br />
Fair value through<br />
profit or loss Hedge derivatives<br />
Non hedge<br />
derivatives Fair value Cash flow<br />
FINANCIAL STATEMENTS<br />
Consolidated financial statements<br />
Non<br />
IAS 39 Total<br />
Non-current liabilities<br />
Loans and financial debts 996.1 (6.9) 24.9 - 2.7 1,016.8<br />
Other debts 6.9 - - - 3.3 10.2<br />
Derivative financial liabilities<br />
Current liabilities<br />
- 5.5 - 9.8 - 15.3<br />
Trade payables 317.1 - - - - 317.1<br />
Other debts 123.3 - - - 116.5 239.8<br />
Derivative financial liabilities - 1.2 - 0.1 - 1.3<br />
Loans and financial debts 217.1 - - 1.9 0.5 219.5<br />
Bank overdrafts 4.7 - - - - 4.7<br />
Total financial liabilities 1,665.2 (0.2) 24.9 11.8 - -<br />
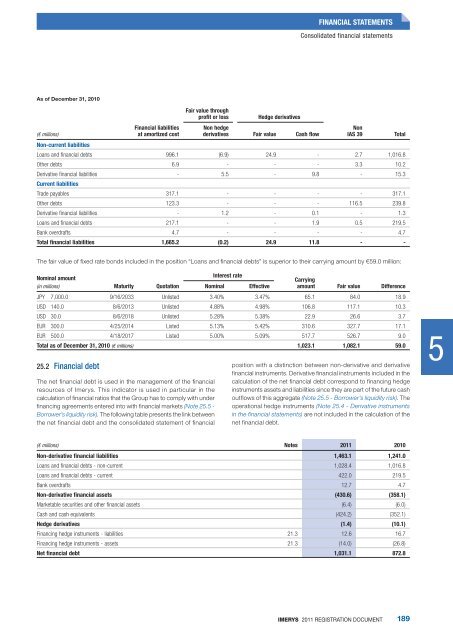
The fair value of fixed rate bonds included in the position “Loans and financial debts” is superior to their carrying amount by €59.0 million:<br />
Nominal amount<br />
(in millions) Maturity Quotation<br />
Interest rate<br />
Nominal Effective<br />
Carrying<br />
amount Fair value Difference<br />
JPY 7,000.0 9/16/2033 Unlisted 3.40% 3.47% 65.1 84.0 18.9<br />
USD 140.0 8/6/2013 Unlisted 4.88% 4.98% 106.8 117.1 10.3<br />
USD 30.0 8/6/2018 Unlisted 5.28% 5.38% 22.9 26.6 3.7<br />
EUR 300.0 4/25/2014 Listed 5.13% 5.42% 310.6 327.7 17.1<br />
EUR 500.0 4/18/2017 Listed 5.00% 5.09% 517.7 526.7 9.0<br />
Total as of December 31, 2010 (€ millions) 1,023.1 1,082.1 59.0<br />
25.2 Financial debt<br />
The net financial debt is used in the management of the financial<br />
resources of <strong>Imerys</strong>. This indicator is used in particular in the<br />
calculation of financial ratios that the Group has to comply with under<br />
financing agreements entered into with financial markets (Note 25.5 -<br />
Borrower’s liquidity risk). The following table presents the link between<br />
the net financial debt and the consolidated statement of financial<br />
position with a distinction between non-derivative and derivative<br />
financial instruments. Derivative financial instruments included in the<br />
calculation of the net financial debt correspond to financing hedge<br />
instruments assets and liabilities since they are part of the future cash<br />
outflows of this aggregate (Note 25.5 - Borrower’s liquidity risk). The<br />
operational hedge instruments (Note 25.4 - Derivative instruments<br />
in the financial statements) are not included in the calculation of the<br />
net financial debt.<br />
(€ millions) Notes <strong>2011</strong> 2010<br />
Non-derivative financial liabilities 1,463.1 1,241.0<br />
Loans and financial debts - non-current 1,028.4 1,016.8<br />
Loans and financial debts - current 422.0 219.5<br />
Bank overdrafts 12.7 4.7<br />
Non-derivative financial assets (430.6) (358.1)<br />
Marketable securities and other financial assets (6.4) (6.0)<br />
Cash and cash equivalents (424.2) (352.1)<br />
Hedge derivatives (1.4) (10.1)<br />
Financing hedge instruments - liabilities 21.3 12.6 16.7<br />
Financing hedge instruments - assets 21.3 (14.0) (26.8)<br />
Net financial debt 1,031.1 872.8<br />
IMERYS <strong>2011</strong> REGISTRATION DOCUMENT<br />
189<br />
5