Economic Valuation of Environmental Impacts in ... - ARCHIVE: Defra
Economic Valuation of Environmental Impacts in ... - ARCHIVE: Defra
Economic Valuation of Environmental Impacts in ... - ARCHIVE: Defra

Create successful ePaper yourself
Turn your PDF publications into a flip-book with our unique Google optimized e-Paper software.
<strong>Economic</strong> <strong>Valuation</strong> <strong>of</strong> <strong>Environmental</strong><br />
<strong>Impacts</strong> <strong>in</strong> the Severely Disadvantaged<br />
Areas<br />
F<strong>in</strong>al Report<br />
Submitted to<br />
Department for Environment, Food and Rural Affairs<br />
3 rd January 2006<br />
<strong>Economic</strong>s For The Environment Consultancy Ltd (eftec) 16 Percy Street London W1T<br />
1DT, tel: 02075805383, fax: 02075805385, eftec@eftec.co.uk, www.eftec.co.uk
<strong>Economic</strong> <strong>Valuation</strong> <strong>of</strong> <strong>Environmental</strong> <strong>Impacts</strong> <strong>in</strong> the Severely Disadvantaged Areas<br />
This report has been prepared by<br />
Ms Helen Johns, eftec<br />
Ms Ece Ozdemiroglu, eftec<br />
Pr<strong>of</strong>essor Nick Hanley, Stirl<strong>in</strong>g University<br />
Dr Sergio Colombo, University <strong>of</strong> Stirl<strong>in</strong>g / IFAPA Junta de Andalusia<br />
Dr Alistair Hamilton, Stirl<strong>in</strong>g University<br />
Dr Tony Hyde, Socio-<strong>Economic</strong> Research Services<br />
The fieldwork for this report was undertaken by Carrick James Market Research and Socio-<br />
<strong>Economic</strong> Research Services.<br />
Acknowledgements<br />
Prelim<strong>in</strong>ary work on the forecast changes to upland attributes by eftec was reviewed and<br />
expanded by Cumulus Consultants Ltd. <strong>in</strong> association with the Institute for European<br />
<strong>Environmental</strong> Policy and the Countryside and Community Research Unit. This work is<br />
quoted extensively <strong>in</strong> Section 2.<br />
The study team would like to thank Pr<strong>of</strong>essor Ian Bateman (University <strong>of</strong> East Anglia) who,<br />
as the peer reviewer, provided valuable comments at various stages <strong>of</strong> the work, and Dr<br />
Stavros Georgiou (CSERGE, University <strong>of</strong> East Anglia), who moderated the focus groups. The<br />
study team would also like to thank the Steer<strong>in</strong>g Group for their valuable comments<br />
throughout the study.<br />
eftec January 2006
<strong>Economic</strong> <strong>Valuation</strong> <strong>of</strong> <strong>Environmental</strong> <strong>Impacts</strong> <strong>in</strong> the Severely Disadvantaged Areas<br />
Executive Summary<br />
E.1 Introduction<br />
This report summarises the methodology and f<strong>in</strong>d<strong>in</strong>gs <strong>of</strong> a study to estimate the economic<br />
value <strong>of</strong> changes <strong>in</strong> environmental features associated with the Severely Disadvantaged<br />
Areas <strong>in</strong> England, which could arise from changes to the Government support for agriculture<br />
<strong>in</strong> Less Favoured Area.<br />
Severely Disadvantaged Areas (SDAs) and Disadvantaged Areas (DAs) together comprise the<br />
English Less Favoured Areas (LFA). These are areas where farm<strong>in</strong>g is more difficult because<br />
<strong>of</strong> poor climate, soils and terra<strong>in</strong>. These lead to lower yields and higher production and<br />
transportation costs. LFAs are located ma<strong>in</strong>ly <strong>in</strong> upland hill-farm<strong>in</strong>g areas. They <strong>in</strong>clude<br />
almost all <strong>of</strong> the upland areas <strong>in</strong> the North <strong>of</strong> England (<strong>in</strong>clud<strong>in</strong>g the Penn<strong>in</strong>es, Lake District<br />
and North York Moors), the Peak District, some (from an English perspective) <strong>of</strong> the English-<br />
Welsh border, Exmoor, Dartmoor, and parts <strong>of</strong> Cornwall. Farm<strong>in</strong>g plays a crucial role <strong>in</strong><br />
ma<strong>in</strong>ta<strong>in</strong><strong>in</strong>g the dist<strong>in</strong>ctive landscape <strong>of</strong> such areas.<br />
The <strong>in</strong>strument for support <strong>of</strong> upland farm<strong>in</strong>g, the Hill Farm Allowance (HFA), is currently<br />
be<strong>in</strong>g revised as part <strong>of</strong> the new Rural Development Regulation which covers the period<br />
2007-2013. The ultimate policy objective <strong>of</strong> this revision is to generate the maximum public<br />
benefit provided by upland farmers.<br />
The pr<strong>in</strong>cipal stages <strong>of</strong> this study can be summarised as follows:<br />
• Identify a number <strong>of</strong> different policy scenarios which could arise <strong>in</strong> relation to the<br />
revision <strong>of</strong> the HFA (<strong>in</strong>itially identified by the eftec team and later expanded upon by<br />
Cumulus et al. (2005), which was subsequently used <strong>in</strong> the economic analysis);<br />
• Predict the likely effects – predom<strong>in</strong>antly <strong>in</strong> terms <strong>of</strong> changes <strong>in</strong> quantity rather than<br />
quality - on fourteen different upland environmental attributes <strong>of</strong> these different policy<br />
scenarios;<br />
• Estimate the economic value <strong>of</strong> the changes <strong>in</strong> some <strong>of</strong> these attributes through a stated<br />
preference survey (the pr<strong>in</strong>cipal method be<strong>in</strong>g choice experiment);<br />
• Estimate the economic value <strong>of</strong> the changes <strong>in</strong> the rest <strong>of</strong> the attributes through benefit<br />
transfer; and;<br />
• Aggregate the economic values per attribute to estimate the total welfare change for<br />
different LFA policy revision scenarios.<br />
The economic valuation aspect <strong>of</strong> this study has been accomplished by means <strong>of</strong> a stated<br />
preference survey <strong>of</strong> the six Government Office Regions conta<strong>in</strong><strong>in</strong>g SDAs (North West, North<br />
East, Yorkshire and Humber, West Midlands, East Midlands and South West), as well as one<br />
survey <strong>in</strong> a region not conta<strong>in</strong><strong>in</strong>g SDAs (the South East). The pr<strong>in</strong>cipal valuation method<br />
used was the choice experiment approach, but the survey also conta<strong>in</strong>ed an element <strong>of</strong><br />
cont<strong>in</strong>gent valuation.<br />
E.2 Upland attributes and policy scenarios<br />
The long list <strong>of</strong> upland attributes considered for <strong>in</strong>clusion <strong>in</strong> the survey was: heather<br />
moorland and bog, improved grassland, rough grassland, hay meadows, bracken, gorse,<br />
arable & set aside land, broadleaf and mixed woodland, coniferous woodland, field<br />
boundaries (hedgerows and drystone walls), cultural heritage, water quantity, water<br />
quality, and greenhouse gas emissions. Of these, heather moorland and bog, rough<br />
grassland, broadleaf and mixed woodland, field boundaries and cultural heritage were<br />
chosen as the five attributes to be used <strong>in</strong> the choice experiment. Cultural heritage may be<br />
taken to <strong>in</strong>clude the visual presence <strong>in</strong> the landscape <strong>of</strong> traditional farm build<strong>in</strong>gs; less<br />
visual aspects may be the presence <strong>of</strong> animals on the hill, traditional breeds, or traditional<br />
farm<strong>in</strong>g practices such as shepherd<strong>in</strong>g with sheep dogs. Given the shortlist <strong>of</strong> attributes<br />
eftec i January 2006
<strong>Economic</strong> <strong>Valuation</strong> <strong>of</strong> <strong>Environmental</strong> <strong>Impacts</strong> <strong>in</strong> the Severely Disadvantaged Areas<br />
chosen, only changes to quantity, rather than quality, <strong>of</strong> the attributes (except for cultural<br />
heritage) were considered.<br />
Four different possible policy scenarios were identified and described. These are<br />
summarised as follows:<br />
Scenario 0 – Basel<strong>in</strong>e: there is no change <strong>in</strong> the strategic aims, structure and level <strong>of</strong><br />
upland support. Support rema<strong>in</strong>s focused on ma<strong>in</strong>ta<strong>in</strong><strong>in</strong>g upland farm<strong>in</strong>g systems with<br />
environmental enhancement be<strong>in</strong>g a secondary objective. In other words the Hill Farm<br />
Allowance scheme rema<strong>in</strong>s the same as it is presently.<br />
Scenario 1 - Environment-agri: the strategic policy aims to reflect the importance <strong>of</strong><br />
environmental and conservation objectives over production and the ma<strong>in</strong>tenance <strong>of</strong> upland<br />
farm<strong>in</strong>g regimes. The same amount <strong>of</strong> LFA-type support still exists, but is targeted more<br />
towards achiev<strong>in</strong>g environmental goals.<br />
Scenario 2 - Environment only: the strategic aims for upland support are focused solely on<br />
achiev<strong>in</strong>g environmental goals. It is assumed that exist<strong>in</strong>g support is ma<strong>in</strong>ta<strong>in</strong>ed, but it is<br />
<strong>in</strong>corporated <strong>in</strong>to the agri-environment scheme budget and r<strong>in</strong>g-fenced for the uplands.<br />
The LFA scheme disappears.<br />
Scenario 3 – Abandonment-<strong>in</strong>tensification: under this scenario, upland support is<br />
withdrawn entirely. Exist<strong>in</strong>g fund<strong>in</strong>g <strong>of</strong> £27 million per year disappears and is ‘lost’ from<br />
the uplands. On many farms dom<strong>in</strong>ated by poorer, higher ground, farm<strong>in</strong>g would be<br />
completely abandoned.<br />
CAP reform and <strong>Environmental</strong> Stewardship are assumed to have been implemented <strong>in</strong> all<br />
scenarios.<br />
The possible effect <strong>of</strong> each scenario on the fourteen attributes <strong>in</strong> the long list was<br />
determ<strong>in</strong>ed by Cumulus et al. (2005). However it should be emphasised that these need to<br />
be considered not as def<strong>in</strong>itive predictions, but as examples <strong>of</strong> possible outcomes. Further<br />
<strong>in</strong>formation on attributes and scenarios can be found <strong>in</strong> Section 2 <strong>of</strong> the ma<strong>in</strong> report.<br />
E.3. <strong>Valuation</strong> Methodology<br />
Two stated preference techniques are used <strong>in</strong> the report: choice experiment and<br />
cont<strong>in</strong>gent valuation. The potential for benefits transfer is explored for upland attributes<br />
that could not (or need not) be <strong>in</strong>cluded <strong>in</strong> the stated preference survey.<br />
A choice experiment approach is used for the ma<strong>in</strong> part <strong>of</strong> the survey to elicit will<strong>in</strong>gness to<br />
pay (WTP) estimates for the five attributes <strong>in</strong>cluded <strong>in</strong> the survey, namely: heather<br />
moorland and bog, rough grassland, broadleaf and mixed woodland, field boundaries and<br />
cultural heritage. The survey questionnaire consisted <strong>of</strong> the follow<strong>in</strong>g sections: (A)<br />
attitudes, op<strong>in</strong>ions and uses; (B) choice experiment valuation section for SDAs <strong>in</strong> the<br />
respondent’s own GOR; (C) cont<strong>in</strong>gent valuation question about SDAs <strong>in</strong> the rest <strong>of</strong> England;<br />
and (D) follow-up and socio-economic questions.<br />
In the choice experiment section, respondents were asked to choose their most preferred<br />
option <strong>in</strong> each <strong>of</strong> the six choice sets they were given. Each choice set conta<strong>in</strong>ed three<br />
options: the current policy (basel<strong>in</strong>e) and alternatives A or B, which on the whole reflected<br />
the possible outcomes <strong>of</strong> Scenarios 1-3 with randomly allocated price tags (<strong>in</strong>creases <strong>in</strong><br />
annual tax payments <strong>of</strong> the household). In the six GORs with SDAs, respondents were<br />
presented <strong>in</strong>formation about and asked to make their choices for the SDAs <strong>in</strong> their own<br />
region. Respondents <strong>in</strong> the South East were asked the same question, but for attributes <strong>in</strong><br />
all SDAs <strong>in</strong> England.<br />
eftec ii January 2006
<strong>Economic</strong> <strong>Valuation</strong> <strong>of</strong> <strong>Environmental</strong> <strong>Impacts</strong> <strong>in</strong> the Severely Disadvantaged Areas<br />
A cont<strong>in</strong>gent valuation question was also added (<strong>in</strong> all questionnaires except the South<br />
East) to gauge respondents’ WTP for a s<strong>in</strong>gle improvement scenario for SDAs <strong>in</strong> all other<br />
regions except their own.<br />
The survey design underwent focus group and pilot survey stages before the ma<strong>in</strong> survey<br />
was undertaken. <strong>Valuation</strong> workshops were also undertaken after the survey as part <strong>of</strong><br />
validity test<strong>in</strong>g and to exam<strong>in</strong>e issues such as respondents’ understand<strong>in</strong>g <strong>of</strong> the choice<br />
experiment tasks, the scope <strong>of</strong> the geographical area and environmental change, and<br />
generally the motivations beh<strong>in</strong>d their choices.<br />
Further details <strong>of</strong> the valuation methodology and <strong>in</strong>itial test<strong>in</strong>g <strong>of</strong> the questionnaire can be<br />
found <strong>in</strong> Section 3. This study is the first <strong>of</strong> its k<strong>in</strong>d <strong>in</strong> the UK <strong>in</strong> that it exam<strong>in</strong>es (a<br />
selection <strong>of</strong>) the <strong>in</strong>dividual upland attributes separately identified but jo<strong>in</strong>tly provided,<br />
rather than as a bundle under the general head<strong>in</strong>g <strong>of</strong> ‘landscape’. Other studies that look<br />
at <strong>in</strong>dividual attributes on their own or together as landscape are also reviewed <strong>in</strong> the<br />
report (see Section 4).<br />
The other n<strong>in</strong>e attributes <strong>in</strong> the long list which had not been <strong>in</strong>cluded <strong>in</strong> the choice<br />
experiment were considered for their suitability for benefit transfer. Of the n<strong>in</strong>e, only hay<br />
meadows were found to be a suitable candidate for transfer <strong>of</strong> amenity benefits, from their<br />
<strong>in</strong>clusion <strong>in</strong> the <strong>Environmental</strong> Landscape Features (ELF) model (IERM/SAC, 2001).<br />
Greenhouse gas emissions could be used for benefit transfer if forecasts for how they may<br />
change under the different policy scenarios were quantitative. Other features either had<br />
not been previously valued (e.g. bracken, gorse), or had been valued, but were too<br />
complex as goods to be transferable (e.g. water quality). Section 5 conta<strong>in</strong>s a detailed<br />
assessment <strong>of</strong> the suitability <strong>of</strong> the evidence from current literature for benefits transfer.<br />
E.4. Results <strong>of</strong> the Stated Preference Survey<br />
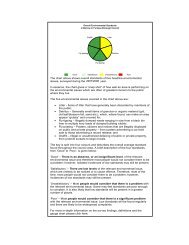
Questions on attitudes and habits showed that respondents <strong>in</strong> general considered<br />
environmental policy to be important compared to other policy areas, but did not consider<br />
protect<strong>in</strong>g the countryside to be the most press<strong>in</strong>g environmental issue. A quarter <strong>of</strong><br />
respondents were members <strong>of</strong> an environmental, recreational, heritage or farm<strong>in</strong>g<br />
organisation. A substantial majority <strong>of</strong> respondents were familiar with the SDAs <strong>in</strong> their<br />
area and visited them for recreational purposes.<br />
Overall, 84% percent <strong>of</strong> respondents said that they visited the countryside, and 79% SDAs,<br />
for recreational purposes (these are the sums <strong>of</strong> those visit<strong>in</strong>g for recreational purposes<br />
only and those who visit for both work and recreation). There was therefore a high level <strong>of</strong><br />
awareness and experience <strong>of</strong> SDAs amongst respondents.<br />
Table E.1 shows the WTP estimates from the choice experiment survey for each GOR region<br />
(except for the North East, for which WTP figures were not derived).<br />
WTP results for which the confidence <strong>in</strong>tervals <strong>in</strong>clude zero are not significantly different<br />
from zero at the 5% level. The South East and North West show the highest number <strong>of</strong><br />
significant results. For further detail on the analysis <strong>of</strong> average WTP responses us<strong>in</strong>g<br />
different econometric models, see Section 7 and Annex 5.<br />
The analysis <strong>of</strong> the cont<strong>in</strong>gent valuation question <strong>in</strong> the surveys for the six regions with<br />
SDAs revealed an average WTP across all six regions <strong>of</strong> £49–105 per household per year for a<br />
change from a ‘worst case’ to a ‘best case’ scenario.<br />
eftec iii January 2006
<strong>Economic</strong> <strong>Valuation</strong> <strong>of</strong> <strong>Environmental</strong> <strong>Impacts</strong> <strong>in</strong> the Severely Disadvantaged Areas<br />
Table E.1: WTP results (£ per household per year per 1% improvement for the first four<br />
attributes) derived from the choice experiment for each region (except the North East).<br />
NW YH WM EM SW SE<br />
Model used 1 : A&S A&S AO A&S AO A&S<br />
HMB 0.78 0.30 0.80 1.04 0.92 0.81<br />
(0.45-1.11) (-0.06-0.65) (0.42-1.18) (-0.03-2.31) (0.37-1.54) (0.36-1.25)<br />
RG 0.74 0.31 0.25 0.08 -0.06 0.50<br />
(0.45-1.05) (0.01-0.60) (-0.05-0.53) (-0.99-0.91) (-0.56-0.39) (0.14-0.86)<br />
BMW 0.61 0.15 0.43 0.97 0.39 1.21<br />
(0.30-0.91) (-0.16-0.48) (0.07-0.81) (0.03-2.46) (-0.01-0.78) (0.81-1.66)<br />
FB 0.00 0.04 0.02 0.06 -0.04 0.06<br />
(-0.03-0.04) (0.01-0.08) (-0.02-0.05) (-0.06-0.18) (-0.11-0.02) (0.02-0.11)<br />
CH<br />
(small 2 )<br />
1.03<br />
(-1.84-4.14)<br />
3.08<br />
(-0.24-6.71)<br />
-0.40<br />
(-4.27-3.03)<br />
7.92<br />
(-1.96-22.62)<br />
5.48<br />
(-0.11-11.59)<br />
0.81<br />
(-3.22-4.96)<br />
CH<br />
(big 3 )<br />
4.89<br />
(1.52-8.43)<br />
11.93<br />
(8.47-15.44)<br />
6.56<br />
(2.49-10.73)<br />
22.51<br />
(11.84-37.24)<br />
7.68<br />
(1.24-15.03)<br />
15.79<br />
(11.47-20.64)<br />
Figures <strong>in</strong> brackets are the 95% confidence <strong>in</strong>terval. Note that if the confidence <strong>in</strong>terval spans zero<br />
then the WTP is not significantly different from zero.<br />
HMB = heather moorland and bog, RG = rough grassland, BMW = mixed and broadleaf woodland, FB =<br />
field boundaries, CH = cultural heritage.<br />
1<br />
A&S = attributes and socio-economic variables; AO = attributes only<br />
2<br />
from “rapid decl<strong>in</strong>e” to “no change”<br />
3<br />
from “rapid decl<strong>in</strong>e” to “much better conservation”<br />
E.5. Validity Test<strong>in</strong>g<br />
With regards to stated preference studies, there are three types <strong>of</strong> validity which should be<br />
considered: content, construct and convergent validity. Content validity assesses whether a<br />
study asked the right questions <strong>in</strong> a clear, understandable, sensible and appropriate manner<br />
with which to obta<strong>in</strong> a valid estimate <strong>of</strong> the WTP measure under <strong>in</strong>vestigation. Construct<br />
validity exam<strong>in</strong>es whether the relationships between choices or WTP estimates and factors<br />
likely to affect those are <strong>in</strong> accordance with expectations based on economic theory.<br />
Convergent validity exam<strong>in</strong>es whether the quantitative results are broadly comparable with<br />
the results <strong>of</strong> other studies valu<strong>in</strong>g similar goods.<br />
The validity tests <strong>in</strong>volve the analysis <strong>of</strong> responses about attitudes towards the survey,<br />
econometric analysis <strong>of</strong> the WTP function and comparison <strong>of</strong> the f<strong>in</strong>d<strong>in</strong>gs aga<strong>in</strong>st prior<br />
expectations and comparison <strong>of</strong> the results from this study to previous studies from the<br />
literature. Section 7 <strong>of</strong> the ma<strong>in</strong> report presents all three types <strong>of</strong> validity test<strong>in</strong>g. Here it<br />
suffices to summarise the f<strong>in</strong>d<strong>in</strong>gs <strong>of</strong> these assessments.<br />
Content validity<br />
• Income non-response: the <strong>in</strong>come non-response rate was relatively high, particularly <strong>in</strong><br />
Yorkshire and Humber and the East Midlands. This precluded the use <strong>of</strong> <strong>in</strong>come as an<br />
explanatory factor <strong>in</strong> the regression models <strong>of</strong> four regions.<br />
• Protest bids: the number <strong>of</strong> protest bids was also relatively high, and <strong>in</strong> the case <strong>of</strong> the<br />
North East, may have been the ma<strong>in</strong> reason for the model to return <strong>in</strong>significant<br />
coefficients for all upland attributes. Protest bids were at similar levels for both<br />
sections <strong>of</strong> the questionnaire while genu<strong>in</strong>e zero WTPs were noticeably higher for<br />
Section C (CV) than Section B (CE). This should be expected, as respondents are more<br />
likely to value SDAs <strong>in</strong> their own region than elsewhere <strong>in</strong> the country.<br />
• Attitudes: 69% <strong>of</strong> the survey respondents found the survey easy to understand while only<br />
20% found it difficult to understand.<br />
Construct validity<br />
• The most important f<strong>in</strong>d<strong>in</strong>g <strong>of</strong> the construct validity analysis is that for both regression<br />
models (an attributes only model and an attribute plus socio-economic variables model)<br />
for each region, the coefficient on tax is both negative and significant at the 5% level.<br />
eftec iv January 2006
<strong>Economic</strong> <strong>Valuation</strong> <strong>of</strong> <strong>Environmental</strong> <strong>Impacts</strong> <strong>in</strong> the Severely Disadvantaged Areas<br />
This <strong>in</strong>dicates that respondents were not mak<strong>in</strong>g random or arbitrary choices, but<br />
considered the cost <strong>of</strong> options before mak<strong>in</strong>g their choices.<br />
• Income was not found to be a significant determ<strong>in</strong>ant <strong>of</strong> WTP <strong>in</strong> the choice experiment<br />
for the three regions where it could be <strong>in</strong>cluded <strong>in</strong> the regression models. This could be<br />
largely due to the high non-response rate, particularly as <strong>in</strong>come was shown to be a<br />
significant determ<strong>in</strong>ant <strong>of</strong> WTP <strong>in</strong> the cont<strong>in</strong>gent valuation question, where all regions<br />
were pooled together for the analysis.<br />
• In all regions except the North East, at least two upland attributes positively affect<br />
respondents’ choices.<br />
• In general, other characteristics affect respondents’ choices as one would expect:<br />
people who consider environmental policy to be important, people who are members <strong>of</strong><br />
environmental or recreational clubs, more educated people, and people who visit SDAs<br />
more <strong>of</strong>ten (except <strong>in</strong> the North West, where many people visit them for work) are all<br />
more likely to be will<strong>in</strong>g to pay for upland landscape improvements.<br />
• Age, gender and rural/urban location, however, do not appear to consistently affect<br />
choices.<br />
Convergent validity<br />
• Comparison with the mean WTP estimate range supplied by the ELF model (suitably<br />
adjusted for appropriate comparison) shows that this study’s regional WTP estimates are<br />
broadly similar for rough grassland, broadleaf and mixed woodland and field boundaries,<br />
but dissimilar (generally higher) for heather moorland and bog.<br />
• Other studies valu<strong>in</strong>g landscapes which cover roughly comparable areas to those valued<br />
by respondents <strong>in</strong> this study show similar (or <strong>in</strong> one case higher) WTP for improvements<br />
<strong>in</strong> landscape attributes.<br />
E.6: Aggregation<br />
The study results <strong>in</strong>dicate a fair degree <strong>of</strong> heterogeneity between regions. The differences<br />
appear to be greater than could be expla<strong>in</strong>ed by socio-economic factors alone. Therefore<br />
we would suggest that there is some regional difference which cannot presently be<br />
expla<strong>in</strong>ed, which <strong>in</strong> particular may give rise to a significant degree <strong>of</strong> transfer error <strong>in</strong> a<br />
potential benefits transfer exercise. For this reason, we do not th<strong>in</strong>k it advisable to conduct<br />
a benefits transfer exercise from the South East results to the other two non-SDA regions <strong>of</strong><br />
England.<br />
For the purposes <strong>of</strong> aggregation, the valuation results should be aggregated across<br />
attributes, across the relevant population, and across time.<br />
Aggregat<strong>in</strong>g across attributes yields estimates for the compensat<strong>in</strong>g surplus (CS) for each<br />
region. This is the change <strong>in</strong> <strong>in</strong>come from an <strong>in</strong>dividual’s orig<strong>in</strong>al level that keeps the<br />
<strong>in</strong>dividual at the orig<strong>in</strong>al utility level given a new quantity level for a good. The CS<br />
estimates <strong>in</strong> this study therefore represent a measure <strong>of</strong> welfare <strong>in</strong> the form <strong>of</strong><br />
respondents’ average WTP to move from the state <strong>of</strong> the world given <strong>in</strong> Scenario 0 to the<br />
state <strong>of</strong> the world given <strong>in</strong> Scenarios 1 to 3.<br />
These CS estimates are then aggregated across the relevant regional populations (Table<br />
8.4) and across time (Table 8.8, E.2) through discount<strong>in</strong>g. Values found for the only<br />
transferable attribute (hay meadows) are also added. Table E.2 shows the f<strong>in</strong>al benefit<br />
estimate aggregated across attributes, population and time.<br />
eftec v January 2006
<strong>Economic</strong> <strong>Valuation</strong> <strong>of</strong> <strong>Environmental</strong> <strong>Impacts</strong> <strong>in</strong> the Severely Disadvantaged Areas<br />
Table E.2: Aggregation <strong>of</strong> benefits across attributes, population and time<br />
Scenario 1<br />
Scenario 2<br />
Scenario 3<br />
Env-agri<br />
Env only<br />
Aband-<strong>in</strong>tern<br />
Estimated annual net benefit <strong>of</strong> eventual change (£ per year)<br />
Choice experiment<br />
attributes –<br />
256,830,000<br />
301,860,000<br />
-14,690,000<br />
compensat<strong>in</strong>g<br />
(132,480,000 – (169,600,000 – (-50,740,000 –<br />
surplus (Table 8.4)<br />
Hay meadows<br />
421,700,000) 486,490,000)<br />
22,500,000)<br />
(Table 8.7) 62,000 156,000 -94,000<br />
Estimated discounted benefit over the period 2007-2013 (£ million)<br />
Choice experiment<br />
897<br />
1,054<br />
-51<br />
attributes<br />
(463 – 1,473) (592 – 1,699)<br />
(-177 – +79)<br />
Hay meadows 0.2 0.5 -0.3<br />
TOTAL 897<br />
1,055<br />
-51<br />
(463 – 1,473) (593 – 1,700)<br />
(-177 – +79)<br />
Figures <strong>in</strong> brackets <strong>in</strong>dicate 95% confidence <strong>in</strong>tervals.<br />
E.7 Conclusions<br />
This study is one <strong>of</strong> two <strong>in</strong>terl<strong>in</strong>ked studies seek<strong>in</strong>g to generate monetary valuation<br />
evidence to <strong>in</strong>form changes to Government support for agriculture <strong>in</strong> the LFAs (the other<br />
be<strong>in</strong>g Cumulus et al., 2005). The revision <strong>of</strong> this policy will affect land use management <strong>in</strong><br />
the SDAs, and as a result the current quality and quantity <strong>of</strong> various upland attributes or<br />
features. Cumulus et al. (2005) establish the basel<strong>in</strong>e changes <strong>in</strong> these attributes due to<br />
CAP and other currently planned reforms, and analyse the potential changes <strong>in</strong> the upland<br />
attributes under three policy revision options. The policy options presented <strong>in</strong> that report<br />
and used <strong>in</strong> this study are not def<strong>in</strong>itive predictions but possible outcomes. The conclusions<br />
<strong>of</strong> this study should be <strong>in</strong>terpreted with that caveat <strong>in</strong> m<strong>in</strong>d.<br />
The objective <strong>of</strong> this study was specifically to provide monetary estimates <strong>of</strong> the relative<br />
economic value <strong>of</strong> upland attributes <strong>in</strong> each GOR with SDAs so that the allocation <strong>of</strong> funds<br />
can benefit from this <strong>in</strong>formation (e.g. more fund<strong>in</strong>g for the protection or improvement <strong>of</strong><br />
upland attributes valued more highly by the GOR population). Some <strong>of</strong> this <strong>in</strong>formation is<br />
collected through a choice experiment survey applied separately <strong>in</strong> each GOR with SDAs (as<br />
well as <strong>in</strong> the South East GOR) while some is estimated through benefits transfer. It was not<br />
possible to provide any quantitative monetised estimates for the changes <strong>in</strong> a number <strong>of</strong><br />
attributes due to lack <strong>of</strong> data.<br />
Individual preferences for upland attributes are only one part <strong>of</strong> the evidence needed to<br />
<strong>in</strong>form the policy revision. The conclusions presented here are based only on the f<strong>in</strong>d<strong>in</strong>gs <strong>of</strong><br />
this study and may not necessarily be the conclusions reached at the end <strong>of</strong> the policy<br />
appraisal process which should consider other evidence (e.g. expert op<strong>in</strong>ion).<br />
On the basis <strong>of</strong> the stated preference survey, we can make the follow<strong>in</strong>g general<br />
conclusions:<br />
• On the whole, people are will<strong>in</strong>g to pay to contribute to the improvements <strong>in</strong> Severely<br />
Disadvantaged Areas and upland attributes associated with them. The exception to this<br />
are the results for the North West GOR which displayed a significant negative constant<br />
term <strong>in</strong> one <strong>of</strong> the regression models (that which considered the upland attributes<br />
alone), <strong>in</strong>dicat<strong>in</strong>g that respondents <strong>in</strong> the North West may actually prefer the current<br />
policy option to scenarios <strong>of</strong>fer<strong>in</strong>g alleged improvements. This fits <strong>in</strong> with attitud<strong>in</strong>al<br />
responses from the North West, and the fact that the policy cost (<strong>in</strong>creases <strong>in</strong> annual<br />
tax payments) attribute showed the most negative coefficient <strong>in</strong> the North West,<br />
<strong>in</strong>dicat<strong>in</strong>g an unwill<strong>in</strong>gness to pay. The North West results, along with the high<br />
will<strong>in</strong>gness to pay <strong>of</strong> South Eastern respondents, to some extent <strong>in</strong>dicates that people<br />
either value what they do not already have <strong>in</strong> abundance, or that people <strong>in</strong> the North<br />
eftec vi January 2006
<strong>Economic</strong> <strong>Valuation</strong> <strong>of</strong> <strong>Environmental</strong> <strong>Impacts</strong> <strong>in</strong> the Severely Disadvantaged Areas<br />
West are less will<strong>in</strong>g to pay alone for what they consider to be a national asset (the<br />
Lake District).<br />
• There are large variations <strong>in</strong> the values <strong>in</strong>dividuals place on landscape features across<br />
different regions that are not possible to expla<strong>in</strong> fully on the basis <strong>of</strong> socio-economic<br />
differences between populations.<br />
• Notwithstand<strong>in</strong>g the regional differences, on the whole, changes <strong>in</strong> the cultural<br />
heritage (if a large improvement) and policy cost attributes seem to have played a role<br />
<strong>in</strong> the choices respondents made. The consistently large coefficients for a large<br />
improvement <strong>in</strong> cultural heritage could be purely because a large discrete change (from<br />
“rapid decl<strong>in</strong>e” to “much better conservation”) was on <strong>of</strong>fer. If we had been able to<br />
measure the cultural heritage attribute quantitatively, and hence vary it cont<strong>in</strong>uously,<br />
it may not have been as consistently important <strong>in</strong> affect<strong>in</strong>g respondents’ choices. That<br />
said, it was clear from the focus groups, valuation workshops and reasons respondents<br />
gave for be<strong>in</strong>g will<strong>in</strong>g to pay for landscape improvements that cultural heritage is<br />
someth<strong>in</strong>g that is highly valued. Therefore, the implications <strong>of</strong> any agricultural or<br />
environmental improvement scheme on this attribute should be considered carefully.<br />
• In terms <strong>of</strong> the other attributes, woodland was the next most likely to affect<br />
respondents’ choices, followed by heather moorland and bog, rough grassland and field<br />
boundaries; the latter did not appear to be highly valued. It is possible that<br />
respondents saw field boundaries as an attribute which could be rebuilt or replanted,<br />
and which was not gone forever if lost.<br />
• There is evidence <strong>of</strong> preference heterogeneity with<strong>in</strong> each region.<br />
• There is evidence (from the cont<strong>in</strong>gent valuation question <strong>in</strong> the survey) that<br />
<strong>in</strong>dividuals <strong>in</strong> one GOR with SDAs are likely to value the SDAs <strong>in</strong> the rest <strong>of</strong> England,<br />
albeit to a lesser extent than they do the SDAs <strong>in</strong> their own region. However, this<br />
result is derived from a context where respondents were asked to choose between the<br />
upper and lower ranges which attributes took under the choice experiment;<br />
respondents would presumably have been will<strong>in</strong>g to pay much less if they had been<br />
asked to pay for a much smaller improvement.<br />
• On the basis <strong>of</strong> the South East survey, there is also evidence that those who live <strong>in</strong><br />
regions without SDAs are likely to have positive preferences for the improvement <strong>of</strong><br />
upland attributes <strong>in</strong> the SDAs. However, due to significant but not completely<br />
expla<strong>in</strong>able differences <strong>in</strong> preferences across GORs, we cannot transfer the results <strong>of</strong><br />
the South East to London and East <strong>of</strong> England GORs which also do not have SDAs.<br />
• A f<strong>in</strong>al piece <strong>of</strong> evidence for non-use values comes from the f<strong>in</strong>d<strong>in</strong>g that many<br />
respondents <strong>in</strong> SDA GORs who said that they never visited SDAs were nevertheless<br />
will<strong>in</strong>g to pay for improvements.<br />
On the basis <strong>of</strong> the choice experiment and benefits transfer results, the “environment only”<br />
scenario (Scenario 2) appears to yield the greatest benefits. This is because it provides<br />
superior quantities <strong>of</strong> all attributes except rough grassland, which was not valued<br />
particularly highly by respondents. On the basis <strong>of</strong> the quantitative assessment by Cumulus<br />
et al. (2005), Scenario 3 (“Abandonment-<strong>in</strong>tensification”) was likely to generate<br />
disbenefits. The economic assessment <strong>in</strong> this study also comes up with a negative benefit<br />
estimate for this scenario, i.e. a disbenefit. However, it should be noted that this estimate<br />
is not significantly different from zero for any <strong>of</strong> the regions. Scenario 1 (“Environmentagri”)<br />
gives a benefit which is about 85% <strong>of</strong> that <strong>in</strong> Scenario 2.<br />
Other policy scenarios can be analysed us<strong>in</strong>g the results <strong>of</strong> the choice experiment as long as<br />
the magnitude <strong>of</strong> changes <strong>in</strong> the attributes forecast for the scenarios is with<strong>in</strong> the set up<br />
changes covered by the choice experiment. The economic value <strong>of</strong> any changes smaller or<br />
larger than the set covered <strong>in</strong> the experiment cannot be estimated us<strong>in</strong>g the results <strong>of</strong> this<br />
study.<br />
eftec vii January 2006
<strong>Economic</strong> <strong>Valuation</strong> <strong>of</strong> <strong>Environmental</strong> <strong>Impacts</strong> <strong>in</strong> the Severely Disadvantaged Areas<br />
This page is left <strong>in</strong>tentionally blank<br />
eftec viii January 2006
<strong>Economic</strong> <strong>Valuation</strong> <strong>of</strong> <strong>Environmental</strong> <strong>Impacts</strong> <strong>in</strong> the Severely Disadvantaged Areas<br />
Table <strong>of</strong> Contents<br />
1. INTRODUCTION.................................................................................. 1<br />
1.1<br />
1.2<br />
POLICY BACKGROUND ............................................................................... 1<br />
STUDY OUTLINE ..................................................................................... 1<br />
2. THE UPLAND ATTRIBUTES AND THEIR FORECAST CHANGES ...........................5<br />
2.1<br />
2.2<br />
2.3<br />
UPLAND ATTRIBUTES ................................................................................ 5<br />
POLICY SCENARIOS .................................................................................. 9<br />
ATTRIBUTE LEVEL CHANGES RESULTING FROM POLICY SCENARIOS ..................................11<br />
3. VALUATION METHODOLOGY ................................................................ 17<br />
3.1<br />
3.2<br />
3.3<br />
INTRODUCTION .....................................................................................17<br />
CONCEPTUAL BASIS.................................................................................18<br />
IMPLEMENTING THE STATED PREFERENCE SURVEY ...................................................20<br />
4. VALUATION OF LANDSCAPE – LITERATURE REVIEW.................................... 26<br />
4.1<br />
4.2<br />
4.3<br />
4.4<br />
OVERVIEW..........................................................................................26<br />
REVIEW STUDIES....................................................................................26<br />
INDIVIDUAL VALUATION STUDIES ....................................................................27<br />
ISSUES ARISING .....................................................................................28<br />
5. VALUATION OF ATTRIBUTES NOT INCLUDED IN THE CHOICE EXPERIMENT........ 30<br />
5.1<br />
5.2<br />
BENEFITS TRANSFER USING THE ENVIRONMENTAL LANDSCAPE FEATURES MODEL .....................30<br />
OTHER ATTRIBUTES ................................................................................31<br />
6. STATED PREFERENCE SURVEY: SUMMARY AND NON-MONETARY RESULTS ........ 33<br />
6.1<br />
6.2<br />
6.3<br />
MAIN QUESTIONNAIRE SUMMARY ....................................................................33<br />
SOCIO-ECONOMIC REPRESENTATIVENESS OF THE SAMPLE ............................................34<br />
ATTITUDES, OPINIONS AND OTHER INFORMATION ...................................................37<br />
7. VALIDITY TESTING ............................................................................ 40<br />
7.1<br />
7.2<br />
7.3<br />
7.4<br />
7.5<br />
CONTENT VALIDITY.................................................................................40<br />
CONSTRUCT VALIDITY: WTP FUNCTIONS ...........................................................45<br />
CONVERGENT VALIDITY: COMPARISON WITH PREVIOUS STUDIES .....................................52<br />
VALUATION WORKSHOP FINDINGS ..................................................................54<br />
VALIDITY TESTING - SUMMARY......................................................................54<br />
8. WILLINGNESS TO PAY RESULTS, AGGREGATION, POLICY IMPLICATIONS AND<br />
CONCLUSIONS ........................................................................................... 56<br />
8.1<br />
8.2<br />
8.3<br />
WTP RESULTS .....................................................................................56<br />
AGGREGATION......................................................................................58<br />
CONCLUSIONS ......................................................................................62<br />
REFERENCES ............................................................................................. 64<br />
Annexes<br />
(<strong>in</strong> separate documents)<br />
ANNEX 1 – FINAL FOCUS GROUP PROTOCOL<br />
ANNEX 2 – FOCUS GROUP REPORT<br />
ANNEX 3 - PILOT SURVEY REPORT<br />
ANNEX 4 - FINAL QUESTIONNAIRE<br />
ANNEX 5 – TECHNICAL ANNEX<br />
ANNEX 6 – VALUATION WORKSHOP PROTOCOL<br />
ANNEX 7 - VALUATION WORKSHOP – RESULTS AND DISCUSSION<br />
ANNEX 8 - PEER REVIEWER REPORT<br />
eftec ix January 2006
<strong>Economic</strong> <strong>Valuation</strong> <strong>of</strong> <strong>Environmental</strong> <strong>Impacts</strong> <strong>in</strong> the Severely Disadvantaged Areas<br />
This page is left <strong>in</strong>tentionally blank<br />
eftec x January 2006
<strong>Economic</strong> <strong>Valuation</strong> <strong>of</strong> <strong>Environmental</strong> <strong>Impacts</strong> <strong>in</strong> the Severely Disadvantaged Areas<br />
1. Introduction<br />
1.1 Policy Background<br />
This report covers the research, design and data analysis stages <strong>of</strong> a study to estimate the<br />
economic values <strong>of</strong> environmental features associated with the Severely Disadvantaged<br />
Areas <strong>in</strong> England, and the likely changes <strong>in</strong> these features that could result from the<br />
redesign <strong>of</strong> the Less Favoured Area policy.<br />
Severely Disadvantaged Areas (SDAs) and Disadvantaged Areas (DAs) together comprise the<br />
English “Less Favoured Areas”, a land classification <strong>in</strong>stigated at the EU level <strong>in</strong> 1975. All<br />
uplands are covered by the LFA. Farmers <strong>in</strong> Less Favoured Areas receive compensatory<br />
allowances for the fact that the nature <strong>of</strong> the surround<strong>in</strong>g physical landscape results <strong>in</strong><br />
higher production and transportation costs, as well as to acknowledge the role farmers play<br />
<strong>in</strong> ma<strong>in</strong>ta<strong>in</strong><strong>in</strong>g the landscape and rural communities. SDAs are <strong>of</strong>ten remote upland hillfarm<strong>in</strong>g<br />
areas which face particular difficulty <strong>in</strong> this respect. They <strong>in</strong>clude almost all <strong>of</strong> the<br />
upland areas <strong>in</strong> the North <strong>of</strong> England (<strong>in</strong>clud<strong>in</strong>g the Penn<strong>in</strong>es, Lake District and North York<br />
Moors), the Peak District, some <strong>of</strong> the English-Welsh border, and Exmoor and Dartmoor.<br />
The policy on support for upland farmers, i.e. the Hill Farm allowance (HFA), is currently<br />
be<strong>in</strong>g revised as part <strong>of</strong> the new Rural Development Regulation which covers the period<br />
2007-2013. However, what the new policy will be, <strong>in</strong>clud<strong>in</strong>g for the Severely Disadvantaged<br />
Areas, is currently not known. Consequently, despite some prelim<strong>in</strong>ary work <strong>in</strong> this area,<br />
the implications for agricultural practice and hence the landscape and environment are also<br />
not known with any great certa<strong>in</strong>ty. Notwithstand<strong>in</strong>g the current uncerta<strong>in</strong>ty, the ultimate<br />
policy objective <strong>of</strong> the LFA revision is to reward susta<strong>in</strong>able land management and the<br />
provision <strong>of</strong> public benefits.<br />
1.2 Study Outl<strong>in</strong>e<br />
1.2.1 Study objectives<br />
The pr<strong>in</strong>cipal objective <strong>of</strong> this study is to estimate the changes <strong>in</strong> external environmental<br />
values <strong>in</strong> the SDA associated with the land use changes that are expected to follow from<br />
potential revisions <strong>of</strong> the LFA. Other studies exam<strong>in</strong><strong>in</strong>g the possible economic effects <strong>of</strong><br />
policy design will consider the estimation <strong>of</strong> the social benefits <strong>of</strong> hill farm<strong>in</strong>g and analysis<br />
<strong>of</strong> the f<strong>in</strong>ancial position <strong>of</strong> farmers <strong>in</strong> the SDAs.<br />
A number <strong>of</strong> different environmental and landscape features associated with SDAs are<br />
<strong>in</strong>cluded <strong>in</strong> the study (referred to as ‘upland attributes’ <strong>in</strong> this report). It is assumed that<br />
each <strong>of</strong> these attributes could potentially be changed – for better or worse – by any changes<br />
<strong>in</strong> support to upland farm<strong>in</strong>g. Given the current uncerta<strong>in</strong>ty, as mentioned above, different<br />
scenarios <strong>of</strong> policy change are also exam<strong>in</strong>ed. Thus, the pr<strong>in</strong>cipal stages <strong>of</strong> the study can be<br />
summarised as follows:<br />
• Identify a number <strong>of</strong> different policy scenarios which could arise <strong>in</strong> relation to the<br />
revision <strong>of</strong> the LFA;<br />
• Predict the likely effects – predom<strong>in</strong>antly <strong>in</strong> terms <strong>of</strong> changes <strong>in</strong> quantity rather than<br />
quality - on fourteen different upland environmental attributes <strong>of</strong> these different policy<br />
scenarios;<br />
• Estimate the economic value <strong>of</strong> the changes <strong>in</strong> some (see Section 1.2.2 below) <strong>of</strong> these<br />
attributes through a stated preference survey (the pr<strong>in</strong>cipal method be<strong>in</strong>g choice<br />
experiment);<br />
eftec 1 January 2006
<strong>Economic</strong> <strong>Valuation</strong> <strong>of</strong> <strong>Environmental</strong> <strong>Impacts</strong> <strong>in</strong> the Severely Disadvantaged Areas<br />
• Estimate the economic value <strong>of</strong> the changes <strong>in</strong> the rest <strong>of</strong> the attributes (where<br />
possible) through benefits transfer; and<br />
• Aggregate the economic values per attribute to estimate the total welfare change for<br />
different LFA policy revision scenarios.<br />
The overall objective <strong>of</strong> the study is to provide evidence for <strong>in</strong>form<strong>in</strong>g the allocation <strong>of</strong> the<br />
exist<strong>in</strong>g upland support with<strong>in</strong> each region, at the current level. It is not about<br />
undertak<strong>in</strong>g, say, a cost benefit analysis to decide whether LFA support should be abolished<br />
or the funds allocated to LFA should be decreased or <strong>in</strong>creased. In order to <strong>in</strong>form the<br />
allocation decisions (both between different environmental attributes and across the<br />
regions with SDAs), the relevant <strong>in</strong>formation is the relative economic value associated with<br />
each upland attribute. This regional focus has <strong>in</strong>fluenced the design <strong>of</strong> the stated<br />
preference study, and <strong>in</strong> read<strong>in</strong>g the results for <strong>in</strong>dividual upland attributes (<strong>in</strong> Sections 6<br />
and 7) and the aggregated estimates (Section 8), this objective should be kept <strong>in</strong> m<strong>in</strong>d.<br />
1.2.2 Scope<br />
The scope <strong>of</strong> the project can be thought <strong>of</strong> <strong>in</strong> terms <strong>of</strong>: environmental impacts,<br />
geographical coverage and regional level disaggregation.<br />
In terms <strong>of</strong> environmental impacts, the long list <strong>of</strong> fourteen upland attributes to <strong>in</strong>clude <strong>in</strong><br />
the study was decided jo<strong>in</strong>tly by the project team and the Steer<strong>in</strong>g Group. These<br />
attributes, which are described <strong>in</strong> more detail <strong>in</strong> Section 2.1, are:<br />
• heather moorland and bog*;<br />
• improved grassland;<br />
• rough grassland*;<br />
• hay meadows;<br />
• bracken;<br />
• gorse;<br />
• arable & set aside land;<br />
• broadleaf and mixed woodland*;<br />
• coniferous woodland;<br />
• field boundaries*;<br />
• cultural heritage*;<br />
• water quantity;<br />
• water quality; and<br />
• greenhouse gas emissions.<br />
The attributes marked with an asterisk are <strong>in</strong>cluded <strong>in</strong> the stated preference questionnaire.<br />
This selection was suggested by the study team on the basis <strong>of</strong> the <strong>in</strong>itial research and<br />
focus group f<strong>in</strong>d<strong>in</strong>gs and approved by the Steer<strong>in</strong>g Group prior to the pilot survey.<br />
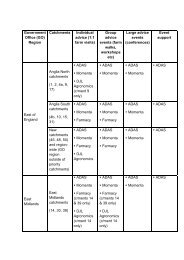
The overall geographical scope <strong>of</strong> the study is the SDAs <strong>in</strong> England, namely <strong>in</strong> six<br />
Government Office Regions (GORs) (see Fig 1.1): the North West, North East, Yorkshire and<br />
the Humber, East Midlands, West Midlands, and the South West. SDAs <strong>in</strong> other parts <strong>of</strong> the<br />
UK and Disadvantaged Areas are explicitly excluded.<br />
The stated preference study was designed and implemented separately <strong>in</strong> each <strong>of</strong> the<br />
above mentioned GORs <strong>in</strong> order to estimate the economic value <strong>of</strong> SDAs with<strong>in</strong> each region<br />
as expressed by the population <strong>of</strong> that region. In addition, we also <strong>in</strong>vestigated the<br />
economic value <strong>of</strong> the attributes <strong>of</strong> the SDAs as held by the population liv<strong>in</strong>g <strong>in</strong> GORs which<br />
do not conta<strong>in</strong> SDAs. In order to save time and budget, <strong>in</strong>stead <strong>of</strong> undertak<strong>in</strong>g a stated<br />
preference survey <strong>in</strong> each <strong>of</strong> the three GORs without SDAs, we implemented a survey <strong>in</strong> one<br />
<strong>of</strong> those, namely, the South East GOR. The aim was to transfer the results from the South<br />
East to the two other regions without SDAs (London and the East). The results <strong>of</strong> the<br />
surveys show that such a transfer is not advisable given the regional differences. This is<br />
eftec 2 January 2006
<strong>Economic</strong> <strong>Valuation</strong> <strong>of</strong> <strong>Environmental</strong> <strong>Impacts</strong> <strong>in</strong> the Severely Disadvantaged Areas<br />
further discussed <strong>in</strong> Section 8. Respondents <strong>in</strong> the six SDA-GORs were also asked a less<br />
detailed question about their value for SDAs <strong>in</strong> the regions <strong>of</strong> England other than their own.<br />
The feasibility <strong>of</strong> estimat<strong>in</strong>g (through benefits transfer) the economic values for the<br />
attributes excluded from the stated preference study us<strong>in</strong>g the evidence <strong>in</strong> the current<br />
literature is discussed <strong>in</strong> Section 5.<br />
Fig 1.1: Map <strong>of</strong> England show<strong>in</strong>g the Severely Disadvantaged Areas <strong>in</strong> p<strong>in</strong>k and GOR<br />
borders <strong>in</strong> green.<br />
1.2.3 Study and report structure<br />
A schematic show<strong>in</strong>g the study structure is given <strong>in</strong> Figure 1.2. The ‘policy – impact –<br />
economic values’ structure forms the basis <strong>of</strong> the study. The impact analysis was<br />
undertaken by Cumulus et al. (2005) and their f<strong>in</strong>d<strong>in</strong>gs on the upland attributes <strong>of</strong> <strong>in</strong>terest<br />
eftec 3 January 2006
<strong>Economic</strong> <strong>Valuation</strong> <strong>of</strong> <strong>Environmental</strong> <strong>Impacts</strong> <strong>in</strong> the Severely Disadvantaged Areas<br />
<strong>in</strong> the survey and the possible land use changes brought about by different potential policy<br />
scenarios are summarised <strong>in</strong> Section 2. Section 3 describes the conceptual bases <strong>of</strong> the<br />
valuation methodologies used and the stages <strong>in</strong> their practical implementation. Section 4<br />
discusses the literature review conducted as <strong>in</strong>itial research for the stated preference<br />
survey and the benefits transfer exercise. Section 5 discusses the estimation <strong>of</strong> value<br />
changes <strong>of</strong> the upland attributes which were not <strong>in</strong>cluded <strong>in</strong> the choice experiment. Section<br />
6 discusses the ma<strong>in</strong> survey results, and Section 7 the validity test<strong>in</strong>g <strong>of</strong> these results.<br />
Section 8 aggregates the survey results with these results to ga<strong>in</strong> estimates <strong>of</strong> the total<br />
value change, discusses the policy implications and outl<strong>in</strong>es the conclusions.<br />
CE<br />
SDA<br />
GORs<br />
(residents<br />
for own<br />
GOR)<br />
Policy<br />
scenarios<br />
Policy Impact <strong>Economic</strong><br />
Values<br />
1 non-SDA<br />
GOR<br />
(nonresidents<br />
for other<br />
GORs)<br />
CV<br />
SDA<br />
GORs<br />
(residents<br />
for other<br />
GORs)<br />
Impact<br />
analysis<br />
SP survey<br />
Aggregation<br />
Workshops<br />
Upland<br />
attributes<br />
Benefits<br />
transfer<br />
Figure 1.2: Flowchart show<strong>in</strong>g the structure <strong>of</strong> the study. Blue ellipses <strong>in</strong>dicate<br />
processes, while green boxes <strong>in</strong>dicate components <strong>of</strong> economic valuation. Italics <strong>in</strong>dicate<br />
<strong>in</strong>puts. CE and CV are short for Choice Experiment and Cont<strong>in</strong>gent <strong>Valuation</strong> – the two<br />
valuation methods used (see Section 3 for details).<br />
eftec 4 January 2006
<strong>Economic</strong> <strong>Valuation</strong> <strong>of</strong> <strong>Environmental</strong> <strong>Impacts</strong> <strong>in</strong> the Severely Disadvantaged Areas<br />
2. The Upland Attributes and Their Forecast Changes<br />
This Section presents the upland attributes exam<strong>in</strong>ed <strong>in</strong> the study, <strong>in</strong> terms <strong>of</strong> their<br />
def<strong>in</strong>ition and current trends (Section 2.1), and how they may be expected to change under<br />
four potential policy scenarios. The policies themselves are outl<strong>in</strong>ed <strong>in</strong> Section 2.2, and the<br />
expected changes <strong>in</strong> attribute levels <strong>in</strong> Section 2.3.<br />
Although eftec performed preparatory work on the current trends and forecasts <strong>in</strong> attribute<br />
levels at the beg<strong>in</strong>n<strong>in</strong>g <strong>of</strong> this study, this work was reviewed and extended <strong>in</strong> a parallel<br />
study by Cumulus et al. (2005). Consequently, the Cumulus report is used as the basis <strong>of</strong><br />
the rest <strong>of</strong> this report. For full details on current trends and forecasts <strong>in</strong> each <strong>of</strong> the<br />
attributes, the reader is referred to Cumulus et al. (2005).<br />
2.1 Upland Attributes<br />
2.1.1 Attribute long list<br />
The long list <strong>of</strong> upland attributes for use <strong>in</strong> the study was decided jo<strong>in</strong>tly by the project<br />
team and steer<strong>in</strong>g group. These attributes were chosen as they are most likely to be<br />
affected by changes <strong>in</strong> LFA policy.<br />
For those attributes that are essentially a habitat type, care has been taken to standardise<br />
the def<strong>in</strong>itions as much as possible to fit with other studies and allow use <strong>of</strong> other data. In<br />
particular, reference has been made to UK Biodiversity Action Plan (UKBAP) broad habitat<br />
def<strong>in</strong>itions 1 and the Countryside Survey (Ha<strong>in</strong>es-Young et al., 2000). Differences <strong>in</strong><br />
def<strong>in</strong>itions are discussed later. Note that <strong>in</strong> the uplands, particularly <strong>in</strong> unfenced areas<br />
used for extensive graz<strong>in</strong>g, many <strong>of</strong> these habitats can occur together <strong>in</strong> an <strong>in</strong>tricate<br />
mosaic.<br />
A description <strong>of</strong> the long list <strong>of</strong> attributes follows (numbered A1-A14).<br />
A1. Heather moorland and bog: Calluna vulgaris (heather) dom<strong>in</strong>ates heather moorland,<br />
although the extent <strong>of</strong> that dom<strong>in</strong>ation varies from very high <strong>in</strong> dry heath (typically<br />
on well-dra<strong>in</strong>ed nutrient-poor acid soils) to lower <strong>in</strong> wet heath (found on wetter,<br />
peaty soils). In areas <strong>of</strong> high ra<strong>in</strong>fall and over flatter areas and <strong>in</strong> hollows, bog<br />
habitat may be found. This high conservation value habitat is <strong>of</strong>ten characterised by<br />
a high cover <strong>of</strong> Sphagnum mosses. These habitats are all typically used as extensive<br />
graz<strong>in</strong>g, particularly for sheep. All <strong>of</strong> these habitats can be found over peat or peaty<br />
podsol soils, and peat erosion is <strong>of</strong>ten a problem when the habitat is over-grazed or<br />
subject to nutrient enrichment.<br />
A2. Improved grassland: This usually occurs on fertile soils, is dom<strong>in</strong>ated by fast-grow<strong>in</strong>g<br />
plant species preferred by livestock, and is used ma<strong>in</strong>ly for either pasture or silage.<br />
Improved grassland is typically found on the valley floors, or on the less steep slopes.<br />
These areas will be enclosed to keep <strong>in</strong> (or keep out) graz<strong>in</strong>g animals. Many<br />
improved grassland areas would have previously consisted <strong>of</strong> smaller fields, but <strong>in</strong><br />
places these have been amalgamated to make it easier to manage (apply<strong>in</strong>g fertiliser<br />
and herbicides, plough<strong>in</strong>g and re-seed<strong>in</strong>g) and to reduce boundary ma<strong>in</strong>tenance.<br />
A3. Rough grassland: This def<strong>in</strong>ition applies to areas typically used for extensive<br />
graz<strong>in</strong>g, usually by sheep, and <strong>in</strong> this study is taken to <strong>in</strong>clude acid grasslands<br />
(<strong>in</strong>clud<strong>in</strong>g grass dom<strong>in</strong>ated moorland) and calcareous grasslands. In areas <strong>of</strong> poor soil<br />
quality (acidic, nutrient poor), acid grasslands may <strong>of</strong>ten conta<strong>in</strong> some heather, or<br />
may be <strong>in</strong>termixed with heather moorland. As with heather, the colour <strong>of</strong> this<br />
1 see http://www.ukbap.org.uk/habitats.aspx<br />
eftec 5 January 2006
<strong>Economic</strong> <strong>Valuation</strong> <strong>of</strong> <strong>Environmental</strong> <strong>Impacts</strong> <strong>in</strong> the Severely Disadvantaged Areas<br />
habitat changes with season (and with mix <strong>of</strong> species) – <strong>in</strong> spr<strong>in</strong>g and summer green<br />
is predom<strong>in</strong>ant, but <strong>in</strong> autumn and w<strong>in</strong>ter some plants die back to give a ‘white<br />
moor’ appearance. In contrast, calcareous grassland is found on richer soils, <strong>of</strong>ten<br />
subdivided <strong>in</strong>to fields and is typically grazed a lot shorter than the poorer quality<br />
acid grassland.<br />
A4. Hay meadows: Typically found on soils that are neither too acidic nor too alkal<strong>in</strong>e,<br />
these grasslands reflect a land use that is much less important than previously. Hay<br />
meadows are periodically cut for a supply <strong>of</strong> hay, but are managed without the<br />
<strong>in</strong>puts associated with improved grassland. This management encourages and<br />
ma<strong>in</strong>ta<strong>in</strong>s high plant diversity, and this is therefore a high conservation value<br />
habitat.<br />
A5. Bracken dom<strong>in</strong>ated: Bracken (Pteridium aquil<strong>in</strong>um) is recognised as a pest species<br />
<strong>in</strong> many open upland habitats, as it is not eaten by livestock and can be hard to<br />
control once established. Spread <strong>of</strong> bracken can be encouraged on moorland by<br />
<strong>in</strong>appropriate management (e.g. burn<strong>in</strong>g), and the historic reduction <strong>in</strong> cattle on the<br />
hill is also thought to have assisted its spread. Bracken also harbours sheep ticks<br />
which spread Lyme disease and loup<strong>in</strong>g ill.<br />
A6. Gorse dom<strong>in</strong>ated: Gorse (Ulex europaeus) is a prickly legum<strong>in</strong>ous shrub with<br />
conspicuous yellow flowers, usually found on lighter (not deep peat) soils on moors<br />
and rough grassy habitats. Like bracken, gorse is considered an <strong>in</strong>vasive species <strong>in</strong>to<br />
some habitats and control is <strong>of</strong>ten attempted by burn<strong>in</strong>g, but it recovers well after<br />
fire. However, gorse can provide a good habitat for nest<strong>in</strong>g birds, and new growth<br />
can be eaten by brows<strong>in</strong>g animals.<br />
A7. Arable/set aside: In the uplands this land use is found only on the flatter/gently<br />
slop<strong>in</strong>g and more fertile areas. Crops may be grown <strong>in</strong> rotation with improved<br />
grassland, sometimes to provide supplementary or w<strong>in</strong>ter feed for livestock. Under<br />
agri-environment schemes, some fields may be left as stubbles or have a reduced<br />
cropp<strong>in</strong>g area due to uncultivated buffer strips, beetle banks or field corners.<br />
A8. Broadleaf and mixed woodland: In upland areas this habitat may consist <strong>of</strong> a mix <strong>of</strong><br />
native species, or be dom<strong>in</strong>ated by one. In different parts <strong>of</strong> the country different<br />
species may dom<strong>in</strong>ate or be <strong>of</strong> higher conservation importance. Broadleaf woodland<br />
is <strong>of</strong>ten newly established by plant<strong>in</strong>g young trees (usually with a stake for support<br />
and a plastic tube for protection). The spread <strong>of</strong> established woodland can be<br />
assisted by reduced graz<strong>in</strong>g and ground preparation (e.g. scarification). The most<br />
common species found naturally establish<strong>in</strong>g <strong>in</strong> upland areas is birch (Betula spp).<br />
Note that this habitat category is taken to <strong>in</strong>clude woodland habitats that may<br />
conta<strong>in</strong> native conifers such as yew (Taxus baccata) and juniper (Juniperus<br />
communis).<br />
A9. Coniferous woodland: The species used <strong>in</strong> forestry plantations are usually exotic,<br />
with probably the commonest be<strong>in</strong>g sitka spruce (Picea abies). Although there are<br />
still many rema<strong>in</strong><strong>in</strong>g examples <strong>of</strong> unsightly rectangular blocks on hillsides, guidel<strong>in</strong>es<br />
now dictate that modern coniferous forestry plantations are planted <strong>in</strong> a more<br />
landscape-friendly fashion. This <strong>in</strong>cludes hav<strong>in</strong>g irregular boundaries, with the sides<br />
<strong>of</strong> watercourses be<strong>in</strong>g left unplanted, and a m<strong>in</strong>imum area <strong>of</strong> native broadleaf trees<br />
also planted, most likely around the outside/lower part <strong>of</strong> the plantation to reduce<br />
visible impact.<br />
A10. Field boundaries: Included <strong>in</strong> this attribute are hedges, stone walls, ditches, banks<br />
and l<strong>in</strong>es <strong>of</strong> trees, but not modern fences. Field boundaries prevent the passage <strong>of</strong><br />
animals and demarcate fields, as well as be<strong>in</strong>g part <strong>of</strong> the visual landscape. In many<br />
upland areas, field boundaries are made up <strong>of</strong> traditional dry-stone walls. However,<br />
hedges can also be common and these can be a valuable habitat for many species.<br />
Hedges and stone walls are costly to ma<strong>in</strong>ta<strong>in</strong> and have <strong>of</strong>ten been replaced or<br />
supplemented by modern fences, and there has also been a move towards bigger<br />
field sizes result<strong>in</strong>g <strong>in</strong> removal <strong>of</strong> boundaries altogether.<br />
eftec 6 January 2006
<strong>Economic</strong> <strong>Valuation</strong> <strong>of</strong> <strong>Environmental</strong> <strong>Impacts</strong> <strong>in</strong> the Severely Disadvantaged Areas<br />
A11. Cultural heritage: This attribute may be taken to <strong>in</strong>clude the visual presence <strong>in</strong> the<br />
landscape <strong>of</strong> traditional farm build<strong>in</strong>gs. Less visual aspects may be the presence <strong>of</strong><br />
animals on the hill, traditional breeds, or traditional farm<strong>in</strong>g practices such as<br />
shepherd<strong>in</strong>g with sheep dogs.<br />
A12. Water quantity: This attribute may be taken to mean a range <strong>of</strong> conditions from<br />
drought to excess <strong>of</strong> water lead<strong>in</strong>g to flood<strong>in</strong>g, either <strong>in</strong> upland catchments or<br />
further down the river system. The important parameter <strong>in</strong> determ<strong>in</strong><strong>in</strong>g whether<br />
flood<strong>in</strong>g occurs is not overall precipitation but the frequency and severity <strong>of</strong><br />
<strong>in</strong>dividual precipitation events, comb<strong>in</strong>ed with variables such as soil moisture. It is<br />
thought that such flood<strong>in</strong>g is also exacerbated by lack <strong>of</strong> suitable vegetation <strong>in</strong> the<br />
uplands to slow down the flow <strong>of</strong> water <strong>in</strong>to the rivers.<br />
A13. Water quality: Water quality <strong>in</strong> the uplands is determ<strong>in</strong>ed to a great extent by<br />
agricultural pollution. This pollution, referred to as DWPA (diffuse water pollution<br />
from agriculture) consists <strong>of</strong> nitrogen, phosphorous, organic wastes, pesticides,<br />
veter<strong>in</strong>ary medic<strong>in</strong>es, micro-organisms and silt. The relative contributions <strong>of</strong> these<br />
different pollutants varies by agricultural activity and <strong>in</strong>tensity, and therefore also<br />
by farm type and geographical region.<br />
A14. Greenhouse gas emissions: There are several ma<strong>in</strong> gasses that contribute to the<br />
greenhouse effect, with probably the most important be<strong>in</strong>g carbon dioxide. In order<br />
to summarise the overall effect and make comparisons possible, a given quantity <strong>of</strong><br />
each greenhouse gas is usually converted to a carbon equivalent value which<br />
summarises its ‘global warm<strong>in</strong>g potential’. The habitat or activity <strong>in</strong> question can<br />
either be a greenhouse gas ‘source’ or ‘s<strong>in</strong>k’. In the uplands, certa<strong>in</strong> activities can<br />
be a source (e.g. carbon released by peat erosion, methane from livestock), or can<br />
be a s<strong>in</strong>k (e.g. via good condition ‘active’ bog habitat or through tree growth, both<br />
<strong>of</strong> which sequester carbon).<br />
2.1.2 Estimates <strong>of</strong> current trends<br />
For all habitat type attributes, estimates <strong>of</strong> recent rates <strong>of</strong> change <strong>in</strong> the extent <strong>of</strong> these<br />
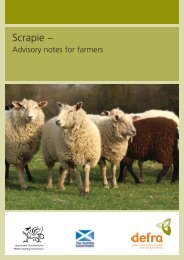
habitats were made. This was done us<strong>in</strong>g the data classified as ‘<strong>Environmental</strong> Zone 3’ from<br />
the Countryside Survey 2000 (CS2000), which is essentially the upland areas <strong>of</strong> England and<br />
Wales. As can be seen <strong>in</strong> Figure 2.1, Zone 3 corresponds very closely with the area <strong>of</strong><br />
England classified as SDA, but with the important addition <strong>of</strong> the uplands <strong>of</strong> Wales. As the<br />
data for England only is not readily available it was decided that the Zone 3 estimates <strong>of</strong><br />
habitat changes were acceptable as a broad-brush representation for the whole country.<br />
For most habitat types the amount <strong>of</strong> habitat loss/ga<strong>in</strong> between 1990 and 1998 (f<strong>in</strong>al<br />
column, Table 2.1) were obta<strong>in</strong>ed from the ma<strong>in</strong> report <strong>of</strong> the CS2000 (Ha<strong>in</strong>es-Young et al.,<br />
2000), however for bracken and field boundaries Zone 3 <strong>in</strong>formation was obta<strong>in</strong>ed from the<br />
survey website 2 . There are some def<strong>in</strong>ition differences between the habitats as def<strong>in</strong>ed <strong>in</strong><br />
this study, those <strong>in</strong> the CS2000, and those <strong>in</strong> the Land Cover 2000 data set supplied by<br />
<strong>Defra</strong>. Table 2.1 compares these habitat def<strong>in</strong>itions and <strong>in</strong>dicates where habitat types were<br />
amalgamated. For example, ‘Heather Moorland and Bog’ <strong>in</strong> this study corresponds to ‘Dwarf<br />
Shrub Heath’ and ‘Bog’ from CS2000. In this case the areas and changes <strong>in</strong> area were<br />
comb<strong>in</strong>ed to calculate a revised s<strong>in</strong>gle percentage change. A similar process was necessary<br />
with the ‘L<strong>in</strong>ear Boundary Features’ <strong>of</strong> CS2000. These data were re-analysed to give a rate<br />
<strong>of</strong> change for all boundary types (walls, hedges, l<strong>in</strong>es <strong>of</strong> trees/shrubs, bank<strong>in</strong>gs) except<br />
fences.<br />
2 See http://www.cs2000.org.uk/M01_tables/<strong>in</strong>dex.htm<br />
eftec 7 January 2006
<strong>Economic</strong> <strong>Valuation</strong> <strong>of</strong> <strong>Environmental</strong> <strong>Impacts</strong> <strong>in</strong> the Severely Disadvantaged Areas<br />
A B<br />
Figure 2.1: Map A shows the LFA Severely Disadvantaged Areas <strong>in</strong> England (p<strong>in</strong>k<br />
shad<strong>in</strong>g). Map B shows the area covered by <strong>Environmental</strong> Zone 3, as used by CS2000.<br />
Note that this Zone, whilst substantially correspond<strong>in</strong>g to the SDAs <strong>in</strong> England, also<br />
<strong>in</strong>cludes much <strong>of</strong> Wales.<br />
In the case <strong>of</strong> Hay Meadow, this attribute is considered a part <strong>of</strong> the Neutral Grassland<br />
CS2000 category, and even though this habitat conta<strong>in</strong>s two sub-habitats (neutral grassland<br />
and herb-rich), neither seemed to correspond closely to Hay Meadow. The change <strong>in</strong> area<br />
figure <strong>of</strong> -15 % quoted is therefore a compromise derived from the data for these two<br />
categories, and reflects an ongo<strong>in</strong>g loss <strong>of</strong> this habitat type. Quantitative estimates <strong>of</strong> rates<br />
<strong>of</strong> change <strong>in</strong> gorse area over the English SDA are not available. It has therefore been<br />
decided to adopt a current rate <strong>of</strong> change <strong>of</strong> zero, consider<strong>in</strong>g gorse as be<strong>in</strong>g controlled by<br />
brows<strong>in</strong>g animals and other management measures.<br />
Cumulus et al. (2005) reviewed whether the trends identified over the period 1990-1998<br />
should be modified <strong>in</strong> the light <strong>of</strong> any further <strong>in</strong>formation, but concluded that such further<br />
<strong>in</strong>formation was not available.<br />
eftec 8 January 2006
<strong>Economic</strong> <strong>Valuation</strong> <strong>of</strong> <strong>Environmental</strong> <strong>Impacts</strong> <strong>in</strong> the Severely Disadvantaged Areas<br />
Table 2.1: Comparison <strong>of</strong> attributes with the equivalent categories from the Land Cover<br />
2000 and Countryside Survey 2000, and the estimated % change over an 8 year period<br />
(used to def<strong>in</strong>e the current trend).<br />
Name <strong>of</strong> attributes <strong>in</strong><br />
this study<br />
Heather moorland<br />
and bog<br />
Improved grassland<br />
Rough grassland<br />
Hay meadow<br />
Bracken<br />
Gorse<br />
Arable (<strong>in</strong>clud<strong>in</strong>g setaside<br />
and fallow)<br />
Broadleaf and mixed<br />
woodland<br />
Coniferous woodland<br />
Field boundaries<br />
2.2 Policy Scenarios<br />
Categories <strong>in</strong> LC2000 Categories <strong>in</strong> CS2000 Estimated change<br />
(1990-1998)<br />
Moorland heath and<br />
bog<br />
Dwarf Shrub Heath<br />
Bog<br />
+1%<br />
Improved grassland Improved Grassland<br />
+7%<br />
Rough grass<br />
Acid grass<br />
Calcareous grass<br />
Improved grassland<br />
(subdivided by <strong>Defra</strong>)<br />
Acid Grassland<br />
Calcareous Grassland -13%<br />
Neutral Grassland (a<br />
part <strong>of</strong>)<br />
Bracken Bracken<br />
Not <strong>in</strong>cluded as a category<br />
Arable / set-aside Arable and<br />
horticultural<br />
Broad-leaved/mixed Broadleaved, Mixed<br />
woodland<br />
and Yew Woodland<br />
Coniferous woodland Coniferous woodland<br />
Not <strong>in</strong>cluded as a<br />
category<br />
Boundary and L<strong>in</strong>ear<br />
Features<br />
The follow<strong>in</strong>g describes the policy scenarios (or “policy options”) used <strong>in</strong> this study.<br />
Accord<strong>in</strong>g to Cumulus et al. (2005), “all scenarios cover the seven year period 2007 to 2013,<br />
which is the period for any revised system <strong>of</strong> support for upland farmers”.<br />
In all scenarios, the hypothesised effects <strong>of</strong> the policies outl<strong>in</strong>ed are superimposed on<br />
current trends. CAP reform and the <strong>Environmental</strong> Stewardship Scheme are assumed to<br />
have taken place <strong>in</strong> all scenarios. Scenarios 0, 1 and 2 assume that there is cont<strong>in</strong>ued and<br />
adequate fund<strong>in</strong>g to support vary<strong>in</strong>g degrees <strong>of</strong> upland farm<strong>in</strong>g <strong>in</strong> the SDA, and these policy<br />
options therefore describe differ<strong>in</strong>g emphasis (<strong>in</strong> direction and degree) <strong>of</strong> available<br />
fund<strong>in</strong>g. Option 3 (Abandonment-<strong>in</strong>tensification) is a ‘no subsidy’ scenario, assum<strong>in</strong>g that<br />
support for upland farm<strong>in</strong>g has been withdrawn.<br />
Accord<strong>in</strong>g to Cumulus et al. (2005):<br />
“It should be noted that these scenarios and assumptions are <strong>in</strong>tended to show only the<br />
impacts <strong>of</strong> chang<strong>in</strong>g forms <strong>of</strong> upland support, not the impacts <strong>of</strong> other possible changes<br />
(e.g. market changes, further reductions <strong>in</strong> the value <strong>of</strong> the S<strong>in</strong>gle Payment, or lower than<br />
anticipated agri-environment scheme fund<strong>in</strong>g).”<br />
The scenario descriptions are <strong>in</strong>terpretations <strong>of</strong> ways <strong>in</strong> which the policy options could be<br />
implemented and do not represent government policy, nor do they necessarily reflect how<br />
the policies would actually be implemented.<br />
The follow<strong>in</strong>g descriptions <strong>of</strong> the policy scenarios are taken from Cumulus et al. (2005).<br />
eftec 9 January 2006<br />
-15%<br />
+8%<br />
0%<br />
-5%<br />
+4%<br />
-7%<br />
+9%
<strong>Economic</strong> <strong>Valuation</strong> <strong>of</strong> <strong>Environmental</strong> <strong>Impacts</strong> <strong>in</strong> the Severely Disadvantaged Areas<br />
2.2.1 Scenario 0 - Basel<strong>in</strong>e<br />
Under the basel<strong>in</strong>e scenario, there is no change <strong>in</strong> the strategic aims, structure and level <strong>of</strong><br />
upland support. Support rema<strong>in</strong>s focused on ma<strong>in</strong>ta<strong>in</strong><strong>in</strong>g upland farm<strong>in</strong>g system. In other<br />
words the Hill Farm Allowance (HFA) scheme rema<strong>in</strong>s broadly the same as it is presently.<br />
It is assumed that CAP reform has been implemented from the beg<strong>in</strong>n<strong>in</strong>g <strong>of</strong> 2005 and that<br />
the level <strong>of</strong> the S<strong>in</strong>gle Payment will reduce by about 20% over the period given anticipated<br />
deductions for the national reserve, modulation and f<strong>in</strong>ancial discipl<strong>in</strong>e.<br />
It is also assumed that the agri-environment scheme budget will <strong>in</strong>crease from its present<br />
level <strong>of</strong> £180 million per year to £400 million per year by 2013. This <strong>in</strong>cludes an <strong>in</strong>crease <strong>in</strong><br />
the coverage <strong>of</strong> Entry Level Stewardship (ELS) to 60% <strong>of</strong> all farmland by the end <strong>of</strong> 2007 and<br />
75% by 2013.<br />
2.2.2 Scenario 1 - Environment-agri<br />
Under Scenario 1, the strategic policy aims reflect the importance <strong>of</strong> environmental and<br />
conservation objectives and the importance <strong>of</strong> ma<strong>in</strong>ta<strong>in</strong><strong>in</strong>g upland farm<strong>in</strong>g systems to<br />
achieve these objectives. HFA-type support amount<strong>in</strong>g to around £27 million per year still<br />
exists but it is focused on SDA land only. Furthermore eligibility for support is dependent<br />
upon producers hav<strong>in</strong>g all or part <strong>of</strong> their hold<strong>in</strong>g <strong>in</strong> an exist<strong>in</strong>g or new agri-environment<br />
scheme. Exist<strong>in</strong>g schemes <strong>in</strong>clude <strong>Environmental</strong>ly Sensitive Area (ESA) or Countryside<br />
Stewardship (CSS) schemes. New schemes refer to <strong>Environmental</strong> Stewardship (ES) schemes<br />
<strong>in</strong>clud<strong>in</strong>g Entry Level Stewardship (ELS), Organic Entry Level Stewardship (OELS) or Higher<br />
Level Stewardship (HLS). Farmers would be paid for all their land <strong>in</strong> the SDA (not just land<br />
<strong>in</strong> an agri-environment scheme).<br />
The aims <strong>of</strong> the changes are firstly to target exist<strong>in</strong>g resources where they will have most<br />
impact <strong>in</strong> terms <strong>of</strong> ma<strong>in</strong>ta<strong>in</strong><strong>in</strong>g and enhanc<strong>in</strong>g the upland environment (there is a<br />
concentration <strong>of</strong> environmental assets <strong>in</strong> SDAs and farm<strong>in</strong>g practices which support these<br />
assets are particularly under threat <strong>in</strong> these areas) and secondly to provide a further<br />
<strong>in</strong>centive to farmers to jo<strong>in</strong> <strong>Environmental</strong> Stewardship. The result would be more land<br />
be<strong>in</strong>g entered <strong>in</strong>to ELS, OELS and HLS than otherwise and the associated delivery <strong>of</strong> greater<br />
environmental outcomes. This scenario can be considered as the <strong>in</strong>verse <strong>of</strong> the basel<strong>in</strong>e<br />
(agri-environment), as it is essentially a switch <strong>in</strong> emphasis from agriculture to<br />
environment.<br />
Other changes under this scenario <strong>in</strong>clude target<strong>in</strong>g upland support at all livestock farmers<br />
(as opposed to beef and sheep farmers only) and remov<strong>in</strong>g the current system <strong>of</strong> enhanced<br />
HFA payments if certa<strong>in</strong> environmental criteria are met. This latter system is superseded by<br />
the requirement for producers to have all or part <strong>of</strong> their land <strong>in</strong> an agri-environment<br />
scheme <strong>in</strong> order to be eligible for HFA payments.<br />
The CAP reform and agri-environment scheme assumptions (e.g. the agri-environment<br />
scheme budget) rema<strong>in</strong> the same as under the basel<strong>in</strong>e scenario.<br />
2.2.3 Scenario 2 - Environment only<br />
Under Scenario 2, the strategic aims for upland support are focused solely on achiev<strong>in</strong>g<br />
environmental goals. It is assumed that exist<strong>in</strong>g support amount<strong>in</strong>g to £27 million per year<br />
is ma<strong>in</strong>ta<strong>in</strong>ed but it is <strong>in</strong>corporated <strong>in</strong>to the agri-environment scheme budget and r<strong>in</strong>gfenced<br />
for the uplands, specifically the SDAs. It is assumed that such a r<strong>in</strong>g fence would be<br />
demanded by stakeholders to ensure that the fund<strong>in</strong>g was not simply subsumed <strong>in</strong>to<br />
broader budgetary plann<strong>in</strong>g and used to displace other funds sought from Treasury for<br />
scheme growth. The HFA scheme disappears.<br />
eftec 10 January 2006
<strong>Economic</strong> <strong>Valuation</strong> <strong>of</strong> <strong>Environmental</strong> <strong>Impacts</strong> <strong>in</strong> the Severely Disadvantaged Areas<br />
In practice it is assumed that the fund<strong>in</strong>g is used for an Upland Entry Level Stewardship<br />
Scheme (UELS) and would take the form <strong>of</strong> annual payments targeted at enhanc<strong>in</strong>g specific,<br />
valuable or threatened upland habitats or features alongside ESA, CSS, ELS, OELS and HLS.<br />
Examples <strong>of</strong> UELS options might <strong>in</strong>clude payments for:<br />
• active graz<strong>in</strong>g and/or cutt<strong>in</strong>g management accord<strong>in</strong>g to specific tailored plans for<br />
<strong>in</strong>dividual upland areas;<br />
• mixed graz<strong>in</strong>g, <strong>in</strong>clud<strong>in</strong>g cattle (an upland equivalent <strong>of</strong> exist<strong>in</strong>g ELS Option EK5 ‘mixed<br />
stock<strong>in</strong>g’);<br />
• shepherd<strong>in</strong>g or ma<strong>in</strong>ta<strong>in</strong><strong>in</strong>g hefted flocks on the poorest graz<strong>in</strong>g areas;<br />
• the management <strong>of</strong> archaeological sites through graz<strong>in</strong>g;<br />
• moorland grip block<strong>in</strong>g and rewett<strong>in</strong>g <strong>of</strong> upland agricultural areas;<br />
• <strong>in</strong>creas<strong>in</strong>g vegetation through low <strong>in</strong>tensity land management;<br />
• prepar<strong>in</strong>g management plans e.g. Moorland Management Plans and Manure, Nutrient and<br />
Waste Management Plans.<br />
Re-focused support <strong>of</strong> this type is likely to lead to more significant redistributive effects<br />
than under scenario 1.<br />
The CAP reform and agri-environment scheme assumptions rema<strong>in</strong> the same as under the<br />
basel<strong>in</strong>e scenario.<br />
2.2.4 Scenario 3 – Abandonment-<strong>in</strong>tensification<br />
Under Scenario 3, upland support is withdrawn entirely. Exist<strong>in</strong>g fund<strong>in</strong>g <strong>of</strong> £27 million per<br />
year disappears and is ‘lost’ from the uplands. The CAP reform and agri-environment<br />
scheme assumptions rema<strong>in</strong> the same as under the basel<strong>in</strong>e scenario. In other words, there<br />
will be still be more agri-environment scheme fund<strong>in</strong>g, some <strong>of</strong> which will be used <strong>in</strong> the<br />
uplands, despite the loss <strong>of</strong> the HFA scheme.<br />
2.3 Attribute Level Changes Result<strong>in</strong>g From Policy Scenarios<br />
The difficulty <strong>in</strong> mak<strong>in</strong>g predictive assessments <strong>of</strong> CAP reform are acknowledged (GFA-RACE<br />
& IEEP, 2003), and the difficulties <strong>in</strong> predict<strong>in</strong>g the impacts <strong>of</strong> further policy changes<br />
considered here are even greater. Given the uncerta<strong>in</strong>ty attached to all predictions at this<br />
stage, those conta<strong>in</strong>ed <strong>in</strong> this report should be considered as examples <strong>of</strong> possible<br />
outcomes, rather than def<strong>in</strong>itive predictions.<br />
With regards to climate change, the UKCIP scenarios (Hulme et al., 2002) for low and<br />
medium-low emissions for the year 2020 have been consulted for possible impacts.<br />
Although the predicted climate changes will have different regional impacts (e.g. Holman<br />
et al., 2002), and will affect different habitats to different rates and extents, these<br />
impacts are considered m<strong>in</strong>or with<strong>in</strong> the timescale considered, compared to policy-<strong>in</strong>duced<br />
changes. The one exception to this is precipitation changes, which are taken <strong>in</strong>to account<br />
<strong>in</strong> predict<strong>in</strong>g flood risk (water quantity).<br />
Cumulus et al. (2005) provide predictions <strong>of</strong> the likely effects <strong>of</strong> the policy scenarios upon<br />
the different attributes. These are summarised <strong>in</strong> Table 2.2 at the end <strong>of</strong> this Section.<br />
Edited versions <strong>of</strong> Cumulus et al. derivations <strong>of</strong> these changes are given for each<br />
attribute below 3 . However, for a full, detailed explanation, the reader is referred to<br />
the Cumulus report.<br />
3 In places where Cumulus et al. were <strong>in</strong> broad agreement with eftec’s <strong>in</strong>itial report for this study, some <strong>of</strong> the<br />
text used here may be taken from the <strong>in</strong>itial report.<br />
eftec 11 January 2006
<strong>Economic</strong> <strong>Valuation</strong> <strong>of</strong> <strong>Environmental</strong> <strong>Impacts</strong> <strong>in</strong> the Severely Disadvantaged Areas<br />
A1. Heather moorland and bog:<br />
Scenario 0: A forecast reduction <strong>in</strong> cattle numbers and a greater emphasis on sheep<br />
production have significant implications for heather moorland and bog. Reduced graz<strong>in</strong>g<br />
pressure may well result <strong>in</strong> heather re-establish<strong>in</strong>g itself <strong>in</strong> areas where it has been<br />
suppressed by graz<strong>in</strong>g (e.g. on rough grassland). In addition, HLS will be targeted at<br />
extensive SSSI (Sites <strong>of</strong> Special Scientific Interest) heather moorland areas. Much <strong>of</strong> what<br />
happens will depend on the actual management <strong>of</strong> heather moorland as well as the<br />
absolute graz<strong>in</strong>g pressure. Practices such as shepherd<strong>in</strong>g, heather burn<strong>in</strong>g and bracken<br />
control are all important factors <strong>in</strong> the management <strong>of</strong> upland areas, heather moorland <strong>in</strong><br />
particular. The expected decl<strong>in</strong>e <strong>in</strong> labour and the loss <strong>of</strong> traditional upland management<br />
skills could have a significant bear<strong>in</strong>g on what happens to heather moorland.<br />
Other Scenarios: Small <strong>in</strong>creases <strong>in</strong> the extent <strong>of</strong> this attribute are estimated under<br />
Scenarios 1 (+3%) and 2 (+5%), as graz<strong>in</strong>g pressure reduces. However these <strong>in</strong>creases are<br />
limited due to the loss <strong>of</strong> cattle and <strong>in</strong>creases <strong>in</strong> some places <strong>of</strong> rough grassland and<br />
bracken. There should be some improvements <strong>in</strong> the quality <strong>of</strong> heather moorland as ELS<br />
and HLS kick <strong>in</strong> – especially towards 2008/9 and beyond (and more so <strong>in</strong> Scenario 2 than 1).<br />
In Scenario 3, loss <strong>of</strong> LFA support could tip the economic balance for some farmers and<br />
result <strong>in</strong> further reduction <strong>in</strong> graz<strong>in</strong>g result<strong>in</strong>g <strong>in</strong> a decl<strong>in</strong>e <strong>in</strong> this attribute, although agrienvironment<br />
schemes will help to counter this effect.<br />
A2. Improved grassland:<br />
Scenario 0: As a result <strong>of</strong> the 2003 CAP reforms, some upland farmers are likely to place<br />
greater emphasis on f<strong>in</strong>ish<strong>in</strong>g animals. There will be pressure to farm <strong>in</strong>tensively on lower,<br />
better land (compared to the extensification and switch to agri-environment management<br />
that will occur elsewhere) and grassland improvement is likely to cont<strong>in</strong>ue, ma<strong>in</strong>ly on areas<br />
<strong>of</strong> neutral and rough grassland. Land taken out <strong>of</strong> arable cropp<strong>in</strong>g is also likely to be<br />
reverted to improved grassland; the extent <strong>of</strong> this area will be relatively small, however,<br />
given that arable cropp<strong>in</strong>g only occurs on 1% <strong>of</strong> upland farms. Given that grassland<br />
improvement was a trend already be<strong>in</strong>g witnessed before the reforms, it is estimated that<br />
the extent <strong>of</strong> improved grassland will <strong>in</strong>crease. The expansion <strong>of</strong> agri-environment schemes<br />
will help to counter the <strong>in</strong>tensification trend.<br />
Other Scenarios: Scenarios 1 and 2 are likely to slow the <strong>in</strong>tensification trend identified<br />
under Scenario 0. More modest <strong>in</strong>creases are expected under Scenario 1 (+1%) and no<br />
<strong>in</strong>crease expected under Scenario 2. In Scenario 3, loss <strong>of</strong> LFA support will affect all<br />
farmers and the trend towards <strong>in</strong>tensification is likely to be reduced to the extent that<br />
improved grassland decl<strong>in</strong>es by 2%.<br />
A3. Rough grassland:<br />
Scenario 0: As discussed <strong>in</strong> relation to heather moorland, the expected reduction <strong>in</strong> cattle<br />
numbers and the withdrawal <strong>of</strong> labour result<strong>in</strong>g <strong>in</strong> less shepherd<strong>in</strong>g, heather management<br />
etc. may result <strong>in</strong> the loss <strong>of</strong> some heather moor and an <strong>in</strong>crease <strong>in</strong> rough grassland over a<br />
period <strong>of</strong> time. Much will depend on the absolute graz<strong>in</strong>g pressure, the management <strong>of</strong><br />
livestock, the demand for improved grassland further up the hill and the counter<strong>in</strong>g factor<br />
<strong>of</strong> conservation and agri-environment strategies. Increases <strong>in</strong> bracken and woodland will be<br />
counter<strong>in</strong>g factors to the expansion <strong>of</strong> rough grassland. Scenario 0 could result <strong>in</strong> either<br />
small decreases or larger <strong>in</strong>creases depend<strong>in</strong>g particularly on the change <strong>in</strong> heather<br />
moorland.<br />
Other Scenarios: Changes <strong>in</strong> the extent <strong>of</strong> rough grassland are l<strong>in</strong>ked to changes <strong>in</strong><br />
attributes such as heather moorland, <strong>in</strong>tensive grassland, bracken, gorse and woodland,<br />
and are <strong>in</strong>fluenced by what happens to cattle numbers and overall graz<strong>in</strong>g pressure.<br />
Scenarios 1 and 2 are likely to result <strong>in</strong> small decl<strong>in</strong>es (1% and 3% respectively) <strong>in</strong> the<br />
extent <strong>of</strong> rough grassland as agri-environment schemes and LFA fund<strong>in</strong>g promote the<br />
extension and management <strong>of</strong> other habitats such as heather moorland and woodland.<br />
Scenario 3 is likely to result <strong>in</strong> a reversed trend with an <strong>in</strong>crease <strong>in</strong> rough grassland (5%) as<br />
the loss <strong>of</strong> LFA fund<strong>in</strong>g beg<strong>in</strong>s to be felt.<br />
eftec 12 January 2006
<strong>Economic</strong> <strong>Valuation</strong> <strong>of</strong> <strong>Environmental</strong> <strong>Impacts</strong> <strong>in</strong> the Severely Disadvantaged Areas<br />
A4. Hay meadows:<br />
Scenario 0: It is anticipated that species-rich hay meadow will cont<strong>in</strong>ue to be protected<br />
under agri-environment scheme agreements and will be targeted for future HLS agreement.<br />
Many meadows are also protected by SSSI legislation and are designated Special Areas <strong>of</strong><br />
Conservation under the EU Habitats Directive. However, the value <strong>of</strong> hay meadows to<br />
farmers will cont<strong>in</strong>ue to decl<strong>in</strong>e, with the loss <strong>of</strong> cattle <strong>in</strong> particular; agri-environment<br />
payments would need to be <strong>in</strong>creas<strong>in</strong>gly attractive to susta<strong>in</strong> meadow management.<br />
Other Scenarios: Cont<strong>in</strong>u<strong>in</strong>g the explanations for scenario 0, the expected net results would<br />
be a slow decl<strong>in</strong>e <strong>in</strong> the area <strong>of</strong> hay meadow under Scenario 1 (-3%) and ma<strong>in</strong>tenance under<br />
Scenario 2. Greater losses (-10%) would occur under Scenario 3.<br />
A5. Bracken dom<strong>in</strong>ated:<br />
Scenario 0: The extent <strong>of</strong> bracken will be determ<strong>in</strong>ed by the graz<strong>in</strong>g pressure and the type<br />
<strong>of</strong> graz<strong>in</strong>g as well as the use (or not) <strong>of</strong> control strategies. The decl<strong>in</strong>e <strong>in</strong> cattle, (expected<br />
as a result <strong>of</strong> the 2003 Mid-Term CAP reforms) and the reduction <strong>in</strong> graz<strong>in</strong>g pressure overall<br />
suggests bracken may become difficult to control and will cont<strong>in</strong>ue to spread. Agrienvironment<br />
schemes and uptake will be important factors <strong>in</strong> relation to control.<br />
Other Scenarios: Cattle control bracken, so reductions <strong>in</strong> their number will lead to bracken<br />
spread. In Scenario 1 animal numbers fall more than under the basel<strong>in</strong>e, and whilst there<br />
are still control subsidies, the rate <strong>of</strong> spread <strong>in</strong>creases slightly as upland habitats are<br />
managed less. This rate drops <strong>in</strong> Scenario 2 as there is more money available for control,<br />
probably through spray<strong>in</strong>g and/or cutt<strong>in</strong>g. The rate <strong>of</strong> spread jumps dramatically <strong>in</strong><br />
Scenario 3 due to a lack <strong>of</strong> animals on the hills and a lack <strong>of</strong> <strong>in</strong>centive to undertake control.<br />
A6. Gorse dom<strong>in</strong>ated:<br />
Scenario 0: Gorse is not specifically encouraged for conservation purposes although can be<br />
a valuable component <strong>of</strong> upland habitats. Fewer livestock are likely to create conditions<br />
under which gorse will spread.<br />
Other Scenarios: Under Scenarios 1 and 2 gorse will <strong>in</strong>crease, but less than <strong>in</strong> Scenario 0,<br />
due to active management. There is likely to be a higher percentage <strong>in</strong>crease under<br />
Scenario 3.<br />
A7. Arable/set aside:<br />
Scenario 0: Only 1% <strong>of</strong> upland farms are classified as cereal or general cropp<strong>in</strong>g farms.<br />
These farms will probably decl<strong>in</strong>e under all scenarios, <strong>in</strong>clud<strong>in</strong>g Scenario 0, and those that<br />
rema<strong>in</strong> will make more use <strong>of</strong> set-aside and fallow. However this is still technically<br />
classified as arable land so the overall area may not decl<strong>in</strong>e significantly, rather its<br />
management will change. Where arable land use does change it is likely to become<br />
improved grassland. Gett<strong>in</strong>g arable cropp<strong>in</strong>g back <strong>in</strong> the uplands is a key objective for some<br />
environmental <strong>in</strong>terests (e.g. RSPB) and agri-environment schemes already <strong>of</strong>fer some<br />
options. In the future, arable will be a target habitat <strong>in</strong> the uplands and there is likely to<br />
be some small <strong>in</strong>crease <strong>in</strong> extensive arable cropp<strong>in</strong>g for conservation purposes<br />
Other scenarios: In cont<strong>in</strong>uation <strong>of</strong> the explanation for Scenario 0, under Scenarios 1 and 2,<br />
losses <strong>in</strong> arable land will be reduced by the measures discussed (-3% and -1% respectively).<br />
Under Scenario 3 there is likely to be a slightly greater decl<strong>in</strong>e than the Scenario 0 (-5%).<br />
A8. Broadleaf and mixed woodland:<br />
Scenario 0: Broadleaf and mixed woodland creation is policy driven and much depends on<br />
the EARDF (European Agriculture Rural Development Fund) rules and budgets post 2007.<br />
Woodland cover will <strong>in</strong>crease through a comb<strong>in</strong>ation <strong>of</strong> schemes/grants, demand for short<br />
eftec 13 January 2006
<strong>Economic</strong> <strong>Valuation</strong> <strong>of</strong> <strong>Environmental</strong> <strong>Impacts</strong> <strong>in</strong> the Severely Disadvantaged Areas<br />
rotation coppice for energy and natural succession but <strong>in</strong>creases due to natural succession<br />
are likely to be curtailed by cross-compliance requirements and the relatively short<br />
timescale (to 2013).<br />
Other Scenarios: This attribute <strong>in</strong>creases successively through Scenarios 1 and 2, aga<strong>in</strong><br />
because <strong>of</strong> the <strong>in</strong>creas<strong>in</strong>g importance and success <strong>of</strong> environmental/conservation schemes.<br />
However, the rate then drops <strong>in</strong> Scenario 3 due to a reduction <strong>in</strong> active management for<br />
this woodland type, and although native herbivores (deer, rabbits) contribute to some<br />
control, there is still natural <strong>in</strong>vasion, particularly by birch onto moorland habitats.<br />
A9. Coniferous woodland:<br />
Scenario 0: The current policy emphasis is on broadleaf plant<strong>in</strong>g/expansion but<br />
opportunities under new EAFRD for afforestation could result <strong>in</strong> more coniferous plant<strong>in</strong>g.<br />
This may appeal to some non-farm<strong>in</strong>g owners although the tax advantages <strong>of</strong> forestry<br />
<strong>in</strong>vestment are much more limited than previously and the present and likely future<br />
markets for s<strong>of</strong>twood timber would not encourage significant expansion. S<strong>in</strong>gle Payment<br />
would also be forfeited. As such we consider that there is unlikely to be an overall <strong>in</strong>crease<br />
<strong>in</strong> coniferous woodland but <strong>in</strong>stead a slow decl<strong>in</strong>e.<br />
Other Scenarios: Cumulus et al. (2005) do not provide any discussion <strong>of</strong> how the other<br />
scenario figures are arrived at apart from to repeat the above paragraph and to add: “This<br />
may be stemmed under Scenario 3 given the lack <strong>of</strong> other alternatives, particularly on<br />
marg<strong>in</strong>al land.”<br />
A10. Field boundaries:<br />
Scenario 0: We would suggest that there is likely to be a steady improvement <strong>in</strong> the quality<br />
and extent <strong>of</strong> traditional field boundaries as a result <strong>of</strong> cross compliance, the cont<strong>in</strong>uation<br />
<strong>of</strong> ESA agreements <strong>in</strong> large parts <strong>of</strong> the uplands for the next 5-10 years and the <strong>in</strong>troduction<br />
<strong>of</strong> ELS and HLS. Negative <strong>in</strong>fluences <strong>in</strong>clude loss <strong>of</strong> farm pr<strong>of</strong>itability (required to pay for<br />
the balance <strong>of</strong> costs), simplified farm<strong>in</strong>g systems, less labour and the loss <strong>of</strong> traditional<br />
skills such as hedge-lay<strong>in</strong>g and dry-stone wall<strong>in</strong>g. In addition ELS will not provide payments<br />
for boundary restoration but only ma<strong>in</strong>tenance and even then this will tend to be targeted<br />
at selected boundaries.<br />
Other Scenarios: It is suggested that there is likely to be a steady improvement <strong>in</strong> the<br />
quality and extent <strong>of</strong> traditional field boundaries as a result <strong>of</strong> cross compliance, the<br />
cont<strong>in</strong>uation <strong>of</strong> ESA agreements <strong>in</strong> large parts <strong>of</strong> the uplands for the next 5-10 years and<br />
the <strong>in</strong>troduction <strong>of</strong> ELS and HLS. Scenario 1 is likely to see steady <strong>in</strong>creases <strong>in</strong> the extent <strong>of</strong><br />
field boundaries (+5%) while Scenario 2 will result <strong>in</strong> greater <strong>in</strong>creases (+10%) as LFA<br />
fund<strong>in</strong>g is put to more targeted use. Scenario 3 is likely to result <strong>in</strong> no change; a reduction<br />
<strong>in</strong> farm<strong>in</strong>g activity brought about by loss <strong>of</strong> LFA fund<strong>in</strong>g would result <strong>in</strong> less attention to<br />
boundary features but the timescale is too short to see any losses.<br />
A11. Cultural heritage:<br />
Scenario 0: It is anticipated that there will be a cont<strong>in</strong>u<strong>in</strong>g decl<strong>in</strong>e <strong>in</strong> cultural heritage<br />
under the basel<strong>in</strong>e scenario due to reduced use/function <strong>of</strong> build<strong>in</strong>gs, reduced pr<strong>of</strong>itability<br />
and manpower to ma<strong>in</strong>ta<strong>in</strong> build<strong>in</strong>gs, reduced availability <strong>of</strong> grants and <strong>in</strong>creas<strong>in</strong>g damage<br />
to the archaeological resource due to bracken and tree growth. Conservation strategies and<br />
agri-environment schemes will help but are unlikely to be adequately resourced to deal<br />
with the extent <strong>of</strong> the problem.<br />
Other Scenarios: The decl<strong>in</strong>e <strong>in</strong> cultural heritage identified under the basel<strong>in</strong>e scenario is<br />
likely to be less under Scenario 1. Selective management and enhancement <strong>of</strong> priority<br />
features through agri-environment schemes will br<strong>in</strong>g about no change under Scenario 2.<br />
eftec 14 January 2006
<strong>Economic</strong> <strong>Valuation</strong> <strong>of</strong> <strong>Environmental</strong> <strong>Impacts</strong> <strong>in</strong> the Severely Disadvantaged Areas<br />
Scenario 3 is likely to see a decl<strong>in</strong>e <strong>in</strong> this attribute. Under all scenarios, changes <strong>in</strong> hill<br />
farm<strong>in</strong>g – especially fewer farmers and a decl<strong>in</strong>e <strong>in</strong> labour - may well result <strong>in</strong> the loss <strong>of</strong><br />
traditional skills from the uplands such as shepherd<strong>in</strong>g. However diversification should be<br />
able to safeguard some traditional build<strong>in</strong>gs.<br />
A12. Water quantity:<br />
Scenario 0: The water quantity attribute represents a range from drought to flood<strong>in</strong>g. The<br />
possibility <strong>of</strong> drought will be largely driven by climate change and little impacted by<br />
changes <strong>in</strong> LFA policy. However, with regard to flood risk, climate change is predicted to<br />
reduce ra<strong>in</strong>fall overall, but to make w<strong>in</strong>ters wetter and most importantly to <strong>in</strong>crease the<br />
<strong>in</strong>cidence and severity <strong>of</strong> storm events. A modell<strong>in</strong>g study by CEH Wall<strong>in</strong>gford (2001)<br />
<strong>in</strong>dicated that for their eight study rivers across the UK, high discharge events would<br />
<strong>in</strong>crease <strong>in</strong> the future. The results <strong>of</strong> Price & McKenna (2003), who determ<strong>in</strong>ed an <strong>in</strong>creased<br />
flood risk for different areas <strong>of</strong> Scotland <strong>in</strong> the future, are applied here. Based on their<br />
results from eastern and south-west Scotland, the predictions given here are for the return<br />
period for a ‘once <strong>in</strong> a hundred year flood’. The different predictions <strong>in</strong> the scenarios<br />
reflect the different degrees to which the vegetation and management <strong>in</strong> the uplands may<br />
<strong>in</strong>fluence flood<strong>in</strong>g. As agriculture decreases <strong>in</strong> Scenario 0, to be replaced by different<br />
vegetation types (<strong>in</strong> particular trees), the <strong>in</strong>cidence risks <strong>of</strong> flood<strong>in</strong>g decrease.<br />
Other Scenarios: As agriculture decreases through Scenarios 1 to 3, to be replaced by<br />
different vegetation types (<strong>in</strong> particular trees), the <strong>in</strong>cidence risks <strong>of</strong> flood<strong>in</strong>g decrease.<br />
There may be localized effects, for example, areas where <strong>in</strong>tensification occurs may be more<br />
vulnerable to flood<strong>in</strong>g.<br />
A13. Water quality:<br />
Scenario 0: Water quality <strong>in</strong> and from the uplands has been generally improv<strong>in</strong>g s<strong>in</strong>ce the<br />
1990s, due to tighter controls over the use <strong>of</strong> chemicals and less spillage allowed <strong>in</strong>to<br />
waterways. However, erosion lead<strong>in</strong>g to sedimentation cont<strong>in</strong>ues to be a problem <strong>in</strong> some<br />
areas (e.g. the Peak District). In future, there may be localized problems where<br />
<strong>in</strong>tensification occurs. The development <strong>of</strong> riparian habitats, through natural succession as<br />
well as through agri-environment scheme target<strong>in</strong>g, will help improve water quality.<br />
Improper use and disposal <strong>of</strong> sheep dip may rema<strong>in</strong> a problem <strong>in</strong> some areas especially with<br />
the anticipated reduction <strong>in</strong> labour.<br />
Other Scenarios: Water quality is predicted to cont<strong>in</strong>ue to improve through Scenarios 1 to 3<br />
even though there may be localized problems where <strong>in</strong>tensification occurs. As <strong>in</strong> relation to<br />
flood<strong>in</strong>g, target<strong>in</strong>g <strong>of</strong> agri-environment schemes and catchment management approaches<br />
could br<strong>in</strong>g greater improvements.<br />
A14. Greenhouse gas emissions:<br />
Scenario 0: greenhouse gas emissions from agriculture are currently decreas<strong>in</strong>g. This<br />
reduction is predicted to cont<strong>in</strong>ue under Scenario 0. This is due to the cumulative effects <strong>of</strong><br />
fewer livestock (reduc<strong>in</strong>g methane emissions), more young tree growth, re-vegetation<br />
slow<strong>in</strong>g soil (particularly peat) erosion, and peat habitats becom<strong>in</strong>g active s<strong>in</strong>ks aga<strong>in</strong> for<br />
carbon. However, there may also be some displacement effects, for example, as farm<strong>in</strong>g<br />
<strong>in</strong>tensifies <strong>in</strong> adjacent lowland areas.<br />
Other Scenarios: The reduction <strong>in</strong> greenhouse gas emissions is predicted to cont<strong>in</strong>ue <strong>in</strong> all<br />
scenarios, but with the rate <strong>in</strong>creas<strong>in</strong>g with the reduction <strong>in</strong> the importance <strong>of</strong> agriculture,<br />
for reasons expla<strong>in</strong>ed above.<br />
Attempts to give quantified predictions for reductions <strong>in</strong> this attribute have been omitted.<br />
The predicted changes for each policy scenario are summarised <strong>in</strong> Table 2.2<br />
eftec 15 January 2006
<strong>Economic</strong> <strong>Valuation</strong> <strong>of</strong> <strong>Environmental</strong> <strong>Impacts</strong> <strong>in</strong> the Severely Disadvantaged Areas<br />
Table 2.2: Summary <strong>of</strong> the current trend and hypothesised future changes <strong>in</strong> the upland<br />
attributes accord<strong>in</strong>g to Cumulus et al. (2005). Percentage changes <strong>in</strong> the 3 rd to 6 th<br />
column are relative to the extent <strong>of</strong> the habitat before the period 2007-2013.<br />
Attribute Estimated<br />
change<br />
(1990-1998)<br />
Heather<br />
moorland/bog<br />
Improved<br />
grassland<br />
Rough<br />
grassland<br />
Policy 0<br />
Basel<strong>in</strong>e<br />
(2007-2013)<br />
Policy 1<br />
Env-agri<br />
(2007-2013)<br />
Policy 2<br />
Env only<br />
(2007-2013)<br />
Policy 3<br />
Aband-Inten<br />
(2007-2013)<br />
+1% +1% +3% +5% -2%<br />
+7% +1% 0% 0% +2%<br />
-13% +1% -1% -3% +3%<br />
Hay meadow -15% -5% -3% 0% -8%<br />
Bracken<br />
dom<strong>in</strong>ated<br />
+8% +7% +6% +3% +9%<br />
Gorse<br />
dom<strong>in</strong>ated<br />
0% +5% +4% +2% +7%<br />
Arable (& set<br />
aside / fallow)<br />
Broadleaf and<br />
-5% -5% -4% -4% -5%<br />
mixed woodland<br />
+4% +3% +4% +6% +5%<br />
Coniferous<br />
woodland<br />
-7% -5% -5% -6% -5%<br />
Field<br />
boundaries<br />
+9% +5% +6% +10% 2%<br />
Cultural<br />
heritage<br />
Slight loss Decl<strong>in</strong>e Slow decl<strong>in</strong>e No change Decl<strong>in</strong>e<br />
Water quantity<br />
(flood risk)<br />
More floods<br />
100 year<br />
flood every<br />
85 years<br />
100 year<br />
flood every<br />
90 years<br />
100 year<br />
flood every<br />
90 years<br />
100 year<br />
flood every<br />
95 years<br />
Water quality Improv<strong>in</strong>g Improv<strong>in</strong>g<br />
Improv<strong>in</strong>g<br />
more<br />
Improv<strong>in</strong>g<br />
much more<br />
Improv<strong>in</strong>g<br />
but localised<br />
deterioration<br />
Greenhouse<br />
gas emissions<br />
Reduc<strong>in</strong>g Reduc<strong>in</strong>g Reduc<strong>in</strong>g Reduc<strong>in</strong>g Reduc<strong>in</strong>g<br />
eftec 16 January 2006
<strong>Economic</strong> <strong>Valuation</strong> <strong>of</strong> <strong>Environmental</strong> <strong>Impacts</strong> <strong>in</strong> the Severely Disadvantaged Areas<br />
3. <strong>Valuation</strong> Methodology<br />
3.1 Introduction<br />
This section expla<strong>in</strong>s the methodology employed to value the changes to the attributes<br />
described <strong>in</strong> the previous section.<br />
The stated preference part <strong>of</strong> this study could only <strong>in</strong>clude a limited number <strong>of</strong> attributes<br />
(up to five), for reasons expla<strong>in</strong>ed <strong>in</strong> Section 3.2.1 below. The rest <strong>of</strong> the attributes must<br />
be valued by benefits transfer – by transferr<strong>in</strong>g valuation estimates for the attributes found<br />
by other studies and adjust<strong>in</strong>g them to the context <strong>of</strong> this study. This, <strong>in</strong> turn, is limited by<br />
the available literature. Table 3.1 summarises how each <strong>of</strong> the upland attributes is to be<br />
valued.<br />
Table 3.1: Attribute list and valuation method to be used<br />
Upland attribute <strong>Valuation</strong> method<br />
A1 Heather moorland/bog Choice experiment<br />
A2 Improved grassland n/a<br />
A3 Rough grassland Choice experiment<br />
A4 Hay meadow Benefits transfer<br />
A5 Bracken dom<strong>in</strong>ated n/a<br />
A6 Gorse dom<strong>in</strong>ated n/a<br />
A7 Arable (<strong>in</strong>c. set aside / fallow) n/a<br />
A8 Broadleaf and mixed wood-land Choice experiment<br />
A9 Coniferous woodland n/a<br />
A10 Field boundaries Choice experiment<br />
A11 Cultural heritage Choice experiment<br />
A12 Water quantity (flood risk) n/a<br />
A13 Water quality n/a<br />
A14 Greenhouse gas emissions<br />
Benefits transfer would be<br />
possible if data on SDA<br />
emissions were available<br />
and scenario forecasts<br />
were quantitative<br />
n/a: shows attributes which were not <strong>in</strong>clude <strong>in</strong> the stated preference<br />
questionnaire and about which either there are no estimates <strong>in</strong> the literature<br />
or previous estimates are not transferable.<br />
Stated preference techniques estimate values by ask<strong>in</strong>g people directly to state how much<br />
they would be will<strong>in</strong>g to pay (WTP) for non-market goods, or will<strong>in</strong>g to accept (WTA) to<br />
forgo them, or by ask<strong>in</strong>g them to choose between alternative sets <strong>of</strong> goods with different<br />
associated price tags.<br />
The conceptual bases <strong>of</strong> the two stated preference techniques used (choice experiment and<br />
cont<strong>in</strong>gent valuation) and benefits transfer are expla<strong>in</strong>ed <strong>in</strong> Section 3.2. Although the<br />
choice experiment method is the ma<strong>in</strong> technique used <strong>in</strong> the survey to value the selected<br />
upland attributes, cont<strong>in</strong>gent valuation is also used to estimate the value that survey<br />
respondents had for SDAs outside <strong>of</strong> their own region. The practical implementation <strong>of</strong> the<br />
various stages <strong>of</strong> survey design is outl<strong>in</strong>ed <strong>in</strong> Section 3.3.<br />
eftec 17 January 2006
<strong>Economic</strong> <strong>Valuation</strong> <strong>of</strong> <strong>Environmental</strong> <strong>Impacts</strong> <strong>in</strong> the Severely Disadvantaged Areas<br />
3.2 Conceptual Basis<br />
3.2.1 Choice experiment<br />
Most <strong>of</strong> the upland attributes <strong>in</strong>cluded <strong>in</strong> this study are examples <strong>of</strong> non-market goods –<br />
goods which, while contribut<strong>in</strong>g towards people’s welfare, are not traded <strong>in</strong> markets and<br />
therefore if they are to be valued, must be valued by methods other than those us<strong>in</strong>g<br />
market data 4 . The ma<strong>in</strong> economic valuation technique used <strong>in</strong> this study is the choice<br />
experiment (CE), which is one <strong>of</strong> a group <strong>of</strong> survey based valuation techniques referred to<br />
as stated preference techniques. CE shows a series <strong>of</strong> ‘choice cards’ conta<strong>in</strong><strong>in</strong>g alternative<br />
sets <strong>of</strong> a goods with different associated price tags and asks people to state their most<br />
preferred choice among the alternatives. The choice cards always <strong>in</strong>clude the ‘current<br />
situation’ at no extra cost <strong>in</strong> order to enable the respondents to choose the ‘no change’<br />
option. Thus, respondents are asked to imag<strong>in</strong>e that they face a situation where it is<br />
possible to, <strong>in</strong> effect, trade <strong>of</strong>f the different attributes <strong>of</strong> a good aga<strong>in</strong>st each other and<br />
aga<strong>in</strong>st the cost <strong>of</strong> secur<strong>in</strong>g the provision <strong>of</strong> those attributes. From their choices, the<br />
analyst can <strong>in</strong>fer the respondents’ will<strong>in</strong>gness to pay to secure a unit improvement or to<br />
avoid a decl<strong>in</strong>e <strong>in</strong> any <strong>of</strong> the non-cost attributes.<br />
In this study, the ‘good’ presented to the respondents was different policy options <strong>in</strong>clud<strong>in</strong>g<br />
the current situation. This good was def<strong>in</strong>ed <strong>in</strong> terms <strong>of</strong> the impacts <strong>of</strong> the policy options<br />
on the upland attributes, i.e. the level <strong>of</strong> each upland attribute <strong>in</strong> each policy option. The<br />
cost attribute was zero <strong>in</strong> the basel<strong>in</strong>e and took random values (out <strong>of</strong> a set <strong>of</strong> six) <strong>in</strong> other<br />
policy options. While no policy option would cost extra <strong>in</strong> reality, associat<strong>in</strong>g cost with each<br />
policy option was necessary <strong>in</strong> order to create a trade <strong>of</strong>f between changes <strong>in</strong> upland<br />
attributes and money and hence <strong>in</strong>fer WTP estimates. An illustration <strong>of</strong> how the choice sets<br />
were presented to respondents is shown <strong>in</strong> Figure 3.4 <strong>in</strong> Section 3.3.3. Respondents do not<br />
all face the same choice sets, and there are many more choice sets than any one<br />
respondent sees.<br />
For more on the theory and practice <strong>of</strong> choice experiments see Bateman et al. (2002) and<br />
Louviere et al. (2000).<br />
3.2.2 Cont<strong>in</strong>gent valuation<br />
The other commonly used stated preference technique, cont<strong>in</strong>gent valuation (CV), elicits<br />
WTP or WTA directly by ask<strong>in</strong>g respondents to express their maximum WTP/WTA for a<br />
hypothetical change <strong>in</strong> the provision <strong>of</strong> the good <strong>of</strong> <strong>in</strong>terest. Respondents are presented<br />
with alternative scenarios, usually one(s) where an environmental good is <strong>of</strong>fered a certa<strong>in</strong><br />
level <strong>of</strong> protection or guaranteed accessibility, and one where it isn’t. Here the trade <strong>of</strong>f is<br />
between money and the good as a bundle <strong>of</strong> attributes as opposed to the CE which <strong>of</strong>fers<br />
trade <strong>of</strong>f between the attributes and between attributes and money, as mentioned above.<br />
The WTP and WTA question can be asked <strong>in</strong> a variety <strong>of</strong> different so-called elicitation<br />
formats. In this study, the dichotomous choice elicitation format is used, whereby<br />
respondents are asked if they are will<strong>in</strong>g to pay a given amount per year for an alternative<br />
policy option. The amounts are randomly varied between respondents. In the CV survey,<br />
the same set <strong>of</strong> six amounts used <strong>in</strong> the choice experiment were applied. F<strong>in</strong>ally, as with<br />
the CE, if a respondent preferred the current situation (or basel<strong>in</strong>e scenario), they would<br />
face no additional cost.<br />
For more on the theory and practice <strong>of</strong> cont<strong>in</strong>gent valuation see Bateman et al. (2002).<br />
4 Note that while the land itself can be bought and sold, the amenity value associated with it cannot.<br />
eftec 18 January 2006
<strong>Economic</strong> <strong>Valuation</strong> <strong>of</strong> <strong>Environmental</strong> <strong>Impacts</strong> <strong>in</strong> the Severely Disadvantaged Areas<br />
3.2.3 Choos<strong>in</strong>g between choice experiment and cont<strong>in</strong>gent valuation<br />
Cont<strong>in</strong>gent valuation is typically suited to <strong>in</strong>vestigat<strong>in</strong>g changes to the whole resource <strong>in</strong><br />
question, i.e. overall quantity or quality changes. A CE approach was chosen <strong>in</strong> preference<br />
for the ma<strong>in</strong> valuation <strong>in</strong> this study for two key reasons. Firstly, it allows the presentation<br />
<strong>of</strong> <strong>in</strong>dividual attributes <strong>of</strong> the good, allow<strong>in</strong>g more <strong>in</strong>formation about preferences for<br />
specific upland attributes than CV could. Secondly, CE can accommodate a larger<br />
uncerta<strong>in</strong>ty about future scenarios than CV. So long as the upper and lower limits <strong>of</strong> the set<br />
<strong>of</strong> potential future scenarios are <strong>in</strong>cluded <strong>in</strong> the CE design, other alternative policy<br />
scenarios that fall with<strong>in</strong> this set can be assessed us<strong>in</strong>g the results <strong>of</strong> the CE. With CV, on<br />
the other hand, the survey results are limited to the policy scenarios presented <strong>in</strong> the<br />
survey and cannot be extrapolated beyond these. Therefore, <strong>in</strong> this study a simpler CV<br />
question was only used to test respondents’ will<strong>in</strong>gness to pay for upland attributes <strong>in</strong> SDAs<br />
outside <strong>of</strong> their own region.<br />
3.2.4 Benefits transfer<br />
Changes to those attributes that are not <strong>in</strong>cluded <strong>in</strong> the choice experiment are analysed<br />
through benefits transfer. Benefits transfer <strong>in</strong>volves transferr<strong>in</strong>g valuation estimates for<br />
environmental goods from a previous study(ies) to a new context. The context <strong>of</strong> a previous<br />
study is referred to as the ‘study site’ and the new context as the ‘policy site’.<br />
Previous valuation studies cover<strong>in</strong>g the environmental good(s) <strong>in</strong> question are identified and<br />
exam<strong>in</strong>ed for whether they are sufficiently similar to the current context <strong>in</strong> terms <strong>of</strong> the<br />
similarities between the environmental goods, the change exam<strong>in</strong>ed and the affected<br />
population at the very least. Therefore, the success and reliability <strong>of</strong> benefits transfer<br />
depends on the similarity <strong>of</strong> the goods <strong>in</strong> the two contexts, the level <strong>of</strong> detail known about<br />
the socio-economics <strong>of</strong> the affected populations and the equivalence <strong>of</strong> expected changes<br />
to the good(s) <strong>in</strong> question (e.g. a study valu<strong>in</strong>g a change <strong>in</strong> the quality <strong>of</strong> a good will not be<br />
applicable to a context where its quantity is chang<strong>in</strong>g).<br />
Benefits transfer can <strong>in</strong>volve simply tak<strong>in</strong>g a ‘value-per-unit’ estimate from the study site<br />
and apply<strong>in</strong>g it unadjusted to the policy site. However, this is likely to be <strong>in</strong>accurate apart<br />
from <strong>in</strong> cases <strong>of</strong> goods with high spatial equivalence. For example, the value <strong>of</strong> a tonne <strong>of</strong><br />
carbon sequestered (<strong>in</strong> terms <strong>of</strong> climate change damages) is the same wherever it occurs,<br />
but the value <strong>of</strong> a clean stream varies accord<strong>in</strong>g to geographical and local population<br />
characteristics.<br />
The ‘value-per-unit’ estimate can be adjusted to reflect the differences between study and<br />
policy sites. The most common adjustment factor is <strong>in</strong>come s<strong>in</strong>ce this is usually a significant<br />
determ<strong>in</strong>ant <strong>of</strong> WTP or WTA and is relatively easy to f<strong>in</strong>d data for both study and policy<br />
sites. However, a more conceptually accurate approach is to take the function l<strong>in</strong>k<strong>in</strong>g the<br />
study site value to various explanatory factors and to plug <strong>in</strong> the appropriate numbers for<br />
the explanatory variables for the policy site. For example, if the orig<strong>in</strong>al study f<strong>in</strong>ds that<br />
WTP <strong>in</strong> the study site appears to be a function <strong>of</strong> age, <strong>in</strong>come and frequency <strong>of</strong> use <strong>of</strong> the<br />
good, then it is assumed that this function can be transferred to the policy site with the<br />
appropriate average age, <strong>in</strong>come and frequency <strong>of</strong> use (if available) estimates <strong>in</strong>serted <strong>in</strong>to<br />
the function.<br />
It should be noted, however, that this approach is not always so straightforward, depend<strong>in</strong>g<br />
on the method used to elicit WTP. If, for example, a survey has asked people “would you<br />
be will<strong>in</strong>g to pay £X, yes or no?”, then the econometric modell<strong>in</strong>g <strong>of</strong> the results has to take<br />
the form <strong>of</strong> modell<strong>in</strong>g which factors were more likely to make people say “yes” – as<br />
opposed to modell<strong>in</strong>g which factors caused people to state higher WTP. This form <strong>of</strong><br />
modell<strong>in</strong>g makes benefits transfer more difficult. In addition, not all studies report full<br />
functions and it is not always possible to f<strong>in</strong>d policy site data for all explanatory variables.<br />
For a more detailed review <strong>of</strong> the benefits transfer see Bateman et al. (2000).<br />
eftec 19 January 2006
<strong>Economic</strong> <strong>Valuation</strong> <strong>of</strong> <strong>Environmental</strong> <strong>Impacts</strong> <strong>in</strong> the Severely Disadvantaged Areas<br />
3.3 Implement<strong>in</strong>g the Stated Preference Survey<br />
This section lays out the practical steps taken to implement the methodology. The<br />
follow<strong>in</strong>g steps are best practice <strong>in</strong> implement<strong>in</strong>g a stated preference study (see Bateman<br />
et al., 2002):<br />
• Initial research (see Section 2 for attribute and policy def<strong>in</strong>itions. A literature<br />
review is presented <strong>in</strong> Section 4 as it also applies to benefits transfer);<br />
• Focus groups (Section 3.3.1);<br />
• Pilot survey (Section 3.3.2);<br />
• Ma<strong>in</strong> survey (Section 3.3.3);<br />
• Data analysis (Section 6 and Annex 5);<br />
• Validity test<strong>in</strong>g (Section 7), and<br />
• Aggregation (Section 8)<br />
The stated preference questionnaire was revised several times dur<strong>in</strong>g the focus group stage<br />
and after the pilot survey to reflect the lessons learnt. The f<strong>in</strong>al version <strong>of</strong> the<br />
questionnaire can be seen <strong>in</strong> Annex 4. In addition to the above stages, valuation workshops<br />
were also held to analyse preferences for upland attributes <strong>in</strong> greater detail (see Sections<br />
3.3.4 and 7.3).<br />
Throughout this report, the socio-economic classifications laid out by the Market Research<br />
Society are used <strong>in</strong> def<strong>in</strong><strong>in</strong>g the sample and assess<strong>in</strong>g its representativeness <strong>of</strong> the regional<br />
populations:<br />
A: pr<strong>of</strong>essionals, very senior managers <strong>in</strong> bus<strong>in</strong>ess or commerce or top-level civil servants;<br />
B: middle management executives <strong>in</strong> large organisations, with appropriate qualifications;<br />
pr<strong>in</strong>cipal <strong>of</strong>ficers <strong>in</strong> local government and civil service; top management or owners <strong>of</strong><br />
small bus<strong>in</strong>ess concerns, educational and service establishments;<br />
C: junior management, owners <strong>of</strong> small establishments, and all others <strong>in</strong> non-manual<br />
positions; jobs <strong>in</strong> this group have very varied responsibilities and educational<br />
requirements;<br />
D: all skilled manual workers, and those manual workers with responsibility for other<br />
people;<br />
E: all semi-skilled and un-skilled manual workers, and apprentices and tra<strong>in</strong>ees to skilled<br />
workers;<br />
F: all those entirely dependant on the state long-term, through sickness, unemployment,<br />
old age 5 or other reasons; those unemployed for a period exceed<strong>in</strong>g six months<br />
(otherwise classify on previous occupation); casual workers and those without a regular<br />
<strong>in</strong>come.<br />
As it is very difficult to select samples that can represent each socio-economic group<br />
separately, standard comb<strong>in</strong>ations <strong>of</strong> groups and sub-groups are used (e.g. ABC1, BC1C2<br />
etc.) <strong>in</strong> focus group recruitment and pilot and ma<strong>in</strong> survey samples.<br />
3.3.1 Focus groups<br />
Focus groups are semi-structured discussion groups led by a moderator, <strong>in</strong> which<br />
participants are presented with a topic. In this way, attitudes about the study issues can be<br />
reflected <strong>in</strong> the design <strong>of</strong> the questionnaire so as to make it credible, mean<strong>in</strong>gful and easily<br />
understood. Each group consists <strong>of</strong> 6-8 people and typically lasts one and a half hours.<br />
Participants are paid for their time.<br />
5<br />
This does not <strong>in</strong>clude pensioners with pensions from their previous jobs, or widows receiv<strong>in</strong>g a pension from a<br />
husband’s previous job.<br />
eftec 20 January 2006
<strong>Economic</strong> <strong>Valuation</strong> <strong>of</strong> <strong>Environmental</strong> <strong>Impacts</strong> <strong>in</strong> the Severely Disadvantaged Areas<br />
Three focus groups were held for this study: one <strong>in</strong> Manchester and two <strong>in</strong> Kendal. The<br />
details <strong>of</strong> the focus groups are given <strong>in</strong> Table 3.2.<br />
Table 3.2: Focus Group Participants and Logistics<br />
Groups 1. Manchester 2. Kendal 3. Kendal<br />
Number <strong>of</strong> participants 8 8 6<br />
Gender 5F 3M 4F 4M 4F 2M<br />
Age 18-51 18-40 40-65<br />
Socio-economic group BC1C2 ABC1 C2DE<br />
Date 21/06/05 22/06/05 23/06/05<br />
Time 19:00 19:30 19:30<br />
Moderator Stavros Georgiou assisted by Helen Johns<br />
The ma<strong>in</strong> po<strong>in</strong>ts <strong>of</strong> <strong>in</strong>terest to note from the Focus Groups were that participants <strong>in</strong><br />
general:<br />
• showed fairly marked and consistent preferences for certa<strong>in</strong> landscape and<br />
environmental features;<br />
• generally preferred attributes associated with ma<strong>in</strong>ta<strong>in</strong><strong>in</strong>g attractive, “natural-look<strong>in</strong>g”<br />
scenery and ma<strong>in</strong>ta<strong>in</strong><strong>in</strong>g cultural heritage;<br />
• were generally very familiar with SDAs, showed a strong appreciation <strong>of</strong> their amenity<br />
value and recreational opportunities, and visited SDAs regularly;<br />
• were <strong>in</strong>fluenced by the amount <strong>of</strong> <strong>in</strong>formation they had on certa<strong>in</strong> attributes and<br />
sometimes revised their preferences <strong>in</strong> the light <strong>of</strong> others’ op<strong>in</strong>ions;<br />
• mostly supported the pr<strong>in</strong>ciple <strong>of</strong> subsidis<strong>in</strong>g hill-farm<strong>in</strong>g, but disagreed over the<br />
appropriate means to do this; and<br />
• showed a greater will<strong>in</strong>gness to subsidise hill farm<strong>in</strong>g <strong>in</strong> their own immediate locality<br />
than further afield, <strong>in</strong>dicat<strong>in</strong>g that use values are likely to be greater than non-use<br />
values.<br />
The protocols were changed between groups, but the protocol used <strong>in</strong> the f<strong>in</strong>al group is<br />
presented <strong>in</strong> Annex 1. A more detailed report on the f<strong>in</strong>d<strong>in</strong>gs <strong>of</strong> the focus groups is provided<br />
<strong>in</strong> Annex 2.<br />
3.3.2 Pilot survey<br />
Only a limited number <strong>of</strong> attributes can feasibly be conta<strong>in</strong>ed <strong>in</strong> a choice set, otherwise<br />
respondents are required to trade <strong>of</strong>f aga<strong>in</strong>st too many different attributes. The five upland<br />
attributes used <strong>in</strong> the survey were chosen from the <strong>in</strong>itial long list (described <strong>in</strong> Section<br />
2.1.1) <strong>of</strong> fourteen through the results <strong>of</strong> the focus groups and through consultation with the<br />
Steer<strong>in</strong>g Group. The upland attributes chosen were:<br />
• heather moorland and bog<br />
• rough grassland<br />
• broadleaf and mixed woodland<br />
• field boundaries (particularly hedgerows and dry stone walls)<br />
• cultural heritage<br />
These attributes were chosen because they were shown to be thought to be important <strong>in</strong><br />
the focus groups, and because they would be impacted by the policy options. The cost<br />
attribute was def<strong>in</strong>ed as “Increase <strong>in</strong> tax payments by your household each year”. A more<br />
specific ‘payment vehicle’ such as council tax or a new national tax was not used as a<br />
general <strong>in</strong>crease was seen both by the study team and the Steer<strong>in</strong>g Group as more realistic.<br />
The pilot survey questionnaire was conducted over the period 4 th -13 th July 2005. The pilot<br />
survey sample comprised 25 respondents <strong>in</strong> Manchester and 25 <strong>in</strong> the Lake District, and was<br />
eftec 21 January 2006
<strong>Economic</strong> <strong>Valuation</strong> <strong>of</strong> <strong>Environmental</strong> <strong>Impacts</strong> <strong>in</strong> the Severely Disadvantaged Areas<br />
sampled accord<strong>in</strong>g to gender, age and socio-economic characteristics representative <strong>of</strong> the<br />
North West. The survey mode was face-to-face, door-to-door personal <strong>in</strong>terviews.<br />
The pilot survey worked well enough to cont<strong>in</strong>ue with the same broad questionnaire design<br />
and the same upland attributes listed above. See the pilot survey report provided <strong>in</strong> Annex<br />
3 for a discussion <strong>of</strong> the results and conclusions drawn from the pilot survey.<br />
3.3.3 Ma<strong>in</strong> survey and questionnaire<br />
The populations affected by the presence and upkeep <strong>of</strong> SDAs are: (i) local/regional<br />
residents; (ii) visitors to upland areas; and (iii) the non-user population liv<strong>in</strong>g further away<br />
from the areas <strong>of</strong> concern. Three-hundred respondents <strong>in</strong> each <strong>of</strong> the six GORs which<br />
conta<strong>in</strong> SDAs, as well as 300 respondents <strong>in</strong> the South East GOR, were <strong>in</strong>terviewed. The<br />
respondents <strong>in</strong> each GOR with SDAs were <strong>of</strong> type (i) as far as their own SDA was concerned,<br />
but were <strong>of</strong> either type (ii) or (iii) with respect to other regions’ SDAs. Each sample was<br />
chosen accord<strong>in</strong>g to quotas for age, gender, socio-economic group and also whether<br />
respondents resided <strong>in</strong> an urban or rural area. The survey mode was face-to-face, door-todoor<br />
personal <strong>in</strong>terviews.<br />
The questionnaire consisted <strong>of</strong> four sections: (A) attitudes, op<strong>in</strong>ions and uses; (B) choice<br />
experiment valuation section for SDAs <strong>in</strong> the respondent’s own GOR; (C) CV question for<br />
SDAs <strong>in</strong> the rest <strong>of</strong> England; and (D) follow-up and socio-economic questions. The<br />
questionnaires <strong>in</strong> all versions followed the same format except for two different changes to<br />
the South West and South East questionnaires. In the South West survey, half <strong>of</strong> the<br />
respondents received a questionnaire with a different upper limit for <strong>in</strong>creases <strong>in</strong> broadleaved<br />
and mixed woodland, as a validity test to see if different upper limits to the<br />
attributes would make any difference to responses. The questionnaire used <strong>in</strong> the South<br />
East GOR had the same structure but no CV section, s<strong>in</strong>ce the choice experiment section<br />
already asked for a value for all <strong>of</strong> England.<br />
Further details on each <strong>of</strong> the questionnaire sections are provided <strong>in</strong> Section 6.1. Here the<br />
design <strong>of</strong> the choice experiment is discussed as it affected the design <strong>of</strong> the sub-samples<br />
and the different versions <strong>of</strong> the questionnaire.<br />
Each choice card shown <strong>in</strong> Section B <strong>of</strong> the questionnaire presented three possible<br />
scenarios: the first scenario represents the ‘current policy’, which is identical on all the<br />
choice cards. The other two scenarios present different levels <strong>of</strong> change over the basel<strong>in</strong>e,<br />
described by different levels <strong>of</strong> the upland attributes. Note that the attribute levels<br />
appear<strong>in</strong>g on the choice cards are not exactly the same as any <strong>of</strong> the policy scenarios<br />
outl<strong>in</strong>ed <strong>in</strong> Section 2.2, <strong>in</strong>clud<strong>in</strong>g the current situation (which is not the same as ‘Scenario<br />
0’). The purpose for select<strong>in</strong>g the levels <strong>in</strong> this way was to <strong>in</strong>clude the highest and the<br />
lowest estimates <strong>of</strong> change for each attribute (from Table 2.2) and a variation <strong>in</strong> between<br />
these two.<br />
The same basel<strong>in</strong>e is used for every choice card, but the other levels are used <strong>in</strong> different<br />
comb<strong>in</strong>ations, chosen from one <strong>of</strong> three levels for each upland attribute (six levels for cost)<br />
presented <strong>in</strong> Table 3.3. The appropriate range <strong>of</strong> values to use was decided <strong>in</strong> consultation<br />
with the Steer<strong>in</strong>g Group, consider<strong>in</strong>g the range <strong>of</strong> predictions for each attribute made by<br />
eftec’s Initial Report and by Cumulus et al. (2005).<br />
eftec 22 January 2006
<strong>Economic</strong> <strong>Valuation</strong> <strong>of</strong> <strong>Environmental</strong> <strong>Impacts</strong> <strong>in</strong> the Severely Disadvantaged Areas<br />
Table 3.3: The levels <strong>of</strong> each attribute which were used <strong>in</strong> the choice experiment.<br />
Attribute Basel<strong>in</strong>e Bottom level Middle level Top level<br />
Heather moorland/bog -2% -12% -2% +5%<br />
Rough grassland -10% -10% +5% +10%<br />
Broadleaf and mixed wood-land +3% +3% +10% +20% 1 +30% 2<br />
Field boundaries<br />
(For every 1km, Xm is restored)<br />
X = 100 X = 50 X = 100 X = 200<br />
Cultural heritage Rapid decl<strong>in</strong>e Rapid decl<strong>in</strong>e No change<br />
Cost £0 £2, £5, £10, £17, £40, £70<br />
1 For all GORs other than the half <strong>of</strong> the South West survey.<br />
2 For half <strong>of</strong> the South West survey only.<br />
Much better<br />
conservation<br />
Statistical design theory was used to comb<strong>in</strong>e the levels <strong>of</strong> the attributes <strong>in</strong>to a number <strong>of</strong><br />
alternative landscape scenarios to be presented to respondents. Comb<strong>in</strong>ation <strong>of</strong> the six<br />
attributes at their various levels created a total <strong>of</strong> 1,458 (levels to the power <strong>of</strong> attributes:<br />
five attributes at three levels and one attribute at six: 3 x 3 x 3 x 3 x 3 x 6) possible<br />
scenario comb<strong>in</strong>ations. It is obviously too difficult for a respondent to make an <strong>in</strong>formed<br />
choice from such a large number <strong>of</strong> scenarios. A fractional factorial design 6 was therefore<br />
used to reduce the number <strong>of</strong> scenarios, while still ma<strong>in</strong>ta<strong>in</strong><strong>in</strong>g the possibility <strong>of</strong> estimat<strong>in</strong>g<br />
‘ma<strong>in</strong> effects’, i.e. the effects <strong>of</strong> the attributes on respondents’ choices (Louviere et al.,<br />
2000). The fractional factorial design selected 36 “alternative policy” scenarios, which<br />
were then grouped <strong>in</strong>to choice sets to be presented to respondents.<br />
This process resulted <strong>in</strong> 18 choice cards (two “alternative policy” scenarios per card) for<br />
each region (each with current policy and two future policy options). Given that it would<br />
not be practical for an <strong>in</strong>dividual to make even that many choices, each respondent was<br />
shown six out <strong>of</strong> the total set <strong>of</strong> 18 cards 7 . Therefore, the sample (300) <strong>in</strong> each region was<br />
divided <strong>in</strong>to three: 100 respondents for cards 1-6, 100 for cards 7-12 and 100 for cards 13-<br />
18. In each sub-sample, the sequence <strong>of</strong> cards was rotated between respondents (e.g.<br />
respondent 1 saw cards 1-6 <strong>in</strong> order, respondent 2 saw cards 2,3,4,5,6,1 and so on), <strong>in</strong><br />
order to avoid any ‘order<strong>in</strong>g effect’.<br />
Table 3.4 presents an example <strong>of</strong> a choice card used <strong>in</strong> the survey.<br />
6 The ‘full factorial’ is the set <strong>of</strong> all possible comb<strong>in</strong>ations <strong>of</strong> attribute levels. A ‘fractional factorial’ refers to a<br />
selection <strong>of</strong> this set. The fractional factorial must be chosen so as to ma<strong>in</strong>ta<strong>in</strong> the property that there is no<br />
correlation between attributes, but if it is too small “it may not be capable <strong>of</strong> driv<strong>in</strong>g a model that accurately<br />
represents the relationships exist<strong>in</strong>g between choice probabilities and attribute levels” (Bennett and Adamowicz,<br />
2001).<br />
7 Different numbers <strong>of</strong> choice cards were tested <strong>in</strong> the pilot survey to asses the optimum number <strong>of</strong> cards a<br />
respondent could cope with.<br />
eftec 23 January 2006
<strong>Economic</strong> <strong>Valuation</strong> <strong>of</strong> <strong>Environmental</strong> <strong>Impacts</strong> <strong>in</strong> the Severely Disadvantaged Areas<br />
Table 3.4: Example <strong>of</strong> a choice card used <strong>in</strong> the survey<br />
Policy Option Current<br />
Policy<br />
Change <strong>in</strong> area <strong>of</strong> Heather<br />
Moorland and Bog<br />
Change <strong>in</strong> area <strong>of</strong> Rough<br />
Grassland<br />
Change <strong>in</strong> area <strong>of</strong> Mixed and<br />
Broadleaf Woodlands<br />
Condition <strong>of</strong> field boundaries<br />
Change <strong>in</strong> farm build<strong>in</strong>g and<br />
traditional farm practices<br />
Increase <strong>in</strong> tax payments by<br />
your household each year<br />
A loss <strong>of</strong> 2%<br />
(-2%)<br />
A loss <strong>of</strong> 10%<br />
(-10%)<br />
A ga<strong>in</strong> <strong>of</strong> 3%<br />
(+3%)<br />
For every 1km,<br />
100 m is<br />
restored<br />
Rapid decl<strong>in</strong>e<br />
Policy<br />
Option A<br />
A ga<strong>in</strong> <strong>of</strong> 5%<br />
(+5%)<br />
A ga<strong>in</strong> <strong>of</strong> 10%<br />
(+10%)<br />
A ga<strong>in</strong> <strong>of</strong> 20%<br />
(+20%)<br />
For every 1km,<br />
200 m is<br />
restored<br />
Much better<br />
conservation<br />
Policy<br />
Option B<br />
A loss <strong>of</strong> 2%<br />
(-2%)<br />
A loss <strong>of</strong> 10%<br />
(-10%)<br />
A ga<strong>in</strong> <strong>of</strong> 10%<br />
(+10%)<br />
For every 1km,<br />
50 m is<br />
restored<br />
No change<br />
£0 £70 £10<br />
A cont<strong>in</strong>gent valuation scenario was also presented to respondents (<strong>in</strong> all regions except the<br />
South East) to provide evidence on respondents’ values for SDAs <strong>in</strong> the rest <strong>of</strong> England. This<br />
presented respondents with a choice between two options: the same zero-cost Current<br />
Policy as used <strong>in</strong> the choice experiment, and a ‘best case’ alternative policy scenario us<strong>in</strong>g<br />
the best level for each landscape attribute. The cost varied between the same six levels<br />
that were used <strong>in</strong> the choice experiment. Table 3.5 shows how the cont<strong>in</strong>gent valuation<br />
question was presented to respondents.<br />
eftec 24 January 2006
<strong>Economic</strong> <strong>Valuation</strong> <strong>of</strong> <strong>Environmental</strong> <strong>Impacts</strong> <strong>in</strong> the Severely Disadvantaged Areas<br />
Table 3.5: How the cont<strong>in</strong>gent valuation section <strong>of</strong> the questionnaire was presented to<br />
respondents.<br />
CURRENT POLICY FUTURE POLICY OPTION<br />
CHANGE IN AREA OF<br />
HEATHER MOORLAND AND BOG<br />
CHANGE IN AREA OF<br />
ROUGH GRASSLAND<br />
CHANGE IN AREA OF<br />
MIXED AND BROADLEAF WOODLANDS<br />
CHANGE IN<br />
RESTORATION OF FIELD BOUNDARIES<br />
CHANGE IN<br />
FARM BUILDINGS AND TRADITIONAL FARM<br />
PRACTICES<br />
INCREASE IN TAX PAYMENTS BY YOUR<br />
HOUSEHOLD EACH YEAR<br />
Loss <strong>of</strong> 6,600 ha<br />
(2% loss)<br />
Loss <strong>of</strong> 48,000 ha<br />
(10% loss)<br />
Ga<strong>in</strong> <strong>of</strong> 2,800 ha<br />
(3% ga<strong>in</strong>)<br />
For every 1km, 100m is<br />
restored<br />
Ga<strong>in</strong> <strong>of</strong> 16,400 ha<br />
(5% ga<strong>in</strong>)<br />
Ga<strong>in</strong> <strong>of</strong> 48,000 ha<br />
(10% ga<strong>in</strong>)<br />
Ga<strong>in</strong> <strong>of</strong> 19,000 ha<br />
(20% ga<strong>in</strong>)<br />
For every 1km, 200m is<br />
restored<br />
Rapid decl<strong>in</strong>e Much better<br />
£0<br />
Hectare figures shown are appropriate for the East Midlands survey (i.e. they represent the national<br />
total areas m<strong>in</strong>us the East Midlands area for each attribute). X was one <strong>of</strong> the same six cost amounts<br />
used <strong>in</strong> the choice experiment.<br />
3.3.4 <strong>Valuation</strong> workshops<br />
Two valuation workshops <strong>of</strong> seven and twelve participants were held <strong>in</strong> Knaresborough and<br />
Harrogate on the 19 th and 20 th October 2005, respectively. The valuation workshops were<br />
<strong>in</strong>tended to provide a supplementary approach to deal with complex impacts for which<br />
participants may not have had pre-determ<strong>in</strong>ed preferences. Participants answered the<br />
same questionnaire as that used <strong>in</strong> the ma<strong>in</strong> survey (for the Yorkshire & the Humber GOR)<br />
to ga<strong>in</strong> qualitative <strong>in</strong>sights <strong>in</strong>to the relative values which respondents place on the different<br />
attributes, and to hear participants expla<strong>in</strong> their reason<strong>in</strong>g beh<strong>in</strong>d their choices. Follow<strong>in</strong>g<br />
the discussions, the participants were asked to reconsider their choices and make changes<br />
if they wished.<br />
The workshop protocol is presented <strong>in</strong> Annex 6 while a full valuation workshop report is<br />
presented <strong>in</strong> Annex 7. Some key f<strong>in</strong>d<strong>in</strong>gs <strong>of</strong> the valuation workshops are discussed <strong>in</strong><br />
Section 7.3.<br />
eftec 25 January 2006<br />
£X
<strong>Economic</strong> <strong>Valuation</strong> <strong>of</strong> <strong>Environmental</strong> <strong>Impacts</strong> <strong>in</strong> the Severely Disadvantaged Areas<br />
4. <strong>Valuation</strong> <strong>of</strong> Landscape – Literature Review<br />
4.1 Overview<br />
The follow<strong>in</strong>g literature review covers valuation studies <strong>of</strong> agriculturally-dom<strong>in</strong>ated<br />
landscapes and other studies which may usefully <strong>in</strong>form on the survey design and can be<br />
used for benefits transfer. Although this valuation study relates only to SDAs <strong>in</strong> England,<br />
many <strong>of</strong> the relevant studies are from Scotland. As some <strong>of</strong> the upland areas under<br />
consideration are <strong>in</strong> many respects similar to upland areas <strong>in</strong> Scotland rather than the<br />
gentler countryside <strong>in</strong> England, these studies are very much relevant. Studies <strong>of</strong> very<br />
different landscapes (e.g. coastal or East Anglian flat) have been omitted by the literature<br />
review; as have studies which deal only with woodlands or biodiversity, or those which seek<br />
values for access, path ma<strong>in</strong>tenance or visitor facilities.<br />
The type <strong>of</strong> goods valued <strong>in</strong> the relevant literature varies. Typical landscape attributes<br />
exam<strong>in</strong>ed by the studies reviewed <strong>in</strong>clude the physical extent <strong>of</strong> broad habitat categories<br />
(moorland, wetland, broad-leaved woodland, heather moorland, scrub) and diversity <strong>of</strong><br />
habitat components, either the species diversity <strong>of</strong> habitats, or <strong>of</strong> some other consideration<br />
(e.g. age diversity <strong>of</strong> woodlands). Some studies do not discuss specific landscape attributes<br />
with respondents, but show them pictorial representations <strong>of</strong> different landscapes between<br />
which they are asked to choose (e.g. Bullock and Kay, 1997, and Willis and Garrod, 1993).<br />
In common with this study, most previous studies were subject to a conventional series <strong>of</strong><br />
design stages, us<strong>in</strong>g focus groups to determ<strong>in</strong>e whether the questions asked <strong>in</strong> the survey<br />
were credible and to f<strong>in</strong>d out how much the general public already knew about the survey<br />
subject. Small scale pilot surveys were also generally used to test the credibility <strong>of</strong> the<br />
survey as well as survey logistics.<br />
Two <strong>of</strong> the studies reviewed conta<strong>in</strong> literature reviews. These are summarised <strong>in</strong> Section<br />
4.2. The other studies that deal with <strong>in</strong>dividual goods or changes are presented <strong>in</strong> Section<br />
4.3. Issues aris<strong>in</strong>g from this review are discussed <strong>in</strong> Section 4.4.<br />
4.2 Review Studies<br />
4.2.1 The <strong>Environmental</strong> Landscape Features model<br />
The <strong>Environmental</strong> Landscape Features (ELF) is a benefits transfer model to estimate the<br />
value <strong>of</strong> various landscape features <strong>in</strong> different regions <strong>of</strong> England (IERM/SAC, 1999;<br />
IERM/SAC, 2001). It was orig<strong>in</strong>ally constructed from 14 orig<strong>in</strong>al valuation studies to obta<strong>in</strong><br />
value estimates for rough grassland, heather moorland, salt marsh, woodland, wetland and<br />
hay meadow. Hedgerows and field marg<strong>in</strong>s (<strong>in</strong> the form <strong>of</strong> arable headlands) were added to<br />
the model after orig<strong>in</strong>al cont<strong>in</strong>gent valuation surveys were conducted <strong>in</strong> 2001. The ELF<br />
model was updated by David Oglethorpe <strong>in</strong> 2005 (see Oglethorpe 2005 for details).<br />
The benefits encapsulated <strong>in</strong> the ELF model for environmental features <strong>in</strong> each region are<br />
<strong>in</strong>tended to accrue only to those liv<strong>in</strong>g <strong>in</strong> the region and not residents <strong>of</strong> other regions or<br />
visitors. The ELF is also <strong>in</strong>tended to describe the dim<strong>in</strong>ish<strong>in</strong>g marg<strong>in</strong>al utility <strong>of</strong> the<br />
features, i.e. unit values are lower when the features are plentiful and higher when they<br />
are scarce. Transferred benefits are estimated through function transfer.<br />
The orig<strong>in</strong>al ELF model was validated by compar<strong>in</strong>g values calculated through benefits<br />
transfer with the results <strong>of</strong> two specially designed pilot surveys: one for heather moorland<br />
<strong>in</strong> Northumbria and one for rough graz<strong>in</strong>g <strong>in</strong> the North Penn<strong>in</strong>es. The observed mean per<br />
household per annum WTP for the rough graz<strong>in</strong>g survey was found to be with<strong>in</strong> the range<br />
predicted by the model; that for heather moorland was higher (although the 95%<br />
eftec 26 January 2006
<strong>Economic</strong> <strong>Valuation</strong> <strong>of</strong> <strong>Environmental</strong> <strong>Impacts</strong> <strong>in</strong> the Severely Disadvantaged Areas<br />
confidence <strong>in</strong>terval overlapped with the predicted range). The authors attributed this to<br />
the survey sample hav<strong>in</strong>g a slightly higher average <strong>in</strong>come than the regional average.<br />
The values obta<strong>in</strong>ed <strong>in</strong> the ELF model for rough grassland, heather moorland, woodland and<br />
hedgerows are compared with those found <strong>in</strong> the survey <strong>in</strong> Section 7.4. The ELF is also used<br />
for benefits transfer for hay meadows <strong>in</strong> Section 5.1.<br />
4.2.2 Framework for <strong>Environmental</strong> Accounts for Agriculture<br />
This study (eftec and IEEP, 2004) was <strong>in</strong>tended to develop a framework <strong>of</strong> sectoral<br />
account<strong>in</strong>g <strong>in</strong> order to <strong>in</strong>clude the economic costs and benefits <strong>of</strong> environmental impacts <strong>of</strong><br />
agriculture <strong>in</strong> the national agricultural accounts. The study reviewed both exist<strong>in</strong>g similar<br />
frameworks and relevant literature, and provided a useful summary <strong>of</strong> valuation studies<br />
relat<strong>in</strong>g to the impacts <strong>of</strong> agriculture on landscape, habitats and species, and a range <strong>of</strong><br />
other environmental impacts.<br />
The report notes that at least seven <strong>Environmental</strong>ly Sensitive Areas (ESAs) have been the<br />
subject <strong>of</strong> valuation studies. Only two <strong>of</strong> these are described below s<strong>in</strong>ce the other studies<br />
were situated <strong>in</strong> areas irrelevant to this study, such as the coast or Norfolk Broads. Studies<br />
focuss<strong>in</strong>g on ESAs typically encompass their range <strong>of</strong> landscape, biodiversity and heritage<br />
features rather than just landscape features as such.<br />
4.3 Individual <strong>Valuation</strong> Studies<br />
4.3.1 Willis and Garrod (1993) – Yorkshire Dales<br />
Willis and Garrod (1993) used CV to assess preferences for a range <strong>of</strong> different landscapes<br />
<strong>in</strong> the Yorkshire Dales which could result from future subsidy changes. These were<br />
described <strong>in</strong> the survey as: <strong>in</strong>tensive and semi-<strong>in</strong>tensive agricultural, planned, conserved,<br />
sport<strong>in</strong>g, wild and abandoned. The respondents consisted equally <strong>of</strong> residents <strong>of</strong> Craven<br />
local authority district <strong>in</strong> North Yorkshire and visitors to the area. Changes were illustrated<br />
to respondents pictorially. No attempt was made to estimate WTP for separate attributes,<br />
although preferences were exam<strong>in</strong>ed by ask<strong>in</strong>g respondents whether they would prefer<br />
less/more/the same <strong>of</strong> features. The outcome <strong>of</strong> such questions revealed fairly predictable<br />
preferences; most people would prefer more wild flowers and broadleaved woodland,<br />
fewer modern sheds and less wire fenc<strong>in</strong>g. Other attributes such as numbers <strong>of</strong> dry stone<br />
walls and graz<strong>in</strong>g animals were deemed to be at the right level by most people. There were<br />
fairly m<strong>in</strong>or differences <strong>in</strong> preferences between residents and visitors. Overall, the status<br />
quo landscape was the most popular, with nearly 50% <strong>of</strong> respondents choos<strong>in</strong>g it, with the<br />
conserved landscape also popular. The survey revealed strong preferences aga<strong>in</strong>st <strong>in</strong>tensive<br />
and semi-<strong>in</strong>tensive landscapes. Will<strong>in</strong>gness to pay for the preferred landscape ranged from<br />
£18-35 per household per annum. An <strong>in</strong>terest<strong>in</strong>g f<strong>in</strong>d<strong>in</strong>g is that residents who felt the Dales<br />
to be overcrowded had a lower WTP than other residents, suggest<strong>in</strong>g that perceived<br />
overcrowd<strong>in</strong>g can reduce the benefits <strong>of</strong> liv<strong>in</strong>g <strong>in</strong> a national park.<br />
4.3.2 Hanley et al. (1998) – Breadalbane ESA<br />
Hanley et al. (1998) study was designed to assess the economic value <strong>of</strong> the conservation<br />
benefits <strong>of</strong> the Breadalbane <strong>Environmental</strong>ly Sensitive Area (ESA) <strong>in</strong> Highland Perthshire.<br />
This was achieved by us<strong>in</strong>g both the CV and CE methods for comparison purposes. The<br />
relevant populations were considered to be the UK general public, local residents and<br />
visitors. In the choice experiment, the attributes were broadleaved woodland, moorland,<br />
wetland, dry stone dykes and archaeological sites, which are all features which farmers<br />
receiv<strong>in</strong>g ESA payments are obliged to conserve. The policy scenarios pursued were simply<br />
‘policy on’ and ‘policy <strong>of</strong>f’, i.e. a world with ESA payments and one without. Respondents<br />
eftec 27 January 2006
<strong>Economic</strong> <strong>Valuation</strong> <strong>of</strong> <strong>Environmental</strong> <strong>Impacts</strong> <strong>in</strong> the Severely Disadvantaged Areas<br />
expressed positive WTP for all the attributes at the ‘policy on’ levels, show<strong>in</strong>g dist<strong>in</strong>ct<br />
preferences for greater levels <strong>of</strong> broad-leaved woodland, heather moors and wet<br />
grasslands. Dry stone walls and archaeology commanded lower WTP.<br />
4.3.3 Bullock and Kay (1997) – Central Southern Uplands<br />
Bullock and Kay (1997) also performed a CV study on upland attributes <strong>in</strong> Scotland, but <strong>in</strong><br />
the Central Southern Uplands south <strong>of</strong> Ed<strong>in</strong>burgh and Glasgow. They were test<strong>in</strong>g for WTP<br />
for agricultural policies that produced landscapes associated with extensive graz<strong>in</strong>g. Three<br />
policy options were presented: bus<strong>in</strong>ess-as-usual, extensive and very extensive. The<br />
landscapes were illustrated pictorially (us<strong>in</strong>g symbols <strong>in</strong>dicat<strong>in</strong>g the abundance <strong>of</strong> wildlife),<br />
and no attempt was made to elicit values for <strong>in</strong>dividual landscape attributes. Local<br />
residents, birdwatchers and visitors to local beauty spots were surveyed. The results<br />
showed a clear preference for landscapes with more extensive graz<strong>in</strong>g and with more tree<br />
cover than at present.<br />
4.3.4 White and Lovett (1999) – North York Moors<br />
White and Lovett (1999) performed a CV study on a particular estate (Levisham) <strong>in</strong> the<br />
North York Moors to measure will<strong>in</strong>gness to pay to ma<strong>in</strong>ta<strong>in</strong> or enhance the estate. WTP for<br />
different landscape features was not sought, although qualitative preferences for habitat<br />
types associated with or reduced by sheep farm<strong>in</strong>g, such as heather moorland, semi-natural<br />
woodlands and unimproved pasture were sought. Many more respondents preferred either<br />
heather moorland or semi-natural woodlands compared to unimproved pasture, and<br />
<strong>in</strong>dicated different motivations for these choices (heather moorland for landscape,<br />
woodland for biodiversity and scarcity value). Fewer than half <strong>of</strong> participants <strong>in</strong>dicated a<br />
positive WTP to ma<strong>in</strong>ta<strong>in</strong> or enhance the estate, with half <strong>of</strong> the zero WTP bids be<strong>in</strong>g<br />
protest bids stat<strong>in</strong>g that National Parks should pay for themselves.<br />
4.4 Issues Aris<strong>in</strong>g<br />
Overall, the studies <strong>in</strong>dicate that the landscapes <strong>of</strong> upland areas and other agricultural<br />
areas are valued by the public. Although by no means all <strong>of</strong> those <strong>in</strong>terviewed said that<br />
they would be will<strong>in</strong>g to contribute f<strong>in</strong>ancially, this does not <strong>in</strong>dicate a lack <strong>of</strong> value, as a<br />
large proportion <strong>of</strong> protest bids are <strong>of</strong>ten observed.<br />
Hanley et al. (1998) note that both cont<strong>in</strong>gent valuation and choice experiments could<br />
estimate the value <strong>of</strong> landscapes, but that the choice experiment approach “is more suited<br />
to measur<strong>in</strong>g the (marg<strong>in</strong>al) value <strong>of</strong> the <strong>in</strong>dividual landscape and wildlife characteristics”<br />
that make up natural and semi-natural areas. They also note that there is a very large set<br />
<strong>of</strong> such characteristics available and the welfare measure may be <strong>in</strong>fluenced by which ones<br />
are chosen. CE is also more useful for benefits transfer because <strong>in</strong>dividual features are<br />
valued.<br />
The studies reviewed do not agree on whether respondents tend to prefer a particular<br />
landscape because it has always been familiar to them, i.e. attachment to the status quo.<br />
Willis and Garrod (1993) report a clear preference for the status quo. By contrast, Bullock<br />
and Kay (1997) tested specifically for this bias by actually ask<strong>in</strong>g respondents which<br />
landscape they found the more typical. They found that respondents did not necessarily<br />
prefer this landscape, and that overall respondents preferred a more extensified landscape.<br />
These different f<strong>in</strong>d<strong>in</strong>gs could reflect regional differences; or they could reflect a more<br />
conservative attitude by residents <strong>in</strong> a designated National Park.<br />
A further issue is that respondents’ preferences for particular landscape features can be<br />
sensitive both to the amount and type <strong>of</strong> <strong>in</strong>formation that they are given and on the way<br />
eftec 28 January 2006
<strong>Economic</strong> <strong>Valuation</strong> <strong>of</strong> <strong>Environmental</strong> <strong>Impacts</strong> <strong>in</strong> the Severely Disadvantaged Areas<br />
that features are presented to them pictorially. Information about the wider ecological<br />
impact <strong>of</strong> a feature could alter preferences. Willis and Garrod (1993) note that<br />
“respondents unfamiliar with the aesthetic good be<strong>in</strong>g valued by a [CV study] can easily be<br />
<strong>in</strong>fluenced by <strong>in</strong>formation conta<strong>in</strong>ed <strong>in</strong> the def<strong>in</strong>ition <strong>of</strong> the good". Further, Shelby and<br />
Harris (1985) note that the presence <strong>of</strong> animals or time <strong>of</strong> year that the picture was taken<br />
can unduly <strong>in</strong>fluence respondents. It is therefore important that any survey us<strong>in</strong>g images<br />
should treat different features consistently and also be designed so that respondents are<br />
express<strong>in</strong>g preferences for features be<strong>in</strong>g exam<strong>in</strong>ed, and not just for the pictures. This is<br />
why, pictures that are representative <strong>of</strong> typical features <strong>of</strong> the upland attributes were used<br />
<strong>in</strong> the survey for this study as well as verbal descriptions <strong>of</strong> the attributes.<br />
eftec 29 January 2006
<strong>Economic</strong> <strong>Valuation</strong> <strong>of</strong> <strong>Environmental</strong> <strong>Impacts</strong> <strong>in</strong> the Severely Disadvantaged Areas<br />
5. <strong>Valuation</strong> <strong>of</strong> Attributes Not Included <strong>in</strong> the Choice<br />
Experiment<br />
This Section describes the scope for valu<strong>in</strong>g the upland attributes not <strong>in</strong>cluded <strong>in</strong> the choice<br />
experiment via benefits transfer. For a description <strong>of</strong> the pr<strong>in</strong>ciple beh<strong>in</strong>d benefits transfer<br />
see Section 3.3. In all but one case, benefits transfer is not able to be used <strong>in</strong> this study.<br />
5.1 Benefits transfer Us<strong>in</strong>g the <strong>Environmental</strong> Landscape Features<br />
Model<br />
5.1.1 Attributes considered<br />
Six <strong>of</strong> the upland attributes considered <strong>in</strong> this study have exact or rough equivalents <strong>in</strong> the<br />
ELF model: hay meadows, rough grassland, heather moorland and bog, broad-leaved and<br />
mixed woodland, field boundaries, and arable land. However, each <strong>of</strong> these upland<br />
attributes could only be applied to benefits transfer or compared with new values found <strong>in</strong><br />
this study with the follow<strong>in</strong>g caveats:<br />
• The actual area coverage <strong>of</strong> hay meadows <strong>in</strong> SDA areas is not known with precision.<br />
<strong>Defra</strong> use a simple rule <strong>of</strong> thumb <strong>of</strong> assum<strong>in</strong>g that hay meadows make up 35% <strong>of</strong><br />
improved grassland (pers. comm., <strong>Defra</strong>, 2005).<br />
• In the ELF model, the heather moorland attribute does not explicitly <strong>in</strong>clude bog. Bogs<br />
were <strong>in</strong>cluded <strong>in</strong> the “wetland” feature <strong>of</strong> the ELF model;<br />
• The “farm woodlands” feature <strong>in</strong> the ELF model aga<strong>in</strong> does not perfectly overlap with<br />
the “broad-leaved and mixed woodland” attribute. Farm woodlands is <strong>in</strong>tended to cover<br />
mostly ash, oak, beech and alder woodlands, but does also <strong>in</strong>clude “recently planted”<br />
coniferous woodland;<br />
• In the ELF, only hedgerows, not drystone walls, are considered as field boundaries; and<br />
• Only arable headlands and field marg<strong>in</strong>s are considered <strong>in</strong> the ELF. These are likely to<br />
be valued much more highly by the public than a whole field <strong>of</strong> arable crops without<br />
field marg<strong>in</strong>s.<br />
Therefore, there is only one upland attribute, hay meadow, whose per hectare value can be<br />
entirely estimated through benefits transfer from the ELF model. The values <strong>of</strong> four others<br />
– rough grassland, heather moorland and bog, broad-leaved and mixed woodland, and field<br />
boundaries – are estimated <strong>in</strong> the choice experiment and can be compared with values<br />
found <strong>in</strong> the ELF model, and eventually, can be used to update the ELF model.<br />
5.1.2 Transfer <strong>of</strong> hay meadow value<br />
The ELF model provides value estimates based on 10%, 30%, 50%, 70% and 90% reductions <strong>in</strong><br />
abundance. From the predictions laid out <strong>in</strong> Section 2.3, it can be seen that the 10%<br />
reduction is the most appropriate to use. The estimated per hectare values by the 2005<br />
update <strong>of</strong> the ELF <strong>in</strong> each region are presented <strong>in</strong> Table 5.1. It is important to remember<br />
that these are with<strong>in</strong>-region values only. For this reason, it should be kept <strong>in</strong> m<strong>in</strong>d that the<br />
estimates for the South East, which does not have any SDAs, are not applicable to SDAs.<br />
eftec 30 January 2006
<strong>Economic</strong> <strong>Valuation</strong> <strong>of</strong> <strong>Environmental</strong> <strong>Impacts</strong> <strong>in</strong> the Severely Disadvantaged Areas<br />
Table 5.1: Estimated annual per hectare values (£)<br />
from the ELF model (2005 update) for each GOR<br />
region.<br />
Region Lower bound Upper bound<br />
North West 20 34<br />
North East 20 33<br />
Yorkshire & Humber 26 44<br />
West Midlands 19 32<br />
East Midlands 24 40<br />
South West 8 13<br />
South East 29 48<br />
5.2 Other Attributes<br />
5.2.1 Improved grassland<br />
Accord<strong>in</strong>g to eftec and Entec (2002), there has only been one study which explicitly values<br />
improved grassland, <strong>in</strong> the context <strong>of</strong> urban development <strong>in</strong> Canada (Bowker and Diychuck,<br />
1994). However, this is not <strong>of</strong> relevance to improved grassland <strong>in</strong> SDAs <strong>in</strong> the UK. Eftec and<br />
IEEP (2004) note that “studies on the value <strong>of</strong> greenbelt land value agricultural landscape<br />
aga<strong>in</strong>st the threat <strong>of</strong> development reflect both the disamenity <strong>of</strong> hous<strong>in</strong>g development and<br />
the value <strong>of</strong> the landscape without hous<strong>in</strong>g”. At this time, there does not appear to be any<br />
quantitative evidence on the amenity value <strong>of</strong> improved grassland, and this attribute will<br />
have to be excluded from benefits transfer.<br />
5.2.2 Bracken or gorse dom<strong>in</strong>ated<br />
There is no evidence <strong>in</strong> the literature on the valuation <strong>of</strong> bracken and gorse. On the<br />
evidence <strong>of</strong> the focus groups, it is unlikely that either attribute would have a high positive<br />
value, and may even have a negative value, <strong>in</strong> terms <strong>of</strong> landscape amenity. However, gorse<br />
has some ecological benefits which may contribute to biodiversity provision.<br />
5.2.3 Arable / set aside<br />
The amenity value <strong>of</strong> arable and set aside land is unknown, and is likely to be very low (or<br />
possibly even negative). There do not appear to be any studies on the amenity value <strong>of</strong><br />
arable land from which to transfer benefits.<br />
5.2.4 Water quantity<br />
Information relat<strong>in</strong>g to flood<strong>in</strong>g and the costs <strong>of</strong> flood<strong>in</strong>g is sketchy. Eftec and IEEP (2004)<br />
note that the Environment Agency estimates that at least 14% <strong>of</strong> all flood costs (or about<br />
£153 million per annum) should be attributed to agriculture (EA, 2002). However, the<br />
contribution <strong>of</strong> different types <strong>of</strong> agriculture is not detailed. Relat<strong>in</strong>g the causal factors<br />
which cause a greater flood<strong>in</strong>g risk <strong>in</strong> any particular area to the costs which may be<br />
attributable to flood<strong>in</strong>g is highly complicated and beyond the scope <strong>of</strong> this project.<br />
5.2.5 Water quality<br />
Eftec and IEEP (2004) cite Georgiou et al. (2000) as “the only study undertaken that has<br />
l<strong>in</strong>ked WTP for improvements <strong>in</strong> water quality <strong>in</strong>dices”. The study sought WTP for<br />
improvements <strong>in</strong> total ammonia, biochemical oxygen demand and dissolved oxygen <strong>in</strong> the<br />
eftec 31 January 2006
<strong>Economic</strong> <strong>Valuation</strong> <strong>of</strong> <strong>Environmental</strong> <strong>Impacts</strong> <strong>in</strong> the Severely Disadvantaged Areas<br />
River Tame <strong>in</strong> the West Midlands, relat<strong>in</strong>g these to “large”, “medium” and “small”<br />
improvements <strong>in</strong> overall water quality. This study estimated that the annual welfare impact<br />
on society from loss <strong>of</strong> amenity associated with rivers classed as ‘fair’ or ‘poor’ was £5,600<br />
per km <strong>of</strong> river. However, the River Tame is an urban river, so it is not appropriate to use it<br />
for comparison purposes with rivers <strong>in</strong> SDAs.<br />
Furthermore, given that the policy–attribute impact analysis has not been able to provide<br />
quantitative estimates for this attribute (see Table 2.2), it would not be possible to take<br />
this analysis further even if a unit economic value estimate existed.<br />
5.2.6 Greenhouse gas emissions<br />
In the case <strong>of</strong> greenhouse gas emissions, the appropriate figure to use is the ‘social cost <strong>of</strong><br />
carbon’, i.e. the estimated damage (<strong>in</strong> the form <strong>of</strong> damage <strong>in</strong>flicted by extreme weather<br />
events, sea level rises, etc.) caused by an extra tonne <strong>of</strong> carbon dioxide equivalent (tCO2e)<br />
emitted. <strong>Defra</strong> have adopted 8 a range <strong>of</strong> estimates for the social cost <strong>of</strong> carbon <strong>of</strong> £35-£140<br />
per tC, with a s<strong>in</strong>gle po<strong>in</strong>t estimate <strong>of</strong> £70 per tC. In terms <strong>of</strong> carbon dioxide equivalent,<br />
these figures translate <strong>in</strong>to £9.50 to £38 per tCO2e, with a s<strong>in</strong>gle po<strong>in</strong>t estimate <strong>of</strong> £19 per<br />
tCO2e.<br />
However, greenhouse gas emissions will not be able to be <strong>in</strong>cluded <strong>in</strong> the benefits transfer<br />
as no quantitative estimate <strong>of</strong> their likely change under the different policy scenarios has<br />
been made. Furthermore, the amount <strong>of</strong> greenhouse gas emissions for which agriculture <strong>in</strong><br />
SDAs is responsible is not known.<br />
8 See http://www.defra.gov.uk/environment/climatechange/carbon%2Dcost for details.<br />
eftec 32 January 2006
<strong>Economic</strong> <strong>Valuation</strong> <strong>of</strong> <strong>Environmental</strong> <strong>Impacts</strong> <strong>in</strong> the Severely Disadvantaged Areas<br />
6. Stated Preference Survey: Summary and Non-<br />
Monetary Results<br />
This section provides a summary <strong>of</strong> the questionnaire used <strong>in</strong> the ma<strong>in</strong> survey (Section 6.1)<br />
and the headl<strong>in</strong>e results from the survey <strong>in</strong>clud<strong>in</strong>g socio-economic representativeness <strong>of</strong><br />
the samples (Section 6.2), and summary <strong>of</strong> attitudes, op<strong>in</strong>ions and other related<br />
<strong>in</strong>formation (Section 6.3). Will<strong>in</strong>gness to pay estimates from the choice experiment and<br />
cont<strong>in</strong>gent valuation are presented <strong>in</strong> Section 8.1. The actual questionnaire and the<br />
statistical analysis <strong>of</strong> the results can be found <strong>in</strong> Annexes 4 and 5, respectively.<br />
6.1 Ma<strong>in</strong> Questionnaire Summary<br />
The survey conta<strong>in</strong>ed four sections as follows:<br />
A. Attitudes<br />
B. Choice experiment questions<br />
C. Cont<strong>in</strong>gent valuation question (not for the South East survey)<br />
D. Socio-economic characteristics<br />
6.1.1 Section A<br />
Section A conta<strong>in</strong>s three brief questions on attitudes to the environment and countryside.<br />
Question A1 asked whether respondents considered environmental policy to be important <strong>in</strong><br />
relation to other areas <strong>of</strong> government expenditure. Question A2 asked respondents to rank<br />
the four environmental priorities presented to them (controll<strong>in</strong>g air pollution, tackl<strong>in</strong>g<br />
climate change, protect<strong>in</strong>g the countryside and protect<strong>in</strong>g the quality <strong>of</strong> rivers, lakes and<br />
the sea) from the most important to the least. F<strong>in</strong>ally, question A3 asked respondents<br />
whether they ever visited the countryside for recreational or work purposes or both.<br />
6.1.2 Section B<br />
This section conta<strong>in</strong>s the choice experiment. In the preamble to the experiment the<br />
valuation scenario, the location (with<strong>in</strong> the region) and character <strong>of</strong> SDAs were expla<strong>in</strong>ed<br />
to respondents. A map show<strong>in</strong>g all SDAs <strong>in</strong> England and a smaller one show<strong>in</strong>g the specific<br />
region are presented as a show card. The valuation scenarios also described the five chosen<br />
upland attributes (heather moorland and bog, rough grassland, broadleaf and mixed<br />
woodland, field boundaries and traditional farm build<strong>in</strong>gs and farm<strong>in</strong>g practices). The need<br />
for the hill farm<strong>in</strong>g policy and alternative policy options was presented to respondents <strong>in</strong><br />
order to clarify the <strong>in</strong>stitutional set up through which policy changes would be affected.<br />
Respondents were given an example choice card to show how the experiment will proceed.<br />
Before the experiment commenced, respondents were assured that the survey was<br />
<strong>in</strong>terested <strong>in</strong> their views and not that <strong>of</strong> ‘experts’, and they were rem<strong>in</strong>ded <strong>of</strong> other<br />
demands on their household budget. F<strong>in</strong>ally, they were shown a card to expla<strong>in</strong> the<br />
absolute amounts <strong>of</strong> each upland attribute as it exists <strong>in</strong> their region and what percentage<br />
changes shown <strong>in</strong> the choice cards may mean <strong>in</strong> absolute terms.<br />
Dur<strong>in</strong>g the choice experiment each respondent was asked to state their most preferred<br />
option out <strong>of</strong> three policy options on each <strong>of</strong> the six choice cards they were given (question<br />
B1). Some immediate follow up questions aimed to f<strong>in</strong>d out the motivations beh<strong>in</strong>d<br />
choos<strong>in</strong>g the current situation (zero WTP) and an alternative policy option (positive WTP)<br />
(questions B2-B4). The section ended with question B5 which asked the level <strong>of</strong> difficulty<br />
the respondents faced <strong>in</strong> answer<strong>in</strong>g the choice questions.<br />
eftec 33 January 2006
<strong>Economic</strong> <strong>Valuation</strong> <strong>of</strong> <strong>Environmental</strong> <strong>Impacts</strong> <strong>in</strong> the Severely Disadvantaged Areas<br />
6.1.3 Section C<br />
This section conta<strong>in</strong>s the cont<strong>in</strong>gent valuation part <strong>of</strong> the questionnaire. Two scenarios<br />
were presented to respondents detail<strong>in</strong>g the possible level <strong>of</strong> attributes under both a<br />
costless ‘current policy’ scenario and an improvement scenario, with one <strong>of</strong> six different<br />
price levels attached. The improvement scenario was constructed us<strong>in</strong>g the best possible<br />
outcome <strong>of</strong> all upland attributes. This time, however, the attribute levels presented were<br />
for the other five SDAs <strong>in</strong> England as this question aimed to elicit respondents’ preferences<br />
for SDAs that are not <strong>in</strong> their own region. The South Eastern survey did not <strong>in</strong>clude a<br />
Section C because, as the South East does not conta<strong>in</strong> any SDAs, the choice experiment<br />
section had already asked about the rest <strong>of</strong> England.<br />
After the cont<strong>in</strong>gent valuation question (question C1), those who were not will<strong>in</strong>g to pay<br />
the stated amount were asked a follow-up question to expla<strong>in</strong> the reason for their answer<br />
(question C2). It was assumed that those who were will<strong>in</strong>g to pay someth<strong>in</strong>g towards SDAs<br />
<strong>in</strong> other regions had similar reasons for do<strong>in</strong>g so as they did when they answered the choice<br />
experiment questions for their own region. Therefore, respondents were not asked a<br />
follow-up question <strong>in</strong> order to m<strong>in</strong>imise the size <strong>of</strong> the questionnaire.<br />
6.1.4 Section D<br />
This section conta<strong>in</strong>s follow up questions on respondents’ habits regard<strong>in</strong>g actually visit<strong>in</strong>g<br />
SDAs (questions D1 and D2), their previous and expected residency <strong>in</strong> the region (question<br />
D4 and D5) as well as standard socio-economic characteristics <strong>in</strong>clud<strong>in</strong>g the size and<br />
composition <strong>of</strong> their household (question D3), their membership <strong>of</strong> environmental and other<br />
organizations (question D6), their education (question D7), employment status (question<br />
D8) and <strong>in</strong>come (question D9). The f<strong>in</strong>al question (D10) asked respondents what they<br />
thought <strong>of</strong> the questionnaire.<br />
6.2 Socio-economic Representativeness <strong>of</strong> the Sample<br />
The survey sample was selected accord<strong>in</strong>g to appropriate quotas for sex, age and socioeconomic<br />
group for each GOR <strong>in</strong> order to ensure that responses were representative. Table<br />
6.1 summarises for each region the proportions <strong>of</strong> survey respondents <strong>of</strong> each gender, age<br />
bracket and socio-economic group, along with (<strong>in</strong> brackets) comparative proportions<br />
accord<strong>in</strong>g to the 2001 Census (or ONS data provided by <strong>Defra</strong> <strong>in</strong> the case <strong>of</strong> the rural/urban<br />
split). The table shows that <strong>in</strong> each region, more than 300 respondents were sampled <strong>in</strong><br />
order to account for possible unusable surveys.<br />
With the odd exception (particularly <strong>in</strong> the North West), the survey quotas have mostly<br />
been fulfilled and these figures <strong>in</strong>dicate that samples have been as far as possible<br />
appropriately representative <strong>of</strong> gender, age, socio-economic background and location.<br />
Adjusted mean gross household <strong>in</strong>come figures <strong>in</strong> Table 6.2 are <strong>in</strong> some regions fairly<br />
different to <strong>of</strong>ficial regional estimates (<strong>in</strong> brackets). This is probably due to the<br />
approximate nature <strong>of</strong> the mean estimation (generally it is not accepted practice to ask<br />
respondents for their exact <strong>in</strong>come), an approximate McClement’s <strong>in</strong>come adjustment (due<br />
to uncerta<strong>in</strong>ty over household composition), and a high <strong>in</strong>come non-response rate (see<br />
Section 6.1.1).<br />
It was orig<strong>in</strong>ally planned to have three survey quotas based on location: urban, rural non-<br />
SDA and SDA. However, figures provided by <strong>Defra</strong> showed that the proportion <strong>of</strong> the<br />
population actually liv<strong>in</strong>g <strong>in</strong> SDAs <strong>in</strong> each region is too small for this to be feasible or<br />
necessary: overall only 37 out <strong>of</strong> 1,800 respondents <strong>in</strong> SDA GORs (2%) would have been<br />
<strong>in</strong>terviewed, and only five or fewer respondents <strong>in</strong> most GORs. The def<strong>in</strong>ition <strong>of</strong> ‘rural’ and<br />
‘urban’ is the new def<strong>in</strong>ition created by the Office <strong>of</strong> the Deputy Prime M<strong>in</strong>ister <strong>in</strong> 2002 9 .<br />
9 See Office <strong>of</strong> National Statistics http://www.statistics.gov.uk/geography/urban_rural.asp for more details.<br />
eftec 34 January 2006
<strong>Economic</strong> <strong>Valuation</strong> <strong>of</strong> <strong>Environmental</strong> <strong>Impacts</strong> <strong>in</strong> the Severely Disadvantaged Areas<br />
Other socio-economic characteristics <strong>of</strong> the f<strong>in</strong>al survey respondents which are important<br />
but which were not specified <strong>in</strong> the form <strong>of</strong> sample quotas are presented <strong>in</strong> Table 6.2.<br />
There was quite a high non-response rate for the education question <strong>in</strong> some areas.<br />
Table 6.1: Pr<strong>in</strong>cipal socio-economic characteristics <strong>of</strong> survey samples<br />
NW NE YH WM EM SW SE<br />
Total no.<br />
respondents<br />
Gender (%)<br />
335 300 312 318 314 301 345<br />
Males (%) 48(48) 49(49) 50(49) 49(49) 46(50) 46(50) 48(50)<br />
Females (%)<br />
Age brackets (%)<br />
52(52) 51(51) 50(51) 51(51) 54(50) 54(50) 52(50)<br />
18-34 42(33) 34(32) 33(32) 33(33) 39(32) 30(30) 35(32)<br />
35-54 32(42) 42(43) 43(42) 38(42) 36(42) 41(42) 40(43)<br />
55-70 26(25) 24(36) 24(25) 29(25) 26(25) 29(28) 25(26)<br />
Socio-economic group 1 (%)<br />
ABC1 35(48) 43(37) 40(38) 48(46) 46(43) 47(48) 57(53)<br />
C2DE 65(52) 56(63) 59(62) 52(54) 54(57) 52(52) 42(47)<br />
Distribution <strong>of</strong> sample (and population) between rural and urban areas<br />
Rural 11(12) 12(19) 23(20) 15(16) 39(30) 32(34) 20(22)<br />
Urban 89(88) 88(81) 77(80) 85(84) 61(70) 68(66) 80(78)<br />
1<br />
Def<strong>in</strong>itions <strong>of</strong> socio-economic groups are provided <strong>in</strong> Section 3.3.<br />
General notes: The numbers <strong>in</strong> brackets are comparative figures from the 2001 Census. The region<br />
abbreviations will be used throughout the rest <strong>of</strong> the report: NW = North West, NE = North East, YH<br />
= Yorkshire and the Humber, WM= West Midlands, EM = East Midlands, SW = South West, SE = South<br />
East.<br />
eftec 35 January 2006
<strong>Economic</strong> <strong>Valuation</strong> <strong>of</strong> <strong>Environmental</strong> <strong>Impacts</strong> <strong>in</strong> the Severely Disadvantaged Areas<br />
Table 6.2: Further socio-economic characteristics <strong>of</strong> the survey samples<br />
NW NE YH WM EM SW SE<br />
Adjusted mean<br />
gross household<br />
<strong>in</strong>come 1 (£ pa)<br />
Employment (%)<br />
32,800<br />
(23,300)<br />
20,000<br />
(21,400)<br />
18,000<br />
(23,000)<br />
28,900<br />
(25,100)<br />
18,400<br />
(25,300)<br />
21,000<br />
(26,000)<br />
26,500<br />
(33,300)<br />
Self-employed 9 6 7 13 6 8 8<br />
Full-time 52 43 40 32 37 35 33<br />
Part-time 11 12 12 19 14 18 12<br />
Student 4 4 7 6 9 3 10<br />
Unemployed 2 10 6 3 7 7 4<br />
Look<strong>in</strong>g after<br />
home full time<br />
3 6 10 5 7 10 10<br />
Retired 13 15 14 21 15 15 16<br />
Unable to work 2 Education (%)<br />
2 4 3 1 4 2 4<br />
Primary 16 14 11 10 8 10 5<br />
O Levels / GCSE<br />
or equivalent<br />
A level / HSE or<br />
(vocational)<br />
equivalent<br />
Pr<strong>of</strong>essional<br />
qualification <strong>of</strong><br />
degree level<br />
44 39 55 23 57 41 41<br />
19 19 18 17 18 17 26<br />
4 8 6 16 7 4 8<br />
First degree level 11 8 8 26 4 11 14<br />
Higher degree<br />
(masters or PhD)<br />
5 3 1 8 3 4 7<br />
No. children 3 <strong>in</strong> household (%)<br />
None 84 66 55 69 69 64 62<br />
One 9 17 16 16 13 14 13<br />
Two 5 14 19 12 13 14 18<br />
Three or more 3 4 9 4 5 8 7<br />
Percentages may not add up to exactly 100% <strong>in</strong> all cases because <strong>of</strong> small numbers <strong>of</strong> non-responses<br />
to certa<strong>in</strong> questions or because <strong>of</strong> round<strong>in</strong>g.<br />
1<br />
Figures <strong>in</strong> brackets are <strong>in</strong>flation-adjusted regional average gross annual <strong>in</strong>come figures provided by<br />
ONS Regional Trends for the period 1999-2002. Survey <strong>in</strong>comes have been adjusted accord<strong>in</strong>g to the<br />
McClement’s equivalence adjustment, so that they are comparable with <strong>of</strong>ficial statistics. However<br />
as we do not have detailed data on household composition this is approximate. The average shown<br />
here is the average <strong>of</strong> mid-po<strong>in</strong>ts <strong>of</strong> <strong>in</strong>tervals. The mid-po<strong>in</strong>t <strong>of</strong> the top unbounded <strong>in</strong>come <strong>in</strong>terval<br />
“£125,000 or more” is taken to be £125,000, though this may under-estimate average <strong>in</strong>come.<br />
2 from sickness or disability.<br />
3<br />
def<strong>in</strong>ed as 16 or under. Please note that this is the number <strong>in</strong> the household, not <strong>in</strong> the family – i.e.<br />
grown up children who have left, or children liv<strong>in</strong>g with a divorced partner, are not counted.<br />
eftec 36 January 2006
<strong>Economic</strong> <strong>Valuation</strong> <strong>of</strong> <strong>Environmental</strong> <strong>Impacts</strong> <strong>in</strong> the Severely Disadvantaged Areas<br />
6.3 Attitudes, Op<strong>in</strong>ions and Other Information<br />
This section presents the results <strong>of</strong> the questions not presented <strong>in</strong> Section 6.2, i.e.<br />
questions on attitudes, habits and residence <strong>in</strong> the GOR. The questions are paraphrased; for<br />
exact phras<strong>in</strong>g see the full ma<strong>in</strong> questionnaire <strong>in</strong> Annex 4.<br />
6.3.1 Attitudes towards the environment, countryside and SDAs<br />
The results relat<strong>in</strong>g to the follow<strong>in</strong>g questions are presented <strong>in</strong> Table 6.3:<br />
Question A1: How important would you say that environmental policy is, <strong>in</strong> relation to<br />
other th<strong>in</strong>gs that government is concerned with, such as law and order, or education?<br />
Question A2: What do you th<strong>in</strong>k should be the ma<strong>in</strong> concern for environmental policy <strong>in</strong><br />
this country over the next 10 years? Ranked from 1 - most important) to 4 - least<br />
important).<br />
Question D6: Are you or is anyone <strong>in</strong> your household a member <strong>of</strong> an environmental,<br />
heritage, outdoor recreation or farm<strong>in</strong>g organisation?<br />
The percentages reflect the aggregated sample <strong>of</strong> all seven GORs surveyed.<br />
Table 6.3: Responses to attitud<strong>in</strong>al questions on the environment<br />
and countryside<br />
A1 response % response<br />
Very important 45<br />
Quite important 43<br />
Not all that important 8<br />
I really don’t care 3<br />
A2 response % say<strong>in</strong>g most<br />
important 1<br />
average rank<br />
(high means<br />
less important)<br />
Controll<strong>in</strong>g air pollution 36 2.1<br />
Tackl<strong>in</strong>g climate change 32 2.4<br />
Protect<strong>in</strong>g the countryside 18 2.7<br />
Protect<strong>in</strong>g water quality 13 2.8<br />
D6 response % respondent<br />
RSPB<br />
members<br />
5<br />
Other environmental group 11<br />
National Trust 13<br />
NFU or other farm<strong>in</strong>g group 2<br />
Outdoor recreational<br />
4<br />
organization 2<br />
1<br />
These are percentages <strong>of</strong> those who answered the question fully (see text).<br />
2<br />
e.g. Ramblers’ Association.<br />
It was clear that most respondents were environmentally aware and concerned. However,<br />
protect<strong>in</strong>g the countryside did not rank highly as an environmental concern compared to<br />
controll<strong>in</strong>g air pollution or tack<strong>in</strong>g climate change. These rank<strong>in</strong>gs did not change much<br />
between regions, with all samples cit<strong>in</strong>g air pollution as the most important problem, and<br />
all but one cit<strong>in</strong>g climate change as the second most important. As a generalisation,<br />
samples with higher educational levels were more environmentally aware. Not all<br />
respondents completed the rank<strong>in</strong>g question, with a large proportion <strong>in</strong> the West Midlands<br />
say<strong>in</strong>g that all were <strong>of</strong> equal importance.<br />
eftec 37 January 2006
<strong>Economic</strong> <strong>Valuation</strong> <strong>of</strong> <strong>Environmental</strong> <strong>Impacts</strong> <strong>in</strong> the Severely Disadvantaged Areas<br />
Overall, 24% <strong>of</strong> respondents (or members <strong>of</strong> their household) belonged to some k<strong>in</strong>d <strong>of</strong> an<br />
environmental, heritage, outdoor recreation or farm<strong>in</strong>g organisation, with the s<strong>in</strong>gle most<br />
important group be<strong>in</strong>g the National Trust. There were large regional variations <strong>in</strong> group<br />
membership, with 35% <strong>in</strong> the South West, but only 11% <strong>in</strong> Yorkshire and the Humber. These<br />
figures could be higher than national proportions for <strong>in</strong>dividual membership because<br />
respondents were also asked about members <strong>of</strong> their household.<br />
6.3.2 Countryside and SDA visit<strong>in</strong>g habits<br />
The results relat<strong>in</strong>g to the follow<strong>in</strong>g questions are presented <strong>in</strong> Table 6.4 and Figure 6.1:<br />
Question A3: Do you ever visit the countryside for recreation, for work or for both?<br />
Question D1: Do you ever visit SDAs <strong>in</strong> your region for recreation, for work or for both?<br />
Question D2: How <strong>of</strong>ten to you visit SDAs <strong>in</strong> your region?<br />
Table 6.4: responses to questions on visit<strong>in</strong>g SDAs and<br />
countryside <strong>in</strong> general.<br />
A3/D1 response A3 (% response) D1 (% response)<br />
Yes, for recreation 71 67<br />
Yes, for work 2 2<br />
Yes, for both 13 12<br />
No, never 13 17<br />
D2 response 1<br />
% response<br />
More than once a week 23<br />
More than once a month 21<br />
More than once a year 25<br />
Less than once a year 15<br />
Never 14<br />
1<br />
There were actually ten different frequency group<strong>in</strong>gs for this question, but<br />
these are put <strong>in</strong>to fewer group<strong>in</strong>gs here for succ<strong>in</strong>ctness.<br />
Question A3 was asked <strong>of</strong> respondents before it was apparent that SDAs were the subject <strong>of</strong><br />
the survey, while Questions D1 and D2 were asked afterwards.<br />
A high proportion (84%) <strong>of</strong> respondents visited the countryside for recreational purposes,<br />
and a high proportion (79%) visited SDAs for recreational purposes (these percentages are<br />
the sum <strong>of</strong> the “Yes, for recreation” and “Yes, for both” responses). More people said they<br />
never visit SDAs <strong>in</strong> question D1 than <strong>in</strong> D2. This could be because Question D2 conta<strong>in</strong>ed a<br />
“have visited at least once <strong>in</strong> the past” response, whereas a “Never” <strong>in</strong> Question D1<br />
probably meant recent and current <strong>in</strong>tent.<br />
Respondents <strong>in</strong> most regions said that they visited the countryside more than they visited<br />
SDAs, as would be expected (see Figure 6.1). Unsurpris<strong>in</strong>gly, this was especially true <strong>in</strong> the<br />
South East which does not have any SDAs. Oddly, <strong>in</strong> the North West region, only 69% <strong>of</strong><br />
respondents said that they visited the countryside for recreational purposes, compared to<br />
85% who said that they visited SDAs for recreation. It is possible that <strong>in</strong> a region like the<br />
North West, where SDAs dom<strong>in</strong>ate the landscape, the <strong>in</strong>itial term “countryside” conjured<br />
up flatter, less wild countryside to respondents.<br />
eftec 38 January 2006
<strong>Economic</strong> <strong>Valuation</strong> <strong>of</strong> <strong>Environmental</strong> <strong>Impacts</strong> <strong>in</strong> the Severely Disadvantaged Areas<br />
Percentage <strong>of</strong> respondents<br />
70%<br />
60%<br />
50%<br />
40%<br />
30%<br />
20%<br />
10%<br />
0%<br />
Yes<br />
(recreation)<br />
Yes (work) Yes<br />
(both)<br />
Response<br />
Countryside<br />
SDAs (<strong>in</strong> region)<br />
Figure 6.1: Number <strong>of</strong> respondents who visited either “the countryside” or SDAs for<br />
recreation, work or both<br />
6.3.3 Length <strong>of</strong> residence <strong>in</strong> region<br />
The results relat<strong>in</strong>g to the follow<strong>in</strong>g questions are presented <strong>in</strong> Table 6.5:<br />
D4: Approximately, how long have you been liv<strong>in</strong>g <strong>in</strong> your region?<br />
D5: Th<strong>in</strong>k<strong>in</strong>g ahead, how long do you th<strong>in</strong>k you will rema<strong>in</strong> liv<strong>in</strong>g <strong>in</strong> your region?<br />
Table 6.5: To date and expected future<br />
residency <strong>in</strong> respondents’ GORs<br />
D4 response % response<br />
10 years or less 14<br />
11-20 years 16<br />
21-30 years 19<br />
31-40 years 19<br />
41-50 years 10<br />
More than 50 years 20<br />
D5 response % response<br />
Less than 1 year 2<br />
Greater than 1 year 5<br />
Greater than 5 years 7<br />
Greater than 10 years 5<br />
No <strong>in</strong>tention <strong>of</strong> mov<strong>in</strong>g 70<br />
Don’t know 10<br />
The majority <strong>of</strong> respondents were long term residents <strong>in</strong> their region and the overwhelm<strong>in</strong>g<br />
majority expected to cont<strong>in</strong>ue liv<strong>in</strong>g there for the foreseeable future. Because<br />
respondents’ exact ages are not known, it is not possible to determ<strong>in</strong>e how many were so<br />
far lifelong residents, although it is possible to determ<strong>in</strong>e how many were def<strong>in</strong>itely not<br />
lifelong residents (because they had lived <strong>in</strong> the region less time than the m<strong>in</strong>imum age <strong>of</strong><br />
their age bracket). Overall 38% <strong>of</strong> respondents were def<strong>in</strong>itely not lifelong residents; this<br />
varied considerably between regions, from only 23% <strong>in</strong> the North East to 54% <strong>in</strong> the West<br />
Midlands.<br />
eftec 39 January 2006<br />
No
<strong>Economic</strong> <strong>Valuation</strong> <strong>of</strong> <strong>Environmental</strong> <strong>Impacts</strong> <strong>in</strong> the Severely Disadvantaged Areas<br />
7. Validity Test<strong>in</strong>g<br />
The follow<strong>in</strong>g general approaches to test the validity <strong>of</strong> stated preference study results are<br />
commonly used:<br />
• Content validity: assesses whether the stated preference study asked the right<br />
questions <strong>in</strong> a clear, understandable, sensible and appropriate manner with which<br />
to obta<strong>in</strong> a valid estimate <strong>of</strong> the WTP measure under <strong>in</strong>vestigation;<br />
• Construct validity: exam<strong>in</strong>es whether the relationships between measures produced<br />
by a stated preference study and other measures are <strong>in</strong> accordance with<br />
expectations. This <strong>in</strong>volves assess<strong>in</strong>g how far the coefficients <strong>of</strong> the variables used<br />
<strong>in</strong> the WTP functions show the relationships expected based on the economic<br />
theory and exam<strong>in</strong><strong>in</strong>g whether coefficients on certa<strong>in</strong> attitud<strong>in</strong>al and<br />
socioeconomic variables have the expected signs; and<br />
• Convergent validity: exam<strong>in</strong>es whether the quantitative results are broadly<br />
comparable with the results <strong>of</strong> other studies valu<strong>in</strong>g similar goods.<br />
These tests are outl<strong>in</strong>ed <strong>in</strong> Sections 7.1 to 7.3, respectively, with a brief summary <strong>of</strong> the<br />
f<strong>in</strong>d<strong>in</strong>gs <strong>of</strong> the valuation workshops <strong>in</strong> Section 7.4.<br />
7.1 Content Validity<br />
As part <strong>of</strong> the content validity tests, the follow<strong>in</strong>g has been <strong>in</strong>vestigated:<br />
• Non-response rate to the <strong>in</strong>come question: one <strong>of</strong> the signs that the questionnaire<br />
has worked well is generally accepted as a high response rate to <strong>in</strong>dividual<br />
questions. In terms <strong>of</strong> <strong>in</strong>creas<strong>in</strong>g the ability <strong>of</strong> the econometric analysis to expla<strong>in</strong><br />
the WTP responses or the most preferred choices, <strong>in</strong>come is an important factor.<br />
Therefore, response rate to the <strong>in</strong>come question is seen as one <strong>of</strong> the <strong>in</strong>dicators <strong>of</strong><br />
validity. This is discussed <strong>in</strong> Section 7.1.1.<br />
• The reasons beh<strong>in</strong>d positive and zero WTP responses (or implied WTP responses<br />
from choices made) can also be <strong>in</strong>dications <strong>of</strong> validity. Those reasons that<br />
correspond to the change <strong>in</strong> the good presented <strong>in</strong> the questionnaire are termed as<br />
‘valid’ while those that do not are termed as ‘<strong>in</strong>valid’ or ‘protest’ answers. These<br />
are <strong>in</strong>vestigated <strong>in</strong> Sections 7.1.2 and 7.1.3.<br />
• Attitudes to the survey on the whole can also be <strong>in</strong>dicators <strong>of</strong> validity. These are<br />
reported <strong>in</strong> Section 7.1.4.<br />
7.1.1 Income non-response<br />
The analysis <strong>of</strong> the results is to some extent dependent on respondents’ will<strong>in</strong>gness to<br />
divulge their approximate level <strong>of</strong> household <strong>in</strong>come. Table 7.1 <strong>in</strong>dicates the percentage <strong>of</strong><br />
respondents <strong>in</strong> each region unable or unwill<strong>in</strong>g to answer the <strong>in</strong>come question D9.<br />
Table 7.1: Non-response to the <strong>in</strong>come question D9 (either refusal or “don’t know”)<br />
NW NE YH WM EM SW SE<br />
Income nonresponse<br />
(%)<br />
8 21 37 18 37 32 30<br />
eftec 40 January 2006
<strong>Economic</strong> <strong>Valuation</strong> <strong>of</strong> <strong>Environmental</strong> <strong>Impacts</strong> <strong>in</strong> the Severely Disadvantaged Areas<br />
The non-response rate varied considerably across regions, with very high levels <strong>in</strong> Yorkshire<br />
and the Humber and the East Midlands. Unfortunately, the <strong>in</strong>come non-response rate was<br />
high enough <strong>in</strong> four regions for <strong>in</strong>come to have to be excluded from the regression analysis<br />
(see Section 7.2.1).<br />
7.1.2 Reasons for hav<strong>in</strong>g a positive Will<strong>in</strong>gness to Pay<br />
Those respondents who chose at least one policy option <strong>in</strong> the choice experiment other<br />
than the ‘current policy’ <strong>in</strong>dicated that they had non-zero will<strong>in</strong>gness to pay for<br />
improvements to the upland attributes. The proportion <strong>of</strong> respondents who were will<strong>in</strong>g to<br />
pay for improvements <strong>in</strong> the upland attributes, i.e. those who preferred an alternative<br />
policy at least once <strong>in</strong> the choice experiment, and those who chose the alternative scenario<br />
<strong>in</strong> the CV section, are presented <strong>in</strong> Table 7.2.<br />
Table 7.2: Percentage <strong>of</strong> respondents will<strong>in</strong>g to pay for improvements to upland<br />
attributes<br />
Respondents<br />
will<strong>in</strong>g to pay (%)<br />
Section B<br />
(choice<br />
experiment for<br />
own region)<br />
Section C<br />
(cont<strong>in</strong>gent<br />
valuation for all<br />
other SDAs)<br />
NW NE YH WM EM SW SE<br />
Overall<br />
56 48 60 81 65 75 65 64<br />
54 36 44 62 56 51 n/a 51<br />
Unsurpris<strong>in</strong>gly, more respondents were will<strong>in</strong>g to pay for upland attributes <strong>in</strong> their own<br />
region than <strong>in</strong> other regions. Some <strong>of</strong> the responses to Question B1 are noted <strong>in</strong> Box 7.1:<br />
Box 7.1: reasons for be<strong>in</strong>g will<strong>in</strong>g to pay for upland attribute improvements:<br />
B1. What were the ma<strong>in</strong> reasons you were will<strong>in</strong>g to contribute to the fund<strong>in</strong>g <strong>of</strong> future<br />
policy options?<br />
“I want to have a nice place to go at weekends and have a lovely countryside for holidays”<br />
“To make sure the woodlands and countryside <strong>in</strong> general are well ma<strong>in</strong>ta<strong>in</strong>ed and also help<br />
out the farmers”<br />
“It would be such a loss otherwise – I want to keep it for my children and grandchildren”<br />
“To ma<strong>in</strong>ta<strong>in</strong> Brita<strong>in</strong>’s natural beauty and preserve it as long as we can”<br />
“The improvements susta<strong>in</strong> quality <strong>of</strong> life”<br />
“Any effort to reta<strong>in</strong> some tradition should be applauded”<br />
“So that when my son grows up he has a better quality <strong>of</strong> life and still has a countryside to<br />
visit or live <strong>in</strong>”<br />
“It’s a small amount <strong>of</strong> money per year but ga<strong>in</strong>s <strong>in</strong> good th<strong>in</strong>gs - grassland, woodland”<br />
“If we don’t pay th<strong>in</strong>gs will just decl<strong>in</strong>e”<br />
eftec 41 January 2006
<strong>Economic</strong> <strong>Valuation</strong> <strong>of</strong> <strong>Environmental</strong> <strong>Impacts</strong> <strong>in</strong> the Severely Disadvantaged Areas<br />
Figure 7.1 shows the proportion <strong>of</strong> respondents giv<strong>in</strong>g each <strong>of</strong> the different categories <strong>of</strong><br />
pre-identified reasons for hav<strong>in</strong>g positive WTP. Note that respondents were not presented<br />
with a list <strong>of</strong> pre-coded reasons: therefore their answers could be coded by the <strong>in</strong>terviewer<br />
<strong>in</strong> multiple categories, with the result that these percentages do not sum to 100.<br />
Percentage <strong>of</strong> respondents with positive WTP<br />
45%<br />
40%<br />
35%<br />
30%<br />
25%<br />
20%<br />
15%<br />
10%<br />
5%<br />
0%<br />
ENJ<br />
ALT<br />
BEQ<br />
FIN<br />
OFIN<br />
HER<br />
ENV<br />
OBL<br />
WGLW<br />
eftec 42 January 2006<br />
NCR<br />
Reason given for hav<strong>in</strong>g positive WTP<br />
Figure 7.1: Proportion <strong>of</strong> respondents giv<strong>in</strong>g different reasons for hav<strong>in</strong>g positive WTP.<br />
Percentages are as a percentage <strong>of</strong> those with positive WTP, not as a percentage <strong>of</strong> all respondents.<br />
ENJ = personal/family enjoyment; ALT = others’ enjoyment; BEQ = future generations’ enjoyment;<br />
FIN = personal f<strong>in</strong>ancial ga<strong>in</strong>; OFIN = others’ f<strong>in</strong>ancial ga<strong>in</strong>; HER = heritage / communities; ENV =<br />
environmental concern; OBL = moral obligation; WGLW = warm glow; NCR = not credible (e.g. “I<br />
don’t have to pay, so it doesn’t matter”); DKN = don’t know; NOA = none <strong>of</strong> the above.<br />
7.1.3 Reasons for hav<strong>in</strong>g a zero Will<strong>in</strong>gness to Pay: protest bids and scenario<br />
credibility<br />
In every stated preference survey, a certa<strong>in</strong> number <strong>of</strong> respondents will state zero WTP<br />
because they object to the manner <strong>in</strong> which they are be<strong>in</strong>g asked to pay (‘the payment<br />
vehicle’), or they do not f<strong>in</strong>d the scenario credible enough, rather than because they have<br />
no value for the good itself or can’t afford to contribute more. These respondents must be<br />
identified by ask<strong>in</strong>g all who state zero WTP why they have done so (Questions B4 and C2).<br />
These so-called ‘protest bids’ may then be excluded from the survey econometric analysis.<br />
Table 7.3 <strong>in</strong>dicates the percentage <strong>of</strong> respondents <strong>in</strong> each region who were either deemed<br />
to be protest bidders or <strong>in</strong>dicated genu<strong>in</strong>e zero WTP for the choice experiment <strong>in</strong> Section B<br />
and the cont<strong>in</strong>gent valuation question <strong>in</strong> Section C separately.<br />
DKN<br />
NOA
<strong>Economic</strong> <strong>Valuation</strong> <strong>of</strong> <strong>Environmental</strong> <strong>Impacts</strong> <strong>in</strong> the Severely Disadvantaged Areas<br />
Table 7.3: Percentage <strong>of</strong> respondents <strong>in</strong> each region who <strong>in</strong>dicated zero WTP, the<br />
proportion <strong>in</strong>dicat<strong>in</strong>g a genu<strong>in</strong>e zero WTP, and the proportion seem<strong>in</strong>gly <strong>in</strong>dicat<strong>in</strong>g a<br />
protest bid.<br />
Identified respondents (%)<br />
Over<br />
NW NE YH WM EM SW SE<br />
-all<br />
Section B (choice experiment for own region)<br />
Zero WTP <strong>in</strong>dicated 44 52 40 19 35 25 35 36<br />
Genu<strong>in</strong>e zero WTP <strong>in</strong>dicated 18 9 9 5 12 8 8 10<br />
Protest zero <strong>in</strong>dicated 26 44 31 14 23 17 26 26<br />
Section C (cont<strong>in</strong>gent valuation for all other SDAs)<br />
Zero WTP <strong>in</strong>dicated 46 64 56 38 44 49 n/a 49<br />
Genu<strong>in</strong>e zero WTP <strong>in</strong>dicated 24 22 26 21 18 22 n/a 22<br />
Protest zero <strong>in</strong>dicated 22 43 30 17 25 27 n/a 27<br />
Aga<strong>in</strong>, the number <strong>of</strong> protest bids varies widely across regions, with a very high level <strong>in</strong> the<br />
North East and a relatively low number <strong>in</strong> the West Midlands. The level <strong>of</strong> protest bids are<br />
at the high end or slightly <strong>in</strong> excess <strong>of</strong> the range (6-25%) found <strong>in</strong> the comparable studies<br />
detailed <strong>in</strong> Section 4. The proportion <strong>of</strong> protest bids <strong>in</strong> the North East is particularly high.<br />
This could be because the other studies detailed were valu<strong>in</strong>g much more specific areas,<br />
such as a particular <strong>Environmental</strong>ly Sensitive Area or even a particular estate.<br />
It should be expected that the proportion <strong>of</strong> protest bids for each region should be similar<br />
for both sections <strong>of</strong> the questionnaire. This is mostly the case, with the exception <strong>of</strong> the<br />
South West, where protest bids for Section C were quite a bit higher. It is likely that the<br />
South West respondents felt very separate from the rest <strong>of</strong> the country’s SDAs, so more<br />
thought that it was alright for their taxes to be spent protect<strong>in</strong>g their own SDAs, but not<br />
those <strong>in</strong> the rest <strong>of</strong> the country. Surpris<strong>in</strong>gly, more respondents <strong>in</strong> the North West protested<br />
<strong>in</strong> Section B than <strong>in</strong> Section C. This br<strong>in</strong>gs to m<strong>in</strong>d comments made by focus group<br />
participants <strong>in</strong> the Lake District that they viewed the Lake District as a national asset and<br />
did not see why people <strong>in</strong> their region alone should pay for it.<br />
Table 7.4 contrasts some actual reasons for not be<strong>in</strong>g will<strong>in</strong>g to pay given <strong>in</strong> the survey<br />
which <strong>in</strong>dicate protest bids with reasons which <strong>in</strong>dicate valid responses.<br />
Figure 7.2 shows the proportion <strong>of</strong> respondents giv<strong>in</strong>g each <strong>of</strong> the different categories <strong>of</strong><br />
pre-identified reasons for hav<strong>in</strong>g zero WTP. Note aga<strong>in</strong> that respondents were not<br />
presented with a list <strong>of</strong> pre-coded reasons: therefore their answers could be coded by the<br />
<strong>in</strong>terviewer <strong>in</strong> multiple categories, with the result that these percentages do not sum to<br />
100.<br />
eftec 43 January 2006
<strong>Economic</strong> <strong>Valuation</strong> <strong>of</strong> <strong>Environmental</strong> <strong>Impacts</strong> <strong>in</strong> the Severely Disadvantaged Areas<br />
Table 7.4: Reasons for not be<strong>in</strong>g will<strong>in</strong>g to pay<br />
Reasons <strong>in</strong>dicat<strong>in</strong>g a protest bid Reasons <strong>in</strong>dicat<strong>in</strong>g a ‘valid’ zero<br />
Relevant to either section<br />
“I’m sick <strong>of</strong> taxes go<strong>in</strong>g up”<br />
“I’m will<strong>in</strong>g to pay for the countryside but not<br />
for farmers”<br />
“I feel that the council should do more to help<br />
the environment”<br />
“We don’t get value for our council tax as it is”<br />
“God gave it to us for noth<strong>in</strong>g – why do we have<br />
to pay higher taxes?”<br />
“I don’t trust the government to spend my<br />
money wisely”<br />
Specific to section C<br />
“People <strong>in</strong> Birm<strong>in</strong>gham don’t pay to keep our<br />
beaches clean, so why should we pay for their<br />
hills?”<br />
“The rest <strong>of</strong> the country don’t support our high<br />
water rates”<br />
Percentage <strong>of</strong> respondents with zero WTP<br />
45%<br />
40%<br />
35%<br />
30%<br />
25%<br />
20%<br />
15%<br />
10%<br />
5%<br />
0%<br />
AFFRD<br />
N.IMP<br />
SLDM<br />
NVR<br />
OBJCT<br />
GOVT<br />
FARM<br />
VISTR<br />
“I never go to these areas”<br />
“Seventeen pounds is too much”<br />
“We only go there occasionally”<br />
“I can’t afford it”<br />
“These areas aren’t important to me”<br />
eftec 44 January 2006<br />
CRED<br />
Reason given for not hav<strong>in</strong>g positive WTP<br />
Figure 7.2: Proportion <strong>of</strong> respondents giv<strong>in</strong>g different reasons for hav<strong>in</strong>g zero WTP.<br />
Percentages are as a percentage <strong>of</strong> those with zero WTP, not as a percentage <strong>of</strong> all respondents.<br />
AFFRD = <strong>in</strong>ability to afford; N.IMP =areas aren’t important to respondent; SLDM = seldom visits<br />
areas; NVR = never visits areas; OBJCT = objects to pay<strong>in</strong>g for environmental improvements; GOVT =<br />
the government or council should pay; FARM = farmers should pay; VISITR = visitors should pay; CRED<br />
= doesn’t th<strong>in</strong>k policies will happen; DKN = don’t know; NOA = none <strong>of</strong> the above.<br />
DKN<br />
NOA
<strong>Economic</strong> <strong>Valuation</strong> <strong>of</strong> <strong>Environmental</strong> <strong>Impacts</strong> <strong>in</strong> the Severely Disadvantaged Areas<br />
7.1.4 Attitudes towards the survey itself<br />
Answers to the follow<strong>in</strong>g two questions are presented <strong>in</strong> Table 7.5.<br />
B2: How easy or difficult did you f<strong>in</strong>d it to make your decisions about which policy<br />
option to choose?<br />
D10: What did you th<strong>in</strong>k <strong>of</strong> this questionnaire?<br />
Table 7.5: attitudes towards the survey<br />
B5 response % response<br />
Very easy 32<br />
Fairly easy 37<br />
Neither easy nor difficult 10<br />
Fairly difficult 15<br />
Very difficult 5<br />
D10 response % response<br />
Interest<strong>in</strong>g 53<br />
Too long 16<br />
Difficult to understand 16<br />
Educational 12<br />
Not credible 9<br />
It is encourag<strong>in</strong>g that a majority <strong>of</strong> respondents found the survey <strong>in</strong>terest<strong>in</strong>g, although a<br />
certa<strong>in</strong> proportion did f<strong>in</strong>d it rather too long or difficult to understand. Sixty-n<strong>in</strong>e percent<br />
<strong>of</strong> respondents found the survey very or fairly easy to understand.<br />
7.2 Construct Validity: WTP functions<br />
The purpose <strong>of</strong> construct validity is to gauge whether respondents’ choices are <strong>in</strong>ternally<br />
consistent, and whether the relationships expected based on economic theory appear. The<br />
latter is difficult <strong>in</strong> this study (at least <strong>in</strong> the choice experiment analysis) because the<br />
<strong>in</strong>come non-response rate was high, so <strong>in</strong>come had to be excluded from regression models<br />
<strong>in</strong> most regions. However, a negative coefficient for the tax attribute would also be <strong>in</strong> l<strong>in</strong>e<br />
with economic theory. Respondents should be expected to be more likely to be will<strong>in</strong>g to<br />
pay for environmental goods if they <strong>in</strong>dicate by answers to other questions that they are<br />
concerned about environmental issues or make use <strong>of</strong> the goods <strong>in</strong> question.<br />
7.2.1 Choice experiment<br />
The probability <strong>of</strong> respondents mak<strong>in</strong>g particular choices were <strong>in</strong>itially analysed us<strong>in</strong>g a<br />
conditional logit (CL) model, firstly us<strong>in</strong>g only the levels <strong>of</strong> attributes as explanatory<br />
variables, and then <strong>in</strong>troduc<strong>in</strong>g socio-economic and attitud<strong>in</strong>al variables to the model to<br />
test the effect <strong>of</strong> relevant <strong>in</strong>dividual characteristics on choice. Typically, a nested logit<br />
model would also be tested, i.e., a model which attempts to expla<strong>in</strong> the factors beh<strong>in</strong>d a<br />
respondent hav<strong>in</strong>g either zero or non-zero WTP, and then model respondents’ choices given<br />
that they have non-zero WTP. However, the survey dataset did not conta<strong>in</strong> enough zero<br />
WTP observations that were not protest results to run a nested logit model.<br />
An important implication <strong>of</strong> the model specification used <strong>in</strong> analys<strong>in</strong>g the CE responses is<br />
that selections from the choice set must obey the ‘<strong>in</strong>dependence from irrelevant<br />
alternatives’ (IIA) property. This property states that the relative probabilities <strong>of</strong> two<br />
options be<strong>in</strong>g selected are unaffected by the <strong>in</strong>troduction or removal <strong>of</strong> other alternatives.<br />
If a violation <strong>of</strong> the IIA hypothesis is observed, then more complex statistical models are<br />
necessary that relax some <strong>of</strong> the assumptions used. There are numerous formal statistical<br />
eftec 45 January 2006
<strong>Economic</strong> <strong>Valuation</strong> <strong>of</strong> <strong>Environmental</strong> <strong>Impacts</strong> <strong>in</strong> the Severely Disadvantaged Areas<br />
tests than can be used to test for violations <strong>of</strong> the IIA assumption. In this study we<br />
employed the test developed by Hausman and McFadden (1984), be<strong>in</strong>g the most widely<br />
used.<br />
If the data <strong>of</strong> a specific region did not pass the IIA test a random parameter logit (RPL)<br />
approach was chosen for the analysis. Us<strong>in</strong>g this model specification it is also possible to<br />
circumvent the limitation <strong>of</strong> the conditional logit model that assumes that preferences are<br />
homogenous amongst respondents. The random parameters logit model allows for variation<br />
<strong>in</strong> preferences across <strong>in</strong>dividuals. Application requires assumptions be made about the<br />
distribution <strong>of</strong> preferences. Here it is assumed that preferences relat<strong>in</strong>g to the attributes<br />
are heterogeneous and follow a normal distribution while preferences towards cost are<br />
assumed to be homogenous. Therefore, separate parameters are estimated for each<br />
<strong>in</strong>dividual for all attributes along with a s<strong>in</strong>gle parameter for all respondents for cost. The<br />
result is that each random attribute has a mean value (<strong>in</strong>terpreted as the average<br />
preference <strong>of</strong> respondents for the attribute) and a standard deviation value (<strong>in</strong>terpreted as<br />
the magnitude <strong>of</strong> differences <strong>in</strong> respondents’ preferences for the attribute).<br />
The details <strong>of</strong> each model run are presented <strong>in</strong> the statistical Annex 5. Table 7.6a and 7.6b<br />
presents the coefficients for both the attributes only models and models that <strong>in</strong>clude socioeconomic<br />
variables as well as the attributes. Table 7.6c expla<strong>in</strong>s the variable abbreviations<br />
used. Follow<strong>in</strong>g the tables, the ma<strong>in</strong> po<strong>in</strong>ts <strong>of</strong> <strong>in</strong>terpretation are presented.<br />
Table 7.6a: Attributes only models: random parameter or conditional logit model<br />
coefficients for each region. Coefficients found to be statistically significant at the 5%<br />
level are <strong>in</strong>dicated <strong>in</strong> bold.<br />
NW NE YH WM EM SW SE<br />
model 1<br />
RPL RPL CL RPL RPL RPL RPL<br />
const -1.162 0.681 1.196 1.019<br />
HMB 0.048 0.005 0.030 0.026<br />
RG 0.041 -0.001 0.009 -0.002<br />
BMW 0.043 0.016 0.016 0.011<br />
FB -0.001 0.001 0.001 -0.001<br />
CH1 0.082 -0.044<br />
CH2 0.215 0.171<br />
TAX -0.066 -0.019<br />
Standard deviation values<br />
Did not<br />
pass IIA<br />
test<br />
-0.015<br />
0.248<br />
-0.038<br />
Model did<br />
not<br />
converge<br />
0.158<br />
0.222<br />
-0.029<br />
HMB 0.096 0.068 0.054 0.073<br />
RG 0.099 0.067 0.050 0.065<br />
BMW 0.063 0.103 0.074 0.033<br />
FB 0.009 0.007 0.004 0.008<br />
CH1 0.554 0.473 0.522 0.672<br />
CH2 1.056 0.982<br />
0.601<br />
1.014<br />
1<br />
RPL – random parameter logit model applied; CL – conditional logit model applied.<br />
Model<br />
did not<br />
converge<br />
eftec 46 January 2006
<strong>Economic</strong> <strong>Valuation</strong> <strong>of</strong> <strong>Environmental</strong> <strong>Impacts</strong> <strong>in</strong> the Severely Disadvantaged Areas<br />
Table 7.6b: Attributes and socio-economic variables: random parameter or conditional<br />
logit model coefficients for each region. Coefficients found to be statistically significant<br />
at the 5% level are <strong>in</strong>dicated <strong>in</strong> bold.<br />
NW NE YH WM EM SW SE<br />
model 1<br />
RPL RPL CL RPL RPL RPL RPL<br />
const -0.485 0.248 2.915 3.880 2.225 1.463 2.828<br />
HMB 0.062 0.006 0.011 0.035 0.016 0.030 0.025<br />
RG 0.059 0.004 0.011 0.008 0.001 -0.002 0.016<br />
BMW 0.049 0.005 0.005 0.023 0.015 0.009 0.038<br />
FB 0.000 0.000 0.001 0.001 0.001 -0.001 0.002<br />
CH1 0.082 -0.079 0.109 0.033 0.119 0.187 0.025<br />
CH2 0.391 0.139 0.423 0.214 0.338 0.291 0.493<br />
TAX -0.080 -0.021 -0.035 -0.039 -0.015 -0.029 -0.031<br />
AGE -0.463 0.121 -0.031 0.342 -0.175 0.155 -0.047<br />
GENDER 0.079 0.727 0.231 -0.497 0.261 0.903 -0.122<br />
ENVIMP -0.899 -1.070 -0.599 -0.585 -0.794 -0.255 -0.381<br />
VISFREQ 0.153 0.085 -0.235 -0.222 -0.044 -0.125 -0.250<br />
LIVING -0.022 -0.021 -0.006 -0.012 0.009 0.003 -0.001<br />
REMAIN -0.150 0.064 -0.196 -0.204 -0.446 -0.127 -0.204<br />
MEMBER 0.936 0.019 0.437 0.564 -0.059 -0.006 0.554<br />
EDU 0.482 0.275 0.267 0.126 0.393 0.281 0.286<br />
EMPLOY 1.343 1.046 0.148 -0.230 0.321 -0.059 0.089<br />
RURAL -1.083 2.862 0.673 -1.559 0.325 -0.394 1.481<br />
INCOME 0.166 n/a 2<br />
n/a 0.109 0.095 n/a n/a<br />
Standard deviation values<br />
HMB 0.089 0.072 0.054 0.000001 0.062 0.00002<br />
RG 0.080 0.064 0.050 0.000020 0.049 0.00002<br />
BMW 0.031 0.097 Not 0.078 0.000008 0.031 0.00003<br />
FB 0.010 0.007 relevant 0.003 0.0000002 0.008 0.000004<br />
CH1 0.479 0.183 0.199 0.000056 0.471 0.00030<br />
CH2 0.667 1.034<br />
0.760 0.000121 0.900 0.00027<br />
1 RPL – random parameter logit model applied; CL – conditional logit model applied.<br />
2 The <strong>in</strong>come variable had to be omitted from these models due to the high non-response rate.<br />
Table 7.6c: Explanation <strong>of</strong> variable abbreviations used <strong>in</strong> preced<strong>in</strong>g tables.<br />
const constant term (= 0 if the current policy is chosen, = 1 for alternatives A or B)<br />
HMB percentage change <strong>in</strong> area <strong>of</strong> heather moorland and bog<br />
RG percentage change <strong>in</strong> area <strong>of</strong> rough grassland<br />
BMW percentage change <strong>in</strong> area <strong>of</strong> broadleaf and mixed woodland<br />
FB change <strong>in</strong> the length <strong>of</strong> field boundaries (<strong>in</strong> metres restored)<br />
CH1 small change <strong>in</strong> cultural heritage <strong>in</strong>dicated (1 = yes, 0 = no)<br />
CH2 large change <strong>in</strong> cultural heritage <strong>in</strong>dicated (1 = yes, 0 = no)<br />
TAX tax amount <strong>in</strong>dicated <strong>in</strong> pounds<br />
AGE respondent’s age <strong>in</strong> years<br />
GENDER respondent’s gender (1 = male, 0 = female)<br />
importance <strong>of</strong> environmental policy to respondent (1 = very important, 4 = not<br />
ENVIMP important)<br />
respondent’s frequency <strong>of</strong> visits to severely disadvantaged areas (1 = every day,<br />
VISFREQ 10 = never)<br />
LIVING number <strong>of</strong> years respondents have been liv<strong>in</strong>g <strong>in</strong> the region<br />
respondent’s expected residence <strong>in</strong> the region (1 = less than 6 month, 5 =<br />
REMAIN <strong>in</strong>def<strong>in</strong>ite)<br />
whether respondent belongs to an environmental, recreational, etc.<br />
MEMBER organization (1 = yes, 0 = no)<br />
EDU respondent’s education level 1= primary, 6= higher degree)<br />
EMPLOY whether respondent is an active worker (1 = yes, 0 = no)<br />
RURAL whether respondent is a rural-dweller (1 = yes, 0 = no)<br />
INCOME household <strong>in</strong>come per head<br />
eftec 47 January 2006
<strong>Economic</strong> <strong>Valuation</strong> <strong>of</strong> <strong>Environmental</strong> <strong>Impacts</strong> <strong>in</strong> the Severely Disadvantaged Areas<br />
A significant positive coefficient (at the 5% level, <strong>in</strong>dicated <strong>in</strong> bold <strong>in</strong> Tables 7.6a and 7.6b)<br />
<strong>in</strong>dicates that the likelihood <strong>of</strong> a respondent choos<strong>in</strong>g an alternative policy option is greater<br />
the higher the level <strong>of</strong> the variable. A significant negative coefficient <strong>in</strong>dicates that the<br />
higher the level <strong>of</strong> the variable, the more likely the respondent is to choose the zero-cost<br />
current policy. A coefficient which is not significant <strong>in</strong>dicates that it is not possible to<br />
determ<strong>in</strong>e that the variable affected the respondents’ choices. The significance and sign <strong>of</strong><br />
the constant <strong>in</strong>dicates whether, all th<strong>in</strong>gs be<strong>in</strong>g equal, respondents are will<strong>in</strong>g (positive<br />
coefficient) or not (negative coefficient) to pay hill-farmers for improvements to upland<br />
attributes.<br />
Note that two <strong>of</strong> the variables – ENVIMP (importance <strong>of</strong> environmental policy to respondent)<br />
and VISFREQ (respondent’s frequency <strong>of</strong> visit to SDA) - have questionnaire rank<strong>in</strong>gs <strong>in</strong><br />
reverse order <strong>of</strong> magnitude, therefore extra care must be taken over the <strong>in</strong>terpretation <strong>of</strong><br />
their coefficients. More specifically, a lower variable value implies that someone is more<br />
concerned about environmental policy, or that they visit SDAs more <strong>of</strong>ten. This means that<br />
a negative (rather than a positive) coefficient for VISFREQ, for example, means that<br />
respondents are more likely to be will<strong>in</strong>g to pay for alternative policy options if they visit<br />
SDAs more <strong>of</strong>ten.<br />
Some general f<strong>in</strong>d<strong>in</strong>gs emerge from the analysis <strong>of</strong> the model results. While the same<br />
questionnaire and specification <strong>of</strong> attributes are used <strong>in</strong> all regions, the factors that<br />
<strong>in</strong>fluence the choices regional respondents made are different. Heather moorland and bog,<br />
mixed and broadleaved woodland and a large change <strong>in</strong> cultural heritage attributes are<br />
shown to be significant factors <strong>in</strong> respondents’ choices <strong>in</strong> most regions. On the other hand,<br />
rough grassland, field boundaries and a small change <strong>in</strong> cultural heritage attributes are<br />
generally not significant factors <strong>in</strong> the choices. The only evidence that respondents might<br />
prefer what is already abundant <strong>in</strong> their region is that respondents <strong>in</strong> Yorkshire and the<br />
Humber were the only SDA GOR respondents to have their choices significantly affected by<br />
field boundaries. However, this GOR also has the greatest abundance <strong>of</strong> heather moorland<br />
and bog, and respondents were not shown to be particularly responsive to that attribute.<br />
In terms <strong>of</strong> socio-economic variables, the level <strong>of</strong> education seems to be the variable that<br />
has a significant <strong>in</strong>fluence over respondents’ choices most commonly across the regions.<br />
Where <strong>in</strong>come could be <strong>in</strong>cluded <strong>in</strong> models, it does not appear to have been a significant<br />
factor, a potential result <strong>of</strong> the high non-response rate to the <strong>in</strong>come question result<strong>in</strong>g <strong>in</strong><br />
fewer observations for that variable. However, among other factors such as awareness,<br />
education could also embody at least part <strong>of</strong> the impact <strong>in</strong>come would have, given that<br />
education level is generally associated with <strong>in</strong>come level.<br />
The full list <strong>of</strong> factors that <strong>in</strong>fluence the choices <strong>in</strong> the models us<strong>in</strong>g both attributes and<br />
other (socio-economic) variables is discussed below with respect to each region. The only<br />
universally significant f<strong>in</strong>d<strong>in</strong>g was that the cost <strong>of</strong> a policy option was a significant factor <strong>in</strong><br />
mak<strong>in</strong>g respondents less likely to choose an alternative policy the higher its cost, all else<br />
be<strong>in</strong>g equal.<br />
North West<br />
Respondents were more likely to choose an alternative policy if it expressed an <strong>in</strong>crease <strong>in</strong><br />
heather moorland and bog, rough grassland, broadleaf and mixed woodland, or a large<br />
improvement <strong>in</strong> cultural heritage, but their choices were unaffected by field boundaries.<br />
Be<strong>in</strong>g younger, more educated, <strong>in</strong> employment or an urban dweller made respondents more<br />
likely to be will<strong>in</strong>g to pay. Respondents who had lived <strong>in</strong> the area a shorter time were also<br />
more will<strong>in</strong>g to pay, as were respondents who considered environmental policy to be<br />
relatively important or who belonged to an environmental or recreation organisation.<br />
Respondents who visited SDAs more <strong>of</strong>ten were less will<strong>in</strong>g to pay. The North West is the<br />
GOR which has the greatest proportion <strong>of</strong> SDAs relative to total area; it is also the GOR with<br />
the highest proportion <strong>of</strong> respondents visit<strong>in</strong>g SDAs for work reasons and the lowest<br />
proportion who visit only for recreation; and has nearly twice the average proportion <strong>of</strong><br />
respondents who has been there only 0-2 years. These results pa<strong>in</strong>t a picture <strong>of</strong> the North<br />
West as an area where relative newcomers (or seasonal workers), perhaps attracted by<br />
eftec 48 January 2006
<strong>Economic</strong> <strong>Valuation</strong> <strong>of</strong> <strong>Environmental</strong> <strong>Impacts</strong> <strong>in</strong> the Severely Disadvantaged Areas<br />
access to the Lakes, attribute more value to improvements <strong>in</strong> upland attributes than more<br />
established residents, more rural residents, and residents visit<strong>in</strong>g SDAs regularly for work<br />
purposes. The North West region also had a far greater than average proportion <strong>of</strong><br />
respondents who felt that the environment was not all that important to them, or not<br />
important at all.<br />
North East<br />
In the North East survey, none <strong>of</strong> the upland attributes were shown to be significant<br />
determ<strong>in</strong>ants <strong>of</strong> respondents’ choices. This may be because <strong>of</strong> the very high number <strong>of</strong><br />
protest bids <strong>in</strong> the North East, or it may be due to respondents hav<strong>in</strong>g “opposite”<br />
preferences <strong>of</strong>fsett<strong>in</strong>g each other, as expla<strong>in</strong>ed <strong>in</strong> Section A5.2.6 <strong>in</strong> Annex 5. However, cost<br />
was shown to negatively <strong>in</strong>fluence will<strong>in</strong>gness to pay. Be<strong>in</strong>g male, more educated, <strong>in</strong> paid<br />
employment or a rural dweller <strong>in</strong>creased the probability that respondents would be will<strong>in</strong>g<br />
to pay for improvements. Consider<strong>in</strong>g environmental policy to be relatively important and<br />
hav<strong>in</strong>g lived <strong>in</strong> the region for a shorter time period also made respondents more will<strong>in</strong>g to<br />
choose alternative policy options. The North East had higher than average numbers <strong>of</strong> very<br />
long term residents <strong>in</strong> the sample population – as these have been identified as a group<br />
more <strong>in</strong>different to improvements, this could also expla<strong>in</strong> the seem<strong>in</strong>g <strong>in</strong>difference <strong>of</strong> the<br />
regional results towards the upland attributes. The North East is also the least well <strong>of</strong>f <strong>of</strong><br />
all the GORs accord<strong>in</strong>g to <strong>of</strong>ficial statistics.<br />
Yorkshire and the Humber<br />
A significant positive constant term for this region shows more emphatic evidence that<br />
respondents were will<strong>in</strong>g to pay for landscape improvements. Increases <strong>in</strong> rough grassland,<br />
field boundaries and cultural heritage made respondents more likely to pick an alternative<br />
option over the current policy. It was also the only SDA GOR to be more likely to choose<br />
options which showed improvements <strong>in</strong> field boundaries. More educated respondents and<br />
those liv<strong>in</strong>g <strong>in</strong> rural areas were more likely to be will<strong>in</strong>g to pay, as were respondents who<br />
rated environmental policy as important, those who visited SDAs more frequently and those<br />
who expected to rema<strong>in</strong> <strong>in</strong> the area a shorter time. Accord<strong>in</strong>g to census data, the region<br />
has the highest proportion <strong>of</strong> the population actually resident <strong>in</strong> SDAs – twice as many as<br />
the next highest (the North West). There was also the highest proportion <strong>of</strong> survey<br />
respondents <strong>in</strong> this region who visited SDAs solely for recreation. However, overall WTP<br />
results for Yorkshire and the Humber were small, possibly due to the low average <strong>in</strong>come <strong>of</strong><br />
the region.<br />
West Midlands<br />
The high positive constant term shows that West Midlands respondents were the most likely<br />
<strong>of</strong> all to favour pay<strong>in</strong>g for alternative policy options over the current policy. Increases <strong>in</strong><br />
heather moorland and bog, broadleaf and mixed woodland and large improvements <strong>in</strong><br />
cultural heritage, were shown to <strong>in</strong>crease respondents’ likelihood <strong>of</strong> select<strong>in</strong>g an<br />
alternative scenario. Be<strong>in</strong>g older, female and urban-dwell<strong>in</strong>g also made respondents more<br />
likely to choose alternative policy options. Consider<strong>in</strong>g environmental improvements to be<br />
relatively important, visit<strong>in</strong>g SDAs more <strong>of</strong>ten, be<strong>in</strong>g a member <strong>of</strong> an environmental or<br />
recreational society, or expect<strong>in</strong>g to live <strong>in</strong> the area for a shorter time also made<br />
respondents more likely to be will<strong>in</strong>g to pay.<br />
The West Midlands sample had by far the highest proportion with positive WTP for both the<br />
choice experiment and cont<strong>in</strong>gent valuation questions. From the market researchers’<br />
comments, the West Midlands sample appears to have been exceptionally environmentallyconcerned<br />
and well-<strong>in</strong>formed, with many respondents refus<strong>in</strong>g to rank the environmental<br />
problems by importance <strong>in</strong> question A2 because they said that they were “all important”.<br />
Despite the small size <strong>of</strong> SDAs <strong>in</strong> the West Midlands, and their distance from urban centres,<br />
the sample had the second smallest proportion <strong>of</strong> people who said they never visited their<br />
region’s SDAs (after the North West). The sample had the highest comb<strong>in</strong>ed proportion <strong>of</strong><br />
people say<strong>in</strong>g that environmental policy was “very” or “quite” important, the highest<br />
environmental or recreational group membership, and the highest proportions <strong>of</strong> people<br />
eftec 49 January 2006
<strong>Economic</strong> <strong>Valuation</strong> <strong>of</strong> <strong>Environmental</strong> <strong>Impacts</strong> <strong>in</strong> the Severely Disadvantaged Areas<br />
with first or higher degrees or equivalent pr<strong>of</strong>essional qualifications. It was also one <strong>of</strong> the<br />
regional samples with the most transient residence and had the highest proportion <strong>of</strong><br />
people who were def<strong>in</strong>itely not life-long residents 10 . The picture ga<strong>in</strong>ed <strong>of</strong> the West<br />
Midlands sample is <strong>of</strong> a geographically mobile and educated population attracted to the<br />
region by its economic opportunities, but also highly appreciative <strong>of</strong> and concerned for the<br />
factors contribut<strong>in</strong>g to its quality <strong>of</strong> life.<br />
East Midlands<br />
Overall, respondents <strong>in</strong> the East Midlands were <strong>in</strong> favour <strong>of</strong> payments for alternative<br />
policies. Increases <strong>in</strong> broadleaf and mixed woodland were more likely to make respondents<br />
will<strong>in</strong>g to pay, as were large improvements <strong>in</strong> cultural heritage. More educated<br />
respondents, those who considered environmental policy to be relatively important, and<br />
those who expected to rema<strong>in</strong> <strong>in</strong> the area for a shorter time were also more likely to<br />
choose alternative policy options. The region sample was overall one <strong>of</strong> the least educated<br />
and least geographically mobile.<br />
South West<br />
Respondents <strong>in</strong> the South West were not emphatically likely to choose alternative policy<br />
options (as denoted by the statistically <strong>in</strong>significant constant term). Out <strong>of</strong> the upland<br />
attributes, only <strong>in</strong>creases <strong>in</strong> heather moorland and bog and <strong>in</strong> cultural heritage (if a large<br />
improvement) made them more likely to opt to pay for alternative policies. Male or more<br />
educated respondents were also more likely to be will<strong>in</strong>g to pay, as were respondents who<br />
visited SDAs more frequently. Respondents <strong>in</strong> the South West were much more likely to cite<br />
heritage reasons and concern for farmers’ livelihoods for be<strong>in</strong>g will<strong>in</strong>g to pay for<br />
improvements. The South West also had the greatest proportion <strong>of</strong> people who belonged to<br />
farm<strong>in</strong>g organizations.<br />
South East<br />
The <strong>in</strong>terpretation <strong>of</strong> the South East results should be seen <strong>in</strong> the light <strong>of</strong> South East be<strong>in</strong>g<br />
the only GOR without its own SDAs <strong>in</strong>cluded <strong>in</strong> the survey. The South East was the only<br />
region where all upland attributes were significant, i.e. improvements <strong>in</strong> all made<br />
respondents more likely to choose alternative policies over the current policy (although<br />
cultural heritage only did so if a large improvement was noted). Be<strong>in</strong>g more educated, a<br />
rural dweller or a member <strong>of</strong> an environmental or recreational group made respondents<br />
more likely to be will<strong>in</strong>g to pay. Consider<strong>in</strong>g environmental policy to be relatively<br />
important, visit<strong>in</strong>g SDAs more frequently and expect<strong>in</strong>g to live <strong>in</strong> the region for a shorter<br />
amount <strong>of</strong> time also made respondents more will<strong>in</strong>g to pay. Unsurpris<strong>in</strong>gly, compared to<br />
other GORs <strong>in</strong>cluded <strong>in</strong> the survey, respondents <strong>in</strong> the South East were most likely to say<br />
that they never visit SDAs. However they were the most likely <strong>of</strong> all respondents to cite<br />
altruistic, bequest, environmental concerns and moral obligation reasons for be<strong>in</strong>g will<strong>in</strong>g<br />
to pay. This ties <strong>in</strong> with the f<strong>in</strong>d<strong>in</strong>g that they were <strong>in</strong>deed will<strong>in</strong>g to pay for landscapes<br />
which they did <strong>of</strong>ten directly experience, and shows that they had considerable non-use<br />
value for the SDAs <strong>in</strong> other parts <strong>of</strong> the country.<br />
7.2.2 Cont<strong>in</strong>gent valuation<br />
The ma<strong>in</strong> goal <strong>of</strong> cont<strong>in</strong>gent valuation survey was to test if regional populations had<br />
preferences for SDAs <strong>in</strong> other regions. Respondents were asked for their WTP for a ‘best<br />
case’ policy over the current policy, as detailed <strong>in</strong> Table 3.5 as it would not have been<br />
possible to undertake a choice experiment for other regions consider<strong>in</strong>g the cognitive<br />
burden that do<strong>in</strong>g two choice experiments would impose on the respondents.<br />
10 This is difficult to ascerta<strong>in</strong> with certa<strong>in</strong>ty as we did not ask for respondents’ exact ages. However<br />
those who are def<strong>in</strong>itely not life-long residents <strong>of</strong> the region can be marked out by compar<strong>in</strong>g their<br />
age bracket with their stated number <strong>of</strong> years’ residence.<br />
eftec 50 January 2006
<strong>Economic</strong> <strong>Valuation</strong> <strong>of</strong> <strong>Environmental</strong> <strong>Impacts</strong> <strong>in</strong> the Severely Disadvantaged Areas<br />
Given the similarity <strong>of</strong> the valuation exercise <strong>in</strong> all regions, data from all regions with SDAs<br />
were analysed together. Respondents that stated a protest answer or said that they did not<br />
know if they were will<strong>in</strong>g to pay the proposed bid were excluded from the analysis. All<br />
variables <strong>in</strong>itially used to model the CE results were <strong>in</strong>itially applied, and those which were<br />
not significant at the 10% level were then dropped from the model. The results <strong>of</strong> the f<strong>in</strong>al<br />
logit model are presented <strong>in</strong> Table 7.7. The logit model expla<strong>in</strong>s the probability <strong>of</strong> a<br />
respondent answer<strong>in</strong>g ‘yes’ to a WTP bid they are asked to pay for the alternative policy<br />
option.<br />
Table 7.7: Logit model responses for WTP for the CV alternative scenario over the<br />
current policy. Coefficients found to be statistically significant at the 5% level are<br />
<strong>in</strong>dicated <strong>in</strong> bold.<br />
Independent Coefficients Standard error Significance<br />
Variables<br />
constant 4.619 .805 .000<br />
SW -0.537 .375 .152<br />
YH -1.075 .350 .002<br />
NE -1.360 .355 .000<br />
NW -0.914 .373 .014<br />
EM -0.626 .355 .078<br />
ENVIMP -0.658 .138 .000<br />
BID -0.015 .004 .000<br />
VISFREQ -0.169 .038 .000<br />
REMAIN -0.348 .112 .002<br />
MEMBER 0.254 .082 .002<br />
INCOME 0.356 .091 .000<br />
-2Log-Likelihood 739.863<br />
Significance level 0.000<br />
% <strong>of</strong> correct 80%<br />
predictions<br />
No. observations 820 (418 miss<strong>in</strong>g cases)<br />
constant constant term<br />
SW = 1 if respondent is resident <strong>in</strong> the South West, = 0 otherwise<br />
YH = 1 if respondent is resident <strong>in</strong> Yorkshire and the Humber, = 0<br />
otherwise<br />
NE = 1 if respondent is resident <strong>in</strong> the North East, = 0 otherwise<br />
NW = 1 if respondent is resident <strong>in</strong> the North West, = 0 otherwise<br />
EM = 1 if respondent is resident <strong>in</strong> the East Midlands, = 0 otherwise<br />
ENVIMP respondent’s frequency <strong>of</strong> visits to severely disadvantaged areas<br />
(1 = every day, 10 = never)<br />
BID bid amount <strong>in</strong>dicated (£)<br />
VISFREQ respondent’s frequency <strong>of</strong> visits to severely disadvantaged areas<br />
(1 = every day, 10 = never)<br />
REMAIN respondent’s expected residence <strong>in</strong> the region (1 = less than 6<br />
month, 5 = <strong>in</strong>def<strong>in</strong>ite)<br />
MEMBER whether respondent belongs to an environmental, recreational,<br />
etc. organization (1 = yes, 0 = no)<br />
INCOME household <strong>in</strong>come per head<br />
The proportion <strong>of</strong> protest bids for the CV question is reported <strong>in</strong> Table 7.3 above. The<br />
results show that people liv<strong>in</strong>g <strong>in</strong> the West Midlands region (used as a reference for the<br />
region variable) were more will<strong>in</strong>g to contribute to the change <strong>in</strong> policy than those <strong>in</strong> any<br />
other region. This is <strong>in</strong> accordance with the high positive constant for CE regression model<br />
for the West Midlands. Hav<strong>in</strong>g a larger household, a higher <strong>in</strong>come, be<strong>in</strong>g a longer term<br />
resident, visit<strong>in</strong>g SDAs more frequently, and consider<strong>in</strong>g environment policy to be relatively<br />
important were all significant determ<strong>in</strong>ants <strong>of</strong> probability <strong>of</strong> be<strong>in</strong>g will<strong>in</strong>g to pay<br />
(remember aga<strong>in</strong> that the ENVIMP and VISFREQ variables have counter<strong>in</strong>tuitive rank<strong>in</strong>gs).<br />
eftec 51 January 2006
<strong>Economic</strong> <strong>Valuation</strong> <strong>of</strong> <strong>Environmental</strong> <strong>Impacts</strong> <strong>in</strong> the Severely Disadvantaged Areas<br />
Expected future long term residence and be<strong>in</strong>g presented with a higher cost for the<br />
alternative policy reduced the likelihood <strong>of</strong> be<strong>in</strong>g will<strong>in</strong>g to pay for it.<br />
7.3 Convergent Validity: Comparison with Previous Studies<br />
The mean WTP figures found by the study for a 1% change <strong>in</strong> each attribute (except cultural<br />
heritage, which can only be considered <strong>in</strong> discrete changes) and the compensat<strong>in</strong>g surplus<br />
estimates are presented <strong>in</strong> Section 8 (<strong>in</strong> Tables 8.1 and 8.4 respectively). However, this<br />
section compares the WTP results with those found by the ELF model, and the<br />
compensat<strong>in</strong>g surplus estimates with values for landscapes found <strong>in</strong> other studies.<br />
Comparison with previous studies <strong>in</strong> the case <strong>of</strong> landscape attributes is difficult. As<br />
described <strong>in</strong> Section 4, studies rarely cover identical goods or comparable geographical<br />
scopes. In the case <strong>of</strong> cont<strong>in</strong>gent valuation, different studies will frequently cover a change<br />
which is unique to the particular context and difficult to apply elsewhere. However both <strong>of</strong><br />
the comparisons given below can give an <strong>in</strong>dication that at the very least, the order <strong>of</strong><br />
magnitude <strong>of</strong> values found is consistent.<br />
7.3.1 Comparison with ELF<br />
Comparison with the regional WTP values provided by the ELF model outl<strong>in</strong>ed <strong>in</strong> Section<br />
4.2.1 is not straightforward. The habitats valued <strong>in</strong> the ELF are def<strong>in</strong>ed differently from<br />
those <strong>in</strong> this study: heather moorland or heathland, rather than heather moorland and bog;<br />
woodland rather than broadleaved and mixed woodland; and hedgerows rather than field<br />
boundaries. The ELF model values attributes wherever they occur <strong>in</strong> a region – not solely <strong>in</strong><br />
SDAs. It should also be remembered that for the South East region, the ELF model values<br />
attributes with<strong>in</strong> that region, while <strong>in</strong> this study values found <strong>in</strong> the South East are for all<br />
other regions <strong>of</strong> England.<br />
In addition, this study values a change <strong>in</strong> attributes, whereas the WTP values <strong>in</strong>cluded <strong>in</strong><br />
the ELF model are taken to value the entirety <strong>of</strong> the attribute with<strong>in</strong> any given region<br />
(pers. comm., Oglethorpe, 2005). For this reason, <strong>in</strong> the comparison given <strong>in</strong> Table 7.8, the<br />
per household WTP figures given <strong>in</strong> the ELF model for each attribute are divided by 200 to<br />
make them comparable to WTP for a 1% change found <strong>in</strong> this study. The reason why this is<br />
the appropriate factor to use is expla<strong>in</strong>ed <strong>in</strong> Annex A5.4; briefly, it relates to the fact that<br />
marg<strong>in</strong>al WTP is higher at greater scarcity, therefore WTP for the totality <strong>of</strong> the attribute is<br />
greater than one hundred times the WTP to prevent a 1% change.<br />
The grey cells <strong>in</strong>dicate where the 95% confidence <strong>in</strong>tervals for WTP found by this study<br />
overlap the mean WTP range given by the ELF model (note that this is an estimated mean<br />
range, not a 95% confidence <strong>in</strong>terval range, which is not provided).<br />
It is encourag<strong>in</strong>g that over half <strong>of</strong> the estimates from this study appear to show confidence<br />
<strong>in</strong>tervals which overlap with the mean range given by the ELF model. The values for field<br />
boundaries show the most similarity, with only the values <strong>in</strong> the South West markedly<br />
differ<strong>in</strong>g. The rough grassland and broadleaved and mixed woodland values are for the most<br />
part similar, with the ELF figures appear<strong>in</strong>g at the low-to-mid end <strong>of</strong> the SDA study<br />
confidence <strong>in</strong>tervals for all areas except the North West and South East. However, as the<br />
ELF model values attributes with<strong>in</strong> the South East, and this study values South Eastern<br />
respondents’ values for attributes outside the South East, it is not surpris<strong>in</strong>g that the South<br />
East value are fairly different. The heather moorland and bog values appears to fit less<br />
well, with the SDA study generally estimat<strong>in</strong>g significantly higher values than the ELF<br />
model.<br />
Overall, though, the results <strong>of</strong> this study are not too dissimilar from the results <strong>of</strong> the ELF<br />
model, which is encourag<strong>in</strong>g.<br />
eftec 52 January 2006
<strong>Economic</strong> <strong>Valuation</strong> <strong>of</strong> <strong>Environmental</strong> <strong>Impacts</strong> <strong>in</strong> the Severely Disadvantaged Areas<br />
Table 7.8: Comparison <strong>of</strong> the 95% confidence <strong>in</strong>tervals for per household WTP found<br />
by this study with the range for mean WTP found by the ELF model (divided by 200 for<br />
comparison purposes).<br />
NW Y&H WM EM SW SE<br />
Heather moorland and bog<br />
SDA 0.45 - 1.11 -0.06 - 0.65 0.42 - 1.18 -0.03 - 2.31 0.37 - 1.54 0.36 - 1.25<br />
ELF 0.02 - 0.05 0.02 - 0.04 0.02 - 0.05 0.02 - 0.05 0.02 - 0.05 0.02 - 0.05<br />
Rough grassland<br />
SDA 0.45 - 1.05 0.01 - 0.60 -0.05 - 0.53 -0.99 - 0.91 -0.56 - 0.39 0.14 - 0.86<br />
ELF 0.04 - 0.10 0.04 - 0.10 0.04 - 0.10 0.04 - 0.10 0.04 - 0.10 0.04 - 0.10<br />
Broadleaf and mixed woodland<br />
SDA 0.30 - 0.91 -0.16 - 0.48 0.07 - 0.81 0.03 - 2.46 -0.01 - 0.78 0.81 - 1.66<br />
ELF 0.06 - 0.08 0.05 - 0.08 0.06 - 0.08 0.06 - 0.08 0.06 - 0.08 0.05 - 0.08<br />
Field boundaries<br />
SDA -0.03 - 0.04 0.01 - 0.08 -0.02 - 0.05 -0.06 - 0.18 -0.11 - 0.02 0.02 - 0.11<br />
ELF 0.03 - 0.04 0.03 - 0.04 0.03 - 0.04 0.03 - 0.04 0.03 - 0.04 0.03 - 0.04<br />
Key: SDA = 95% confidence <strong>in</strong>tervals for WTP for a 1% change <strong>in</strong> the attribute found by this study.<br />
ELF = estimated mean range given <strong>in</strong> the ELF model for WTP for the whole attribute,<br />
divided by 200. Note that this is not a 95% confidence <strong>in</strong>terval.<br />
7.3.2 Comparison with other studies<br />
The compensat<strong>in</strong>g surplus (CS) figures presented <strong>in</strong> Section 8.4 for Scenarios 1 and 2 range<br />
from £7-48; those for Scenario 3 are mostly negative. The £7-48 range can be compared<br />
with the WTP ranges found <strong>in</strong> the other studies summarised <strong>in</strong> Section 4.3 – these are shown<br />
<strong>in</strong> Table 7.9.<br />
Table 7.9: Summary <strong>of</strong> per household WTP figures found by the landscape valuation<br />
studies exam<strong>in</strong>ed <strong>in</strong> Section 4.3.<br />
Study /<br />
Geographical Change valued WTP per<br />
Location scope<br />
household<br />
per annum 1<br />
Willis &<br />
Yorkshire Dales A range <strong>of</strong> alternative landscape £18-35<br />
Garrod (1993), National Park changes, rang<strong>in</strong>g from<br />
Yorkshire Dales (177,000 ha) <strong>in</strong>tensive/agricultural to<br />
wild/abandoned.<br />
Hanley et al. An ESA<br />
(1998), Breadalbane<br />
2<br />
Change to the landscape from £22-27<br />
cover<strong>in</strong>g remov<strong>in</strong>g ESA subsidies.<br />
179,000 ha<br />
Bullock & Kay An ESA<br />
Landscapes brought about by<br />
£41-82<br />
(1997), Scottish cover<strong>in</strong>g extensive or very extensive graz<strong>in</strong>g<br />
Central Southern<br />
Uplands<br />
273,000 ha<br />
White & Lovett The Levisham Landscapes and habitat types brought Mean WTP<br />
(1999), North Estate (1,359 about by reduced sheep graz<strong>in</strong>g £3.10<br />
York Moors ha)<br />
This study SDAs <strong>in</strong> a given Landscape changes brought about by £7-48<br />
GOR<br />
hypothecated policy Scenarios 1-3<br />
net <strong>of</strong> the basel<strong>in</strong>e<br />
1<br />
Ranges are for different scenarios or sub-samples<br />
2<br />
<strong>Environmental</strong>ly Sensitive Area<br />
The only study with figures considerably lower than the CS figures found <strong>in</strong> this study is<br />
White and Lovett (1999); this is unsurpris<strong>in</strong>g as it valued only one small estate, whereas the<br />
other studies valued large upland areas comparable to the regional SDA areas valued <strong>in</strong> this<br />
study. The CS figures are broadly comparable to the figures found <strong>in</strong> Willis and Garrod<br />
(1993) and Hanley et al. (1998); they are on the low side compared to Bullock and Kay<br />
(1997).<br />
eftec 53 January 2006
<strong>Economic</strong> <strong>Valuation</strong> <strong>of</strong> <strong>Environmental</strong> <strong>Impacts</strong> <strong>in</strong> the Severely Disadvantaged Areas<br />
7.4 <strong>Valuation</strong> Workshop F<strong>in</strong>d<strong>in</strong>gs<br />
A brief explanation <strong>of</strong> the workshops was provided <strong>in</strong> Section 3.3.4 and a full discussion <strong>of</strong><br />
the valuation workshop f<strong>in</strong>d<strong>in</strong>gs is presented <strong>in</strong> the <strong>Valuation</strong> Workshop Report <strong>in</strong> Annex 7.<br />
In summary, the ma<strong>in</strong> f<strong>in</strong>d<strong>in</strong>gs <strong>of</strong> the workshops were:<br />
• Respondents considered all the attributes <strong>in</strong> the policy options presented. They<br />
ma<strong>in</strong>ta<strong>in</strong>ed various strategies <strong>of</strong> ‘simple summ<strong>in</strong>g’ (all <strong>in</strong>creases considered with equal<br />
weight), ‘weighted summ<strong>in</strong>g’ (the level <strong>of</strong> the attribute is valued <strong>in</strong>crementally),<br />
‘personal weight<strong>in</strong>g <strong>of</strong> attributes’ (a selected attribute has greater weight than others)<br />
and f<strong>in</strong>ally a logical deduction. The more complex strategies tended to be applied to the<br />
more difficult choices.<br />
• The geographical regional limit <strong>of</strong> the survey was ma<strong>in</strong>ta<strong>in</strong>ed <strong>in</strong> choice decisions, <strong>in</strong> that<br />
respondents were consider<strong>in</strong>g only the SDAs <strong>in</strong> their own GOR when asked to.<br />
• There was no evidence <strong>of</strong> bias due to scope. The wider context <strong>of</strong> the national and<br />
global environment was discussed but was considered to be beyond the scale <strong>of</strong> the<br />
survey, and respondents did not change their choices as a result <strong>of</strong> the discussion.<br />
• A broader ‘choice set’ than that presented <strong>in</strong> the study was discussed, for example, the<br />
possibility <strong>of</strong> end<strong>in</strong>g all agricultural subsidies. Respondents considered such matters to<br />
be beyond the scale <strong>of</strong> this study and did not change their choices as a result <strong>of</strong> the<br />
discussion.<br />
• Of the attributes that were not <strong>in</strong> the CE questionnaire, only hay meadows might have<br />
had any impact on WTP. The scale <strong>of</strong> this potential impact is not known but discussion<br />
<strong>of</strong> hay meadows affected four (out <strong>of</strong> 19) participants. All other attributes not orig<strong>in</strong>ally<br />
<strong>in</strong>cluded <strong>in</strong> the CE had little or no effect as they were viewed largely as components <strong>of</strong><br />
the attributes already <strong>in</strong>cluded <strong>in</strong> the survey.<br />
• Discussion, <strong>in</strong>formation and a period <strong>of</strong> reflection did not cause respondents to change<br />
their orig<strong>in</strong>al choices.<br />
• Respondents considered the tax <strong>in</strong> policy choices appropriately. Some chose to set<br />
themselves a cost threshold beyond which they would not accept policy options and<br />
<strong>in</strong>creases beyond their threshold WTP were rejected<br />
There is therefore a good deal <strong>of</strong> evidence <strong>in</strong> the behaviour <strong>of</strong> the participants which<br />
<strong>in</strong>dicates the theoretical validity <strong>of</strong> this study, and the technical <strong>in</strong>formation presented was<br />
apparently sufficient to support the choice mak<strong>in</strong>g <strong>of</strong> <strong>in</strong>dividuals.<br />
7.5 Validity Test<strong>in</strong>g - Summary<br />
7.5.1 Content validity<br />
• Income non-response: the <strong>in</strong>come non-response rate was relatively high, particularly <strong>in</strong><br />
Yorkshire and Humber and the East Midlands. This precluded the use <strong>of</strong> <strong>in</strong>come as an<br />
explanatory factor <strong>in</strong> the regression models <strong>of</strong> four regions.<br />
• Protest bids: the number <strong>of</strong> protest bids was also relatively high, and <strong>in</strong> the case <strong>of</strong> the<br />
North East, may have been the ma<strong>in</strong> reason for the model to return <strong>in</strong>significant<br />
coefficients for all upland attributes. Protest bids were at similar levels for both<br />
sections <strong>of</strong> the questionnaire, while genu<strong>in</strong>e zero WTPs were noticeably higher for<br />
Section C (CV) than Section B (CE). This should be expected, as respondents are more<br />
likely to value SDAs <strong>in</strong> their own region than elsewhere <strong>in</strong> the country.<br />
• Attitudes: 69% <strong>of</strong> the survey respondents found the survey easy to understand and only<br />
20% found it difficult to understand.<br />
eftec 54 January 2006
<strong>Economic</strong> <strong>Valuation</strong> <strong>of</strong> <strong>Environmental</strong> <strong>Impacts</strong> <strong>in</strong> the Severely Disadvantaged Areas<br />
7.5.2 Construct validity<br />
• The most important f<strong>in</strong>d<strong>in</strong>g <strong>of</strong> the construct validity analysis is that for both regression<br />
model versions for each region, the coefficient on tax is both negative and significant at<br />
the 5% level. This <strong>in</strong>dicates that respondents were not mak<strong>in</strong>g random or arbitrary<br />
choices, but considered the cost <strong>of</strong> options before mak<strong>in</strong>g their choices.<br />
• Income was not found to be a significant determ<strong>in</strong>ant <strong>of</strong> WTP <strong>in</strong> the choice experiment<br />
for the three regions where it could be <strong>in</strong>cluded <strong>in</strong> the regression models. This could be<br />
largely due to the high non-response rate, particularly as <strong>in</strong>come was shown to be a<br />
significant determ<strong>in</strong>ant <strong>of</strong> WTP <strong>in</strong> the cont<strong>in</strong>gent valuation question, where all regions<br />
were pooled together for the analysis.<br />
• In all regions except the North East, at least two upland attributes positively affect<br />
respondents’ choices.<br />
• In general, other characteristics affect respondents’ choices as one would expect:<br />
people who consider environmental policy to be important, people who are members <strong>of</strong><br />
environmental or recreational clubs, more educated people, and people who visit SDAs<br />
more <strong>of</strong>ten (except <strong>in</strong> the North West, where many people visit them for work) are all<br />
more likely to be will<strong>in</strong>g to pay for upland landscape improvements.<br />
• Age, gender and rural/urban location do not appear to consistently affect choices.<br />
7.5.3 Convergent validity<br />
• Comparison with the mean estimate range supplied by the ELF model (suitably adjusted<br />
for appropriate comparison) shows that this study’s regional WTP estimates are broadly<br />
similar for rough grassland, broadleaf and mixed woodland and field boundaries, but<br />
dissimilar for heather moorland and bog.<br />
• Other studies valu<strong>in</strong>g landscapes which cover roughly comparable areas to those valued<br />
by respondents <strong>in</strong> this study show similar (or <strong>in</strong> one case higher) WTP for improvements<br />
<strong>in</strong> landscape attributes.<br />
eftec 55 January 2006
<strong>Economic</strong> <strong>Valuation</strong> <strong>of</strong> <strong>Environmental</strong> <strong>Impacts</strong> <strong>in</strong> the Severely Disadvantaged Areas<br />
8. Will<strong>in</strong>gness to Pay Results, Aggregation, Policy<br />
Implications and Conclusions<br />
Average will<strong>in</strong>gness to pay results are presented <strong>in</strong> Section 8.1. The aggregation process is<br />
described <strong>in</strong> Section 8.2. Policy implications and conclusions are presented <strong>in</strong> Section 8.3.<br />
8.1 WTP Results<br />
This section reports the WTP estimates from the choice experiment (Section 8.1.1) and<br />
cont<strong>in</strong>gent valuation (Section 8.1.2). The estimates from the choice experiment are for the<br />
<strong>in</strong>dividual upland attributes. Those from the cont<strong>in</strong>gent valuation question are for the<br />
improvement scenario presented for all SDAs not <strong>in</strong> the region the respondent lives. The<br />
functions that expla<strong>in</strong> these estimates are reported <strong>in</strong> Section 7.<br />
8.1.1 Choice experiment<br />
Table 8.1 shows the implicit prices for the attributes and the respective 95% confidence<br />
<strong>in</strong>tervals, calculated us<strong>in</strong>g the Kr<strong>in</strong>sky and Robb (1986) procedure. The results are the<br />
estimates from the will<strong>in</strong>gness to pay functions that <strong>in</strong>clude both attributes and a selection<br />
<strong>of</strong> socio-economic and attitude questions (see Section 7.2 for the explanation <strong>of</strong> different<br />
models). The implicit prices for most attributes are positive, imply<strong>in</strong>g that respondents<br />
have a positive will<strong>in</strong>gness to pay for <strong>in</strong>creases <strong>in</strong> the quality or quantity <strong>of</strong> each <strong>of</strong> these<br />
attributes.<br />
In the case <strong>of</strong> quantitative attributes the implicit prices represent the WTP per household<br />
per year to achieve one unit more (1% more <strong>in</strong> this study) <strong>of</strong> the attribute considered. For<br />
example, <strong>in</strong> the North West, respondents are, on average, will<strong>in</strong>g to pay £0.78 per<br />
household per year for a 1% <strong>in</strong>crease <strong>in</strong> heather moorland and bog beyond the ‘current<br />
policy’ basel<strong>in</strong>e. For field boundaries, the results show WTP per metre <strong>in</strong>crease <strong>in</strong> the<br />
length <strong>of</strong> boundaries conserved per km. For cultural heritage, the implicit price reflects the<br />
WTP for a discrete change <strong>in</strong> the attribute's level, for example to improve farm build<strong>in</strong>g<br />
and traditional farm practices from ‘rapid decl<strong>in</strong>e’ to ‘much better conservation’. For<br />
example, <strong>in</strong> the North West, respondents are, on average, will<strong>in</strong>g to pay £4.89 per<br />
household per year for the cultural heritage attribute to change from “rapid decl<strong>in</strong>e” <strong>of</strong><br />
farm build<strong>in</strong>gs and traditional farm practices to “much better conservation” <strong>of</strong> these.<br />
Table 8.1 summarises the results for all regions except for the North East. As Section 7.2<br />
and statistical Annex 5 show, the function that expla<strong>in</strong>s the WTP estimates for the North<br />
East returned <strong>in</strong>significant coefficients for all upland attributes. The coefficient for the<br />
cost attribute alone was significant. This precludes estimation <strong>of</strong> a WTP per attribute for<br />
this region and similarly aggregation across different policy options is not presented for<br />
North East. However, <strong>in</strong> the “attributes only” model for the North East, the constant term<br />
was positive and significant. This <strong>in</strong>dicates that, all else be<strong>in</strong>g equal, respondents were <strong>in</strong><br />
favour <strong>of</strong> the payments. The lack <strong>of</strong> significance for the attribute coefficients does not<br />
<strong>in</strong>dicate zero WTP.<br />
eftec 56 January 2006
<strong>Economic</strong> <strong>Valuation</strong> <strong>of</strong> <strong>Environmental</strong> <strong>Impacts</strong> <strong>in</strong> the Severely Disadvantaged Areas<br />
Table 8.1: WTP results (£ per household per year per 1% improvement for the first<br />
three attributes, £ per 1 metre <strong>in</strong>crease <strong>in</strong> the case <strong>of</strong> field boundaries) derived from<br />
the choice experiment for each region (except the North East).<br />
NW YH WM EM SW SE<br />
Model used 1 : A&S A&S AO A&S AO A&S<br />
HMB 0.78 0.30 0.80 1.04 0.92 0.81<br />
(0.45-1.11) (-0.06-0.65) (0.42-1.18) (-0.03-2.31) (0.37-1.54) (0.36-1.25)<br />
RG 0.74 0.31 0.25 0.08 -0.06 0.50<br />
(0.45-1.05) (0.01-0.60) (-0.05-0.53) (-0.99-0.91) (-0.56-0.39) (0.14-0.86)<br />
BMW 0.61 0.15 0.43 0.97 0.39 1.21<br />
(0.30-0.91) (-0.16-0.48) (0.07-0.81) (0.03-2.46) (-0.01-0.78) (0.81-1.66)<br />
FB 0.00 0.04 0.02 0.06 -0.04 0.06<br />
(-0.03-0.04) (0.01-0.08) (-0.02-0.05) (-0.06-0.18) (-0.11-0.02) (0.02-0.11)<br />
CH<br />
(small 2 )<br />
1.03<br />
(-1.84-4.14)<br />
3.08<br />
(-0.24-6.71)<br />
-0.40<br />
(-4.27-3.03)<br />
7.92<br />
(-1.96-22.62)<br />
5.48<br />
(-0.11-11.59)<br />
0.81<br />
(-3.22-4.96)<br />
CH<br />
(big 3 )<br />
4.89<br />
(1.52-8.43)<br />
11.93<br />
(8.47-15.44)<br />
6.56<br />
(2.49-10.73)<br />
22.51<br />
(11.84-37.24)<br />
7.68<br />
(1.24-15.03)<br />
15.79<br />
(11.47-20.64)<br />
Figures <strong>in</strong> brackets are the 95% confidence <strong>in</strong>terval. Note that if the confidence <strong>in</strong>terval spans zero<br />
then the WTP is not significantly different from zero.<br />
HMB = heather moorland and bog, RG = rough grassland, BMW = mixed and broadleaf woodland, FB =<br />
field boundaries, CH = cultural heritage.<br />
1<br />
A&S = attributes and socio-economic variables; AO = attributes only<br />
2<br />
from “rapid decl<strong>in</strong>e” to “no change”<br />
3<br />
from “rapid decl<strong>in</strong>e” to “much better conservation”<br />
It should be remembered that while the WTP figures for cultural heritage appear large<br />
compared to the others, as cultural heritage was a qualitative attribute, it could only be<br />
considered as chang<strong>in</strong>g discretely. All other WTP figures are marg<strong>in</strong>al changes (a 1 metre<br />
<strong>in</strong>crease <strong>in</strong> the case <strong>of</strong> field boundaries and 1% change <strong>in</strong> all others), while the cultural<br />
heritage WTP figures are for a large improvement <strong>in</strong> the attribute.<br />
These results show a fair degree <strong>of</strong> heterogeneity between regions, which could be due to<br />
the follow<strong>in</strong>g factors: (i) different abundances <strong>of</strong> attributes <strong>in</strong> different regions; (ii)<br />
different regional cultural preferences; and (iii) socio-economic differences. The first <strong>of</strong><br />
these has not been <strong>in</strong>cluded <strong>in</strong> the regression model; it is not obvious how the second could<br />
be <strong>in</strong>cluded; while the differences appear to be greater than could be expla<strong>in</strong>ed by socioeconomic<br />
factors alone. Therefore there are regional differences which cannot presently be<br />
expla<strong>in</strong>ed or <strong>in</strong>cluded <strong>in</strong> a benefits transfer function (Section 3.2.4). This could make the<br />
transfer error <strong>in</strong> a possible benefits transfer exercise unacceptably large. For this reason,<br />
we do not th<strong>in</strong>k it advisable to conduct a benefits transfer exercise from the South East<br />
results to the other two non-SDA regions <strong>of</strong> England.<br />
8.1.2 Cont<strong>in</strong>gent valuation<br />
As described <strong>in</strong> Section 3.3.3, the cont<strong>in</strong>gent valuation section asked respondents <strong>in</strong> each <strong>of</strong><br />
the GORs conta<strong>in</strong><strong>in</strong>g SDAs to choose between two scenarios for all other GORs conta<strong>in</strong><strong>in</strong>g<br />
SDAs <strong>in</strong> England: the same current policy that was used <strong>in</strong> the choice experiment and a<br />
‘best case’ alternative policy option.<br />
Mean WTP was estimated for all regional results together, both parametrically and nonparametrically.<br />
The results are presented <strong>in</strong> Table 8.2.<br />
Table 8.2: Comparison <strong>of</strong> parametric and non-parametric estimates <strong>of</strong> WTP for the<br />
alternative policy over the current policy presented <strong>in</strong> Table 3.5.<br />
Estimation method Estimated mean 95% confidence Standard error<br />
WTP<br />
<strong>in</strong>terval<br />
Non-parametric £49.27 47.56 – 50.99 0.88<br />
Parametric £104.92 72.17 – 137.67 16.71<br />
WTP is expressed <strong>in</strong> units <strong>of</strong> £ per household per year.<br />
eftec 57 January 2006
<strong>Economic</strong> <strong>Valuation</strong> <strong>of</strong> <strong>Environmental</strong> <strong>Impacts</strong> <strong>in</strong> the Severely Disadvantaged Areas<br />
It is likely that the non-parametric method estimate is conservative, as the method is not<br />
capable <strong>of</strong> tak<strong>in</strong>g <strong>in</strong>to consideration the fact that many respondents may well have been<br />
will<strong>in</strong>g to pay more than £70 per household per year, which was the highest amount <strong>of</strong>fered<br />
<strong>in</strong> the survey.<br />
The CE and CV results are not directly comparable or compatible for jo<strong>in</strong>t aggregation, as<br />
the CV results value a change from a different basel<strong>in</strong>e to the basel<strong>in</strong>e used <strong>in</strong> the choice<br />
experiment and cover a different geographical scope.<br />
8.2 Aggregation<br />
Results from a valuation study such as this can be aggregated across several dimensions. In<br />
this case across: the potential policy scenarios (for CE); population (for CE and CV) and<br />
time (for CE and CV). The separate aggregation <strong>of</strong> the strands <strong>of</strong> this study is presented<br />
below, for choice experiment (Section 8.2.1), cont<strong>in</strong>gent valuation (8.2.2) and benefits<br />
transfer (Section 8.2.3). In the f<strong>in</strong>al Section (8.2.4), results <strong>of</strong> the CE and benefits transfer<br />
results are brought together.<br />
It is worth emphasis<strong>in</strong>g that while aggregation is <strong>in</strong>terest<strong>in</strong>g and has policy relevance, the<br />
advantage <strong>of</strong> the CE is that it gives us the relative importance <strong>of</strong> upland attributes through<br />
the unit WTP estimates per upland attribute. The relative importance <strong>of</strong> the upland<br />
attributes could be use to determ<strong>in</strong>e allocation <strong>of</strong> the exist<strong>in</strong>g LFA, i.e. allocat<strong>in</strong>g higher<br />
funds to attributes that have higher WTP. The aggregate values for policy options, on the<br />
other hand, could be an <strong>in</strong>put to decid<strong>in</strong>g whether the exist<strong>in</strong>g LFA constitutes an under- or<br />
over-spend, by compar<strong>in</strong>g the aggregate values to the LFA funds. However, this is not the<br />
objective <strong>of</strong> the study.<br />
We also aggregated the CE results across regions as an illustration. However, aga<strong>in</strong> this has<br />
caveats as the survey was designed to elicit respondents’ preferences for the attributes <strong>of</strong><br />
the SDAs <strong>in</strong> their own regions. Therefore, possible substitution effects <strong>of</strong> SDAs <strong>in</strong> different<br />
regions on the preferences <strong>of</strong> the respondents <strong>in</strong> a given region are not taken <strong>in</strong>to account.<br />
8.2.1 Choice experiment results<br />
The choice experiment undertaken for this study produces unit values <strong>in</strong> terms <strong>of</strong> £ per<br />
household per year per unit change <strong>of</strong> upland attribute. Here, the aggregation is across LFA<br />
scenarios compared to the basel<strong>in</strong>e. Table 8.3 sets out the forecast levels <strong>of</strong> the attributes<br />
used <strong>in</strong> the choice experiment under the different scenarios, as outl<strong>in</strong>ed <strong>in</strong> Table 2.2.<br />
Table 8.3: Predictions to the five CE landscape attributes under the four policy<br />
scenarios, accord<strong>in</strong>g to Cumulus et al. (2005).<br />
Upland<br />
Scenario 0<br />
attribute<br />
Basel<strong>in</strong>e 1<br />
Scenario 1 Scenario 2 Scenario 3<br />
Env-agri Env only Aband-<strong>in</strong>tern<br />
Heather<br />
moorland and<br />
bog<br />
+1% +3% (+2%) +5% (+4%) -2% (-3%)<br />
Rough grassland +1% -1% (-2%) -3% (-4%) +3% (+2%)<br />
Mixed and<br />
broadleaved<br />
woodland<br />
+3% +4% (+1%) +6% (+3%) +5% (+2%)<br />
Field boundaries +5% +6% (+1%) +10% (+5%) +2%(-3%)<br />
Cultural<br />
heritage<br />
Decl<strong>in</strong>e Slow decl<strong>in</strong>e No change Decl<strong>in</strong>e<br />
Figures <strong>in</strong> brackets <strong>in</strong>dicate the change <strong>of</strong> policies 1 to 3 over the basel<strong>in</strong>e.<br />
1<br />
For simplicity, the lower bound <strong>of</strong> the Cumulus estimates has been used for heather moorland and<br />
bog and rough grassland.<br />
eftec 58 January 2006
<strong>Economic</strong> <strong>Valuation</strong> <strong>of</strong> <strong>Environmental</strong> <strong>Impacts</strong> <strong>in</strong> the Severely Disadvantaged Areas<br />
Table 8.4 summarises the compensat<strong>in</strong>g surplus (CS) results and their aggregation for each<br />
<strong>of</strong> the above scenarios for each GOR per household and per GOR population. All attributes<br />
are <strong>in</strong>cluded <strong>in</strong> the compensat<strong>in</strong>g surplus estimates. The North East results are not<br />
presented for the reason expla<strong>in</strong>ed <strong>in</strong> Section 8.1.<br />
What is sought it is a measure <strong>of</strong> the value to an <strong>in</strong>dividual <strong>of</strong> an <strong>in</strong>crease <strong>in</strong> the quantity <strong>of</strong><br />
a public good (i.e. landscape attributes). From underly<strong>in</strong>g economic theory, the<br />
appropriate measure for this change <strong>in</strong> an <strong>in</strong>dividual’s welfare is that <strong>of</strong> compensat<strong>in</strong>g<br />
surplus. This measure asks what compensat<strong>in</strong>g payment (<strong>in</strong> practical terms what change <strong>in</strong><br />
<strong>in</strong>come/expenditure) will make an <strong>in</strong>dividual <strong>in</strong>different between their orig<strong>in</strong>al level <strong>of</strong><br />
utility and the opportunity to consume the new quantity <strong>of</strong> the public good. Given the<br />
implied property rights (that the <strong>in</strong>dividual is entitled to their current level <strong>of</strong> utility/status<br />
quo), the appropriate metric for measur<strong>in</strong>g the compensat<strong>in</strong>g surplus is that <strong>of</strong> will<strong>in</strong>gness<br />
to pay, which is the amount <strong>of</strong> money an <strong>in</strong>dividual would be will<strong>in</strong>g to give up to obta<strong>in</strong><br />
the change <strong>in</strong> the provision <strong>of</strong> the public good and still be as well as <strong>of</strong>f as their situation<br />
prior to the change (for further, see Mitchell and Carson, 1989; Freeman, 1993).<br />
The CS estimates <strong>in</strong> this study therefore represent respondents’ average WTP to move from<br />
the state <strong>of</strong> the world given <strong>in</strong> Scenario 0 to the state <strong>of</strong> the world given <strong>in</strong> Scenarios 1 to<br />
3. Ultimately they are a measure <strong>of</strong> the welfare associated with different scenarios. The<br />
calculation <strong>of</strong> the CS estimates is expla<strong>in</strong>ed <strong>in</strong> Section A5.1.2.<br />
Assum<strong>in</strong>g the same level <strong>of</strong> impact (% change), the higher the coefficient, the greater the<br />
share <strong>of</strong> the attribute <strong>in</strong> the CS. Assum<strong>in</strong>g the same coefficient, the larger the change, the<br />
greater is the impact. So the attributes that have higher coefficients and higher changes<br />
are likely to dom<strong>in</strong>ate.<br />
Table 8.4: Compensat<strong>in</strong>g surpluses <strong>of</strong> the different policy options over the current<br />
policy: per household per year and aggregated across all households<br />
NW YH WM EM SW SE Total<br />
Compensat<strong>in</strong>g surplus (£ per household per year)<br />
Scenario<br />
1<br />
Scenario<br />
2<br />
Scenario<br />
3<br />
7.68<br />
(2.59 -<br />
13.33)<br />
9.17<br />
(3.60 -<br />
15.22)<br />
0.21<br />
(-1.41 -<br />
1.88)<br />
18.64<br />
(12.28 -<br />
25.56)<br />
20.54<br />
(14.16 -<br />
27.59)<br />
-1.20<br />
(-2.78 -<br />
0.63)<br />
7.44<br />
(0.39 -<br />
14.42)<br />
10.04<br />
(2.58 -<br />
17.51)<br />
-1.50<br />
(-3.36 -<br />
0.42)<br />
41.81<br />
(22.27 -<br />
81.34)<br />
47.97<br />
(26.45 -<br />
94.88)<br />
-2.73<br />
(-9.06 -<br />
3.83)<br />
20.59<br />
(9.28 -<br />
32.83)<br />
21.74<br />
(9.84 -<br />
34.64)<br />
-0.92<br />
(-3.76 -<br />
2.20)<br />
19.85<br />
(12.47 -<br />
27.66)<br />
25.40<br />
(17.72 -<br />
34.17)<br />
-0.89<br />
(-3.12 -<br />
1.15)<br />
No. households (million)<br />
2.81 2.07 2.15 1.73 2.09 3.29<br />
Compensat<strong>in</strong>g surplus (aggregated across all households, £ million per year)<br />
Scenario<br />
1<br />
Scenario<br />
2<br />
Scenario<br />
3<br />
21.58<br />
(7.28 -<br />
37.46)<br />
25.77<br />
(10.12 -<br />
42.77)<br />
0.59<br />
(-3.96 -<br />
5.28)<br />
38.58<br />
(25.42 -<br />
52.91)<br />
42.52<br />
(29.31 -<br />
57.11)<br />
-2.48<br />
(-5.75 -<br />
1.30)<br />
16.00<br />
(0.84 –<br />
31.00)<br />
21.59<br />
(5.55 -<br />
37.65)<br />
-3.23<br />
(-7.22 -<br />
0.90)<br />
Figures <strong>in</strong> brackets <strong>in</strong>dicate 95% confidence <strong>in</strong>tervals.<br />
72.33<br />
(38.53 -<br />
140.72)<br />
82.99<br />
(45.76 -<br />
164.14)<br />
-4.72<br />
(-15.67 -<br />
6.63)<br />
43.03<br />
(19.40 -<br />
68.61)<br />
45.44<br />
(20.57 -<br />
72.40)<br />
-1.92<br />
(-7.86 -<br />
4.60)<br />
65.31<br />
(41.03 –<br />
91.00)<br />
83.57<br />
(58.3 -<br />
112.42)<br />
-2.93<br />
(-10.26 -<br />
3.78)<br />
256.83<br />
(132.48 -<br />
421.70)<br />
301.86<br />
(169.6 -<br />
486.49)<br />
-14.69<br />
(-50.74 -<br />
22.5)<br />
Table 8.4 shows that the CS results are <strong>in</strong> l<strong>in</strong>e with what might be expected from look<strong>in</strong>g at<br />
the physical changes under each policy scenario <strong>in</strong> Table 8.3. For example, Scenario 2 may<br />
be expected to yield the highest benefits based on the physical change levels and it <strong>in</strong>deed<br />
eftec 59 January 2006
<strong>Economic</strong> <strong>Valuation</strong> <strong>of</strong> <strong>Environmental</strong> <strong>Impacts</strong> <strong>in</strong> the Severely Disadvantaged Areas<br />
does. Similarly, Scenario 3 may be expected to produce net disbenefits on the basis <strong>of</strong> the<br />
physical changes. This is the case <strong>in</strong> Table 8.4 but note that the CS estimates for Scenario 3<br />
are <strong>in</strong> fact not significantly different from zero, <strong>in</strong> that the 95% confidence <strong>in</strong>tervals<br />
conta<strong>in</strong> zero.<br />
It is worth not<strong>in</strong>g that the compensat<strong>in</strong>g surplus figures for the West Midlands are not<br />
especially high compared to other regions, despite the apparent enthusiasm <strong>of</strong> West<br />
Midlands respondents to payments for upland landscape improvements noted <strong>in</strong> Section<br />
7.2.1. In the regression analysis, the constant term for the West Midlands was fairly high;<br />
this could <strong>in</strong>dicate that respondents <strong>in</strong> the West Midlands were more <strong>in</strong> favour <strong>of</strong><br />
environmental improvements without preferences for particular upland attributes.<br />
8.2.2 Cont<strong>in</strong>gent valuation results<br />
The cont<strong>in</strong>gent valuation results cannot be added to the choice experiment results,<br />
because the change valued by the cont<strong>in</strong>gent valuation scenario is different to the change<br />
expressed by any <strong>of</strong> the policy scenarios - <strong>in</strong> that the basel<strong>in</strong>e used <strong>in</strong> the cont<strong>in</strong>gent<br />
valuation section was different to that used <strong>in</strong> the choice experiment. It should be<br />
remembered that this WTP was measur<strong>in</strong>g a change from a worst case scenario to a best<br />
case scenario, and that WTP for smaller changes would be considerably less.<br />
However, it should be noted that the fact that respondents expressed quite a substantial<br />
WTP for landscape improvements <strong>in</strong> GORs other than their own is evidence that the with<strong>in</strong>region<br />
aggregated benefits expressed <strong>in</strong> this chapter are likely to be an underestimate <strong>of</strong><br />
total value.<br />
As a stand alone result, the aggregated CV WTP results us<strong>in</strong>g the lower bound result <strong>of</strong><br />
£49.27 per household is presented <strong>in</strong> Table 8.5.<br />
Table 8.5: Aggregation <strong>of</strong> WTP for landscape improvements <strong>in</strong> SDA GORs other than<br />
respondents’ own.<br />
Per household average WTP estimate £49.27 (47.56 – 50.99)<br />
Total no. households 1<br />
10.85 million<br />
Aggregate CV result £535 million<br />
1<br />
I.e. the total number <strong>of</strong> households covered by English SDA GORs, not <strong>in</strong> England overall.<br />
Figures <strong>in</strong> brackets represent the 95% confidence <strong>in</strong>tervals.<br />
8.2.3 Benefit transfer results<br />
As expla<strong>in</strong>ed <strong>in</strong> Section 5 and Table 3.1, there is only one other attribute from the long list<br />
which can be <strong>in</strong>cluded <strong>in</strong> the aggregation: hay meadow. The expected changes to this<br />
attribute under the four policy scenarios, accord<strong>in</strong>g to Cumulus et al. (2005), is presented<br />
<strong>in</strong> Table 8.6.<br />
Table 8.6: Predictions <strong>of</strong> changes <strong>in</strong> hay meadow under the four policy scenarios,<br />
accord<strong>in</strong>g to Cumulus et al. (2005).<br />
Upland<br />
Policy 0 Policy 1 Policy 2 Policy 3<br />
attribute<br />
Basel<strong>in</strong>e Env-agri Env only Aband-<strong>in</strong>tern<br />
Hay meadows -5% -3% (+2%) 0% (+5%) -8% (-3%)<br />
Figures <strong>in</strong> brackets <strong>in</strong>dicate the change <strong>of</strong> policies 1 to 3 over the basel<strong>in</strong>e.<br />
As described <strong>in</strong> Section 5.1.2, values for hay meadows are taken from the <strong>Environmental</strong><br />
Landscape Features model, and are taken from estimates <strong>in</strong> the model where hay meadows<br />
are reduced <strong>in</strong> abundance by 10%. The derivation <strong>of</strong> the estimated net benefits (us<strong>in</strong>g a<br />
midpo<strong>in</strong>t estimate) <strong>of</strong> policy options 1-3 over the basel<strong>in</strong>e scenario with respect to hay<br />
meadows is presented <strong>in</strong> Table 8.7.<br />
eftec 60 January 2006
<strong>Economic</strong> <strong>Valuation</strong> <strong>of</strong> <strong>Environmental</strong> <strong>Impacts</strong> <strong>in</strong> the Severely Disadvantaged Areas<br />
Table 8.7: Derivation <strong>of</strong> estimated annual net benefit <strong>in</strong> 2013 <strong>of</strong> the different policy<br />
scenarios with respect to hay meadows.<br />
NW NE YH WM EM SW Total<br />
A. Present<br />
area <strong>in</strong><br />
SDAs 1 (ha)<br />
39,318 27,144 20,309 6,290 7,487 22,268 122,816<br />
B. Changes net <strong>of</strong> the basel<strong>in</strong>e brought about by policy scenarios (ha) –<br />
multiply<strong>in</strong>g A with % changes from Table 8.6<br />
Scenario 1<br />
change 786 543 406 126 150 445 2,456<br />
Scenario 2<br />
change 1,966 1,357 1,015 315 374 1,113 6,141<br />
Scenario 3<br />
change -1,180 -814 -609 -189 -225 -668 -3,684<br />
C. ELF value estimates (£ per ha per annum)<br />
LB value 20 20 26 19 24 8<br />
UB value 34 33 44 32 40 13<br />
mid-po<strong>in</strong>t 27 26 35 25 32 11<br />
D. Estimated annual benefits net <strong>of</strong> the basel<strong>in</strong>e <strong>of</strong> the different policy scenarios (£)<br />
(B x C (mid po<strong>in</strong>t))<br />
Scenario 1 21,000 14,000 14,000 3,000 5,000 5,000 62,000<br />
Scenario 2 53,000 35,000 36,000 8,000 12,000 12,000 156,000<br />
Scenario 3 -32,000 -21,000 -21,000 -5,000 -7,000 -7,000 -94,000<br />
LB = lower bound; UB = upper bound.<br />
1 Data provided by <strong>Defra</strong><br />
8.2.4 Overall aggregation<br />
Overall aggregation necessitates summ<strong>in</strong>g the different elements <strong>of</strong> value outl<strong>in</strong>ed above,<br />
and also aggregat<strong>in</strong>g over time (but appropriately discount<strong>in</strong>g future values). The estimated<br />
values presented above, aggregated over population, are the values for the eventual<br />
change – e.g. for a state <strong>of</strong> affairs where heather moorland and bog is 5% higher <strong>in</strong> 2013<br />
than it would have been under the current policy basel<strong>in</strong>e scenario. Clearly, the predicted<br />
changes to the landscape attributes will not happen overnight. In the aggregation <strong>of</strong> time,<br />
the (dis)benefits associated with changes to the attributes are assumed to accrue l<strong>in</strong>early.<br />
The justification <strong>of</strong> this is detailed <strong>in</strong> Section A5.5 <strong>in</strong> the Annexes. Therefore, it should be<br />
borne <strong>in</strong> m<strong>in</strong>d that benefits have been both adjusted to account for the fact that the<br />
impacts are not immediate and subjected to discount<strong>in</strong>g.<br />
The overall aggregation across benefits and across the period 2007-2013 are presented <strong>in</strong><br />
Table 8.8, us<strong>in</strong>g 2007 as the base year and a 3.5% discount rate, as recommended by the<br />
Treasury Green Book (HM Treasury, 2003).<br />
It is important to remember that the total aggregation figures for England do not <strong>in</strong>clude<br />
the North East, London or East regions.<br />
eftec 61 January 2006
<strong>Economic</strong> <strong>Valuation</strong> <strong>of</strong> <strong>Environmental</strong> <strong>Impacts</strong> <strong>in</strong> the Severely Disadvantaged Areas<br />
Table 8.8: Aggregation <strong>of</strong> benefits across attributes, population and time<br />
Scenario 1<br />
Scenario 2<br />
Scenario 3<br />
Env-agri<br />
Env only<br />
Aband-<strong>in</strong>tern<br />
Estimated annual net benefit <strong>of</strong> eventual change (£ per year)<br />
Choice experiment<br />
attributes –<br />
256,830,000<br />
301,860,000<br />
-14,690,000<br />
compensat<strong>in</strong>g<br />
(132,480,000 – (169,600,000 – (-50,740,000 –<br />
surplus (Table 8.4)<br />
Hay meadows<br />
421,700,000) 486,490,000)<br />
22,500,000)<br />
(Table 8.7) 62,000 156,000 -94,000<br />
Estimated discounted benefit over the period 2007-2013 (£ million)<br />
Choice experiment<br />
897<br />
1,054<br />
-51<br />
attributes<br />
(463 – 1,473) (592 – 1,699)<br />
(-177 – +79)<br />
Hay meadows 0.2 0.5 -0.3<br />
TOTAL 897<br />
1,055<br />
-51<br />
(463 – 1,473) (593 – 1,700)<br />
(-177 – +79)<br />
Figures <strong>in</strong> brackets <strong>in</strong>dicate 95% confidence <strong>in</strong>tervals.<br />
8.3 Conclusions<br />
This study is one <strong>of</strong> two <strong>in</strong>terl<strong>in</strong>ked studies seek<strong>in</strong>g to generate monetary valuation<br />
evidence for revision <strong>of</strong> the LFA policy (the other be<strong>in</strong>g Cumulus et al., 2005). The revision<br />
<strong>of</strong> this policy will affect land use management <strong>in</strong> the SDAs, and as a result the current<br />
quality and quantity <strong>of</strong> various upland attributes or features. Cumulus et al. (2005)<br />
establish the basel<strong>in</strong>e changes <strong>in</strong> these attributes due to CAP and other currently planned<br />
reforms, and analyse the potential changes <strong>in</strong> the upland attributes under three policy<br />
revision options. The policy options presented <strong>in</strong> that report and used <strong>in</strong> this study are not<br />
def<strong>in</strong>itive predictions but possible outcomes. The conclusions <strong>of</strong> this study should be<br />
<strong>in</strong>terpreted with that caveat <strong>in</strong> m<strong>in</strong>d.<br />
The objective <strong>of</strong> this study was specifically to provide monetary estimates <strong>of</strong> the relative<br />
economic value <strong>of</strong> upland attributes <strong>in</strong> each GOR with SDAs so that the allocation <strong>of</strong> funds<br />
can benefit from this <strong>in</strong>formation (e.g. more fund<strong>in</strong>g for the protection or improvement <strong>of</strong><br />
upland attributes valued more highly by the GOR population). Some <strong>of</strong> this <strong>in</strong>formation is<br />
collected through a choice experiment survey applied separately <strong>in</strong> each GOR with SDAs (as<br />
well as <strong>in</strong> the South East GOR) while some is estimated through benefits transfer. It was not<br />
possible to provide any quantitative monetised estimates for the changes <strong>in</strong> a number <strong>of</strong><br />
attributes due to lack <strong>of</strong> data.<br />
Individual preferences for upland attributes are only one part <strong>of</strong> the evidence needed for<br />
the policy revision. The conclusions presented here are based only on the f<strong>in</strong>d<strong>in</strong>gs <strong>of</strong> this<br />
study and may not necessarily be the conclusions reached at the end <strong>of</strong> the policy appraisal<br />
process which should consider other <strong>in</strong>formation (e.g. expert op<strong>in</strong>ion).<br />
On the basis <strong>of</strong> the stated preference survey, we can make the follow<strong>in</strong>g general<br />
conclusions:<br />
• On the whole, people are will<strong>in</strong>g to pay to contribute to the improvements <strong>in</strong> Severely<br />
Disadvantaged Areas and upland attributes associated with them. The exception to this<br />
are the results for the North West GOR which displayed a significant negative constant<br />
term <strong>in</strong> one <strong>of</strong> the regression models (that which considered the upland attributes<br />
alone), <strong>in</strong>dicat<strong>in</strong>g that respondents <strong>in</strong> the North West may actually prefer the current<br />
policy option to scenarios <strong>of</strong>fer<strong>in</strong>g alleged improvements. This fits <strong>in</strong> with attitud<strong>in</strong>al<br />
responses from the North West, and the fact that the policy cost (<strong>in</strong>creases <strong>in</strong> annual<br />
tax payments) attribute showed the most negative coefficient <strong>in</strong> the North West,<br />
<strong>in</strong>dicat<strong>in</strong>g an unwill<strong>in</strong>gness to pay. The North West results, along with the high<br />
will<strong>in</strong>gness to pay <strong>of</strong> South Eastern respondents, to some extent <strong>in</strong>dicates that people<br />
either value what they do not already have <strong>in</strong> abundance, or that people <strong>in</strong> the North<br />
eftec 62 January 2006
<strong>Economic</strong> <strong>Valuation</strong> <strong>of</strong> <strong>Environmental</strong> <strong>Impacts</strong> <strong>in</strong> the Severely Disadvantaged Areas<br />
West are less will<strong>in</strong>g to pay alone for what they consider to be a national asset (the<br />
Lake District).<br />
• There are large variations <strong>in</strong> the values <strong>in</strong>dividuals place on landscape features across<br />
different regions that are not possible to expla<strong>in</strong> fully on the basis <strong>of</strong> socio-economic<br />
differences between populations.<br />
• Notwithstand<strong>in</strong>g the regional differences, on the whole, changes <strong>in</strong> the cultural<br />
heritage (if a large improvement) and policy cost attributes seem to have played a role<br />
<strong>in</strong> the choices respondents made. The consistently large coefficients for a large<br />
improvement <strong>in</strong> cultural heritage could be purely because a large discrete change (from<br />
“rapid decl<strong>in</strong>e” to “much better conservation”) was on <strong>of</strong>fer. If we had been able to<br />
measure the cultural heritage attribute quantitatively, and hence vary it cont<strong>in</strong>uously,<br />
it may not have been as consistently important <strong>in</strong> affect<strong>in</strong>g respondents’ choices. That<br />
said, it was clear from the focus groups, valuation workshops and reasons respondents<br />
gave for be<strong>in</strong>g will<strong>in</strong>g to pay for landscape improvements that cultural heritage is<br />
someth<strong>in</strong>g that is highly valued. Therefore, the implications <strong>of</strong> any agricultural or<br />
environmental improvement scheme on this attribute should be considered carefully.<br />
• In terms <strong>of</strong> the other attributes, woodland was the next most likely to affect<br />
respondents’ choices, followed by heather moorland and bog, rough grassland and field<br />
boundaries; the latter did not appear to be highly valued. It is possible that<br />
respondents saw field boundaries as an attribute which could be rebuilt or replanted,<br />
and which was not gone forever if lost.<br />
• There is evidence <strong>of</strong> preference heterogeneity with<strong>in</strong> each region.<br />
• There is evidence (from the cont<strong>in</strong>gent valuation question <strong>in</strong> the survey) that<br />
<strong>in</strong>dividuals <strong>in</strong> one GOR with SDAs are likely to value the SDAs <strong>in</strong> the rest <strong>of</strong> England,<br />
albeit to a lesser extent than they do the SDAs <strong>in</strong> their own region. However, this<br />
result is derived from a context where respondents were asked to choose between the<br />
upper and lower ranges which attributes took under the choice experiment;<br />
respondents would presumably have been will<strong>in</strong>g to pay much less if they had been<br />
asked to pay for a much smaller improvement.<br />
• On the basis <strong>of</strong> the South East survey, there is also evidence that those who live <strong>in</strong><br />
regions without SDAs are likely to have positive preferences for the improvement <strong>of</strong><br />
upland attributes <strong>in</strong> the SDAs. However, due to significant but not completely<br />
expla<strong>in</strong>able differences <strong>in</strong> preferences across GORs, we cannot transfer the results <strong>of</strong><br />
the South East to London and East <strong>of</strong> England GORs which also do not have SDAs.<br />
• A f<strong>in</strong>al piece <strong>of</strong> evidence for non-use values comes from the f<strong>in</strong>d<strong>in</strong>g that many<br />
respondents <strong>in</strong> SDA GORs who said that they never visited SDAs were nevertheless<br />
will<strong>in</strong>g to pay for improvements.<br />
On the basis <strong>of</strong> the choice experiment and benefits transfer results, the “environment only”<br />
scenario (Scenario 2) appears to yield the greatest benefits. This is because it provides<br />
superior quantities <strong>of</strong> all attributes except rough grassland, which was not valued<br />
particularly highly by respondents. On the basis <strong>of</strong> the quantitative assessment by Cumulus<br />
et al. (2005), Scenario 3 (“Abandonment-<strong>in</strong>tensification”) was likely to generate<br />
disbenefits. The economic assessment <strong>in</strong> this study also comes up with a negative benefit<br />
estimate for this scenario, i.e. a disbenefit. However, it should be noted that this estimate<br />
is not significantly different from zero for any <strong>of</strong> the regions. Scenario 1 (“Environmentagri”)<br />
gives a benefit which is not much less than Scenario 2.<br />
Other policy scenarios can be analysed us<strong>in</strong>g the results <strong>of</strong> the choice experiment as long as<br />
the magnitude <strong>of</strong> changes <strong>in</strong> the attributes forecast for the scenarios is with<strong>in</strong> the set up<br />
changes covered by the choice experiment. The economic value <strong>of</strong> any changes smaller or<br />
larger than the set covered <strong>in</strong> the experiment cannot be estimated us<strong>in</strong>g the results <strong>of</strong> this<br />
study.<br />
eftec 63 January 2006
<strong>Economic</strong> <strong>Valuation</strong> <strong>of</strong> <strong>Environmental</strong> <strong>Impacts</strong> <strong>in</strong> the Severely Disadvantaged Areas<br />
References<br />
Adamowicz W., Boxall P., Williams M. and Louviere J. (1998), Stated preference<br />
approaches for measur<strong>in</strong>g passive use values: choice experiments and cont<strong>in</strong>gent valuation,<br />
American Journal <strong>of</strong> Agricultural <strong>Economic</strong>s, 80:64-75.<br />
Allenby, G., G<strong>in</strong>ter, J. (1995), The effects <strong>of</strong> <strong>in</strong>-store displays and feature advertis<strong>in</strong>g on<br />
consideration sets, International Journal <strong>of</strong> Research <strong>in</strong> Market<strong>in</strong>g 12:67–80.<br />
Alvarez-Farizo, B., Hanley, N., Wright, R.E. and MacMillan, D. (1999), Estimat<strong>in</strong>g the<br />
Benefits <strong>of</strong> Agri-environemtal Policy: Econometric Issues <strong>in</strong> Open-ended Cont<strong>in</strong>gent<br />
<strong>Valuation</strong> Studies, Journal <strong>of</strong> <strong>Environmental</strong> Plann<strong>in</strong>g & Management 42(1):23-43<br />
Bateman I.J., Carson, R.T., Day, B., Hanemann, M., Hanley, N., Hett, T., Jones-Lee, M.,<br />
Loomes, G., Mourato, S., Ozdemiroglu, E., Pearce, D.W., Sugden, R. and Swanson, J.<br />
(2002), <strong>Economic</strong> <strong>Valuation</strong> with Stated Preference Techniques, Edward Elgar Publish<strong>in</strong>g,<br />
Cheltenham<br />
Bateman, I.J., Jones, A.P., Nishikawa, N. and Brouwer, R. (2000), Benefits transfer <strong>in</strong><br />
theory and practice: A review, CSERGE Global <strong>Environmental</strong> Change Work<strong>in</strong>g Paper<br />
GEC2000-25, Centre for Social and <strong>Economic</strong> Research on the Global Environment,<br />
University <strong>of</strong> East Anglia and University College London.<br />
Bennett, J., and Adamowicz, V. (2001), Some fundamentals <strong>of</strong> <strong>Environmental</strong> Choice<br />
Modell<strong>in</strong>g, Chapter 3 <strong>in</strong> Bennett and Blamey (2001).<br />
Bennett, J., and Blamey, R. (2001), The Choice Modell<strong>in</strong>g Approach to <strong>Environmental</strong><br />
<strong>Valuation</strong>, Edward Elgar Press, Cheltenham.<br />
Berry, P.M., Vanh<strong>in</strong>sbergh, D., Viles, H.A., Harrison, P.A., Pearson, R.G., Fuller, R.J., Butt,<br />
N. and Miller, F. (2001) <strong>Impacts</strong> on terrestrial environments. In: Climate Change and Nature<br />
Conservation <strong>in</strong> Brita<strong>in</strong> and Ireland: Modell<strong>in</strong>g natural resource responses to climate<br />
change (the MONARCH project), P.A. Harrison, P.M. Berry and T.P. Dawson, eds., UKCIP<br />
Technical Report, Oxford.<br />
Bowker, J.M. and D.D. Diychuck (1994), Estimat<strong>in</strong>g the Nonmarket Benefits <strong>of</strong> Agricultural<br />
Land Retention <strong>in</strong> Eastern Canada, Agricultural and Resource <strong>Economic</strong> Review 23:218-25.<br />
Bullock, C.H. and Kay, J. (1997), Preservation and Change <strong>in</strong> the Upland Landscape: The<br />
Public Benefits <strong>of</strong> Graz<strong>in</strong>g Management, Journal <strong>of</strong> <strong>Environmental</strong> Plann<strong>in</strong>g and<br />
Management 40(3):315-334<br />
CEH Wall<strong>in</strong>gford (2001), Climate change and water management: manag<strong>in</strong>g European water<br />
resources <strong>in</strong> an uncerta<strong>in</strong> future (ENV4 – CT98 – 0791) Work Package 7 – UK case study.<br />
Report to the European Community.<br />
Cumulus Consultants Ltd., Institute for European <strong>Environmental</strong> Policy and the Countryside<br />
and Countryside Research Unit (2005), Assessment <strong>of</strong> the impact <strong>of</strong> CAP Reform and other<br />
key policies on upland farms and land use implications <strong>in</strong> both Severely Disadvantaged &<br />
Disadvantaged Areas <strong>of</strong> England, report to the Department for Environment, Food and Rural<br />
Affairs<br />
Domencich, T. and McFadden, D. (1975): Urban travel demand: a behavioural approach.<br />
Amsterdam: North-Holland.<br />
Edwards-Jones, G., Edwards-Jones, E.S. and Mitchell, K. (1995), A comparison <strong>of</strong><br />
cont<strong>in</strong>gent valuation methodology and ecological assessment as techniques for<br />
eftec 64 January 2006
<strong>Economic</strong> <strong>Valuation</strong> <strong>of</strong> <strong>Environmental</strong> <strong>Impacts</strong> <strong>in</strong> the Severely Disadvantaged Areas<br />
<strong>in</strong>corporat<strong>in</strong>g ecological goods <strong>in</strong>to land use decisions, Journal <strong>of</strong> <strong>Environmental</strong> Plann<strong>in</strong>g &<br />
Management 38(2):215-230<br />
eftec and Entec (2002), The External Benefits <strong>of</strong> Undeveloped Land: a Review <strong>of</strong> the<br />
<strong>Economic</strong> Literature, report for the Department <strong>of</strong> Transport, Local Government and the<br />
Regions, available at http://www.odpm.gov.uk/<strong>in</strong>dex.asp?id=1145259<br />
eftec and Institute for European <strong>Environmental</strong> Policy (2004), Framework for<br />
<strong>Environmental</strong> Accounts for Agriculture, report to the Department for Environment, Food<br />
and Rural Affairs available at http://statistics.defra.gov.uk/esg/reports/envacc<br />
Environment Agency (2002), Agriculture and natural resources: benefits, costs and<br />
potential solutions, report by the Environment Agency available at<br />
http://www.environment-agency.gov.uk/aboutus/512398/516810/516841/578627/?lang=_e<br />
Freeman, A.M. (1993) The Measurement <strong>of</strong> <strong>Environmental</strong> and Resource Values: Theory and<br />
Methods, Resources for the Future, Wash<strong>in</strong>gton D.C.<br />
Georgiou, S., Bateman, I.H., Cole, M. and Hadley, D. (2000), Cont<strong>in</strong>gent Rank<strong>in</strong>g and<br />
<strong>Valuation</strong> <strong>of</strong> River Water Quality Improvements: test<strong>in</strong>g for scope, sensitivity, order<strong>in</strong>g and<br />
distance decay effects, CSERGE Work<strong>in</strong>g Paper GEC 2000-18, Centre for Social and<br />
<strong>Economic</strong> Research on the Global Environment, University <strong>of</strong> East Anglia and University<br />
College London.<br />
GFA-RACE Partners Ltd and IEEP (2003), The Potential <strong>Impacts</strong> <strong>of</strong> the CAP Reform<br />
Agreement, Department for the Environment, Food and Rural Affairs, London.<br />
Ha<strong>in</strong>es-Young, R.H., Barr, C.J., Black, H.I.J., Briggs, D.J., Bunce, R.G.H., Clarke, R.T.,<br />
Cooper, A., Dawson, F.H., Firbank, L.G., Fuller, R.M., Furse, M.T., Gillespie, M.K., Hill, R.,<br />
Hornung, M., Howard, D.C., McCann, T., Morecr<strong>of</strong>t, M.D., Petit, S., Sier, A.R.J., Smart,<br />
S.M., Smith, G.M., Stott, A.P., Stuart R.C., and Watk<strong>in</strong>s J.W. (2000), Account<strong>in</strong>g for<br />
Nature: Assess<strong>in</strong>g Habitats <strong>in</strong> the UK countryside, Department <strong>of</strong> the Environment,<br />
Transport and the Regions, London.<br />
Hanley, N., Adamowicz V. and Wright, R.(2005) Price vector effects <strong>in</strong> choice experiments:<br />
an empirical test<strong>in</strong>g, Resource & Energy <strong>Economic</strong>s, 27(3):227-234.<br />
Hanley, N., MacMillan, D., Wright, R.E., Bullock, C., Simpson, I., Parsisson, D. and<br />
Crabtree, B. (1998), Cont<strong>in</strong>gent <strong>Valuation</strong> Versus Choice Experiments: Estimat<strong>in</strong>g the<br />
Benefits <strong>of</strong> <strong>Environmental</strong>ly Sensitive Areas <strong>in</strong> Scotland, Journal <strong>of</strong> Agricultural <strong>Economic</strong>s<br />
49(1):1-15<br />
Harrison, P.A., Berry, P.M. and Dawson, T.P. (2001), Climate Change and Nature<br />
Conservation <strong>in</strong> Brita<strong>in</strong> and Ireland: Modell<strong>in</strong>g natural resource responses to climate<br />
change (the MONARCH project): Summary Report, UK Climate <strong>Impacts</strong> Program, Oxford.<br />
Hausman, J., Wise, D., (1978), A conditional probit model for qualitative choice: discrete<br />
decisions recogniz<strong>in</strong>g <strong>in</strong>terdependence and heterogeneous preferences, Econometrica<br />
42:403–426.<br />
Hausman, J., McFadden, D., (1984), Specification tests for the mult<strong>in</strong>omial logit model,<br />
Econometrica 52:1219–1240.<br />
Hensher, D. and Green W. (1999), Nested logit model estimation: clarify<strong>in</strong>g the rules for<br />
model estimation, Institute <strong>of</strong> Transport Studies, University <strong>of</strong> Sydney.<br />
HM Treasury (2003), The Green Book: Appraisal and Evaluation <strong>in</strong> Central Government, Her<br />
Majesty’s Stationery Office.<br />
eftec 65 January 2006
<strong>Economic</strong> <strong>Valuation</strong> <strong>of</strong> <strong>Environmental</strong> <strong>Impacts</strong> <strong>in</strong> the Severely Disadvantaged Areas<br />
Holman, I.P., Loveland, P.J., Nicholls, R.J., Shackley, S., Berry, P.M., Rounsevell, M.D.A.,<br />
Audsley, E., Harrison, P.A. and Wood, R. (2002), REGIS – Regional Climate Change Impact<br />
Response Studies <strong>in</strong> East Anglia and North West England, UK Climate <strong>Impacts</strong> Program,<br />
Oxford.<br />
Hulme, M., Jenk<strong>in</strong>s, G.J., Lu, X., Turnpenny, J.R., Mitchell, T.D., Jones, R.G., Lowe, J.,<br />
Murphy, J.M., Hassell, D., Boorman, P., McDonald, R. and Hill, S. (2002), Climate Change<br />
Scenarios for the United K<strong>in</strong>gdom: The UKCIP02 Scientific Report, Tyndall Centre for<br />
Climate Change Research, School <strong>of</strong> <strong>Environmental</strong> Sciences, University <strong>of</strong> East Anglia,<br />
Norwich<br />
IEEP, GHK Consult<strong>in</strong>g and Land Use Consultants (2004), An Assessment <strong>of</strong> the <strong>Impacts</strong> <strong>of</strong><br />
Hill Farm<strong>in</strong>g <strong>in</strong> England on the <strong>Economic</strong> and Social Susta<strong>in</strong>ability <strong>of</strong> the Uplands and More<br />
Widely. Vol. 1: Ma<strong>in</strong> Report, Department for the Environment, Food and Rural Affairs,<br />
London.<br />
IERM/SAC (1999), Estimat<strong>in</strong>g the Value <strong>of</strong> <strong>Environmental</strong> Features, Report for the M<strong>in</strong>istry<br />
for Agriculture, Fisheries and Food available at:<br />
http://statistics.defra.gov.uk/esg/reports/envfeat<br />
IERM/SAC (2001), Estimat<strong>in</strong>g the Value <strong>of</strong> <strong>Environmental</strong> Features: Stage Two, Report for<br />
the M<strong>in</strong>istry for Agriculture, Fisheries and Food available at:<br />
http://statistics.defra.gov.uk/esg/reports/envfeat<br />
Kr<strong>in</strong>sky, I. and Robb, A.L. (1986), On Approximat<strong>in</strong>g the Statistical Properties <strong>of</strong><br />
Elasticities, Review <strong>of</strong> <strong>Economic</strong>s and Statistics 68:715-719.<br />
Louiviere J.L., Hensher D.A and J.D. Swait (2000) Stated Choice Models: analysis and<br />
application, Cambridge University Press.<br />
Luce, R.D., (1959), Individual Choice Behaviour: a Theoretical Analysis, Wiley, New York.<br />
Mitchell, R.C. and R.T. Carson (1989), Us<strong>in</strong>g Surveys to Value Public Goods: The Cont<strong>in</strong>gent<br />
<strong>Valuation</strong> Method. Baltimore: John Hopk<strong>in</strong>s University Press.<br />
Oglethorpe, D. (2005), <strong>Environmental</strong> Landscape Features (ELF) Model Update, Report for<br />
the Department for Environment, Food and Rural Affairs<br />
Price, D.J. and McKenna, J.E. (2003), Climate Change: Review <strong>of</strong> Levels <strong>of</strong> Protection<br />
Offered by Flood Prevention Schemes UKCIP02 Update, Environment Group Research Report<br />
2003/05, Scottish Executive, Ed<strong>in</strong>burgh.<br />
Shelby, B. and Harris, R. (1985), Compar<strong>in</strong>g methods for determ<strong>in</strong><strong>in</strong>g visitor evaluations <strong>of</strong><br />
ecological impacts: site visits, photos and written descriptions, Journal <strong>of</strong> Leisure Research<br />
17:57-67.<br />
Tra<strong>in</strong>, K., (1998), Recreation demand models with taste differences over people, Land<br />
<strong>Economic</strong>s 74:230–239.<br />
Tra<strong>in</strong>, K., (2003), Discrete Choice Models with Simulation, Cambridge University Press,<br />
Cambridge.<br />
White, P.C.L. and Lovett, J.C. (1998), Public Preferences and Will<strong>in</strong>gness-to-Pay for Nature<br />
Conservation <strong>in</strong> the North York Moors National Park, UK, Journal <strong>of</strong> <strong>Environmental</strong><br />
Management 55:1-13<br />
Willis, K.G. and Garrod, G.D. (1993), Valu<strong>in</strong>g landscapes - a cont<strong>in</strong>gent valuation approach,<br />
Journal <strong>of</strong> <strong>Environmental</strong> Management 37(1):1-22<br />
eftec 66 January 2006
<strong>Economic</strong> <strong>Valuation</strong> <strong>of</strong> <strong>Environmental</strong><br />
<strong>Impacts</strong> <strong>in</strong> the Severely Disadvantaged<br />
Areas<br />
F<strong>in</strong>al Report – Annexes 1-4<br />
3 rd January 2006<br />
<strong>Economic</strong>s For The Environment Consultancy Ltd (eftec) 16 Percy Street London W1T<br />
1DT, tel: 02075805383, fax: 02075805385, eftec@eftec.co.uk, www.eftec.co.uk
<strong>Economic</strong> <strong>Valuation</strong> <strong>of</strong> <strong>Environmental</strong> <strong>Impacts</strong> <strong>in</strong> the Severely Disadvantaged Areas<br />
Annexes<br />
Table <strong>of</strong> Contents<br />
ANNEX 1 – FINAL FOCUS GROUP PROTOCOL ........................................................1<br />
ANNEX 2 – FOCUS GROUP REPORT ....................................................................6<br />
A2.1 OVERVIEW ......................................................................................... 6<br />
A2.2 FOCUS GROUP 1 FINDINGS ......................................................................... 7<br />
A2.3 FOCUS GROUP 2 FINDINGS ......................................................................... 8<br />
A2.4 FOCUS GROUP 3 FINDINGS ......................................................................... 9<br />
A2.5 MAIN FINDINGS....................................................................................10<br />
ANNEX 3 - PILOT SURVEY REPORT .................................................................. 13<br />
A3.1 INTRODUCTION ....................................................................................13<br />
A3.2 MAIN RESULTS ....................................................................................14<br />
A3.3 LESSONS FOR THE MAIN SURVEY ...................................................................17<br />
ANNEX 4 - FINAL QUESTIONNAIRE................................................................... 19<br />
eftec A-i January 2006
<strong>Economic</strong> <strong>Valuation</strong> <strong>of</strong> <strong>Environmental</strong> <strong>Impacts</strong> <strong>in</strong> the Severely Disadvantaged Areas<br />
Annex 1 - Focus Group Protocol<br />
Annex 1 – F<strong>in</strong>al Focus Group Protocol<br />
Introductions: Participants and discussion topic<br />
• Introduction<br />
o Good even<strong>in</strong>g and welcome to the session today. Thank you for tak<strong>in</strong>g the<br />
time to jo<strong>in</strong> our discussion on a topic <strong>of</strong> environmental <strong>in</strong>terest.<br />
o My name is Stavros, I work at the University <strong>of</strong> East Anglia. My colleague is<br />
Helen from eftec, an environmental consultancy.<br />
• Inform about purpose <strong>of</strong> focus group<br />
o Part <strong>of</strong> a government funded research project we are currently work<strong>in</strong>g on.<br />
o We are hold<strong>in</strong>g a series <strong>of</strong> discussions such as today’s to help us understand<br />
public attitudes towards environmental features.<br />
o Basically we are here to learn from you and your discussion!<br />
• Instructions for the group<br />
o Lots <strong>of</strong> issues to discuss, so we will have refreshments as we go along<br />
rather than take a break!<br />
o We would like everyone to participate, with no-one dom<strong>in</strong>at<strong>in</strong>g the<br />
discussion. We want to hear as many different th<strong>in</strong>gs from as many <strong>of</strong> you<br />
as time allows.<br />
o There really are no right or wrong answers, we are here to learn from<br />
your views and experiences.<br />
o If your experience/op<strong>in</strong>ion is different from what others are say<strong>in</strong>g, please<br />
let us know as that is valuable <strong>in</strong>formation.<br />
o On the other hand, if you th<strong>in</strong>k your experience is just like everyone<br />
else’s that is still important <strong>in</strong>formation for us and we want to hear your<br />
story. There is always someth<strong>in</strong>g unique to each person’s own<br />
experience/views.<br />
• We will be on a first name basis tonight and <strong>in</strong> our reports no names will be<br />
attached to comments. You may be assured <strong>of</strong> complete confidentiality.<br />
• We would like to record the session: it will help us a lot to register your views <strong>in</strong><br />
an accurate way.<br />
o As we are record<strong>in</strong>g the session please try to speak one at a time and no<br />
side conversations between neighbours please!<br />
• Please turn <strong>of</strong>f your mobiles at this po<strong>in</strong>t.<br />
• The discussion should last 1.5 hours.<br />
• Open<strong>in</strong>g / ice-breaker question: Ask participants to briefly <strong>in</strong>troduce themselves<br />
– Name, occupation, any children, how long have l<strong>in</strong>ed <strong>in</strong> the area, etc.<br />
eftec A- 1<br />
January 2006
<strong>Economic</strong> <strong>Valuation</strong> <strong>of</strong> <strong>Environmental</strong> <strong>Impacts</strong> <strong>in</strong> the Severely Disadvantaged Areas<br />
Annex 1 - Focus Group Protocol<br />
Discussion po<strong>in</strong>ts<br />
A. Visits to the countryside<br />
1. Do you visit the countryside near here or elsewhere <strong>in</strong> England and if so for what<br />
purpose? (Bra<strong>in</strong>storm<strong>in</strong>g)<br />
� Flipchart: list events mentioned<br />
A ‘check-list’ <strong>of</strong> activities could <strong>in</strong>clude: hill-walk<strong>in</strong>g / rambl<strong>in</strong>g<br />
Fish<strong>in</strong>g / bird-watch<strong>in</strong>g / other nature observation / cycl<strong>in</strong>g (esp. mounta<strong>in</strong>-bik<strong>in</strong>g?) /<br />
just enjoy<strong>in</strong>g scenery or peace and quiet <strong>in</strong> an <strong>in</strong>active way / pa<strong>in</strong>t<strong>in</strong>g / photography /<br />
water sports / rock-climb<strong>in</strong>g / tour<strong>in</strong>g <strong>in</strong> car / other<br />
1<br />
a. Of the activities listed, which would you say is the most important to you and<br />
the second most important?<br />
b. Approximately how <strong>of</strong>ten do you visit the countryside around here?<br />
B. SDA specific discussion<br />
What we would like to discuss <strong>in</strong> the next little while concerns the areas shaded<br />
p<strong>in</strong>k <strong>in</strong> these two maps.<br />
� SHOW the map <strong>of</strong> England with SDA areas and the map <strong>of</strong> the GO region,<br />
on which the hill areas and SDAs are shaded us<strong>in</strong>g different colours and<br />
the location <strong>of</strong> the FG is marked.<br />
� Show pictures <strong>of</strong> Lake and Peak Districts<br />
2. How familiar are you, if at all, with areas shaded on these maps (England and the<br />
GO Region)? How would you describe them? (Bra<strong>in</strong>storm<strong>in</strong>g)<br />
� Flipchart: list expressions, thoughts<br />
3. How familiar are you with this area <strong>of</strong> the Yorkshire Dales which Helen is <strong>in</strong>dicat<strong>in</strong>g<br />
compared to the rest <strong>of</strong> the Yorkshire Dales?<br />
� <strong>in</strong>dicate bit <strong>of</strong> the Yorkshire Dales <strong>in</strong> NW GOR<br />
(note – this question was test<strong>in</strong>g whether participants could identify parts <strong>of</strong> trans-boundary<br />
SDAs <strong>in</strong> their own GOR more than the parts <strong>in</strong> other GORs. A Peak District example was used<br />
<strong>in</strong> Manchester)<br />
eftec A- 2<br />
January 2006
<strong>Economic</strong> <strong>Valuation</strong> <strong>of</strong> <strong>Environmental</strong> <strong>Impacts</strong> <strong>in</strong> the Severely Disadvantaged Areas<br />
Annex 1 - Focus Group Protocol<br />
4. These p<strong>in</strong>k areas are called ‘severely disadvantaged areas’ because farm<strong>in</strong>g is much<br />
more difficult than <strong>in</strong> the lowlands, and because they are less accessible by<br />
transport.<br />
a. Approximately how <strong>of</strong>ten do you visit other SDAs <strong>in</strong> the North West<br />
beyond the Lake District?<br />
b. What for?<br />
c. Do you visit SDAs <strong>in</strong> other regions?<br />
d. Are you familiar with the blue areas on the fr<strong>in</strong>ges <strong>of</strong> the p<strong>in</strong>k areas? [if<br />
familiar] What are the differences? Can you describe what they are?<br />
(note – test<strong>in</strong>g recognition <strong>of</strong> Disadvantaged Areas)<br />
5. Th<strong>in</strong>k<strong>in</strong>g only <strong>of</strong> the SDAs (the shaded areas on the map) <strong>in</strong> the NW region, what do<br />
you th<strong>in</strong>k is attractive or unattractive about these?<br />
� Flipchart: list expressions, thoughts<br />
6. These (SDA) areas have been used for farm<strong>in</strong>g for a very long time. I’d like to<br />
discuss the impacts that these uses have had on the land?<br />
a. In your view, what are the positive impacts that farm<strong>in</strong>g might have had<br />
on the environment <strong>in</strong> SDAs (shaded areas on the map)? (Bra<strong>in</strong>storm<strong>in</strong>g)<br />
� Flipchart: list<br />
b. In your view, what are the negative impacts that farm<strong>in</strong>g might have had<br />
on the environment <strong>in</strong> (SDAs – shaded areas on the map)? (Bra<strong>in</strong>storm<strong>in</strong>g)<br />
� Flipchart: list<br />
c. If farm<strong>in</strong>g stopped or was significantly reduced <strong>in</strong> these areas, what effect do<br />
you th<strong>in</strong>k that would have?<br />
7. Do you th<strong>in</strong>k there are any particular issues concern<strong>in</strong>g these areas <strong>in</strong> your own<br />
region (SDA) that require changes <strong>in</strong> government policy or require government<br />
support? If there are, what are these?<br />
� Flipchart: list aspects that require policy change or support<br />
8. Do you have any questions about the <strong>in</strong>formation presented so far? Has the<br />
discussion been clear?<br />
C. Attributes section<br />
9. Helen will now pass out some cards.<br />
� Distribute attribute cards<br />
eftec A- 3<br />
January 2006
<strong>Economic</strong> <strong>Valuation</strong> <strong>of</strong> <strong>Environmental</strong> <strong>Impacts</strong> <strong>in</strong> the Severely Disadvantaged Areas<br />
Annex 1 - Focus Group Protocol<br />
The cards have some <strong>of</strong> the different features associated with hill farm<strong>in</strong>g areas written<br />
on them. Please sort these cards <strong>in</strong> order <strong>of</strong> how important each feature is to you, how<br />
much each feature adds or would add to your enjoyment or appreciation <strong>of</strong> upland<br />
areas. We have some pictures show<strong>in</strong>g some <strong>of</strong> these features to help you.<br />
Is there anyth<strong>in</strong>g written on the cards that isn’t clear?<br />
� Distribute pictures<br />
� Give them a few m<strong>in</strong>utes to do this.<br />
� Helen to distribute bits <strong>of</strong> paper and ask each to note ranks – also to<br />
write their names on<br />
10. Now please keep your top five cards and put the rest to one side. We are <strong>in</strong>terested<br />
<strong>in</strong> f<strong>in</strong>d<strong>in</strong>g out how you would allocate public money to these features if you were <strong>in</strong><br />
charge <strong>of</strong> spend<strong>in</strong>g decisions to protect them.<br />
We are go<strong>in</strong>g to give you twenty counters each.<br />
� Helen to hand out counters<br />
Imag<strong>in</strong>e that your twenty counters represent a sum <strong>of</strong> public money which you can<br />
distribute towards protect<strong>in</strong>g the five features you have chosen. Please allocate your<br />
counters between your features. However, please only consider your personal feel<strong>in</strong>gs<br />
on these features, without try<strong>in</strong>g to second guess what you would need to do to keep<br />
other people happy.<br />
� Ask each to note counter scores on their bits <strong>of</strong> paper<br />
� Helen to collect cards<br />
11. In pr<strong>in</strong>ciple, are you will<strong>in</strong>g to pay towards subsidis<strong>in</strong>g farmers <strong>in</strong> upland areas to<br />
provide some <strong>of</strong> the environmental benefits that we have been discuss<strong>in</strong>g?<br />
12. Through what mechanism could such a payment be made?<br />
13. How credible/clear were these questions on rank<strong>in</strong>g and allocat<strong>in</strong>g money? Was<br />
there anyth<strong>in</strong>g that was not clear or confus<strong>in</strong>g?<br />
eftec A- 4<br />
January 2006
<strong>Economic</strong> <strong>Valuation</strong> <strong>of</strong> <strong>Environmental</strong> <strong>Impacts</strong> <strong>in</strong> the Severely Disadvantaged Areas<br />
Annex 1 - Focus Group Protocol<br />
D. Follow up questions<br />
14. For those who were will<strong>in</strong>g to pay someth<strong>in</strong>g: can you tell me your ma<strong>in</strong> reasons for<br />
agree<strong>in</strong>g to pay?<br />
15. If you were NOT prepared to pay anyth<strong>in</strong>g: can you tell me why you were not<br />
prepared to pay anyth<strong>in</strong>g?<br />
TO ALL:<br />
16. When you were rank<strong>in</strong>g the features <strong>in</strong> order <strong>of</strong> importance, what k<strong>in</strong>d <strong>of</strong> factors<br />
were you consider<strong>in</strong>g?<br />
17. Did you th<strong>in</strong>k that any <strong>of</strong> the features were not at all important?<br />
18. When you were choos<strong>in</strong>g to allocate public money to protect<strong>in</strong>g the different<br />
features, what k<strong>in</strong>d <strong>of</strong> factors were you consider<strong>in</strong>g?<br />
19. [If cultural heritage appears to be important] When you hear the phrase ‘cultural<br />
heritage’ applied to hill farm<strong>in</strong>g areas, what does this mean to you?<br />
20. Do you th<strong>in</strong>k we could have told you about other features? If so, what are these?<br />
Non-use question<br />
21. How would you have responded to the question ask<strong>in</strong>g if you were will<strong>in</strong>g to pay if<br />
we asked you about similar areas elsewhere <strong>in</strong> the country?<br />
If their answers would be the same, this would be sign <strong>of</strong> embedd<strong>in</strong>g. You need to<br />
ask why they would not change their answers. If their answers would be different,<br />
ask why?<br />
That is the end <strong>of</strong> our discussion!<br />
Thank you very much for your participation and for shar<strong>in</strong>g your views with us.<br />
eftec A- 5<br />
January 2006
<strong>Economic</strong> <strong>Valuation</strong> <strong>of</strong> <strong>Environmental</strong> <strong>Impacts</strong> <strong>in</strong> the Severely Disadvantaged Areas<br />
Annex 2 – Focus Group Report<br />
Annex 2 – Focus Group Report<br />
A2.1 Overview<br />
This is a report on the focus groups conducted as part <strong>of</strong> a stated preference analysis<br />
undertaken by eftec, with Carrick James Market Research, for the Department <strong>of</strong><br />
Environment, Food and Rural Affairs. The overall aim <strong>of</strong> the analysis is to provide an<br />
economic measure <strong>of</strong> the environmental impacts <strong>of</strong> hill-farm<strong>in</strong>g <strong>in</strong> Severely Disadvantaged<br />
Areas. This report is accompanied by an <strong>in</strong>itial report, which further details the policy<br />
background and overall study approach.<br />
Focus groups are semi-structured discussions led by a moderator among a small group <strong>of</strong><br />
participants, typically six to eight people. The moderator uses a script called the ‘protocol’<br />
to guide the discussion and thereby ga<strong>in</strong> <strong>in</strong>sights about the issue at hand as well as <strong>in</strong>form<br />
particular questionnaire design characteristics. Focus groups are the most important<br />
qualitative research procedure and an essential stage <strong>in</strong> the design <strong>of</strong> a stated preference<br />
survey. The participants <strong>of</strong> focus groups are paid and are normally chosen to be<br />
homogenous on particular characteristics. In this case socio-economic group, age and<br />
location <strong>of</strong> residence <strong>in</strong> the North West Government Office Region were the def<strong>in</strong><strong>in</strong>g<br />
characteristics <strong>of</strong> groups. Overall the three focus groups cover the range <strong>of</strong> characteristics.<br />
Three focus groups were undertaken between the 21 st and the 23 rd <strong>of</strong> June 2005, one <strong>in</strong><br />
Manchester and two <strong>in</strong> Kendal. The focus group locations and socio-economic details <strong>of</strong> the<br />
focus-group attendees are provided <strong>in</strong> Table A2.1. Each was moderated by Stavros Georgiou<br />
<strong>of</strong> the University <strong>of</strong> East Anglia with assistance from Helen Johns <strong>of</strong> eftec.<br />
Table A2.1: Focus Group Participants and Logistics<br />
Groups 1. Manchester 2. Kendal 3. Kendal<br />
Number <strong>of</strong><br />
participants<br />
8 8 6<br />
Gender 5F 3M 4F 4M 4F 2M<br />
Age 18-51 18-40 40-65<br />
Socio-economic<br />
group<br />
BC1C2 ABC1 C2DE<br />
Date 21/06/05 22/06/05 23/06/05<br />
Time 19:00 19:30 19:30<br />
Moderator Stavros Georgiou assisted by Helen Johns<br />
The learn<strong>in</strong>g process from focus groups is iterative, and means that the focus group<br />
protocol should be altered between groups to reflect what was learnt from the previous<br />
group and to either ref<strong>in</strong>e the design or to test different aspects <strong>of</strong> design <strong>in</strong> subsequent<br />
groups. Sections 2 to 4 <strong>of</strong> this report describe the key f<strong>in</strong>d<strong>in</strong>gs from each <strong>of</strong> the focus<br />
groups and changes made to subsequent protocols. The ma<strong>in</strong> f<strong>in</strong>d<strong>in</strong>gs are provided <strong>in</strong><br />
Section 5.<br />
The f<strong>in</strong>alized version <strong>of</strong> the protocol for the focus groups is provided <strong>in</strong> the previous Annex.<br />
However, the protocol can be briefly summarised as follows. The first section <strong>in</strong>vited<br />
participants to talk very generally about their visits to the English countryside. The second<br />
section <strong>in</strong>troduced the SDAs, asked participants to describe them, say what they found<br />
attractive and unattractive about them, and discuss the impacts <strong>of</strong> farm<strong>in</strong>g on the<br />
landscape and environment. The third section consisted <strong>of</strong> an experiment whereby<br />
participants were asked to rank a long list <strong>of</strong> upland attributes <strong>in</strong> order <strong>of</strong> how much they<br />
contributed to their appreciation/enjoyment <strong>of</strong> upland areas. They were then asked to<br />
allocate twenty counters (represent<strong>in</strong>g a sum <strong>of</strong> public money) between their top five<br />
ranked attributes. They were also asked whether they were, <strong>in</strong> pr<strong>in</strong>ciple, <strong>in</strong> favour <strong>of</strong><br />
eftec A- 6<br />
January 2006
<strong>Economic</strong> <strong>Valuation</strong> <strong>of</strong> <strong>Environmental</strong> <strong>Impacts</strong> <strong>in</strong> the Severely Disadvantaged Areas<br />
Annex 2 – Focus Group Report<br />
subsidiz<strong>in</strong>g hill-farm<strong>in</strong>g. The f<strong>in</strong>al section consisted <strong>of</strong> follow up questions, ask<strong>in</strong>g<br />
participants what had been on their m<strong>in</strong>ds <strong>in</strong> the previous section.<br />
Lessons learned from the focus groups will be <strong>in</strong>strumental <strong>in</strong> arriv<strong>in</strong>g at the questionnaire<br />
design that enters <strong>in</strong>to the pilot survey test<strong>in</strong>g phase <strong>in</strong> the week beg<strong>in</strong>n<strong>in</strong>g the 4th <strong>of</strong> July.<br />
A2.2 Focus Group 1 F<strong>in</strong>d<strong>in</strong>gs<br />
A2.2.1 Summary po<strong>in</strong>ts from Focus Group 1<br />
Overall the first focus group discussion went well. Participants expressed a strong<br />
familiarity with and appreciation <strong>of</strong> the countryside <strong>in</strong> the North West GOR (as well as the<br />
Peak District), and mentioned the Lake District as a favourite dest<strong>in</strong>ation without<br />
prompt<strong>in</strong>g. When shown the map <strong>of</strong> SDAs <strong>in</strong> England, participants had very positive<br />
associations with the areas shown, mention<strong>in</strong>g factors such as their lack <strong>of</strong> development,<br />
purity, beauty and peace and quiet. A wide range <strong>of</strong> outdoor activities <strong>in</strong> SDAs were<br />
engaged <strong>in</strong> fairly regularly; the SDAs were very much the areas that participants had <strong>in</strong><br />
m<strong>in</strong>d when talk<strong>in</strong>g about their use <strong>of</strong> the countryside. However, familiarity with SDAs <strong>in</strong><br />
other parts <strong>of</strong> England seemed to tail <strong>of</strong>f with reduced accessibility, with hardly any<br />
participants familiar with the South Western SDAs.<br />
The ma<strong>in</strong> difficulty was try<strong>in</strong>g to get participants to narrow down what they found<br />
attractive about the SDAs. They saw the landscape as an <strong>in</strong>divisible good, and did not<br />
mention particular landscape features (apart from obvious geographical features such as<br />
mounta<strong>in</strong>s, lakes and reservoirs) unprompted. The impacts <strong>of</strong> farm<strong>in</strong>g generally had<br />
negative (but <strong>in</strong>visible) associations, such as pesticides and soil nutrient depletion;<br />
however, the participants also acknowledged that farm<strong>in</strong>g had preserved the land from<br />
development. It was considered that if upland farm<strong>in</strong>g were stopped or reduced that this<br />
would benefit wildlife and lead to a more natural, more rugged look, which was preferred<br />
to landscapes which seemed more man-made.<br />
When we asked the participants to rank the long list <strong>of</strong> attributes, we found that the most<br />
popular attributes (on average and <strong>in</strong> order) were field boundaries, water quality, rough<br />
grassland, cultural heritage and water quantity. There was not unanimity on which<br />
attributes were preferred. Some attributes, such as hay meadows, heather moorland and<br />
coniferous woodland were deemed attractive by some but ranked lowly by others. The only<br />
universally unpopular feature was improved grassland. This may have been prejudiced by<br />
earlier discussion where some participants said that they couldn’t see why it was called<br />
‘improved’ grassland compared to rough grassland, which was deemed more naturallook<strong>in</strong>g,<br />
and therefore preferable. Arable and gorse were not universally unpopular, but<br />
were the only other two attributes not to appear <strong>in</strong> anyone’s top five. Although the concept<br />
<strong>of</strong> carbon sequestration was expla<strong>in</strong>ed, it was only ranked <strong>in</strong> the top five by the one person<br />
with prior knowledge <strong>of</strong> the concept. Broadleaf woodland was not much preferred to<br />
coniferous woodland on average, but unlike coniferous woodland, was not as actively<br />
disliked.<br />
In terms <strong>of</strong> spend<strong>in</strong>g allocation, field boundaries, water quality and water quantity each<br />
attracted between an eighth and a sixth <strong>of</strong> the total pot. However, carbon storage,<br />
broadleaf woodland and water quantity were all valued highly by those who chose them.<br />
Cultural heritage was def<strong>in</strong>ed by participants to mean old build<strong>in</strong>gs (not necessarily just<br />
agricultural build<strong>in</strong>gs), landscapes, <strong>in</strong>tact rural communities with an alternative outlook<br />
and different way <strong>of</strong> life, and local dialects. Very early on <strong>in</strong> the discussion participants<br />
mentioned visit<strong>in</strong>g National Trust properties as someth<strong>in</strong>g they liked to do <strong>in</strong> the<br />
countryside, <strong>in</strong>dicat<strong>in</strong>g that cultural heritage is an important factor <strong>in</strong> their enjoyment.<br />
Participants were emphatically not amenable to the idea <strong>of</strong> pay<strong>in</strong>g higher taxes to protect<br />
upland areas. However, they emphasized that this was not because they did not th<strong>in</strong>k that<br />
eftec A- 7<br />
January 2006
<strong>Economic</strong> <strong>Valuation</strong> <strong>of</strong> <strong>Environmental</strong> <strong>Impacts</strong> <strong>in</strong> the Severely Disadvantaged Areas<br />
Annex 2 – Focus Group Report<br />
it was important to spend money on protect<strong>in</strong>g upland areas – but because <strong>of</strong> a resistance<br />
to contribut<strong>in</strong>g more to central fund<strong>in</strong>g. Some participants said they would be will<strong>in</strong>g to<br />
pay <strong>in</strong>to a very specific local scheme; others said that voluntary payments to bodies such as<br />
the National Trust should pay for it, or that upland areas should pay for themselves.<br />
A2.2.2 Suggested changes to the next protocol<br />
This version <strong>of</strong> the protocol had two separate questions ask<strong>in</strong>g participants (a) what was<br />
attractive or unattractive about SDAs <strong>in</strong> the NW and (b) ask<strong>in</strong>g them to identify the<br />
“positive” and “negative” aspects <strong>of</strong> the environment <strong>in</strong> SDAs, draw<strong>in</strong>g them towards<br />
farm<strong>in</strong>g impacts if necessary. We found that this second question did not draw anyth<strong>in</strong>g<br />
more specific than the general impressions found <strong>in</strong> the first, so we altered it to ask more<br />
specifically and directly about the positive and negative impacts <strong>of</strong> farm<strong>in</strong>g.<br />
We also changed the question about taxation. This previously asked participants whether,<br />
<strong>in</strong> pr<strong>in</strong>ciple, they would be will<strong>in</strong>g to see their taxes <strong>in</strong>crease to pay for the environmental<br />
benefits we had been discuss<strong>in</strong>g. This drew such an immediate and strongly negative<br />
response that it was likely that participants were envisag<strong>in</strong>g a fairly large and/or arbitrary<br />
tax <strong>in</strong>crease (e.g. a penny on <strong>in</strong>come tax). We changed the question to ask (a) whether <strong>in</strong><br />
pr<strong>in</strong>ciple participants were will<strong>in</strong>g to subsidise upland farmers and if so (b) what k<strong>in</strong>d <strong>of</strong><br />
payment mechanisms would be acceptable to them.<br />
A2.3 Focus Group 2 F<strong>in</strong>d<strong>in</strong>gs<br />
A2.3.1 Summary po<strong>in</strong>ts from Focus Group 2<br />
The pr<strong>in</strong>ciple differences between Focus Groups 1 and 2 were that Focus Group 2 actually<br />
lived <strong>in</strong> an SDA and were more affluent. Due to their location, the participants engaged <strong>in</strong><br />
recreation <strong>in</strong> SDAs (specifically the Lake District) much more regularly. Other SDAs <strong>in</strong> the<br />
North West were visited fairly regularly, and those much further afield only rarely. Their<br />
descriptions <strong>of</strong> the characteristics <strong>of</strong> SDAs (“hilly”, “rural”, “less accessible”, “wild”),<br />
while still appreciative, were less enthusiastically positive than those <strong>in</strong> Manchester,<br />
presumably because <strong>of</strong> the lack <strong>of</strong> contrast with their own surround<strong>in</strong>gs.<br />
Consideration <strong>of</strong> the impacts <strong>of</strong> farm<strong>in</strong>g drew both positive and negative responses.<br />
Participants were much more aware that farm<strong>in</strong>g affects the look <strong>of</strong> the landscape, and<br />
mentioned the impact <strong>of</strong> sheep graz<strong>in</strong>g on keep<strong>in</strong>g areas “open”, i.e. not obscured by<br />
woodland, unprompted. They also mentioned dry stone walls unprompted. Other positive<br />
impacts mentioned were local food production, keep<strong>in</strong>g development at bay, and<br />
ma<strong>in</strong>ta<strong>in</strong><strong>in</strong>g cultural identity. However, some conceded that farm<strong>in</strong>g could also sometimes<br />
have a negative visual impact; pesticide pollution and reduced water quality were also<br />
mentioned as negative impacts. The prospect <strong>of</strong> reduced farm<strong>in</strong>g drew a much more<br />
concerned response – participants were very aware <strong>of</strong> how that would affect the identity,<br />
employment prospects and community structure <strong>of</strong> their area.<br />
In terms <strong>of</strong> rank<strong>in</strong>g, the most popular attributes (<strong>in</strong> terms <strong>of</strong> average rank) were water<br />
quality, field boundaries, broadleaf woodland, rough grassland and heather moorland and<br />
bog, represent<strong>in</strong>g an overlap <strong>of</strong> three attributes with the previous group. There were no<br />
features that were universally unpopular; arable and improved grassland were jo<strong>in</strong>tly least<br />
popular. Water quality and cultural heritage both attracted about 20% <strong>of</strong> the public<br />
spend<strong>in</strong>g scores, with field boundaries, broadleaf woodland and carbon sequestration each<br />
attract<strong>in</strong>g about 10%. Aga<strong>in</strong>, carbon sequestration was highly valued by one or two<br />
environmentally-conscious <strong>in</strong>dividuals. Participants commented that they found it difficult<br />
to rank those attributes which they didn’t much care about.<br />
eftec A- 8<br />
January 2006
<strong>Economic</strong> <strong>Valuation</strong> <strong>of</strong> <strong>Environmental</strong> <strong>Impacts</strong> <strong>in</strong> the Severely Disadvantaged Areas<br />
Annex 2 – Focus Group Report<br />
Cultural heritage was partly valued so highly because one participant allocated all twenty<br />
<strong>of</strong> her counters to it, declar<strong>in</strong>g that to her the phrase cultural heritage was an umbrella<br />
term that encompassed all <strong>of</strong> the other attributes. However other people’s def<strong>in</strong>itions <strong>of</strong><br />
cultural heritage were less all-encompass<strong>in</strong>g, mention<strong>in</strong>g components such as “the farm<strong>in</strong>g<br />
way <strong>of</strong> life”, farm build<strong>in</strong>gs and dry stone walls.<br />
Participants agreed <strong>in</strong> pr<strong>in</strong>ciple with spend<strong>in</strong>g public money on subsidiz<strong>in</strong>g hill farmers<br />
(subject to controls), but the attitudes towards taxation were markedly different from the<br />
Manchester group. Participants were much more supportive <strong>of</strong> fund<strong>in</strong>g through national<br />
taxation, and felt that a more localized tax would unfairly penalize them for liv<strong>in</strong>g on the<br />
edges <strong>of</strong> what they viewed as a national asset. They also suggested lottery money and taxes<br />
on supermarkets and visitors to the national park as payment mechanisms which would be<br />
acceptable to them. They were slightly less <strong>in</strong>cl<strong>in</strong>ed to subsidise SDAs further afield than<br />
those nearer home, but this concern was m<strong>in</strong>or compared to their preference for a national<br />
fund<strong>in</strong>g mechanism.<br />
A2.3.2 Suggested changes to the next Protocol<br />
It was felt that both the questions and the rank<strong>in</strong>g/scor<strong>in</strong>g exercises had gone well <strong>in</strong> this<br />
focus group, and that no further changes to the protocol were necessary.<br />
A2.4 Focus Group 3 F<strong>in</strong>d<strong>in</strong>gs<br />
A2.4.1 Summary po<strong>in</strong>ts from Focus Group 3<br />
The third focus group differed <strong>in</strong> that they were <strong>in</strong> general less affluent and on average<br />
older than either <strong>of</strong> the previous two, had the longest experience <strong>of</strong> liv<strong>in</strong>g <strong>in</strong> an SDA, and<br />
had more personal contact with hill farmers (either socially or pr<strong>of</strong>essionally). The<br />
participants naturally were very familiar with the Lake District, but were less familiar than<br />
other groups with other SDAs <strong>in</strong> the North West and other regions. Be<strong>in</strong>g older, they were<br />
also less physically active, and the group conta<strong>in</strong>ed the only two participants <strong>in</strong> any <strong>of</strong> the<br />
focus groups not to engage <strong>in</strong> any recreational activities <strong>in</strong> SDAs. However, those that did<br />
engage <strong>in</strong> recreational activities did so fairly regularly. They were the only group not to<br />
mention the attractiveness <strong>of</strong> SDAs unprompted, presumably because <strong>of</strong> habituation with<br />
the surround<strong>in</strong>gs. This did not mean, however, that they were unappreciative <strong>of</strong> the<br />
amenity and other environmental benefits <strong>of</strong> SDAs once specifically asked about them.<br />
Consideration <strong>of</strong> the impacts <strong>of</strong> farm<strong>in</strong>g aga<strong>in</strong> drew positive and negative responses similar<br />
to those mentioned previously. Aga<strong>in</strong>, participants were aware that farm<strong>in</strong>g had an impact<br />
on the landscape (“the whole landscape is man-made”), and that sheep-farm<strong>in</strong>g <strong>in</strong><br />
particular kept the levels <strong>of</strong> larger vegetation down. The prospect <strong>of</strong> reduced hill-farm<strong>in</strong>g<br />
produced the most concerned response, with participants very concerned that the<br />
character <strong>of</strong> their local area was already irrevocably chang<strong>in</strong>g for the worse. They were<br />
very aware that the social and economic fabric <strong>of</strong> certa<strong>in</strong> hamlets and market towns were<br />
highly dependent on hill-farm<strong>in</strong>g.<br />
In terms <strong>of</strong> rank<strong>in</strong>g, the most popular attributes (<strong>in</strong> terms <strong>of</strong> average rank) were cultural<br />
heritage (which was – significantly – <strong>in</strong> everyone’s top three), water quality, field<br />
boundaries, carbon sequestration and hay meadows (however, the latter was ranked last by<br />
two participants). Gorse was almost universally unpopular. Global warm<strong>in</strong>g was a much<br />
more widely spread concern than <strong>in</strong> the previous groups, despite the fact that participants<br />
did not otherwise claim to be particularly environmentally conscious (this may be because<br />
more <strong>of</strong> them had children or grandchildren). Uniquely, rough grassland was less<br />
appreciated than improved grassland and broadleaf woodland less appreciated than<br />
coniferous woodland. In terms <strong>of</strong> public spend<strong>in</strong>g allocation, cultural heritage was aga<strong>in</strong> by<br />
far the most significant recipient (27%), and water quality the second most (19%). This huge<br />
eftec A- 9<br />
January 2006
<strong>Economic</strong> <strong>Valuation</strong> <strong>of</strong> <strong>Environmental</strong> <strong>Impacts</strong> <strong>in</strong> the Severely Disadvantaged Areas<br />
Annex 2 – Focus Group Report<br />
preference for cultural heritage is very much <strong>in</strong> accordance with casual comments<br />
participants made throughout the session on the perceived dis<strong>in</strong>tegration <strong>of</strong> local<br />
communities and the farm<strong>in</strong>g way <strong>of</strong> life. Other cited components <strong>of</strong> cultural heritage<br />
<strong>in</strong>cluded hunt<strong>in</strong>g, old farm<strong>in</strong>g techniques and other old trades associated with farm<strong>in</strong>g,<br />
such as blacksmith<strong>in</strong>g.<br />
Participants expressed very mixed views about subsidiz<strong>in</strong>g hill-farm<strong>in</strong>g and its associated<br />
benefits. They <strong>in</strong>itially said “no” outright, but after discussion expressed the idea that<br />
expenditure <strong>of</strong> public money to protect the landscape (to “keep the countryside as it is”)<br />
for future generations is important, but expressed skepticism that such subsidies would do<br />
good other than “l<strong>in</strong>e the pockets <strong>of</strong> farmers”. Aga<strong>in</strong>, there was very much a preference for<br />
transparent taxation rather than contribut<strong>in</strong>g more to a national pot that they would not<br />
know directly benefited the landscape. There was also a perception that urban and<br />
southern areas received a disproportionate amount <strong>of</strong> public money. A tourist tax was aga<strong>in</strong><br />
suggested as a preferable payment mechanism. When asked about subsidiz<strong>in</strong>g SDAs <strong>in</strong> other<br />
regions, participants were split between those who said they would be will<strong>in</strong>g to pay<br />
exactly the same as <strong>in</strong> the Lake District, and those who said that they would be much less<br />
will<strong>in</strong>g to subsidize other areas. It was considered that farmers further south did not need<br />
as much support because the w<strong>in</strong>ters are milder; however, it is possible that dur<strong>in</strong>g some <strong>of</strong><br />
the discussion it was not clear that the subsidies would just be for SDA farmers and not<br />
lowland farmers.<br />
A2.5 Ma<strong>in</strong> F<strong>in</strong>d<strong>in</strong>gs<br />
A2.5.1 Rank<strong>in</strong>g and allocation results<br />
The overall f<strong>in</strong>d<strong>in</strong>gs <strong>of</strong> the rank<strong>in</strong>g exercise are presented <strong>in</strong> Table A2.2.<br />
Table A2.2: Overall rank<strong>in</strong>gs <strong>of</strong> attributes from the focus groups.<br />
Attribute Overall Urban/Manchester Rural/Kendal<br />
Average<br />
rank<br />
Rank <strong>of</strong><br />
average<br />
rank<br />
Average<br />
rank<br />
Rank <strong>of</strong><br />
average<br />
rank<br />
Average<br />
rank<br />
Rank <strong>of</strong><br />
average<br />
rank<br />
Heather<br />
moorland and<br />
bog<br />
Improved<br />
6.7 6 6.1 6 7.1 5<br />
grassland<br />
Rough<br />
10.7 14 12.3 14 9.9 13<br />
grassland 6.4 4 4.8 2 7.3 8<br />
Hay meadows<br />
Bracken<br />
8.0 9 7.6 8 8.2 9<br />
dom<strong>in</strong>ated<br />
Gorse<br />
9.5 11 9.8 10 9.3 10<br />
dom<strong>in</strong>ated 10.5 13 10.4 13 10.6 14<br />
Arable<br />
Broadleaf<br />
9.5 12 9.8 10 9.4 11<br />
woodland<br />
Coniferous<br />
6.8 7 6.3 7 7.1 6<br />
woodland 9.0 10 8.3 9 9.4 11<br />
Field boundaries 4.2 1 3.4 1 4.6 2<br />
Cultural heritage 4.9 3 5.3 4 4.7 3<br />
Water quantity 6.5 5 5.3 5 7.1 6<br />
Water quality<br />
Carbon<br />
4.2 1 4.8 2 3.9 1<br />
sequestration 7.7 8 10.1 12 6.3 4<br />
The top five <strong>in</strong> each column are highlighted <strong>in</strong> bold.<br />
eftec A- 10<br />
January 2006
<strong>Economic</strong> <strong>Valuation</strong> <strong>of</strong> <strong>Environmental</strong> <strong>Impacts</strong> <strong>in</strong> the Severely Disadvantaged Areas<br />
Annex 2 – Focus Group Report<br />
Accord<strong>in</strong>g to the overall average rank, the most popular upland attributes appear to be<br />
field boundaries, water quality, cultural heritage, rough grassland and water quantity.<br />
Many <strong>of</strong> the rank<strong>in</strong>gs rema<strong>in</strong> very similar between the urban and rural groups – rough<br />
grassland and carbon sequestration be<strong>in</strong>g the obvious exceptions. The consistency between<br />
the groups’ choices is encourag<strong>in</strong>g and <strong>in</strong>dicates that the rank<strong>in</strong>gs were not wholly<br />
arbitrary, but do reflect genu<strong>in</strong>e preferences.<br />
The results <strong>of</strong> the spend<strong>in</strong>g allocation exercise are presented <strong>in</strong> Table A2.3. Note that each<br />
respondent allocated counters to their personal top five only.<br />
Table A2.3: Overall sum <strong>of</strong> public spend<strong>in</strong>g counters for <strong>in</strong>dividual attributes<br />
given by the focus groups (absolute sum an percentage).<br />
Attribute<br />
Overall<br />
Urban /<br />
Manchester<br />
Rural / Kendal<br />
Sum % Sum % Sum %<br />
Heather moorland and<br />
bog 36 8.2 14 8.8 22 7.9<br />
Improved grassland 3 0.7 0 0.0 3 1.1<br />
Rough grassland 25 5.7 14 8.8 11 3.9<br />
Hay meadows 31 7.0 14 8.8 17 6.1<br />
Bracken dom<strong>in</strong>ated 12 2.7 3 1.9 9 3.2<br />
Gorse dom<strong>in</strong>ated 0 0.0 0 0.0 0 0.0<br />
Arable 5 1.1 0 0.0 5 1.8<br />
Broadleaf woodland 34 7.7 15 9.4 19 6.8<br />
Coniferous woodland 13 3.0 11 6.9 2 0.7<br />
Field boundaries 58 13.2 27 16.9 31 11.1<br />
Cultural heritage 76 17.3 15 9.4 61 21.8<br />
Water quantity 36 8.2 20 12.5 16 5.7<br />
Water quality 72 16.4 21 13.1 51 18.2<br />
Carbon sequestration 39 8.9 6 3.8 33 11.8<br />
The overall top five (or six where there is a tie) <strong>in</strong> each column are highlighted <strong>in</strong> bold.<br />
Aga<strong>in</strong>, with some attributes there is a certa<strong>in</strong> consistency between groups. However, the<br />
notable exceptions here are field boundaries, cultural heritage, carbon sequestration and<br />
water quantity and quality. As the top attributes <strong>in</strong> this case are not the same as under the<br />
rank<strong>in</strong>g exercise, it is likely the participants were mak<strong>in</strong>g some budgetary assumptions <strong>in</strong><br />
their allocation decisions; i.e. consider<strong>in</strong>g which attributes may actually need fund<strong>in</strong>g, and<br />
which (such as rough grassland) could fend for themselves. Cultural heritage was allocated<br />
over twice as many counters by the rural groups as the urban groups (and attracts<br />
significantly more even without the outlier represented by the lady for whom the term was<br />
an umbrella for all attributes). It is not surpris<strong>in</strong>g that the participants who actually reside<br />
<strong>in</strong> an SDA should be more aware <strong>of</strong>, and concerned for, the role that hill-farm<strong>in</strong>g has to<br />
play <strong>in</strong> cultural heritage and attribute a higher spend<strong>in</strong>g allocation to it.<br />
It should be noted that the preferences for water quantity and quality may be suffer<strong>in</strong>g<br />
from a regional bias because <strong>of</strong> the fact that the focus groups took place either <strong>in</strong> the Lake<br />
District or (<strong>in</strong> Manchester) amongst people who said they preferred to go to the Lakes<br />
rather than any other SDA. Several participants said that either they or their children liked<br />
to go swimm<strong>in</strong>g <strong>in</strong> the lakes; one or two others liked to go canoe<strong>in</strong>g on them. It is not<br />
known whether water attributes would be as highly favoured elsewhere <strong>in</strong> the country.<br />
A2.5.2 Other general f<strong>in</strong>d<strong>in</strong>gs<br />
When shown the map <strong>of</strong> the North West, participants were not generally able to readily<br />
dist<strong>in</strong>guish Disadvantaged Areas from Severely Disadvantaged Areas from their own<br />
experience <strong>of</strong> travell<strong>in</strong>g through such areas. This was probably due to the fact that<br />
Disadvantaged Areas are usually th<strong>in</strong> fr<strong>in</strong>ges on the SDAs. Descriptions <strong>of</strong> them (“a bit more<br />
eftec A- 11<br />
January 2006
<strong>Economic</strong> <strong>Valuation</strong> <strong>of</strong> <strong>Environmental</strong> <strong>Impacts</strong> <strong>in</strong> the Severely Disadvantaged Areas<br />
Annex 2 – Focus Group Report<br />
built up”, “less remote”, “more populated”) were partially based on local knowledge but<br />
were mostly based on <strong>in</strong>ferences from the map itself. However, the low rank<strong>in</strong>g <strong>of</strong><br />
improved grassland by participants, coupled with the fact that remarks were made dur<strong>in</strong>g<br />
the sessions on preferr<strong>in</strong>g more rugged, more “natural-look<strong>in</strong>g” terra<strong>in</strong>, suggest that the<br />
landscape attributes <strong>of</strong> DAs are likely to be much less valued by the public than those <strong>of</strong><br />
SDAs.<br />
As expected, on the whole people identified with national parks (or geographical features<br />
such as the Penn<strong>in</strong>es) much more than with the North West Government Office Region.<br />
Despite the fact that the Kendal groups said that they recognised a qualitative difference<br />
between the part <strong>of</strong> the Yorkshire Dales <strong>in</strong> the North West GOR and the part <strong>in</strong> the<br />
Yorkshire and Humber GOR, it should be remembered that this is not likely to be true for<br />
most respondents. Respondents <strong>in</strong> the North West, North East and Yorkshire and Humber<br />
will probably not be able to clearly demarcate between SDAs <strong>in</strong> their GOR and those <strong>in</strong><br />
neighbour<strong>in</strong>g GORs.<br />
Participants cited different reasons for rank<strong>in</strong>g and allocat<strong>in</strong>g public spend<strong>in</strong>g between<br />
attributes. With respect to the rank<strong>in</strong>g, some thought very specifically about what they<br />
liked to see on days out; others considered altruistic and bequest motives; others the<br />
contribution the attributes make to their recreational activities. With respect to allocation,<br />
some participants gave their allocation seem<strong>in</strong>gly <strong>in</strong> proportion to the contribution to their<br />
appreciation; others considered how much fund<strong>in</strong>g the attributes would actually need<br />
compared to others.<br />
All <strong>of</strong> the focus groups showed that participants can be swayed towards certa<strong>in</strong> preferences<br />
by hav<strong>in</strong>g more <strong>in</strong>formation or hear<strong>in</strong>g others’ op<strong>in</strong>ions. In all three, at least on person<br />
said, after hear<strong>in</strong>g why others had ranked the attributes as they did, that they would have<br />
ranked theirs differently <strong>in</strong> the light <strong>of</strong> the subsequent discussion. Although the concept<br />
was expla<strong>in</strong>ed dur<strong>in</strong>g each session, carbon sequestration <strong>in</strong> particular was valued more by<br />
people who were better <strong>in</strong>formed about global warm<strong>in</strong>g. Cultural heritage would also have<br />
been more highly valued by at least two participants if they had heard others’ descriptions<br />
<strong>of</strong> what it meant to them first.<br />
The last focus group also shows that both the payment vehicle and the fact that payments<br />
would only be given to hill-farmers must be stressed <strong>in</strong> the survey. Participants will be<br />
will<strong>in</strong>g to pay less if they imag<strong>in</strong>e that payments will go to lowland farmers who they<br />
perceive as not need<strong>in</strong>g it. Comments made dur<strong>in</strong>g the taxation and payment parts <strong>of</strong> the<br />
session also suggest that a distance decay effect is likely to be observed, and that use<br />
values will be likely to be much higher than non-use values.<br />
When asked if we could have <strong>in</strong>cluded any other attributes <strong>in</strong> the exercise, participants<br />
cited air quality, wildlife, farm animals and <strong>in</strong>dustries that might replace farm<strong>in</strong>g, such as<br />
w<strong>in</strong>d farms. It was also suggested that images <strong>of</strong> habitats could have conta<strong>in</strong>ed <strong>in</strong>formation<br />
about which species live there.<br />
In conclusion, the focus groups <strong>in</strong>dicated that while some participants expressed difficulty<br />
<strong>in</strong> disaggregat<strong>in</strong>g the different parts <strong>of</strong> the landscape which contributes to their enjoyment<br />
<strong>of</strong> SDAs, participants did <strong>in</strong> fact show fairly marked and consistent preferences for certa<strong>in</strong><br />
landscape and environmental features. Whether the exact top five overall attributes should<br />
be used <strong>in</strong> the choice experiment merits further discussion, (a) because <strong>of</strong> the likely<br />
regional bias towards water quality and quantity; and (b) because urban and rural<br />
preferences are slightly different. This is <strong>in</strong> particular need <strong>of</strong> consideration as rural<br />
participants outweighed urban participants <strong>in</strong> the focus groups, whereas urban respondents<br />
will outweigh rural respondents <strong>in</strong> the ma<strong>in</strong> survey.<br />
eftec A- 12<br />
January 2006
<strong>Economic</strong> <strong>Valuation</strong> <strong>of</strong> <strong>Environmental</strong> <strong>Impacts</strong> <strong>in</strong> the Severely Disadvantaged Areas<br />
Annex 3 – Pilot Survey Report<br />
Annex 3 - Pilot Survey Report<br />
A3.1 Introduction<br />
The objective <strong>of</strong> the pilot survey<strong>in</strong>g a stated preference questionnaire is to test the<br />
coverage, word<strong>in</strong>g, length and the design <strong>of</strong> the questionnaire <strong>in</strong> a small sample <strong>of</strong><br />
respondents before apply<strong>in</strong>g it to the ma<strong>in</strong> survey sample. While some level <strong>of</strong> population<br />
representativeness is expected from the pilot survey sample, high levels <strong>of</strong><br />
representativeness and statistical significance are not sought at this stage.<br />
The pilot survey for this study had a sample <strong>of</strong> 50 respondents and took place <strong>in</strong> the North<br />
West GOR between 5 th and 13 th July 2005. The sample was divided 25-25 <strong>in</strong> rural (Kendal<br />
and Ambleside <strong>in</strong> the Lake District) and urban (Stockport, Middleton and Blackley <strong>in</strong><br />
Manchester). This is not representative <strong>of</strong> the rural-urban split <strong>of</strong> the North West GOR<br />
population but aga<strong>in</strong> representativeness <strong>of</strong> this split was also not sought. The socioeconomic<br />
characteristics <strong>of</strong> the pilot survey sample are given <strong>in</strong> Table 1.<br />
Table 1: Pilot Survey Respondents<br />
Number <strong>of</strong> respondents<br />
No. (%) used <strong>in</strong> survey<br />
50<br />
Gender<br />
Male 29 (58%)<br />
Age<br />
Socio-economic group<br />
Residence<br />
Female 21 (42%)<br />
18-34 10 (20%)<br />
35-54 20 (40%)<br />
55-70 20 (40%)<br />
ABC1 24 (48%)<br />
C2DE 26 (52%)<br />
Rural 25 (50%)<br />
Urban 25 (50%)<br />
It appears that the actual survey process went well, with 68% <strong>of</strong> respondents say<strong>in</strong>g that<br />
they found the survey <strong>in</strong>terest<strong>in</strong>g, and only 4% say<strong>in</strong>g that they found it unrealistic or not<br />
credible (question D8). Fifty four percent <strong>of</strong> respondents said that they found the choice<br />
experiment part <strong>of</strong> the survey either very or fairly easy, while 30% said it was fairly or very<br />
difficult. This means that the questionnaire provided the necessary <strong>in</strong>formation and was<br />
thought to be accessible and clear.<br />
Each <strong>in</strong>terview took 15-45 m<strong>in</strong>utes to complete depend<strong>in</strong>g on the <strong>in</strong>terviewer and version <strong>of</strong><br />
the questionnaire they were us<strong>in</strong>g. They did not report any particular problems <strong>in</strong><br />
implement<strong>in</strong>g the questionnaire.<br />
The next section reports the ma<strong>in</strong> results from the pilot survey. These results should be<br />
read for what they are – pilot survey results. They are not expected to be representative <strong>of</strong><br />
the sampl<strong>in</strong>g po<strong>in</strong>ts let alone the North West GOR or England.<br />
eftec A- 13<br />
January 2006
<strong>Economic</strong> <strong>Valuation</strong> <strong>of</strong> <strong>Environmental</strong> <strong>Impacts</strong> <strong>in</strong> the Severely Disadvantaged Areas<br />
Annex 3 – Pilot Survey Report<br />
A3.2 Ma<strong>in</strong> Results<br />
A3.2.1 Section A: Attitudes<br />
Respondents appeared to be both environmentally aware and to have an appreciation <strong>of</strong><br />
the countryside. N<strong>in</strong>ety two percent <strong>of</strong> respondents said that they considered<br />
environmental policy to be an important consideration for the Government, with climate<br />
change draw<strong>in</strong>g the most concern. Eighty four percent <strong>of</strong> respondents said that they visited<br />
the countryside for days out. About 60% <strong>of</strong> respondents engaged <strong>in</strong> general sightsee<strong>in</strong>g or<br />
gentle walk<strong>in</strong>g <strong>in</strong> the countryside, while about a quarter engaged <strong>in</strong> hill walk<strong>in</strong>g or visit<strong>in</strong>g<br />
historic build<strong>in</strong>gs.<br />
A3.2.2 Section B: <strong>Valuation</strong> scenario<br />
A choice experiment does not make for an easy questionnaire to complete. In this case, the<br />
questionnaire is even more difficult s<strong>in</strong>ce unlike most other surveys, the attributes here<br />
could get better as well as worse under alternative policy options <strong>in</strong> comparison to the<br />
current situation depend<strong>in</strong>g on the respondent’s <strong>in</strong>terpretation. For example, the area <strong>of</strong> a<br />
particular attribute can be larger <strong>in</strong> the current situation compared to policy option A but<br />
can be smaller compared to policy option B. Whether one change (current situation to A) is<br />
better than the other (current situation to B) depends on whether the respondent f<strong>in</strong>ds the<br />
attribute a pleasant one to start with (so that he would like to have more <strong>of</strong> it). This is<br />
why it is important to word the example choice set <strong>in</strong> the scenario as clearly as possible.<br />
Encourag<strong>in</strong>gly, as responses to question D8 shows on the whole, respondents were happy<br />
with the questionnaire (see below).<br />
The pilot data were analysed us<strong>in</strong>g a Conditional Logit model. In this model, the probability<br />
that a particular scenario is chosen by a respondent is expla<strong>in</strong>ed as a function <strong>of</strong> the levels<br />
<strong>of</strong> attributes. In its simplest form only the attributes are used as explanatory variables. In<br />
more comprehensive models some <strong>of</strong> the relevant socio-economic characteristics <strong>of</strong> the<br />
respondents are also <strong>in</strong>cluded <strong>in</strong> the model. But for the pilot survey analysis, the simplest<br />
form is sufficient to test the appropriateness <strong>of</strong> the questionnaire.<br />
Overall the model is significant. All coefficients had the expected signs: cost had a negative<br />
sign (the higher the cost <strong>of</strong> a policy option, the less likely is a given respondent to choose<br />
that option) and all other attributes had positive signs (the more there is <strong>of</strong> an attribute,<br />
the more likely is a given respondent to choose that option). However, moorland, grassland<br />
and field boundaries attributes did not affect the choice <strong>of</strong> the preferred option, i.e. these<br />
attributes were <strong>in</strong>significant. On the other hand, the quality <strong>of</strong> woodland area, the<br />
conservation <strong>of</strong> cultural heritage and the tax played a significant role <strong>in</strong> the choice <strong>of</strong> the<br />
policy option. In particular the conservation <strong>of</strong> cultural heritage is significant only when a<br />
“much better conservation” <strong>of</strong> the current condition is <strong>of</strong>fered, be<strong>in</strong>g no significant when<br />
only a better conservation is presented.<br />
The constant term embodies all considerations that the respondent may have <strong>in</strong> m<strong>in</strong>d other<br />
than what is presented and hence <strong>in</strong>cluded <strong>in</strong> the model. The significance and positive sign<br />
<strong>of</strong> the constant term show that respondents are, everyth<strong>in</strong>g else equal, <strong>in</strong> favour <strong>of</strong> the<br />
payments to farmers for the “environmental services” they are required to provide.<br />
Incidentally, a negative and significant constant term would have showed a current<br />
situation bias or a tendency to keep the current situation and not make any more<br />
payments.<br />
In summary, the model says respondents value programmes which result <strong>in</strong> higher woodland<br />
area, much better conservation <strong>of</strong> cultural heritage and the less these programmes cost the<br />
better. Table 2 presents the model. Note that only two respondents stated zero WTP by<br />
choos<strong>in</strong>g the current situation <strong>in</strong> each choice set. While some <strong>of</strong> the reasons given <strong>in</strong> the<br />
eftec A- 14<br />
January 2006
<strong>Economic</strong> <strong>Valuation</strong> <strong>of</strong> <strong>Environmental</strong> <strong>Impacts</strong> <strong>in</strong> the Severely Disadvantaged Areas<br />
Annex 3 – Pilot Survey Report<br />
follow up questions for hav<strong>in</strong>g positive or zero WTP can be classified as <strong>in</strong>valid or protest<br />
responses, these have not been excluded from the analysis at this stage.<br />
Table 2: Discrete choice (mult<strong>in</strong>omial logit) model; Maximum Likelihood Estimates<br />
Dependent variable Choice<br />
Weight<strong>in</strong>g variable None<br />
Number <strong>of</strong> observations 298<br />
Iterations completed 5<br />
Log likelihood function -276.5660<br />
Log-L for Choice model = -276.56601<br />
R2=1-LogL/LogL* Log-L fncn R-sqrd RsqAdj<br />
Constants only -309.3028 .10584 .09368<br />
Response data are given as <strong>in</strong>d. choice.<br />
Number <strong>of</strong> obs.= 298, skipped 0 bad obs.<br />
Variable Coefficient (b) Standard Error b/St.Er. P[|Z|>z]<br />
CON .8636212639 .27686916 3.119 .0018<br />
MOOR .1280057635E-01 .16458674E-01 .778 .4367<br />
GRASS .1400712558E-01 .26885885E-01 .521 .6024<br />
WOOD .3293236416E-01 .16320005E-01 2.018 .0436<br />
FB .2286595058E-01 .15864743E-01 1.441 .1495<br />
CH1 .1192586984 .12056125 .989 .3226<br />
CH2 .4631175946 .13857153 3.342 .0008<br />
TAX -.2877372103E-01 .45331256E-02 -6.347 .0000<br />
CON: Constant term<br />
MOOR: Change <strong>in</strong> area <strong>of</strong> Heather Moorland and Bog<br />
GRASS: Change <strong>in</strong> area <strong>of</strong> Rough Grassland<br />
WOOD: Change <strong>in</strong> area <strong>of</strong> Broadleaf and mixed woodlands<br />
FB: Change <strong>in</strong> length <strong>of</strong> field boundaries (hedges and stone walls)<br />
Cultural heritage (Change <strong>in</strong> farm build<strong>in</strong>g and traditional farm practices): as a qualitative<br />
<strong>in</strong>dicator has to be coded so that<br />
CH1: shows change <strong>in</strong> cultural heritage attribute from ‘worse’ to ‘better’<br />
CH2: shows change <strong>in</strong> cultural heritage attribute from ‘worse’ to ‘much better’<br />
Tax: Increase <strong>in</strong> tax payments per annum<br />
F<strong>in</strong>ally, <strong>in</strong> this section <strong>of</strong> the scenario, three versions <strong>of</strong> the questionnaire were tested: (1)<br />
each respondent was given four choice cards; (2) each respondent was given six choice<br />
cards and (3) each respondent was given eight choice cards. The analysis shows that there<br />
are no signs <strong>of</strong> fatigue effects. With a such a small sample size it is not possible to estimate<br />
separate models for each groups <strong>of</strong> choice cards used (4, 6 and 8 <strong>in</strong> the pilot) and test for<br />
differences <strong>in</strong> parameter estimates. But we compared the responses to question D8 “what<br />
did you th<strong>in</strong>k <strong>of</strong> this questionnaire” with the number <strong>of</strong> choice cards presented. This<br />
comparison shows that the only one respondent who found the questionnaire too long was<br />
presented only 4 card. As well, <strong>in</strong>terviewers reported that respondents found the survey<br />
fairly difficult <strong>of</strong> very difficult <strong>in</strong> the case <strong>of</strong> only 6 people. These people were given with<br />
4, 6 or 8 choice cards so that the difficult seems to be <strong>in</strong>dependent from the number <strong>of</strong><br />
choice cards presented. It can be seen that it is highly correlated with respondents’ age (5<br />
out <strong>of</strong> 6 people were older than 55 years) as expected.<br />
eftec A- 15<br />
January 2006
<strong>Economic</strong> <strong>Valuation</strong> <strong>of</strong> <strong>Environmental</strong> <strong>Impacts</strong> <strong>in</strong> the Severely Disadvantaged Areas<br />
Annex 3 – Pilot Survey Report<br />
A3.2.3 Section C: Follow-up questions<br />
Compar<strong>in</strong>g the model results to what respondent stated <strong>in</strong> the follow-up question C1: “<strong>in</strong><br />
mak<strong>in</strong>g your choices, which <strong>of</strong> the features on the cards concerned you the most” shows<br />
some <strong>in</strong>terest<strong>in</strong>g consistencies. The three most important attributes were broadleaf/mixed<br />
woodland (38% <strong>of</strong> respondents), cultural heritage (20%) and cost (20%). It can be seen that<br />
the three attributes that were significant <strong>in</strong> the choice model are the ones that concern<br />
respondents the most. That shows a consistency between the choice model and<br />
respondents’ preferences.<br />
There are two further aspects are <strong>of</strong> <strong>in</strong>terest here. The first is about the <strong>in</strong>significance <strong>of</strong><br />
heather moorland and bog and field boundaries attributes. The heather moorland and bog<br />
is a feature <strong>in</strong> which respondents are <strong>in</strong>terested, but it is not a significant variable <strong>in</strong> the<br />
choice model. The same applies to the field boundaries attributes, although respondents<br />
are even less concerned <strong>in</strong> this attribute. In the choice experiment design, both <strong>of</strong> these<br />
attributes have a current situation policy that <strong>of</strong>fers an <strong>in</strong>termediate level, i.e. policy<br />
options A and B sometimes conta<strong>in</strong> a value that is worse than the one that is shown <strong>in</strong> the<br />
current option. This may have caused confusion to respondents, so that the no significance<br />
<strong>of</strong> the attributes might be due to this confusion. Probably, by <strong>in</strong>clud<strong>in</strong>g a short explication<br />
that only the overall policy A and B options are always better than the current situation<br />
policy and not <strong>in</strong> each attribute level and by tra<strong>in</strong><strong>in</strong>g <strong>in</strong>terviewers to po<strong>in</strong>t out any<br />
<strong>in</strong>consistencies <strong>in</strong> responses may help <strong>in</strong> the understand<strong>in</strong>g (or acceptance) <strong>of</strong> the<br />
<strong>in</strong>significance <strong>of</strong> this attributes <strong>in</strong> the choice model.<br />
Secondly, the rough grassland area attribute was <strong>in</strong>dicated as the lead<strong>in</strong>g attribute when<br />
choos<strong>in</strong>g the preferred option by only one respondent. Also, it was not significant <strong>in</strong> the<br />
choice model. That does not mean the attribute is not <strong>of</strong> concern, but it shed some doubts<br />
about it. Furthermore, the positive and significant value <strong>of</strong> the model constant says that<br />
there are some other systematic reasons that “push” respondents choos<strong>in</strong>g policy options A<br />
and B respect to the current policy. Consider<strong>in</strong>g that and the fact the rough grassland<br />
attribute was deemed not very important, leads to the question if it would be better to<br />
change this attribute. This decision cannot be taken on the basis <strong>of</strong> this pilot survey alone<br />
but it may be worth keep<strong>in</strong>g <strong>in</strong> m<strong>in</strong>d when the new study on the basel<strong>in</strong>e and policy options<br />
considers the issue <strong>of</strong> the attributes list.<br />
Other follow up questions asked respondents why they were / were not will<strong>in</strong>g to pay for<br />
the future policy options, where hav<strong>in</strong>g zero WTP means select<strong>in</strong>g the current situation (at<br />
zero cost) <strong>in</strong> all choice sets and hav<strong>in</strong>g a positive WTP means select<strong>in</strong>g one future policy<br />
option at least on one <strong>of</strong> the choice sets.<br />
Whether they have a positive or zero WTP, all respondents were asked the relevant openended<br />
questions about the reasons beh<strong>in</strong>d their choices. The <strong>in</strong>terviewers were given a precoded<br />
answer list, which was not shown to the respondents, and asked to record the<br />
answers both verbatim and mark them on the pre-coded list.<br />
The comparison <strong>of</strong> the verbatim and coded answers <strong>of</strong> those who had a positive WTP shows<br />
that we will need to extend the pre-coded sheet to reflect some <strong>of</strong> the common reasons<br />
people gave. These <strong>in</strong>clude more general feel<strong>in</strong>gs such as “I care very much about how<br />
farms look and are managed”, “it’s about time th<strong>in</strong>gs were turned around” and “it’s the<br />
right th<strong>in</strong>g to do”. Note that some <strong>of</strong> these results could <strong>in</strong> fact signify ‘<strong>in</strong>valid’ or protest<br />
reasons for a positive WTP. For example, it is not clear if the WTP <strong>of</strong> someone who pays<br />
‘because it is the right th<strong>in</strong>g’ should be excluded on the grounds that what they get is not a<br />
benefit specific to the scenario described to them but a ‘warm glow’ unrelated to the<br />
scenario; or it should still be <strong>in</strong>cluded because <strong>in</strong> addition to these policies be<strong>in</strong>g a right<br />
th<strong>in</strong>g to do the respondent also derive direct benefits from the improvements. In order to<br />
be able to decide whether to <strong>in</strong>clude the responses from such <strong>in</strong>dividuals <strong>in</strong> the analysis,<br />
we need to understand the motives beh<strong>in</strong>d these reasons <strong>in</strong> more detail.<br />
eftec A- 16<br />
January 2006
<strong>Economic</strong> <strong>Valuation</strong> <strong>of</strong> <strong>Environmental</strong> <strong>Impacts</strong> <strong>in</strong> the Severely Disadvantaged Areas<br />
Annex 3 – Pilot Survey Report<br />
Only two respondents were not will<strong>in</strong>g to pay for any alternative options presented on their<br />
choice cards, cit<strong>in</strong>g the reasons: “the farmers should pay” and “the government or council<br />
should pay – we pay enough taxes”. These would <strong>in</strong> fact classified as protest votes rather<br />
than genu<strong>in</strong>e refusals due to lack <strong>of</strong> receiv<strong>in</strong>g any benefits and we would tend to exclude<br />
them from the analysis.<br />
A3.2.4 Section D: Socio-<strong>Economic</strong> Characteristics<br />
Most <strong>of</strong> the respondents were long term, or life-time, residents <strong>of</strong> the North West. The<br />
average length <strong>of</strong> residency was 36 years, and more than half <strong>of</strong> respondents had been<br />
resident for more than 30 years. Eighty percent had no <strong>in</strong>tention <strong>of</strong> leav<strong>in</strong>g.<br />
The range <strong>of</strong> educational level was fairly restricted: 82% <strong>of</strong> respondents had a maximum<br />
level <strong>of</strong> educational atta<strong>in</strong>ment <strong>of</strong> A-levels, O-levels or primary school; 46% <strong>of</strong> respondents<br />
were <strong>in</strong> full-time or part-time or self-employed, and 34% were retired. Household <strong>in</strong>come<br />
ranges were fairly evenly spread. However, 28% <strong>of</strong> respondents did not know or refused to<br />
disclose their <strong>in</strong>come. Given that <strong>in</strong>come is an important determ<strong>in</strong>ant <strong>of</strong> WTP and hence an<br />
important variable <strong>in</strong> expla<strong>in</strong><strong>in</strong>g the choices people make, collection <strong>of</strong> data on <strong>in</strong>come<br />
levels <strong>of</strong> the respondents is crucial. Therefore, we will <strong>in</strong>struct the <strong>in</strong>terviewers to be more<br />
<strong>in</strong>sistent <strong>in</strong> gett<strong>in</strong>g more respondents to answer this question.<br />
Forty percent <strong>of</strong> respondents belonged to a heritage, environmental, recreational or<br />
farm<strong>in</strong>g association; the most common <strong>of</strong> these was the National Trust, with 24% <strong>of</strong> the<br />
survey.<br />
Urban-rural differences<br />
The attitudes <strong>of</strong> urban and rural respondents towards the environment and countryside did<br />
not vary much, apart from <strong>in</strong> the rank<strong>in</strong>g <strong>of</strong> environmental issues: on average, urban<br />
respondents ranked water quality as the most important issue, while rural respondents<br />
ranked it last and climate change first. Cultural heritage appeared to be a more important<br />
attribute to urban respondents, and cost to rural respondents. This is unsurpris<strong>in</strong>g, as the<br />
rural sub-sample conta<strong>in</strong>ed more people on low household <strong>in</strong>comes (less than £10,400 per<br />
annum). Urban respondents were more likely to cite altruistic, bequest or “national<br />
heritage” reasons why they were will<strong>in</strong>g to pay, while rural respondents were less likely to<br />
be p<strong>in</strong>ned down.<br />
A3.3 Lessons for the Ma<strong>in</strong> Survey<br />
The pilot survey is carried out ma<strong>in</strong>ly to f<strong>in</strong>e-tune the questionnaire and to tra<strong>in</strong> the<br />
<strong>in</strong>terviewers. The questionnaire format, word<strong>in</strong>g, edit<strong>in</strong>g and length are f<strong>in</strong>e. People found<br />
it <strong>in</strong>terest<strong>in</strong>g and not too long. The format (number <strong>of</strong> attribute and levels) <strong>of</strong> the choice<br />
set can be considered adequate. The number <strong>of</strong> choice sets that can be shown to<br />
respondents may be high (up to 8 or 9). That will allow the collection <strong>of</strong> more data and will<br />
confer more statistical power to the models.<br />
However, there are some aspects po<strong>in</strong>ted out <strong>in</strong> this report that may be used to improve<br />
the questionnaire. Of particular relevance are the high number <strong>of</strong> people that did not<br />
declare their <strong>in</strong>come, the description <strong>of</strong> the valuation scenarios and the attributes that<br />
should be used <strong>in</strong> the f<strong>in</strong>al survey. The <strong>in</strong>terviewers’ tra<strong>in</strong><strong>in</strong>g is a crucial po<strong>in</strong>t when fix<strong>in</strong>g<br />
these aspects. These are further listed below.<br />
Section A - Attitudes:<br />
• In question A1, it will be useful to add a rem<strong>in</strong>der to the respondents that every<br />
pound spent on environmental policy cannot be spent on anyth<strong>in</strong>g else thereby<br />
eftec A- 17<br />
January 2006
<strong>Economic</strong> <strong>Valuation</strong> <strong>of</strong> <strong>Environmental</strong> <strong>Impacts</strong> <strong>in</strong> the Severely Disadvantaged Areas<br />
Annex 3 – Pilot Survey Report<br />
<strong>in</strong>troduc<strong>in</strong>g the idea <strong>of</strong> a trade-<strong>of</strong>f. Otherwise, it is expected that a large<br />
proportion <strong>of</strong> respondents will say environmental protection is important.<br />
Section B – <strong>Valuation</strong> Scenario<br />
• In order to ensure that people are th<strong>in</strong>k<strong>in</strong>g about only the SDAs <strong>in</strong> their own GOR as<br />
marked on the map <strong>of</strong> England they are shown, we may want to revise the word<strong>in</strong>g<br />
<strong>of</strong> the scenario to emphasise this po<strong>in</strong>t. This, however, rema<strong>in</strong>s to be seen through<br />
further work over the period between now and the start <strong>of</strong> the ma<strong>in</strong> survey. This<br />
has been a po<strong>in</strong>t we have had <strong>in</strong> m<strong>in</strong>d s<strong>in</strong>ce the beg<strong>in</strong>n<strong>in</strong>g <strong>of</strong> the design process<br />
rather than as a result <strong>of</strong> any particular f<strong>in</strong>d<strong>in</strong>g <strong>of</strong> the pilot survey.<br />
• If an <strong>in</strong>consistency is detected between the respondent’s choices and the reasons<br />
given <strong>in</strong> the follow up questions (e.g. respondent says ‘visitors should pay’ but still<br />
chooses policy options imply<strong>in</strong>g a cost to his/her household as well as to visitors),<br />
the <strong>in</strong>terviewer may be required to check that the earlier choices were valid. We<br />
will th<strong>in</strong>k about how this <strong>in</strong>struction could be given to <strong>in</strong>terviewers <strong>in</strong> an<br />
appropriate way.<br />
• In order to better test for the sensitivity <strong>of</strong> the respondents to different levels <strong>of</strong><br />
the attributes, we will also <strong>in</strong>clude a test <strong>in</strong> the choice set design by us<strong>in</strong>g different<br />
estimates for the maximum levels <strong>of</strong> 1-3 attributes <strong>in</strong> at least one <strong>of</strong> the surveys.<br />
Comparison <strong>of</strong> the results will tell us more about the construction <strong>of</strong> respondent<br />
preferences.<br />
• Hav<strong>in</strong>g tested different number <strong>of</strong> choice sets per person and found that most<br />
respondents are comfortable with eight choice sets, we are happy to use this<br />
number <strong>of</strong> choice sets to implement different tests <strong>of</strong> consistency and validity.<br />
Section C – Follow up Questions<br />
• Half the respondents were classified as “none <strong>of</strong> the above” <strong>in</strong> response to question<br />
C2 on why they were will<strong>in</strong>g to pay. Our range <strong>of</strong> pre-coded answers will need to be<br />
expanded, and clearer guidance will be given to the <strong>in</strong>terviewers on how to<br />
<strong>in</strong>terpret responses.<br />
• In order to clarify and/or reduce the motivations like ‘it’s the right th<strong>in</strong>g to do’ or<br />
‘warm glow’, we will also ensure that the word<strong>in</strong>g <strong>of</strong> the valuation scenario and the<br />
necessary tests will be put <strong>in</strong> place.<br />
Section D – Socio-economic Characteristics<br />
The pilot survey was not meant to be fully representative <strong>of</strong> the North West GOR. However,<br />
the market research companies are required to ensure full representativeness <strong>in</strong> the ma<strong>in</strong><br />
survey accord<strong>in</strong>g to socio-economic group, age and gender distribution at the level <strong>of</strong> the<br />
GOR.<br />
eftec A- 18<br />
January 2006
<strong>Economic</strong> <strong>Valuation</strong> <strong>of</strong> <strong>Environmental</strong> <strong>Impacts</strong> <strong>in</strong> the Severely Disadvantaged Areas<br />
Annex 4 – F<strong>in</strong>al Questionnaire template<br />
Annex 4 - F<strong>in</strong>al Questionnaire<br />
Market_Research_Company_Name<br />
TIME TAKEN TO FIND RESPONDENT:<br />
RECORD TIME OF INTERVIEW:<br />
Region – Version Rx<br />
Start (24hr Clock): : End (24hr Clock): :<br />
INTERVIEWER DECLARATION:<br />
This <strong>in</strong>terview was conducted face to face with a respondent who is unknown to me.<br />
Signature: ………………………………… (Pr<strong>in</strong>t Your Name: …………………………………….)<br />
Date: …… / …... /2005<br />
Introduction<br />
Hello! I am [GIVE NAME AND SHOW IDENTIFICATION] from Market_Research_Company_Name.<br />
We are conduct<strong>in</strong>g a survey about an issue <strong>of</strong> general regional <strong>in</strong>terest for the UK Government<br />
Department <strong>of</strong> Environment, Food and Rural Affairs. I’d be grateful if you would answer a few<br />
questions concern<strong>in</strong>g your op<strong>in</strong>ions about this issue. The <strong>in</strong>terview should last about half an hour.<br />
For your piece <strong>of</strong> m<strong>in</strong>d, we adhere to the Code <strong>of</strong> Conduct <strong>of</strong> the Market Research Society, and<br />
anyth<strong>in</strong>g you say is confidential. Under no circumstances will your answers be l<strong>in</strong>ked to your name.<br />
First, may I check some details about you.<br />
Quota Controls<br />
A. How old are you?<br />
Exact Age:<br />
AGE MALE FEMALE<br />
1 18-34 years 01 11<br />
2 35-54 years 02 12<br />
3 55-70 years 03 13<br />
B. Where do you live?<br />
Town/village:<br />
C. What is the Occupation <strong>of</strong> the chief<br />
wage earner <strong>in</strong> your Household?<br />
Job:<br />
Industry:<br />
D. Please record <strong>in</strong> CAPITALS:<br />
Name:<br />
VERSION Questionnaire No.<br />
Full Postal Address:<br />
Full Post Code:<br />
Tel. Number:<br />
Sampl<strong>in</strong>g<br />
Po<strong>in</strong>t No.<br />
AB 1<br />
C1 2<br />
C2 3<br />
DE 4<br />
eftec A- 19<br />
January 2006
<strong>Economic</strong> <strong>Valuation</strong> <strong>of</strong> <strong>Environmental</strong> <strong>Impacts</strong> <strong>in</strong> the Severely Disadvantaged Areas<br />
Annex 4 – F<strong>in</strong>al Questionnaire template<br />
A. ATTITUDES<br />
A1. How important would you say that environmental policy is, <strong>in</strong> relation to other th<strong>in</strong>gs that<br />
government is concerned with, such as law and order, or education?<br />
CARD A1: CIRCLE ONE ONLY<br />
Very important 1<br />
Quite important 2<br />
Not all that important 3<br />
I really don’t care about the environment at all 4<br />
A2. What do you th<strong>in</strong>k should be the ma<strong>in</strong> concern for environmental policy <strong>in</strong> this country<br />
over the next 10 years? Please rank the options on this card from 1 (most important) to 4(least<br />
important)<br />
CARD A2: WRITE DOWN RANKS HERE – 1 (MOST IMPORTANT) TO 4 (LEAST IMPORTANT)<br />
Controll<strong>in</strong>g air pollution<br />
Tackl<strong>in</strong>g climate change<br />
Protect<strong>in</strong>g the countryside<br />
Protect<strong>in</strong>g the quality <strong>of</strong> rivers, lakes and<br />
the sea<br />
A3. Do you ever visit the countryside for recreation, for work or for both?<br />
IF THEY JUST SAY “YES” FIND OUT IF RECREATION, WORK OR BOTH.<br />
SHORT VISITS (E.G TO WALK THE DOG), DAYS OUT, WEEKENDS AWAY OR LONGER<br />
HOLIDAYS AND VISITING FRIENDS AND FAMILY ALL COUNT AS RECREATION.<br />
YES - RECREATION 1<br />
YES - WORK 2<br />
YES - BOTH 3<br />
NO, NEVER visit the countryside 4<br />
eftec A- 20<br />
January 2006
<strong>Economic</strong> <strong>Valuation</strong> <strong>of</strong> <strong>Environmental</strong> <strong>Impacts</strong> <strong>in</strong> the Severely Disadvantaged Areas<br />
Annex 4 – F<strong>in</strong>al Questionnaire template<br />
B. CHOICE EXPERIMENT VALUATION SCENARIO<br />
This survey is ma<strong>in</strong>ly concerned with your op<strong>in</strong>ions about hill farm<strong>in</strong>g areas <strong>in</strong> the Region [<strong>of</strong><br />
England]. This map shows your region.<br />
SHOW MAP ERROR! REFERENCE SOURCE NOT FOUND.1 AND POINT OUT THE DETAILED<br />
MAP OF THE REGION<br />
[FOR INFORMATION – PURPLE AREAS ON MAP ARE URBAN AREAS – IGNORE THESE]<br />
The green l<strong>in</strong>e shows the regional border and the p<strong>in</strong>k shaded areas shows the hill farm<strong>in</strong>g areas <strong>of</strong><br />
<strong>in</strong>terest. You can see that the [ma<strong>in</strong>] areas <strong>of</strong> concern <strong>in</strong> the Region [<strong>of</strong> England] is/are the specific<br />
area name(s)[, but there are other areas, such as …].<br />
We would like you to th<strong>in</strong>k <strong>in</strong> particular about the different landscape features <strong>in</strong> these areas, such<br />
as farm woodlands, hedgerows and moorland. These features are affected by the way <strong>in</strong> which<br />
farm<strong>in</strong>g is carried out. If there are fewer work<strong>in</strong>g hill farms <strong>in</strong> an area, or if they change their<br />
practices, then some <strong>of</strong> these landscape features may change. You may get more or less <strong>of</strong> them,<br />
or their quality might alter.<br />
In these areas, farmers receive special payments from the Government to make up for the fact that<br />
farm<strong>in</strong>g is more difficult, because <strong>of</strong> the steep ground, and because these areas are far away from<br />
the majority <strong>of</strong> customers.<br />
The Government may change how it pays farmers <strong>in</strong> these hilly areas. If this happened, the ma<strong>in</strong><br />
aim would be to try and reduce the bad impacts <strong>of</strong> future changes <strong>in</strong> farm<strong>in</strong>g on the landscape, and<br />
to <strong>in</strong>crease any good impacts. However, this policy change would come at a cost to people like you,<br />
either through higher national or local taxes, or even perhaps through charges on people visit<strong>in</strong>g<br />
the areas. The government would like to know what people th<strong>in</strong>k <strong>of</strong> as good and bad impacts and<br />
whether the cost <strong>of</strong> the policy change is right. This is why we are conduct<strong>in</strong>g this survey.<br />
So what are these “Landscape Features” that I have been talk<strong>in</strong>g about? Well, the landscape<br />
features we are look<strong>in</strong>g at <strong>in</strong> this survey are the follow<strong>in</strong>g.<br />
SHOW CARD B0a.<br />
Please read this card carefully - it will help you to make decisions <strong>in</strong> the next section <strong>of</strong> the<br />
questionnaire.<br />
eftec A- 21<br />
January 2006
CARD B0a<br />
<strong>Economic</strong> <strong>Valuation</strong> <strong>of</strong> <strong>Environmental</strong> <strong>Impacts</strong> <strong>in</strong> the Severely Disadvantaged Areas<br />
Annex 4 – F<strong>in</strong>al Questionnaire template<br />
Heather moorland and bog<br />
These are areas <strong>of</strong> heather moorland <strong>in</strong> drier areas and on steeper slopes, but with less heather and<br />
more bog <strong>in</strong> wetter areas. Bogs conta<strong>in</strong> peat, with bog mosses and sometimes bog pools. All <strong>of</strong> these<br />
areas are typically used for sheep graz<strong>in</strong>g, and may conta<strong>in</strong> many different k<strong>in</strong>ds <strong>of</strong> birds, <strong>in</strong>sects and<br />
plants.<br />
Rough grassland<br />
These areas can <strong>of</strong>ten look untidy where the soil is poor, but can be heavily grazed by sheep where<br />
soil is better. They may look a bit brown or pale at some times <strong>of</strong> the year, but at other times can look<br />
very green. Birds also like these areas.<br />
Broadleaf and mixed woodland<br />
These woodlands usually consist <strong>of</strong> a mix <strong>of</strong> native tree species such as ash, oak and hazel. Unlike<br />
conifer plantations, these woodlands have an irregular shape when seen from a distance (so they<br />
don’t look like square blocks on the hillside!). Some <strong>of</strong> these woods are very old, others are more<br />
recently planted.<br />
Field boundaries<br />
These are the traditional stone walls (or dykes) and hedgerows seen across the upland landscape.<br />
Modern wire fences are NOT <strong>in</strong>cluded <strong>in</strong> this feature, although they have <strong>of</strong>ten replaced, or run<br />
alongside, traditional stone walls and hedges.<br />
Traditional farm build<strong>in</strong>gs and farm<strong>in</strong>g practices<br />
Here we mean the traditional farm build<strong>in</strong>gs that can be seen <strong>in</strong> the uplands, and their associated<br />
barns and sheds. But we also <strong>in</strong>clude traditional farm practices such as shepherd<strong>in</strong>g.<br />
We would now like you to th<strong>in</strong>k about a number <strong>of</strong> possible options for future government policy <strong>in</strong><br />
hill-farm<strong>in</strong>g areas. These options are shown <strong>in</strong> the “Choice Cards” which I am go<strong>in</strong>g to show you. In<br />
each one, you will see there are three choices for you to make: the Current Policy, Policy Option A<br />
or Policy Option B. You’ll notice that if you choose the current policy then this comes at no extra<br />
cost to your household, but some landscape features will get worse <strong>in</strong> time accord<strong>in</strong>g to<br />
predictions. Policy Option A and Policy Option B come at an additional cost to your household every<br />
year, but also give you some improvements <strong>in</strong> the landscape features <strong>of</strong> these hill-farm<strong>in</strong>g areas.<br />
SHOW EXAMPLE CARD B0b<br />
Here’s an example which we have worked through for you. As you can see <strong>in</strong> the “current policy”<br />
(POINT), the condition <strong>of</strong> many <strong>of</strong> the landscape features <strong>in</strong> the Region is gett<strong>in</strong>g worse: the<br />
amounts <strong>of</strong> heather moorland and rough grassland are both fall<strong>in</strong>g, there is some restoration <strong>of</strong><br />
field boundaries and there is a rapid decl<strong>in</strong>e <strong>in</strong> the condition <strong>of</strong> farm build<strong>in</strong>gs and traditional<br />
farm<strong>in</strong>g practices. However, the area <strong>of</strong> woodland is <strong>in</strong>creas<strong>in</strong>g, and stick<strong>in</strong>g with this option would<br />
not create any extra cost for your household.<br />
In Option A (POINT) the area <strong>of</strong> heather moorland <strong>in</strong>creases, the area <strong>of</strong> rough grassland falls by<br />
less, and more field boundaries are restored. There is also more woodland compared to the current<br />
policy. However, your household would face an additional cost <strong>of</strong> £20 a year to pay for these<br />
landscape improvements.<br />
In Option B (POINT), the extra cost is lower - £10 per year - and you still get some landscape<br />
improvements over the current policy, but not as much as with Option A.<br />
EXAMPLE CARD B0b<br />
eftec A- 22<br />
January 2006
<strong>Economic</strong> <strong>Valuation</strong> <strong>of</strong> <strong>Environmental</strong> <strong>Impacts</strong> <strong>in</strong> the Severely Disadvantaged Areas<br />
Annex 4 – F<strong>in</strong>al Questionnaire template<br />
Policy Option Current<br />
policy<br />
Change <strong>in</strong> area <strong>of</strong> Heather<br />
Moorland and Bog<br />
Change <strong>in</strong> area <strong>of</strong> Rough<br />
Grassland<br />
Change <strong>in</strong> area <strong>of</strong> Broadleaf<br />
and mixed woodlands<br />
Condition <strong>of</strong> field boundaries<br />
Change <strong>in</strong> farm build<strong>in</strong>g and<br />
traditional farm practices<br />
Increase <strong>in</strong> tax payments by<br />
your household each year<br />
A loss <strong>of</strong> 2%<br />
(-2%)<br />
A loss <strong>of</strong> 10%<br />
(-10%)<br />
A ga<strong>in</strong> <strong>of</strong> 3%<br />
(+3%)<br />
For every 1 km,<br />
100m is<br />
restored<br />
Policy<br />
Option A<br />
A ga<strong>in</strong> <strong>of</strong> 2%<br />
(+2%)<br />
A loss <strong>of</strong> 2%<br />
(-2%)<br />
A ga<strong>in</strong> <strong>of</strong> 20%<br />
(+20%)<br />
For every 1 km,<br />
200 m is<br />
restored<br />
Rapid decl<strong>in</strong>e no change<br />
Policy<br />
Option B<br />
A loss <strong>of</strong> 2%<br />
(-2%)<br />
A loss <strong>of</strong> 2%<br />
(-2%)<br />
A ga<strong>in</strong> <strong>of</strong> 10%<br />
(+10%)<br />
for every 1 km,<br />
50 m is<br />
restored<br />
Much better<br />
conservation<br />
£0 £20 £10<br />
So, which would you prefer? The current policy with no extra costs but some losses <strong>in</strong> most<br />
landscape features; Option A with an extra cost <strong>of</strong> £20 per year to you, but some improvements; or<br />
Option B, with fewer, but less expensive improvements?<br />
There are no right or wrong answers. On each choice card you just pick the option that you would<br />
prefer to see happen <strong>in</strong> the Region. You’ll notice that sometimes <strong>in</strong> the cards you are shown th<strong>in</strong>gs<br />
get better, and sometimes th<strong>in</strong>gs get worse, but that is the most likely range <strong>of</strong> possibilities for<br />
what might happen <strong>in</strong> the future. Now you might th<strong>in</strong>k that you do not have enough “expert<br />
knowledge” to make these k<strong>in</strong>ds <strong>of</strong> choices, but we are <strong>in</strong>terested <strong>in</strong> what ord<strong>in</strong>ary people th<strong>in</strong>k<br />
about what the Government should be do<strong>in</strong>g.<br />
Please do consider only the hill-farm<strong>in</strong>g areas, and only those areas <strong>in</strong> your region, the Region, as<br />
the survey is be<strong>in</strong>g conducted <strong>in</strong> other regions separately. Each time, just th<strong>in</strong>k about what you<br />
would most like to happen. But remember that if you opt to pay extra by choos<strong>in</strong>g Option A or B on<br />
any card, then this means your household would have less money available to spend on other<br />
th<strong>in</strong>gs, or to save. Take your time and make your best choice for each <strong>of</strong> these six cards I am go<strong>in</strong>g<br />
to show you. Please th<strong>in</strong>k about which you would prefer.<br />
On each card, you will see that these landscape features can take a number <strong>of</strong> possible values. On<br />
the cards we show these as % changes over how much there is <strong>of</strong> each feature at the moment – for<br />
example, “a 2% loss”. You might like to know what these % changes mean for landscape features <strong>in</strong><br />
the Region. This card shows you. You might f<strong>in</strong>d it helpful to th<strong>in</strong>k <strong>of</strong> “1 hectare” as a couple <strong>of</strong><br />
football pitches!<br />
SHOW CARD B0c AND READ THROUGH IT WITH THEM. LET THEM KEEP HOLD OF IT WHILST<br />
THEY ARE GOING THROUGH THE CHOICE CARDS.<br />
eftec A- 23<br />
January 2006
CARD B0c<br />
<strong>Economic</strong> <strong>Valuation</strong> <strong>of</strong> <strong>Environmental</strong> <strong>Impacts</strong> <strong>in</strong> the Severely Disadvantaged Areas<br />
Annex 4 – F<strong>in</strong>al Questionnaire template<br />
Heather<br />
moorland and<br />
bog<br />
Rough<br />
grassland<br />
Broadleaf and<br />
mixed<br />
woodlands<br />
Current policy: Effects <strong>of</strong> possible future policy changes<br />
A 2% loss is equal<br />
to los<strong>in</strong>g 380<br />
hectares out <strong>of</strong> the<br />
current total <strong>of</strong><br />
19,000 hectares<br />
A 10% loss is equal<br />
to los<strong>in</strong>g 3, 200<br />
hectares out <strong>of</strong> the<br />
current total <strong>of</strong><br />
32,000 hectares<br />
A ga<strong>in</strong> <strong>of</strong> 3% is<br />
equal to hav<strong>in</strong>g an<br />
extra 190 hectares<br />
<strong>in</strong> addition to the<br />
current area <strong>of</strong><br />
6,300 hectares<br />
A 12% loss is equal<br />
to los<strong>in</strong>g 2,300<br />
hectares out <strong>of</strong> the<br />
current total<br />
A 5% ga<strong>in</strong> is equal<br />
to hav<strong>in</strong>g an extra<br />
1,600 hectares<br />
A 10% ga<strong>in</strong> is equal<br />
to hav<strong>in</strong>g an extra<br />
630 hectares<br />
A 5% ga<strong>in</strong> is equal<br />
to hav<strong>in</strong>g an extra<br />
960 hectares<br />
A 10% ga<strong>in</strong> is equal<br />
to hav<strong>in</strong>g an extra<br />
3,200 hectares<br />
A 20% ga<strong>in</strong> is equal<br />
to hav<strong>in</strong>g an extra<br />
1,250 hectares<br />
Note: Page: 24<br />
These are the figures for East Midlands – these figures were appropriate for each GOR and changed <strong>in</strong> each<br />
version.<br />
B1.<br />
GO THROUGH THE SIX CHOICE CARDS AND FOR EACH ONE ASK THE RESPONDENT FOR<br />
THEIR PREFERRED OPTION.<br />
THE ORDER OF THE CHOICE CARDS IN YOUR SET SHOULD BE ROTATED EACH TIME.<br />
WRITE THE ANSWERS IN THE TABLE BELOW. TICK THE CHOICE CARD USED AS A STARTING<br />
POINT AND CIRCLE ONLY ONE RESPONSE PER CHOICE CARD IN THE OTHER COLUMNS.<br />
Choice card Tick start<strong>in</strong>g Current Policy Policy<br />
number po<strong>in</strong>t<br />
policy Option A Option B<br />
B1 1 2 3<br />
B2 1 2 3<br />
B3 1 2 3<br />
B4 1 2 3<br />
B5 1 2 3<br />
B6 1 2 3<br />
Note: three different sets <strong>of</strong> choice cards were used: B1-6, B7-12 and B13-18.<br />
eftec A- 24<br />
January 2006
<strong>Economic</strong> <strong>Valuation</strong> <strong>of</strong> <strong>Environmental</strong> <strong>Impacts</strong> <strong>in</strong> the Severely Disadvantaged Areas<br />
Annex 4 – F<strong>in</strong>al Questionnaire template<br />
B2. In mak<strong>in</strong>g your choices, which <strong>of</strong> the these features concerned you the most?<br />
CARD B2: CIRCLE ONE ONLY<br />
Heather moorland and bog 1<br />
Rough grassland 2<br />
Broadleaf and mixed woodlands 3<br />
Field boundaries (hedges and stone walls) 4<br />
Farm build<strong>in</strong>gs and traditional farm practices 5<br />
Cost 6<br />
QUESTION ROUTING:<br />
*ALL WHO CHOOSE POLICY OPTION A OR POLICY OPTION B AT LEAST ONCE<br />
� QUESTION B3<br />
*ALL WHO CHOOSE ‘CURRENT POLICY’ EVERY TIME � QUESTION B4<br />
B3. What were the ma<strong>in</strong> reasons you were will<strong>in</strong>g to contribute to the fund<strong>in</strong>g <strong>of</strong> future policy<br />
options?<br />
PROBE FULLY AND WRITE IN, THEN CODE ON NEXT PAGE<br />
………………………………………………………………………………………………………………………<br />
………………………………………………………………………………………………………………………<br />
eftec A- 25<br />
January 2006
<strong>Economic</strong> <strong>Valuation</strong> <strong>of</strong> <strong>Environmental</strong> <strong>Impacts</strong> <strong>in</strong> the Severely Disadvantaged Areas<br />
Annex 4 – F<strong>in</strong>al Questionnaire template<br />
Category Phrases / reasons Tick Cod<strong>in</strong>g<br />
Personal /<br />
Family<br />
enjoyment<br />
Others’<br />
enjoyment now<br />
– altruism<br />
I/we like / enjoy / love go<strong>in</strong>g to the countryside<br />
I/we care about the countryside<br />
The countryside is lovely / beautiful<br />
Other personal/family enjoyment reason<br />
It should be conserved / protected / improved<br />
to benefit us all / for everyone<br />
Others’<br />
Other altruistic reason<br />
It should be conserved / protected for<br />
future generations<br />
enjoyment – I want future generations / to enjoy it<br />
3<br />
future<br />
my (grand)children<br />
Personal<br />
f<strong>in</strong>ancial ga<strong>in</strong><br />
Other future enjoyment reason<br />
Many/most <strong>of</strong> my customers are farmers<br />
I’m a farmer myself<br />
My bus<strong>in</strong>ess depends on tourists<br />
Other personal f<strong>in</strong>ancial ga<strong>in</strong> reason<br />
4<br />
� Mix � Farm<strong>in</strong>g should be ma<strong>in</strong>ta<strong>in</strong>ed to keep prices down<br />
Preserve (small) farmers’ livelihoods<br />
Safeguard livelihoods / employment<br />
4 and 5<br />
Others’ f<strong>in</strong>ancial<br />
ga<strong>in</strong><br />
It would be good for the farm<strong>in</strong>g <strong>in</strong>dustry<br />
Tourism <strong>in</strong>dustry is important for those/this area(s)<br />
Farm<strong>in</strong>g <strong>in</strong>dustry deserves support<br />
Other reason support<strong>in</strong>g others’/farmers’ livelihoods<br />
5<br />
� Mix �<br />
Keep (small / hill) farms go<strong>in</strong>g / here / <strong>in</strong> the<br />
hill-farm<strong>in</strong>g areas<br />
Keep countryside as it is / keep what we have<br />
5 and 6<br />
Preserve<br />
heritage /<br />
communities /<br />
way <strong>of</strong> life<br />
Preserve/ma<strong>in</strong>ta<strong>in</strong> our (national) heritage<br />
Protect / stop decl<strong>in</strong>e <strong>of</strong> the country / hill-farm<strong>in</strong>g<br />
way <strong>of</strong> life<br />
Protect rural / local communities<br />
Stop / prevent decl<strong>in</strong>e <strong>of</strong> countryside<br />
Other communities / heritage reason<br />
6<br />
� Mix � Preserve/protect the countryside / landscape<br />
Improve the environment / I care about environment<br />
6 and 7<br />
<strong>Environmental</strong><br />
concern<br />
Countryside needs look<strong>in</strong>g after<br />
The environment is under threat<br />
Protect wildlife / animals / plants / birds / trees<br />
Other environmental reason<br />
7<br />
� Mix � We have a duty to protect environment<br />
It’s the right th<strong>in</strong>g to do / we have a duty<br />
7 and 8<br />
Moral obligation We have to pay for conservation / to get benefits<br />
Other moral obligation reason<br />
We all have to give sometimes / do our bit (for the<br />
8<br />
Warm glow<br />
environment / for others)<br />
The money isn’t important<br />
Other warm glow reason<br />
9<br />
Scenario not<br />
credible<br />
I am not pay<strong>in</strong>g so it does not matter<br />
Other “scenario not credible” response<br />
10<br />
Don’t know 11<br />
None <strong>of</strong> the above 12<br />
GO TO QUESTION B5<br />
eftec A- 26<br />
January 2006<br />
1<br />
2
<strong>Economic</strong> <strong>Valuation</strong> <strong>of</strong> <strong>Environmental</strong> <strong>Impacts</strong> <strong>in</strong> the Severely Disadvantaged Areas<br />
Annex 4 – F<strong>in</strong>al Questionnaire<br />
B4. What were the ma<strong>in</strong> reasons you were not will<strong>in</strong>g to contribute to the fund<strong>in</strong>g <strong>of</strong><br />
future policy options?<br />
PROBE FULLY AND WRITE IN, THEN CODE BELOW<br />
……………………………………………………………………………………………………………<br />
………<br />
I can’t afford to pay<br />
The improvements aren’t important to me/ current policy is OK<br />
I seldom see / use the areas described<br />
I never see / use the areas described<br />
I object to pay<strong>in</strong>g <strong>in</strong> this way for environmental improvements <strong>in</strong> these areas<br />
The government or council should pay for this<br />
The farmers should pay for this<br />
Visitors to these areas should pay<br />
I don’t believe the policies would actually happen<br />
Don’t know<br />
None <strong>of</strong> the above<br />
GO TO QUESTION B5<br />
B5. How easy or difficult did you f<strong>in</strong>d it to make your decisions about which policy<br />
option to choose?<br />
CARD B5: CIRCLE ONE ONLY<br />
Very easy 1<br />
Fairly easy 2<br />
Neither easy nor difficult 3<br />
Fairly difficult 4<br />
Very difficult 5<br />
Don’t know 6<br />
eftec A- 27<br />
January 2006<br />
1<br />
2<br />
3<br />
4<br />
5<br />
6<br />
7<br />
8<br />
9<br />
10<br />
11
<strong>Economic</strong> <strong>Valuation</strong> <strong>of</strong> <strong>Environmental</strong> <strong>Impacts</strong> <strong>in</strong> the Severely Disadvantaged Areas<br />
Annex 4 – F<strong>in</strong>al Questionnaire<br />
C. Cont<strong>in</strong>gent <strong>Valuation</strong> Section<br />
The policy choices I showed you up to now were about the landscape features <strong>of</strong> the hillfarm<strong>in</strong>g<br />
areas <strong>in</strong> the Region region. For the f<strong>in</strong>al choice, please consider the landscape<br />
features <strong>of</strong> the hill farm<strong>in</strong>g areas <strong>in</strong> the rest <strong>of</strong> England. These are the shaded areas on the<br />
map <strong>of</strong> England.<br />
SHOW MAP R1 AGAIN AND INDICATE THE PINK AREAS ON THE MAP OF ENGLAND<br />
ONE OF SHOWCARDS C1a TO C1f SHOULD HAVE BEEN SELECTED BEFORE THE<br />
START OF THE INTERVIEW (ROTATE THE SHOWCARDS SO THAT ALL ARE USED<br />
EQUALLY OFTEN).<br />
SHOW THE SHOWCARD C1# SELECTED.<br />
This card shows the likely changes <strong>in</strong> other regions under the most likely government policy<br />
for hill farm<strong>in</strong>g. It shows the current policy contrasted with an alternative future policy<br />
option.<br />
C1. In addition to the amount you said you would (or would not) be<br />
will<strong>in</strong>g to pay for alternative policies <strong>in</strong> the Region, would you be will<strong>in</strong>g to<br />
pay this amount here (POINT TO THE SHADED CELL ON SHOWCARD<br />
WHERE AMOUNT IS SHOWN) <strong>in</strong> <strong>in</strong>creased taxes per year, towards the<br />
cost <strong>of</strong> the future policy shown on the card <strong>in</strong> other regions <strong>of</strong> England?<br />
Or would you prefer not to pay and ma<strong>in</strong>ta<strong>in</strong> the current policy?<br />
TICK THE SHOWCARD/AMOUNT USED AND CIRCLE THE ANSWER GIVEN<br />
Amount<br />
C1a £2<br />
C1b £5<br />
C1c £10<br />
C1d £17<br />
C1e £40<br />
C1f £70<br />
Tick if used<br />
Will<strong>in</strong>g to pay<br />
for future<br />
policy<br />
1<br />
GO TO<br />
SECTION D<br />
Not will<strong>in</strong>g to<br />
pay – prefer<br />
current policy<br />
2<br />
GO TO<br />
QUESTION C2<br />
Don’t know<br />
3<br />
GO TO<br />
SECTION D<br />
eftec A- 28<br />
January 2006
<strong>Economic</strong> <strong>Valuation</strong> <strong>of</strong> <strong>Environmental</strong> <strong>Impacts</strong> <strong>in</strong> the Severely Disadvantaged Areas<br />
Annex 4 – F<strong>in</strong>al Questionnaire<br />
C2. What were the ma<strong>in</strong> reasons you were not will<strong>in</strong>g to contribute to the fund<strong>in</strong>g <strong>of</strong><br />
this future policy option?<br />
PROBE FULLY AND WRITE IN, THEN CODE BELOW<br />
……………………………………………………………………………………………………………<br />
………<br />
I’ve already been asked to pay for my own area<br />
I am not (as) <strong>in</strong>terested <strong>in</strong> other regions <strong>of</strong> the country<br />
I can’t afford to pay (more)<br />
The improvements aren’t important to me/ current policy is OK<br />
I seldom see / use the areas described<br />
I never see / use the areas described<br />
I object to pay<strong>in</strong>g <strong>in</strong> this way for environmental improvements <strong>in</strong> these areas<br />
The government or council should pay for this<br />
The farmers should pay for this<br />
Visitors to these areas should pay<br />
I don’t believe the policies would actually happen<br />
Don’t know<br />
None <strong>of</strong> the above<br />
D. SOCIO-ECONOMIC CHARACTERISTICS<br />
D1. Go<strong>in</strong>g back aga<strong>in</strong> just to the Region - do you ever visit any <strong>of</strong> the areas shaded<br />
p<strong>in</strong>k on the map <strong>in</strong> the region? For recreation, for work or for both?<br />
SHOW THE DETAILED REGIONAL MAP AGAIN ON MAP ERROR! REFERENCE SOURCE<br />
NOT FOUND.1 – – INDICATE PINK AREA(S)<br />
IF THEY JUST SAY “YES” FIND OUT IF RECREATION, WORK OR BOTH.<br />
SHORT VISITS (E.G TO WALK THE DOG), DAYS OUT, WEEKENDS AWAY OR LONGER<br />
HOLIDAYS AND VISITING FRIENDS AND FAMILY ALL COUNT AS RECREATION.<br />
YES - RECREATION 1<br />
YES - WORK 2<br />
YES - BOTH 3<br />
NO, NEVER visit these areas 4<br />
eftec A- 29<br />
January 2006<br />
1<br />
2<br />
3<br />
4<br />
5<br />
6<br />
7<br />
8<br />
9<br />
10<br />
11<br />
12<br />
13
<strong>Economic</strong> <strong>Valuation</strong> <strong>of</strong> <strong>Environmental</strong> <strong>Impacts</strong> <strong>in</strong> the Severely Disadvantaged Areas<br />
Annex 4 – F<strong>in</strong>al Questionnaire<br />
D2. How <strong>of</strong>ten to you visit this/these areas <strong>in</strong> your region?<br />
CARD D2: CIRCLE ONE ANSWER ONLY<br />
Every day 1<br />
More than once a week 2<br />
Once a week 3<br />
More than once a month 4<br />
About once a month 5<br />
At least once every six months 6<br />
At least once a year 7<br />
Less than once a year 8<br />
Have visited at least once <strong>in</strong> past 9<br />
Never 10<br />
Don’t know 11<br />
D3. Includ<strong>in</strong>g yourself, how many people <strong>in</strong> your household are:<br />
READ OUT AND INSERT ANSWERS<br />
Over 60 years old ...................<br />
Between 17 years and 60<br />
years old<br />
...................<br />
Between 5 and 16 years old ...................<br />
Below 5 years old ...................<br />
D4. Approximately, how long have you been liv<strong>in</strong>g <strong>in</strong> the Region?<br />
RECORD ANSWER ……………………………years<br />
D5. Th<strong>in</strong>k<strong>in</strong>g ahead, which <strong>of</strong> these phrases best describes how long you th<strong>in</strong>k you will<br />
rema<strong>in</strong> liv<strong>in</strong>g <strong>in</strong> the Region?<br />
CARD D5: CIRCLE ONE ONLY<br />
Less than 6 months 1<br />
At least 1 year 2<br />
At least 5 years 3<br />
At least 10 years 4<br />
I have no <strong>in</strong>tentions <strong>of</strong> mov<strong>in</strong>g out <strong>of</strong><br />
this area<br />
5<br />
Don’t know / Not sure 6<br />
eftec A- 30<br />
January 2006
<strong>Economic</strong> <strong>Valuation</strong> <strong>of</strong> <strong>Environmental</strong> <strong>Impacts</strong> <strong>in</strong> the Severely Disadvantaged Areas<br />
Annex 4 – F<strong>in</strong>al Questionnaire<br />
D6. Are you or is anyone <strong>in</strong> your household a member <strong>of</strong> any <strong>of</strong> these organisations?<br />
CARD D6: CIRCLE ALL THAT APPLY<br />
Royal Society for the Protection <strong>of</strong> Birds 1<br />
The Ramblers’ Association 2<br />
National Trust 3<br />
Friends <strong>of</strong> the Earth / Greenpeace 4<br />
A local wildlife trust or environmental organisation 5<br />
A local recreational club (e.g. angl<strong>in</strong>g or walk<strong>in</strong>g club) 6<br />
National Farmers’ Union 7<br />
Other environmental organisations<br />
Specify……………………………………………………..<br />
8<br />
Other farm<strong>in</strong>g organisations 9<br />
Specify………………………………………………………<br />
D7. At what level did you complete your education?<br />
(IF STILL STUDYING):<br />
Which level best describes the highest level <strong>of</strong> education you have obta<strong>in</strong>ed until now?<br />
CARD D7: CIRCLE ONE ONLY<br />
Primary 1<br />
O levels/ GCSE/ CSE/ School Cert./ Intermediate GNVQ / or<br />
equivalent<br />
2<br />
A levels Advanced/ Vocational tra<strong>in</strong><strong>in</strong>g<br />
(HNC/ HND) (BTEC) or equivalent / Advanced GNVQ<br />
3<br />
Pr<strong>of</strong>essional qualification <strong>of</strong> degree level 4<br />
College/ University/ First degree level 5<br />
Higher degree (MA, MSc, PhD, etc.) 6<br />
eftec A- 31<br />
January 2006
<strong>Economic</strong> <strong>Valuation</strong> <strong>of</strong> <strong>Environmental</strong> <strong>Impacts</strong> <strong>in</strong> the Severely Disadvantaged Areas<br />
Annex 4 – F<strong>in</strong>al Questionnaire<br />
D8. What is your current work status?<br />
CARD D8: CIRCLE ONE ONLY<br />
Self-employed 1<br />
Employed full-time<br />
(30 hours plus per week)<br />
2<br />
Employed part-time<br />
(under 30 hours per week)<br />
3<br />
Student 4<br />
Unemployed 5<br />
Look<strong>in</strong>g after the home full-time / housewife 6<br />
Retired 7<br />
Unable to work due to sickness or disability 8<br />
D9. Could you estimate approximately your total household annual, monthly or weekly<br />
<strong>in</strong>come before tax? Choose from one <strong>of</strong> the categories on this card. Remember to<br />
<strong>in</strong>clude all your sources <strong>of</strong> <strong>in</strong>come, for <strong>in</strong>stance, pensions, benefits, <strong>in</strong>come from<br />
sav<strong>in</strong>gs etc. Your answer is completely confidential. It will be used only for statistical<br />
analysis.<br />
CARD D9: CIRCLE ONE ONLY<br />
Weekly gross Monthly gross Annual gross<br />
K Up to £99 Up to £429 Up to £5,199 1<br />
X £100-£199 £430-£869 £5,200-£10,399 2<br />
A £200-£299 £870-£1,299 £10,400-£15,599 3<br />
L £300-£399 £1,300-£1,699 £15,600-£20,799 4<br />
Z £400-£499 £1,700-£2,199 £20,800-£25,999 5<br />
F £500-£599 £2,200-£2,599 £26,000-£31,199 6<br />
P £600-£799 £2,600-£3,499 £31,200-£41,599 7<br />
C £800-£999 £3,500-£4,299 £41,600-£51,999 8<br />
M £1,000-£1,499 £4,300- £6,299 £52,000-£74,999 9<br />
O £1,500-£1,999 £6,300-£8,299 £75,000-£99,999 10<br />
S £2,000-£2,399 £8,300-<br />
£10,399<br />
H £2,400 or £10,400 or<br />
more<br />
more<br />
£100,000-<br />
£124,999<br />
11<br />
£125,000 or more 12<br />
Don’t know 13<br />
Refused 14<br />
IF RESPONDENT ANSWERS ‘DON’T KNOW’, PLEASE ASK HIM/HER TO GIVE AN<br />
ESTIMATE IF RESPONDENT REFUSES TO ANSWER, PLEASE TELL HIM/HER THAT THE<br />
eftec A- 32<br />
January 2006
<strong>Economic</strong> <strong>Valuation</strong> <strong>of</strong> <strong>Environmental</strong> <strong>Impacts</strong> <strong>in</strong> the Severely Disadvantaged Areas<br />
Annex 4 – F<strong>in</strong>al Questionnaire<br />
ANSWERS ARE COMPLETELY CONFIDENTIAL AND THAT INCOME IS A VERY<br />
IMPORTANT EXPLANATORY FACTOR FOR THE RESEARCHERS.<br />
D10. F<strong>in</strong>ally, what did you th<strong>in</strong>k <strong>of</strong> this questionnaire?<br />
CARD D10: CIRCLE AS MANY AS APPLY<br />
Interest<strong>in</strong>g 1<br />
Too long 2<br />
Difficult to understand 3<br />
Educational 4<br />
Unrealistic / not credible 5<br />
Other (please specify) 6<br />
That’s all the questions I have. Thank you very much for your time.<br />
QUESTION TO YOU, THE INTERVIEWER.<br />
In your op<strong>in</strong>ion, how easy or difficult did the respondent f<strong>in</strong>d it to make decisions<br />
about which options to choose?<br />
Very easy 1<br />
Fairly easy 2<br />
Neither easy nor difficult 3<br />
Fairly difficult 4<br />
Very difficult 5<br />
Don’t know 6<br />
eftec A- 33<br />
January 2006
<strong>Economic</strong> <strong>Valuation</strong> <strong>of</strong> <strong>Environmental</strong><br />
<strong>Impacts</strong> <strong>in</strong> the Severely Disadvantaged<br />
Areas<br />
F<strong>in</strong>al Report – Annexes 5-8<br />
3 rd January 2006<br />
<strong>Economic</strong>s For The Environment Consultancy Ltd (eftec) 16 Percy Street London W1T<br />
1DT, tel: 02075805383, fax: 02075805385, eftec@eftec.co.uk, www.eftec.co.uk
<strong>Economic</strong> <strong>Valuation</strong> <strong>of</strong> <strong>Environmental</strong> <strong>Impacts</strong> <strong>in</strong> the Severely Disadvantaged Areas<br />
Annexes<br />
Table <strong>of</strong> Contents<br />
ANNEX 5 – TECHNICAL ANNEX........................................................................ 34<br />
A5.1 CHOICE EXPERIMENT: INTRODUCTION..............................................................34<br />
A5.2 REGIONAL ANALYSIS ...............................................................................35<br />
A5.3 CONTINGENT VALUATION..........................................................................64<br />
A5.4 COMPARISON OF ELF WTP WITH STUDY WTP.....................................................68<br />
A5.5 THEORETICAL BASIS OF LINEAR TIME TREATMENT OF BENEFITS.....................................69<br />
A5.6 COMPENSATING SURPLUS AGGREGATION ESTIMATES (ADJUSTED VARIANT) .........................70<br />
ANNEX 6 – VALUATION WORKSHOP PROTOCOL................................................... 72<br />
ANNEX 7 - VALUATION WORKSHOPS – RESULTS AND DISCUSSION ............................ 85<br />
A7.1 INTRODUCTION ....................................................................................85<br />
A7.2 WORKSHOP METHODOLOGY........................................................................85<br />
A7.3 RESULTS ..........................................................................................86<br />
A7.4 CONCLUSION ......................................................................................92<br />
ANNEX 8 - PEER REVIEWER REPORT ................................................................ 94<br />
eftec A-i January 2006
<strong>Economic</strong> <strong>Valuation</strong> <strong>of</strong> <strong>Environmental</strong> <strong>Impacts</strong> <strong>in</strong> the Severely Disadvantaged Areas<br />
Annex 5 – Technical Annex<br />
Annex 5 – Technical Annex<br />
A5.1 Choice Experiment: Introduction<br />
A5.1.1 Introduction<br />
The data were <strong>in</strong>itially analyzed us<strong>in</strong>g only the levels <strong>of</strong> attributes as explanatory variables<br />
<strong>in</strong> a Conditional Logit model. In this model, the probability that a particular scenario is<br />
chosen by a respondent is expla<strong>in</strong>ed as a function <strong>of</strong> the levels <strong>of</strong> attributes. Subsequently,<br />
socio-economic and attitud<strong>in</strong>al variables were also added to the model to test the effect <strong>of</strong><br />
relevant <strong>in</strong>dividual characteristics on choice.<br />
An important implication <strong>of</strong> this model specification is that selections from the choice set<br />
must obey the ‘<strong>in</strong>dependence from irrelevant alternatives’ (IIA) property (or Luce’s Choice<br />
Axiom; see Luce, 1959). This property states that the relative probabilities <strong>of</strong> two options<br />
be<strong>in</strong>g selected are unaffected by the <strong>in</strong>troduction or removal <strong>of</strong> other alternatives. This<br />
property follows from the <strong>in</strong>dependence <strong>of</strong> the error terms across the different options<br />
conta<strong>in</strong>ed <strong>in</strong> the choice set. If a violation <strong>of</strong> the IIA hypothesis is observed, then more<br />
complex statistical models are necessary that relax some <strong>of</strong> the assumptions used. These<br />
<strong>in</strong>clude the mult<strong>in</strong>omial probit (Hausman and Wise, 1978), the nested logit (Hensher and<br />
Greene, 1999), the random parameters logit model (Tra<strong>in</strong>, 2003) and the heterogeneous<br />
extreme value logit (Allenby and G<strong>in</strong>ter, 1995). There are numerous formal statistical tests<br />
than can be used to test for violations <strong>of</strong> the IIA assumption. In this study we employed the<br />
test developed by Hausman and McFadden (1984) be<strong>in</strong>g that it is the most widely used.<br />
If the data <strong>of</strong> a specific region did not pass the IIA test, a random parameter logit approach<br />
was chosen for the analysis. Us<strong>in</strong>g this model specification it is also possible to circumvent<br />
the limitation <strong>of</strong> the conditional logit model that assumes that preferences are homogenous<br />
amongst respondents. The random parameters logit model allows for such variation <strong>in</strong><br />
preferences across <strong>in</strong>dividuals. Application requires assumptions be<strong>in</strong>g made about the<br />
distribution <strong>of</strong> preferences. Here it is assumed that preferences relat<strong>in</strong>g to the attributes<br />
are heterogeneous and follow a normal distribution, while preferences towards price are<br />
assumed to be homogeneous. Therefore, separate parameters are estimated for each<br />
<strong>in</strong>dividual for all attributes along with a s<strong>in</strong>gle parameter for all respondents for price. It<br />
results estimate for each attribute a mean value (<strong>in</strong>terpreted as the average preference <strong>of</strong><br />
respondents for the attribute), and a standard deviation value (<strong>in</strong>terpreted as the<br />
magnitude <strong>of</strong> differences <strong>in</strong> respondents’ preferences for the attribute).<br />
A5.1.2 Compensat<strong>in</strong>g surplus calculation<br />
What is sought it is a measure <strong>of</strong> the value to an <strong>in</strong>dividual <strong>of</strong> an <strong>in</strong>crease <strong>in</strong> the quantity <strong>of</strong><br />
a public good (i.e. landscape attributes). From underly<strong>in</strong>g economic theory, the<br />
appropriate measure for this change <strong>in</strong> an <strong>in</strong>dividual’s welfare is that <strong>of</strong> compensat<strong>in</strong>g<br />
surplus. This measure asks what compensat<strong>in</strong>g payment (<strong>in</strong> practical terms what change <strong>in</strong><br />
<strong>in</strong>come/expenditure) will make an <strong>in</strong>dividual <strong>in</strong>different between their orig<strong>in</strong>al level <strong>of</strong><br />
utility and the opportunity to consume the new quantity <strong>of</strong> the public good. Given the<br />
implied property rights (that the <strong>in</strong>dividual is entitled to their current level <strong>of</strong> utility/status<br />
quo), the appropriate metric for measur<strong>in</strong>g the compensat<strong>in</strong>g surplus is that <strong>of</strong> will<strong>in</strong>gness<br />
to pay, which is the amount <strong>of</strong> money an agent would be will<strong>in</strong>g to give up to obta<strong>in</strong> the<br />
change <strong>in</strong> the provision <strong>of</strong> the public good and still be as well as <strong>of</strong>f as their situation prior<br />
to the change.<br />
eftec A- 34<br />
January 2006
<strong>Economic</strong> <strong>Valuation</strong> <strong>of</strong> <strong>Environmental</strong> <strong>Impacts</strong> <strong>in</strong> the Severely Disadvantaged Areas<br />
Annex 5 – Technical Annex<br />
Compensat<strong>in</strong>g surplus welfare measures relative to different environmental scenarios can<br />
be obta<strong>in</strong>ed by apply<strong>in</strong>g the follow<strong>in</strong>g formula:<br />
1<br />
CS = Y −<br />
β<br />
M<br />
( V V )<br />
X<br />
where VX is the utility associated with the “<strong>in</strong>itial state”, VY the utility associated with an<br />
improved state, and βM the monetary attribute coefficient.<br />
Vi is a conditional <strong>in</strong>direct utility function assumed to be l<strong>in</strong>ear <strong>in</strong> parameters:<br />
Vi = C + ∑kβk Xik +∑m γm Smn (2)<br />
where C is the regression constant, Xik is the value <strong>of</strong> attribute k under alternative i; βk are<br />
the regression coefficients associated with attribute k, Smn is the vector <strong>of</strong> socio-economic<br />
characteristics <strong>of</strong> <strong>in</strong>dividual n, and γm is the vector <strong>of</strong> the coefficients associated with the<br />
m <strong>in</strong>dividual socio-economic characteristics.<br />
The follow<strong>in</strong>g formula can be used to estimate the difference <strong>in</strong> utility between any two<br />
alternatives and <strong>in</strong>serted <strong>in</strong>to equation (1) to obta<strong>in</strong> the compensat<strong>in</strong>g surplus estimate:<br />
VB – VA = C + ∑kβk XBk +∑m γm Smn – (C + ∑kβk XAk +∑m γm Smn)<br />
= ∑kβk XBk - ∑kβk XAk = ∑kβk (XBk - XAk) (3)<br />
A5.2 Regional Analysis<br />
A5.2.1 West Midlands<br />
In the West Midlands region 318 respondents were <strong>in</strong>terviewed. Of the total number <strong>of</strong><br />
responses 45 expressed a protest answer regard<strong>in</strong>g the proposed project; these protest bids<br />
were removed from the sample. All respondents that displayed a genu<strong>in</strong>e zero WTP (WTP)<br />
by always choos<strong>in</strong>g the current policy option (5%), and those that chose either alternative A<br />
or B at least once were considered <strong>in</strong> the analysis, giv<strong>in</strong>g a total number <strong>of</strong> 1638 [(318-45) x<br />
6)] observations for model estimation.<br />
Analysis <strong>of</strong> West Midlands data showed that the simple conditional logit model specification<br />
cannot be used s<strong>in</strong>ce both models (attributes only and attributes plus socioeconomic<br />
variables) suffer from IIA violations. Table A5.1 shows the attributes only RPL model.<br />
eftec A- 35<br />
January 2006<br />
(1)
<strong>Economic</strong> <strong>Valuation</strong> <strong>of</strong> <strong>Environmental</strong> <strong>Impacts</strong> <strong>in</strong> the Severely Disadvantaged Areas<br />
Annex 5 – Technical Annex<br />
Table A5.1: Random parameters logit model; Maximum Likelihood Estimates<br />
Dependent variable: CHOICE<br />
Number <strong>of</strong> obs.: 1638, skipped 1 bad obs.<br />
Iterations completed: 43<br />
Log likelihood function: 1553.938<br />
Number <strong>of</strong> parameters: 14<br />
Restricted log likelihood: -1798.428<br />
Chi squared: 488.9815<br />
Degrees <strong>of</strong> freedom: 14<br />
Prob[ChiSqd > value] = .0000000<br />
Variable Coefficient (b) Standard Error t values Significance<br />
Mean values<br />
K 1.196 0.137 8.733 0.000<br />
HMB 0.030 0.007 4.280 0.000<br />
RG 0.009 0.006 1.559 0.119<br />
BMW 0.016 0.008 2.134 0.033<br />
FB 0.001 0.001 0.824 0.410<br />
CH1 -0.015 0.071 -0.215 0.830<br />
CH2 0.248 0.076 3.255 0.001<br />
TAX -0.038 0.003 -13.038 0.000<br />
Standard deviation values<br />
NsHMB 0.054 0.011 4.834 0.000<br />
NsRG 0.050 0.007 6.931 0.000<br />
NsBMW 0.074 0.010 7.701 0.000<br />
NsFB 0.004 0.002 2.760 0.006<br />
NsCH1 0.522 0.110 4.741 0.000<br />
NsCH2 0.601 0.098 6.132 0.000<br />
Clarification:<br />
K: Constant term, = 0 <strong>in</strong> the current policy and 1 <strong>in</strong> alternatives A and B.<br />
HMB: Change <strong>in</strong> area <strong>of</strong> Heather Moorland and Bog<br />
RG: Change <strong>in</strong> area <strong>of</strong> Rough Grassland<br />
BMW: Change <strong>in</strong> area <strong>of</strong> Broadleaf and mixed woodlands<br />
FB: Change <strong>in</strong> length <strong>of</strong> field boundaries<br />
Cultural heritage as a qualitative <strong>in</strong>dicator has to be coded so that:<br />
CH1: shows change <strong>in</strong> cultural heritage from ‘rapid decl<strong>in</strong>e’ to ‘no change’<br />
CH2: shows change <strong>in</strong> cultural heritage from ‘rapid decl<strong>in</strong>e’ to ‘much better conservation’<br />
Tax: Increase <strong>in</strong> tax payments per annum<br />
Overall the model is highly significant, although the fitt<strong>in</strong>g to data is moderate (ρ 2 = 0.14) 1 .<br />
Turn<strong>in</strong>g to the attribute coefficients, the change <strong>in</strong> the area <strong>of</strong> rough grassland and the<br />
change <strong>in</strong> the length <strong>of</strong> field boundaries did not affect respondents’ choices. Neither did<br />
the prospect <strong>of</strong> improvement <strong>in</strong> cultural heritage from “rapid decl<strong>in</strong>e” to “no change”. The<br />
significance and positive sign <strong>of</strong> the constant term shows that respondents are, all else<br />
be<strong>in</strong>g equal, <strong>in</strong> favour <strong>of</strong> the payments to farmers for the “environmental services” they<br />
provide. A negative and significant constant term would have suggested a current situation<br />
bias – i.e. a tendency to keep the current situation and prefer not to make payments.<br />
Increas<strong>in</strong>g the areas <strong>of</strong> heather moorland and bog and broadleaf and mixed woodland are<br />
changes positively evaluated by respondents. The same is true for the cultural heritage<br />
attribute when the change be<strong>in</strong>g evaluated is an improvement from a “rapid decl<strong>in</strong>e”<br />
situation to “much better conservation”. Cost is highly significant and has a negative sign,<br />
1 Simulations by Dom<strong>in</strong>ick and McFadden (1975) compare values <strong>of</strong> ρ 2 between 0.2-0.4 to values<br />
between 0.7-0.9 <strong>of</strong> the R 2 <strong>in</strong> the case <strong>of</strong> the ord<strong>in</strong>ary l<strong>in</strong>ear regression.<br />
eftec A- 36<br />
January 2006
<strong>Economic</strong> <strong>Valuation</strong> <strong>of</strong> <strong>Environmental</strong> <strong>Impacts</strong> <strong>in</strong> the Severely Disadvantaged Areas<br />
Annex 5 – Technical Annex<br />
show<strong>in</strong>g that the higher the cost associated with a policy option, the less likely a given<br />
respondent is to choose that option.<br />
Interest<strong>in</strong>gly, all standard deviation terms are significant, <strong>in</strong>dicat<strong>in</strong>g preference<br />
heterogeneity does <strong>in</strong>deed exist. Under these circumstances, it is not surpris<strong>in</strong>g that the<br />
conditional logit model did not fully describe respondents’ preferences. There is no clear<br />
direction <strong>of</strong> preferences amongst respondents. For <strong>in</strong>stance, from the mean and standard<br />
deviation values <strong>of</strong> the heather moorland and bog attribute it can be seen that 27% <strong>of</strong><br />
respondents have negative preferences for <strong>in</strong>creases <strong>in</strong> the area <strong>of</strong> this attribute 2 . It is<br />
noteworthy that the standard deviation <strong>of</strong> the rough grassland attribute is five times<br />
greater than its mean, show<strong>in</strong>g an extreme heterogeneity <strong>in</strong> people’s preferences. In this<br />
case 43% <strong>of</strong> respondents prefer a reduction <strong>of</strong> the area <strong>of</strong> rough grassland and 57% an<br />
<strong>in</strong>crease.<br />
In summary, the model <strong>in</strong>dicates that respondents value programs which result <strong>in</strong> greater<br />
heather moorland and bog area, an <strong>in</strong>crease <strong>in</strong> woodlands area, much better conservation<br />
<strong>of</strong> cultural heritage, and the less these programs cost the better. But with<strong>in</strong> the sample a<br />
high degree <strong>of</strong> heterogeneity exists.<br />
By <strong>in</strong>clud<strong>in</strong>g <strong>in</strong>dividual socioeconomic and attitud<strong>in</strong>al variables it is possible to expla<strong>in</strong> a<br />
part <strong>of</strong> respondent heterogeneity. For <strong>in</strong>stance, people that give a high value to landscape<br />
conservation or that use it regularly for personal purposes (recreation, work, etc.) should<br />
be more likely to choose policy options <strong>in</strong> favour <strong>of</strong> the payments to farmers to <strong>in</strong>crease the<br />
quality <strong>of</strong> landscape.<br />
Table A5.2 presents a random parameter logit model <strong>in</strong> which the socioeconomic and<br />
attitud<strong>in</strong>al characteristics <strong>of</strong> respondents have been added.<br />
2 This is the probability at zero <strong>of</strong> a normal distributed random variable with mean = 0.03 and<br />
standard deviation = 0.05. Zero represents the cut-<strong>of</strong>f between positive and negative preferences for<br />
an attribute.<br />
eftec A- 37<br />
January 2006
<strong>Economic</strong> <strong>Valuation</strong> <strong>of</strong> <strong>Environmental</strong> <strong>Impacts</strong> <strong>in</strong> the Severely Disadvantaged Areas<br />
Annex 5 – Technical Annex<br />
Table A5.2: Random parameters logit model (socio-economics)<br />
Dependent variable: CHOICE<br />
Number <strong>of</strong> obs.: 1638, skipped 481 bad obs<br />
Iterations completed: 42<br />
Log likelihood function: -1059.020<br />
Number <strong>of</strong> parameters: 25<br />
Restricted log likelihood: -1271.094<br />
Chi squared: 424.1489<br />
Degrees <strong>of</strong> freedom: 25<br />
Prob[ChiSqd > value] = .0000000<br />
Variable Coefficient (b) Standard Error t values Significance<br />
Mean values<br />
K 3.880 0.861 4.507 0.000<br />
HMB 0.035 0.008 4.206 0.000<br />
RG 0.008 0.007 1.167 0.243<br />
BMW 0.023 0.010 2.393 0.017<br />
FB 0.001 0.001 1.265 0.206<br />
CH1 0.033 0.074 0.452 0.651<br />
CH2 0.214 0.098 2.176 0.030<br />
TAX -0.039 0.004 -10.913 0.000<br />
AGE 0.342 0.188 1.821 0.069<br />
GENDER -0.497 0.232 -2.141 0.032<br />
ENVIMP -0.585 0.204 -2.871 0.004<br />
VISFREQ -0.222 0.052 -4.263 0.000<br />
LIVING -0.012 0.008 -1.550 0.121<br />
REMAIN -0.204 0.113 -1.801 0.072<br />
MEMBER 0.564 0.238 2.373 0.018<br />
EDU 0.126 0.082 1.527 0.127<br />
EMPLOY -0.230 0.250 -0.920 0.357<br />
RURAL -1.559 0.435 -3.583 0.000<br />
INCOME 0.109 0.091 1.199 0.231<br />
Standard deviation values<br />
NsHMB 0.054 0.014 3.951 0.000<br />
NsRG 0.050 0.009 5.664 0.000<br />
NsBMW 0.078 0.012 6.574 0.000<br />
NsFB 0.003 0.002 1.570 0.117<br />
NsCH1 0.199 0.169 1.179 0.238<br />
NsCH2 0.760 0.099 7.671 0.000<br />
Clarification <strong>of</strong> socioeconomic variables: (for attributes see Table A5.1).<br />
AGE: Respondents’ age (1 = 18-34; 2 = 35-54; 3= 55-70)<br />
GENDER: Respondents’ gender (0=female; 1= male)<br />
ENVIMP: Rank<strong>in</strong>g <strong>of</strong> environmental policy relative to other policies (1=very important; 4= not<br />
important)<br />
VISFREQ: Respondents’ frequency <strong>of</strong> visits to severely disadvantaged areas (1= every day; 10 =<br />
never)<br />
LIVING: number <strong>of</strong> years respondents have been liv<strong>in</strong>g <strong>in</strong> the area<br />
REMAIN: time period respondents th<strong>in</strong>g are stay<strong>in</strong>g <strong>in</strong> the area (1=less than 6 month; 5=for<br />
ever)<br />
MEMBER: dummy = 1 if respondents’ belong to any “environmental” or trust organization and 0<br />
otherwise<br />
EDU: Respondents’ education (1= primary, 6= higher degree)<br />
EMPLOY: dummy = 0 if respondent is not an active worker; 1 otherwise<br />
RURAL: dummy = 0 if respondent is an urban dweller, 1 if he/she is a rural dweller.<br />
INCOME: respondents’ per capita <strong>in</strong>comes.<br />
eftec A- 38<br />
January 2006
<strong>Economic</strong> <strong>Valuation</strong> <strong>of</strong> <strong>Environmental</strong> <strong>Impacts</strong> <strong>in</strong> the Severely Disadvantaged Areas<br />
Annex 5 – Technical Annex<br />
Before turn<strong>in</strong>g to a discussion <strong>of</strong> the model coefficients, it is worth not<strong>in</strong>g that this model is<br />
estimated by us<strong>in</strong>g 480 fewer observations than the attributes only model, due to miss<strong>in</strong>g<br />
data <strong>in</strong> the socioeconomic characteristics. Hence add<strong>in</strong>g <strong>in</strong>dividual characteristics has a<br />
cost <strong>in</strong> terms <strong>of</strong> miss<strong>in</strong>g <strong>in</strong>formation.<br />
The <strong>in</strong>terpretation <strong>of</strong> the coefficients is exactly the as <strong>in</strong> the attributes only model, save<br />
that the field boundaries attribute and the cultural heritage change from “rapid decl<strong>in</strong>e” to<br />
“no change” are no longer heterogeneous <strong>in</strong> preference. This implies that the<br />
socioeconomic variables now capture this heterogeneity.<br />
Turn<strong>in</strong>g to the <strong>in</strong>terpretation <strong>of</strong> <strong>in</strong>dividuals’ characteristics 3 , it can be seen that females<br />
and older people are more likely to choose option A or B. Consistently, people who assigned<br />
a high importance to environmental policy relative to other policies are more likely to<br />
choose alternative A or B over the current policy. Along the same l<strong>in</strong>e, people that visit the<br />
region more <strong>of</strong>ten are <strong>in</strong> favour <strong>of</strong> the payments to farmers. The same is true for people<br />
that belong an environmental, heritage, recreation or farm<strong>in</strong>g organization. However, the<br />
longer respondents th<strong>in</strong>k they will rema<strong>in</strong> <strong>in</strong> the region, the less likely they are to be<br />
will<strong>in</strong>g to contribute to alternative policies. F<strong>in</strong>ally, rural people tend to prefer the current<br />
policy.<br />
The random parameter model with socioeconomic <strong>in</strong>formation provides a useful <strong>in</strong>sight <strong>in</strong>to<br />
the effects <strong>of</strong> <strong>in</strong>dividual characteristics on choices, but <strong>in</strong> this dataset, it makes little<br />
difference to attribute significances and values. It can be seen that the attribute values are<br />
very similar <strong>in</strong> the two models. For statistical parsimony, the attributes only random<br />
parameter logit model will be used when estimat<strong>in</strong>g implicit prices and compensat<strong>in</strong>g<br />
surplus measures.<br />
Table A5.3 shows the implicit prices for the attributes and the respective 95% confidence<br />
<strong>in</strong>tervals, calculated us<strong>in</strong>g the Kr<strong>in</strong>sky and Robb (1986) procedure. The implicit prices for<br />
all significant attributes are positive 4 , imply<strong>in</strong>g that respondents have a positive will<strong>in</strong>gness<br />
to pay (WTP) for <strong>in</strong>creases <strong>in</strong> the quality or quantity <strong>of</strong> each attribute. In the case <strong>of</strong><br />
quantitative attributes, the implicit prices represent the WTP to achieve one unit more<br />
(one percent more <strong>in</strong> this study) <strong>of</strong> the attribute considered. For cultural heritage, the<br />
implicit price reflects the WTP for a discrete change <strong>in</strong> the attribute's level, from ‘rapid<br />
decl<strong>in</strong>e’ to ‘much better conservation’. These implicit prices afford some understand<strong>in</strong>g <strong>of</strong><br />
the relative importance <strong>of</strong> each attribute, and can be used by policy makers to assign more<br />
resources to improv<strong>in</strong>g those attributes which have higher implicit prices.<br />
3 Socio-economic characteristics cannot be <strong>in</strong>troduced alone <strong>in</strong>to the model. This is because Hessian<br />
s<strong>in</strong>gularities would arise <strong>in</strong> the model estimation. To circumvent this problem <strong>in</strong> this study the<br />
<strong>in</strong>dividual socio-economic characteristics are <strong>in</strong>troduced as <strong>in</strong>teractions with the constant. The<br />
result<strong>in</strong>g <strong>in</strong>teraction coefficients have to be <strong>in</strong>terpreted as the effect that socio-economic<br />
characteristics <strong>of</strong> <strong>in</strong>dividuals have on the probability <strong>of</strong> choos<strong>in</strong>g the alternative A or B over the<br />
current policy option. For <strong>in</strong>stance, a positive coefficient for “age” means that older people are more<br />
likely to choose alternative A and B than the current policy.<br />
4 If a coefficient is not significantly different from zero neither is its implicit price, as can be<br />
observed <strong>in</strong> the 95% confidence <strong>in</strong>tervals <strong>of</strong> Table A5.3.<br />
eftec A- 39<br />
January 2006
<strong>Economic</strong> <strong>Valuation</strong> <strong>of</strong> <strong>Environmental</strong> <strong>Impacts</strong> <strong>in</strong> the Severely Disadvantaged Areas<br />
Annex 5 – Technical Annex<br />
Table A5.3: Implicit prices and 95% confidence <strong>in</strong>terval.<br />
Attributes Implicit price<br />
95% lower<br />
bound<br />
95% upper<br />
bound<br />
Heather moorland and bog 0.80 0.42 1.18<br />
Rough grassland 0.25 -0.05 0.53<br />
Broadleaf and mixed woodlands 0.43 0.07 0.81<br />
Field boundaries 0.02 -0.02 0.05<br />
Cultural heritage:<br />
from “rapid decl<strong>in</strong>e” to “no change”<br />
Cultural heritage:<br />
from “rapid decl<strong>in</strong>e” to “much better<br />
conservation”<br />
-0.40 -4.27 3.03<br />
6.56 2.49 10.73<br />
Us<strong>in</strong>g the choice model parameters it is also possible to obta<strong>in</strong> compensat<strong>in</strong>g surplus<br />
estimates for the required range <strong>of</strong> policy scenarios, as detailed <strong>in</strong> Table 2.2 <strong>of</strong> the ma<strong>in</strong><br />
report. Table A5.4 shows the appropriate mean compensat<strong>in</strong>g surpluses and their<br />
correspond<strong>in</strong>g 95% confidence <strong>in</strong>tervals. As expected, the compensat<strong>in</strong>g surplus for the<br />
change from the current policy to the scenarios considered <strong>in</strong> the example <strong>in</strong>creases with<br />
better environmental conditions.<br />
Table A5.4: Compensat<strong>in</strong>g surplus to change from the basel<strong>in</strong>e scenario to each <strong>of</strong> the<br />
alternative policy scenarios, and 95% confidence <strong>in</strong>tervals<br />
Scenario<br />
Compensat<strong>in</strong>g surplus<br />
(£)<br />
95% lower<br />
bound<br />
95% upper<br />
bound<br />
Scenario 1<br />
7.44 0.39 14.42<br />
Scenario 2<br />
10.04 2.58 17.51<br />
Scenario 3<br />
-1.5 -3.36 0.42<br />
In the survey follow-up questions 53% <strong>of</strong> respondents declared the attribute that concerned<br />
them the most when mak<strong>in</strong>g choices was the cost, followed by broadleaf and mixed<br />
woodland (19%). The attribute that concerned respondents the least was rough grassland,<br />
chosen by only 3% <strong>of</strong> respondents as most important.<br />
Regard<strong>in</strong>g respondents’ cited reasons for be<strong>in</strong>g will<strong>in</strong>g to pay for landscape improvements,<br />
environmental concerns followed by personal or family enjoyment and the enjoyment <strong>of</strong><br />
future generations <strong>in</strong> the countryside were the most commonly cited reasons (see Fig.<br />
A5.1). Note that these percentages are approximate s<strong>in</strong>ce responses could be coded under<br />
more than one category.<br />
eftec A- 40<br />
January 2006
<strong>Economic</strong> <strong>Valuation</strong> <strong>of</strong> <strong>Environmental</strong> <strong>Impacts</strong> <strong>in</strong> the Severely Disadvantaged Areas<br />
Annex 5 – Technical Annex<br />
23%<br />
9% 2%<br />
17%<br />
16%<br />
7%<br />
1%<br />
4%<br />
21%<br />
Personal family enjoyment<br />
Other enjoyment altruism<br />
Other enjoyment future<br />
Personal f<strong>in</strong>ancial ga<strong>in</strong><br />
Other f<strong>in</strong>ancial ga<strong>in</strong><br />
Preserve heritage<br />
communities<br />
<strong>Environmental</strong> concerns<br />
Moral obligation<br />
Warm glow<br />
Figure A5.1: Pie chart show<strong>in</strong>g the break down <strong>of</strong> why respondents <strong>in</strong> the West<br />
Midlands were will<strong>in</strong>g to pay for alternative policies over the current policy.<br />
A5.2.2 North West<br />
In the North West region 335 respondents were <strong>in</strong>terviewed. Of the total number <strong>of</strong><br />
responses, 88 expressed a protest answer regard<strong>in</strong>g the proposed project; these protest<br />
bids were removed from the sample. All respondents that displayed a genu<strong>in</strong>e zero WTP by<br />
always choos<strong>in</strong>g the current policy option (17%), and those that chose either alternative A<br />
or B at least once were considered <strong>in</strong> the analysis, giv<strong>in</strong>g a total number <strong>of</strong> 1482 [(335-88) x<br />
6)] observations for model estimation.<br />
Analysis <strong>of</strong> North West data showed that the simple conditional logit model specification<br />
cannot be used s<strong>in</strong>ce both models (attributes only and attributes plus socioeconomic<br />
variables) suffer from IIA violations. Table A5.5 shows the attributes only RPL model.<br />
eftec A- 41<br />
January 2006
<strong>Economic</strong> <strong>Valuation</strong> <strong>of</strong> <strong>Environmental</strong> <strong>Impacts</strong> <strong>in</strong> the Severely Disadvantaged Areas<br />
Annex 5 – Technical Annex<br />
Table A5.5: Random parameters logit model; Maximum Likelihood Estimates<br />
Dependent variable: CHOICE<br />
Number <strong>of</strong> obs.: 1482, skipped 1 bad obs.<br />
Iterations completed: 40<br />
Log likelihood function: -1158.275<br />
Number <strong>of</strong> parameters: 14<br />
Restricted log likelihood: -1627.045<br />
Chi squared: 937.5401<br />
Degrees <strong>of</strong> freedom: 14<br />
Prob[ChiSqd > value] = .0000000<br />
Variable Coefficient (b) Standard Error t values Significance<br />
Mean values<br />
K -1.162 0.194 -5.994 0.000<br />
HMB 0.048 0.011 4.248 0.000<br />
RG 0.041 0.011 3.790 0.000<br />
BMW 0.043 0.011 3.894 0.000<br />
FB -0.001 0.001 -0.716 0.474<br />
CH1 0.082 0.113 0.725 0.469<br />
CH2 0.215 0.141 1.527 0.127<br />
TAX -0.066 0.005 -12.944 0.000<br />
Standard deviation values<br />
NsHMB 0.096 0.016 5.834 0.000<br />
NsRG 0.099 0.010 9.604 0.000<br />
NsBMW 0.063 0.016 3.849 0.000<br />
NsFB 0.009 0.002 5.674 0.000<br />
NsCH1 0.554 0.152 3.636 0.000<br />
NsCH2 1.056 0.141 7.486 0.000<br />
Clarification:<br />
K: Constant term, = 0 <strong>in</strong> the current policy and 1 <strong>in</strong> alternatives A and B.<br />
HMB: Change <strong>in</strong> area <strong>of</strong> Heather Moorland and Bog<br />
RG: Change <strong>in</strong> area <strong>of</strong> Rough Grassland<br />
BMW: Change <strong>in</strong> area <strong>of</strong> Broadleaf and mixed woodlands<br />
FB: Change <strong>in</strong> length <strong>of</strong> field boundaries<br />
Cultural heritage as a qualitative <strong>in</strong>dicator has to be coded so that:<br />
CH1: shows change <strong>in</strong> cultural heritage from ‘rapid decl<strong>in</strong>e’ to ‘no change’<br />
CH2: shows change <strong>in</strong> cultural heritage from ‘rapid decl<strong>in</strong>e’ to ‘much better conservation’<br />
Tax: Increase <strong>in</strong> tax payments per annum<br />
Overall the model is highly significant and the fitt<strong>in</strong>g to data is high (ρ 2 = 0.29). Turn<strong>in</strong>g to<br />
the attribute coefficients, the change <strong>in</strong> the length <strong>of</strong> field boundaries and the effect that<br />
future policies might have on cultural heritage did not affect respondents’ choices. The<br />
significance and negative sign <strong>of</strong> the constant term shows that respondents are, all else<br />
be<strong>in</strong>g equal, <strong>in</strong> favour <strong>of</strong> ma<strong>in</strong>ta<strong>in</strong><strong>in</strong>g the current policy. This reveals the presence <strong>of</strong> a<br />
status quo bias, a phenomenon that has been noted before <strong>in</strong> environmental applications <strong>of</strong><br />
choice experiments (e.g. Adamowicz et al., 1998; Hanley, Adamowicz and Wright, 2005).<br />
These authors identified three possible reasons to expla<strong>in</strong> status quo bias: (i) some k<strong>in</strong>d <strong>of</strong><br />
endowment effect; (ii) mistrust <strong>of</strong> the government to actually undertake programmes<br />
effectively; and (iii) people f<strong>in</strong>d<strong>in</strong>g the choice task to be too complex, and pick<strong>in</strong>g the<br />
current policy as an easy opt-out. Consider<strong>in</strong>g that <strong>in</strong> the region 26% <strong>of</strong> the sample<br />
expressed a protest answer, and 17% always chose the current policy option, both po<strong>in</strong>ts (i)<br />
and (ii) can reasonably expla<strong>in</strong> the status quo bias. On the other hand, we do not have<br />
enough <strong>in</strong>formation (see the end <strong>of</strong> this section) to say how difficult respondents found the<br />
choice task, s<strong>in</strong>ce 55% reported a “don’t know” answer to the question “how easy or<br />
difficult did you f<strong>in</strong>d it to make your decisions?”.<br />
eftec A- 42<br />
January 2006
<strong>Economic</strong> <strong>Valuation</strong> <strong>of</strong> <strong>Environmental</strong> <strong>Impacts</strong> <strong>in</strong> the Severely Disadvantaged Areas<br />
Annex 5 – Technical Annex<br />
Increas<strong>in</strong>g heather moorland and bog, rough grassland and broadleaf and mixed woodlands<br />
are changes positively evaluated by respondents. Cost is highly significant and has a<br />
negative sign, show<strong>in</strong>g that the higher the cost <strong>of</strong> a policy option, the less likely a given<br />
respondent is to choose it.<br />
Interest<strong>in</strong>gly, all the standard deviation terms are highly significant, <strong>in</strong>dicat<strong>in</strong>g preference<br />
heterogeneity does <strong>in</strong>deed exist. Under these circumstances it is not surpris<strong>in</strong>g that the<br />
conditional logit model did not fully describe respondents’ preferences. There is not a clear<br />
direction <strong>of</strong> preferences amongst respondents. For <strong>in</strong>stance, from the mean and standard<br />
deviation values <strong>of</strong> the heather moorland and bog attribute it can be seen that 31% <strong>of</strong><br />
respondents have negative preferences for <strong>in</strong>creases <strong>in</strong> the area <strong>of</strong> that attribute 5 . The<br />
same is valid for the rough grassland and broadleaf and mixed woodland attributes where<br />
34% and 25% respectively <strong>of</strong> respondents had negative preferences for <strong>in</strong>creas<strong>in</strong>g the area<br />
<strong>of</strong> these attributes.<br />
In summary, the model suggests that respondents value programs which result <strong>in</strong> greater<br />
areas <strong>of</strong> heather moorland and bog, rough grassland area and woodland. Aga<strong>in</strong>, the less<br />
these programs cost the better. But with<strong>in</strong> the sample a high degree <strong>of</strong> heterogeneity<br />
exists.<br />
By <strong>in</strong>clud<strong>in</strong>g <strong>in</strong>dividual socioeconomic and attitud<strong>in</strong>al variables it is possible to partially<br />
expla<strong>in</strong> this heterogeneity. For <strong>in</strong>stance, people that give a high value to landscape<br />
conservation or that encounter it regularly for recreational or work reasons should be more<br />
likely to choose policy options <strong>in</strong> favour <strong>of</strong> the payments to farmers to <strong>in</strong>crease the quality<br />
<strong>of</strong> landscape.<br />
Table A5.6 presents a random parameter logit model <strong>in</strong> which the socioeconomic and<br />
attitud<strong>in</strong>al characteristics <strong>of</strong> respondents have been added.<br />
Before turn<strong>in</strong>g to a discussion <strong>of</strong> model coefficients, it is worth not<strong>in</strong>g that this model is<br />
estimated by us<strong>in</strong>g 409 fewer observations than the attributes only model, due to miss<strong>in</strong>g<br />
data <strong>in</strong> the socioeconomic characteristics. So add<strong>in</strong>g the <strong>in</strong>dividual characteristics has a<br />
cost <strong>in</strong> terms <strong>of</strong> miss<strong>in</strong>g <strong>in</strong>formation.<br />
The <strong>in</strong>terpretation <strong>of</strong> the coefficients is quite different to the attributes only model, so<br />
that the heterogeneity expla<strong>in</strong>ed from the socioeconomic variables matter <strong>in</strong> this model.<br />
Here comments are only made on differences with respect to the previous model; the<br />
constant is now no longer significant, and that implies the addition <strong>of</strong> <strong>in</strong>dividual<br />
characteristics expla<strong>in</strong>s part <strong>of</strong> the unexpla<strong>in</strong>ed variance that was caught by the constant <strong>in</strong><br />
the attributes only model. The change from “rapid decl<strong>in</strong>e” to “no change” <strong>in</strong> cultural<br />
heritage is also now significant.<br />
5 This is the probability at zero <strong>of</strong> a normal distributed random variable with mean = 0.03 and<br />
standard deviation = 0.05. Zero represents the cut-<strong>of</strong>f between positive and negative preferences for<br />
an attribute.<br />
eftec A- 43<br />
January 2006
<strong>Economic</strong> <strong>Valuation</strong> <strong>of</strong> <strong>Environmental</strong> <strong>Impacts</strong> <strong>in</strong> the Severely Disadvantaged Areas<br />
Annex 5 – Technical Annex<br />
Table A5.6: Random parameters logit model (socio-economics)<br />
Dependent variable: CHOICE<br />
Number <strong>of</strong> obs.: 1482, skipped 409 bad obs.<br />
Iterations completed: 47<br />
Log likelihood function: -760.8772<br />
Number <strong>of</strong> parameters: 25<br />
Restricted log likelihood: -1178.811<br />
Chi squared: 835.8675<br />
Degrees <strong>of</strong> freedom: 25<br />
Prob[ChiSqd > value] = .0000000<br />
Variable Coefficient (b) Standard Error t values Significance<br />
Mean values<br />
K -0.485 0.933 -0.519 0.604<br />
HMB 0.062 0.014 4.584 0.000<br />
RG 0.059 0.012 4.948 0.000<br />
BMW 0.049 0.012 4.133 0.000<br />
FB 0.000 0.002 0.257 0.797<br />
CH1 0.082 0.121 0.680 0.497<br />
CH2 0.391 0.143 2.736 0.006<br />
TAX -0.080 0.007 -11.733 0.000<br />
AGE -0.463 0.223 -2.082 0.037<br />
GENDER 0.079 0.276 0.285 0.776<br />
ENVIMP -0.899 0.192 -4.679 0.000<br />
VISFREQ 0.153 0.064 2.399 0.016<br />
LIVING -0.022 0.009 -2.434 0.015<br />
REMAIN -0.150 0.125 -1.202 0.230<br />
MEMBER 0.936 0.407 2.296 0.022<br />
EDU 0.482 0.109 4.413 0.000<br />
EMPLOY 1.343 0.336 4.001 0.000<br />
RURAL -1.083 0.514 -2.108 0.035<br />
INCOME 0.166 0.105 1.579 0.114<br />
Standard deviation values<br />
NsHMB 0.089 0.021 4.309 0.000<br />
NsRG 0.080 0.012 6.534 0.000<br />
NsBMW 0.031 0.020 1.528 0.127<br />
NsFB 0.010 0.002 4.466 0.000<br />
NsCH1 0.479 0.167 2.863 0.004<br />
NsCH2 0.667 0.163 4.086 0.000<br />
Clarification <strong>of</strong> socioeconomic variables: (for attributes see Table A5.1).<br />
AGE: Respondents’ age (1 = 18-34; 2 = 35-54; 3= 55-70)<br />
GENDER: Respondents’ gender (0=female; 1= male)<br />
ENVIMP: Rank<strong>in</strong>g <strong>of</strong> environmental policy relative ot other policies (1=very important; 4= not<br />
important)<br />
VISFREQ: Respondent’s frequency <strong>of</strong> visits to severely disadvantaged areas (1= every day; 10 =<br />
never)<br />
LIVING: number <strong>of</strong> years respondents have been liv<strong>in</strong>g <strong>in</strong> the area<br />
REMAIN: time period respondents th<strong>in</strong>g are stay<strong>in</strong>g <strong>in</strong> the area (1=less than 6 month; 5=for<br />
ever)<br />
MEMBER: dummy = 1 if respondents’ belong to any “environmental” or trust organization and 0<br />
otherwise<br />
EDU: Respondents’ education (1= primary, 6= higher degree)<br />
EMPLOY: dummy = 0 if respondent is not an active worker; 1 otherwise<br />
RURAL: dummy = 0 if respondent is an urban dweller, 1 if he/she is a rural dweller.<br />
INCOME: respondents’ per capita <strong>in</strong>comes.<br />
eftec A- 44<br />
January 2006
<strong>Economic</strong> <strong>Valuation</strong> <strong>of</strong> <strong>Environmental</strong> <strong>Impacts</strong> <strong>in</strong> the Severely Disadvantaged Areas<br />
Annex 5 – Technical Annex<br />
The random parameter model with socioeconomic <strong>in</strong>formation provides a useful <strong>in</strong>sight <strong>in</strong>to<br />
the effects <strong>of</strong> <strong>in</strong>dividual characteristics and it is used <strong>in</strong> the estimation <strong>of</strong> implicit prices<br />
and compensat<strong>in</strong>g surplus measures.<br />
Table A5.7 shows the implicit prices for the attributes and the respective 95% confidence<br />
<strong>in</strong>tervals, calculated us<strong>in</strong>g the Kr<strong>in</strong>sky and Robb (1986) procedure. The implicit prices for<br />
all significant attributes are positive, imply<strong>in</strong>g that respondents have a positive WTP for<br />
<strong>in</strong>creases <strong>in</strong> the quality or quantity <strong>of</strong> each attribute. In case <strong>of</strong> quantitative attributes the<br />
implicit prices represent the WTP to achieve one unit more (one percent more <strong>in</strong> this study)<br />
<strong>of</strong> the attribute considered. For cultural heritage, the implicit price reflects the WTP for a<br />
discrete change <strong>in</strong> the attribute's level, for example to improve farm build<strong>in</strong>g and<br />
traditional farm practices from ‘rapid decl<strong>in</strong>e’ to ‘much better conservation’.<br />
Table A5.7: Implicit prices and 95% confidence <strong>in</strong>terval.<br />
Attributes Implicit price<br />
95% lower<br />
bound<br />
Heather moorland and bog<br />
0.78 0.45 1.11<br />
Rough grassland<br />
0.74 0.45 1.05<br />
Broadleaf and mixed woodlands<br />
0.61 0.30 0.91<br />
Field boundaries<br />
Cultural heritage:<br />
0.00 -0.03 0.04<br />
from “rapid decl<strong>in</strong>e” to “no change”<br />
Cultural heritage:<br />
1.03 -1.84 4.14<br />
from “rapid decl<strong>in</strong>e” to “much better<br />
conservation” 4.89 1.52 8.43<br />
95% upper<br />
bound<br />
Us<strong>in</strong>g the choice model parameters it is also possible to obta<strong>in</strong> compensat<strong>in</strong>g surplus<br />
estimates for the required range <strong>of</strong> policy scenarios, as detailed <strong>in</strong> Table 2.2 <strong>of</strong> the ma<strong>in</strong><br />
report. Table A5.8 shows the appropriate mean compensat<strong>in</strong>g surpluses and their<br />
correspond<strong>in</strong>g 95% confidence <strong>in</strong>tervals.<br />
Table A5.8: Compensat<strong>in</strong>g surplus to change from the basel<strong>in</strong>e scenario to each <strong>of</strong> the<br />
alternative policy scenarios, and 95% confidence <strong>in</strong>tervals<br />
Scenario<br />
Compensat<strong>in</strong>g surplus<br />
(£)<br />
95% lower<br />
bound<br />
95% upper<br />
bound<br />
Scenario 1<br />
7.68 2.59 13.33<br />
Scenario 2<br />
9.17 3.6 15.22<br />
Scenario 3<br />
0.21 -1.41 1.88<br />
In the survey follow-up questions 57% <strong>of</strong> respondents declared the attribute that concerned<br />
them the most when mak<strong>in</strong>g choices was the cost, followed by the broadleaf and mixed<br />
woodland (18%). The attribute that concerned respondents the least was rough grassland,<br />
chosen by only 3% <strong>of</strong> respondents as most important.<br />
Regard<strong>in</strong>g respondents’ cited reasons for be<strong>in</strong>g will<strong>in</strong>g to pay for landscape improvements,<br />
personal or family enjoyment was the most <strong>in</strong>dicated reason followed by environmental<br />
concerns and the enjoyment <strong>of</strong> future generations (see Fig. A5.2). Note that these<br />
percentages are approximate s<strong>in</strong>ce responses could be coded under more than one<br />
category.<br />
eftec A- 45<br />
January 2006
19%<br />
<strong>Economic</strong> <strong>Valuation</strong> <strong>of</strong> <strong>Environmental</strong> <strong>Impacts</strong> <strong>in</strong> the Severely Disadvantaged Areas<br />
Annex 5 – Technical Annex<br />
11%<br />
15%<br />
5%<br />
3% 2%<br />
22%<br />
17%<br />
eftec A- 46<br />
January 2006<br />
6%<br />
Personal family<br />
enjoyment<br />
Other enjoyment<br />
altruism<br />
Other enjoyment future<br />
Personal f<strong>in</strong>ancial ga<strong>in</strong><br />
Other f<strong>in</strong>ancial ga<strong>in</strong><br />
Preserve heritage<br />
communities<br />
<strong>Environmental</strong> concerns<br />
Moral obligation<br />
Warm glow<br />
Figure A5.2: Pie chart show<strong>in</strong>g the break down <strong>of</strong> why respondents <strong>in</strong> the North West<br />
were will<strong>in</strong>g to pay for alternative policies over the current policy.<br />
A5.2.3 Yorkshire and the Humber<br />
In the Yorkshire and the Humber region 312 respondents were <strong>in</strong>terviewed. Of the total<br />
number <strong>of</strong> responses, 98 expressed a protest answer regard<strong>in</strong>g the proposed project; these<br />
protest bids were removed from the sample. All respondents that displayed a genu<strong>in</strong>e zero<br />
WTP by always choos<strong>in</strong>g the current policy option (11%), and those that chose either<br />
alternative A or B at least once were considered <strong>in</strong> the analysis, giv<strong>in</strong>g a total number <strong>of</strong><br />
1284 [(312-98) x 6)] observations for model estimation.<br />
Analysis <strong>of</strong> Yorkshire and the Humber data showed that the conditional logit model fulfils<br />
the IIA condition, and so is used <strong>in</strong> the analysis. Table A5.9 shows the conditional logit<br />
model that <strong>in</strong>corporates the socioeconomic <strong>in</strong>formation 6 .<br />
Overall the model is highly significant and shows a good fit to data (ρ 2 = 0.20). All the<br />
attributes save broadleaf and mixed woodland are significant and have the expected sign.<br />
Nevertheless, the low significance <strong>of</strong> the heather moorland and bog attribute and <strong>of</strong> the<br />
change from a “rapid decl<strong>in</strong>e” to a “no change” <strong>in</strong> the cultural heritage attribute suggests<br />
that for these attributes preferences cannot be accurately def<strong>in</strong>ed. The significance and<br />
positive sign <strong>of</strong> the constant term shows that respondents are, all else be<strong>in</strong>g equal, <strong>in</strong><br />
favour <strong>of</strong> the payments to farmers for the “environmental services” they provide.<br />
6 The per capita <strong>in</strong>come variable has been dropped from the model due to the high number <strong>of</strong> miss<strong>in</strong>g<br />
values. At the beg<strong>in</strong>n<strong>in</strong>g we estimated a conditional logit model that <strong>in</strong>cluded this variable, observ<strong>in</strong>g<br />
that it was significant. In the model f<strong>in</strong>ally chosen (without <strong>in</strong>come) we observed that the education<br />
variable, that was not significant <strong>in</strong> the model specification that <strong>in</strong>cluded the <strong>in</strong>come, is significant.<br />
Hence it is likely that part <strong>of</strong> the <strong>in</strong>formation expla<strong>in</strong>ed by the per capita <strong>in</strong>come is expla<strong>in</strong>ed by the<br />
education variable <strong>in</strong> the model without <strong>in</strong>come, so that we do not loose a lot <strong>of</strong> <strong>in</strong>formation and we<br />
can use a greater number <strong>of</strong> observations for modell<strong>in</strong>g.
<strong>Economic</strong> <strong>Valuation</strong> <strong>of</strong> <strong>Environmental</strong> <strong>Impacts</strong> <strong>in</strong> the Severely Disadvantaged Areas<br />
Annex 5 – Technical Annex<br />
Table A5.9: Conditional logit model; Maximum Likelihood Estimates<br />
Dependent variable: Choice<br />
Number <strong>of</strong> obs.: 1284, skipped 146 bad obs.<br />
Iterations completed: 6<br />
Log likelihood function: -1049.394<br />
Number <strong>of</strong> parameters: 18<br />
Restricted log likelihood: -1178.811<br />
Chi squared: 258.82<br />
Prob [chiSqd>value]=.0000<br />
Variable Coefficient (b) Standard Error t values Significance<br />
Mean values<br />
K 2.915 0.722 4.036 0.000<br />
HMB 0.011 0.006 1.657 0.098<br />
RG 0.011 0.005 2.031 0.042<br />
BMW 0.005 0.006 0.871 0.384<br />
FB 0.001 0.001 2.036 0.042<br />
CH1 0.109 0.061 1.801 0.072<br />
CH2 0.423 0.066 6.430 0.000<br />
TAX -0.035 0.003 -11.784 0.000<br />
AGE -0.031 0.142 -0.216 0.829<br />
GENDER 0.231 0.154 1.502 0.133<br />
ENVIMP -0.599 0.124 -4.818 0.000<br />
VISFREQ -0.235 0.036 -6.551 0.000<br />
LIVING -0.006 0.007 -0.898 0.369<br />
REMAIN -0.196 0.116 -1.688 0.091<br />
MEMBER 0.437 0.275 1.590 0.112<br />
EDU 0.267 0.082 3.242 0.001<br />
EMPLOY 0.148 0.162 0.914 0.361<br />
RURAL 0.673 0.280 2.409 0.016<br />
Clarification:<br />
K: Constant term, = 0 <strong>in</strong> the current policy and 1 <strong>in</strong> alternatives A and B.<br />
HMB: Change <strong>in</strong> area <strong>of</strong> Heather Moorland and Bog<br />
RG: Change <strong>in</strong> area <strong>of</strong> Rough Grassland<br />
BMW: Change <strong>in</strong> area <strong>of</strong> Broadleaf and mixed woodlands<br />
FB: Change <strong>in</strong> length <strong>of</strong> field boundaries<br />
Cultural heritage as a qualitative <strong>in</strong>dicator has to be coded so that:<br />
CH1: shows change <strong>in</strong> cultural heritage from ‘rapid decl<strong>in</strong>e’ to ‘no change’<br />
CH2: shows change <strong>in</strong> cultural heritage from ‘rapid decl<strong>in</strong>e’ to ‘much better conservation’<br />
Tax: Increase <strong>in</strong> tax payments per annum<br />
AGE: Respondents’ age (1 = 18-34; 2 = 35-54; 3= 55-70)<br />
GENDER: Respondents’ gender (0=female; 1= male)<br />
ENVIMP: Rank<strong>in</strong>g <strong>of</strong> environmental policy relative to other policies(1=very important; 4=<br />
not important)<br />
VISFREQ: Respondent’s frequency <strong>of</strong> visits to severely disadvantaged areas (1= every day;<br />
10 = never)<br />
LIVING: number <strong>of</strong> years respondents have been liv<strong>in</strong>g <strong>in</strong> the area<br />
REMAIN: time period respondents th<strong>in</strong>g are stay<strong>in</strong>g <strong>in</strong> the area (1=less than 6 month; 5=for<br />
ever)<br />
MEMBER: dummy = 1 if respondents’ belong to any “environmental” or trust organization<br />
and 0 otherwise<br />
EDU: Respondents’ education (1= primary, 6= higher degree)<br />
EMPLOY: dummy = 0 if respondent is not an active worker; 1 otherwise<br />
RURAL: dummy = 0 if respondent is an urban dweller, 1 if he/she is a rural dweller.<br />
Increas<strong>in</strong>g the area <strong>of</strong> heather moorland and bog and rough grassland and the length <strong>of</strong><br />
field boundaries are changes positively evaluated by respondents. As well, respondents<br />
receive utility from improvement <strong>in</strong> cultural heritage. Cost is highly significant and has a<br />
eftec A- 47<br />
January 2006
<strong>Economic</strong> <strong>Valuation</strong> <strong>of</strong> <strong>Environmental</strong> <strong>Impacts</strong> <strong>in</strong> the Severely Disadvantaged Areas<br />
Annex 5 – Technical Annex<br />
negative sign, show<strong>in</strong>g that the higher the cost <strong>of</strong> a policy option, the less likely a given<br />
respondent is to choose it.<br />
Turn<strong>in</strong>g to the <strong>in</strong>terpretation <strong>of</strong> <strong>in</strong>dividuals’ characteristics, it can be seen that the gender,<br />
age, number <strong>of</strong> years that respondents have been liv<strong>in</strong>g <strong>in</strong> the area, whether the<br />
respondent belongs to an “environmental” organization and their work<strong>in</strong>g status did not<br />
<strong>in</strong>fluence the selection <strong>of</strong> the preferred alternative. Consistently, people who assigned a<br />
high importance to environmental policy relative to other policies were more likely to<br />
choose alternative A or B over the current policy. Along the same l<strong>in</strong>es, people that visit<br />
SDAs more <strong>of</strong>ten are <strong>in</strong> favour <strong>of</strong> the payments to farmers. The more educated <strong>in</strong>terviewees<br />
are the more likely they chose alternative A or B. F<strong>in</strong>ally, rural dwellers are more will<strong>in</strong>g to<br />
contribute for gett<strong>in</strong>g the environmental situations described <strong>in</strong> alternatives A and B.<br />
Table A5.10 shows the implicit prices and the respective 95% confidence <strong>in</strong>tervals,<br />
calculated us<strong>in</strong>g the Kr<strong>in</strong>sky and Robb (1986) procedure. Mean implicit prices for all<br />
attributes are positive, imply<strong>in</strong>g that respondents have positive WTP for <strong>in</strong>creases <strong>in</strong> the<br />
quality or quantity <strong>of</strong> each attribute. One observation is noteworthy; the wide confidence<br />
<strong>in</strong>tervals reveal that there is a low precision <strong>in</strong> the mean values: only three <strong>of</strong> the six<br />
implicit prices can be considered different from 0 at a 95% confidence level.<br />
Table A5.10: Implicit prices and 95% confidence <strong>in</strong>terval.<br />
Attributes Implicit price<br />
95% lower<br />
bound<br />
Heather moorland and bog 0.30 -0.06 0.65<br />
Rough grassland 0.31 0.01 0.60<br />
Broadleaf and mixed woodlands 0.15 -0.16 0.48<br />
Field boundaries 0.04 0.01 0.08<br />
Cultural heritage:<br />
from “rapid decl<strong>in</strong>e” to “no change”<br />
Cultural heritage:<br />
3.08 -0.24 6.71<br />
from “rapid decl<strong>in</strong>e” to “much better 11.93 8.47 15.44<br />
conservation”<br />
95% upper<br />
bound<br />
Us<strong>in</strong>g the choice model parameters it is also possible to obta<strong>in</strong> compensat<strong>in</strong>g surplus<br />
estimates for the required range <strong>of</strong> policy scenarios, as detailed <strong>in</strong> Table 2.2 <strong>of</strong> the ma<strong>in</strong><br />
report. Table A5.11 shows the appropriate mean compensat<strong>in</strong>g surpluses and their<br />
correspond<strong>in</strong>g 95% confidence <strong>in</strong>tervals.<br />
Table A5.11: Compensat<strong>in</strong>g surplus to change from the basel<strong>in</strong>e scenario to each <strong>of</strong> the<br />
alternative policy scenarios, and 95% confidence <strong>in</strong>tervals<br />
Scenario<br />
Compensat<strong>in</strong>g surplus<br />
(£)<br />
95% lower<br />
bound<br />
95% upper<br />
bound<br />
Scenario 1<br />
18.64 12.28 25.56<br />
Scenario 2<br />
20.54 14.16 27.59<br />
Scenario 3<br />
-1.2 -2.78 0.63<br />
In the survey follow-up questions 47% <strong>of</strong> respondents declared that the attribute that<br />
concerned them the most when mak<strong>in</strong>g choices was the cost, followed by cultural heritage.<br />
The attribute that concerned respondents the least was rough grassland, chosen by only 3%<br />
<strong>of</strong> respondents as most important.<br />
Regard<strong>in</strong>g respondents’ cited reasons for be<strong>in</strong>g will<strong>in</strong>g to pay for landscape improvements,<br />
the need to preserve heritage and communities was the most important (see Fig. A5.3).<br />
eftec A- 48<br />
January 2006
<strong>Economic</strong> <strong>Valuation</strong> <strong>of</strong> <strong>Environmental</strong> <strong>Impacts</strong> <strong>in</strong> the Severely Disadvantaged Areas<br />
Annex 5 – Technical Annex<br />
These percentages are approximate s<strong>in</strong>ce responses could be coded under more than one<br />
category.<br />
17%<br />
21%<br />
5% 2%<br />
9%<br />
1%<br />
17%<br />
14%<br />
14%<br />
Personal family<br />
enjoyment<br />
Other enjoyment<br />
altruism<br />
Other enjoyment<br />
future<br />
Personal f<strong>in</strong>ancial<br />
ga<strong>in</strong><br />
Other f<strong>in</strong>ancial ga<strong>in</strong><br />
Preserve heritage<br />
communities<br />
<strong>Environmental</strong><br />
concerns<br />
Moral obligation<br />
Warm glow<br />
Figure A5.3: Pie chart show<strong>in</strong>g the break down <strong>of</strong> why respondents <strong>in</strong> Yorkshire and the<br />
Humber were will<strong>in</strong>g to pay for alternative policies over the current policy.<br />
A5.2.4 South East<br />
In the South East region 345 respondents were <strong>in</strong>terviewed. Of the total number <strong>of</strong><br />
responses, 91 expressed a protest answer regard<strong>in</strong>g the proposed project; these protest<br />
bids were removed from the sample. All respondents that displayed a genu<strong>in</strong>e zero WTP by<br />
always choos<strong>in</strong>g the current policy option (8%), and those that chose either alternative A or<br />
B at least once were considered <strong>in</strong> the analysis, giv<strong>in</strong>g a total number <strong>of</strong> 1524 [(345-91) x<br />
6)] observations for model estimation.<br />
It is worth repeat<strong>in</strong>g that the scenario described to respondents <strong>in</strong> the South East region<br />
was different to the scenario described to respondents <strong>in</strong> other regions. S<strong>in</strong>ce there are no<br />
Severely Disadvantaged Areas <strong>in</strong> the South East region, respondents were <strong>in</strong>stead asked for<br />
their preferences for the implementation <strong>of</strong> the policies <strong>in</strong> question <strong>in</strong> all the SDAs <strong>of</strong><br />
England. This leads to two important differences <strong>in</strong> the valuation exercise. First,<br />
respondents are valu<strong>in</strong>g the environmental policies for six regions <strong>in</strong>stead <strong>of</strong> one; hence<br />
higher welfare estimates may be expected. Secondly, the areas <strong>of</strong> <strong>in</strong>terest are much<br />
further away from respondents’ dwell<strong>in</strong>gs so that the “non-use” component <strong>of</strong> the value<br />
will be much more important <strong>in</strong> this region. The fact that <strong>in</strong> this region the use value has<br />
lower importance should reduce the WTP estimates. The f<strong>in</strong>al WTP will comprise elements<br />
<strong>of</strong> an <strong>in</strong>crease due to the “global” valuation and a reduction due to the lesser actual use <strong>of</strong><br />
the good.<br />
Analysis <strong>of</strong> South East data showed that the simple conditional logit model specification<br />
cannot be used s<strong>in</strong>ce both models (attributes only and attributes plus socioeconomic<br />
variables) suffer from IIA violations. Furthermore, the attribute only random parameters<br />
logit model did not converge. Therefore the random parameter logit model that <strong>in</strong>cludes<br />
the socioeconomic characteristics has been used. Coefficients <strong>of</strong> this model are shown <strong>in</strong><br />
Table A5.12.<br />
eftec A- 49<br />
January 2006
<strong>Economic</strong> <strong>Valuation</strong> <strong>of</strong> <strong>Environmental</strong> <strong>Impacts</strong> <strong>in</strong> the Severely Disadvantaged Areas<br />
Annex 5 – Technical Annex<br />
Table A5.12: Random parameters logit model (socio-economics)<br />
Dependent variable: CHOICE<br />
Number <strong>of</strong> obs.: 1524, skipped 269 bad obs.<br />
Iterations completed: 30<br />
Log likelihood function: -1134.262<br />
Number <strong>of</strong> parameters: 24<br />
Restricted log likelihood: -1378.758<br />
Chi squared: 488.9929<br />
Degrees <strong>of</strong> freedom: 24<br />
Prob[ChiSqd > value] = .0000000<br />
Variable Coefficient (b) Standard Error t values Significance<br />
Mean values<br />
K 2.828 0.641 4.412 0.000<br />
HMB 0.025 0.007 3.516 0.000<br />
RG 0.016 0.006 2.809 0.005<br />
BMW 0.038 0.007 5.557 0.000<br />
FB 0.002 0.001 2.698 0.007<br />
CH1 0.025 0.065 0.387 0.699<br />
CH2 0.493 0.071 6.907 0.000<br />
TAX -0.031 0.003 -11.336 0.000<br />
AGE -0.047 0.130 -0.359 0.720<br />
GENDER -0.122 0.164 -0.745 0.456<br />
ENVIMP -0.381 0.136 -2.790 0.005<br />
VISFREQ -0.250 0.046 -5.440 0.000<br />
LIVING -0.001 0.006 -0.152 0.879<br />
REMAIN -0.204 0.094 -2.164 0.031<br />
MEMBER 0.554 0.195 2.841 0.005<br />
EDU 0.286 0.067 4.294 0.000<br />
EMPLOY 0.089 0.171 0.524 0.600<br />
RURAL 1.481 0.232 6.380 0.000<br />
Standard deviation values<br />
NsHMB 0.00002 0.00001 1.057 0.291<br />
NsRG 0.00002 0.00001 1.513 0.130<br />
NsBMW 0.00003 0.00001 2.126 0.034<br />
NsFB 0.000004 0.000002 2.504 0.012<br />
NsCH1 0.00030 0.00015 2.056 0.040<br />
NsCH2 0.00027 0.00015 1.784 0.075<br />
Clarification <strong>of</strong> socioeconomic variables: (for attributes see Table A5.1).<br />
AGE: Respondents’ age (1 = 18-34; 2 = 35-54; 3= 55-70)<br />
GENDER: Respondents’ gender (0=female; 1= male)<br />
ENVIMP: Rank<strong>in</strong>g <strong>of</strong> environmental policy relative to other policies(1=very important; 4= not<br />
important)<br />
VISFREQ: Respondent’s frequency <strong>of</strong> visits to severely disadvantaged areas (1= every day; 10 =<br />
never)<br />
LIVING: number <strong>of</strong> years respondents have been liv<strong>in</strong>g <strong>in</strong> the area<br />
REMAIN: time period respondents th<strong>in</strong>g are stay<strong>in</strong>g <strong>in</strong> the area (1=less than 6 month; 5=for<br />
ever)<br />
MEMBER: dummy = 1 if respondents’ belong to any “environmental” or trust organization and 0<br />
otherwise<br />
EDU: Respondents’ education (1= primary, 6= higher degree)<br />
EMPLOY: dummy = 0 if respondent is not an active worker; 1 otherwise<br />
RURAL: dummy = 0 if respondent is an urban dweller, 1 if he/she is a rural dweller.<br />
Overall the model is highly significant and shows a good fitt<strong>in</strong>g to data (ρ 2 = 0.18). Turn<strong>in</strong>g<br />
to the attribute coefficients, it can be seen that all are highly significant. Increas<strong>in</strong>g the<br />
area <strong>of</strong> heather moorland and bog, rough grassland, broadleaf and mixed woodlands, the<br />
length <strong>of</strong> field boundaries and the improvement from “rapid decl<strong>in</strong>e” to “much better<br />
eftec A- 50<br />
January 2006
<strong>Economic</strong> <strong>Valuation</strong> <strong>of</strong> <strong>Environmental</strong> <strong>Impacts</strong> <strong>in</strong> the Severely Disadvantaged Areas<br />
Annex 5 – Technical Annex<br />
conservation” <strong>in</strong> cultural heritage all <strong>in</strong>crease respondents’ utility. In addition, the<br />
significance and positive sign <strong>of</strong> the constant term shows that respondents are, all else<br />
be<strong>in</strong>g equal, <strong>in</strong> favour <strong>of</strong> the payments to farmers for the “environmental services” they<br />
provide. Cost is highly significant and has a negative sign, show<strong>in</strong>g that the higher the cost<br />
<strong>of</strong> a policy option, the less likely a given respondent is to choose it.<br />
As <strong>in</strong> Yorkshire and the Humber, the per capita <strong>in</strong>come variable has been dropped from the<br />
model s<strong>in</strong>ce its <strong>in</strong>clusion would have caused the loss <strong>of</strong> an additional 22% <strong>of</strong> observations.<br />
Turn<strong>in</strong>g to the <strong>in</strong>terpretation <strong>of</strong> <strong>in</strong>dividuals’ characteristics it can be seen that people who<br />
assigned a high importance to environmental policy relative to other policies are more<br />
likely to choose alternative A or B over the current policy. Along the same l<strong>in</strong>es, people<br />
that visit SDAs more <strong>of</strong>ten are <strong>in</strong> favour <strong>of</strong> the payments to farmers. The same is true for<br />
people that belong to an environmental, heritage, recreation or farm<strong>in</strong>g organization.<br />
However, the longer respondents th<strong>in</strong>k they will rema<strong>in</strong> <strong>in</strong> the region, the less likely they<br />
are to be will<strong>in</strong>g to contribute to alternative policies. F<strong>in</strong>ally, more educated people and<br />
rural dwellers prefer the “change scenario” policies than the current situation.<br />
Preferences for the heather moorland and bog and rough grassland attribute are<br />
homogeneous <strong>in</strong> the sample. The significance <strong>of</strong> the standard deviation terms <strong>in</strong>dicates<br />
some heterogeneity <strong>in</strong> the sample. The standard deviation values are very small compared<br />
to their means, so the heterogeneity <strong>in</strong> this sample, although it exists for these attributes,<br />
is very low.<br />
In summary, the model suggests respondents value programs which result <strong>in</strong> an<br />
improvement <strong>in</strong> all landscape features.<br />
Table A5.13 shows the implicit prices for the attributes and the respective 95% confidence<br />
<strong>in</strong>tervals, calculated us<strong>in</strong>g the Kr<strong>in</strong>sky and Robb (1986) procedure. As expected, implicit<br />
prices are positive for all significant attributes.<br />
Table A5.13: Implicit prices and 95% confidence <strong>in</strong>tervals.<br />
Attributes Implicit price<br />
95% lower<br />
bound<br />
Heather moorland and bog 0.81 0.36 1.25<br />
Rough grassland<br />
0.50 0.14 0.86<br />
Broadleaf and mixed woodlands<br />
1.21 0.81 1.66<br />
Field boundaries<br />
0.06 0.02 0.11<br />
Cultural heritage:<br />
from “rapid decl<strong>in</strong>e” to “no change” 0.81 -3.22 4.96<br />
Cultural heritage:<br />
from “rapid decl<strong>in</strong>e” to “much better<br />
conservation” 15.79 11.47 20.64<br />
95% upper<br />
bound<br />
Us<strong>in</strong>g the choice model parameters it is also possible to obta<strong>in</strong> compensat<strong>in</strong>g surplus<br />
estimates for the required range <strong>of</strong> policy scenarios, as detailed <strong>in</strong> Table 2.2 <strong>of</strong> the ma<strong>in</strong><br />
report. Table A5.14 shows the appropriate mean compensat<strong>in</strong>g surpluses and their<br />
correspond<strong>in</strong>g 95% confidence <strong>in</strong>tervals.<br />
eftec A- 51<br />
January 2006
<strong>Economic</strong> <strong>Valuation</strong> <strong>of</strong> <strong>Environmental</strong> <strong>Impacts</strong> <strong>in</strong> the Severely Disadvantaged Areas<br />
Annex 5 – Technical Annex<br />
Table A5.14: Compensat<strong>in</strong>g surplus to change from the basel<strong>in</strong>e scenario to each <strong>of</strong> the<br />
alternative policy scenarios, and 95% confidence <strong>in</strong>tervals<br />
Scenario<br />
Compensat<strong>in</strong>g surplus<br />
(£)<br />
95% lower<br />
bound<br />
95% upper<br />
bound<br />
Scenario 1<br />
19.85 12.47 27.66<br />
Scenario 2<br />
25.4 17.72 34.17<br />
Scenario 3<br />
-0.89 -3.12 1.15<br />
In the survey follow-up questions 39% <strong>of</strong> respondents declared the attribute that concerned<br />
them the most when mak<strong>in</strong>g choices was the cost, followed by broadleaf and mixed<br />
woodland (26%) and cultural heritage (21%). The attribute that concerned respondents the<br />
least was rough grassland, chosen by only 3% <strong>of</strong> respondents as most important.<br />
Regard<strong>in</strong>g respondents’ cited reasons for be<strong>in</strong>g will<strong>in</strong>g to pay for landscape improvements,<br />
environmental concerns followed by personal or family enjoyment and the enjoyment <strong>of</strong><br />
future generations were the most commonly cited reasons (see Fig. A5.4). These<br />
percentages are approximate s<strong>in</strong>ce responses could be coded under more than one<br />
category.<br />
18%<br />
10%<br />
16%<br />
7%<br />
13%<br />
9%<br />
3%<br />
11%<br />
13%<br />
Personal family<br />
enjoyment<br />
Other enjoyment<br />
altruism<br />
Other enjoyment<br />
future<br />
Personal f<strong>in</strong>ancial ga<strong>in</strong><br />
Other f<strong>in</strong>ancial ga<strong>in</strong><br />
Preserve heritage<br />
communities<br />
<strong>Environmental</strong><br />
concerns<br />
Moral obligation<br />
Warm glow<br />
Figure A5.4: Pie chart show<strong>in</strong>g the break down <strong>of</strong> why respondents <strong>in</strong> the South East<br />
were will<strong>in</strong>g to pay for alternative policies over the current policy.<br />
A5.2.5 South West<br />
In the South West region 301 respondents were <strong>in</strong>terviewed. Of the total number <strong>of</strong><br />
responses, 52 expressed a protest answer regard<strong>in</strong>g the proposed project; these protest<br />
bids were removed from the sample. All respondents that displayed a genu<strong>in</strong>e zero WTP by<br />
always choos<strong>in</strong>g the current policy option (8%), and those that chose either alternative A or<br />
B at least once were considered <strong>in</strong> the analysis, giv<strong>in</strong>g a total number <strong>of</strong> 1494 [(301-52) x<br />
6)] observations for model estimation.<br />
In the South West, the sample was split <strong>in</strong>to two groups to test for “procedural <strong>in</strong>variance”<br />
<strong>of</strong> CE estimates. In one half the highest value <strong>of</strong> <strong>in</strong>crease <strong>in</strong> the area <strong>of</strong> broadleaf and<br />
mixed woodlands was 30%, whilst <strong>in</strong> the other, the maximum <strong>in</strong>crease for the same<br />
eftec A- 52<br />
January 2006
<strong>Economic</strong> <strong>Valuation</strong> <strong>of</strong> <strong>Environmental</strong> <strong>Impacts</strong> <strong>in</strong> the Severely Disadvantaged Areas<br />
Annex 5 – Technical Annex<br />
attribute was 20%. In pr<strong>in</strong>ciple, this provides two different models that would allow a test<br />
<strong>of</strong> whether the results obta<strong>in</strong>ed by one model (say the model with the maximum <strong>in</strong>crease <strong>of</strong><br />
20%) could be replicated by the other (the one with a 30% <strong>in</strong>crease). Unfortunately, the<br />
broadleaf and mixed woodland coefficient is no longer significant <strong>in</strong> the split models, so the<br />
test <strong>of</strong> procedural <strong>in</strong>variance cannot be taken; however, it was significant <strong>in</strong> the pooled<br />
model, as described below. Data were analysed jo<strong>in</strong>tly.<br />
Analysis <strong>of</strong> the South West data shows that the simple conditional logit model specification<br />
cannot be used s<strong>in</strong>ce both models (attributes only and attributes plus socioeconomic<br />
variables) suffer from IIA violations. Table A5.15 shows the attributes only RPL model.<br />
Table A5.15: Random parameters logit model; Maximum Likelihood Estimates<br />
Dependent variable: CHOICE<br />
Number <strong>of</strong> obs.: 1494, skipped17 bad obs.<br />
Iterations completed: 34<br />
Log likelihood function: -1375.101<br />
Number <strong>of</strong> parameters: 14<br />
Restricted log likelihood: -1622.650<br />
Chi squared: 495.0992<br />
Degrees <strong>of</strong> freedom: 14<br />
Prob[ChiSqd > value] = .0000000<br />
Variable Coefficient (b) Standard Error t values Significance<br />
Mean values<br />
K 1.019 0.155 6.571 0.000<br />
HMB 0.026 0.008 3.169 0.002<br />
RG -0.002 0.007 -0.256 0.798<br />
BMW 0.011 0.006 1.953 0.051<br />
FB -0.001 0.001 -1.164 0.245<br />
CH1 0.158 0.082 1.922 0.055<br />
CH2 0.222 0.099 2.234 0.026<br />
TAX -0.029 0.003 -9.490 0.000<br />
Standard deviation values<br />
NsHMB 0.073 0.013 5.755 0.000<br />
NsRG 0.065 0.008 8.059 0.000<br />
NsBMW 0.033 0.012 2.800 0.005<br />
NsFB 0.008 0.001 5.986 0.000<br />
NsCH1 0.672 0.101 6.636 0.000<br />
NsCH2 1.014 0.115 8.798 0.000<br />
Clarification:<br />
K: Constant term, = 0 <strong>in</strong> the current policy and 1 <strong>in</strong> alternatives A and B.<br />
HMB: Change <strong>in</strong> area <strong>of</strong> Heather Moorland and Bog<br />
RG: Change <strong>in</strong> area <strong>of</strong> Rough Grassland<br />
BMW: Change <strong>in</strong> area <strong>of</strong> Broadleaf and mixed woodlands<br />
FB: Change <strong>in</strong> length <strong>of</strong> field boundaries<br />
Cultural heritage as a qualitative <strong>in</strong>dicator has to be coded so that:<br />
CH1: shows change <strong>in</strong> cultural heritage from ‘rapid decl<strong>in</strong>e’ to ‘no change’<br />
CH2: shows change <strong>in</strong> cultural heritage from ‘rapid decl<strong>in</strong>e’ to ‘much better conservation’<br />
Tax: Increase <strong>in</strong> tax payments per annum<br />
Overall the model is highly significant and the data fitt<strong>in</strong>g is moderate (ρ 2 = 0.15). Turn<strong>in</strong>g<br />
to the attribute coefficients, the change <strong>in</strong> the area <strong>of</strong> rough grassland and the change <strong>in</strong><br />
the length <strong>of</strong> field boundaries did not affect respondents’ choices. The significance and<br />
positive sign <strong>of</strong> the constant term shows that respondents are, all else be<strong>in</strong>g equal, <strong>in</strong><br />
favour <strong>of</strong> the payments to farmers for the “environmental services” they provide.<br />
eftec A- 53<br />
January 2006
<strong>Economic</strong> <strong>Valuation</strong> <strong>of</strong> <strong>Environmental</strong> <strong>Impacts</strong> <strong>in</strong> the Severely Disadvantaged Areas<br />
Annex 5 – Technical Annex<br />
Increas<strong>in</strong>g the areas <strong>of</strong> heather moorland and bog is positively valued by respondents. The<br />
same is true for the cultural heritage attribute, so long as the change is large. Cost is highly<br />
significant and has a negative sign, show<strong>in</strong>g that the higher the cost <strong>of</strong> a policy option, the<br />
less likely a given respondent is to choose it.<br />
Interest<strong>in</strong>gly, all the standard deviation terms are significant, <strong>in</strong>dicat<strong>in</strong>g preference<br />
heterogeneity does <strong>in</strong>deed exist. There is not a clear direction <strong>of</strong> preferences amongst<br />
respondents. For <strong>in</strong>stance, from the mean and standard deviation values <strong>of</strong> the heather<br />
moorland and bog attribute it can be seen that 36% <strong>of</strong> respondents have negative<br />
preferences for <strong>in</strong>creases <strong>in</strong> the area <strong>of</strong> that attribute.<br />
In summary, the model suggests respondents value programs which result <strong>in</strong> higher heather<br />
moorland and bog area, an <strong>in</strong>crease <strong>in</strong> the woodland area, much better conservation <strong>of</strong><br />
cultural heritage and the less these programs cost the better. But with<strong>in</strong> the sample a high<br />
degree <strong>of</strong> heterogeneity exists.<br />
Table A5.16 presents a random parameter logit model <strong>in</strong> which the socioeconomic and<br />
attitud<strong>in</strong>al characteristics <strong>of</strong> respondents have been added.<br />
eftec A- 54<br />
January 2006
<strong>Economic</strong> <strong>Valuation</strong> <strong>of</strong> <strong>Environmental</strong> <strong>Impacts</strong> <strong>in</strong> the Severely Disadvantaged Areas<br />
Annex 5 – Technical Annex<br />
Table A5.16: Random parameters logit model (socio-economics)<br />
Dependent variable: CHOICE<br />
Weight<strong>in</strong>g variable: None<br />
Number <strong>of</strong> obs.: 1494, skipped 359 bad obs.<br />
Iterations completed: 42<br />
Log likelihood function: -1032.413<br />
Number <strong>of</strong> parameters: 24<br />
Restricted log likelihood: -1246.925<br />
Chi squared: 429.0237<br />
Degrees <strong>of</strong> freedom: 24<br />
Prob[ChiSqd > value] = .0000000<br />
Variable Coefficient (b) Standard Error t values Significance<br />
Mean values<br />
K 1.463 0.957 1.528 0.126<br />
HMB 0.030 0.009 3.306 0.001<br />
RG -0.002 0.007 -0.271 0.787<br />
BMW 0.009 0.006 1.435 0.151<br />
FB -0.001 0.001 -0.956 0.339<br />
CH1 0.187 0.083 2.248 0.025<br />
CH2 0.291 0.108 2.698 0.007<br />
TAX -0.029 0.003 -8.281 0.000<br />
AGE 0.155 0.188 0.829 0.407<br />
GENDER 0.903 0.240 3.761 0.000<br />
ENVIMP -0.255 0.204 -1.252 0.211<br />
VISFREQ -0.125 0.047 -2.696 0.007<br />
LIVING 0.003 0.008 0.358 0.720<br />
REMAIN -0.127 0.142 -0.899 0.369<br />
MEMBER -0.006 0.270 -0.023 0.981<br />
EDU 0.281 0.105 2.663 0.008<br />
EMPLOY -0.059 0.280 -0.211 0.833<br />
RURAL -0.394 0.261 -1.510 0.131<br />
Standard deviation values<br />
NsHMB 0.062 0.014 4.548 0.000<br />
NsRG 0.049 0.009 5.203 0.000<br />
NsBMW 0.031 0.012 2.647 0.008<br />
NsFB 0.008 0.001 5.404 0.000<br />
NsCH1 0.471 0.131 3.604 0.000<br />
NsCH2 0.900 0.117 7.682 0.000<br />
Clarification <strong>of</strong> socioeconomic variables: (for attributes see Table A5.1).<br />
AGE: Respondents’ age (1 = 18-34; 2 = 35-54; 3= 55-70)<br />
GENDER: Respondents’ gender (0=female; 1= male)<br />
ENVIMP: Rank<strong>in</strong>g <strong>of</strong> environmental policy relative to other policies(1=very important; 4= not<br />
important)<br />
VISFREQ: Respondent’s frequency <strong>of</strong> visits to severely disadvantaged areas (1= every day; 10 =<br />
never)<br />
LIVING: number <strong>of</strong> years respondents have been liv<strong>in</strong>g <strong>in</strong> the area<br />
REMAIN: time period respondents th<strong>in</strong>g are stay<strong>in</strong>g <strong>in</strong> the area (1=less than 6 month; 5=for<br />
ever)<br />
MEMBER: dummy = 1 if respondents’ belong to any “environmental” or trust organization and 0<br />
otherwise<br />
EDU: Respondents’ education (1= primary, 6= higher degree)<br />
EMPLOY: dummy = 0 if respondent is not an active worker; 1 otherwise<br />
RURAL: dummy = 0 if respondent is an urban dweller, 1 if he/she is a rural dweller.<br />
Before turn<strong>in</strong>g to a discussion <strong>of</strong> model coefficients, it is worth not<strong>in</strong>g that this model is<br />
estimated by us<strong>in</strong>g 359 fewer observations than the attributes only model, due to miss<strong>in</strong>g<br />
eftec A- 55<br />
January 2006
<strong>Economic</strong> <strong>Valuation</strong> <strong>of</strong> <strong>Environmental</strong> <strong>Impacts</strong> <strong>in</strong> the Severely Disadvantaged Areas<br />
Annex 5 – Technical Annex<br />
data <strong>in</strong> the socioeconomic characteristics. Aga<strong>in</strong>, the per capita <strong>in</strong>come variable was<br />
dropped from analysis s<strong>in</strong>ce it would have caused an additional loss <strong>of</strong> 21% <strong>of</strong> observations.<br />
The <strong>in</strong>crease <strong>in</strong> model fit is very low (Δρ 2 = 0.02) given the addition <strong>of</strong> 11 parameters.<br />
The <strong>in</strong>terpretation <strong>of</strong> the coefficients reveals some <strong>in</strong>terest<strong>in</strong>g differences <strong>in</strong> relation to the<br />
attributes only model. The constant is no longer significant; it means a part <strong>of</strong> the<br />
systematic unobserved variance that led respondents to choose a particular option is now<br />
expla<strong>in</strong>ed by the socioeconomic characteristics. Secondly, the broadleaf and mixed<br />
woodland attribute is not significant. The reduction <strong>in</strong> the sample size <strong>of</strong> 24% probably<br />
caused the lack <strong>of</strong> significance.<br />
Turn<strong>in</strong>g to the <strong>in</strong>terpretation <strong>of</strong> <strong>in</strong>dividuals’ characteristics, it can be seen that only<br />
respondents’ gender, their frequency <strong>of</strong> visit to the regions SDAs and their education are<br />
significant. In particular, men and more educated people were more likely to choose policy<br />
options A and B. As expected, people that visit SDAs more <strong>of</strong>ten are <strong>in</strong> favour <strong>of</strong> the<br />
payments to farmers.<br />
The random parameter model with socioeconomic <strong>in</strong>formation provides a useful <strong>in</strong>sight <strong>in</strong>to<br />
the effects <strong>of</strong> <strong>in</strong>dividual characteristics on choices, but the low <strong>in</strong>crease <strong>in</strong> model fitt<strong>in</strong>g<br />
and the loss <strong>of</strong> the 24% <strong>of</strong> the sample observations makes choos<strong>in</strong>g the attributes only<br />
model appropriate when estimat<strong>in</strong>g implicit prices and compensat<strong>in</strong>g surplus measures.<br />
Table A5.17 shows the implicit prices for the attributes and the respective 95% confidence<br />
<strong>in</strong>tervals, calculated us<strong>in</strong>g the Kr<strong>in</strong>sky and Robb (1986) procedure. Mean implicit price<br />
values for all significant attributes are positive imply<strong>in</strong>g that respondents have a positive<br />
will<strong>in</strong>gness to pay (WTP) for <strong>in</strong>creases <strong>in</strong> the quality or quantity <strong>of</strong> each attribute. The wide<br />
confidence <strong>in</strong>tervals for the broadleaf and mixed woodland implicit price and for the<br />
qualitative change between “rapid decl<strong>in</strong>e” and “no change” <strong>in</strong> the cultural heritage<br />
attribute reveal that these implicit prices cannot be considered different from 0 at a 95%<br />
confidence level.<br />
Table A5.17: Implicit prices and 95% confidence <strong>in</strong>terval.<br />
Attributes Implicit price<br />
95% lower<br />
bound<br />
Heather moorland and bog 0.92 0.37 1.54<br />
Rough grassland -0.06 -0.56 0.39<br />
Broadleaf and mixed woodlands 0.39 -0.01 0.78<br />
Field boundaries -0.04 -0.11 0.02<br />
Cultural heritage:<br />
from “rapid decl<strong>in</strong>e” to “no change”<br />
Cultural heritage:<br />
5.48 -0.11 11.59<br />
from “rapid decl<strong>in</strong>e” to “much better 7.68 1.24 15.03<br />
conservation”<br />
95% upper<br />
bound<br />
Us<strong>in</strong>g the choice model parameters it is also possible to obta<strong>in</strong> compensat<strong>in</strong>g surplus<br />
estimates for the required range <strong>of</strong> policy scenarios, as detailed <strong>in</strong> Table 2.2 <strong>of</strong> the ma<strong>in</strong><br />
report. Table A5.18 shows the appropriate mean compensat<strong>in</strong>g surpluses and their<br />
correspond<strong>in</strong>g 95% confidence <strong>in</strong>tervals.<br />
eftec A- 56<br />
January 2006
<strong>Economic</strong> <strong>Valuation</strong> <strong>of</strong> <strong>Environmental</strong> <strong>Impacts</strong> <strong>in</strong> the Severely Disadvantaged Areas<br />
Annex 5 – Technical Annex<br />
Table A5.18: Compensat<strong>in</strong>g surplus to change from the basel<strong>in</strong>e scenario to each <strong>of</strong> the<br />
alternative policy scenarios, and 95% confidence <strong>in</strong>tervals<br />
Scenario<br />
Compensat<strong>in</strong>g surplus<br />
(£)<br />
95% lower<br />
bound<br />
95% upper<br />
bound<br />
Scenario 1<br />
20.59 9.28 32.83<br />
Scenario 2<br />
21.74 9.84 34.64<br />
Scenario 3<br />
-0.92 -3.76 2.2<br />
In the survey follow-up questions 28% <strong>of</strong> respondents declared the attribute that concerned<br />
them the most when mak<strong>in</strong>g choices was broadleaf and mixed woodland, closely followed<br />
by the cost (25%) and cultural heritage (24%). The attribute that concerned respondents the<br />
least was rough grassland, chosen by only 5% <strong>of</strong> respondents as most important.<br />
Regard<strong>in</strong>g respondents’ cited reasons for be<strong>in</strong>g will<strong>in</strong>g to pay for landscape improvements,<br />
environmental concerns followed by the preservation <strong>of</strong> cultural heritage were the most<br />
important reasons (see Fig. A5.5). These percentages are approximate s<strong>in</strong>ce responses<br />
could be coded under more than one category.<br />
18%<br />
8%<br />
17%<br />
6%<br />
11%<br />
13%<br />
4%<br />
10%<br />
13%<br />
Personal family<br />
enjoyment<br />
Other enjoyment<br />
altruism<br />
Other enjoyment<br />
future<br />
Personal f<strong>in</strong>ancial<br />
ga<strong>in</strong><br />
Other f<strong>in</strong>ancial<br />
ga<strong>in</strong><br />
Preserve heritage<br />
communities<br />
<strong>Environmental</strong><br />
concerns<br />
Moral obligation<br />
Warm glow<br />
Figure A5.5: Pie chart show<strong>in</strong>g the break down <strong>of</strong> why respondents <strong>in</strong> the South West<br />
were will<strong>in</strong>g to pay for alternative policies over the current policy.<br />
A5.2.6 North East<br />
In the North East region 300 respondents were <strong>in</strong>terviewed. Of the total number <strong>of</strong><br />
responses, 131 (44%) expressed a protest answer regard<strong>in</strong>g the proposed project; these<br />
protest bids were removed from the sample. This proportion <strong>of</strong> protest answers is very<br />
high, and the result<strong>in</strong>g reduction <strong>of</strong> the sample size may <strong>in</strong>fluence results. All respondents<br />
that displayed a genu<strong>in</strong>e zero WTP by always choos<strong>in</strong>g the current policy option (11%), and<br />
those that chose either alternative A or B at least once were considered <strong>in</strong> the analysis,<br />
giv<strong>in</strong>g a total number <strong>of</strong> 1014 [(300-131) x 6)] observations for model estimation.<br />
Analysis <strong>of</strong> the North East data shows that the simple conditional logit model specification<br />
cannot be used s<strong>in</strong>ce both models (attributes only and attributes plus socioeconomic<br />
variables) suffer from IIA violations. Table A5.19 shows the attributes only RPL model.<br />
eftec A- 57<br />
January 2006
<strong>Economic</strong> <strong>Valuation</strong> <strong>of</strong> <strong>Environmental</strong> <strong>Impacts</strong> <strong>in</strong> the Severely Disadvantaged Areas<br />
Annex 5 – Technical Annex<br />
Table A5.19: Random parameters logit model; Maximum Likelihood Estimates<br />
Dependent variable: CHOICE<br />
Number <strong>of</strong> obs.: 1014, skipped 3 bad obs.<br />
Iterations completed: 39<br />
Log likelihood function: -965.0677<br />
Number <strong>of</strong> parameters: 14<br />
Restricted log likelihood: -1110.697<br />
Chi squared: 291.2586<br />
Degrees <strong>of</strong> freedom: 14<br />
Prob[ChiSqd > value] = .0000000<br />
Variable Coefficient (b) Standard Error t values Significance<br />
Mean values<br />
K 0.681 0.179 3.813 0.000<br />
HMB 0.005 0.010 0.463 0.644<br />
RG -0.001 0.009 -0.121 0.904<br />
BMW 0.016 0.012 1.242 0.214<br />
FB 0.001 0.001 0.772 0.440<br />
CH1 -0.044 0.101 -0.435 0.664<br />
CH2 0.171 0.126 1.356 0.175<br />
TAX -0.019 0.003 -5.419 0.000<br />
Standard deviation values<br />
NsHMB 0.068 0.017 3.998 0.000<br />
NsRG 0.067 0.010 6.723 0.000<br />
NsBMW 0.103 0.014 7.596 0.000<br />
NsFB 0.007 0.002 4.185 0.000<br />
NsCH1 0.473 0.193 2.452 0.014<br />
NsCH2 0.982 0.136 7.235 0.000<br />
Clarification:<br />
K: Constant term, = 0 <strong>in</strong> the current policy and 1 <strong>in</strong> alternatives A and B.<br />
HMB: Change <strong>in</strong> area <strong>of</strong> Heather Moorland and Bog<br />
RG: Change <strong>in</strong> area <strong>of</strong> Rough Grassland<br />
BMW: Change <strong>in</strong> area <strong>of</strong> Broadleaf and mixed woodlands<br />
FB: Change <strong>in</strong> length <strong>of</strong> field boundaries<br />
Cultural heritage as a qualitative <strong>in</strong>dicator has to be coded so that:<br />
CH1: shows change <strong>in</strong> cultural heritage from ‘rapid decl<strong>in</strong>e’ to ‘no change’<br />
CH2: shows change <strong>in</strong> cultural heritage from ‘rapid decl<strong>in</strong>e’ to ‘much better conservation’<br />
Tax: Increase <strong>in</strong> tax payments per annum<br />
Although the model is globally significant the data fit is poor (ρ 2 = 0.13) and, apart from the<br />
tax attribute, none <strong>of</strong> the attributes is significant. The constant is positive and highly<br />
significant <strong>in</strong>dicat<strong>in</strong>g that all else be<strong>in</strong>g equal, respondents (at least the 56% that did not<br />
protest) are <strong>in</strong> favour <strong>of</strong> the payments to farmers for the “environmental services” they<br />
provide.<br />
The high values <strong>of</strong> the standard deviations <strong>in</strong> relation to their mean provide a possible<br />
explanation <strong>of</strong> the observed lack <strong>of</strong> significance <strong>of</strong> attributes. From the mean and standard<br />
deviation values it is possible to calculate the percentage <strong>of</strong> respondent that hold negative<br />
or positive preferences for a specific attribute. In this sample the percentage <strong>of</strong> negative or<br />
positive preferences is very close to 50% for all attributes. If we consider the rough<br />
grasslands attribute for example, exactly half <strong>of</strong> respondents were observed to dislike it,<br />
half to like it. These “opposite” preferences <strong>of</strong>fset each other giv<strong>in</strong>g an overall lack <strong>of</strong><br />
significance for the attribute. In summary, the model suggests respondents hold<br />
heterogeneous preferences for all attributes and the heterogeneity is “equally” share<br />
between two halves.<br />
eftec A- 58<br />
January 2006
<strong>Economic</strong> <strong>Valuation</strong> <strong>of</strong> <strong>Environmental</strong> <strong>Impacts</strong> <strong>in</strong> the Severely Disadvantaged Areas<br />
Annex 5 – Technical Annex<br />
Table A5.20 presents a random parameter logit model <strong>in</strong> which the socioeconomic and<br />
attitud<strong>in</strong>al characteristics <strong>of</strong> respondents have been added.<br />
Table A5.20: Random parameters logit model (socio-economics)<br />
Dependent variable: CHOICE<br />
Weight<strong>in</strong>g variable: None<br />
Number <strong>of</strong> obs.: 1014, skipped 201 bad obs.<br />
Iterations completed: 44<br />
Log likelihood function: -727.2352<br />
Number <strong>of</strong> parameters: 24<br />
Restricted log likelihood: -893.1718<br />
Chi squared: 331.8732<br />
Degrees <strong>of</strong> freedom: 24<br />
Prob[ChiSqd > value] = .0000000<br />
Variable Coefficient (b) Standard Error t values Significance<br />
Mean values<br />
K 0.248 1.238 0.200 0.841<br />
HMB 0.006 0.011 0.549 0.583<br />
RG 0.004 0.010 0.397 0.692<br />
BMW 0.005 0.014 0.353 0.724<br />
FB 0.000 0.001 0.289 0.772<br />
CH1 -0.079 0.107 -0.736 0.462<br />
CH2 0.139 0.138 1.009 0.313<br />
TAX -0.021 0.004 -5.273 0.000<br />
AGE 0.121 0.267 0.453 0.651<br />
GENDER 0.727 0.316 2.302 0.021<br />
ENVIMP -1.070 0.237 -4.516 0.000<br />
VISFREQ 0.085 0.067 1.274 0.203<br />
LIVING -0.021 0.012 -1.733 0.083<br />
REMAIN 0.064 0.197 0.326 0.744<br />
MEMBER 0.019 0.424 0.046 0.964<br />
EDU 0.275 0.149 1.839 0.066<br />
EMPLOY 1.046 0.328 3.189 0.001<br />
RURAL 2.862 0.613 4.666 0.000<br />
Standard deviation values<br />
NsHMB 0.072 0.017 4.124 0.000<br />
NsRG 0.064 0.011 5.972 0.000<br />
NsBMW 0.097 0.016 6.062 0.000<br />
NsFB 0.007 0.002 3.771 0.000<br />
NsCH1 0.183 0.219 0.834 0.405<br />
NsCH2 1.034 0.152 6.818 0.000<br />
Clarification <strong>of</strong> socioeconomic variables: (for attributes see Table A5.1).<br />
AGE: Respondents’ age (1 = 18-34; 2 = 35-54; 3= 55-70)<br />
GENDER: Respondents’ gender (0=female; 1= male)<br />
ENVIMP: Rank<strong>in</strong>g <strong>of</strong> environmental policy relative to other policies(1=very important; 4= not<br />
important)<br />
VISFREQ: Respondent’s frequency <strong>of</strong> visits to severely disadvantaged areas (1= every day; 10 =<br />
never)<br />
LIVING: number <strong>of</strong> years respondents have been liv<strong>in</strong>g <strong>in</strong> the area<br />
REMAIN: time period respondents th<strong>in</strong>g are stay<strong>in</strong>g <strong>in</strong> the area (1=less than 6 month; 5=for<br />
ever)<br />
MEMBER: dummy = 1 if respondents’ belong to any “environmental” or trust organization and 0<br />
otherwise<br />
EDU: Respondents’ education (1= primary, 6= higher degree)<br />
EMPLOY: dummy = 0 if respondent is not an active worker; 1 otherwise<br />
RURAL: dummy = 0 if respondent is an urban dweller, 1 if he/she is a rural dweller.<br />
eftec A- 59<br />
January 2006
<strong>Economic</strong> <strong>Valuation</strong> <strong>of</strong> <strong>Environmental</strong> <strong>Impacts</strong> <strong>in</strong> the Severely Disadvantaged Areas<br />
Annex 5 – Technical Annex<br />
Before turn<strong>in</strong>g to a discussion <strong>of</strong> model coefficients, it is worth not<strong>in</strong>g that this model is<br />
estimated us<strong>in</strong>g 198 fewer observations than the attributes only model, due to miss<strong>in</strong>g data<br />
<strong>in</strong> the socioeconomic characteristics. Aga<strong>in</strong>, the per capita <strong>in</strong>come variable was dropped<br />
from the analysis s<strong>in</strong>ce it would have caused the loss <strong>of</strong> an additional 17% <strong>of</strong> observations.<br />
The <strong>in</strong>terpretation <strong>of</strong> the model is fairly similar to that for the attributes only model, the<br />
exception be<strong>in</strong>g that the constant is no longer significant, show<strong>in</strong>g that the socioeconomic<br />
variables now expla<strong>in</strong> part <strong>of</strong> the variance that was not expla<strong>in</strong>ed by the attributes <strong>in</strong> the<br />
attributes only model.<br />
Turn<strong>in</strong>g to the <strong>in</strong>terpretation <strong>of</strong> <strong>in</strong>dividuals’ characteristics, it can be observed that men,<br />
more educated people, active workers and rural dwellers were more likely to choose policy<br />
options A and B. Aga<strong>in</strong>, people who visit the region more <strong>of</strong>ten are more <strong>in</strong> favour <strong>of</strong> the<br />
payments to farmers.<br />
S<strong>in</strong>ce neither model has significant attributes it is not logical to pursue welfare estimates,<br />
s<strong>in</strong>ce no sound <strong>in</strong>terpretation could be atta<strong>in</strong>ed.<br />
Regard<strong>in</strong>g the follow up questions, a total <strong>of</strong> 32% <strong>of</strong> respondents declared the attribute that<br />
concerned them the most when mak<strong>in</strong>g choices was the broadleaf and mixed woodland.<br />
The cost was the second most important attribute for 26% <strong>of</strong> respondents. The attribute<br />
that concerned respondents the least was rough grassland, <strong>in</strong>dicated by only 5% <strong>of</strong><br />
respondents.<br />
Regard<strong>in</strong>g respondents’ cited reasons for be<strong>in</strong>g will<strong>in</strong>g to pay for landscape improvements,<br />
the preservation <strong>of</strong> cultural heritage and environmental concerns were the most cited<br />
reasons (see Fig. A5.6). These percentages are approximate s<strong>in</strong>ce responses could be coded<br />
under more than one category.<br />
17%<br />
9%<br />
18%<br />
6%<br />
15%<br />
11%<br />
3%<br />
11%<br />
10%<br />
Personal family<br />
enjoyment<br />
Other enjoyment<br />
altruism<br />
Other enjoyment future<br />
Personal f<strong>in</strong>ancial ga<strong>in</strong><br />
Other f<strong>in</strong>ancial ga<strong>in</strong><br />
Preserve heritage<br />
communities<br />
<strong>Environmental</strong> concerns<br />
Moral obligation<br />
Warm glow<br />
Figure A5.6: Pie chart show<strong>in</strong>g the break down <strong>of</strong> why respondents <strong>in</strong> the North East<br />
were will<strong>in</strong>g to pay for alternative policies over the current policy.<br />
A5.2.7 East Midlands<br />
In the East Midlands region 314 respondents were <strong>in</strong>terviewed. Of the total number <strong>of</strong><br />
responses, 73 expressed a protest answer regard<strong>in</strong>g the proposed project; these protest<br />
bids were removed from the sample. All respondents that displayed a genu<strong>in</strong>e zero WTP by<br />
eftec A- 60<br />
January 2006
<strong>Economic</strong> <strong>Valuation</strong> <strong>of</strong> <strong>Environmental</strong> <strong>Impacts</strong> <strong>in</strong> the Severely Disadvantaged Areas<br />
Annex 5 – Technical Annex<br />
always choos<strong>in</strong>g the current policy option (13%), and those that chose either alternative A<br />
or B at least once were considered <strong>in</strong> the analysis, giv<strong>in</strong>g a total number <strong>of</strong> 1446 [(314-73) x<br />
6)] observations for model estimation.<br />
Analysis <strong>of</strong> East Midlands data shows that the simple conditional logit model specification<br />
cannot be used s<strong>in</strong>ce both models (attributes only and attributes plus socioeconomic<br />
variables) suffer from IIA violations. Furthermore, the attributes only RPL model did not<br />
converge. The same happens if a RPL model that <strong>in</strong>cludes the socioeconomic variables and<br />
does not <strong>in</strong>clude the per capita <strong>in</strong>come variable is estimated. By <strong>in</strong>clud<strong>in</strong>g the per capita<br />
<strong>in</strong>come variable, 600 observations are removed from the sample and, probably by chance,<br />
it is possible to fit a model to the rema<strong>in</strong><strong>in</strong>g data.<br />
Table A5.21 presents a random parameter logit model that <strong>in</strong>cludes the socioeconomic and<br />
attitud<strong>in</strong>al characteristics <strong>of</strong> respondents.<br />
eftec A- 61<br />
January 2006
<strong>Economic</strong> <strong>Valuation</strong> <strong>of</strong> <strong>Environmental</strong> <strong>Impacts</strong> <strong>in</strong> the Severely Disadvantaged Areas<br />
Annex 5 – Technical Annex<br />
Table A5.21: Random parameters logit model (socio-economics)<br />
Dependent variable: CHOICE<br />
Weight<strong>in</strong>g variable: None<br />
Number <strong>of</strong> observations: 4338<br />
Iterations completed: 29<br />
Log likelihood function: -821.9945<br />
Number <strong>of</strong> parameters: 25<br />
Chi squared: 214.8629<br />
Degrees <strong>of</strong> freedom: 25<br />
Prob[ChiSqd > value] = .0000000<br />
Variable Coefficient (b) Standard Error t values Significance<br />
Mean values<br />
K 2.225 0.819 2.718 0.007<br />
HMB 0.016 0.008 1.884 0.060<br />
RG 0.001 0.007 0.185 0.853<br />
BMW 0.015 0.007 1.946 0.052<br />
FB 0.001 0.001 0.989 0.323<br />
CH1 0.119 0.077 1.542 0.123<br />
CH2 0.338 0.087 3.865 0.000<br />
TAX -0.015 0.003 -4.453 0.000<br />
AGE -0.175 0.150 -1.166 0.244<br />
GENDER 0.261 0.194 1.346 0.178<br />
ENVIMP -0.794 0.148 -5.372 0.000<br />
VISFREQ -0.044 0.036 -1.239 0.215<br />
LIVING 0.009 0.007 1.245 0.213<br />
REMAIN -0.446 0.138 -3.222 0.001<br />
MEMBER -0.059 0.234 -0.251 0.802<br />
EDU 0.393 0.109 3.621 0.000<br />
EMPLOY 0.321 0.201 1.598 0.110<br />
RURAL 0.325 0.214 1.518 0.129<br />
INCOME 0.095 0.086 1.105 0.269<br />
Standard deviation values<br />
NsHMB 0.000001 0.000017 0.077 0.939<br />
NsRG 0.000020 0.000012 1.764 0.078<br />
NsBMW 0.000008 0.000014 0.572 0.568<br />
NsFB 0.0000002 0.000002 0.099 0.921<br />
NsCH1 0.000056 0.000155 0.361 0.718<br />
NsCH2 0.000121 0.000155 0.780 0.436<br />
Clarification <strong>of</strong> socioeconomic variables: (for attributes see Table A5.1).<br />
AGE: Respondents’ age (1 = 18-34; 2 = 35-54; 3= 55-70)<br />
GENDER: Respondents’ gender (0=female; 1= male)<br />
ENVIMP: Rank<strong>in</strong>g <strong>of</strong> environmental policy relative to other policies(1=very important; 4= not<br />
important)<br />
VISFREQ: Respondent’ frequency <strong>of</strong> visits to severely disadvantaged areas (1= every day; 10 =<br />
never)<br />
LIVING: number <strong>of</strong> years respondents have been liv<strong>in</strong>g <strong>in</strong> the area<br />
REMAIN: time period respondents th<strong>in</strong>g are stay<strong>in</strong>g <strong>in</strong> the area (1=less than 6 month; 5=for<br />
ever)<br />
MEMBER: dummy = 1 if respondents’ belong to any “environmental” or trust organization and 0<br />
otherwise<br />
EDU: Respondents’ education (1= primary, 6= higher degree)<br />
EMPLOY: dummy = 0 if respondent is not an active worker; 1 otherwise<br />
RURAL: dummy = 0 if respondent is an urban dweller, 1 if he/she is a rural dweller.<br />
eftec A- 62<br />
January 2006
<strong>Economic</strong> <strong>Valuation</strong> <strong>of</strong> <strong>Environmental</strong> <strong>Impacts</strong> <strong>in</strong> the Severely Disadvantaged Areas<br />
Annex 5 – Technical Annex<br />
Although the model is globally significant the data fitt<strong>in</strong>g is poor (ρ 2 = 0.11) and, as<br />
expla<strong>in</strong>ed above, coefficients may not describe the weight that the attributes have <strong>in</strong><br />
people’s utility. If the model is accepted, its coefficients suggest that respondents prefer<br />
<strong>in</strong>creases <strong>in</strong> broadleaf and mixed woodland and large <strong>in</strong>creases <strong>in</strong> cultural heritage. Cost is<br />
highly significant and has a negative sign, show<strong>in</strong>g that the higher the cost <strong>of</strong> a policy<br />
option, the less likely a given respondent is to choose it. The significance and positive sign<br />
<strong>of</strong> the constant term shows that respondents are, all else be<strong>in</strong>g equal, <strong>in</strong> favour <strong>of</strong> the<br />
payments to farmers for “environmental services”. The small standard deviation terms<br />
reveal that preferences are homogeneous <strong>in</strong> the sample, except for the rough grassland<br />
attribute where a low degree <strong>of</strong> heterogeneity is observed.<br />
Table A5.22 describes the implicit prices for the East Midlands region.<br />
Table A5.22: Implicit prices and 95% confidence <strong>in</strong>terval.<br />
Attributes Implicit price<br />
95% lower<br />
bound<br />
Heather moorland and bog 1.04 -0.03 2.31<br />
Rough grassland 0.08 -0.99 0.91<br />
Broadleaf and mixed woodlands 0.97 0.03 2.46<br />
Field boundaries<br />
0.06 -0.06 0.18<br />
Cultural heritage:<br />
from “rapid decl<strong>in</strong>e” to “no change”<br />
Cultural heritage:<br />
7.92 -1.96 22.62<br />
from “rapid decl<strong>in</strong>e” to “much better 22.51 11.84 37.24<br />
conservation”<br />
95% upper<br />
bound<br />
Mean implicit price values for all significant attributes are positive imply<strong>in</strong>g that<br />
respondents have a positive WTP for <strong>in</strong>creases <strong>in</strong> the quality or quantity <strong>of</strong> each attribute.<br />
The wide confidence <strong>in</strong>tervals for the heather moorland and bog implicit price reveal that<br />
it cannot be considered different from 0 at a 95% confidence level. The implicit price for<br />
the broadleaf and mixed woodlands attributes, although positive, has a very wide<br />
confidence <strong>in</strong>terval too.<br />
Us<strong>in</strong>g the choice model parameters it is also possible to obta<strong>in</strong> compensat<strong>in</strong>g surplus<br />
estimates for the required range <strong>of</strong> policy scenarios, as detailed <strong>in</strong> Table 2.2 <strong>of</strong> the ma<strong>in</strong><br />
report. Table A5.23 shows the appropriate mean compensat<strong>in</strong>g surpluses and their<br />
correspond<strong>in</strong>g 95% confidence <strong>in</strong>tervals.<br />
Table A5.23: Compensat<strong>in</strong>g surplus to change from the basel<strong>in</strong>e scenario to each <strong>of</strong> the<br />
alternative policy scenarios, and 95% confidence <strong>in</strong>tervals<br />
Scenario<br />
Compensat<strong>in</strong>g surplus<br />
(£)<br />
95% lower<br />
bound<br />
95% upper<br />
bound<br />
Scenario 1<br />
41.81 22.27 81.34<br />
Scenario 2<br />
47.97 26.45 94.88<br />
Scenario 3<br />
-2.73 -9.06 3.83<br />
A total <strong>of</strong> 29% <strong>of</strong> respondents declared the attribute that concerned them the most to be<br />
cost, followed by the conservation <strong>of</strong> the cultural heritage, <strong>in</strong>dicated by 25% <strong>of</strong><br />
respondents. The attribute that concerned respondents the least was rough grassland,<br />
<strong>in</strong>dicated by only 5% <strong>of</strong> respondents.<br />
Regard<strong>in</strong>g respondents’ cited reasons for be<strong>in</strong>g will<strong>in</strong>g to pay for landscape improvements,<br />
personal family enjoyment, the preservation <strong>of</strong> cultural heritage and environmental<br />
eftec A- 63<br />
January 2006
<strong>Economic</strong> <strong>Valuation</strong> <strong>of</strong> <strong>Environmental</strong> <strong>Impacts</strong> <strong>in</strong> the Severely Disadvantaged Areas<br />
Annex 5 – Technical Annex<br />
concerns were the most <strong>in</strong>dicated options (see Fig. A5.7). These percentages are<br />
approximate s<strong>in</strong>ce responses could be coded under more than one category.<br />
16%<br />
18%<br />
5% 4%<br />
7%<br />
1%<br />
21%<br />
15%<br />
13%<br />
Personal family<br />
enjoyment<br />
Other enjoyment<br />
altruism<br />
Other enjoyment<br />
future<br />
Personal f<strong>in</strong>ancial ga<strong>in</strong><br />
Other f<strong>in</strong>ancial ga<strong>in</strong><br />
Preserve heritage<br />
communities<br />
<strong>Environmental</strong><br />
concerns<br />
Moral obligation<br />
Warm glow<br />
Figure A5.7: Pie chart show<strong>in</strong>g the break down <strong>of</strong> why respondents <strong>in</strong> the East Midlands<br />
were will<strong>in</strong>g to pay for alternative policies over the current policy.<br />
A5.3 Cont<strong>in</strong>gent <strong>Valuation</strong><br />
A5.3.1 Introduction<br />
Data were analyzed us<strong>in</strong>g two different approaches (parametric and non-parametric) to<br />
“double check” results. The ma<strong>in</strong> goal <strong>of</strong> a cont<strong>in</strong>gent valuation survey is to identify the<br />
mean WTP for a specific change <strong>in</strong> the current policy. Two policies were presented to<br />
respondents: the current policy at zero cost and an alternative policy at a range <strong>of</strong> six<br />
costs. The current policy used was the same as <strong>in</strong> the choice experiment part <strong>of</strong> the survey.<br />
The alternative policy represented the follow<strong>in</strong>g change <strong>in</strong> attributes: a 5% <strong>in</strong>crease <strong>in</strong> the<br />
area <strong>of</strong> heather moorland and bog; a 10% <strong>in</strong>crease <strong>in</strong> rough grassland; a 20% <strong>in</strong>crease <strong>in</strong><br />
broadleaf and mixed woodland; an <strong>in</strong>crease <strong>in</strong> field boundary improvement <strong>of</strong> 100 metres<br />
per kilometre; and a cultural heritage conservation level set to “much better conservation”<br />
rather than “rapid decl<strong>in</strong>e”.<br />
Respondents <strong>in</strong> each region were asked whether they were will<strong>in</strong>g to pay the non-zero cost<br />
for the implementation <strong>of</strong> the alternative policy <strong>in</strong> the other five English GORs which<br />
conta<strong>in</strong> Severely Disadvantaged Areas. The cont<strong>in</strong>gent valuation exercise was not carried<br />
out <strong>in</strong> the South East region survey. It should be emphasised that the expressed WTP refers<br />
to five regions where respondents do not live. Given the similarity <strong>of</strong> the valuation exercise<br />
<strong>in</strong> all regions, data from all regions are comb<strong>in</strong>ed <strong>in</strong> this analysis. Respondents that stated a<br />
protest answer or said that they did not know if were will<strong>in</strong>g to pay the proposed bid were<br />
excluded from analysis.<br />
A5.3.2 Non-parametric estimation <strong>of</strong> WTP<br />
As suggested by Bateman et al. (2002), the use <strong>of</strong> a parametric distribution to approximate<br />
the distribution <strong>of</strong> WTP <strong>in</strong> a sample represents a fairly large assumption, mak<strong>in</strong>g the mean<br />
eftec A- 64<br />
January 2006
<strong>Economic</strong> <strong>Valuation</strong> <strong>of</strong> <strong>Environmental</strong> <strong>Impacts</strong> <strong>in</strong> the Severely Disadvantaged Areas<br />
Annex 5 – Technical Annex<br />
WTP particularly sensitive to the particular distributional assumption made by the analyst.<br />
Therefore, the authors advise the use <strong>of</strong> a non-parametric approach to provide an estimate<br />
<strong>of</strong> the mean WTP that can be taken as a lower bound for the statistic. The non-parametric<br />
technique provides a purely empirical approach to estimat<strong>in</strong>g the survivor function <strong>of</strong> WTP<br />
responses. Figure A5.8 shows the survivor function <strong>of</strong> the overall sample.<br />
Proportion<br />
1<br />
0.8<br />
0.6<br />
0.4<br />
0.2<br />
0<br />
0 2 5 10 17 40 70<br />
WTP<br />
Figure A5.8: Non-parametric survivor function<br />
The survivor function <strong>in</strong>dicates that the selected bids were too low. As can be observed <strong>in</strong><br />
Figure A5.8, at the maximum bid (£70), 63% <strong>of</strong> the sample are still will<strong>in</strong>g to pay. A possible<br />
reason for that is the fact that the CV question was not pilot-tested – it was added at the<br />
end <strong>of</strong> the study design us<strong>in</strong>g the same cost range as the choice experiment.<br />
Under these circumstances, the non-parametric approach provides a very conservative<br />
estimate <strong>of</strong> WTP, s<strong>in</strong>ce it considers that 63% <strong>of</strong> the population is will<strong>in</strong>g to pay a maximum<br />
<strong>of</strong> £70, when it is likely that a percentage <strong>of</strong> this 63% would be will<strong>in</strong>g to pay more.<br />
Table A5.24 summarizes the mean WTP and the 95% confidence <strong>in</strong>tervals estimated us<strong>in</strong>g<br />
the non-parametric methodology described <strong>in</strong> Bateman et al (2002).<br />
Table A5.24: non-parametric WTP mean estimation<br />
Statistics £ 95% lower<br />
bound(£)<br />
95% upper<br />
bound(£)<br />
Mean 49.27 47.56 50.99<br />
Std Error 0.88<br />
Respondents’ WTP for the alternative scenario is therefore approximately £50. The<br />
measure is quite precise, as can be deduced from the very tight confidence <strong>in</strong>tervals.<br />
However, as expla<strong>in</strong>ed above, this value should be considered a very conservative<br />
estimation <strong>of</strong> the welfare change <strong>in</strong>duced by the implementation <strong>of</strong> the policy.<br />
A5.3.3 Parametric estimation <strong>of</strong> WTP<br />
Given the “<strong>in</strong>complete” survivor function described above, it is very important to provide a<br />
parametric estimation <strong>of</strong> WTP. Amongst the possible parametric assumptions that can be<br />
made, the most used <strong>in</strong> the literature considers the sample WTP to have a normal or<br />
logistic distribution. The differences <strong>in</strong> the estimated WTP found us<strong>in</strong>g these two<br />
eftec A- 65<br />
January 2006
<strong>Economic</strong> <strong>Valuation</strong> <strong>of</strong> <strong>Environmental</strong> <strong>Impacts</strong> <strong>in</strong> the Severely Disadvantaged Areas<br />
Annex 5 – Technical Annex<br />
distributions are <strong>of</strong>ten negligible; however, the logistic distribution is frequently used given<br />
its analytical tractability, and is chosen <strong>in</strong> this analysis.<br />
A simple analysis was carried out, as the CV design did not allow splitt<strong>in</strong>g between<br />
respondents with zero WTP and those with positive WTP. Consider<strong>in</strong>g the low percentage<br />
<strong>of</strong> people that stated that they were not will<strong>in</strong>g to pay (22.8%) this should not have a<br />
significant impact on results. Table A5.25 summarizes the mean WTP and 95% confidence<br />
<strong>in</strong>tervals.<br />
Table A5.25: parametric WTP mean estimation<br />
Statistics £ 95% lower<br />
bound(£)<br />
95% upper<br />
bound(£)<br />
Mean 104.92 72.17 137.67<br />
Std Error 16.71<br />
On average, respondents valued the change from the current scenario to the change<br />
scenario at £105. As expected the mean WTP under the parametric approach is significantly<br />
higher than that estimated us<strong>in</strong>g the non-parametric approach, s<strong>in</strong>ce the parametric<br />
distribution does not “cut” the WTP at £70. The right tail <strong>of</strong> the distribution attributes a<br />
positive probability to WTP greater than £70 to <strong>in</strong>crease the likelihood <strong>of</strong> fitt<strong>in</strong>g the<br />
observed responses.<br />
A5.3.4 Reasons for contribut<strong>in</strong>g<br />
F<strong>in</strong>ally, it is customary to apply tests <strong>of</strong> validity to CV data sets (Bateman et al., 2002). One<br />
such test that can be run for this data set is to check whether responses to the will<strong>in</strong>gness<br />
to pay question are driven by some rational, consistent process. To test this, we estimate a<br />
logit model on WTP for the hypothetical improvements <strong>in</strong> landscape quality. A general<br />
model <strong>in</strong>clud<strong>in</strong>g a wide range <strong>of</strong> variables hypothesised a priori to determ<strong>in</strong>e respondents’<br />
decisions was estimated. The variables <strong>in</strong>itially <strong>in</strong>cluded <strong>in</strong> the model were those used <strong>in</strong><br />
the CE study. Next, we dropped all the variables that were not significant at the 10% level<br />
to obta<strong>in</strong> a f<strong>in</strong>al model (Table A5.26). This revealed significant correlations between the<br />
probability <strong>of</strong> positive WTP and: 1) region <strong>of</strong> residence; 2) importance <strong>of</strong> environmental<br />
policy; 3) the bid shown; 4) the frequency <strong>of</strong> visits to the Severely Disadvantaged Areas; 5)<br />
respondents’ expected residence <strong>in</strong> the area; 6) number <strong>of</strong> members <strong>in</strong> the household; and<br />
7) household per capita <strong>in</strong>come.<br />
eftec A- 66<br />
January 2006
<strong>Economic</strong> <strong>Valuation</strong> <strong>of</strong> <strong>Environmental</strong> <strong>Impacts</strong> <strong>in</strong> the Severely Disadvantaged Areas<br />
Annex 5 – Technical Annex<br />
Table A5.26: Logit Model results for will<strong>in</strong>gness to pay<br />
responses.<br />
Independent<br />
Variables a<br />
Coefficients Standard Signifi-<br />
error cance<br />
constant 4.619 .805 .000<br />
region SW -.537 .375 .152<br />
region YH -1.075 .350 .002<br />
region NE -1.360 .355 .000<br />
region NW -.914 .373 .014<br />
region EM -.626 .355 .078<br />
ENVIMP -.658 .138 .000<br />
BID -.015 .004 .000<br />
VISFREQ -.169 .038 .000<br />
REMAIN -.348 .112 .002<br />
FAMILY .254 .082 .002<br />
INCOME .356 .091 .000<br />
-2Log-Likelihood 739.863<br />
Significance level<br />
Percentage <strong>of</strong><br />
0.000<br />
correct prediction 80 %<br />
Number <strong>of</strong><br />
observations 820 (418 miss<strong>in</strong>g cases)<br />
a Dependent variable: probability <strong>of</strong> be<strong>in</strong>g will<strong>in</strong>g to pay.<br />
ENVIMP: Rank<strong>in</strong>g <strong>of</strong> environmental policy relative to other policies(1=very important; 4= not important)<br />
VISFREQ: Respondent’s frequency <strong>of</strong> visits to severely disadvantaged areas (1= every day; 10 = never)<br />
BID: bid shown to respondents<br />
REMAIN: time period respondents th<strong>in</strong>g are stay<strong>in</strong>g <strong>in</strong> the area (1=less than 6 month; 5=for ever)<br />
FAMILY: number <strong>of</strong> people liv<strong>in</strong>g <strong>in</strong> the household<br />
RURAL: dummy = 0 if respondent is an urban dweller, 1 if he/she is a rural dweller.<br />
INCOME: respondents’ per capita <strong>in</strong>comes.<br />
Regard<strong>in</strong>g the <strong>in</strong>terpretation <strong>of</strong> model coefficients, <strong>in</strong>dividuals liv<strong>in</strong>g <strong>in</strong> the West Midlands<br />
region (used as reference for the region variable) were more will<strong>in</strong>g to contribute to the<br />
change <strong>in</strong> policy than those liv<strong>in</strong>g <strong>in</strong> Yorkshire and the Humber, the North East, the North<br />
West and East Midlands. Consistently, <strong>in</strong>dividuals who assigned a high importance to<br />
environmental policy <strong>in</strong> relation to others policies were more likely to contribute. Along the<br />
same l<strong>in</strong>es, people that visited the region more <strong>of</strong>ten are <strong>in</strong> favour <strong>of</strong> the payments.<br />
Note that two <strong>of</strong> the variables – ENVIMP (importance <strong>of</strong> environmental policy to respondent)<br />
and VISFREQ (respondent’s frequency <strong>of</strong> visit to SDA) - have counter-<strong>in</strong>tuitive rank<strong>in</strong>gs, i.e.<br />
a lower number implies that someone is more concerned about environmental policy, or<br />
that they visit SDAs more <strong>of</strong>ten.<br />
People with larger families are more will<strong>in</strong>g to contribute to the proposed policy change.<br />
Reliably, higher <strong>in</strong>come is also a sign <strong>of</strong> will<strong>in</strong>gness to accept the payment. Unexpectedly,<br />
the negative sign <strong>of</strong> the coefficient <strong>of</strong> REMAIN shows that respondents who expect to<br />
rema<strong>in</strong> <strong>in</strong> the region for longer are less likely to contribute to policies. F<strong>in</strong>ally, the bid<br />
coefficient is highly significant and has a negative sign, show<strong>in</strong>g that the higher the cost<br />
associated with a policy option, the less likely a given respondent is to choose that option.<br />
Overall, the model predicted correctly for 80% <strong>of</strong> observations and is significant at the 99%<br />
level <strong>of</strong> confidence.<br />
eftec A- 67<br />
January 2006
<strong>Economic</strong> <strong>Valuation</strong> <strong>of</strong> <strong>Environmental</strong> <strong>Impacts</strong> <strong>in</strong> the Severely Disadvantaged Areas<br />
Annex 5 – Technical Annex<br />
A5.4 Comparison <strong>of</strong> ELF WTP with Study WTP<br />
In Section 7.4.1 <strong>of</strong> the ma<strong>in</strong> report, the ELF model’s WTP figures are compared with those<br />
found <strong>in</strong> the study. However, this study values a small change <strong>in</strong> attributes, whereas the<br />
WTP values <strong>in</strong>cluded <strong>in</strong> the ELF model are taken to value the entirety <strong>of</strong> the attribute<br />
with<strong>in</strong> any given region. For this reason the per household WTP figures given <strong>in</strong> the ELF<br />
model for each attribute must be scaled down to make them comparable to WTP for a 1%<br />
change found <strong>in</strong> this study. This section derives an estimate for the ratio <strong>of</strong> total WTP to<br />
WTP for a 1% change, used to compare the two sets <strong>of</strong> results <strong>in</strong> Section 7.4.1.<br />
Importantly, the functional form <strong>of</strong> the marg<strong>in</strong>al WTP is not known. Ord<strong>in</strong>arily it is<br />
reasonable to expect that marg<strong>in</strong>al WTP with respect to the proportion <strong>of</strong> the attribute<br />
conserved would take a functional form similar to the dashed l<strong>in</strong>e <strong>in</strong> Figure A5.9. This<br />
suggests that WTP for additional conservation <strong>of</strong> an attribute decl<strong>in</strong>es as the abundance <strong>of</strong><br />
the attribute is <strong>in</strong>creased (i.e. dim<strong>in</strong>ish<strong>in</strong>g marg<strong>in</strong>al utility is displayed). However, s<strong>in</strong>ce the<br />
parameters <strong>of</strong> such a function are unknown, it is <strong>in</strong>stead assumed that that the marg<strong>in</strong>al<br />
WTP function can be approximated by a l<strong>in</strong>ear function <strong>of</strong> the form given by the straight<br />
solid l<strong>in</strong>e. Will<strong>in</strong>gness to pay for the attribute <strong>in</strong> its entirety – i.e. the <strong>in</strong>tegral between 0<br />
and 1 - is shown by the grey area. The WTP for a change from 100% to 90% is given by the<br />
area shaded with diagonal black l<strong>in</strong>es.<br />
marg<strong>in</strong>al WTP<br />
If the solid l<strong>in</strong>e function for marg<strong>in</strong>al WTP (w) can be given as a function <strong>of</strong> abundance (Q):<br />
w = a + bQ<br />
0.1<br />
then the total WTP (W) to prevent a loss <strong>of</strong> a proportion x <strong>of</strong> the attribute is the <strong>in</strong>tegral <strong>of</strong><br />
w between 1-x and 1:<br />
2<br />
⎡ Q ⎤<br />
W = ⎢aQ<br />
+ b<br />
2<br />
⎥<br />
⎣ ⎦<br />
1<br />
1-x<br />
=<br />
0.3<br />
Abundance<br />
Figure A5.9: Assumed form <strong>of</strong> marg<strong>in</strong>al WTP and comparison <strong>of</strong> different total<br />
WTP figures represented by <strong>in</strong>tegrals.<br />
(a - b)x<br />
bx<br />
+<br />
2<br />
2<br />
0.5<br />
eftec A- 68<br />
January 2006<br />
0.7<br />
0.9
<strong>Economic</strong> <strong>Valuation</strong> <strong>of</strong> <strong>Environmental</strong> <strong>Impacts</strong> <strong>in</strong> the Severely Disadvantaged Areas<br />
Annex 5 – Technical Annex<br />
From this, the ratio r <strong>of</strong> the WTP to save the whole attribute (W1) and 1% <strong>of</strong> the attribute<br />
(W0.01) is given approximately as follows 7 :<br />
W1<br />
r =<br />
W<br />
0.01<br />
a − 0.5b 100(a − 0.5b)<br />
≈<br />
≈<br />
0.01a − 0.01b a − b<br />
i.e. a hundred times the ratio <strong>of</strong> the marg<strong>in</strong>al WTP at 50% abundance and at 100%<br />
abundance. Note that r would only equal 100 if b = 0; i.e. if the marg<strong>in</strong>al WTP was constant<br />
at no matter how great or small the abundance <strong>of</strong> the feature.<br />
From the WTP curves provided by the ELF model, it appears that for most attributes, WTP<br />
at 50% abundance is roughly twice WTP at 100% abundance. Therefore, it seems a<br />
reasonable approximation to divide ELF estimates by 200 for comparison purposes with this<br />
study’s estimates.<br />
A5.5 Theoretical Basis <strong>of</strong> L<strong>in</strong>ear Time Treatment <strong>of</strong> Benefits<br />
This section presents the justification for treat<strong>in</strong>g the compensat<strong>in</strong>g surplus for each policy<br />
scenario to change l<strong>in</strong>early with time.<br />
The utility <strong>of</strong> a particular policy scenario is given by:<br />
Vi = C + ∑kβk Xik +S<br />
where Vi is utility, C is the constant, βk are coefficients, Xk are physical attribute levels. Xk<br />
is time-dependent, S is the sum <strong>of</strong> socioeconomic factors (treat as constant for present<br />
purposes).<br />
Utility changes with respect to time as follows:<br />
dV<br />
dt<br />
=<br />
∑<br />
k<br />
dV<br />
dX<br />
ik<br />
dX<br />
dt<br />
ik<br />
=<br />
∑<br />
k<br />
dX<br />
β k<br />
dt<br />
If attribute k changes l<strong>in</strong>early with time, then:<br />
dX k = ak<br />
+ b t and = bk<br />
dt<br />
Xk k<br />
where ak and bk are constants.<br />
ik<br />
If all attributes can be assumed to change l<strong>in</strong>early with time, then:<br />
dV<br />
dt<br />
∑<br />
= k<br />
β kb<br />
k<br />
This is itself a constant; therefore utility, and compensat<strong>in</strong>g surplus measures, also change<br />
l<strong>in</strong>early with time.<br />
7 This derivation uses the simplify<strong>in</strong>g assumption that the term <strong>in</strong> W0.01 <strong>in</strong>corporat<strong>in</strong>g 0.01 2 is small<br />
enough to be neglected.<br />
eftec A- 69<br />
January 2006
<strong>Economic</strong> <strong>Valuation</strong> <strong>of</strong> <strong>Environmental</strong> <strong>Impacts</strong> <strong>in</strong> the Severely Disadvantaged Areas<br />
Annex 5 – Technical Annex<br />
Annex 3 <strong>of</strong> Cumulus et al. (2005) <strong>in</strong>dicates that all attributes are expected to change with<br />
time <strong>in</strong> a fashion which can reasonably be approximated as l<strong>in</strong>ear up to (but not beyond)<br />
2013, therefore a l<strong>in</strong>ear treatment <strong>of</strong> compensat<strong>in</strong>g surplus measures over time is justified.<br />
A5.6 Compensat<strong>in</strong>g Surplus Aggregation Estimates (Adjusted Variant)<br />
Table A5.27 is a version <strong>of</strong> Table 8.4 <strong>in</strong> the ma<strong>in</strong> report. The only difference is that the<br />
number <strong>of</strong> households used for each region is the total number <strong>of</strong> households <strong>in</strong> the GOR<br />
multiplied by the proportion <strong>of</strong> households who did not <strong>in</strong>dicate a protest response <strong>in</strong> the<br />
choice experiment. This slightly modified set <strong>of</strong> aggregation figures is presented to give a<br />
lower bound estimate <strong>of</strong> the aggregate compensat<strong>in</strong>g surplus figures under consideration <strong>of</strong><br />
the possibility that protest responses may have represented genu<strong>in</strong>e zero WTP responses.<br />
Table A5.27: Adjusted compensat<strong>in</strong>g surplus estimates <strong>of</strong> the different policy options<br />
over the current policy.<br />
NW YH WM EM SW SE Total<br />
Annual per household compensat<strong>in</strong>g surplus (£ pHH)<br />
Scenario 1<br />
Scenario 2<br />
Scenario 3<br />
7.68<br />
(2.59 -<br />
13.33)<br />
9.17<br />
(3.60 -<br />
15.22)<br />
0.21<br />
(-1.41 -<br />
1.88)<br />
18.64<br />
(12.28 -<br />
25.56)<br />
20.54<br />
(14.16 -<br />
27.59)<br />
-1.20<br />
(-2.78 -<br />
0.63)<br />
7.44<br />
(0.39 -<br />
14.42)<br />
10.04<br />
(2.58 -<br />
17.51)<br />
-1.50<br />
(-3.36 -<br />
0.42)<br />
Figures <strong>in</strong> brackets are 95% confidence <strong>in</strong>tervals.<br />
41.81<br />
(22.27 -<br />
81.34)<br />
47.97<br />
(26.45 -<br />
94.88)<br />
-2.73<br />
(-9.06 -<br />
3.83)<br />
20.59<br />
(9.28 -<br />
32.83)<br />
21.74<br />
(9.84 -<br />
34.64)<br />
-0.92<br />
(-3.76 -<br />
2.20)<br />
19.85<br />
(12.47 -<br />
27.66)<br />
25.40<br />
(17.72 -<br />
34.17)<br />
-0.89<br />
(-3.12 -<br />
1.15)<br />
Total no.<br />
households<br />
(millions) 2.81 2.07 2.15 1.73 2.09 3.29<br />
% protest<br />
bids 26 31 14 23 17 26<br />
No.<br />
households<br />
(adjusted) 2.07 1.42 1.85 1.33 1.73 2.42<br />
Total adjusted annual compensat<strong>in</strong>g surplus (£ million)<br />
Scenario 1<br />
15.91<br />
(5.37 -<br />
27.62)<br />
19.00<br />
(7.46 -<br />
26.47<br />
(17.44 -<br />
36.29)<br />
29.16<br />
(20.10 -<br />
13.73<br />
(0.72 -<br />
26.62)<br />
18.53<br />
(4.76 -<br />
55.52<br />
(29.57 –<br />
108.00)<br />
63.69<br />
(35.12 -<br />
35.62<br />
(16.06 -<br />
56.80)<br />
37.61<br />
(17.02 -<br />
48.08<br />
(30.20 –<br />
67.00)<br />
61.52<br />
(42.92 -<br />
195.33<br />
(99.35 -<br />
322.33)<br />
229.52<br />
(127.39 -<br />
Scenario 2 31.53) 39.17) 32.32) 125.98) 59.93) 82.77) 371.71)<br />
0.44 -1.70 (- -2.77 -3.62 -1.59 -2.16 -11.41<br />
(-2.92 - 3.95 - (-6.20 - (-12.03 - (-6.51 - (-7.56 - (-39.16 -<br />
Scenario 3 3.90) 0.89) 0.78) 5.09) 3.81) 2.79) 17.24)<br />
Total adjusted compensat<strong>in</strong>g surplus aggregated 2007-2013 (£ million)<br />
55.56 92.42 47.95 193.86 124.4 167.9 682.1<br />
(18.74 - (60.88 - (2.51 - (103.26 - (56.07 - (105.48 - (346.94 -<br />
Scenario 1 96.44) 126.73) 92.94) 377.15) 198.35) 233.96) 1125.57)<br />
66.34 101.84 64.71 222.42 131.35 214.84 801.51<br />
(26.05 - (70.21 - (16.63 - (122.64 - (59.45 - (149.88 - (444.86 -<br />
Scenario 2 110.12) 136.79) 112.86) 439.93) 209.28) 289.02) 1298.01)<br />
1.52 -5.95 -9.67 -12.66 -5.56 -7.53 -39.84<br />
(-10.20 - (-13.78 - (-21.66 - (-42.01 - (-22.72 - (-26.39 - (-136.76<br />
Scenario 3 13.6) 3.12) 2.71) 17.76) 13.29) 9.73) - 60.21)<br />
eftec A- 70<br />
January 2006
<strong>Economic</strong> <strong>Valuation</strong> <strong>of</strong> <strong>Environmental</strong> <strong>Impacts</strong> <strong>in</strong> the Severely Disadvantaged Areas<br />
Annex 5 – Technical Annex<br />
Assumptions made <strong>in</strong> time aggregation are the same as those <strong>in</strong> Section 8 <strong>of</strong> the ma<strong>in</strong><br />
report:<br />
• Discount rate is 3.5%<br />
• 2007 is the base year – i.e. the discount factor <strong>in</strong> 2007 is equal to 1.<br />
• Physical changes can be acceptably approximated as occurr<strong>in</strong>g l<strong>in</strong>early<br />
References to Section 5<br />
Adamowicz W., Boxall P., Williams M. and Louviere J. (1998) “Stated preference<br />
approaches for measur<strong>in</strong>g passive use values: choice experiments and cont<strong>in</strong>gent valuation”<br />
American Journal <strong>of</strong> Agricultural <strong>Economic</strong>s, 80, 64-75.<br />
Allenby, G., G<strong>in</strong>ter, J., 1995. The effects <strong>of</strong> <strong>in</strong>-store displays and feature advertis<strong>in</strong>g on<br />
consideration sets. International Journal <strong>of</strong> Research <strong>in</strong> Market<strong>in</strong>g 12, 67–80.<br />
Bateman, I., Carson, R., Day, B., Hanemann, M., Hanley, N., Hett, T., Jones-Lee, M.,<br />
Loomes, G., Mourato, S., Ozdemiroglu, E., Pearce, D., Sugden, R. and Swanson, J. (2002):<br />
“<strong>Economic</strong> <strong>Valuation</strong> with Stated Preference Techniques, A Manual”. Edward Elgar,<br />
Cheltenham, UK / Northampton, Ma, USA.<br />
Cumulus Consultants Ltd., Institute for European <strong>Environmental</strong> Policy and the Countryside<br />
and Countryside Research Unit (2005), “Assessment <strong>of</strong> the impact <strong>of</strong> CAP Reform and other<br />
key policies on upland farms and land use implications <strong>in</strong> both Severely Disadvantaged &<br />
Disadvantaged Areas <strong>of</strong> England”, report to the Department for Environment, Food and<br />
Rural Affairs<br />
Domencich, T. and McFadden, D. (1975): Urban travel demand: a behavioural approach.<br />
Amsterdam: North-Holland.<br />
Hanley, N., Adamowicz V. and Wright, R. (2005) “Price vector effects <strong>in</strong> choice<br />
experiments: an empirical test<strong>in</strong>g”. Resource & Energy <strong>Economic</strong>s, 27 (3), 2005: 227-234.<br />
Hausman, J., Wise, D., 1978. A conditional probit model for qualitative choice: discrete<br />
decisions recogniz<strong>in</strong>g <strong>in</strong>terdependence and heterogeneous preferences. Econometrica 42,<br />
403–426.<br />
Hausman, J., McFadden, D., 1984. Specification tests for the mult<strong>in</strong>omial logit model.<br />
Econometrica 52, 1219–1240.<br />
Hensher, D. and Green W (1999): Nested logit model estimation: clarify<strong>in</strong>g the rules for<br />
model estimation, Institute <strong>of</strong> Transport Studies, University <strong>of</strong> Sydney.<br />
Kr<strong>in</strong>sky, I. and Robb, A.L. “On Approximat<strong>in</strong>g the Statistical Properties <strong>of</strong> Elasticities”.<br />
Review <strong>of</strong> <strong>Economic</strong>s and Statistics, 68(1986): 715-719.<br />
Luce, R.D., 1959. Individual Choice Behaviour: a Theoretical Analysis. Wiley, New York.<br />
Tra<strong>in</strong>, K., 1998. Recreation demand models with taste differences over people. Land<br />
<strong>Economic</strong>s 74, 230–239.<br />
Tra<strong>in</strong>, K., 2003. Discrete Choice Models with Simulation. Cambridge University Press,<br />
Cambridge.<br />
eftec A- 71<br />
January 2006
<strong>Economic</strong> <strong>Valuation</strong> <strong>of</strong> <strong>Environmental</strong> <strong>Impacts</strong> <strong>in</strong> the Severely Disadvantaged Areas<br />
Annex 6 – <strong>Valuation</strong> Workshop Protocol<br />
Annex 6 – <strong>Valuation</strong> Workshop Protocol<br />
Knaresborough, 19 th October 2005<br />
Harrogate, 20 th October 2005<br />
Section A - Introduction<br />
This is not <strong>in</strong>tended to be read out verbatim, but is written as suggested content<br />
• Introduction<br />
Good even<strong>in</strong>g and welcome to the session today. Thank you for tak<strong>in</strong>g the time to<br />
jo<strong>in</strong> our discussion.<br />
My name is Tony, I work for SERS, a company that specializes <strong>in</strong> social and<br />
economic research. My colleague is Helen from eftec, an environmental<br />
consultancy.<br />
• Inform about purpose <strong>of</strong> focus group<br />
Part <strong>of</strong> a government funded research project we are currently work<strong>in</strong>g on.<br />
We are hold<strong>in</strong>g a series <strong>of</strong> discussions such as today’s to help us understand public<br />
attitudes towards environmental features.<br />
Basically we are here to learn from you and your discussion!<br />
• Instructions for the group<br />
Lots <strong>of</strong> issues to discuss, so we will have refreshments as we go along rather than<br />
take a break.<br />
We would like everyone to participate, with no-one dom<strong>in</strong>at<strong>in</strong>g the discussion. We<br />
want to hear as many different th<strong>in</strong>gs from as many <strong>of</strong> you as time allows.<br />
There really are no right or wrong answers, we are here to learn from your views<br />
and experiences.<br />
On the other hand, if you th<strong>in</strong>k your experience is just like everyone else’s that is<br />
still important <strong>in</strong>formation for us and we want to hear your story. There is always<br />
someth<strong>in</strong>g unique to each person’s own experience/views.<br />
We are go<strong>in</strong>g to ask you to do a questionnaire and then talk about it afterwards.<br />
We will be on a first name basis tonight and <strong>in</strong> our reports no names will be<br />
attached to comments. You may be assured <strong>of</strong> complete confidentiality.<br />
We would like to record the session: it will help us a lot to register your views <strong>in</strong> an<br />
accurate way.<br />
Do you have any objections (to us record<strong>in</strong>g the session)?<br />
However, you are assured that although we may quote what you say, your names<br />
will not be <strong>in</strong>cluded anywhere <strong>in</strong> our report<strong>in</strong>g.<br />
As we are record<strong>in</strong>g the session please try to speak one at a time and no side<br />
conversations between neighbours please!<br />
Please turn <strong>of</strong>f your mobiles at this po<strong>in</strong>t.<br />
The discussion should last 1.5 hours.<br />
eftec A- 72<br />
January 2006
<strong>Economic</strong> <strong>Valuation</strong> <strong>of</strong> <strong>Environmental</strong> <strong>Impacts</strong> <strong>in</strong> the Severely Disadvantaged Areas<br />
Annex 6 – <strong>Valuation</strong> Workshop Protocol<br />
Open<strong>in</strong>g / ice-breaker question: ask participants to briefly <strong>in</strong>troduce themselves,<br />
etc.<br />
Section B - Questionnaire<br />
The first th<strong>in</strong>g we would like you to do is fill <strong>in</strong> this questionnaire. You should have a<br />
questionnaire form and also a supplement booklet with some additional <strong>in</strong>formation.<br />
ASK RESPONDENTS TO FILL IN THE FIRST SECTION OF THE QUESTIONNAIRE<br />
“BASICS & ATTITUDES AND THEN WAIT.<br />
BASICS & ATTITUDES<br />
Question B1. Please tick the correct box for your age range and gender.<br />
Question B2. Where do you live?<br />
Question B3. What is the Occupation <strong>of</strong> the chief wage earner <strong>in</strong> your Household?<br />
Question B4. How important would you say that environmental policy is, <strong>in</strong> relation to<br />
other th<strong>in</strong>gs that government is concerned with, such as law and order, or education?<br />
Please tick one.<br />
Very important<br />
Quite important<br />
Not all that important<br />
I really don’t care about the environment at all<br />
Question B5. What do you th<strong>in</strong>k should be the ma<strong>in</strong> concern for environmental policy <strong>in</strong><br />
this country over the next 10 years? Please rank the options <strong>in</strong> this table from 1 (most<br />
important) to 4 (least important).<br />
Controll<strong>in</strong>g air pollution<br />
Tackl<strong>in</strong>g climate change<br />
Protect<strong>in</strong>g the countryside<br />
Protect<strong>in</strong>g the quality <strong>of</strong> rivers, lakes and the sea<br />
Question B6. Do you ever visit the countryside for recreation, for work or for both?<br />
Please tick an option <strong>in</strong> this table. Short visits (e.g. to walk the dog), days out,<br />
weekends away or longer holidays and visit<strong>in</strong>g friends and family all count as<br />
recreation.<br />
YES – RECREATION<br />
YES – WORK<br />
YES – BOTH<br />
NO, NEVER visit the countryside<br />
CHOICE EXPERIMENT VALUATION SCENARIO<br />
EXPLAIN THAT YOU ARE NOW GOING TO READ SOME INFORMATION OUT.<br />
eftec A- 73<br />
January 2006
<strong>Economic</strong> <strong>Valuation</strong> <strong>of</strong> <strong>Environmental</strong> <strong>Impacts</strong> <strong>in</strong> the Severely Disadvantaged Areas<br />
Annex 6 – <strong>Valuation</strong> Workshop Protocol<br />
This survey is ma<strong>in</strong>ly concerned with your op<strong>in</strong>ions about hill farm<strong>in</strong>g areas <strong>in</strong> Yorkshire &<br />
Humber. The map on page 1 <strong>of</strong> your supplement shows your region.<br />
ASK PARTICIPANTS TO LOOK AT THE DETAILED MAP OF YORKSHIRE & HUMBER<br />
The green l<strong>in</strong>e shows the regional border and the p<strong>in</strong>k shaded areas show the hill farm<strong>in</strong>g<br />
areas <strong>of</strong> <strong>in</strong>terest. You can see that the ma<strong>in</strong> areas <strong>of</strong> concern <strong>in</strong> Yorkshire & Humber are<br />
the Yorkshire Dales and North Yorkshire Moors, but there are also other areas.<br />
We would like you to th<strong>in</strong>k <strong>in</strong> particular about the different landscape features <strong>in</strong> these<br />
areas, such as farm woodlands, hedgerows and moorland. These features are affected by<br />
the way <strong>in</strong> which farm<strong>in</strong>g is carried out. If there are fewer work<strong>in</strong>g hill farms <strong>in</strong> an area, or<br />
if they change their practices, then some <strong>of</strong> these landscape features may change. You may<br />
get more or less <strong>of</strong> them, or their quality might alter.<br />
In these areas, farmers receive special payments from the Government to make up for the<br />
fact that farm<strong>in</strong>g is more difficult, because <strong>of</strong> the steep ground, and because these areas<br />
are far away from the majority <strong>of</strong> customers.<br />
The Government may change how it pays farmers <strong>in</strong> these hilly areas. If this happened, the<br />
ma<strong>in</strong> aim would be to try and reduce the bad impacts <strong>of</strong> future changes <strong>in</strong> farm<strong>in</strong>g on the<br />
landscape, and to <strong>in</strong>crease any good impacts. However, this policy change would come at a<br />
cost to people like you, either through higher national or local taxes, or even perhaps<br />
through charges on people visit<strong>in</strong>g the areas. The government would like to know what<br />
people th<strong>in</strong>k <strong>of</strong> as good and bad impacts and whether the cost <strong>of</strong> the policy change is right.<br />
This is why we are conduct<strong>in</strong>g this survey.<br />
So what are these “Landscape Features” that I have been talk<strong>in</strong>g about? Well, the<br />
landscape features we are look<strong>in</strong>g at <strong>in</strong> this survey are the follow<strong>in</strong>g:<br />
ASK PARTICIPANTS TO LOOK AT TABLE 1 ON PAGE 2 OF THEIR SUPPLEMENT<br />
heather moorland and bog, rough grassland, broadleaf and mixed woodland, field<br />
boundaries and traditional farm build<strong>in</strong>gs and farm practices.<br />
Please read Table 1 carefully - it will help you to make decisions <strong>in</strong> the next section <strong>of</strong> the<br />
questionnaire.<br />
eftec A- 74<br />
January 2006
<strong>Economic</strong> <strong>Valuation</strong> <strong>of</strong> <strong>Environmental</strong> <strong>Impacts</strong> <strong>in</strong> the Severely Disadvantaged Areas<br />
Annex 6 – <strong>Valuation</strong> Workshop Protocol<br />
TABLE 1<br />
Heather moorland and bog<br />
These are areas <strong>of</strong> heather moorland <strong>in</strong> drier areas and on steeper slopes, but with<br />
less heather and more bog <strong>in</strong> wetter areas. Bogs conta<strong>in</strong> peat, with bog mosses and<br />
sometimes bog pools. All <strong>of</strong> these areas are typically used for sheep graz<strong>in</strong>g, and<br />
may conta<strong>in</strong> many different k<strong>in</strong>ds <strong>of</strong> birds, <strong>in</strong>sects and plants.<br />
Rough grassland<br />
These areas can <strong>of</strong>ten look untidy where the soil is poor, but can be heavily grazed<br />
by sheep where soil is better. They may look a bit brown or pale at some times <strong>of</strong> the<br />
year, but at other times can look very green. Birds also like these areas.<br />
Broadleaf and mixed woodland<br />
These woodlands usually consist <strong>of</strong> a mix <strong>of</strong> native tree species such as ash, oak<br />
and hazel. Unlike conifer plantations, these woodlands have an irregular shape when<br />
seen from a distance (so they don’t look like square blocks on the hillside!). Some <strong>of</strong><br />
these woods are very old, others are more recently planted.<br />
Field boundaries<br />
These are the traditional stone walls (or dykes) and hedgerows seen across the<br />
upland landscape. Modern wire fences are NOT <strong>in</strong>cluded <strong>in</strong> this feature, although<br />
they have <strong>of</strong>ten replaced, or run alongside, traditional stone walls and hedges.<br />
Traditional farm build<strong>in</strong>gs and farm<strong>in</strong>g practices<br />
Here we mean the traditional farm build<strong>in</strong>gs that can be seen <strong>in</strong> the uplands, and<br />
their associated barns and sheds. But we also <strong>in</strong>clude traditional farm practices such<br />
as shepherd<strong>in</strong>g.<br />
We would now like you to th<strong>in</strong>k about a number <strong>of</strong> possible options for future government<br />
policy <strong>in</strong> hill-farm<strong>in</strong>g areas. These options are shown <strong>in</strong> the “Choice Sets” which we’re<br />
go<strong>in</strong>g to look at.<br />
ASK PARTICIPANTS TO LOOK AT TABLE 2 ON PAGE 3 IN THEIR SUPPLEMENT.<br />
In each one, you will see there are three choices for you to make: the Current Policy, Policy<br />
Option A or Policy Option B. You’ll notice that if you choose the current policy then this<br />
comes at no extra cost to your household, but some landscape features will get worse <strong>in</strong><br />
time accord<strong>in</strong>g to predictions. Policy Option A and Policy Option B come at an additional<br />
cost to your household every year, but also give you some improvements <strong>in</strong> the landscape<br />
features <strong>of</strong> these hill-farm<strong>in</strong>g areas.<br />
eftec A- 75<br />
January 2006
<strong>Economic</strong> <strong>Valuation</strong> <strong>of</strong> <strong>Environmental</strong> <strong>Impacts</strong> <strong>in</strong> the Severely Disadvantaged Areas<br />
Annex 6 – <strong>Valuation</strong> Workshop Protocol<br />
TABLE 2<br />
Policy Option Current<br />
policy<br />
Change <strong>in</strong> area <strong>of</strong> Heather<br />
Moorland and Bog<br />
Change <strong>in</strong> area <strong>of</strong> Rough<br />
Grassland<br />
Change <strong>in</strong> area <strong>of</strong> Broadleaf<br />
and mixed woodlands<br />
Condition <strong>of</strong> field boundaries<br />
Change <strong>in</strong> farm build<strong>in</strong>g and<br />
traditional farm practices<br />
Increase <strong>in</strong> tax payments by<br />
your household each year<br />
A loss <strong>of</strong> 2%<br />
(-2%)<br />
A loss <strong>of</strong> 10%<br />
(-10%)<br />
A ga<strong>in</strong> <strong>of</strong> 3%<br />
(+3%)<br />
For every 1 km,<br />
100m is<br />
restored<br />
Policy<br />
Option A<br />
A ga<strong>in</strong> <strong>of</strong> 2%<br />
(+2%)<br />
A loss <strong>of</strong> 2%<br />
(-2%)<br />
A ga<strong>in</strong> <strong>of</strong> 20%<br />
(+20%)<br />
For every 1 km,<br />
200 m is<br />
restored<br />
Rapid decl<strong>in</strong>e no change<br />
Policy<br />
Option B<br />
A loss <strong>of</strong> 2%<br />
(-2%)<br />
A loss <strong>of</strong> 2%<br />
(-2%)<br />
A ga<strong>in</strong> <strong>of</strong> 10%<br />
(+10%)<br />
for every 1 km,<br />
50 m is<br />
restored<br />
Much better<br />
conservation<br />
£0 £20 £10<br />
As you can see <strong>in</strong> the “current policy” (POINT), the condition <strong>of</strong> many <strong>of</strong> the landscape<br />
features <strong>in</strong> Yorkshire & Humber is gett<strong>in</strong>g worse: the amounts <strong>of</strong> heather moorland and<br />
rough grassland are both fall<strong>in</strong>g, there is some restoration <strong>of</strong> field boundaries and there is a<br />
rapid decl<strong>in</strong>e <strong>in</strong> the condition <strong>of</strong> farm build<strong>in</strong>gs and traditional farm<strong>in</strong>g practices. However,<br />
the area <strong>of</strong> woodland is <strong>in</strong>creas<strong>in</strong>g, and stick<strong>in</strong>g with this option would not create any extra<br />
cost for your household.<br />
In Option A (POINT) the area <strong>of</strong> heather moorland <strong>in</strong>creases, the area <strong>of</strong> rough grassland<br />
falls by less, and more field boundaries are restored. There is also more woodland<br />
compared to the current policy. However, your household would face an additional cost <strong>of</strong><br />
£20 a year to pay for these landscape improvements.<br />
In Option B (POINT), the extra cost is lower - £10 per year - and you still get some<br />
landscape improvements over the current policy, but not as much as with Option A.<br />
So, which would you prefer? The current policy with no extra costs but some losses <strong>in</strong> most<br />
landscape features; Option A with an extra cost <strong>of</strong> £20 per year to you, but some<br />
improvements; or Option B, with fewer, but less expensive improvements?<br />
We are now go<strong>in</strong>g to give you six more <strong>of</strong> these choice sets. For each one we would like you<br />
to pick the option that you would prefer to see happen <strong>in</strong> the hill farm areas <strong>of</strong> Yorkshire &<br />
Humber. You’ll notice that sometimes <strong>in</strong> the sets you are shown that th<strong>in</strong>gs get better, and<br />
sometimes th<strong>in</strong>gs get worse. You might th<strong>in</strong>k that you do not have enough “expert<br />
knowledge” to make these k<strong>in</strong>ds <strong>of</strong> choices, but we are <strong>in</strong>terested <strong>in</strong> what ord<strong>in</strong>ary people<br />
th<strong>in</strong>k about what the Government should be do<strong>in</strong>g.<br />
eftec A- 76<br />
January 2006
<strong>Economic</strong> <strong>Valuation</strong> <strong>of</strong> <strong>Environmental</strong> <strong>Impacts</strong> <strong>in</strong> the Severely Disadvantaged Areas<br />
Annex 6 – <strong>Valuation</strong> Workshop Protocol<br />
Please do consider only the hill-farm<strong>in</strong>g areas, and only those areas <strong>in</strong> your region,<br />
Yorkshire & Humber, as the survey is be<strong>in</strong>g conducted <strong>in</strong> other regions separately. Each<br />
time, just th<strong>in</strong>k about what you would most like to happen. But remember that if you opt<br />
to pay extra by choos<strong>in</strong>g Option A or B on any set, then this means your household would<br />
have less money available to spend on other th<strong>in</strong>gs, or to save. Take your time, make your<br />
best choice for each <strong>of</strong> the six sets, and tick your choice <strong>in</strong> Question B7 <strong>of</strong> your<br />
questionnaire.<br />
There are no right or wrong answers. Please be honest if you would prefer not to pay the<br />
extra money.<br />
In each choice set, you will see that these landscape features can take a number <strong>of</strong> possible<br />
values. In the choice sets we show these as % changes over how much there is <strong>of</strong> each<br />
feature at the moment – for example, “a 2% loss”. You might like to know what these %<br />
changes mean for landscape features <strong>in</strong> Yorkshire & Humber. Table 3 <strong>in</strong> your supplement<br />
shows you this. You might f<strong>in</strong>d it helpful to th<strong>in</strong>k <strong>of</strong> “1 hectare” as a couple <strong>of</strong> football<br />
pitches.<br />
ASK PARTICIPANTS TO LOOK AT TABLE 3 ON PAGE 4 OF THEIR SUPPLMENT<br />
TABLE 3<br />
Heather<br />
moorland and<br />
bog<br />
Rough<br />
grassland<br />
Broadleaf and<br />
mixed<br />
woodlands<br />
Current policy: Effects <strong>of</strong> possible future policy changes<br />
A 2% loss is equal<br />
to los<strong>in</strong>g 2,550<br />
hectares out <strong>of</strong> the<br />
current total <strong>of</strong><br />
128,000 hectares<br />
A 10% loss is equal<br />
to los<strong>in</strong>g 11,500<br />
hectares out <strong>of</strong> the<br />
current total <strong>of</strong><br />
115,000 hectares<br />
A ga<strong>in</strong> <strong>of</strong> 3% is<br />
equal to hav<strong>in</strong>g an<br />
extra 600 hectares<br />
<strong>in</strong> addition to the<br />
current area <strong>of</strong><br />
20,000 hectares<br />
A 12% loss is equal<br />
to los<strong>in</strong>g 15,000<br />
hectares out <strong>of</strong> the<br />
current total<br />
A 5% ga<strong>in</strong> is equal<br />
to hav<strong>in</strong>g an extra<br />
5,800 hectares<br />
A 10% ga<strong>in</strong> is equal<br />
to hav<strong>in</strong>g an extra<br />
2,000 hectares<br />
A 5% ga<strong>in</strong> is equal<br />
to hav<strong>in</strong>g an extra<br />
6,400 hectares<br />
A 10% ga<strong>in</strong> is equal<br />
to hav<strong>in</strong>g an extra<br />
11,500 hectares<br />
A 20% ga<strong>in</strong> is equal<br />
to hav<strong>in</strong>g an extra<br />
4,000 hectares<br />
You might like to keep this table visible as you go through your choices so that you can<br />
refer back to it.<br />
ASK PARTICIPANTS WHETHER ALL IS CLEAR AND ASK THEM TO FILL IN QUESTIONS<br />
B7 AND B8, THEN WAIT.<br />
Question B7. Please go through the six choice sets (on pages 5 to 10 <strong>in</strong> your<br />
supplement) and for each one tick which policy option you would prefer.<br />
eftec A- 77<br />
January 2006
<strong>Economic</strong> <strong>Valuation</strong> <strong>of</strong> <strong>Environmental</strong> <strong>Impacts</strong> <strong>in</strong> the Severely Disadvantaged Areas<br />
Annex 6 – <strong>Valuation</strong> Workshop Protocol<br />
Choice set<br />
number<br />
1 (page 5)<br />
2<br />
3<br />
4<br />
5<br />
6 (page 10)<br />
Current<br />
policy<br />
Policy<br />
Option A<br />
Policy<br />
Option B<br />
Question B8. In mak<strong>in</strong>g your choices, which <strong>of</strong> these features concerned you the most?<br />
Please tick one.<br />
Heather moorland and bog<br />
Rough grassland<br />
Broadleaf and mixed woodlands<br />
Field boundaries (hedges and stone walls)<br />
Farm build<strong>in</strong>gs and traditional farm practices<br />
Cost<br />
[Now please look aga<strong>in</strong> at the table you filled <strong>in</strong> for Question B7. If all <strong>of</strong> your ticks are <strong>in</strong><br />
the grey column, please skip Question B9 and answer Question B10. Otherwise please<br />
answer Question B9.]<br />
Question B9. Briefly, what were the ma<strong>in</strong> reasons you were will<strong>in</strong>g to contribute to the<br />
fund<strong>in</strong>g <strong>of</strong> future policy options?<br />
Please go to Question B11.<br />
Question B10. Briefly, what were the ma<strong>in</strong> reasons you were not will<strong>in</strong>g to contribute<br />
to the fund<strong>in</strong>g <strong>of</strong> future policy options?<br />
Please go to Question B11.<br />
Question B11. How easy or difficult did you f<strong>in</strong>d it to make your decisions about which<br />
policy option to choose? Please tick one.<br />
Very easy<br />
Fairly easy<br />
Neither easy nor difficult<br />
Fairly difficult<br />
Very difficult<br />
Don’t know<br />
CONTINGENT VALUATION SECTION<br />
The policy choices I showed you up to now were about the landscape features <strong>of</strong> the hillfarm<strong>in</strong>g<br />
areas <strong>in</strong> the Yorkshire & Humber region. For the f<strong>in</strong>al choice, please consider the<br />
landscape features <strong>of</strong> the hill farm<strong>in</strong>g areas <strong>in</strong> the rest <strong>of</strong> England. These are the shaded<br />
areas on the map <strong>of</strong> England.<br />
eftec A- 78<br />
January 2006
<strong>Economic</strong> <strong>Valuation</strong> <strong>of</strong> <strong>Environmental</strong> <strong>Impacts</strong> <strong>in</strong> the Severely Disadvantaged Areas<br />
Annex 6 – <strong>Valuation</strong> Workshop Protocol<br />
ASK PARTICIPANTS TO LOOK AT THE MAP OF ENGLAND ON PAGE 11 OF THEIR<br />
SUPPLEMENT.<br />
Question B12 shows the likely changes <strong>in</strong> other regions under the most likely government<br />
policy for hill farm<strong>in</strong>g. It shows the current policy contrasted with an alternative future<br />
policy option.<br />
ASK PARTICIPANTS TO ANSWER QUESTIONS B12 AND B13 AND THEN WAIT.<br />
Question B12. In addition to the amount you said you would (or would not) be will<strong>in</strong>g to<br />
pay for alternative policies <strong>in</strong> Yorkshire & Humber, would you be will<strong>in</strong>g to pay for the<br />
cost <strong>of</strong> an alternative policy <strong>in</strong> other regions <strong>of</strong> England?<br />
In the table below, please tick the grey box if you would prefer the alternative policy<br />
option at an annual cost to your household <strong>of</strong> £17, and the other blank box if you would<br />
prefer the current policy option at no additional cost.<br />
Change <strong>in</strong> area <strong>of</strong> Heather Moorland<br />
and Bog<br />
Change <strong>in</strong> area <strong>of</strong> Rough Grassland<br />
Change <strong>in</strong> area <strong>of</strong> Broadleaf and mixed<br />
woodlands<br />
Change <strong>in</strong> Restoration <strong>of</strong> Field<br />
Boundaries<br />
Change <strong>in</strong> Farm Build<strong>in</strong>gs and<br />
Traditional Farm Practices<br />
Increase <strong>in</strong> Tax Payments by your<br />
household each year<br />
Please tick one<br />
Current policy<br />
Loss <strong>of</strong> 4,400 ha<br />
(2% loss)<br />
Loss <strong>of</strong><br />
39,500 ha<br />
(10% loss)<br />
Ga<strong>in</strong> <strong>of</strong> 2,400 ha<br />
(3% ga<strong>in</strong>)<br />
For every 1km, 100m is<br />
restored<br />
Alternative policy<br />
option<br />
Ga<strong>in</strong> <strong>of</strong><br />
11,000 ha<br />
(5% ga<strong>in</strong>)<br />
Ga<strong>in</strong> <strong>of</strong><br />
39,500 ha<br />
(10% ga<strong>in</strong>)<br />
Ga<strong>in</strong> <strong>of</strong><br />
16,000 ha<br />
(20% ga<strong>in</strong>)<br />
For every 1km, 200m is<br />
restored<br />
Rapid decl<strong>in</strong>e Much better<br />
£0 £17<br />
Question B13. What were the ma<strong>in</strong> reasons you were not will<strong>in</strong>g to contribute to the<br />
fund<strong>in</strong>g <strong>of</strong> this future policy option?<br />
FOLLOW UP QUESTIONS<br />
EXPLAIN TO RESPONDENTS THAT THERE ARE JUST A FEW MORE BRIEF<br />
QUESTIONS TO FILL IN.<br />
Question B14. Go<strong>in</strong>g back aga<strong>in</strong> just to Yorkshire & Humber - do you ever visit any <strong>of</strong><br />
the areas shaded p<strong>in</strong>k on the map <strong>in</strong> the region? For recreation, for work or for both?<br />
Please tick an option <strong>in</strong> this table<br />
eftec A- 79<br />
January 2006
<strong>Economic</strong> <strong>Valuation</strong> <strong>of</strong> <strong>Environmental</strong> <strong>Impacts</strong> <strong>in</strong> the Severely Disadvantaged Areas<br />
Annex 6 – <strong>Valuation</strong> Workshop Protocol<br />
Short visits (e.g. to walk the dog), days out, weekends away or longer holidays and<br />
visit<strong>in</strong>g friends and family all count as recreation.<br />
YES - RECREATION<br />
YES - WORK<br />
YES - BOTH<br />
NO, NEVER visit these areas<br />
Question B15. How <strong>of</strong>ten to you visit these areas <strong>in</strong> your region? Please tick one.<br />
Every day<br />
More than once a week<br />
Once a week<br />
More than once a month<br />
About once a month<br />
At least once every six months<br />
At least once a year<br />
Less than once a year<br />
Have visited at least once <strong>in</strong> past<br />
Never<br />
Don’t know<br />
Question B16. Includ<strong>in</strong>g yourself, how many people <strong>in</strong> your household are (please fill <strong>in</strong><br />
numbers):<br />
Over 60 years old<br />
Between 17 years and 60<br />
years old<br />
Between 5 and 16 years old<br />
Below 5 years old<br />
Question B17. Approximately, how long have you been liv<strong>in</strong>g <strong>in</strong> Yorkshire & Humber?<br />
Question B18. Th<strong>in</strong>k<strong>in</strong>g ahead, which <strong>of</strong> these phrases best describes how long you<br />
th<strong>in</strong>k you will rema<strong>in</strong> liv<strong>in</strong>g <strong>in</strong> the Yorkshire & Humber region? Please tick one.<br />
Less than 6 months<br />
At least 1 year<br />
At least 5 years<br />
At least 10 years<br />
I have no <strong>in</strong>tentions <strong>of</strong> mov<strong>in</strong>g out <strong>of</strong><br />
this area<br />
Don’t know / Not sure<br />
eftec A- 80<br />
January 2006
<strong>Economic</strong> <strong>Valuation</strong> <strong>of</strong> <strong>Environmental</strong> <strong>Impacts</strong> <strong>in</strong> the Severely Disadvantaged Areas<br />
Annex 6 – <strong>Valuation</strong> Workshop Protocol<br />
Question B19. Are you or is anyone <strong>in</strong> your household a member <strong>of</strong> any <strong>of</strong> these<br />
organisations? Please tick any that apply.<br />
Royal Society for the Protection <strong>of</strong> Birds<br />
The Ramblers’ Association<br />
National Trust<br />
Friends <strong>of</strong> the Earth / Greenpeace<br />
A local wildlife trust or environmental organisation<br />
A local recreational club (e.g. angl<strong>in</strong>g or walk<strong>in</strong>g club)<br />
National Farmers’ Union<br />
Other environmental organisations<br />
Specify……………………………………………………..<br />
Other farm<strong>in</strong>g organisations<br />
Specify………………………………………………………<br />
Question B20. At what level did you complete your education?<br />
If still study<strong>in</strong>g, which level best describes the highest level <strong>of</strong> education you have<br />
obta<strong>in</strong>ed until now?<br />
Please tick one.<br />
Primary<br />
O levels/ GCSE/ CSE/ School Cert./ Intermediate GNVQ / or<br />
equivalent<br />
A levels Advanced/ Vocational tra<strong>in</strong><strong>in</strong>g<br />
(HNC/ HND) (BTEC) or equivalent / Advanced GNVQ<br />
Pr<strong>of</strong>essional qualification <strong>of</strong> degree level<br />
College/ University/ First degree level<br />
Higher degree (MA, MSc, PhD, etc.)<br />
Question B21. What is your current work status? Please tick one.<br />
Self-employed<br />
Employed full-time<br />
(30 hours plus per week)<br />
Employed part-time<br />
(under 30 hours per week)<br />
Student<br />
Unemployed<br />
Look<strong>in</strong>g after the home full-time / housewife<br />
Retired<br />
Unable to work due to sickness or disability<br />
eftec A- 81<br />
January 2006
<strong>Economic</strong> <strong>Valuation</strong> <strong>of</strong> <strong>Environmental</strong> <strong>Impacts</strong> <strong>in</strong> the Severely Disadvantaged Areas<br />
Annex 6 – <strong>Valuation</strong> Workshop Protocol<br />
Question B22. Could you estimate approximately your total household annual, monthly<br />
or weekly <strong>in</strong>come before tax? Choose from one <strong>of</strong> the categories <strong>in</strong> this table.<br />
Remember to <strong>in</strong>clude all your sources <strong>of</strong> <strong>in</strong>come, for <strong>in</strong>stance, pensions, benefits,<br />
<strong>in</strong>come from sav<strong>in</strong>gs etc. Your answer is completely confidential. It will be used only<br />
for statistical analysis.<br />
Please tick one.<br />
Weekly gross Monthly gross Annual gross<br />
Up to £99 Up to £429 Up to £5,199<br />
£100-£199 £430-£869 £5,200-£10,399<br />
£200-£299 £870-£1,299 £10,400-£15,599<br />
£300-£399 £1,300-£1,699 £15,600-£20,799<br />
£400-£499 £1,700-£2,199 £20,800-£25,999<br />
£500-£599 £2,200-£2,599 £26,000-£31,199<br />
£600-£799 £2,600-£3,499 £31,200-£41,599<br />
£800-£999 £3,500-£4,299 £41,600-£51,999<br />
£1,000-£1,499 £4,300- £6,299 £52,000-£74,999<br />
£1,500-£1,999 £6,300-£8,299 £75,000-£99,999<br />
£2,000-£2,399 £8,300-<br />
£10,399<br />
£2,400 or £10,400 or<br />
more<br />
more<br />
£100,000-<br />
£124,999<br />
£125,000 or more<br />
Don’t know<br />
Don’t want to say<br />
Question B23. F<strong>in</strong>ally, what did you th<strong>in</strong>k <strong>of</strong> this questionnaire? Please tick any that<br />
apply.<br />
Interest<strong>in</strong>g<br />
Too long<br />
Difficult to understand<br />
Educational<br />
Unrealistic / not credible<br />
Other<br />
Specify……………………………………<br />
………………..……………………………<br />
eftec A- 82<br />
January 2006
<strong>Economic</strong> <strong>Valuation</strong> <strong>of</strong> <strong>Environmental</strong> <strong>Impacts</strong> <strong>in</strong> the Severely Disadvantaged Areas<br />
Annex 6 – <strong>Valuation</strong> Workshop Protocol<br />
Section C – Follow up<br />
Aga<strong>in</strong> not a verbatim Q&A session – but try to cover all topics<br />
EXPLAIN THAT WE WOULD NOW LIKE TO DISCUSS SOME OF THE ANSWERS THEY<br />
GAVE.<br />
C1. Before you were given this questionnaire, did you ever th<strong>in</strong>k about the landscape<br />
and environmental features <strong>of</strong> hill-farm<strong>in</strong>g areas as someth<strong>in</strong>g you enjoy?<br />
C2. When you were go<strong>in</strong>g through the six choice sets and choos<strong>in</strong>g which policy options<br />
to go for, what k<strong>in</strong>d <strong>of</strong> factors affected your decisions?<br />
IF PEOPLE DON’T MENTION COST TRY TO PROMPT WHETHER THIS WAS AN<br />
IMPORTANT FACTOR.<br />
C3. Did you th<strong>in</strong>k that you were be<strong>in</strong>g asked to pay for hill farm<strong>in</strong>g areas <strong>in</strong> your own<br />
region or <strong>in</strong> the country as a whole?<br />
C4. I’d like to go back now to the first choice set and ask everyone <strong>in</strong> turn which policy<br />
option they chose and why.<br />
[THE ANSWER TO THE FOLLOWING QUESTION MIGHT ALREADY BE EVIDENT FROM<br />
THE PREVIOUS QUESTIONS ]<br />
C5. So which <strong>of</strong> the five th<strong>in</strong>gs – heather moorland and bog, rough grassland, broadleaf<br />
and mixed woodland, field boundaries and traditional farm build<strong>in</strong>gs an practices – do<br />
you th<strong>in</strong>k is most important and why? Which is least important?<br />
C6. I’d also like to go back to questions B9 and B10. Can I ask everyone who answered<br />
Question B9 what the reasons were that you gave for want<strong>in</strong>g to pay for alternative<br />
policies?<br />
HELEN TO TRY TO CODE ANSWERS USING TABLE GIVEN IN ORIGINAL<br />
QUESTIONNAIRE<br />
C7. And those who answered Question B10, what were the reasons you gave for not<br />
want<strong>in</strong>g to pay for alternative policies?<br />
HELEN TO TRY TO CODE ANSWERS USING TABLE GIVEN IN ORIGINAL<br />
QUESTIONNAIRE<br />
C8. We’re now go<strong>in</strong>g to give you a list <strong>of</strong> n<strong>in</strong>e other environmental and landscape<br />
features associated with hill-farm<strong>in</strong>g areas. Please look at boxes 1 to 9 on pages12 to 13<br />
<strong>of</strong> your supplement.<br />
Are the descriptions clear?<br />
If some <strong>of</strong> these features had been <strong>in</strong>cluded <strong>in</strong> the questionnaire (<strong>in</strong>stead or as well as<br />
the others) do you th<strong>in</strong>k you would have been more or less will<strong>in</strong>g to pay for their<br />
protection?<br />
C9. Are any <strong>of</strong> the fourteen features we’ve looked at together not important at all to<br />
you?<br />
Helen is now go<strong>in</strong>g to collect your questionnaires and check a couple <strong>of</strong> th<strong>in</strong>gs.<br />
eftec A- 83<br />
January 2006
<strong>Economic</strong> <strong>Valuation</strong> <strong>of</strong> <strong>Environmental</strong> <strong>Impacts</strong> <strong>in</strong> the Severely Disadvantaged Areas<br />
Annex 6 – <strong>Valuation</strong> Workshop Protocol<br />
HELEN TO COLLECT QUESTIONNAIRES AND CHECK WHETHER (1) PARTICIPANT<br />
ANSWERS AS TO WHETHER THEY VISIT THE COUNTRYSIDE AND SDAS ARE<br />
CONSISTENT; AND (2) ANSWERS TO QUESTIONS B14 AND B15 ARE CONSISTENT. IF<br />
NOT WE NEED TO ASK INDIVIDUAL PARTICIPANTS WHY NOT.<br />
C10. This is the end <strong>of</strong> our discussion session. Now, as the f<strong>in</strong>al po<strong>in</strong>t, we would like<br />
you to look back at the choice cards and the choices you made <strong>in</strong> question B7. As a<br />
result <strong>of</strong> the discussions with<strong>in</strong> the group, would you like to change any <strong>of</strong> the choices<br />
you made? If so, <strong>in</strong>dicate what your new choice(s) will be.<br />
ASK IF THEY MADE ANY CHANGES AND ASK FOR THE REASONS.<br />
That’s it – thanks very much for your time.<br />
REMIND PARTICIPANTS TO COLLECT THEIR MONEY BEFORE THEY LEAVE.<br />
eftec A- 84<br />
January 2006
<strong>Economic</strong> <strong>Valuation</strong> <strong>of</strong> <strong>Environmental</strong> <strong>Impacts</strong> <strong>in</strong> the Severely Disadvantaged Areas<br />
Annex 7 – <strong>Valuation</strong> Workshops – Results and Discussion<br />
Annex 7 - <strong>Valuation</strong> Workshops – Results and Discussion<br />
A7.1 Introduction<br />
In accordance with procedures used to <strong>in</strong>vestigate the validity <strong>of</strong> the study two valuation<br />
workshops were conducted. While workshops are somewhat constra<strong>in</strong>ed by a similar set <strong>of</strong><br />
conditions to focus groups and other small sample exercises, they perform well as a tool to<br />
<strong>in</strong>vestigate choice processes and expression <strong>of</strong> op<strong>in</strong>ion. In particular, workshops allow<br />
discourse, <strong>in</strong>formation process<strong>in</strong>g and a period to reflect on choices given the <strong>in</strong>clusion <strong>of</strong><br />
social (group) <strong>in</strong>put.<br />
The study under scrut<strong>in</strong>y <strong>in</strong> these workshops <strong>in</strong>cluded choices across putative policies, the<br />
analysis <strong>of</strong> which has its foundations <strong>in</strong> Random Utility Theory (RUT). One <strong>of</strong> the<br />
applications <strong>of</strong> RUT made <strong>in</strong> this study, and the most complex, is the choice experiment<br />
(CE). CE, through application <strong>of</strong> Lancastrian Theory (Lancaster, 1966) allows the analyst to<br />
assess a composite good through its several attributes, thus there is the assumption that<br />
some form <strong>of</strong> <strong>in</strong>formed rational compensatory choice method is employed by respondents<br />
as they weigh the policy options described <strong>in</strong> terms <strong>of</strong> a bundle <strong>of</strong> attributes. Further<br />
assumptions are made regard<strong>in</strong>g the theory <strong>of</strong> <strong>in</strong>formation process<strong>in</strong>g and choice mak<strong>in</strong>g<br />
outl<strong>in</strong>ed, for example, by He<strong>in</strong>er (He<strong>in</strong>er, 1983). As such the respondents must perceive<br />
relevance, realism and understand such issues as the scope <strong>of</strong> the proposals when mak<strong>in</strong>g<br />
their choices.<br />
A7.2 Workshop methodology<br />
Although the study was concerned with public op<strong>in</strong>ion on specifically rural regions, the<br />
SDAs, the spend<strong>in</strong>g on policies is a national issue <strong>of</strong> some relevance to all tax payers.<br />
Recognis<strong>in</strong>g this fact the study sample <strong>in</strong>cluded both rural and urban residents. This division<br />
was replicated <strong>in</strong> the workshops; Knaresborough be<strong>in</strong>g the rural location and Harrogate<br />
represent<strong>in</strong>g an urban population.<br />
To replicate the ‘cold canvass<strong>in</strong>g’ used <strong>in</strong> the study respondents were recruited on the day<br />
<strong>of</strong> the workshop, thereby prevent<strong>in</strong>g any significant <strong>in</strong>formation gather<strong>in</strong>g or op<strong>in</strong>ionform<strong>in</strong>g.<br />
Efforts were made to simulate the sample frame <strong>of</strong> the study based on age,<br />
gender and social classification.<br />
Each workshop was conducted as a s<strong>in</strong>gle session follow<strong>in</strong>g the Protocol (see Annex 6).<br />
Follow<strong>in</strong>g an <strong>in</strong>troduction, respondents were asked to complete the questionnaire used <strong>in</strong><br />
the study. The facilitator provided the same <strong>in</strong>formation used <strong>in</strong> the study to the group and<br />
asked each participant to complete the set <strong>of</strong> choice tasks as <strong>in</strong>dividuals.<br />
Upon completion a discussion, follow<strong>in</strong>g the po<strong>in</strong>ts <strong>in</strong> Section C <strong>of</strong> the Protocol, was<br />
<strong>in</strong>itiated. Together these po<strong>in</strong>ts exam<strong>in</strong>ed the issues <strong>of</strong> relevance, choice strategy, scope,<br />
alternative attributes and their impact on choice, and respondents’ reasons for their<br />
choice. F<strong>in</strong>ally, respondents were asked whether they might have altered their op<strong>in</strong>ions<br />
(and consequently their policy selections) as a result <strong>of</strong> the discussion. Collectively, these<br />
discussion po<strong>in</strong>ts:<br />
• <strong>in</strong>vestigated if the actual choice methods conformed to the assumptions <strong>in</strong> the analysis;<br />
• exam<strong>in</strong>ed the possibility <strong>of</strong> a bias <strong>in</strong>troduced through scope; and<br />
• permitted an assessment <strong>of</strong> the <strong>in</strong>formation provided <strong>in</strong> the study.<br />
This last issue would be made apparent by respondents chang<strong>in</strong>g their policy choices due to<br />
<strong>in</strong>formation obta<strong>in</strong>ed <strong>in</strong> the discussion.<br />
Probabilistic models used <strong>in</strong> the application <strong>of</strong> RUT require large sample sizes, which<br />
preclude compar<strong>in</strong>g estimates from the workshop questionnaires with those <strong>in</strong> the ma<strong>in</strong><br />
study. However, such comparisons are not necessary to the validation process; by<br />
consider<strong>in</strong>g the workshop participants as a representative sample <strong>of</strong> the ma<strong>in</strong> study then<br />
eftec A- 85<br />
January 2006
<strong>Economic</strong> <strong>Valuation</strong> <strong>of</strong> <strong>Environmental</strong> <strong>Impacts</strong> <strong>in</strong> the Severely Disadvantaged Areas<br />
Annex 7 – <strong>Valuation</strong> Workshops – Results and Discussion<br />
validation is made through comparison <strong>of</strong> their actual decision-mak<strong>in</strong>g and <strong>in</strong>formation<br />
process<strong>in</strong>g with underly<strong>in</strong>g theory and assumptions.<br />
A7.3 Results<br />
A7.3.1 Attendees<br />
A total <strong>of</strong> n<strong>in</strong>eteen persons attended the two workshops; seven <strong>in</strong> Knaresborough and<br />
twelve <strong>in</strong> Harrogate.<br />
Table A7.1: <strong>Valuation</strong> Workshop Participants and Logistics<br />
Groups Knaresborough Harrogate<br />
Number <strong>of</strong> participants 7 12<br />
Gender 3F 4M 4F 8M<br />
Age 18-34 18-70<br />
Socio-economic group BC1C2 ABC1C2<br />
Date 19/10/05 20/10/05<br />
Time 19:00 18:00<br />
A7.3.2 Questionnaire (Workshop Protocol Section B)<br />
In general, respondents were will<strong>in</strong>g to pay for improvements <strong>in</strong> landscape attributes, with<br />
only one respondent <strong>in</strong>dicat<strong>in</strong>g that he was not wil<strong>in</strong>g to pay for any improvements. Ten out<br />
<strong>of</strong> seventeen respondents chose to pay for an alternative to the current policy <strong>in</strong> every<br />
choice set. Seven respondents <strong>in</strong>dicated that they would be prepared to pay up to £70 for<br />
improvements.<br />
Although we cannot expect to replicate survey results proportionally with such a small<br />
sample, the respondents did have a range <strong>of</strong> views on key attitud<strong>in</strong>al questions, just as the<br />
survey respondents did. Responses to three questions are compared <strong>in</strong> Table A7.2. This is<br />
shown to demonstrate that the workshop respondents were not a select group with totally<br />
similar views and experiences.<br />
eftec A- 86<br />
January 2006
<strong>Economic</strong> <strong>Valuation</strong> <strong>of</strong> <strong>Environmental</strong> <strong>Impacts</strong> <strong>in</strong> the Severely Disadvantaged Areas<br />
Annex 7 – <strong>Valuation</strong> Workshops – Results and Discussion<br />
Table A7.2: Comparison <strong>of</strong> responses to select attitud<strong>in</strong>al questions<br />
between the workshop and survey respondents.<br />
Workshop<br />
response (%)<br />
Survey response<br />
(%)<br />
Question A1 – how important is environment policy?<br />
Very 37 45<br />
Quite 53 43<br />
Not all that 5 8<br />
Not at all 5 3<br />
Question B2 – which attribute was most important <strong>in</strong> mak<strong>in</strong>g your<br />
choice?<br />
Heather moorland and bog 5 7<br />
Rough grassland 0 4<br />
Broadleaf and mixed<br />
woodland 42 22<br />
Field boundaries 16 7<br />
Cultural heritage 21 19<br />
Cost 16 39<br />
Question D1 – do you ever visit the SDAs <strong>in</strong> your region?<br />
Yes, for recreation 58 67<br />
Yes, for work 5 2<br />
Yes, for both 11 12<br />
No 26 17<br />
Question D6 – are you a member <strong>of</strong> an environmental, farm<strong>in</strong>g,<br />
heritage or recreational organization?<br />
Yes 29 24<br />
A7.3.3 Discussion (Workshop Protocol Section C)<br />
While not question and answer sessions, it is usual practice for focus groups to be guided by<br />
a set <strong>of</strong> topics for discussion. It is equally common for participants to move through the<br />
topics without prompt<strong>in</strong>g by the facilitator and to volunteer <strong>in</strong>formation which supports<br />
previous comments when discuss<strong>in</strong>g subsequent topics. Such natural conversation may not<br />
follow the order nor be as clearly del<strong>in</strong>eated as the Protocol suggests. For clarity the topics<br />
and responses are reported below as they appeared <strong>in</strong> Section C <strong>of</strong> the protocol.<br />
Topic C1: Before you were given this questionnaire, did you ever th<strong>in</strong>k about the<br />
landscape and environmental features as someth<strong>in</strong>g you enjoy?<br />
Respondents made a clear dist<strong>in</strong>ction between urban and rural areas, <strong>of</strong>ten consider<strong>in</strong>g the<br />
rural areas to be special places due to the cleaner environment and, for some, the place<br />
for recreation and relaxation. As such, there was significant evidence <strong>in</strong> their <strong>in</strong>itial<br />
response that participants had thought about the landscape and environment, as someth<strong>in</strong>g<br />
they were aware <strong>of</strong> but were less forthcom<strong>in</strong>g on their relationship with it. Of all the<br />
discussion topics raised, the responses to this were the most dispersed over the session;<br />
participants tended to volunteer <strong>in</strong>formation <strong>in</strong> support <strong>of</strong> other responses. For example<br />
one participant supported his response to C6 by the happy memories he had <strong>of</strong> enjoy<strong>in</strong>g the<br />
countryside on trips with his father. While he did not at present go to the countryside, the<br />
impend<strong>in</strong>g birth <strong>of</strong> his first child had impressed on him the importance <strong>of</strong> preserv<strong>in</strong>g those<br />
areas for future generations’ enjoyment.<br />
Whilst all participants were at least aware <strong>of</strong> the landscape and environment there was a<br />
discernable correlation between use and enjoyment <strong>of</strong> those features; those who<br />
participated <strong>in</strong> activities <strong>in</strong> SDAs had a higher level <strong>of</strong> enjoyment and awareness. This was<br />
clearly demonstrated by one person who had recently taken up mounta<strong>in</strong> bik<strong>in</strong>g. He<br />
mentioned that he was aware <strong>of</strong>, but knew little about the countryside prior to go<strong>in</strong>g<br />
cycl<strong>in</strong>g <strong>in</strong> the countryside. This abstract awareness was transformed by his experiences, he<br />
eftec A- 87<br />
January 2006
<strong>Economic</strong> <strong>Valuation</strong> <strong>of</strong> <strong>Environmental</strong> <strong>Impacts</strong> <strong>in</strong> the Severely Disadvantaged Areas<br />
Annex 7 – <strong>Valuation</strong> Workshops – Results and Discussion<br />
was now acutely aware that the enjoyment <strong>of</strong> his chosen activity is closely l<strong>in</strong>ked to the<br />
quality <strong>of</strong> the environment and landscape. Others who made use <strong>of</strong> the countryside <strong>of</strong>fered<br />
similar observations.<br />
The opposite view was also expressed by one person <strong>in</strong> the Knaresborough group. He said<br />
that while he appreciated that others were <strong>in</strong>terested and even enthusiastic about the<br />
landscape and environment, and that perhaps <strong>in</strong> the future he may change his views, it<br />
simply had no relevance to him. He did not go to the countryside for relaxation, and did not<br />
participate <strong>in</strong> any related activities; <strong>in</strong> fact it was little more that the “bit between towns”<br />
when he was travell<strong>in</strong>g. Furthermore, while it may be more attractive than driv<strong>in</strong>g through<br />
streets, he felt he could not dist<strong>in</strong>guish between a good and a bad landscape.<br />
In answer to this ambivalence, respondents raised an issue which touched on the issue <strong>of</strong><br />
scope, a question also raised <strong>in</strong> the Harrogate group: isn’t the environment essential to us<br />
all, for our survival and well be<strong>in</strong>g? While both groups acknowledged, this they also<br />
demonstrated a sense <strong>of</strong> scale by acknowledg<strong>in</strong>g that they did not expect the proposed<br />
schemes to have far-reach<strong>in</strong>g impacts - the effect would be mostly local. For the purposes<br />
<strong>of</strong> the validation, this confirms a sense <strong>of</strong> proportion and suggests no misunderstand<strong>in</strong>g<br />
regard<strong>in</strong>g the scale <strong>of</strong> impact which could engender bias due to scope.<br />
The majority <strong>of</strong> participants fit somewhere between the dis<strong>in</strong>terest and the active<br />
participation <strong>in</strong> activities mentioned above.<br />
Topic C2: When you were complet<strong>in</strong>g the six choice sets what factors affected your<br />
decisions?<br />
One respondent <strong>in</strong> the Knaresborough group consistently chose the no change option; a<br />
second participant selected only two low cost alternative policy options (Cards B5 & B6),<br />
but mostly the current policy. The choices made by both were logical and explicable.<br />
The person who consistently chose no change worked for a contractor lay<strong>in</strong>g water supply<br />
pipes <strong>in</strong> the countryside. His experience <strong>of</strong> the countryside had led him to consider it as a<br />
vast area to which the loss <strong>of</strong>, for example, 2% <strong>of</strong> heather moorland and bog would be<br />
<strong>in</strong>significant. By way <strong>of</strong> illustration, he stated that if he was given a map <strong>of</strong> the present<br />
situation and one <strong>of</strong> the putative future scenarios, the two would be <strong>in</strong>dist<strong>in</strong>guishable. As<br />
the only reason for consistently select<strong>in</strong>g no change this would perhaps suggest a lack <strong>of</strong><br />
relevance or credibility; however the <strong>in</strong>dividual also registered a protest aga<strong>in</strong>st be<strong>in</strong>g<br />
taxed for what amounts to an <strong>in</strong>discernible, irrelevant change.<br />
The second person who chose only low cost alternatives options said that the countryside<br />
had little relevance for him.<br />
All other participants decided that the policies were relevant and proceeded to use some<br />
form <strong>of</strong> compensatory choice; no respondents used random or heuristic selection. It may be<br />
worth not<strong>in</strong>g that while it was attempted to replicate the survey conditions dur<strong>in</strong>g the<br />
workshops there are a number <strong>of</strong> differences. Participants <strong>in</strong> the workshops, unlike<br />
respondents <strong>in</strong> the survey, had consented to a session last<strong>in</strong>g up to two hours and were<br />
seated <strong>in</strong> relatively comfortable conditions. As a result they may have had the opportunity<br />
to give greater consideration to the tasks than those respondents whose day-to-day<br />
activities were <strong>in</strong>terrupted. The magnitude <strong>of</strong> this effect, if it occurs at all, is unclear. As<br />
shall be discussed below, further discussion and reflection had no impact on choice mak<strong>in</strong>g<br />
strategy or selection suggest<strong>in</strong>g that any difference is due to unavoidable differences <strong>in</strong><br />
<strong>in</strong>terview format.<br />
The simplest form <strong>of</strong> the choice was a summ<strong>in</strong>g <strong>of</strong> benefits associated with each policy: the<br />
better policy be<strong>in</strong>g the one with the most ga<strong>in</strong>s. Even this method had some variation, the<br />
most basic be<strong>in</strong>g any ga<strong>in</strong>, regardless <strong>of</strong> whether it was <strong>of</strong> 5% or 10% <strong>in</strong> the area <strong>of</strong><br />
grassland, for <strong>in</strong>stance, was counted as +1, and losses were similarly treated. The best<br />
policy was the one with the greatest sum <strong>of</strong> positives. This choice strategy would suggest<br />
non-specific preferences for improvements as each <strong>of</strong> the attributes and levels were<br />
equally valued. These choices were driven by respondents accept<strong>in</strong>g a general<br />
responsibility for the environment whilst ma<strong>in</strong>ta<strong>in</strong><strong>in</strong>g ambivalence regard<strong>in</strong>g the detail.<br />
eftec A- 88<br />
January 2006
<strong>Economic</strong> <strong>Valuation</strong> <strong>of</strong> <strong>Environmental</strong> <strong>Impacts</strong> <strong>in</strong> the Severely Disadvantaged Areas<br />
Annex 7 – <strong>Valuation</strong> Workshops – Results and Discussion<br />
Underly<strong>in</strong>g this attitude were limited knowledge on the issues and trust <strong>in</strong> the<br />
adm<strong>in</strong>ister<strong>in</strong>g authority and their advisors. Some comment was made on this matter: one<br />
respondent used the sum <strong>of</strong> benefits to make her choice but admitted she was unsure if it<br />
would have been the best landscape for farmers, wildlife, the environment or other th<strong>in</strong>gs<br />
she did not know about.<br />
A more complex strategy took the levels <strong>of</strong> the attributes <strong>in</strong>to account. To cont<strong>in</strong>ue with<br />
the above example, a 5% ga<strong>in</strong> scored +1, the 10% ga<strong>in</strong> would score +2, and policy selection<br />
would be made by the same criteria <strong>of</strong> greatest equals preferred. Inherent <strong>in</strong> both the<br />
simple and more complex summ<strong>in</strong>g <strong>of</strong> benefits is the assumption <strong>of</strong> equal value for all<br />
attributes: restor<strong>in</strong>g 200m per 1km <strong>of</strong> field boundaries has the same ‘value’ as the<br />
equivalent <strong>in</strong>cremental change (1 level <strong>of</strong> the attribute) <strong>in</strong> rough grassland. Several <strong>of</strong> the<br />
people us<strong>in</strong>g this strategy appeared to graduate to it as they completed the tasks and<br />
became familiar with the levels <strong>of</strong> attributes. Two reasons were suggested by respondents;<br />
first, they were learn<strong>in</strong>g as they completed the tasks and, secondly, they used this to<br />
decide on policies which appeared to be <strong>of</strong> similar value us<strong>in</strong>g the simple summ<strong>in</strong>g above.<br />
Neither <strong>of</strong> these simple systems appears to have been consistently applied. The ma<strong>in</strong><br />
variation was to apply exist<strong>in</strong>g knowledge and/or preferences for one or more attributes.<br />
For example, several participants expressed a preference for the broadleaf and mixed<br />
woodlands attribute. The reasons <strong>in</strong>cluded that it was the best for the environment, it had<br />
f<strong>in</strong>ancial as well as aesthetic values, and that it had more ecological functions (<strong>in</strong> the form<br />
<strong>of</strong> carbon sequestration and flood prevention) than the other attributes. Policy selection<br />
was made on one <strong>of</strong> two methods; either the woodlands carried more weight than the +1 <strong>of</strong><br />
other attributes, or was used as an <strong>in</strong>itial selection criteria. Initial selection would be made<br />
on the policy which gave the greatest ga<strong>in</strong> <strong>of</strong> woodland. The <strong>in</strong>itial choice may have been<br />
subsequently changed if the net losses <strong>of</strong> the selected policy were too great when<br />
compared with the lesser ga<strong>in</strong>s <strong>in</strong> forestry and greater ga<strong>in</strong>s <strong>in</strong> other attributes <strong>of</strong> the other<br />
policy option.<br />
A further modification to choice strategy, an application <strong>of</strong> logic, was used to ‘force’<br />
decisions. Given an <strong>in</strong>ability to decide us<strong>in</strong>g the above methods above, some logic was<br />
applied. For example if faced with similar ga<strong>in</strong>s <strong>in</strong> woodlands and a similar sum <strong>of</strong> ga<strong>in</strong>s<br />
across the four other environmental attributes, then a personal logic would be applied. It is<br />
important to note that it is an <strong>in</strong>dividual’s logic that is used. Applied to the example above<br />
that logic might suggest to one <strong>in</strong>dividual that field boundaries are less important to<br />
landscapes with woodland because there would be less livestock to conta<strong>in</strong> <strong>in</strong> landscapes<br />
with more woodlands/less graz<strong>in</strong>g land. To another <strong>in</strong>dividual the same reasons might<br />
suggest that traditional farm practices and build<strong>in</strong>gs are less important because there is a<br />
reduction <strong>in</strong> farm<strong>in</strong>g land. Effectively, respondents appear to identify ‘critical attributes’<br />
which ma<strong>in</strong>ta<strong>in</strong> a consistently high value relative to other attributes; the rema<strong>in</strong><strong>in</strong>g<br />
attributes have values which alter accord<strong>in</strong>g to the make up <strong>of</strong> the bundle <strong>of</strong> attributes and<br />
a personal logic.<br />
While all <strong>of</strong> the above strategies were used at some po<strong>in</strong>t by most <strong>in</strong>dividuals they were not<br />
applied to every choice task. One respondent po<strong>in</strong>ted out that some policy options were<br />
“obvious”. Us<strong>in</strong>g Card B1 to illustrate she po<strong>in</strong>ted out that there was one small ga<strong>in</strong><br />
(woodland) and one loss (field boundaries) <strong>in</strong> Policy Option B. Selection <strong>of</strong> Option A would<br />
have been the obvious choice but for the tax <strong>in</strong>crease <strong>of</strong> £70. Her options, as she perceived<br />
them were as follows: Option A is best but too expensive, Option B amounts to pay<strong>in</strong>g £10<br />
for, <strong>in</strong> total, no ga<strong>in</strong> (one ga<strong>in</strong> + one loss), the Current Policy is similar to B but costs<br />
noth<strong>in</strong>g and while it has a lesser ga<strong>in</strong> <strong>in</strong> woodland it also gets more field boundaries; the<br />
choice <strong>of</strong> Current Policy “was obvious”. In this example, the cost <strong>of</strong> the policy was shown<br />
to be a critical factor – but not because the respondent was not will<strong>in</strong>g to pay <strong>in</strong> pr<strong>in</strong>ciple,<br />
but because the cost <strong>of</strong> the one policy option exceeded her personal threshold price,<br />
reduc<strong>in</strong>g the choice to a decision between the current policy and the affordable option.<br />
All <strong>of</strong> the respondents considered the cost <strong>of</strong> the policy <strong>in</strong> all choices. Cost was discussed<br />
both as the annual sum and the calculated equivalent weekly sum; <strong>in</strong> either form the<br />
greatest amount was consistently considered by many people to be ‘too much’.<br />
eftec A- 89<br />
January 2006
<strong>Economic</strong> <strong>Valuation</strong> <strong>of</strong> <strong>Environmental</strong> <strong>Impacts</strong> <strong>in</strong> the Severely Disadvantaged Areas<br />
Annex 7 – <strong>Valuation</strong> Workshops – Results and Discussion<br />
Most participants limited policy choice by sett<strong>in</strong>g a maximum amount they would be will<strong>in</strong>g<br />
and able to pay. Various methods <strong>of</strong> sett<strong>in</strong>g this threshold were suggested based on relative<br />
prices (one smoker compared the cost <strong>of</strong> the policy with one packet <strong>of</strong> cigarettes per<br />
month), disposable <strong>in</strong>come and perceived value for money. Individuals applied the price<br />
threshold <strong>in</strong> one <strong>of</strong> two forms: a ‘hard’ threshold above which the policy would be rejected<br />
without further consideration and a ‘s<strong>of</strong>t’ threshold which was subject to some <strong>in</strong>crease if<br />
the benefits <strong>of</strong> the policy were considered enough to justify the change. Notable po<strong>in</strong>ts<br />
regard<strong>in</strong>g the price vector were:<br />
1. the highest tax <strong>in</strong>crease (£70) appeared <strong>in</strong> two choice tasks. Of the 38 opportunities<br />
to select the high cost policies (19 respondents x 2 opportunities) they were chosen<br />
on 8 occasions. This gives an acceptance rate <strong>of</strong> 21%. While a lower acceptance<br />
rate may <strong>in</strong>dicate a value closer to the marg<strong>in</strong>al WTP Hanley et al. (2000) suggest<br />
that the effect <strong>of</strong> a lower price vector is to enlarge confidence <strong>in</strong>tervals and as a<br />
result the difference <strong>in</strong> estimated mean WTP <strong>of</strong> comparable vectors is rarely<br />
significant.<br />
2. the threshold WTP used by respondents varied across <strong>in</strong>dividuals; that is, an<br />
<strong>in</strong>dividuals’ marg<strong>in</strong>al WTP was with<strong>in</strong> the range <strong>of</strong> the price vector;<br />
3. the price was considered as an actual payment - there is no evidence <strong>of</strong> select<strong>in</strong>g<br />
best policy regardless <strong>of</strong> price; and<br />
4. there is no evidence <strong>of</strong> always select<strong>in</strong>g the least cost policy.<br />
Topic C3: Did you th<strong>in</strong>k you were be<strong>in</strong>g asked to pay for hill fam<strong>in</strong>g areas <strong>in</strong> your own<br />
region or <strong>in</strong> the country as a whole?<br />
The <strong>in</strong>formation provided <strong>in</strong> the survey <strong>in</strong>strument clearly specified the region <strong>of</strong> the CE<br />
exercise. All respondents confirmed they had considered only this region. Support<strong>in</strong>g this<br />
were some questions and comments from the participants. One noted that local people<br />
pay<strong>in</strong>g for their region made sense, however when asked to consider the national (CV)<br />
policy choice he noticed that there were few SDAs <strong>in</strong> the south and that a national payment<br />
amounted largely to a local payment (from his perspective) if the money was directed by<br />
the total area <strong>of</strong> SDA. Some others commented that they did not have any previous<br />
knowledge <strong>of</strong> designations and assumed, from the <strong>in</strong>formation they were given before the<br />
choice sets, that the policy was specific to the region. In short, respondents only<br />
considered the appropriate region.<br />
Topic C4: I’d like to go back to the first choice set and ask everyone <strong>in</strong> turn which policy<br />
option they chose and why<br />
As previously discussed, the choice strategies used by respondents were consistent (with<strong>in</strong><br />
the variations discussed), and as Card B1 conta<strong>in</strong>ed a policy option with the highest tax<br />
level, for the majority <strong>of</strong> participants the outcome was largely a choice between the<br />
Current Policy and Policy Option B. The decision rested on whether the ga<strong>in</strong> <strong>of</strong> 7% <strong>of</strong><br />
woodland was worth a £10 tax <strong>in</strong>crease plus 50m per km less field boundaries restored.<br />
The importance <strong>of</strong> the tax <strong>in</strong>crease proposed <strong>in</strong> Option A was tested <strong>in</strong> two ways: obta<strong>in</strong><strong>in</strong>g<br />
participants’ suggestions for an acceptable value and an iterative bidd<strong>in</strong>g game start<strong>in</strong>g at<br />
£70, and reduc<strong>in</strong>g by <strong>in</strong>crements <strong>of</strong> £5. In both cases, respondents were asked to consider<br />
the choice task as it was presented and asked at what tax value they would def<strong>in</strong>itely<br />
select Policy Option A. Both methods suggest an acceptable value for Policy Option A <strong>of</strong><br />
between £20 and £55.<br />
Topic C5: Which <strong>of</strong> the five attributes do you th<strong>in</strong>k is the most important and why?<br />
In both groups only broad leafed woodland was suggested as a more important attribute<br />
due to the perception <strong>of</strong> its broader ecological function (i.e. carbon sequestration, oxygen<br />
exchange) than the other natural attributes (moorland and grassland).<br />
Interest<strong>in</strong>gly, ask<strong>in</strong>g participants to consider the importance <strong>of</strong> <strong>in</strong>dividual attributes led to<br />
discussion <strong>in</strong> the Harrogate group on the scope <strong>of</strong> the study. Consideration ranged from the<br />
eftec A- 90<br />
January 2006
<strong>Economic</strong> <strong>Valuation</strong> <strong>of</strong> <strong>Environmental</strong> <strong>Impacts</strong> <strong>in</strong> the Severely Disadvantaged Areas<br />
Annex 7 – <strong>Valuation</strong> Workshops – Results and Discussion<br />
potential function restored traditional build<strong>in</strong>gs would serve other than the aesthetic,<br />
through question<strong>in</strong>g what sort <strong>of</strong> build<strong>in</strong>gs farmers would prefer (modern and convenient<br />
versus traditional) to what function farmers perform <strong>in</strong> the countryside. The discussion was<br />
<strong>in</strong>conclusive and echoed contemporary debate; are farmers’ simply primary producers or<br />
guardians <strong>of</strong> the countryside? Should we import food and so aid development <strong>of</strong> other<br />
countries but <strong>in</strong> so do<strong>in</strong>g <strong>in</strong>crease food miles?, Should we remove farm<strong>in</strong>g subsidies<br />
altogether?<br />
Although the group did not achieve consensus (an unrealistic expectation!) the debate<br />
served to give context to the proposals. This caused one <strong>in</strong>dividual to note that he selected<br />
the options he would like to be implemented, but was sure they would never happen<br />
because he expected European policy to overrule whatever the public chose.<br />
In the Knaresborough group, the discussion also followed the pattern <strong>of</strong> expand<strong>in</strong>g from<br />
discussion <strong>of</strong> the attributes to the wider context <strong>of</strong> the study. However the discussion was<br />
largely concerned with the fund<strong>in</strong>g <strong>of</strong> the policies. One participant questioned how much <strong>of</strong><br />
the tax <strong>in</strong>crease would actually be spent <strong>in</strong> the countryside. She was unsure <strong>of</strong> actual<br />
figures, but if every tax payer paid an additional £30 the total “would be hundreds <strong>of</strong><br />
millions”. The group questioned:<br />
1. Do we as a country need to spend that much money on the countryside?<br />
2. Are there better th<strong>in</strong>gs to spend it on?<br />
3. What proportion <strong>of</strong> the total will actually be spent on the countryside?<br />
4. How would the money be allocated to each <strong>of</strong> the attributes?<br />
Most members had assumed that the tax <strong>in</strong>crease funded the proposed changes and had not<br />
considered that part <strong>of</strong> the tax may be used <strong>in</strong> adm<strong>in</strong>ister<strong>in</strong>g the policy. In other words, the<br />
tax equated to the exact cost <strong>of</strong> the putative changes. However, without prompt<strong>in</strong>g the<br />
group concluded that it was reasonable and acceptable that the cost <strong>of</strong> the improvements<br />
<strong>in</strong>cluded management.<br />
Topic C6/C7: What were the reasons you gave for be<strong>in</strong>g will<strong>in</strong>g/not will<strong>in</strong>g to pay <strong>in</strong><br />
question B9/B10 (test for ability to code verbal responses)<br />
Only one respondent consistently chose the Current Policy option, as outl<strong>in</strong>ed above, due to<br />
lack <strong>of</strong> personal relevance and a protest aga<strong>in</strong>st be<strong>in</strong>g taxed for an irrelevant, <strong>in</strong>discernible<br />
change.<br />
All those participants select<strong>in</strong>g at least one paid-for option mentioned reasons which were<br />
able to be coded <strong>in</strong> the study schema.<br />
Topic C8/C9: See boxes 1 to 9 show<strong>in</strong>g some alternative attributes. If some <strong>of</strong> these had<br />
been <strong>in</strong>cluded do you th<strong>in</strong>k you would have been more or less will<strong>in</strong>g to pay for their<br />
protection?<br />
Both groups had largely similar views on the alternative attributes.<br />
• Two <strong>of</strong> the alternative attributes, bracken and gorse, would not change WTP as<br />
they were assumed to be components <strong>of</strong> the attributes used <strong>in</strong> the study.<br />
• Improved grassland and set aside would likewise have no impact on WTP: the<br />
former it was assumed would be replaced by other features such as rough<br />
grassland, while the latter was thought to be one <strong>of</strong> the mechanisms for switch<strong>in</strong>g<br />
from the present to the proposed feature<br />
• Several respondents, approximately 20% <strong>of</strong> the total, would have <strong>in</strong>creased their<br />
WTP for policies featur<strong>in</strong>g hay meadows. Their beauty and ecological value were<br />
the ma<strong>in</strong> reasons given.<br />
• Only one participant would have <strong>in</strong>creased her WTP for policies with coniferous<br />
woodlands; she liked their prom<strong>in</strong>ence <strong>in</strong> the landscape and their atmosphere for<br />
eftec A- 91<br />
January 2006
<strong>Economic</strong> <strong>Valuation</strong> <strong>of</strong> <strong>Environmental</strong> <strong>Impacts</strong> <strong>in</strong> the Severely Disadvantaged Areas<br />
Annex 7 – <strong>Valuation</strong> Workshops – Results and Discussion<br />
walk<strong>in</strong>g <strong>in</strong>. The majority disliked them and would perhaps reduce WTP for polices<br />
which <strong>in</strong>cluded completely coniferous forests - they would f<strong>in</strong>d mixed more<br />
acceptable, and favoured wholly broadleaf forests.<br />
• The attributes water quantity/flood prevention, water quality and greenhouse gas<br />
emissions would not have changed WTP for a number <strong>of</strong> reasons. First, all three<br />
attributes were thought to be the effects <strong>of</strong> the proposed policies. One respondent<br />
summarised his view that the actual survey was about landscape and environment,<br />
the effects <strong>of</strong> changes to which would impact on water quantity, water quality and<br />
greenhouse gasses. Landscape and environment are so closely l<strong>in</strong>ked that one is<br />
effectively the same as the other. Secondly, while respondents acknowledged the<br />
ecosystem services <strong>of</strong> the landscape, they were aware <strong>of</strong> the limited environmental<br />
effects <strong>of</strong> the proposed policies; the value <strong>of</strong> the environmental changes was<br />
limited by their scale. F<strong>in</strong>ally, the issue <strong>of</strong> personal relevance was considered. Only<br />
one participant found personal relevance <strong>in</strong> flood control (she was consider<strong>in</strong>g<br />
buy<strong>in</strong>g a house near a canal), water quality was considered presently to be<br />
acceptable, and while greenhouse gases had relevance for almost everyone, the<br />
probable impact <strong>of</strong> the policies vis-à-vis the scale <strong>of</strong> the problem was not<br />
significant.<br />
Topic C10: As a result <strong>of</strong> the discussion would you change any <strong>of</strong> your policy choices?<br />
Despite <strong>in</strong>terest<strong>in</strong>g and <strong>in</strong>formative discussions <strong>in</strong> which new <strong>in</strong>formation, alternative views<br />
and varied <strong>in</strong>sights were <strong>of</strong>fered all <strong>of</strong> the respondents stated that they would not alter any<br />
choices. None <strong>of</strong> the attributes dissected <strong>in</strong> the discussion were controversial enough to<br />
polarise op<strong>in</strong>ion; a ‘better’ landscape/environment is simply that, no new <strong>in</strong>formation was<br />
given to disabuse participants <strong>of</strong> that belief. Likewise, the discussion was not sufficient to<br />
change the op<strong>in</strong>ions <strong>of</strong> those who were not will<strong>in</strong>g to pay.<br />
A7.4 Conclusion<br />
A broad spectrum <strong>of</strong> <strong>in</strong>terest <strong>in</strong> the landscape/environment was represented <strong>in</strong> the groups,<br />
<strong>in</strong>clud<strong>in</strong>g: (1) those who were not will<strong>in</strong>g to pay due to lack <strong>of</strong> personal relevance or<br />
protest; (2) a “realist” who chose the policies he would like to be implemented but did not<br />
believe they would be; (3) those with a pass<strong>in</strong>g <strong>in</strong>terest and (4) those with an active<br />
<strong>in</strong>terest <strong>in</strong> countryside-based activities. An equally diverse range <strong>of</strong> knowledge on the<br />
countryside and environment was evident. A range <strong>of</strong> <strong>in</strong>comes, ages and social categories<br />
were present; the groups were diverse and <strong>in</strong>cluded, for example, an unemployed man<br />
liv<strong>in</strong>g <strong>in</strong> a hostel, a chartered surveyor, a student and a retired couple <strong>in</strong> Harrogate.<br />
For the purpose <strong>of</strong> validation it is pleas<strong>in</strong>g to note that there is evidence <strong>of</strong> logical,<br />
explicable behaviour which conforms to the assumptions <strong>of</strong> RUM.<br />
1. Those f<strong>in</strong>d<strong>in</strong>g no relevance or realism <strong>in</strong> the study have bid appropriately and<br />
consistently for the no change option.<br />
2. There is no evidence <strong>of</strong> random choice by respondents.<br />
3. There is no evidence <strong>of</strong> heuristic choice.<br />
4. Respondents have considered all the attributes <strong>in</strong> the policy. This has been through<br />
the various strategies <strong>of</strong> ‘simple summ<strong>in</strong>g’ (all <strong>in</strong>creases are considered with equal<br />
weight), ‘weighted summ<strong>in</strong>g’ (the level <strong>of</strong> the attribute is valued <strong>in</strong>crementally),<br />
‘personal weight<strong>in</strong>g <strong>of</strong> attributes’ (a selected attribute has greater weight than<br />
others) and f<strong>in</strong>ally a logical deduction. The more complex strategies tended to be<br />
applied to the more difficult choices.<br />
5. Acceptance rates for the maximum tax (21%) are higher than the recommended<br />
10%. However this <strong>in</strong> not excessive and should not present any difficulties to model<br />
estimation.<br />
eftec A- 92<br />
January 2006
<strong>Economic</strong> <strong>Valuation</strong> <strong>of</strong> <strong>Environmental</strong> <strong>Impacts</strong> <strong>in</strong> the Severely Disadvantaged Areas<br />
Annex 7 – <strong>Valuation</strong> Workshops – Results and Discussion<br />
6. Respondents considered appropriately the tax <strong>in</strong> policy choices; <strong>in</strong>creases beyond<br />
their threshold WTP were rejected.<br />
7. Bidd<strong>in</strong>g games on Card B1 obta<strong>in</strong>ed a range <strong>of</strong> WTP values from £20 to £55 for the<br />
greatest improvements option suggest<strong>in</strong>g there is no start<strong>in</strong>g po<strong>in</strong>t bias or centr<strong>in</strong>g<br />
<strong>of</strong> WTP.<br />
8. The geographical limits <strong>of</strong> the study were ma<strong>in</strong>ta<strong>in</strong>ed <strong>in</strong> policy decisions.<br />
9. There is no bias due to scope. The wider context <strong>of</strong> the national and global<br />
environment was discussed but was considered to be beyond the scale <strong>of</strong> this study,<br />
respondents did not change their choices as a result <strong>of</strong> the discussion.<br />
10. A broader ‘choice set’ than that presented <strong>in</strong> the study was discussed, for example<br />
the possibility <strong>of</strong> end<strong>in</strong>g all agricultural subsidies. Respondents considered such<br />
matters to be beyond the scale <strong>of</strong> this study and did not change their choices as a<br />
result <strong>of</strong> the discussion: a clear demonstration that the necessary condition <strong>of</strong><br />
Independence from Irrelevant Alternatives (IIA) demanded <strong>in</strong> the assumptions <strong>of</strong><br />
RUT modell<strong>in</strong>g has been fulfilled.<br />
11. Of the alternative attributes only hay meadows would have had any impact on WTP;<br />
the scale is not known but this affected four participants. All other attributes had<br />
little or no effect as they were viewed largely as components <strong>of</strong> the study<br />
attributes.<br />
12. Discussion, <strong>in</strong>formation and a period <strong>of</strong> reflection did not cause respondents to<br />
change their orig<strong>in</strong>al policy selections.<br />
Information provided to respondents was generally sufficient to support <strong>in</strong>formed decisionmak<strong>in</strong>g.<br />
One exception was noted which may have a bear<strong>in</strong>g on the both the CE and CV<br />
estimates. The northern regions have a relatively large proportion <strong>of</strong> SDA. This presents no<br />
issues for the CE choice tasks; however <strong>in</strong> the CV task respondents are asked to consider all<br />
SDAs <strong>in</strong> England. As there are fewer SDAs <strong>in</strong> the south <strong>of</strong> the country respondents queried<br />
how the funds would be distributed. “Is the north subsidis<strong>in</strong>g the south or vice-versa?” one<br />
participant asked. He went on to suggest that he may have changed his CE policy choices if<br />
this national split had been expla<strong>in</strong>ed earlier.<br />
F<strong>in</strong>ally, rightly or wrongly, it is commonly assumed that much <strong>of</strong> British agricultural policy<br />
is actually European Policy emanat<strong>in</strong>g from Brussels. To present putative changes <strong>in</strong><br />
agricultural policy without any reference to Europe is an omission some respondents<br />
thought unrealistic.<br />
There is therefore a great deal <strong>of</strong> evidence <strong>in</strong> the behaviour <strong>of</strong> the participants which<br />
<strong>in</strong>dicates the theoretical validity <strong>of</strong> this study. While the technical <strong>in</strong>formation was clearly<br />
sufficient to support the choice mak<strong>in</strong>g <strong>of</strong> <strong>in</strong>dividuals, the lack <strong>of</strong> reference to European<br />
Regulations and the implied autonomy <strong>of</strong> the Government to implement agricultural policy<br />
annoyed at least one participant and are likely to be noted as a significant omission by<br />
more <strong>in</strong>formed <strong>in</strong>dividuals.<br />
References<br />
Lancaster, K. (1966). A New Approach to Consumer Theory. Journal <strong>of</strong> Political Economy,<br />
74, 132-157.<br />
He<strong>in</strong>er, R.A. (1983). The Orig<strong>in</strong> <strong>of</strong> Predictable Behaviour. The American <strong>Economic</strong> Review.<br />
73(4), 560-595.<br />
Hanley, N., Adamowicz, W. and Wright, R.E. (2002). Price Vector Effects <strong>in</strong> Choice<br />
Experiments: An Empirical Test. Paper presented to World Congress <strong>of</strong> <strong>Environmental</strong> and<br />
Resource Economists, Monterey, CA, June 2002.<br />
eftec A- 93<br />
January 2006
<strong>Economic</strong> <strong>Valuation</strong> <strong>of</strong> <strong>Environmental</strong> <strong>Impacts</strong> <strong>in</strong> the Severely Disadvantaged Areas<br />
Annex 8 – Peer Reviewer Report<br />
Annex 8 - Peer Reviewer Report<br />
Comments on EFTEC (2005) “<strong>Economic</strong> <strong>Valuation</strong> <strong>of</strong> <strong>Environmental</strong> <strong>Impacts</strong> <strong>in</strong> the<br />
Severely Disadvantaged Areas: Draft F<strong>in</strong>al Report to the Department for Environment,<br />
Food and Rural Affairs”<br />
Ian J. Bateman<br />
CSERGE<br />
School <strong>of</strong> <strong>Environmental</strong> Sciences<br />
University <strong>of</strong> East Anglia<br />
16 th November 2005<br />
Introduction<br />
• This document reports on a study to estimate the non-market benefits <strong>of</strong> changes <strong>in</strong><br />
land use policy and practice <strong>in</strong> the Severely Disadvantaged Areas (SDA) <strong>of</strong> England.<br />
Specifically the study applies a stated preference approach to elicit<strong>in</strong>g monetary<br />
measures <strong>of</strong> preferences for a range <strong>of</strong> policy options. The approach adopted for<br />
estimat<strong>in</strong>g these values is the choice experiment (CE) method as described by<br />
Adamowicz et al., (1994, 1998, 1999), Bateman, et al., (2002), Bennett and Blamey<br />
(2001), Holmes and Adamowicz (2003), Louviere (2001), Louviere and Hensher<br />
(1982), Louviere, et al., (2000) and others. This choice <strong>of</strong> methodology is, from an<br />
economic-theoretic and policy perspective, appropriate, be<strong>in</strong>g compatible with<br />
cost-benefit analysis (CBA), provid<strong>in</strong>g that the validity <strong>of</strong> the resultant valuation<br />
estimates can be robustly established.<br />
• Overall this is a high quality application address<strong>in</strong>g arguably one <strong>of</strong> the most<br />
difficult subjects for valuation. That degree <strong>of</strong> difficulty is reflected <strong>in</strong> a number <strong>of</strong><br />
issues regard<strong>in</strong>g which I comment below.<br />
• Furthermore, the level <strong>of</strong> report<strong>in</strong>g is generally good although latter sections were<br />
<strong>in</strong>complete <strong>in</strong> the version sent to me. There are a few grammatical errors and odd<br />
changes <strong>of</strong> tense (particularly from past to present) which I will not dwell upon.<br />
Neither will I repeat the basic elements <strong>of</strong> the study, such as def<strong>in</strong><strong>in</strong>g the good<br />
under consideration, as these are clearly stated <strong>in</strong> the report. Rather I will simply<br />
list my comments and concerns as follows us<strong>in</strong>g the order<strong>in</strong>g <strong>of</strong> the report as a<br />
template.<br />
Section 1: Introduction<br />
• An <strong>in</strong>itial concern arises regard<strong>in</strong>g a potential ‘add<strong>in</strong>g-up’ problem. There are<br />
numerous SDAs across England and given the constra<strong>in</strong>ts <strong>of</strong> the study not all could<br />
be valued at once. This could cause a problem if (as seems likely) different areas<br />
are partial substitutes for each other. In such a case then values for <strong>in</strong>dividual<br />
areas cannot straightforwardly be added together as such a procedure would lead<br />
to an over-estimation <strong>of</strong> total values. It was not clear to me how the methodology<br />
developed would address this issue.<br />
Section 2: The Upland Attributes and Their Forecast Changes<br />
• An exhaustive list <strong>of</strong> potential land use attributes was considered. I am not an<br />
ecologist and cannot verify the accuracy <strong>of</strong> the various attribute descriptions.<br />
However, the estimated rates <strong>of</strong> land use change are <strong>in</strong> l<strong>in</strong>e with changes <strong>in</strong> general<br />
marg<strong>in</strong>al land use dur<strong>in</strong>g the specified period (1990-8).<br />
eftec A- 94<br />
January 2006
<strong>Economic</strong> <strong>Valuation</strong> <strong>of</strong> <strong>Environmental</strong> <strong>Impacts</strong> <strong>in</strong> the Severely Disadvantaged Areas<br />
Annex 8 – Peer Reviewer Report<br />
• Four policy change scenarios are presented. These are developed from various<br />
permutations <strong>of</strong> Common Agricultural Policy (CAP) reform, <strong>Environmental</strong><br />
Stewardship Scheme (ESS) implementation and differ<strong>in</strong>g levels <strong>of</strong> upland farm<strong>in</strong>g<br />
subsidy and consequent land use or abandonment. One could always imag<strong>in</strong>e<br />
further permutations, but those chosen cover a good range <strong>of</strong> likely policy scenarios<br />
and consequent impacts. In theory this flexibility is enhanced by adoption <strong>of</strong> the<br />
chosen CE valuation methodology. This approach estimates the marg<strong>in</strong>al value <strong>of</strong><br />
each attribute (i.e. the value generated by a s<strong>in</strong>gle unit change <strong>in</strong> that attribute)<br />
which should allow for further permutations to be exam<strong>in</strong>ed (however, note<br />
subsequent comments on the implementation <strong>of</strong> the CE study).<br />
• Section 2 concludes by exam<strong>in</strong><strong>in</strong>g the impact <strong>of</strong> each scenario upon each <strong>of</strong> the<br />
highlighted land use attributes. Aga<strong>in</strong>, not be<strong>in</strong>g an ecologist, I am unable to verify<br />
the accuracy <strong>of</strong> these predictions but to the lay audience they seem credible.<br />
Section 3. <strong>Valuation</strong> Methodology<br />
• A variety <strong>of</strong> methods are employed to value changes to <strong>in</strong>dividual land use<br />
attributes. Individually these appear perfectly reasonable. However, as mentioned<br />
<strong>in</strong> relation to Section 1, my concern here is that there may well be substitution<br />
effects aris<strong>in</strong>g here. For example, a loss <strong>of</strong> set aside land might be either<br />
completely, partially or not at all compensated for by changes <strong>in</strong> the area <strong>of</strong><br />
heather moorland. It is unclear to me how such substitution effects were allowed<br />
for.<br />
• The comments regard<strong>in</strong>g methods are defensible. It is my own personal op<strong>in</strong>ion that<br />
the doubtless advantages <strong>of</strong> the CE approach (such as the estimation <strong>of</strong> marg<strong>in</strong>al<br />
attribute values mentioned above) have to some extent led practitioners to be less<br />
critical <strong>of</strong> the method than other approaches, such as cont<strong>in</strong>gent valuation (CV),<br />
which have been extensively researched and for which limitations are well known.<br />
My own research suggests that some <strong>of</strong> the elicitation anomalies documented <strong>in</strong> the<br />
CV transfer over <strong>in</strong>to a CE context and that the latter has other foibles <strong>of</strong> its own.<br />
That does not <strong>in</strong> any way mean that I feel the choice <strong>of</strong> approach was <strong>in</strong>correct.<br />
However, some recognition <strong>of</strong> limits might have been appreciated.<br />
• The section on benefits transfer is well <strong>in</strong>formed and even handed. However, it<br />
should spell out the proposed methodology for adjust<strong>in</strong>g values between sites.<br />
• The focus group exercises where <strong>in</strong>tended to test out the robustness and clarity <strong>of</strong><br />
the CE questionnaire. My one concern here is that the groups used seem highly<br />
weighted towards high prior experience <strong>of</strong> SDAs. This means that they did not<br />
<strong>in</strong>form the design with respect to how low experience respondents would cope with<br />
the questionnaire.<br />
• The sample size used was appropriate (1,800 local <strong>in</strong>terviews plus 300 <strong>in</strong>terviews<br />
with those who live far from SDAs). This is a strong po<strong>in</strong>t <strong>of</strong> the study.<br />
• The survey comb<strong>in</strong>es two forms <strong>of</strong> valuation exercise: a choice experiment<br />
valuation section for SDAs <strong>in</strong> the respondent’s own Government Office Region (GOR)<br />
and a CV question for SDAs <strong>in</strong> the rest <strong>of</strong> England. I do not understand the rationale<br />
for this simultaneous change <strong>in</strong> both valuation method and geographical scope <strong>of</strong><br />
the good. Given that we know that different valuation methods are subject to<br />
certa<strong>in</strong> measurement effects, such a simultaneous switch would appear to<br />
underm<strong>in</strong>e the comparability <strong>of</strong> resultant value estimates.<br />
eftec A- 95<br />
January 2006
<strong>Economic</strong> <strong>Valuation</strong> <strong>of</strong> <strong>Environmental</strong> <strong>Impacts</strong> <strong>in</strong> the Severely Disadvantaged Areas<br />
Annex 8 – Peer Reviewer Report<br />
• The CE uses a very <strong>in</strong>terest<strong>in</strong>g mix <strong>of</strong> attribute levels allow<strong>in</strong>g the researchers to<br />
exam<strong>in</strong>e simultaneous ga<strong>in</strong>s and losses across a range <strong>of</strong> attribute levels (but see<br />
subsequent comments).<br />
• The comb<strong>in</strong>ation <strong>of</strong> a relatively high number <strong>of</strong> attributes (six) each hav<strong>in</strong>g a<br />
number <strong>of</strong> levels (either three or six) means that the total potential number <strong>of</strong><br />
options (the ‘full factorial’) is large even given the substantial sample size<br />
employed. As a consequence the researchers adopt a ‘ma<strong>in</strong> effects’ design which<br />
effectively reduces the amount <strong>of</strong> <strong>in</strong>formation collected regard<strong>in</strong>g the <strong>in</strong>teraction<br />
<strong>of</strong> changes across levels (e.g. how a ga<strong>in</strong> <strong>in</strong> say heather moorland is traded <strong>of</strong>f<br />
aga<strong>in</strong>st a loss <strong>in</strong> rough grassland). Given that <strong>in</strong>teraction effects can be substantial<br />
this is a po<strong>in</strong>t <strong>of</strong> some concern and I would be <strong>in</strong>terested <strong>in</strong> hear<strong>in</strong>g the researchers<br />
views on the effects <strong>of</strong> this aspect <strong>of</strong> the design upon the applicability <strong>of</strong> resultant<br />
value estimates.<br />
• Given that we have a ma<strong>in</strong> effects design the decision to present respondents with<br />
just six out <strong>of</strong> the total ma<strong>in</strong> effects set <strong>of</strong> 18 choice questions was a good one and<br />
is to be applauded given the doubtless temptation to load respondents with more<br />
choice tasks and thereby generate substantial <strong>in</strong>creases <strong>in</strong> response data. The<br />
danger <strong>of</strong> the latter strategy (avoided by the researchers) would be that where<br />
choices are cognitively demand<strong>in</strong>g (see below) response fatigue sets <strong>in</strong> quickly<br />
mean<strong>in</strong>g that answers are <strong>of</strong> variable certa<strong>in</strong>ty.<br />
• Arguably my ma<strong>in</strong> concern (and one which I highlighted <strong>in</strong> previous comments<br />
dur<strong>in</strong>g the design stage) is <strong>in</strong> respect <strong>of</strong> the cognitive load imposed upon<br />
respondents by the complexity <strong>of</strong> choice tasks such as that illustrated on p.22. I<br />
still feel that these are very difficult questions for respondents to answer (I<br />
certa<strong>in</strong>ly struggled even with this one example). A number <strong>of</strong> related issues arise<br />
here:<br />
o Do respondents understand the various attributes which make up an option?<br />
o Do they understand the changes <strong>in</strong> attribute levels detailed <strong>in</strong> those<br />
options?<br />
o Do they have economic preferences regard<strong>in</strong>g those options (do they care <strong>in</strong><br />
a manner which relates to any formal economic value)?<br />
o Can respondents deal with the complexity <strong>of</strong> the choice questions?<br />
These questions are, I feel, only partially answered by the subsequent analysis <strong>of</strong><br />
data. The danger is that, faced with such tasks, unless supportive answers to all <strong>of</strong><br />
these questions can be established, then we may be concerned that respondents<br />
may have ‘constructed preferences’ (Clark, 1988; Hsee & Kunreuther, 2000;<br />
Kahneman, Schkade, & Sunste<strong>in</strong>, 1998; Loewenste<strong>in</strong> et al., 2001; Mitchell, 1989;<br />
Packard, 1957; Powell, 2001; Slovic, 1995; Slovic et al., 1991, 2004). Such<br />
preferences are malleable, be<strong>in</strong>g formed <strong>in</strong> part by the question frames used to<br />
elicit responses. As such they are not commensurate with standard economic<br />
preferences. However, I do wish to stress that there is a danger here <strong>of</strong> ask<strong>in</strong>g the<br />
researchers to pass tests which are more str<strong>in</strong>gent that those normally required by<br />
policy makers. Very few valuation studies conduct any assessments <strong>of</strong> whether<br />
preferences are constructed or not. Furthermore, as discussed subsequently, the<br />
researchers do undertake conventional tests <strong>of</strong> theoretical consistency. Therefore<br />
<strong>Defra</strong> may wish to ignore concerns about preference construction on this occasion.<br />
• Comments regard<strong>in</strong>g the difficulties <strong>of</strong> compar<strong>in</strong>g the CV and CE exercises<br />
(discussed on p 23) are as outl<strong>in</strong>ed previously.<br />
• The researchers also conduct a number <strong>of</strong> valuation workshops. My concern here is<br />
that the value generated by such group exercises do not appear to be<br />
eftec A- 96<br />
January 2006
<strong>Economic</strong> <strong>Valuation</strong> <strong>of</strong> <strong>Environmental</strong> <strong>Impacts</strong> <strong>in</strong> the Severely Disadvantaged Areas<br />
Annex 8 – Peer Reviewer Report<br />
commensurate with the <strong>in</strong>dividual will<strong>in</strong>gness to pay (WTP) values which underp<strong>in</strong><br />
conventional CBA.<br />
Section 4: <strong>Valuation</strong> <strong>of</strong> Landscape – Literature Review<br />
• This is a good review. My only comment is that it would be worth cit<strong>in</strong>g the<br />
excellent review by Munro and Hanley (1999) <strong>in</strong> respect <strong>of</strong> <strong>in</strong>formation effects <strong>in</strong><br />
valuation studies.<br />
Section 5: <strong>Valuation</strong> <strong>of</strong> Attributes Not Included <strong>in</strong> the Choice Experiment<br />
• I have no familiarity with the <strong>Environmental</strong> Landscape Features (ELF) model. My<br />
ma<strong>in</strong> comment is that it needs to be established that values emanat<strong>in</strong>g from such a<br />
model are commensurate with <strong>in</strong>corporation with a CBA. Accept<strong>in</strong>g that I am not<br />
familiar with the model, the resultant value estimates for hay meadows (p.29)<br />
seem high to me. I am unsure what the implications would be for a CBA but they<br />
would appear to be substantial.<br />
• The methodology adopted does not appear to be able to account for values derived<br />
from the <strong>in</strong>teraction <strong>of</strong> land use types. Given that a diversity <strong>of</strong> land uses may well<br />
be considered to be a desirable feature <strong>of</strong> a landscape this seems an issue which<br />
should be considered <strong>in</strong> future research.<br />
Section 6: Stated Preference Survey: Summary and Results<br />
• Page 32 states “Question A1 asked whether respondents considered environmental<br />
policy to be important <strong>in</strong> relation to other areas <strong>of</strong> government expenditure.” This<br />
seems a lead<strong>in</strong>g question, likely to <strong>in</strong>duce pro-environment biased answers<br />
(detailed on page 36) which should not be given much weight (they are susceptible<br />
to the type <strong>of</strong> focuss<strong>in</strong>g bias commented on by Daniel Kahneman <strong>in</strong> his Nobel Prize<br />
acceptance speech). However, it is not at all a central part <strong>of</strong> the study design.<br />
Section 7: Validity Test<strong>in</strong>g<br />
• Generally the sampl<strong>in</strong>g looks much better than most valuation studies and as a<br />
result provides a much firmer basis for policy use than prior research. Perhaps as a<br />
result <strong>of</strong> the rigour <strong>of</strong> sampl<strong>in</strong>g and report<strong>in</strong>g it is easier to detect problems with<br />
that sample (p.35) such as the relatively high <strong>in</strong>come <strong>of</strong> the NW sample (which is<br />
commented upon) and the unusually high educational atta<strong>in</strong>ment level <strong>of</strong> the WM<br />
sample (which is not <strong>in</strong>vestigated further). Item non-response for the <strong>in</strong>come<br />
question is also high (p. 39) As I say, it would be churlish to criticise here as most<br />
other studies have done such a poor job <strong>of</strong> sampl<strong>in</strong>g that any <strong>in</strong>spection <strong>of</strong><br />
representativeness is impossible.<br />
• The analysis <strong>of</strong> protest bidd<strong>in</strong>g is robust throughout however results <strong>in</strong>dicate a high<br />
level <strong>of</strong> such protests. Indeed they are higher than those <strong>in</strong>dicated on p.41 (where<br />
they range up to 44% <strong>of</strong> subsample size) as this only documents cases where<br />
protests occurred <strong>in</strong> both the CE and CV exercises. [Note: this is a<br />
mis<strong>in</strong>terpretation by Pr<strong>of</strong>essor Bateman: the table referred to details protest<br />
votes for the CE and CV exercises separately.]<br />
• In comment<strong>in</strong>g upon the reasons for zero WTP responses the horizontal axis <strong>of</strong> the<br />
graph on p.43 appears to be <strong>in</strong>correctly labelled.<br />
eftec A- 97<br />
January 2006
<strong>Economic</strong> <strong>Valuation</strong> <strong>of</strong> <strong>Environmental</strong> <strong>Impacts</strong> <strong>in</strong> the Severely Disadvantaged Areas<br />
Annex 8 – Peer Reviewer Report<br />
• Tests <strong>of</strong> face validity (p.43) are somewhat mixed. In particular some 41% <strong>of</strong><br />
respondents appear to have encountered some problem with the survey<br />
questionnaire (either “Too long”, “Difficult to understand” or “Not credible”).<br />
• In report<strong>in</strong>g WTP functions it would be useful to report some more raw data on<br />
choices with respect to different levels <strong>of</strong> attributes.<br />
• The construct validity WTP functions reported on page 45 are useful although I<br />
wondered why a pooled model was not reported us<strong>in</strong>g say a cont<strong>in</strong>uous variable<br />
def<strong>in</strong><strong>in</strong>g distance to the relevant SDA be<strong>in</strong>g valued as an <strong>in</strong>dicator <strong>of</strong> proximity (and<br />
distance decay on values). Nonetheless the reported analysis has been carried out<br />
to a typically high standard. There are a few results <strong>of</strong> concern. In particular a<br />
number <strong>of</strong> significant variables switch signs across subsamples (AGE, GENDER,<br />
VISFREQ (which is commented upon) and RURAL). Interest<strong>in</strong>gly a number <strong>of</strong> the<br />
choice attributes are typically not significant predictors <strong>of</strong> choices. This is arguably<br />
a concern as it may reflect a lack <strong>of</strong> preference strength. It could well be that<br />
respondents either do not care about this issue or did not understand the<br />
complexity <strong>of</strong> the question. Either <strong>in</strong>terpretation would raise questions regard<strong>in</strong>g<br />
the validity <strong>of</strong> <strong>in</strong>corporat<strong>in</strong>g results with<strong>in</strong> subsequent CBAs.<br />
• How was the possibility <strong>of</strong> status quo bias dealt with <strong>in</strong> the analysis? It does not<br />
appear to be a feature <strong>of</strong> the reported WTP functions.<br />
• The analysts are candid about problems such as the unexpected signs on the<br />
ENVIMP and VISFREQ variables. Nevertheless such f<strong>in</strong>d<strong>in</strong>gs do raise some concern<br />
here. Could the VISFREQ result be a product <strong>of</strong> the national sampl<strong>in</strong>g strategy. For<br />
example, I live a very long way from the south west <strong>of</strong> Cornwall. Yet it is my<br />
favourite area <strong>of</strong> the UK and I have a high WTP for its preservation. Because <strong>of</strong> this<br />
I would have a much higher probability <strong>of</strong> agree<strong>in</strong>g to be surveyed if I knew from<br />
the outset that the survey concerned Cornwall. Such a survey might possibly reveal<br />
an unexpected relation with visit frequency as my proximity means that I do not<br />
visit frequently despite my high valuation <strong>of</strong> the area. However, for such a result to<br />
arise the survey would have to be conducted somewhat improperly. Another<br />
possibility is that the high item non-response for <strong>in</strong>come is contribut<strong>in</strong>g to this<br />
result. Yet a further possibility is that this reflects the omission <strong>of</strong> substitute<br />
availability from the analysis. If those who visit frequently are those who are more<br />
<strong>in</strong>terested <strong>in</strong> outdoor pursuits and have as a consequence moved to areas <strong>of</strong> high<br />
substitute availability then such a f<strong>in</strong>d<strong>in</strong>g may result. F<strong>in</strong>ally, this anomaly might be<br />
alleviated by employ<strong>in</strong>g the pooled model with distance variable suggested above.<br />
The distance variable may supersede visitor frequency show<strong>in</strong>g that this is actually<br />
the driv<strong>in</strong>g force beh<strong>in</strong>d the anomaly.<br />
• The CV analysis <strong>in</strong>dicates that one third <strong>of</strong> responses were omitted. For some <strong>of</strong><br />
these this will be due to item non-response, for others it will be as a result <strong>of</strong><br />
protest bids. This should be clarified, but either way this is a high proportion. The<br />
f<strong>in</strong>d<strong>in</strong>g that residents <strong>in</strong> the West Midlands area have the highest WTP does not<br />
seem to have an obvious explanation (although, as po<strong>in</strong>ted out by the researchers,<br />
this may reflect the ENVIMP and VISFREQ anomaly which persists here).<br />
• F<strong>in</strong>ally there are no clear tests for preference construction (although see my<br />
comments above regard<strong>in</strong>g this).<br />
Section 8: Will<strong>in</strong>gness to Pay Results, Aggregation, Policy Implications and Conclusions<br />
• A concern which I feel I should aga<strong>in</strong> reiterate is the lack <strong>of</strong> consideration <strong>of</strong><br />
<strong>in</strong>teraction and substitution effects. It is not clear to me that the f<strong>in</strong>d<strong>in</strong>gs allow us<br />
to understand how landscape attributes <strong>in</strong>teract or how different land use scenarios<br />
might substitute for each other. Perhaps this is someth<strong>in</strong>g which I have<br />
eftec A- 98<br />
January 2006
<strong>Economic</strong> <strong>Valuation</strong> <strong>of</strong> <strong>Environmental</strong> <strong>Impacts</strong> <strong>in</strong> the Severely Disadvantaged Areas<br />
Annex 8 – Peer Reviewer Report<br />
misunderstood <strong>in</strong> the report <strong>in</strong> which case I would welcome guidance from the<br />
researchers. However, <strong>in</strong> the absence <strong>of</strong> such <strong>in</strong>formation it seems difficult to know<br />
how these results should be used <strong>in</strong> policy appraisal. I should note that this seems<br />
to be a general problem. In particular the Environment Agency PR04 exercise is<br />
clearly vulnerable to criticisms upon these grounds.<br />
• Because <strong>of</strong> the above issue and the switch <strong>in</strong> goods considered it seems very<br />
difficult to mean<strong>in</strong>gfully compare the CE and CV values. The simultaneous switch <strong>of</strong><br />
methods and scope <strong>of</strong> goods to my m<strong>in</strong>d precludes such comparison.<br />
• The aggregation section is clearly still be<strong>in</strong>g written (this is acknowledged <strong>in</strong> the<br />
report) and so cannot really be commented upon. I feel that the researchers need<br />
to be very clear about the aggregation procedure adopted. The use <strong>of</strong> transfers and<br />
policy implications also needs to be clarified.<br />
References<br />
Adamowicz W.L., Boxall, P., Louviere, J.J., Swait, J. and Williams, M. (1999) Stated<br />
preference methods for valu<strong>in</strong>g environmental amenities, <strong>in</strong> Bateman, I.J. and Willis,<br />
K.G. (eds.) Valu<strong>in</strong>g <strong>Environmental</strong> Preferences: Theory and Practice <strong>of</strong> the Cont<strong>in</strong>gent<br />
<strong>Valuation</strong> Method <strong>in</strong> the US, EU and Develop<strong>in</strong>g Countries, Oxford University Press,<br />
Oxford, 460-479.<br />
Adamowicz, W., Boxall, P., Williams, M., Louviere, J. (1998) Stated preference approaches for<br />
measur<strong>in</strong>g passive use values: choice experiments and cont<strong>in</strong>gent valuation, American<br />
Journal <strong>of</strong> Agricultural <strong>Economic</strong>s, 80(1): 64-75<br />
Adamowicz W.L., Louviere, J.J. and Williams, M. (1994) "Comb<strong>in</strong><strong>in</strong>g stated and revealed<br />
preference methods for valu<strong>in</strong>g environmental amenities" Journal <strong>of</strong> <strong>Environmental</strong><br />
<strong>Economic</strong>s and Management, 26: 271-292.<br />
Bateman, I.J., Carson, R.T., Day, B., Hanemann, W.M., Hanley, N., Hett, T., Jones-Lee, M.,<br />
Loomes, G., Mourato, S., Özdemiroğlu, E., Pearce, D.W., Sugden, R. and Swanson, J.<br />
(2002) <strong>Economic</strong> <strong>Valuation</strong> with Stated Preference Techniques: A Manual, Edward Elgar<br />
Publish<strong>in</strong>g, Cheltenham.<br />
Bennett, J. and Blamey, R. (Eds). (2001) The Choice Modell<strong>in</strong>g Approach to <strong>Environmental</strong><br />
<strong>Valuation</strong>. Edward Elgar, Cheltenham.<br />
Clark, E. (1988). The want makers: Inside the world <strong>of</strong> advertis<strong>in</strong>g. New York: Pengu<strong>in</strong><br />
Books.<br />
Holmes, T. and Adamowicz, W.L., (2003) Attribute-based methods, <strong>in</strong> Champ, P.A., Boyle,<br />
K. and Brown, T.C. (eds.) A Primer on Non-market <strong>Valuation</strong>, Kluwer Academic Press,<br />
Dordrecht.<br />
Hsee, C. K., & Kunreuther, H. (2000). The affection effect <strong>in</strong> <strong>in</strong>surance decisions. Journal<br />
<strong>of</strong> Risk and Uncerta<strong>in</strong>ty, 20, 141-159.<br />
Kahneman, D., Schkade, D., & Sunste<strong>in</strong>, C. R. (1998). Shared outrage and erratic awards:<br />
The psychology <strong>of</strong> punitive damages. Journal <strong>of</strong> Risk and Uncerta<strong>in</strong>ty, 16, 49-86.<br />
Loewenste<strong>in</strong>, G. F., Weber, E. U., Hsee, C. K., & Welch, E. S. (2001). Risk as feel<strong>in</strong>gs.<br />
Psychological Bullet<strong>in</strong>, 127(2), 267-286.<br />
Louviere J (2001) "Choice experiments: an overview <strong>of</strong> concepts and issues" <strong>in</strong> Bennett J<br />
and Blamey R (eds.) The Choice Modell<strong>in</strong>g Approach to <strong>Environmental</strong> <strong>Valuation</strong>.<br />
Cheltenham: Edward Elgar.<br />
eftec A- 99<br />
January 2006
<strong>Economic</strong> <strong>Valuation</strong> <strong>of</strong> <strong>Environmental</strong> <strong>Impacts</strong> <strong>in</strong> the Severely Disadvantaged Areas<br />
Annex 8 – Peer Reviewer Report<br />
Louviere, J. and Hensher, D. (1982) ‘On the Design and Analysis <strong>of</strong> Simulated Choice or<br />
Allocation Experiments <strong>in</strong> Travel Choice Modell<strong>in</strong>g’, Transportation Research Record<br />
890:11-17.<br />
Louviere, J, Hensher, D and Swait, J. (2000) Stated Choice Methods: Analysis and<br />
Application, Cambridge: Cambridge University Press.<br />
Mitchell, M.L. (1989). The impact <strong>of</strong> external parties on brand-name capital: The 1982<br />
Tylenol poison<strong>in</strong>gs and subsequent cases. <strong>Economic</strong> Inquiry, 27, 601-618.<br />
Munro, A. and Hanley, N.D. (1999) Information, uncerta<strong>in</strong>ty and cont<strong>in</strong>gent valuation, <strong>in</strong><br />
Bateman, I.J. and Willis, K.G. (eds.) Valu<strong>in</strong>g <strong>Environmental</strong> Preferences: Theory and<br />
Practice <strong>of</strong> the Cont<strong>in</strong>gent <strong>Valuation</strong> Method <strong>in</strong> the US, EU, and Develop<strong>in</strong>g Countries,<br />
Oxford University Press, pp258-279.<br />
Packard, V. (1957). The hidden persuaders. New York: David McKay Company.<br />
Slovic, P. (1995). The construction <strong>of</strong> preference. American Psychologist, 50, 364-371.<br />
Slovic, P., F<strong>in</strong>ucane, M.L., Peters, E., & MacGregor, D. G. (2004). Risk as analysis and risk<br />
as feel<strong>in</strong>gs: Some thoughts about affect, reason, risk,, and rationality. Risk Analysis.<br />
Slovic, P., Layman, M., Kraus, N., Flynn, J., Chalmers, J., & Gesell, G. (1991). Perceived<br />
risk, stigma, and potential economic impacts <strong>of</strong> a high-level nuclear waste repository <strong>in</strong><br />
Nevada. Risk Analysis, 11(4), 683-696.<br />
eftec A- 100<br />
January 2006