Global Marketing, 6/e - Pearson Learning Solutions
Global Marketing, 6/e - Pearson Learning Solutions
Global Marketing, 6/e - Pearson Learning Solutions

Create successful ePaper yourself
Turn your PDF publications into a flip-book with our unique Google optimized e-Paper software.
2<br />
PART 2<br />
CHAPTER<br />
The <strong>Global</strong> <strong>Marketing</strong> Environment<br />
Case 2-1<br />
The <strong>Global</strong> Economic Crisis<br />
In his 1997 book One World, Ready or Not, William<br />
Greider described the United States as “the buyer of<br />
last resort.” Greider explained that, for many years, the<br />
United States was the only nation that was willing to<br />
absorb production surpluses exported by companies in<br />
Europe, Asia, and Latin America. Greider asked: “Who will<br />
buy the surpluses when the United States cannot?” The<br />
conventional wisdom has long held that strong spending<br />
by consumers in other nations would keep the world<br />
economy humming.<br />
However, by 2008, Greider’s question was taking on<br />
a new urgency and the conventional wisdom was being<br />
The <strong>Global</strong> Economic Environment<br />
tested. An economic crisis that had its roots in lax subprime<br />
mortgage lending practices began to spread<br />
around the globe. In the United States, where the crisis<br />
began, economic misery was widespread: The housing<br />
market collapsed, real estate values plummeted, credit<br />
tightened, and job growth slowed (see Exhibit 2-1). As<br />
the price of oil passed the $100 per barrel benchmark,<br />
the average price of a gallon of gasoline rose to $4.<br />
American consumers were, indeed, less willing and less<br />
able to buy.<br />
However, the crisis was not confined to the United<br />
States alone. Consumer-goods exporters in Asia, which<br />
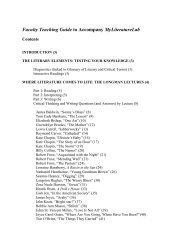
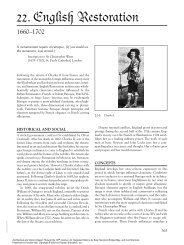
Exhibit 2-1: The bursting of the<br />
global real estate bubble was only<br />
one aspect of the worst recession<br />
in decades. The ripple effects from<br />
the economic turmoil were felt<br />
around the world. In 2007, just<br />
before the onset of the crisis,<br />
Mexico’s Cemex SAB acquired an<br />
Australian company, Rinker<br />
Materials, for $15.3 billion.<br />
Unfortunately, one of Rinker’s primary<br />
sources of revenue was the<br />
United States housing market. With<br />
that market collapsing, Cemex chief<br />
Lorenzo Zambrano was forced to<br />
sell assets and cut spending in an<br />
effort to trim his company’s debt<br />
load.<br />
Source: Paul J. Richards/AFP/<br />
Newscom.<br />
<strong>Global</strong> <strong>Marketing</strong>, Sixth Edition, by Warren J. Keegan and Mark C. Green. Copyright © 2011 by Warren J. Keegan. Published by Prentice Hall.<br />
000200010270740623
000200010270740623<br />
had prospered as Americans snapped up autos, electronics,<br />
and other products, faced flagging demand. By<br />
contrast, Brazil and Russia, two nations that had experienced<br />
economic turmoil in the 1990s, were buoyed by<br />
soaring demand for commodities such as gas and oil.<br />
Demand for raw materials was particularly strong in India<br />
and China. Then, as the economic crisis deepened, prices<br />
for oil and other commodities plummeted. Case 2-1<br />
describes the challenges of the current economic<br />
environment in more detail. When you are done reading<br />
the chapter, study the case and answer the discussion<br />
questions. Needless to say, the current economic downturn<br />
is creating both challenges and opportunities for<br />
global marketers.<br />
The global economic crisis vividly illustrates the<br />
dynamic, integrated nature of today’s economic environment.<br />
Recall the basic definition of a market: people<br />
or organizations with needs and wants and both the<br />
willingness and ability to buy or sell. As noted in Chapter<br />
1, many companies engage in global marketing in<br />
an effort to reach new customers outside their home<br />
THE WORLD ECONOMY—AN OVERVIEW<br />
countries and thereby increase sales, profits, and market<br />
share. Brazil, Russia, India, and China deserve special<br />
mention; collectively referred to as BRIC, these four<br />
country markets are particularly dynamic and represent<br />
important opportunities. 1 The BRIC nations and other<br />
emerging markets are also home to companies that are<br />
challenging established global giants at home and<br />
abroad. This chapter will identify the most salient characteristics<br />
of the world economic environment, starting<br />
with an overview of the world economy, a survey of<br />
economic system types, a discussion of stages of market<br />
development, and balance of payments. Foreign<br />
exchange is discussed in the final section of the chapter.<br />
Throughout the chapter, we will discuss the implications<br />
of the worldwide economic downturn on global marketing<br />
strategies.<br />
“As the saying goes, if you are not manufacturing in China<br />
or selling in India, you are as good as finished.” 2<br />
The world economy has changed profoundly since World War II. 3 Perhaps the most fundamental<br />
change is the emergence of global markets; responding to new opportunities, global competitors<br />
have steadily displaced or absorbed local ones. Concurrently, the integration of the world economy<br />
has increased significantly. Economic integration stood at 10 percent at the beginning of the<br />
twentieth century; today, it is approximately 50 percent. Integration is particularly striking in the<br />
European Union (EU) and the North American Free Trade Area.<br />
Just 65 years ago, the world was far less integrated than it is today. As evidence of the<br />
changes that have taken place, consider the automobile. Cars with European nameplates such as<br />
Renault, Citroën, Peugeot, Morris, Volvo, and others were radically different from the American<br />
Chevrolet, Ford, or Plymouth, or Japanese models from Toyota or Nissan. These were local cars<br />
built by local companies, mostly destined for local or regional markets. Even today, global and<br />
regional auto companies make cars for their home-country car buyers that are not marketed<br />
abroad. However, it is also true that the world car is a reality for Honda and Toyota. Product<br />
changes reflect organizational changes as well: The world’s largest automakers have, for the<br />
most part, evolved into global companies. Ford is a case in point: In 2008, the company unveiled<br />
an updated version of the Fiesta that will be marketed throughout the world. As Mark Fields, an<br />
executive vice president at Ford, explained, “We’ve had cars with the same name, like Escort and<br />
1<br />
The “BRIC” designation first appeared in a 2001 report published by Goldman Sachs, the New York–based investment<br />
bank, hedge fund, and private equity firm.<br />
2<br />
Saritha Rai, “Tastes of India in U.S. Wrappers,” The New York Times (April 29, 2003), p. W7.<br />
3<br />
Numerous books and articles survey this subject, for example, Lowell Bryan et al., Race for the World: Strategies<br />
to Build a Great <strong>Global</strong> Firm (Boston: Harvard Business School Press, 1999).<br />
Dipankar Halder, Associate Director,<br />
KSA Technopak, India<br />
<strong>Global</strong> <strong>Marketing</strong>, Sixth Edition, by Warren J. Keegan and Mark C. Green. Copyright © 2011 by Warren J. Keegan. Published by Prentice Hall.<br />
39
40 PART 2 • THE GLOBAL MARKETING ENVIRONMENT<br />
Focus, but the products themselves were very regional. This is a real shift point for us in that it’s<br />
a real global car.” 4<br />
During the past two decades, the world economic environment has become increasingly<br />
dynamic; change has been dramatic and far-reaching. To achieve success, executives and<br />
marketers must take into account the following new realities: 5<br />
� Capital movements have replaced trade as the driving force of the world economy.<br />
� Production has become “uncoupled” from employment.<br />
� The world economy dominates the scene; individual country economies play a subordinate<br />
role.<br />
� The struggle between capitalism and socialism that began in 1917 is largely over.<br />
� The growth of e-commerce diminishes the importance of national barriers and forces<br />
companies to reevaluate their business models.<br />
The first change is the increased volume of capital movements. The dollar value of world<br />
trade in goods and services was $16.9 trillion in 2007. However, the London foreign exchange<br />
market turns over $450 billion each working day; overall, foreign exchange transactions worth<br />
approximately $1.5 trillion are booked every day—far surpassing the dollar volume of world<br />
trade in goods and services. 6 There is an inescapable conclusion in these data: <strong>Global</strong> capital<br />
movements far exceed the dollar volume of global trade. This explains the paradoxical combination<br />
of U.S. trade deficits and a strong dollar during the first half of the 1980s and again in the<br />
early twenty-first century. According to orthodox economic theory, when a country runs a deficit<br />
on its trade accounts, its currency should depreciate in value. Today, it is capital movements and<br />
trade that determine currency value.<br />
The second change concerns the relationship between productivity and employment. To illustrate<br />
this relationship, it is necessary to review some basic macroeconomics. Gross domestic<br />
product (GDP), a measure of a nation’s economic activity, is calculated by adding consumer<br />
spending (C), investment spending (I), government purchases (G), and net exports (NX):<br />
C � I � G � NX � GDP<br />
Economic growth, as measured by GDP, reflects increases in a nation’s productivity. Until the<br />
recent economic crisis, employment in manufacturing had remained steady or declined while<br />
productivity continued to grow. Now, because of the global recession, both employment and productivity<br />
are declining. The historical pattern is especially clear in American agriculture, where<br />
fewer farm employees produce more output. In the United States, manufacturing’s share of GDP<br />
declined from 19.2 percent in 1989 to 13 percent in 2004. 7 In 2001, manufacturing employment<br />
accounted for about 13 percent of the U.S. workforce; in 1971, the figure was 26 percent. During<br />
that 30-year period, productivity has increased dramatically. Similar trends can be found in many<br />
other major industrial economies as well. One recent study of 20 large economies found that,<br />
between 1995 and 2002, more than 22 million factory jobs have been eliminated. Manufacturing<br />
is not in decline—it is employment in manufacturing that is in decline. 8<br />
4 Bill Vlasic, “Ford Introduces One Small Car for a World of Markets,” The New York Times (February 15, 2008), p. C3.<br />
5 William Greider offers a thought-provoking analysis of these new realities in One World, Ready or Not: The Manic<br />
Logic of <strong>Global</strong> Capitalism (New York: Simon & Schuster, 1997).<br />
6 Alan C. Shapiro, Multinational Financial Management, 7th ed. (Hoboken, NJ: John Wiley & Sons, 2003), p. 137.<br />
A Eurodollar is a U.S. dollar held outside the United States. U.S. dollars are subject to U.S. banking regulations;<br />
Eurodollars are not.<br />
7 Another economic indicator, gross national income (GNI), is comprised of GDP plus income generated from nonresident<br />
sources. A third metric, gross national product (GNP), is the total value of all final goods and services produced in a<br />
country by its residents and domestic business enterprises, plus the value of output produced by citizens working abroad,<br />
plus income generated by capital held abroad, minus transfers of net earnings by global companies operating in the<br />
country. GDP also measures economic activity; however, GDP includes all income produced within a country’s borders<br />
by its residents and domestic enterprises as well as foreign-owned enterprises. Income earned by citizens working abroad<br />
is not included. For example, Ireland has attracted a great deal of foreign investment, and foreign-owned firms account<br />
for nearly 90 percent of Ireland’s exports. This helps explain the fact that, in 2005, Ireland’s GDP totaled €161 billion<br />
while GNP was €135 billion. However, as a practical matter, GNP, GDP, and GNI figures for many countries will be<br />
roughly the same.<br />
8 Jon E. Hilsenrath and Rebecca Buckman, “Factory Employment Is Falling World-Wide,” The Wall Street Journal<br />
(October 20, 2003), p. A2. Some companies have cut employment by outsourcing or subcontracting nonmanufacturing<br />
activities such as data processing, accounting, and customer service.<br />
<strong>Global</strong> <strong>Marketing</strong>, Sixth Edition, by Warren J. Keegan and Mark C. Green. Copyright © 2011 by Warren J. Keegan. Published by Prentice Hall.<br />
000200010270740623
000200010270740623<br />
Russia’s Economic Roller-Coaster Ride<br />
In August 1998, the Russian economy imploded. The ruble<br />
plunged in value and the government defaulted on its foreign<br />
debt obligations. Many Russians faced wage cuts and layoffs;<br />
savings were wiped out as banks collapsed. The meltdown sent<br />
shock waves through global financial markets. Russia was down,<br />
but it was not out; in the years since the crisis, Russia’s economy<br />
has experienced substantial growth. By 2006, a country that<br />
had teetered on the brink of bankruptcy had posted four consecutive<br />
years of 6 percent economic growth and had amassed<br />
$250 billion in foreign currency reserves. The dramatic economic<br />
recovery can be attributed in part to record world prices for oil<br />
and gas; the energy sector is Russia’s most important source of<br />
export revenue.<br />
A second explanation for the rebounding economy was politics.<br />
In 2000, Vladimir Putin succeeded Boris Yeltsin as president. Putin<br />
initiated a reform program that included a new tax code. He<br />
also streamlined customs regulations, slashed subsidies to stateowned<br />
enterprises, and made other improvements in the business<br />
climate. A third factor in Russia’s economic rebound was the fact<br />
that price increases for imports caused by the ruble’s devaluation<br />
stimulated local production of a wide range of goods. As one<br />
economist noted, “The crash of ’98 really cleaned out the macroeconomy.”<br />
Putin confidently predicted that national income in<br />
Russia would double by 2010.<br />
Will Putin’s vision for economic growth in Russia be realized?<br />
Can the current recovery be sustained? Some indicators are positive;<br />
for example, foreign investment topped $13 billion in 2005,<br />
more than three times the 2002 level. Negotiations are ongoing<br />
to gain Russia admittance to the WTO. From the American<br />
perspective, issues such as market access for U.S. financial services<br />
companies and intellectual property protection are top priorities.<br />
Software, music, and video piracy are well-entrenched; annual<br />
losses from illegal software alone are estimated to be about<br />
$1.5 billion. Resolving those issues would pave the way for a lifting<br />
of U.S. economic restrictions known as the Jackson-Vanik<br />
amendment and the granting of permanent normal trade relations<br />
with Russia.<br />
Putin hosted the 2006 Group of Eight Summit in St. Petersburg,<br />
further enhancing Russia’s status on the world stage. Despite the<br />
positive publicity, however, other recent events have raised concerns<br />
in the world community. There is concern in Washington that Putin<br />
is suppressing the growth of democratic institutions. The phrase<br />
managed democracy describes what some call the arbitrary exercise<br />
of state power. Russia plans to limit foreign investment in strategic<br />
industries such as oil; the term renationalization has been applied to<br />
the process by which state-owned enterprises are acquiring rivals.<br />
Kleptocracy refers to rampant corruption and bribery.<br />
Russia is so dependent on revenues from the fuel and energy<br />
sectors that some feared the major decline in world oil prices that<br />
began in 2008 would have a destabilizing effect. A related<br />
problem is the fact that Russia’s energy industry is dominated by<br />
a handful of huge conglomerates. The men who run these companies<br />
are known as oligarchs; at one time, Yukos Oil’s Mikhail<br />
CHAPTER 2 • THE GLOBAL ECONOMIC ENVIRONMENT 41<br />
Khodorkovsky, Sibneft’s Roman Abramovich, and their peers<br />
were among Russia’s ultra-rich elite. However, there was<br />
widespread resentment among the Russian citizenry about the<br />
manner in which the oligarchs gained control of their respective<br />
companies. In July 2003, the Putin government sent a message<br />
to the oligarchs by arresting billionaire businessman Platon<br />
Lebedev on charges of paying too little for a fertilizer plant that<br />
he acquired in 1994. Khodorkovsky was also arrested and his<br />
Yukos empire was forced into bankruptcy.<br />
There are other problems as well. Putin’s tax reform program<br />
was relatively easy to implement; however, further reforms may face<br />
more opposition. Russia’s entrenched bureaucracy is a barrier to<br />
increased economic freedom. The banking system remains fragile<br />
and in need of reform. Tragically, in the fall of 2006, Andrei Kozlov,<br />
Russia’s top banking regulator, was shot to death on the streets of<br />
Moscow. Yevgeny Yasin, a former economy minister and an advocate<br />
of liberal reforms, noted recently, “The Russian economy is<br />
constrained by bureaucratic shackles. If the economy is to grow,<br />
these chains must be dropped. If we can overcome this feudal<br />
system of using power, we will create a stimulus for strong and<br />
sustainable economic growth and improve the standards of living.”<br />
A number of global companies took note of Russia’s<br />
improved economic climate. For example, IKEA, the global furniture<br />
retailer, has opened dozens of new stores across Russia.<br />
France’s Auchan and German retail chains Rewe and Metro are<br />
targeting the grocery market (see Exhibit 2-2). By contrast,<br />
Walmart, Carrefour, and UK-based Tesco do not yet have a market<br />
presence; management at these companies believes the risks<br />
and difficulties of doing business in Russia are too great.<br />
In 2008, Dimitri Medvedev was elected president; Putin was<br />
named prime minister. The price of a barrel of oil fell from $200 to<br />
less than $50, and Russia’s economy began to sputter. As the global<br />
recession deepened, Russia’s dependence on a single commodity<br />
for the bulk of its export earnings turned out to be a liability. Only<br />
time will tell how long it will be until the good times return.<br />
Sources: Neil Buckley, “From Shock Therapy to Retail Therapy: Russia’s<br />
Middle Class Starts Spending,” The Financial Times (October 31, 2006),<br />
p. 13; David Lynch, “Russia Brings Revitalized Economy to the Table,”<br />
USA Today (July 13, 2006), pp. 1B, 2B; Guy Chazan, “Kremlin<br />
Capitalism: Russian Car Maker Comes under Sway of Old Pal of Putin,”<br />
The Wall Street Journal (May 19, 2006), pp. A1, A7; Greg Hitt and<br />
Gregory L. White, “Hurdles Grow as Russia, U.S. Near Trade Deal,” The<br />
Wall Street Journal (April 12, 2006), p. A4; Chazan, “Russia Is Flush—<br />
For Now,” The Wall Street Journal (November 17, 2004), p. A14; Peter<br />
Weinberg, “Russia Merits a Welcome into the Trade Fold,” Financial<br />
Times (October 27, 2003), p. 13; Mark Medish, “Russia’s Economic<br />
Strength Begins at Home,” Financial Times (September 22, 2003), p. 15;<br />
Andrew Jack and Stefan Wagstyl, “In 1998, Russia Was Nearly Bankrupt.<br />
Today It Has Reserves of $60 Bn. but Its Economic Future Remains<br />
Insecure,” Financial Times (August 18, 2003), p. 9; Gregory L. White and<br />
Jeanne Whalen, “Why Russian Oil Is a Sticky Business,” The Wall Street<br />
Journal (August 1, 2003), p. A7; Marshall Goldman, “Russia Will Pay<br />
Twice for the Fortunes of Its Oligarchs,” Financial Times (July 26/27,<br />
2003), p. 10.<br />
<strong>Global</strong> <strong>Marketing</strong>, Sixth Edition, by Warren J. Keegan and Mark C. Green. Copyright © 2011 by Warren J. Keegan. Published by Prentice Hall.
42 PART 2 • THE GLOBAL MARKETING ENVIRONMENT<br />
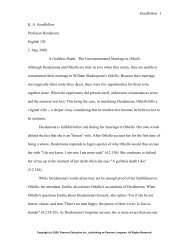
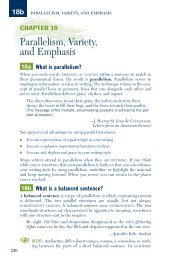
Exhibit 2-2: Russia is being<br />
transformed by economic<br />
change. In Moscow, for<br />
example, affluent Russians<br />
can shop at boutiques that<br />
offer Versace, Burberry,<br />
Bulgari, and other exclusive<br />
brands. Although per capita<br />
gross national income (GNI)<br />
in Russia is only $5,770,<br />
Russian shoppers spend an<br />
estimated $4 billion each<br />
year on luxury goods. Flush<br />
with dollars from oil exports,<br />
in 2006 the Russian government<br />
lifted all currency<br />
controls, making the ruble<br />
freely convertible in world<br />
markets.<br />
Source: Alexander Nemenov/<br />
AFP/Getty Images, Inc. AFP.<br />
“Only an outbreak of<br />
protectionist policies<br />
or a sharp rise in<br />
international shipping<br />
costs could slow or<br />
temporarily reverse<br />
manufacturing’s<br />
declining share of<br />
employment in the<br />
United States.” 10<br />
Steven J. Davis, Professor<br />
of Economics, University of<br />
Chicago<br />
“Ask one billion<br />
people, and 99<br />
percent of them are<br />
going to say they<br />
want a car. The<br />
problem is, how many<br />
can afford it?” 11<br />
Jagdish Khattar, Managing<br />
Director, Maruti Suzuki India<br />
The third major change is the emergence of the world economy as the dominant economic<br />
unit. Company executives and national leaders who recognize this have the greatest chance of<br />
success. For example, the real secret of the economic success of Germany and Japan is the fact<br />
that business leaders and policymakers focus on world markets and their respective countries’<br />
competitive positions in the world economy. This change has brought two questions to the fore:<br />
How does the global economy work, and who is in charge? Unfortunately, the answers to these<br />
questions are not clear-cut.<br />
The fourth change is the end of the Cold War. The demise of communism as an economic and<br />
political system can be explained in a straightforward manner: Communism is not an effective economic<br />
system. The overwhelmingly superior performance of the world’s market economies has<br />
given leaders in socialist countries little choice but to renounce their ideology. A key policy change<br />
in such countries has been the abandonment of futile attempts to manage national economies with<br />
a single central plan. This policy change frequently goes hand in hand with governmental efforts to<br />
foster increased public participation in matters of state by introducing democratic reforms. 9<br />
Finally, the personal computer revolution and the advent of the Internet era have in some<br />
ways diminished the importance of national boundaries. Worldwide, an estimated 1 billion<br />
people use personal computers. In the so-called Information Age, barriers of time and place have<br />
been subverted by a transnational cyberworld that functions “24/7.” Amazon.com, eBay,<br />
Facebook, Google, iTunes, MySpace, Priceline, Twitter, and YouTube are just a few of the companies<br />
that are pushing the envelope in this brave new world.<br />
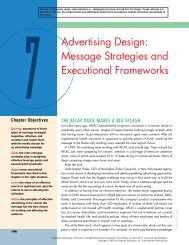
ECONOMIC SYSTEMS<br />
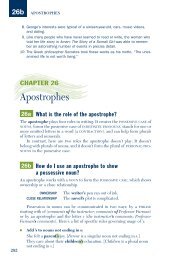
Traditionally, economists identified four main types of economic systems: market capitalism,<br />
centrally planned socialism, centrally planned capitalism, and market socialism. As shown in<br />
Figure 2-1, this classification was based on the dominant method of resource allocation (market<br />
versus command) and the dominant form of resource ownership (private versus state). Thanks to<br />
9<br />
Marcus W. Brauchli, “Poll Vaults: More Nations Embrace Democracy—and Find It Can Often Be Messy,” The Wall<br />
Street Journal (June 25, 1996), pp. A1, A6.<br />
10<br />
Tracey Taylor, “A Label of Pride That Pays,” The New York Times (April 23, 2009), p. B4.<br />
11<br />
Heather Timmons, “In India, a $2,500 Pace Car,” The New York Times (October 12, 2007), p. C1.<br />
<strong>Global</strong> <strong>Marketing</strong>, Sixth Edition, by Warren J. Keegan and Mark C. Green. Copyright © 2011 by Warren J. Keegan. Published by Prentice Hall.<br />
000200010270740623
000200010270740623<br />
Resource<br />
Ownership<br />
Private<br />
State<br />
Market<br />
Market<br />
capitalism<br />
Market<br />
socialism<br />
Resource Allocation<br />
CHAPTER 2 • THE GLOBAL ECONOMIC ENVIRONMENT 43<br />
Command<br />
Centrally<br />
planned<br />
capitalism<br />
Centrally<br />
planned<br />
socialism<br />
globalization, however, economic systems are harder to categorize within the confines of a<br />
four-cell matrix. Alternatively, more robust descriptive criteria include the following: 12<br />
� Type of economy Is the nation an advanced industrial state, an emerging economy, a transition<br />
economy, or a developing nation?<br />
� Type of government Is the nation ruled by a monarchy, a dictatorship, or a tyrant? Is there an<br />
autocratic one-party system? Is the nation dominated by another state, or is it a democracy<br />
with a multi-party system? Is it an unstable or terrorist nation?<br />
� Trade and capital flows Is the nation characterized by almost completely free trade or incomplete<br />
free trade, and is it part of a trading bloc? Is there a currency board or exchange controls?<br />
Is there no trade, or does the government dominate trade possibilities?<br />
� The commanding heights (e.g., the transportation, communications, and energy sectors).<br />
Are these sectors state owned and operated? Is there a mix of state and private ownership?<br />
Are they all private, with or without controlled prices?<br />
� Services provided by the state and funded through taxes Are pensions, health care, and education<br />
provided? Pensions and education but not health care? Do privatized systems dominate?<br />
� Institutions Is the nation characterized by transparency, standards, the absence of corruption,<br />
and the presence of a free press and strong courts? Or is corruption a fact of life and the press<br />
dominated by the government? Are standards ignored and the court system compromised?<br />
� Markets Does the nation have a free market system characterized by high risk/high reward<br />
entrepreneurial dynamism? Is it a free market that is dominated by monopolies, cartels, and<br />
concentrated industries? Is it a socialized market with cooperation between business,<br />
government, and labor (but with little entrepreneurial support)? Or is planning, including<br />
price and wage controls, dominated by the center?<br />
Market Capitalism<br />
Market capitalism is an economic system in which individuals and firms allocate resources and<br />
production resources are privately owned. Simply put, consumers decide what goods they desire<br />
and firms determine what and how much to produce; the role of the state in market capitalism is<br />
to promote competition among firms and ensure consumer protection. Today, market capitalism<br />
is widely practiced around the world, most notably in North America and the European Union<br />
(see Table 2-1).<br />
It would be a gross oversimplification, however, to assume that all market-oriented<br />
economies function in an identical manner. Economist Paul Krugman has remarked that the<br />
United States is distinguished by its competitive, “wild free-for-all” and decentralized initiative.<br />
By contrast, outsiders sometimes refer to Japan as “Japan Inc.” The label can be interpreted in<br />
different ways, but it basically refers to a tightly run, highly regulated economic system that is<br />
also market oriented.<br />
12<br />
The authors are indebted to Professor Francis J. Colella, Department of Economics, Simpson College, for suggesting<br />
these criteria.<br />
<strong>Global</strong> <strong>Marketing</strong>, Sixth Edition, by Warren J. Keegan and Mark C. Green. Copyright © 2011 by Warren J. Keegan. Published by Prentice Hall.<br />
FIGURE 2-1<br />
Economic Systems
44 PART 2 • THE GLOBAL MARKETING ENVIRONMENT<br />
TABLE 2-1 Western Market Systems<br />
Type of System Key Characteristics Countries<br />
Anglo-Saxon Model Private ownership; free enterprise economy; capitalism; minimal social safety net;<br />
highly flexible employment policies<br />
Social Market<br />
Economy Model<br />
Private ownership; “social partners” orientation that includes employer groups,<br />
unions, and banks; unions and corporations are involved in government,<br />
and vice versa; inflexible employment policies<br />
Nordic Model Mix of state ownership and private ownership; high taxes, some market<br />
regulation, generous social safety net<br />
Centrally Planned Socialism<br />
At the opposite end of the spectrum from market capitalism is centrally planned socialism.<br />
In this type of economic system, the state has broad powers to serve the public interest as it sees<br />
fit. State planners make “top-down” decisions about what goods and services are produced and in<br />
what quantities; consumers can spend their money on what is available. Government ownership of<br />
entire industries as well as individual enterprises is characteristic of centrally planned socialism.<br />
Because demand typically exceeds supply, the elements of the marketing mix are not used as<br />
strategic variables. 13 Little reliance is placed on product differentiation, advertising, or promotion;<br />
to eliminate “exploitation” by intermediaries, the government also controls distribution.<br />
The clear superiority of market capitalism in delivering the goods and services that people<br />
need and want has led to its adoption in many formerly socialist countries. An ideology developed<br />
in the nineteenth century by Marx and perpetuated in the twentieth century by Lenin and<br />
others has been resoundingly refuted. As William Greider writes:<br />
Marxism is utterly vanquished, if not yet entirely extinct, as an alternative economic system.<br />
Capitalism is triumphant. The ideological conflict first joined in the mid-nineteenth century<br />
in response to the rise of industrial capitalism, the deep argument that has preoccupied<br />
political imagination for 150 years, is ended. 14<br />
For decades, the economies of China, the former Soviet Union, and India functioned according<br />
to the tenets of centrally planned socialism. All three countries are now engaged in economic<br />
reforms characterized, in varying proportions, by increased reliance on market allocation and<br />
private ownership. Even as China’s leaders attempt to maintain control over society, they<br />
acknowledge the importance of economic reform (see Exhibit 2-3). At a recent assembly, the<br />
Communist Party said that reform “is an inevitable road for invigorating the country’s economy<br />
and promoting social progress, and a great pioneering undertaking without parallel in history.”<br />
Centrally Planned Capitalism and Market Socialism<br />
United States, Canada,<br />
Great Britain<br />
Germany, France, Italy<br />
Sweden, Norway<br />
In reality, market capitalism and centrally planned socialism do not exist in “pure” form. In most<br />
countries, to a greater or lesser degree, command and market resource allocation are practiced<br />
simultaneously, as are private and state resource ownership. The role of government in modern<br />
market economies varies widely. An economic system in which command resource allocation is<br />
utilized extensively in an overall environment of private resource ownership can be called centrally<br />
planned capitalism. A fourth variant, market socialism, is also possible. In such a system, market<br />
allocation policies are permitted within an overall environment of state ownership.<br />
In Sweden, for example, where the government controls two-thirds of all expenditures,<br />
resource allocation is more “command” oriented than “market” oriented. Also, as indicated in<br />
Table 2-2, the Swedish government has significant holdings in key business sectors. Thus,<br />
Sweden’s so-called “welfare state” has a hybrid economic system that incorporates elements<br />
13<br />
Peggy A. Golden, Patricia M. Doney, Denise M. Johnson, and Jerald R. Smith, “The Dynamics of a <strong>Marketing</strong><br />
Orientation in Transition Economies: A Study of Russian Firms,” Journal of International <strong>Marketing</strong> 3,<br />
no. 2 (1995), pp. 29–49.<br />
14<br />
William Greider, One World, Ready or Not: The Manic Logic of <strong>Global</strong> Capitalism (New York: Simon & Schuster,<br />
1997), p. 37.<br />
<strong>Global</strong> <strong>Marketing</strong>, Sixth Edition, by Warren J. Keegan and Mark C. Green. Copyright © 2011 by Warren J. Keegan. Published by Prentice Hall.<br />
000200010270740623
000200010270740623<br />
CHAPTER 2 • THE GLOBAL ECONOMIC ENVIRONMENT 45<br />
of both centrally planned socialism and capitalism. The Swedish government is embarking on a<br />
privatization plan that calls for selling its stakes in some of the businesses in Table 2-2. 15 In<br />
2008, Vin & Spirit was sold to France’s Pernod Ricard for $8.34 billion.<br />
As noted previously, China is an example of centrally planned socialism. However, China’s<br />
Communist leadership has given considerable freedom to businesses and individuals in the<br />
Guangdong Province to operate within a market system. Today, China’s private sector accounts<br />
for approximately 70 percent of national output. Even so, state enterprises still receive more than<br />
two-thirds of the credit available from the country’s banks.<br />
Market reforms and nascent capitalism in many parts of the world are creating opportunities<br />
for large-scale investments by global companies. Indeed, Coca-Cola returned to India in 1994,<br />
two decades after being forced out by the government. A new law allowing 100 percent foreign<br />
ownership of enterprises helped pave the way. By contrast, Cuba stands as one of the last<br />
bastions of the command allocation approach. Daniel Yergin and Joseph Stanislaw sum up the<br />
situation in the following way:<br />
Socialists are embracing capitalism, governments are selling off companies they had<br />
nationalized, and countries are seeking to entice multinational corporations expelled just<br />
two decades earlier. Today, politicians on the left admit that their governments can no<br />
TABLE 2-2 Examples of Government Resource<br />
Ownership in Sweden<br />
Company Industry Sector State Ownership %<br />
TeliaSonera Telecom 45<br />
SAS Airline 21<br />
Nordea Banking 20<br />
OMX Stock Exchange 7<br />
Vin & Spirit Alcohol 100*<br />
*Sold in 2008.<br />
15 Joel Sherwood and Terence Roth, “Defeat of Sweden’s Ruling Party Clears Way for Sales of State Assets,” The Wall<br />
Street Journal (September 19, 2006), p. A8.<br />
16 Nicholas R. Lardy, Integrating China into the <strong>Global</strong> Economy (Washington, D.C.: The Brookings Institution, 2003), p. 21.<br />
<strong>Global</strong> <strong>Marketing</strong>, Sixth Edition, by Warren J. Keegan and Mark C. Green. Copyright © 2011 by Warren J. Keegan. Published by Prentice Hall.<br />
Exhibit 2-3: In 2003, the<br />
Rolling Stones’ 40 Licks CD<br />
went on sale in China.<br />
However, some of the band’s<br />
most famous hits—“Brown<br />
Sugar,” “Beast of Burden,”<br />
“Honky Tonk Women,” and<br />
“Let’s Spend the Night<br />
Together”—were left off<br />
because officials viewed<br />
them as promoting social<br />
permissiveness. The Stones<br />
were scheduled to bring<br />
their fortieth anniversary<br />
tour to Beijing and Shanghai<br />
in 2003. However, the concerts<br />
were postponed due<br />
to the SARS outbreak. When<br />
Mick, Keith, and company<br />
finally did perform in China<br />
in 2006, government officials<br />
ordered the band to omit<br />
five songs from its set list.<br />
Source: AP Wide World Photos.<br />
“Countries with<br />
planned economies<br />
have never been part<br />
of economic<br />
globalization. China’s<br />
economy must<br />
become a market<br />
economy.” 16<br />
Long Yongtu, chief WTO<br />
negotiator for China
46 PART 2 • THE GLOBAL MARKETING ENVIRONMENT<br />
Exhibit 2-4: For decades,<br />
Singapore has been an<br />
important trade hub in Asia.<br />
The city-state is now being<br />
remade as a cultural destination.<br />
Leaders have embarked<br />
upon an ambitious real<br />
estate development<br />
program designed to keep<br />
Singapore up-to-date and<br />
competitive with Doha,<br />
Dubai, and other popular<br />
tourist centers. Sentosa<br />
Cove, a mixed-use, integrated<br />
resort, features thousands of<br />
apartments and villas, as well<br />
as hotels, a casino complex,<br />
and numerous retail shops.<br />
Unfortunately, many development<br />
projects are now in<br />
jeopardy, victims of the<br />
global recession.<br />
Source:Tim Hall/Getty Images,Inc.–<br />
Photodisc/Royalty Free.<br />
longer afford the expansive welfare state. . . . The decamping of the state from the “commanding<br />
heights” marks a great divide between the 20th and 21st centuries. It is opening<br />
the doors of many formerly closed countries to trade and investment, and vastly increasing<br />
the global market. 17<br />
The Washington, D.C.–based Heritage Foundation, a conservative think tank, takes a more<br />
conventional approach to classifying economies: It compiles a survey of more than 175 countries<br />
ranked by degree of economic freedom (Table 2-3). A number of key economic variables are<br />
considered: trade policy, taxation policy, government consumption of economic output, monetary<br />
policy, capital flows and foreign investment, banking policy, wage and price controls, property<br />
rights, regulations, and the black market. Hong Kong and Singapore are ranked first and second in<br />
terms of economic freedom; Cuba, Zimbabwe, and North Korea are ranked lowest (see Exhibit 2-4).<br />
There is a high correlation between the degree of economic freedom and the extent to which<br />
a nation’s mixed economy is heavily market oriented. However, the validity of the ranking has<br />
been subject to some debate. For example, author William Greider has observed that the authoritarian<br />
state capitalism practiced in Singapore deprives the nation’s citizens of free speech, a free<br />
press, and free assembly. For example, in 1992, Singapore banned the import, manufacture, and<br />
sale of chewing gum, because discarded wads of gum were making a mess in public places.<br />
Today, gum is available at pharmacies; before buying a pack, however, consumers must register<br />
their names and addresses. Greider notes, “Singaporeans are comfortably provided for by a<br />
harshly autocratic government that administers paranoid control over press and politics and an<br />
effective welfare state that keeps everyone well housed and fed, but not free.” 18 As Greider’s<br />
observation makes clear, some aspects of “free economies” bear more than a passing resemblance<br />
to command-style economic systems.<br />
STAGES OF MARKET DEVELOPMENT<br />
At any point in time, individual country markets are at different stages of economic development.<br />
The World Bank has developed a four-category classification system that uses per capita<br />
gross national income (GNI) as a base. The income definition for each of the stages is based on<br />
the World Bank’s lending categories, and countries within a given category generally have a<br />
17<br />
Daniel Yergin and Joseph Stanislaw, “Sale of the Century,” Financial Times Weekend (January 24–25, 1998), p. I.<br />
18<br />
William Greider, One World, Ready or Not: The Manic Logic of <strong>Global</strong> Capitalism (New York: Simon & Schuster,<br />
1997), pp. 36–37. See also John Burton, “Singapore’s Social Contract Shows Signs of Strain,” Financial Times<br />
(August 19–20, 2006), p. 3.<br />
<strong>Global</strong> <strong>Marketing</strong>, Sixth Edition, by Warren J. Keegan and Mark C. Green. Copyright © 2011 by Warren J. Keegan. Published by Prentice Hall.<br />
000200010270740623
000200010270740623<br />
TABLE 2-3 Index of Economic Freedom—2009 Rankings<br />
1. Hong Kong<br />
2. Singapore<br />
3. Australia<br />
4. Ireland<br />
5. New Zealand<br />
6. United States<br />
7. Canada<br />
8. Denmark<br />
9. Switzerland<br />
10. United Kingdom<br />
11. Chile<br />
12. The Netherlands<br />
13. Estonia<br />
14. Iceland<br />
15. Luxembourg<br />
16. Bahrain<br />
17. Finland<br />
18. Mauritius<br />
19. Japan<br />
20. Belgium<br />
21. Macau<br />
22. Barbados<br />
23. Austria<br />
24. Cyprus<br />
25. Germany<br />
26. Sweden<br />
27. The Bahamas<br />
28. Norway<br />
29. Spain<br />
30. Lithuania<br />
31. Armenia<br />
32. Georgia<br />
33. El Salvador<br />
34. Botswana<br />
35. Taiwan<br />
36. Slovak Republic<br />
37. Czech Republic<br />
38. Uruguay<br />
39. Saint Lucia<br />
40. South Korea<br />
41. Trinidad and<br />
Tobago<br />
42. Israel<br />
43. Oman<br />
44. Hungary<br />
45. Latvia<br />
46. Costa Rica<br />
47. Malta<br />
48. Qatar<br />
49. Mexico<br />
50. Kuwait<br />
51. Jordan<br />
52. Jamaica<br />
53. Portugal<br />
54. United Arab Emirates<br />
55. Panama<br />
56. Bulgaria<br />
57. Peru<br />
58. Malaysia<br />
59. Saudi Arabia<br />
60. Saint Vincent and<br />
the Grenadines<br />
61. South Africa<br />
62. Albania<br />
63. Uganda<br />
64. France<br />
65. Romania<br />
66. Belize<br />
67. Thailand<br />
68. Slovenia<br />
69. Mongolia<br />
70. Dominica<br />
71. Namibia<br />
72. Colombia<br />
73. Madagascar<br />
74. Kyrgyz Republic<br />
75. Turkey<br />
76. Italy<br />
77. Cape Verde<br />
78. Macedonia<br />
79. Paraguay<br />
80. Fiji<br />
81. Greece<br />
82. Poland<br />
83. Kazakhstan<br />
84. Nicaragua<br />
85. Burkina Faso<br />
86. Samoa<br />
87. Guatemala<br />
88. Dominican Republic<br />
89. Swaziland<br />
90. Kenya<br />
91. Honduras<br />
92. Vanuatu<br />
93. Tanzania<br />
94. Montenegro<br />
95. Lebanon<br />
96. Ghana<br />
97. Egypt<br />
98. Tunisia<br />
99. Azerbaijan<br />
100. Bhutan<br />
101. Morocco<br />
102. Pakistan<br />
103. Yemen<br />
104. The Philippines<br />
105. Brazil<br />
106. Cambodia<br />
107. Algeria<br />
108. Zambia<br />
109. Serbia<br />
110. Senegal<br />
111. Sri Lanka<br />
112. The Gambia<br />
113. Mozambique<br />
114. Mali<br />
115. Benin<br />
116. Croatia<br />
117. Nigeria<br />
118. Gabon<br />
119. Côte d’Ivoire<br />
120. Moldova<br />
121. Papua New Guinea<br />
122. Tajikistan<br />
123. India<br />
124. Rwanda<br />
125. Suriname<br />
126. Tonga<br />
127. Mauritania<br />
128. Niger<br />
129. Malawi<br />
130. Bolivia<br />
131. Indonesia<br />
132. China<br />
133. Nepal<br />
134. Bosnia and Herzegovina<br />
135. Ethiopia<br />
136. Cameroon<br />
137. Ecuador<br />
138. Argentina<br />
139. Micronesia<br />
Source: Terry Miller, “Freedom Is Still the Winning Formula,” The Wall Street Journal (January 13, 2009), p. A17.<br />
140. Djibouti<br />
141. Syria<br />
142. Equatorial Guinea<br />
143. Maldives<br />
144. Guinea<br />
145. Vietnam<br />
146. Russia<br />
147. Haiti<br />
148. Uzbekistan<br />
149. Timor-Leste<br />
150. Laos<br />
151. Lesotho<br />
152. Ukraine<br />
153. Burundi<br />
154. Togo<br />
155. Guyana<br />
156. Central African Republic<br />
157. Liberia<br />
158. Sierra Leone<br />
159. Seychelles<br />
160. Bangladesh<br />
161. Chad<br />
162. Angola<br />
163. Solomon Islands<br />
164. Kiribati<br />
165. Guinea-Bissau<br />
166. Republic of Congo<br />
167. Belarus<br />
168. Iran<br />
169. Turkmenistan<br />
170. São Tomé and Príncipe<br />
171. Libya<br />
172. Comoros<br />
173. Democratic Republic<br />
of Congo<br />
174. Venezuela<br />
175. Eritrea<br />
176. Burma<br />
177. Cuba<br />
178. Zimbabwe<br />
179. North Korea<br />
NOT RANKED<br />
Afghanistan<br />
Iraq<br />
Liechtenstein<br />
Sudan<br />
<strong>Global</strong> <strong>Marketing</strong>, Sixth Edition, by Warren J. Keegan and Mark C. Green. Copyright © 2011 by Warren J. Keegan. Published by Prentice Hall.<br />
47
48 PART 2 • THE GLOBAL MARKETING ENVIRONMENT<br />
TABLE 2-4 Stages of Market Development<br />
Income Group by<br />
per Capita GNI<br />
2006 GNI<br />
($ millions)<br />
number of characteristics in common. Thus, the stages provide a useful basis for global market<br />
segmentation and target marketing. The categories are shown in Table 2-4.<br />
A decade ago, a number of countries in Central Europe, Latin America, and Asia were expected<br />
to experience rapid economic growth. Known as big emerging markets (BEMs), the list included<br />
China, India, Indonesia, South Korea, Brazil, Mexico, Argentina, South Africa, Poland, and<br />
Turkey. 19 Today, much attention is focused on opportunities in Brazil, Russia, India, and China. As<br />
previously noted, these four countries are collectively known as BRIC. Microsoft’s experience<br />
illustrates the nature of the market opportunity in these countries: In fiscal 2008, the software giant’s<br />
collective revenues from BRIC grew 54 percent, compared with overall global revenue growth of<br />
18 percent. Experts predict that the BRIC nations will be key players in global trade even as their<br />
track records on human rights, environmental protection, and other issues come under closer<br />
scrutiny by their trading partners. The BRIC government leaders will also come under pressure at<br />
home as their developing market economies create greater income disparity. For each of the stages of<br />
economic development discussed here, special attention is given to the BRIC countries.<br />
Low-Income Countries<br />
2006 GNI<br />
per Capita($)<br />
% of World<br />
GNI<br />
2006 Population<br />
(millions)<br />
High-income countries<br />
GNI per capita � $11,456<br />
Upper-middle-income countries<br />
37,731,702 36,608 77.49 1,031<br />
GNI per capita � $3,706 but � $11,455<br />
Lower-middle-income countries<br />
4,797,291 5,913 9.85 811<br />
GNI per capita � $936 but � $3,705<br />
Low-income countries<br />
4,639,790 2,038 9.53 2,276<br />
GNI per capita � $935 1,570,841 649 3.23 2,420<br />
Low-income countries have a GNI per capita of less than $936. The general characteristics<br />
shared by countries at this income level are:<br />
1. Limited industrialization and a high percentage of the population engaged in agriculture<br />
and subsistence farming<br />
2. High birth rates<br />
3. Low literacy rates<br />
4. Heavy reliance on foreign aid<br />
5. Political instability and unrest<br />
6. Concentration in Africa south of the Sahara<br />
About 40 percent of the world’s population is included in this economic category. Many lowincome<br />
countries have such serious economic, social, and political problems that they represent<br />
extremely limited opportunities for investment and operations. Some are low-income, no-growth<br />
countries such as Burundi and Rwanda that are beset by one disaster after another. Others were<br />
once relatively stable countries with growing economies that have become divided by political<br />
struggles. The result is an unstable environment characterized by civil strife, declining income,<br />
and often considerable danger to residents. Haiti is a case in point. Countries embroiled in civil<br />
wars are dangerous areas; most companies find it prudent to avoid them.<br />
Other low-income countries represent genuine market opportunities. Bangladesh is a case in<br />
point: Per capita GNI is approximately $450, and the garment industry is enjoying burgeoning<br />
exports. Finished clothing exports totaled $9 billion in 2007; the president of the Bangladesh<br />
19 For an excellent discussion of BEMs, see Jeffrey E. Garten, The Big Ten: The Big Emerging Markets and How They<br />
Will Change Our Lives (New York: Basic Books, 1997).<br />
<strong>Global</strong> <strong>Marketing</strong>, Sixth Edition, by Warren J. Keegan and Mark C. Green. Copyright © 2011 by Warren J. Keegan. Published by Prentice Hall.<br />
000200010270740623
000200010270740623<br />
CHAPTER 2 • THE GLOBAL ECONOMIC ENVIRONMENT 49<br />
Garments Manufacturers and Exporters Association expects that figure to reach $25 billion by 2013.<br />
An estimated 1.8 million Bangladeshis—mostly women—work in the industry for an average<br />
monthly wage of about $35. Bangladesh received preferential treatment under the Multifiber<br />
Arrangement (MFA), an international pact dating to the mid-1970s that established import quotas to<br />
regulate the global trade in garments. The MFA expired at the end of 2004; some observers expected<br />
that a shakeout in the garment industry would lead to widespread unemployment and social and political<br />
unrest. However, this has not happened. The garment sector’s vigor is due in part to Bangladesh’s<br />
extremely low labor costs and new limits on Chinese textile exports to the United States. 20<br />
The newly independent countries of the former Soviet Union present an interesting situation:<br />
Income is declining, and there is considerable economic hardship. The potential for disruption is<br />
certainly high. Are they problem cases, or are they attractive opportunities with good potential for<br />
moving out of the low-income category? These countries present an interesting risk-reward tradeoff;<br />
many companies have taken the plunge, but many others are still assessing whether to take the<br />
risk. Table 2-3 rates two low-income former Soviet republics—Belarus and Turkmenistan—quite<br />
low in terms of economic freedom. This is one indication of a risky business environment. Russia<br />
itself, whose economy is in the upper-middle income category, has slipped significantly in the<br />
most recent ranking (number 146). As evidenced by the Kremlin’s recent actions, which include<br />
cutting off supplies of natural gas to some former Soviet republics and launching a military action<br />
in Georgia, economic and political instability are present here as well.<br />
With 2006 per capita GNI of $820, India is the sole low-income country in the BRIC grouping.<br />
In 2007, India commemorated the sixtieth anniversary of its independence from Great Britain. For<br />
many decades, economic growth was weak. As the 1990s began, India was in the throes of economic<br />
crisis: Inflation was high, and foreign exchange reserves were low. Country leaders opened India’s<br />
economy to trade and investment and dramatically improved market opportunities. Manmohan<br />
Singh was placed in charge of India’s economy. Singh, former governor of the Indian central bank<br />
and finance minister, noted, “For years, India has been taking the wrong road.” Accordingly, he set<br />
about dismantling the planned economy by eliminating import licensing requirements for many<br />
products, reducing tariffs, easing restrictions on foreign investment, and liberalizing the rupee.<br />
The results were impressive: Foreign exchange reserves jumped to $13 billion in 1993 from<br />
$1 billion in 1991. However, the political climate remains unpredictable. The nationalistic<br />
Bharatiya Janata Party (BJP) has been a vocal and powerful opponent of reform; in 2004, the BJP<br />
was ousted in national elections and the left-leaning Congress party came to power. Manmohan<br />
Singh, India’s former finance minister and the architect of the country’s economic reforms, is the<br />
new prime minister. Financial markets reacted negatively to uncertainty over India’s future direction;<br />
as one analyst put it, “This feels like the Asia crisis and the Mexico crisis times again.” 21<br />
Despite such concerns, Yashwant Sinha, the country’s former finance minister, declared that<br />
the twenty-first century will be “the century of India.” His words appear prescient; India is home<br />
to a number of world-class companies with growing global reach, including Infosys, Mahindra &<br />
Mahindra, Tata, and Wipro. Meanwhile, the list of companies operating in India is growing<br />
longer. They include Benetton, Cadbury, Coca-Cola, DuPont, Ericsson, Fujitsu, IBM, L’Oréal,<br />
MTV, Staples, Unilever, and Walmart. India’s huge population base also presents attractive<br />
opportunities for automakers. Suzuki, Hyundai, General Motors, and Ford are among the global<br />
car manufacturers doing business in India.<br />
Lower-Middle-Income Countries<br />
The United Nations designates 50 countries in the bottom ranks of the low-income category as<br />
least-developed countries (LDCs); the term is sometimes used to indicate a contrast with<br />
developing (i.e., upper ranks of low-income plus lower-middle and upper-middle-income)<br />
countries and developed (high-income) countries. Lower-middle-income countries are those<br />
with a GNI per capita between $936 and $3,705. Consumer markets in these countries are expanding<br />
rapidly. Countries such as China, Indonesia, and Thailand represent an increasing competitive<br />
20 Mahtab Haider, “Defying Predictions, Bangladesh’s Garment Factories Thrive,” The Christian Science Monitor<br />
(February 7, 2006), p. 4. See also Peter Fritsch, “Looming Trouble: As End of a Quota System Nears, Bangladesh Fears<br />
for Its Jobs,” The Wall Street Journal (November 20, 2003), pp. A1, A12.<br />
21 Sara Calian, “In India, Plunges and Protest,” The Wall Street Journal (May 18, 2004), p. C16.<br />
22 Manjeet Kirpalani, “The Factories Are Humming,” Business Week (October 18, 2004), pp. 54–55.<br />
<strong>Global</strong> <strong>Marketing</strong>, Sixth Edition, by Warren J. Keegan and Mark C. Green. Copyright © 2011 by Warren J. Keegan. Published by Prentice Hall.<br />
“It may feel like the<br />
temperature has only<br />
risen a couple of<br />
degrees so far, but<br />
this heralds the end<br />
of India’s economic<br />
Ice Age.” 22<br />
Vivek Paul, Vice Chairman,<br />
Wipro
50 PART 2 • THE GLOBAL MARKETING ENVIRONMENT<br />
“In a global market,<br />
you’re going to gain<br />
your profit not by<br />
sitting tight in the<br />
United States in a flat<br />
and declining market.<br />
You’re going to make<br />
your money in China<br />
and Russia and India<br />
and Brazil.” 23<br />
Tom Pirko, President,<br />
BevMark, commenting on<br />
InBev’s acquisition of<br />
Anheuser-Busch<br />
threat as they mobilize their relatively cheap—and often highly motivated—labor forces to serve<br />
target markets in the rest of the world. The developing countries in the lower-middle-income<br />
category have a major competitive advantage in mature, standardized, labor-intensive industries<br />
such as making toys and textiles.<br />
With per capita GNI of $2,000, China is the BRIC nation in the lower-middle-income<br />
category. China represents the largest single destination for foreign investment in the developing<br />
world. Attracted by the country’s vast size and market potential, companies in Asia, Europe, and<br />
North and South America are making China a key country in their global strategies. Shenzhen and<br />
other special economic zones have attracted billions of dollars in foreign investment. Despite<br />
ongoing market reforms, Chinese society does not have democratic foundations. Although China<br />
has joined the World Trade Organization, trading partners are still concerned about human rights,<br />
protection of intellectual property rights, and other issues. The country’s leaders must deal with<br />
China’s sprawling bureaucracy while reforming the state enterprise sector. To ensure that the<br />
nation’s export-led economic transformation is sustained, policymakers have launched hundreds<br />
of infrastructure projects. These include airports, cargo ports, highways, and railroads. Avon, the<br />
Coca-Cola Company, Dell, Ford, General Motors, Honda, HSBC, JP Morgan Chase, McDonald’s,<br />
Motorola, Procter & Gamble, Samsung, Siemens AG, Toyota, and Volkswagen are among the<br />
scores of global companies that are actively pursuing opportunities in China.<br />
Upper-Middle-Income Countries<br />
Upper-middle-income countries, also known as industrializing or developing countries, are<br />
those with GNI per capita ranging from $3,706 to $11,455. In these countries, the percentage of<br />
population engaged in agriculture drops sharply as people move to the industrial sector and the<br />
degree of urbanization increases. Malaysia, Chile, Hungary, Venezuela, and many other countries<br />
in this stage are rapidly industrializing (see Exhibit 2-5). They have high literacy rates and<br />
strong education systems; wages are rising but they are still significantly lower than in the<br />
advanced countries. Innovative local companies can become formidable competitors and help<br />
contribute to their nations’ rapid, export-driven economic growth.<br />
Russia and Brazil, with per capita GNI of $5,770 and $4,710, respectively, are the two<br />
BRIC nations that currently fall into the upper-middle-income category. As noted elsewhere in<br />
the chapter, Russia’s economic situation improved and declined again as the price of oil reached<br />
record levels and then collapsed. Strong local companies have appeared on the scene, including<br />
Wimm-Bill-Dann Foods, Russia’s largest dairy company. However, the Kremlin’s recent use of<br />
military force in Georgia has many observers worried. Corruption is pervasive, and the bureaucracy<br />
often means a mountain of red tape for companies such as Diageo, Mars, McDonald’s,<br />
Nestlé, and SAB Miller. Still, the market opportunity is enticing: Wages have increased dramatically<br />
in recent years, and consumers are showing a tendency to spend rather than save. 24<br />
Brazil is the largest country in Latin America in terms of the size of its economy, population,<br />
and geographic territory. Brazil also boasts the richest reserves of natural resources in the hemisphere.<br />
Brazil has tamed hyperinflation, and liberalized trade is replacing tariff protection and an<br />
import quota system. <strong>Global</strong> companies doing business in Brazil include Electrolux, Fiat, Ford,<br />
General Motors, Nestlé, Nokia, Raytheon, Toyota, Unilever, and Whirlpool.<br />
Typical of countries at this stage of development, Brazil is a study in contrasts. Grocery<br />
distribution companies use logistics software to route their trucks; meanwhile, horse-drawn carts<br />
are still a common sight on many roads. To help them keep pace with the volatile financial<br />
environment, many local retailers have invested in sophisticated computer and communications<br />
systems. They utilize sophisticated inventory management software to maintain financial control.<br />
Thanks to Brazil’s strength in computers, the country’s outsourcing sector is growing<br />
rapidly. 25 Former French president Chirac underscored Brazil’s importance on the world trade<br />
scene when he noted, “Geographically, Brazil is part of America. But it’s European because of<br />
its culture and global because of its interests.” 26<br />
23<br />
Sarah Theodore, “Beer Has Big Changes on Tap,” Beverage Industry (September 2008), p. 24.<br />
24<br />
Jenny Wiggins, “Brands Make a Dash into Russia,” Financial Times (September 4, 2008), p. 10.<br />
25<br />
Antonio Regalado, “Soccer, Samba and Outsourcing?” The Wall Street Journal (January 25, 2007), p. B1.<br />
26<br />
Matt Moffett and Helene Cooper, “Silent Invasion: In Backyard of the U.S., Europe Gains Ground in Trade,<br />
Diplomacy,” The Wall Street Journal (September 18, 1997), pp. A1, A8.<br />
<strong>Global</strong> <strong>Marketing</strong>, Sixth Edition, by Warren J. Keegan and Mark C. Green. Copyright © 2011 by Warren J. Keegan. Published by Prentice Hall.<br />
000200010270740623
000200010270740623<br />
CHAPTER 2 • THE GLOBAL ECONOMIC ENVIRONMENT 51<br />
Upper-middle-income countries that achieve the highest rates of economic growth are<br />
sometimes referred to collectively as newly industrializing economies (NIEs). Hungary is a<br />
case in point: Scores of manufacturing companies have received ISO-9000 certification for<br />
documenting compliance with recognized quality standards. The influx of technology, particularly<br />
the computer revolution, creates startling juxtapositions of the old and the new in these<br />
countries.<br />
<strong>Marketing</strong> Opportunities in LDCs and Developing Countries<br />
Despite many problems in LDCs and developing countries, it is possible to nurture long-term<br />
market opportunities. Today, Nike produces and sells only a small portion of its output in China,<br />
but when the firm refers to China as a “two-billion-foot market,” it clearly has the future in mind.<br />
<strong>Global</strong> <strong>Marketing</strong>, Sixth Edition, by Warren J. Keegan and Mark C. Green. Copyright © 2011 by Warren J. Keegan. Published by Prentice Hall.<br />
Exhibit 2-5: With per capita<br />
GNI of $6,070, Venezuela is<br />
considered an uppermiddle-income<br />
country.<br />
Venezuela is one of the<br />
world’s top oil-producing<br />
nations, and an important<br />
source of U.S. oil imports.<br />
A state-owned company,<br />
Petróleos de Venezuela S.A.<br />
(PDVSA), has operations in<br />
many different countries.<br />
For example, its CITGO<br />
Petroleum subsidiary<br />
operates 13,000 filling<br />
stations in the United States.<br />
The collapse in oil prices has<br />
had a direct impact on<br />
Venezuela’s economy.<br />
Source: Citgo.
52 PART 2 • THE GLOBAL MARKETING ENVIRONMENT<br />
C. K. Prahalad and Allen Hammond have identified several assumptions and misconceptions<br />
about the “bottom of the pyramid” (BOP) that need to be corrected: 27<br />
� Mistaken assumption #1: The poor have no money. In fact, the aggregate buying power of<br />
poor communities can be substantial. In rural Bangladesh, for example, villagers spend<br />
considerable sums to use village phones operated by local entrepreneurs.<br />
� Mistaken assumption #2: The poor are too concerned with fulfilling basic needs to “waste”<br />
money on nonessential goods. In fact, consumers who are too poor to purchase a house do<br />
buy “luxury” items such as television sets and gas stoves to improve their lives.<br />
� Mistaken assumption #3: The goods sold in developing markets are so inexpensive that<br />
there is no room for a new market entrant to make a profit. In fact, because the poor often<br />
pay higher prices for many goods, there is an opportunity for efficient competitors to<br />
realize attractive margins by offering quality and low prices.<br />
� Mistaken assumption #4: People in BOP markets cannot use advanced technology. In fact, residents<br />
of rural areas can and do quickly learn to use cell phones, PCs, and similar devices.<br />
� Mistaken assumption #5: <strong>Global</strong> companies that target BOP markets will be criticized for<br />
exploiting the poor. In fact, the informal economies in many poor countries are highly<br />
exploitative. A global company offering basic goods and services that improve a country’s<br />
standard of living can earn a reasonable return while benefiting society.<br />
Despite the difficult economic conditions in parts of Southeast Asia, Latin America,<br />
Africa, and Eastern Europe, many nations in these regions will evolve into attractive markets.<br />
One of marketing’s roles in developing countries is to focus resources on the task of creating<br />
and delivering products that are best suited to local needs and incomes. Appropriate marketing<br />
communications techniques can also be applied to accelerate acceptance of these products.<br />
<strong>Marketing</strong> can be the link that relates resources to opportunity and facilitates need satisfaction<br />
on the consumer’s terms.<br />
An interesting debate in marketing is whether it has any relevance to the process of economic<br />
development. Some people believe that marketing is relevant only in affluent, industrialized countries,<br />
where the major problem is directing society’s resources into ever-changing output or<br />
production to satisfy a dynamic marketplace. In the less-developed country, the argument goes,<br />
the major problem is the allocation of scarce resources toward obvious production needs. Efforts<br />
should focus on production and how to increase output, not on customer needs and wants.<br />
Conversely, it can be argued that the process of focusing an organization’s resources on environmental<br />
opportunities is a process of universal relevance. The role of marketing—to identify<br />
people’s needs and wants and to focus individual and organizational efforts to respond to these<br />
needs and wants—is the same in all countries, irrespective of the level of economic development.<br />
When global marketers respond to the needs of rural residents in emerging markets such as China<br />
and India, they are also more likely to gain all-important government support and approval.<br />
For example, pursuing alternative energy sources is important for two reasons: the lack of<br />
coal reserves in many countries and concerns that heavy reliance on fossil fuels contributes to<br />
global warming. Similarly, people everywhere need affordable, safe drinking water. Recognizing<br />
this fact, Nestlé launched Pure Life bottled water in Pakistan. The price was set at about 35 cents<br />
a bottle, and advertising promised “Pure safety. Pure trust. The ideal water.” Pure Life quickly<br />
captured 50 percent of the bottled water market in Pakistan; the brand has been rolled out in<br />
dozens of other low-income countries (see Exhibit 2-6). 28 The Coca-Cola Company recently<br />
began to address dietary and health needs in low-income countries by developing Vitango, a beverage<br />
product that can help fight anemia, blindness, and other ailments related to malnutrition.<br />
There is also an opportunity to help developing countries join the Internet economy. Intel<br />
chairman Craig Barrett has been visiting villages in China and India and launching programs to<br />
provide Internet access and computer training. One aspect of Intel’s World Ahead initiative is the<br />
development of a $550 computer that is powered by a car battery. Similarly, Hewlett-Packard engineers<br />
are working to develop solar-powered communication devices that can link remote areas to<br />
27<br />
C.K. Prahalad and Allen Hammond, “Serving the World’s Poor, Profitably,” Harvard Business Review 80, no. 9<br />
(September 2002), pp. 48–57.<br />
28<br />
Ernest Beck, “Populist Perrier? Nestlé Pitches Bottled Water to World’s Poor,” The Asian Wall Street Journal<br />
(June 18, 1999), p. B1.<br />
<strong>Global</strong> <strong>Marketing</strong>, Sixth Edition, by Warren J. Keegan and Mark C. Green. Copyright © 2011 by Warren J. Keegan. Published by Prentice Hall.<br />
000200010270740623
000200010270740623<br />
CHAPTER 2 • THE GLOBAL ECONOMIC ENVIRONMENT 53<br />
the Internet. 29 Meanwhile, an initiative called One Laptop Per Child has the goal of developing a<br />
laptop computer that governments in developing countries can buy for $100 (see Case 2-2).<br />
<strong>Global</strong> companies can also contribute to economic development by finding creative ways to<br />
preserve old-growth forests and other resources while creating economic opportunities for local<br />
inhabitants. In Brazil, for example, Daimler AG works with a cooperative of farmers who transform<br />
coconut husks into natural rubber to be used in auto seats, headrests, and sun visors. French<br />
luxury-goods marketer Hermès International has created a line of handbags called “Amazonia”<br />
made of latex extracted by traditional rubber tappers. Both Daimler and Hermès are responding<br />
to the opportunity to promote themselves as environmentally conscious while appealing to<br />
“green”-oriented consumers. As Isabela Fortes, director of a company in Rio de Janeiro that<br />
retrains forest workers, notes, “You can only prevent forest people from destroying the jungle by<br />
giving them viable economic alternatives.” 30<br />
High-Income Countries<br />
High-income countries, also known as advanced, developed, industrialized, or postindustrial<br />
countries, are those with GNI per capita of $11,456 or higher. With the exception of a few oilrich<br />
nations, the countries in this category reached their present income level through a process<br />
of sustained economic growth.<br />
The phrase postindustrial countries was first used by Daniel Bell of Harvard to describe<br />
the United States, Sweden, Japan, and other advanced, high-income societies. In his 1973 book<br />
The Coming of the Post-Industrial Society, Bell drew a distinction between the industrial and the<br />
postindustrial stages of country development that went beyond mere measures of income. Bell’s<br />
thesis was that the sources of innovation in postindustrial societies are derived increasingly from the<br />
codification of theoretical knowledge rather than from “random” inventions. The service sector<br />
29 Jason Dean and Peter Wonacott, “Tech Firms Woo ‘Next Billion’ Users,” The Wall Street Journal (November 3,<br />
2006), p. A2. See also David Kirkpatrick, “Looking for Profits in Poverty,” Fortune (February 5, 2001), pp. 174–176.<br />
30 Miriam Jordan, “From the Amazon to Your Armrest,” The Wall Street Journal (May 1, 2001), pp. B1, B4.<br />
31 Stuart L. Hart and Clayton M. Christensen, “The Great Leap: Driving Innovation from the Base of the Pyramid,” MIT<br />
Sloan Management Review 44, no. 1 (Fall 2002), p. 56.<br />
<strong>Global</strong> <strong>Marketing</strong>, Sixth Edition, by Warren J. Keegan and Mark C. Green. Copyright © 2011 by Warren J. Keegan. Published by Prentice Hall.<br />
Exhibit 2-6: According to<br />
the World Bank, approximately<br />
25 percent of the<br />
world’s population lives on<br />
less than $2 per day. In Brazil,<br />
Latin America’s largest market,<br />
low-income consumers<br />
comprise 87 percent of the<br />
population and account<br />
for 512 billion reals—$240<br />
billion—in annual income.<br />
The balance of Brazil’s<br />
population accounts for<br />
454 billion reals. Nestlé’s<br />
competitors in Brazil include<br />
both local and global<br />
brands. Sales of Nestlé’s<br />
Bono brand cookies<br />
increased 40 percent in<br />
Brazil after both the serving<br />
size and the price were<br />
decreased.<br />
Source: Reprinted with permission<br />
of The Wall Street Journal,<br />
© 2007 Dow Jones & Company,<br />
Inc. All Rights Reserved<br />
Worldwide.<br />
“Sustainable energy<br />
pioneers who focus<br />
on the base of the<br />
pyramid could set the<br />
stage for one of the<br />
biggest bonanzas in<br />
the history of<br />
commerce, since<br />
extensive adoption<br />
and experience in<br />
developing markets<br />
would almost<br />
certainly lead to<br />
dramatic<br />
improvements in cost<br />
and quality.” 31<br />
Stuart L. Hart and Clayton<br />
M. Christensen
54 PART 2 • THE GLOBAL MARKETING ENVIRONMENT<br />
Exhibit 2-7: When Russian<br />
president Vladimir Putin hosted<br />
the Group of Eight Summit in<br />
Saint Petersburg in 2006, he took<br />
advantage of the opportunity to<br />
show his country to the world in<br />
a positive light. The PR effort<br />
included a two-hour television<br />
broadcast during which Putin<br />
answered questions submitted<br />
from around the world via the<br />
Internet. The figure on Putin’s<br />
laptop depicts the Bronze<br />
Horseman, a statue near St.<br />
Isaac’s Cathedral that faces the<br />
Neva River. The monument was<br />
commissioned by Catherine the<br />
Great in tribute to Peter the<br />
Great, who founded Saint<br />
Petersburg as Russia’s “Window<br />
on the West.” Putin was Time<br />
magazine’s 2007 “Person of the<br />
Year.” Despite Putin’s public<br />
efforts, some observers fear that,<br />
behind the scenes, the Kremlin is<br />
attempting to reassert state control<br />
over Russia’s energy sector<br />
and other strategic assets.<br />
Source: Dmitry Astakhove/Getty<br />
Images, Inc. AFP.<br />
accounts for more than half of national output, the processing and exchange of information becomes<br />
increasingly important, and knowledge trumps capital as the key strategic resource. In addition, in a<br />
postindustrial society, intellectual technology is more important than machine technology, and scientists<br />
and professionals play a more dominant role than engineers and semiskilled workers.<br />
Postindustrial societies exhibit an orientation toward the future and stress the importance of interpersonal<br />
relationships in the functioning of society. Taken together, these forces and factors spell big<br />
sociological changes for the work and home lives of the residents of postindustrial nations.<br />
Product and market opportunities in a postindustrial society are heavily dependent upon<br />
new products and innovations. Ownership levels for basic products are extremely high in most<br />
households. Organizations seeking to grow often face a difficult task if they attempt to expand<br />
their share of existing markets. Alternatively, they can endeavor to create new markets. Today,<br />
for example, global companies in a range of communication-related industries are seeking to<br />
create new e-commerce markets for interactive forms of electronic communication. A case in<br />
point is Barry Diller’s IAC/InterActiveCorp, which includes Ask.com, Expedia.com,<br />
Hotels.com, and other Internet businesses.<br />
South Korea occupies a unique position among the high-income countries in that it is the only<br />
one classified as an emerging market by influential stock market indexes. South Korea is home to<br />
Samsung Electronics, LG Group, Kia Motors Corporation, Daewoo Corporation, Hyundai<br />
Corporation, and other well-known global enterprises. In place of substantial barriers to free trade,<br />
South Korea has initiated major reforms in its political and economic system in response to the<br />
“Asian flu.” Even so, investors note the political risk posed by North Korea. Another concern is<br />
inconsistent treatment of foreign investors by the government. For example, authorities recently<br />
raided the local offices of French retailer Carrefour. If the indexes do eventually reclassify South<br />
Korea as a “developed” market, the change would trigger a wave of investment inflows. 32<br />
Seven high-income countries—the United States, Japan, Germany, France, Britain, Canada,<br />
and Italy—comprise the Group of Seven (G-7). Finance ministers, central bankers, and heads of<br />
state from the seven nations have worked together for more than a quarter of a century in an<br />
effort to steer the global economy in the direction of prosperity and to ensure monetary stability.<br />
Whenever a global crisis looms—be it the Latin American debt crisis of the 1980s or Russia’s<br />
struggle to transform its economy in the 1990s—representatives from the G-7 nations gather<br />
and try to coordinate policy. Starting in the mid-1990s, Russia began attending the G-7 summit<br />
meetings. In 1998, Russia became a full participant, giving rise to the Group of Eight (G-8) (see<br />
Exhibits 2-7 and 2-8).<br />
32 Ian McDonald and Karen Richardson, “For South Korea, ‘Emerging’ Label Can Be a Burden,” The Wall Street<br />
Journal (July 12, 2006), p. C1.<br />
<strong>Global</strong> <strong>Marketing</strong>, Sixth Edition, by Warren J. Keegan and Mark C. Green. Copyright © 2011 by Warren J. Keegan. Published by Prentice Hall.<br />
000200010270740623
000200010270740623<br />
CHAPTER 2 • THE GLOBAL ECONOMIC ENVIRONMENT 55<br />
Another institution comprised of high-income countries is the Organization for Economic<br />
Cooperation and Development (OECD; www.oecd.org). The 30 nations that belong to the<br />
OECD believe in market-allocation economic systems and pluralistic democracy. The organization<br />
has been variously described as an “economic think tank” and a “rich-man’s club”; in any event, the<br />
OECD’s fundamental task is to “enable its members to achieve the highest sustainable economic<br />
growth and improve the economic and social well-being of their populations.” Today’s organization<br />
<strong>Global</strong> <strong>Marketing</strong>, Sixth Edition, by Warren J. Keegan and Mark C. Green. Copyright © 2011 by Warren J. Keegan. Published by Prentice Hall.<br />
Exhibit 2-8: When the<br />
world’s leaders meet to<br />
discuss policy issues, nongovernmental<br />
organizations<br />
(NGOs) often take advantage<br />
of the opportunity to<br />
make their voices heard.<br />
This print ad was timed to<br />
coincide with the 2008 G-8<br />
summit in Japan. The ad<br />
was paid for by Oxfam<br />
International, Whiteband,<br />
Save the Children, One, and<br />
Avaaz.org. The copy urges<br />
G8 leaders to keep their aid<br />
promises, to provide health<br />
care and education for<br />
everyone, and to address the<br />
issue of climate change.<br />
Source: Used by permission.
56 PART 2 • THE GLOBAL MARKETING ENVIRONMENT<br />
The term tiger has frequently been used to describe fast-growing<br />
economies in Asia. For years, Hong Kong, Singapore, Taiwan,<br />
and South Korea were considered tigers because they posted<br />
double-digit rates of economic growth. As the decade of the 1990s<br />
came to an end, however, the Asian “economic miracle” had given<br />
way to hard times. Concurrently, some observers began calling<br />
Ireland the “Celtic Tiger.” Riding the wave of the technology boom<br />
of the late 1990s, Ireland’s economy grew at an annual rate of<br />
9.6 percent. Lured by low corporate tax rates and a skilled workforce,<br />
companies from the United States, the United Kingdom,<br />
Germany, and Japan established subsidiaries in Ireland. The country<br />
best known for exports such as Waterford crystal, Guinness stout,<br />
Riverdance, and U2 had been transformed into a preferred location<br />
for high-tech manufacturing (see Exhibit 2-9).<br />
More than 500 U.S. companies created tens of thousands of<br />
jobs as Intel, Motorola, and Gateway built factories to keep pace<br />
with burgeoning global demand for personal computers and<br />
other high-tech products. Before long, however, there were signs<br />
that Ireland’s economic bubble might burst. The country’s infrastructure<br />
was showing signs of stress, labor was in short supply,<br />
and inflation soared. By mid-2000, the pot of gold at the end of<br />
the rainbow gave way to gray and gloom. As the U.S. economy<br />
slowed and the technology sector slumped, the impact on Ireland<br />
was immediate. Exports fell as foreign companies severely curtailed<br />
operations in Ireland or even closed down altogether.<br />
Irish officials had high hopes for Media Lab Europe, which<br />
opened in July 2000 in Dublin in a building that once was the site<br />
of a Guinness brewery. Media Lab Europe was an offshoot of the<br />
original Media Lab that was established at the Massachusetts<br />
Institute of Technology (MIT) more than 25 years ago. The Irish<br />
government allocated nearly $50 million in funding to establish<br />
the organization. In addition, global companies such as BT, Intel,<br />
the LEGO Group, and Swatch AG paid for sponsorships that entitled<br />
them to a first look at the lab’s innovations in such areas as<br />
robotic design, speech synthesis, and holographic imaging.<br />
Irish officials hoped the investment would pay off by strengthening<br />
Ireland’s position in advanced information-technology<br />
research. However, there were problems. For one thing, some<br />
researchers at MIT were reluctant to move their work to Ireland.<br />
By mid-2001, only six researchers and about two dozen research<br />
associates, assistants, and graduate students were working in a<br />
facility designed to accommodate 250 people. In 2005, the Media<br />
Lab Europe was closed down after MIT and the Irish government<br />
failed to reach agreement on future funding.<br />
“We’re transitioning the nation from being a supplier and<br />
producer of other people’s ideas to a place where you can<br />
actually do that development.”<br />
Enda Connolly, Industrial Development Agency of Ireland<br />
CULTURE WATCH<br />
Can the “Celtic Tiger” Reboot Its Economy?<br />
The Media Lab Europe generated a fair amount of controversy<br />
during its short existence. Some academics were offended<br />
by the notion that Ireland needs outside help; critics also questioned<br />
whether the lab would contribute to economic growth to<br />
the extent envisioned by the government. To placate such critics,<br />
the government increased funding for local research efforts. For<br />
example, Science Foundation Ireland (SFI) is a government-funded<br />
initiative funded to create an economic base in information<br />
technology, telecommunications, and biotechnology. A typical SFI<br />
research grant provides €1 million in annual support for five<br />
years. The Irish government hopes that, attracted by the skills and<br />
talents of students graduating from local universities, global companies<br />
currently operating in Ireland will increase their level of<br />
investment. Ultimately, the government hopes to create its own<br />
world-class companies. In 2007, Ireland launched a National<br />
Development Plan. The theme is “Transforming Ireland: A Better<br />
Life for All.”<br />
Meanwhile, the economic downturn is directly affecting<br />
some of Ireland’s oldest and most iconic brands. Citing falling<br />
global demand and the real estate bust, Guinness canceled plans<br />
to invest €650 ($1 billion) to build a superbrewery on the site of<br />
its 250-year-old St. James’s Gate facility. And Waterford, the<br />
venerable crystal and fine-china company, violated its credit<br />
obligations. The company entered insolvency administration and<br />
its owners put its assets up for sale.<br />
Visit the Web site<br />
www.sfi.ie<br />
Sources: Charles Forelle, “Ireland’s Boom Falls Hard in <strong>Global</strong><br />
Crisis,” The Wall Street Journal (February 7–8, 2009), p. A6; Jeanne<br />
Whalen, “Waterford Wedgewood Succumbs,” The Wall Street Journal<br />
(January 6, 2009), p. B3; Jeffrey Stinson, “Ireland’s Economy Not<br />
Roaring Back,” USA Today (November 20, 2008), p. 10; Quentin Peel,<br />
“Cowen Must Revive the Celtic Tiger,” Financial Times (April 8,<br />
2008), p. 2; Glenn R. Simpson, “Wearing of the Green: Irish<br />
Subsidiary Lets Microsoft Slash Taxes in U.S. and Europe,” The Wall<br />
Street Journal (November 11, 2005), pp. A1, 10; John Murray Brown,<br />
“Ireland Extends Its Hospitality to Top Scientists,” Financial Times<br />
(November 8, 2003), p. 12; Alana Cowell, “Ireland, Once a Celtic<br />
Tiger, Slackens Its Stride,” The New York Times (February 19, 2003),<br />
pp. C1, C4; Saritha Rai, “Rift in India Leads M.I.T. to Abandon a<br />
Media Lab,” The New York Times (May 8, 2003), p. C4; David<br />
Armstrong, “Many Irish Eyes Aren’t Smiling on MIT Import,” The<br />
Wall Street Journal (July 5, 2001), p. B1, B4; Jeffrey R. Young, “MIT’s<br />
Media Lab, a Media Darling, Seeks <strong>Global</strong> Role and New Missions,”<br />
The Chronicle of Higher Education (October 12, 2001), pp. A41–A43;<br />
Christopher Rhoads, “U.S. Slowdown Muffles the Volume of Ireland’s<br />
Boom,” The Wall Street Journal (March 6, 2001), p. A18; Mike Burns,<br />
“High-Tech Shudders for the Celtic Tiger,” Europe, no. 406 (May<br />
2001), pp. 14–15; Stewart Brand, The Media Lab: Inventing the Future<br />
at M.I.T. (New York: Viking Penguin, 1988).<br />
<strong>Global</strong> <strong>Marketing</strong>, Sixth Edition, by Warren J. Keegan and Mark C. Green. Copyright © 2011 by Warren J. Keegan. Published by Prentice Hall.<br />
000200010270740623
000200010270740623<br />
Exhibit 2-9: U2’s Bono is a<br />
key figure in several advocacy<br />
organizations. DATA<br />
(debt, AIDS, trade, Africa)<br />
helped influence the G-8’s<br />
decision to provide an<br />
additional $25 billion in aid<br />
to sub-Saharan Africa by<br />
2010. ONE (The Campaign<br />
to Make Poverty History) is<br />
a constellation of several<br />
NGOs united in an effort to<br />
generate grassroots interest<br />
in policy issues via alternative<br />
media such<br />
as YouTube and MySpace.<br />
EDUN Apparel’s garments<br />
are designed in New York<br />
City and sewn in developing<br />
countries. Finally, Bono was<br />
instrumental in launching<br />
Project (RED), a marketing<br />
initiative with Apple, GAP,<br />
and other corporate partners.<br />
A percentage of<br />
profits from sales of<br />
RED-branded product is<br />
donated to the <strong>Global</strong><br />
Fund to Fight AIDS.<br />
Source: Amy Sancetta/AP Wide<br />
World Photos.<br />
CHAPTER 2 • THE GLOBAL ECONOMIC ENVIRONMENT 57<br />
is based in Paris and evolved from a group of European nations that worked together after World<br />
War II to rebuild the region’s economy. Canada and the United States have been members since<br />
1961; Japan joined in 1964. Evidence of the increasing importance of the BRIC group is the fact<br />
that Brazil, Russia, India, and China have all formally announced their intention to join the OECD.<br />
Applicants must demonstrate progress toward economic reform.<br />
Representatives from OECD member nations work together in committees to review<br />
economic and social policies that affect world trade. The secretary-general presides over a Council<br />
that meets regularly and has decision-making power. Committees comprised of specialists from<br />
member countries provide a forum for discussion of trade and other issues. Consultation, peer pressure,<br />
and diplomacy are the keys to helping member nations candidly assess their own economic<br />
policies and actions. The OECD publishes country surveys and an annual economic outlook.<br />
Recently, the OECD has become more focused on global issues, social policy, and labor market<br />
deregulation. For example, the OECD has addressed the vexing problem of bribery; in 1997, it<br />
passed a convention that requires members to cooperate when pursuing bribery allegations. In the<br />
decade since the agreement entered into force, Germany, France, and other countries have adopted<br />
antibribery laws. Prosecutors from various countries are doing a better job of collaborating across<br />
borders; one recent case against Siemens AG resulted in a record €201 million fine. 33<br />
The Triad<br />
The ascendancy of the global economy has been noted by many observers in recent years. One of<br />
the most astute is Kenichi Ohmae, former chairman of McKinsey & Company Japan. His 1985<br />
book Triad Power represented one of the first attempts to develop a coherent conceptualization of<br />
the new emerging order. Ohmae argued that successful global companies had to be equally strong<br />
in Japan, Western Europe, and the United States. These three regions, which Ohmae collectively<br />
called the Triad, represented the dominant economic centers of the world. Today, nearly 75 percent<br />
of world income as measured by GNP is located in the Triad. Ohmae has recently revised his view<br />
of the world; in the expanded Triad, the Japanese leg encompasses the entire Pacific region; the<br />
American leg includes Canada and Mexico; and the boundary in Europe is moving eastward.<br />
Coca-Cola is a perfect illustration of a company with a balanced revenue stream. Approximately<br />
one-quarter of the company’s revenues are generated in Asia; another 25 percent come from<br />
Europe, Eurasia, and the Middle East. North America accounts for about 40 percent.<br />
33<br />
Russell Gold and David Crawford, “U.S., Other Nations Step Up Bribery Battle,” The Wall Street Journal (September 12,<br />
2008), pp. B1, B6.<br />
<strong>Global</strong> <strong>Marketing</strong>, Sixth Edition, by Warren J. Keegan and Mark C. Green. Copyright © 2011 by Warren J. Keegan. Published by Prentice Hall.
58 PART 2 • THE GLOBAL MARKETING ENVIRONMENT<br />
<strong>Marketing</strong> Implications of the Stages of Development<br />
The stages of economic development described previously can serve as a guide to marketers in<br />
evaluating product saturation levels, or the percentage of potential buyers or households who<br />
own a particular product. In countries with low per capita income, product saturation levels for<br />
many products are low. For example, India’s teledensity—a measure of ownership of private<br />
telephones—is only about 20 percent of the population. In China, saturation levels of private<br />
motor vehicles and personal computers (PCs) are quite low; there is only one car or light truck<br />
for every 43,000 Chinese, and only one PC for every 6,000 people. In Poland in 2001, there were<br />
21 cars per 100 compared with 49 in the 15-nation European Union; in 2002 Poland had 11 PCs<br />
STRATEGIC DECISION MAKING IN GLOBAL MARKETING<br />
Mexico’s “Tequila Crisis”<br />
On December 20, 1994, the Bank of Mexico embarked on a<br />
course of action that sent shock waves around the world.<br />
A combination of circumstances, including a $28 billion currentaccount<br />
deficit, dwindling reserves, the murder of presidential<br />
candidate Donaldo Colosio, and eroding investor confidence,<br />
forced the Bank of Mexico to devalue the peso. The Clinton<br />
administration quickly arranged $20 billion in loans and loan guarantees,<br />
secured in part by some of Mexico’s $7 billion in annual oil<br />
export revenues. Opponents of NAFTA—notably Ross Perot—<br />
seized the opportunity to denounce both the loans and the trade<br />
agreement. The devalued peso, critics predicted, would make U.S.<br />
exports to Mexico more expensive and reduce America’s $2 billion<br />
trade surplus with Mexico. NAFTA opponents also noted that<br />
increased imports of Mexican goods into the United States would<br />
constitute a new threat to U.S. jobs.<br />
The Bank of Mexico attempted to devalue the peso gradually;<br />
in fact, the Mexican currency declined nearly 40 percent<br />
relative to the dollar and other key currencies. As expected, one<br />
immediate effect of the devaluation was a sharp decline in<br />
Mexican purchases of U.S. imports. For example, Westinghouse<br />
and Lennox had been aggressively selling air conditioners after<br />
NAFTA reduced tariffs; sales quickly slowed down after the devaluation.<br />
McDonald’s, KFC, Dunkin’ Donuts, and other U.S. restaurant<br />
chains were also hard hit as they were forced to raise prices.<br />
Many franchisors had contracted to pay rent for their facilities in<br />
dollars; after the devaluation, franchisors who couldn’t pay the<br />
rent were forced to shut down. Simply put, the purchasing<br />
power of Mexican consumers was cut nearly in half. To reduce<br />
the risk of inflation, the Mexican government pledged to cut<br />
spending and allow interest rates to rise. Meanwhile, investors<br />
who had poured money into Mexico since the late 1980s, lured<br />
by the promise of low inflation and a stable currency, faced huge<br />
declines in the value of their holdings.<br />
For many manufacturing companies, the weaker peso<br />
wreaked havoc with 1995 sales forecasts. GM, for example, had<br />
hoped to export 15,000 vehicles to Mexico in 1995, a goal rendered<br />
unattainable by the financial crisis. Ford raised vehicle<br />
prices in Mexico; the increases applied to vehicles built in Mexico<br />
as well as those imported from Canada and the United States.<br />
Shares of Avon Products, whose Mexican sales comprise 11 percent<br />
of the company’s $4 billion in annual revenue, declined<br />
sharply on Wall Street. Hoping to calm investors’ fears, company<br />
executives predicted that a decline in Mexican sales would be offset<br />
in 1995 by gains in other countries.<br />
Supporters and opponents of NAFTA debated the long-term<br />
effects of the devaluation. Harley Shaiken, a labor professor at the<br />
University of California and NAFTA critic, noted, “It will have a<br />
dual impact: It will diminish the market for U.S. goods in Mexico,<br />
but the more sizable impact will be the transfer of production to<br />
Mexico. It’s going to make Mexico less desirable as a place to sell<br />
things and far more desirable as a place to make things.” Persons<br />
holding opposing views acknowledged that the devaluation cut<br />
Mexican wages in dollar terms. However, NAFTA supporters<br />
pointed out that labor’s percentage of total cost in autos and auto<br />
parts, which constitute Mexico’s largest export sector, was relatively<br />
low. Despite the devaluation, NAFTA supporters denied that<br />
there would be a “giant sucking sound” caused by an exodus of<br />
U.S. jobs south of the border. In 2009, the fifteenth anniversary of<br />
NAFTA’s implementation, policymakers and the general public<br />
were still divided. Perhaps the best assessment came from a<br />
recent report by the Carnegie Endowment of International Peace,<br />
which noted, “NAFTA has been neither the disaster its opponents<br />
predicted nor the savior hailed by its supporters.”<br />
As policymakers around the global tried to respond to the<br />
financial crisis of 2008, some looked to Mexico’s Tequila Crisis for<br />
answers. Several lessons could be discerned. First, it is important<br />
to stay flexible and act decisively before the market loses confidence.<br />
This may require policymakers to take unprecedented<br />
steps such as restructuring mortgages. As part of Mexico’s rescue<br />
plan, the government assumed bad loans from banks in order to<br />
ease the credit crisis. Although the government expected to<br />
break even, in the end the government lost three times the<br />
amount of money it expected the bailout to cost.<br />
Sources: David Luhnow, “Mexican Crisis Holds Lessons for U.S.,” The<br />
Wall Street Journal (October 13, 2008), p. A2; James Cox, “10 Years<br />
Ago, NAFTA Was Born,” USA Today (December 31, 2003), p. 3B; Craig<br />
Torres, “Headed South: Mexico’s Devaluation Stuns Latin America—and<br />
U.S. Investors,” The Wall Street Journal (December 22, 1994), pp. A1,<br />
A12; “Ford Lifts Prices, Avon Tries to Calm Holders, Dina Estimates<br />
Loss as Peso Fallout Continues,” The Wall Street Journal (January 13,<br />
1995); Michael Clements and Bill Montague, “Will Peso’s Fall Prove<br />
Perot Right?” USA Today (January 17, 1995), pp. B1, B2.<br />
<strong>Global</strong> <strong>Marketing</strong>, Sixth Edition, by Warren J. Keegan and Mark C. Green. Copyright © 2011 by Warren J. Keegan. Published by Prentice Hall.<br />
000200010270740623
000200010270740623<br />
TABLE 2-5 U.S. Balance of Payments, 2003–2007 (US$ millions)<br />
2003 2004 2005 2006 2007<br />
CHAPTER 2 • THE GLOBAL ECONOMIC ENVIRONMENT 59<br />
per 100 people. In the EU, the ratio was 34 PCs per 100 people. 34 In India, just 8 out of every<br />
1,000 adults own a car. 35 In Russia, 188 people out of 1,000 own cars; in Germany, the figure is<br />
565 out of 1,000. 36<br />
BALANCE OF PAYMENTS<br />
The balance of payments is a record of all economic transactions between the residents of a country<br />
and the rest of the world. U.S. balance of payments statistics for the period 2003 to 2007 are<br />
shown in Table 2-5. International trade data for the United States is available from the U.S. Bureau<br />
of Economic Analysis (www.bea.gov); the bureau’s interactive Web site enables users to generate<br />
customized reports. The International Monetary Fund’s Balance of Payments Statistics Yearbook<br />
provides trade statistics and summaries of economic activity for all countries in the world. 37<br />
The balance of payments is divided into the current and capital accounts. The current<br />
account is a broad measure that includes merchandise trade (i.e., manufactured goods) and<br />
services trade (i.e., intangible, experience-based economic output) plus certain categories of<br />
financial transfers such as humanitarian aid. A country with a negative current account balance<br />
has a trade deficit; that is, the outflow of money to pay for imports exceeds the inflow of money<br />
for sales of exports. Conversely, a country with a positive current account balance has a trade<br />
surplus. The capital account is a record of all long-term direct investment, portfolio investment,<br />
and other short- and long-term capital flows. The minus signs signify outflows of cash; for example,<br />
in Table 2-5, line 2 shows an outflow of $1.97 trillion in 2007 that represents payment for<br />
U.S. merchandise imports. (Other entries not shown in Table 2-5 represent changes in net errors<br />
and omissions, foreign liabilities, and reserves.) These are the entries that make the balance of<br />
payments balance. In general, a country accumulates reserves when the net of its current and<br />
capital account transactions shows a surplus; it gives up reserves when the net shows a deficit.<br />
The important fact to recognize about the overall balance of payments is that it is always in<br />
balance. Imbalances occur in subsets of the overall balance. For example, a commonly reported<br />
balance is the trade balance on goods (line 3 in Table 2-5).<br />
A close examination of Table 2-5 reveals that the United States regularly posts deficits in<br />
both the current account and the trade balance in goods. The United States’ growing trade deficit<br />
A. Current Account –527,514 –665,286 –791,508 –811,477 –731,214<br />
1. Goods Exports (BOP basis) 713,415 807,516 894,631 1,023,109 1,148,481<br />
2. Goods Imports (BOP basis) –1,260,717 –1,472,926 –1,677,371 –1,861,380 –1,976,853<br />
3. Balance on Goods –547,302 –665,410 –782,740 –838,271 –819,373<br />
4. Services: Credit 302,681 344,426 380,614 422,594 497,245<br />
5. Services: Debit –250,276 –290,312 –314,604 –342,845 –378,130<br />
6. Balance on Services 52,405 54,114 66,011 79,749 119,115<br />
7. Balance on Goods<br />
and Services<br />
–494,897 –611,296 –716,730 –758,522 –700,258<br />
B. Capital Account –3,480 –2,369 –4,036 –3,880 –1,842<br />
Source: www.bea.gov.<br />
34<br />
Stefan Wagstyl, “The Next Investment Wave: Companies in East and West Prepare for the Risks and Opportunities of<br />
an Enlarged EU,” Financial Times (April 27, 2004), p. 13.<br />
35<br />
Amy Chozik, “Nissan Races to Make Smaller, Cheaper Cars,” The Wall Street Journal (October 22, 2007), p. A12.<br />
36<br />
Will Bland and Katharina Becker, “Oil-Rich Russia Acquires a Taste for Gas Guzzlers,” The Wall Street Journal<br />
(September 18, 2008), p. B4.<br />
37<br />
Balance of payments data are available from a number of different sources, each of which may show slightly different<br />
figures for a given line item.<br />
<strong>Global</strong> <strong>Marketing</strong>, Sixth Edition, by Warren J. Keegan and Mark C. Green. Copyright © 2011 by Warren J. Keegan. Published by Prentice Hall.
60 PART 2 • THE GLOBAL MARKETING ENVIRONMENT<br />
TABLE 2-6 U.S. Goods and Services Trade with Brazil, India, and China 2007<br />
(US$ millions)<br />
reflects a number of factors, including increased imports from China, a seemingly insatiable consumer<br />
demand for imported goods, and the enormous cost of military operations in the Middle<br />
East. Table 2-6 shows a record of goods and services trade between the United States and Brazil,<br />
India, and China for 2007. A comparison of lines 4 and 5 in the two tables shows a bright spot<br />
from the U.S. perspective: The United States has maintained a services trade surplus with the rest<br />
of the world. Overall, however, the United States posts balance of payments deficits while important<br />
trading partners such as China have surpluses.<br />
China has more than $1 trillion in foreign reserves, more than any other nation. It offsets its<br />
trade surpluses with an outflow of capital, while the United States offsets its trade deficit with an<br />
inflow of capital. China and other countries with healthy trade surpluses are setting up sovereign<br />
wealth funds to invest some of the money. As trading partners, U.S. consumers and businesses<br />
own an increasing quantity of foreign products, while foreign investors own more U.S. land, real<br />
estate, and government securities. Foreign-owned U.S. assets total $2.5 trillion; in 2005, the<br />
United States borrowed 6 percent of its output in goods and services from foreign countries. 38 As<br />
Ha Jiming, an economist with China’s largest investment bank, noted, “One trillion [in reserves]<br />
is a big amount, but it is also a hot potato.” Some policymakers in Washington are alarmed about<br />
the U.S. trade deficit with China, which reached $250 billion in 2007.<br />
TRADE IN MERCHANDISE AND SERVICES<br />
China India Brazil<br />
1. U.S. Goods Exports to 65,073 17,516 24,497<br />
2. Goods Imports from –321,685 –24,102 –25,650<br />
3. Balance on Goods –256,611 –6,586 –1,153<br />
4. U.S. Services Exports to 14,205 9,506 9,924<br />
5. Services Imports from –8,791 –9,663 –4,051<br />
6. U.S. Balance on Services 5,413 –157 5,873<br />
7. U.S. Balance on Goods and Services –251,198 –6,743 4,720<br />
Source: www.bea.gov.<br />
Thanks in part to the achievements of GATT and the WTO, world merchandise trade has grown at<br />
a faster rate than world production since the end of World War II. Put differently, import and export<br />
growth has outpaced the rate of increase in GNI. According to figures compiled by the WTO, the<br />
dollar value of world merchandise trade in 2007 totaled $13.9 trillion. However, as the world<br />
slipped into recession in 2008, annual world trade growth slowed to about 6 percent. The top<br />
exporting and importing countries are shown in Table 2-7.<br />
In 2003, Germany surpassed the United States as the world’s top exporter. German<br />
manufacturers of all sizes have benefited from global economic growth because they provide the<br />
motors, machines, vehicles, and other capital goods that are required to build factories and country<br />
infrastructures; worldwide, machinery and transport equipment constitute approximately one-third<br />
of global exports. Overall, about two-thirds of Germany’s exports go to other EU nations; France is<br />
the number one country destination, while the United States ranks second. Today, exports generate<br />
40 percent of Germany’s gross domestic product, and 9 million jobs are export related. In addition,<br />
annual sales by the foreign subsidiaries of German-based companies are $1.5 billion. 39<br />
China’s third place in the export rankings underscores its role as an export powerhouse. Even in<br />
the face of Asia’s economic downturn in the late 1990s and the SARS outbreak, China demonstrated<br />
continued economic strength by achieving double-digit export growth. Chinese exports to the United<br />
38<br />
David Wessel, “Counting on a Miracle with U.S. Debt,” The Wall Street Journal (September 29, 2005), p. A2.<br />
39<br />
Bertrand Benoit and Richard Milne, “Germany’s Best-Kept Secret: How Its Exporters are Beating the World,”<br />
Financial Times (May 19, 2006), p. 11.<br />
<strong>Global</strong> <strong>Marketing</strong>, Sixth Edition, by Warren J. Keegan and Mark C. Green. Copyright © 2011 by Warren J. Keegan. Published by Prentice Hall.<br />
000200010270740623
000200010270740623<br />
TABLE 2-7 Top Exporters and Importers in World<br />
Merchandise Trade, 2004 (US$ billions)<br />
Leading Exporters 2004 Leading Importers 2004<br />
1. Germany 912 1. United States 1,526<br />
2. United States 819 2. Germany 717<br />
3. China 593 3. China 561<br />
4. Japan 566 4. France 466<br />
5. France 449 5. Great Britain 464<br />
6. Netherlands 358 6. Japan 455<br />
7. Italy 349 7. Italy 351<br />
8. Great Britain 347 8. Netherlands 319<br />
9. Canada 317 9. Belgium 286<br />
10. Belgium 307 10. Canada 280<br />
Source: WTO.<br />
TABLE 2-8 Top Exporters and Importers in World<br />
Merchandise Trade, 2004 (percentage of total)<br />
Leading Exporters 2004 Leading Importers 2004<br />
1. European Union 18.1 1. United States 21.8<br />
2. United States 12.3 2. European Union 18.3<br />
3. China 8.9 3. China 8.0<br />
4. Japan 8.5 4. Japan 6.9<br />
5. Canada 4.8 5. Canada 4.0<br />
6. South Korea 3.8 6. South Korea 3.2<br />
7. Mexico 2.8 7. Mexico 3.0<br />
8. Russia 2.8 8. Taiwan 2.4<br />
9. Taiwan 2.7 9. Switzerland 1.6<br />
10. Malaysia 1.9 10. Australia 1.6<br />
Source: WTO.<br />
CHAPTER 2 • THE GLOBAL ECONOMIC ENVIRONMENT 61<br />
States have surged since China joined the WTO in 2001; in fact, policymakers in Washington are<br />
pressuring Beijing to boost the value of the yuan in an effort to stem the tide of imports.<br />
Table 2-8 provides a different perspective on global trade. The European Union is treated as<br />
a single entity with imports and exports that exclude intra-regional trade among the 25 countries<br />
that were EU members at the end of 2006. South Korea, Mexico, and Russia appear in the top<br />
10 exporter rankings; South Korea and Mexico also rank in the top 10 importers table. Figures<br />
are cited as a percentage of the world total.<br />
The fastest-growing sector of world trade is trade in services. Services include travel and entertainment;<br />
education; business services such as accounting, advertising, engineering, investment<br />
banking, and legal services; and royalties and license fees that represent payments for intellectual<br />
property. One of the major issues in trade relations between the high- and lower-income countries<br />
is trade in services. As a group, low-, lower-middle, and even upper-middle-income countries are<br />
lax in enforcing international copyrights and protecting intellectual property and patent laws. As a<br />
result, countries that export service products such as computer software, music, and video entertainment<br />
suffer a loss of income. According to a recent <strong>Global</strong> Software Piracy Study conducted<br />
by the Business Software Association, annual worldwide losses due to software piracy amount<br />
to approximately $29 billion. In China alone, software piracy cost the industry an estimated<br />
$3.6 billion in lost sales in 2005.<br />
The United States is a major service trader. As shown in Figure 2-2, U.S. services exports in<br />
2007 totaled nearly $500 billion. This represents about one-third of total U.S. exports. The U.S.<br />
<strong>Global</strong> <strong>Marketing</strong>, Sixth Edition, by Warren J. Keegan and Mark C. Green. Copyright © 2011 by Warren J. Keegan. Published by Prentice Hall.
62 PART 2 • THE GLOBAL MARKETING ENVIRONMENT<br />
FIGURE 2-2<br />
U.S. Trade Balance<br />
on Services and on<br />
Merchandise Trade<br />
(US$ billions)<br />
US$ (billions)<br />
2000<br />
1800<br />
1600<br />
1400<br />
1200<br />
1000<br />
800<br />
600<br />
400<br />
200<br />
0<br />
–200<br />
–400<br />
–600<br />
–800<br />
Goods imports<br />
Services exports<br />
Goods exports<br />
Combined balance<br />
Services imports<br />
1992 1993 1994 1995 1996 1997 1998 1999<br />
Year<br />
2000 2001 2002 2003 2004 2005 2006 2007<br />
services surplus (service exports minus imports) stood at $119 billion. This surplus partially<br />
offset the U.S. merchandise trade deficit, which reached a record $819 billion in 2007. American<br />
Express, Walt Disney, IBM, and Microsoft are a few of the U.S. companies that have experienced<br />
rapid growth in demand for their services around the world.<br />
OVERVIEW OF INTERNATIONAL FINANCE<br />
Foreign exchange makes it possible for a company in one country to conduct business in other<br />
countries with different currencies. However, foreign exchange is an aspect of global marketing<br />
that involves certain financial risks, decisions, and activities that are completely different than<br />
those facing a domestic marketer. Moreover, those risks can be even higher in developing<br />
markets such as Thailand, Malaysia, and South Korea. When a company conducts business<br />
within a single country or region with customers and suppliers paying in the same currency, there<br />
is no exchange risk. All prices, payments, receipts, assets, and liabilities are in the given<br />
currency. However, when conducting business across boundaries in countries with different<br />
currencies, a company is thrust into the turbulent world of exchange risk.<br />
The foreign exchange market consists literally of a buyer’s and a seller’s market where<br />
currencies are traded for both spot and future delivery on a continuous basis. The spot market is<br />
for immediate delivery; the market for future delivery is called the forward market. This is a true<br />
market where prices are based on the combined forces of supply and demand that come into play<br />
at the moment of any transaction. Who are the participants in this market? First, a country’s<br />
central bank can buy and sell currencies in the foreign exchange market and government securities<br />
in an effort to influence exchange rates. For example, in the five-year period between 2001 and<br />
2006, China bought more than $250 billion in U.S. Treasury bonds. Such purchases help ensure<br />
that China’s currency is relatively weak compared to the U.S. dollar. 40 Second, some of the<br />
trading in the foreign exchange market takes the form of transactions needed to settle accounts for<br />
the global trade in goods and services. For example, because Porsche is a German company, the<br />
dollars spent on Porsche automobiles by American car buyers must be converted to euros. Finally,<br />
currency speculators also participate in the foreign exchange market.<br />
Devaluation can result from government action that decrees a reduction in the value of the<br />
local currency against other currencies. In 1994, for example, the Chinese devalued the yuan (also<br />
known as renminbi or “people’s money”). The immediate result was to ensure the low-cost position<br />
of Chinese exporters. However, the action also set the stage for the 1997 devaluations of the<br />
Thai baht, Malaysian ringgit, and Indonesian rupiah; the expression “beggar thy neighbor” is<br />
sometimes used to describe devaluations designed to increase export competitiveness.<br />
40 Mark Whitehouse, “U.S. Foreign Debt Shows Its Teeth as Rates Climb,” The Wall Street Journal (September 25, 2006), p. A9.<br />
<strong>Global</strong> <strong>Marketing</strong>, Sixth Edition, by Warren J. Keegan and Mark C. Green. Copyright © 2011 by Warren J. Keegan. Published by Prentice Hall.<br />
000200010270740623
000200010270740623<br />
TABLE 2-9 Exchange Risks and Gains in Foreign Transactions<br />
CHAPTER 2 • THE GLOBAL ECONOMIC ENVIRONMENT 63<br />
Foreign Contract $1,000,000 Contract €1,100,000 Contract<br />
Exchange Rates U.S. Seller Receives European Buyer Pays U.S. Seller Receives European Buyer Pays<br />
€1.25 = $1 $1,000,000 €1,250,000 $880,000 €1,100,000<br />
€1.10 = $1 $1,000,000 €1,100,000 $1,000,000 €1,100,000<br />
€1.00 = $1 $1,000,000 €1,000,000 $1,100,000 €1,100,000<br />
€0.85 = $1 $1,000,000 €850,000 $1,294,118 €1,100,000<br />
To the extent that a country sells more goods and services abroad than it buys, there will be<br />
a greater demand for its currency and a tendency for it to appreciate in value—unless government<br />
policymakers do not allow the currency to fluctuate. In 2005, the Chinese government<br />
responded to pressure from its trading partners by adopting a policy of revaluation to strengthen<br />
the yuan against the dollar and other currencies. A stronger yuan would make China’s exports to<br />
the United States more expensive while making U.S. exports to China less expensive. The net<br />
result would be a reduction in China’s trade surplus with the United States. The initial 2.1 percent<br />
increase in the yuan’s value was not expected to have much impact on prices; some experts<br />
believe the yuan is undervalued by 20 percent or more (see the Emerging Markets Briefing Book:<br />
Is China’s Currency Too Weak? feature). 41<br />
Table 2-9 shows how fluctuating currency values can affect financial risk, depending on the<br />
terms of payment specified in the contract. Suppose, at the time a deal is made, the exchange rate<br />
is €1.10 equals $1.00. How is a U.S. exporter affected if the dollar strengthens against the euro<br />
(e.g., trades at €1.25 equals $1.00) and the contract specifies payment in dollars? What happens<br />
if the dollar weakens (e.g., €0.85 equals $1.00)? Conversely, what if the European buyer<br />
contracts to pay in euros rather than dollars?<br />
Purchasing Power Parity<br />
Given that currencies fluctuate in value, a reasonable question to ask is whether a given currency<br />
is over- or undervalued compared with another. Recall from the previous discussion that the<br />
currency’s value could reflect government policy (as in the case of China) or market forces. One<br />
way to answer the question is to compare world prices for a single well-known product:<br />
McDonald’s Big Mac hamburger. The so-called Big Mac Index is a “quick and dirty” way of<br />
determining which of the world’s currencies are too weak or strong. The underlying assumption<br />
is that the price of a Big Mac in any world currency should, after being converted to dollars,<br />
equal the price of a Big Mac in the United States. (Similar indexes have been proposed based on<br />
the price of Starbucks coffee and IKEA furniture.)<br />
A country’s currency would be overvalued if the Big Mac price (converted to dollars) is<br />
higher than the U.S. price. Conversely, a country’s currency would be undervalued if the converted<br />
Big Mac price is lower than the U.S. price. Economists use the concept of purchasing<br />
power parity (PPP) when adjusting national income data to improve comparability. Table 2-10<br />
shows the Big Mac Index for selected countries in 2008. The first column of figures shows the<br />
price of a Big Mac converted from the local currency to dollars at the prevailing exchange rate.<br />
Thus, we can see that the Chinese yuan is undervalued against the dollar by about 58 percent.<br />
In other words, based on the U.S price for a Big Mac, the yuan/dollar exchange rate ought to be<br />
3.53/$1 rather than 6.84 to $1. 42 India is not included in the Index. Can you explain why?<br />
Economic Exposure<br />
Economic exposure reflects the impact of currency fluctuations on a company’s financial performance.<br />
Economic exposure can occur when a company’s business transactions result in sales or<br />
purchases denominated in foreign currencies. Diageo, for example, faces transaction exposure to the<br />
41 Sue Kirchhoff, “First Step: China Will Stop Pegging Yuan to Dollar,” USA Today (July 22, 2005), p. 1B, 2B.<br />
42 The authors acknowledge that the PPP theory-based Big Mac Index is simplistic; as noted in this section, exchange<br />
rates are also affected by interest rate differentials and monetary and fiscal policies—not just prices.<br />
<strong>Global</strong> <strong>Marketing</strong>, Sixth Edition, by Warren J. Keegan and Mark C. Green. Copyright © 2011 by Warren J. Keegan. Published by Prentice Hall.
64 PART 2 • THE GLOBAL MARKETING ENVIRONMENT<br />
TABLE 2-10 The 2008 Big Mac Index<br />
Country<br />
Big Mac Price<br />
Converted to $<br />
extent that it accepts payment for exports of Scotch whisky at one exchange rate but actually settles<br />
its accounts at a different rate of exchange. 43 Obviously, currency exposure is a critical issue for<br />
Nestlé, with 98 percent of annual sales taking place outside Switzerland. Among countries in the<br />
euro zone, GlaxoSmithKline, Daimler AG, BP, Sanofi-Aventis, Royal Dutch Shell, AstraZeneca,<br />
and SAB Miller all generate more than one-third of total sales in the U.S. market. Given the current<br />
weakness of the dollar relative to the euro, all of these companies face potential economic exposure.<br />
By comparison, GE generates more than 50 percent of its revenues in the domestic U.S. market, so<br />
the relative extent of GE’s exposure is less than that of the European companies previously listed.<br />
Even so, as noted in its annual report, GE does face economic exposure:<br />
When countries or regions experience currency and/or economic stress, we often have<br />
increased exposure to certain risks, but also often have new profit opportunities.<br />
Potential increased risks include, among other things, high receivable delinquencies and<br />
bad debts, delays or cancellations of sales and orders principally related to power and<br />
aircraft equipment, higher local currency financing costs and slowdown in established<br />
financial services activities. 44<br />
In dealing with the economic exposure introduced by currency fluctuations, a key issue is<br />
whether the company can use price as a strategic tool for maintaining its profit margins. Can the<br />
company adjust prices in response to a rise or fall of foreign exchange rates in various markets? That<br />
depends on the price elasticity of demand. The less price-sensitive the demand, the greater the flexibility<br />
a company has in responding to exchange rate changes. In the late 1980s, for example, Porsche<br />
raised prices in the United States three times in response to the weak dollar. The result: Porsche’s<br />
U.S. sales dropped precipitously, from 30,000 vehicles in 1986 to 4,500 vehicles in 1992. Clearly,<br />
U.S. luxury car buyers were exhibiting elastic demand curves for pricey German sports cars!<br />
Managing Exchange Rate Exposure<br />
Official<br />
Exchange Rate<br />
Over- or Undervaluation<br />
of Local Currency (%)<br />
Switzerland 5.60 1.16/$1 +58<br />
U.S. 3.54 – –<br />
Brazil 3.45 2.27/$1 –2<br />
Euro zone 3.42 1.28/$1 +24<br />
Japan 3.23 89.9/$1 –9<br />
Russia 1.73 35.7/$1 –51<br />
China 1.83 6.84/$1 –48<br />
Source: Adapted from “Big Mac Index,” Economist.com, accessed May 1, 2009. Used by permission.<br />
It should be clear from this discussion that accurately forecasting exchange rate movements is a<br />
major challenge. Over the years, the search for ways of managing cash flows to eliminate or reduce<br />
exchange rate risks has resulted in the development of numerous techniques and financial strategies.<br />
For example, it may be desirable to sell products in the company’s home country currency. When<br />
this is not possible, techniques are available to reduce both transaction and operating exposure.<br />
Hedging exchange rate exposure involves establishing an offsetting currency position such<br />
that the loss or gain of one currency position is offset by a corresponding gain or loss in some<br />
other currency. The practice is common among global companies that sell products and maintain<br />
operations in different countries. Today, for example, Porsche relies on currency hedging rather<br />
than price increases to boost pretax profits on sales of its automobiles. Porsche manufactures all<br />
43<br />
John Willman, “Currency Squeeze on Guinness,” Financial Times—Weekend Money (September 27–28, 1997), p. 5.<br />
44<br />
General Electric 2004 Annual Report, p. 58.<br />
<strong>Global</strong> <strong>Marketing</strong>, Sixth Edition, by Warren J. Keegan and Mark C. Green. Copyright © 2011 by Warren J. Keegan. Published by Prentice Hall.<br />
000200010270740623
000200010270740623<br />
Is China’s Currency Too Weak?<br />
In July 2005, the Peoples Bank of China announced the end of a<br />
10-year effort to peg the value of the Chinese currency, the<br />
yuan, to the value of the U.S. dollar. Instead, the yuan would be<br />
linked to a basket of several foreign currencies. The announcement<br />
signaled Beijing’s decision to abandon a policy of fixed<br />
exchange rates, according to which 8.28 yuan equaled $1, and<br />
adopt a policy of flexible rates. In short, by ending the peg,<br />
China’s central bank was finally allowing the yuan to float.<br />
The United States and other key trading partners had been<br />
urging such an action for years. The New York Times called the<br />
Chinese central bank’s decision “the most hotly anticipated event<br />
for the foreign-exchange world in years.” Many economists<br />
believed that the yuan had been undervalued relative to the dollar<br />
and other currencies by as much as 40 percent, and this weakness<br />
was cited as one of the factors contributing to growing trade<br />
deficits with China. For example, the U.S. trade deficit with China<br />
was more than $200 billion in 2006. This had occurred, it was<br />
argued, because the Chinese government had deliberately manipulated<br />
its currency to give Chinese exports a price advantage<br />
compared to goods from the United States and other countries.<br />
Some observers favored a quick change in the yuan’s value;<br />
others argued for a go-slow, gradualist approach. The immediate<br />
result of the revaluation was a 2.1 percent increase in the yuan’s<br />
value, to 8.11 yuan equals $1. The stronger yuan was expected<br />
to have a ripple effect on the economies of China’s top trading<br />
partners. For one thing, it was likely to result in increased prices<br />
for Chinese exports to the United States and elsewhere. This<br />
would be good news to some of the 12,000 members of the<br />
National Association of Manufacturers (N.A.M.). Many small<br />
factory owners in the United States are worried about competing<br />
with low-priced Chinese goods. However, a stronger yuan could<br />
be bad news for Walmart and other retailers that buy billions of<br />
dollars worth of goods from China each year. Likewise, global<br />
companies based in the West such as Whirlpool that source manufactured<br />
goods in China might be forced to raise prices.<br />
By mid-2007, the yuan had appreciated about 8.5 percent<br />
against the dollar. However, that was not enough to satisfy some<br />
policymakers. Impatient with the slow pace of the revaluation,<br />
some members of the U.S. Congress introduced legislation<br />
designed to punish China for its currency policy. One bill,<br />
co-sponsored by Senate Finance Chairman Max Baucus, a<br />
democrat, and Charles Grassley, the republican senator from<br />
45 Stephen Power, “Porsche Powers Profit with Currency Play,” The Wall Street Journal (December 8, 2004), p. C3.<br />
CHAPTER 2 • THE GLOBAL ECONOMIC ENVIRONMENT 65<br />
Iowa, was contingent on the U.S. Treasury Department determining<br />
that a “currency misalignment” had occurred. Following such<br />
a finding, the United States would impose fines in the form of<br />
antidumping penalties and the Chinese government would have<br />
six months to make the required currency adjustments. If China<br />
didn’t take action, the U.S. trade representative would request<br />
dispute settlement at the WTO. A final ruling would be issued<br />
in 2010.<br />
The introduction of the Congressional bill raised several<br />
questions. For example, it was unclear whether a dispute involving<br />
currency issues was a legitimate trade issue that the WTO<br />
would agree to hear. Another issue was whether it was possible<br />
to determine exactly how much the yuan would have to appreciate<br />
for it to be fairly aligned with the dollar.<br />
Some observers warned that the Baucus-Grassley bill and<br />
others like it could undermine the trade relationship between the<br />
United States and China and actually harm U.S. companies that<br />
do business with China. Since joining the WTO in 2001, China has<br />
become America’s fourth-largest export market. According to<br />
a study by the American Chamber of Commerce in China,<br />
American companies sold $61 billion worth of goods to China in<br />
2005. Chamber chairman James Zimmerman noted, “A revalued<br />
yuan will not force the Chinese to buy American goods and services.”<br />
Others warned that Chinese companies could diversify<br />
their export base by expanding trade with other countries.<br />
A trade war was another possibility. Scott Miller, director of trade<br />
policy for Procter & Gamble, said, “You can’t rule out a backlash.<br />
That ought to be part of the calculus that lawmakers should consider.”<br />
Some observers raised concerns that, in retaliation for<br />
trade sanctions, China might restrict market access for American<br />
goods.<br />
Sources: John McCary and Andrew Batson, “Punishing China: Will It<br />
Fly?” The Wall Street Journal (June 23–24, 2007), p. A4; Wu Yi, “It’s<br />
Win-Win on U.S. China Trade,” The Wall Street Journal (May 17, 2007),<br />
p. A21; Martin Wolf, “How China Has Managed to Keep the Renminbi<br />
Pinned Down,” Financial Times (October 11, 2006), p. 13; Louis Uchitelle,<br />
“What to Do About China and the Yuan,” The New York Times (October 12,<br />
2005), p. C1; E. S. Browning, “Yuan Move Might Stir Big Ripples,” The<br />
Wall Street Journal (July 25, 2005), pp. C1, C4; Sue Kirchhoff, “First Step:<br />
China Will Stop Pegging Yuan to Dollar,” USA Today (July 22, 2005),<br />
pp. 1B, 2B; Keith Bradsher, “A Chinese Revaluation May Not Help U.S.,”<br />
The New York Times (January 4, 2005), pp. C1, C5.<br />
of its cars in Europe, but generates about 45 percent of its sales in the United States. Thus,<br />
Porsche faces economic exposure stemming from the relative value of the dollar to the euro.<br />
Porsche is “fully hedged”; that is, it takes currency positions to protect all earnings from foreignexchange<br />
movements. 45<br />
If company forecasts indicate that the value of the foreign currency will weaken against the<br />
home currency, it can hedge to protect against potential transaction losses. Conversely, for<br />
predictions that the foreign currency will appreciate (strengthen) against the home currency, then<br />
a gain, rather than a loss, can be expected on foreign transactions when revenues are converted<br />
<strong>Global</strong> <strong>Marketing</strong>, Sixth Edition, by Warren J. Keegan and Mark C. Green. Copyright © 2011 by Warren J. Keegan. Published by Prentice Hall.
66 PART 2 • THE GLOBAL MARKETING ENVIRONMENT<br />
Summary<br />
into the home currency. Given this expectation, the best decision may be not to hedge at all. (The<br />
operative word is “may”; many companies hedge anyway unless management is convinced the<br />
foreign currency will strengthen.) Porsche has profited by (correctly) betting on a weak dollar.<br />
External hedging methods for managing both transaction and translation exposure require<br />
companies to participate in the foreign currency market. Specific hedging tools include forward<br />
contracts and currency options. Internal hedging methods include price adjustment clauses and<br />
intra-corporate borrowing or lending in foreign currencies. The forward market is a mechanism<br />
for buying and selling currencies at a preset price for future delivery. If it is known that a certain<br />
amount of foreign currency is going to be paid out or received at some future date, a company<br />
can insure itself against exchange loss by buying or selling forward. With a forward contract, the<br />
company can lock in a specific fixed exchange rate for a future date and thus immunize itself<br />
from the loss (or gain) caused by the exchange rate fluctuation. By consulting sources such as<br />
Financial Times, The Wall Street Journal, or www.ozforex.com, it is possible to determine<br />
exchange rates on any given day. In addition to spot prices, 30-, 60-, and 180-day forward prices<br />
are quoted for dozens of world currencies.<br />
Companies use the forward market when the currency exposure is known in advance (e.g.,<br />
when a firm contract of sale exists). In some situations, however, companies are not certain about<br />
the future foreign currency cash inflow or outflow. Consider the risk exposure of a U.S. company<br />
that bids for a foreign project but won’t know if the project will be granted until sometime later.<br />
The company needs to protect the dollar value of the contract by hedging the potential foreign<br />
currency cash inflow that will be generated if the company turns out to be the winning bidder. In<br />
such an instance, forward contracts are not the appropriate hedging tool.<br />
A foreign currency option is best for such situations. A put option gives the buyer the<br />
right, not the obligation, to sell a specified number of foreign currency units at a fixed price, up<br />
to the option’s expiration date. (Conversely, a call option is the right, but not the obligation, to<br />
buy the foreign currency.) In the example of bidding the foreign project, the company can take<br />
out a put option to sell the foreign currency for dollars at a set price in the future. In other<br />
words, the U.S. company locks in the value of the contract in dollars. Thus, if the project is<br />
granted, the future foreign currency cash inflow has been hedged by means of the put option. If<br />
the project is not granted, the company can trade the put option in the options market without<br />
exercising it; remember, options are rights, not obligations. The only money the company<br />
stands to lose is the difference between what it paid for the option and what it receives upon<br />
selling it.<br />
Financial officers of global firms can avoid economic exposure altogether by demanding a<br />
particular currency as the payment for its foreign sales. As noted, a U.S-based company might<br />
demand U.S. dollars as the payment currency for its foreign sales. This, however, does not eliminate<br />
currency risk; it simply shifts that risk to the customers. In common practice, companies<br />
typically attempt to invoice exports (receivables) in strong currencies and imports (payables) in<br />
weak currencies. However, in today’s highly competitive world market, such practice may<br />
reduce a company’s competitive edge.<br />
The economic environment is a major determinant of global market potential and opportunity. In<br />
today’s global economy, capital movements are the key driving force, production has become<br />
uncoupled from employment, and capitalism has vanquished communism. Based on patterns of<br />
resource allocation and ownership, the world’s national economies can be categorized as market<br />
capitalism, centrally planned capitalism, centrally planned socialism, and market<br />
socialism. The final years of the twentieth century were marked by a transition toward market<br />
capitalism in many countries that had been centrally controlled. However, there still exists a great<br />
disparity among the nations of the world in terms of economic freedom.<br />
Countries can be categorized in terms of their stage of economic development: low<br />
income, lower-middle income, upper-middle income, and high income. Gross domestic<br />
product (GDP) and gross national income (GNI) are commonly used measures of economic<br />
development. The 50 poorest countries in the low-income category are sometimes referred to<br />
<strong>Global</strong> <strong>Marketing</strong>, Sixth Edition, by Warren J. Keegan and Mark C. Green. Copyright © 2011 by Warren J. Keegan. Published by Prentice Hall.<br />
000200010270740623
000200010270740623<br />
Discussion Questions<br />
CHAPTER 2 • THE GLOBAL ECONOMIC ENVIRONMENT 67<br />
as least-developed countries (LDCs). Upper-middle-income countries with high growth rates<br />
are often called newly industrializing economies (NIEs). Several of the world’s economies<br />
are notable for their fast growth; the BRIC nations include Brazil (lower-middle income),<br />
Russia (upper-middle-income), India (low income), and China (lower-middle income). The<br />
Group of Seven (G-7), Group of Eight (G-8), and Organization for Economic<br />
Cooperation and Development (OECD) represent efforts by high-income nations to promote<br />
democratic ideals and free-market policies throughout the rest of the world. Most of the<br />
world’s income is located in the Triad, which is comprised of Japan, the United States, and<br />
Western Europe. Companies with global aspirations generally have operations in all three<br />
areas. Market potential for a product can be evaluated by determining product saturation levels<br />
in light of income levels.<br />
A country’s balance of payments is a record of its economic transactions with the rest of<br />
the world; this record shows whether a country has a trade surplus (value of exports exceeds<br />
value of imports) or a trade deficit (value of imports exceeds value of exports). Trade figures can<br />
be further divided into merchandise trade and services trade accounts; a country can run a<br />
surplus in both accounts, a deficit in both accounts, or a combination of the two. The U.S.<br />
merchandise trade deficit was $819 billion in 2007. However, the United States enjoys an annual<br />
service trade surplus. Overall, the United States is a debtor; Japan enjoys an overall trade surplus<br />
and serves as a creditor nation.<br />
Foreign exchange provides a means for settling accounts across borders. The dynamics of<br />
international finance can have a significant impact on a nation’s economy as well as the fortunes<br />
of individual companies. Currencies can be subject to devaluation or revaluation as a result of<br />
actions taken by a country’s central banker. Currency trading by international speculators can<br />
also lead to devaluation. When a country’s economy is strong or when demand for its goods is<br />
high, its currency tends to appreciate in value. When currency values fluctuate, global firms face<br />
various types of economic exposure. Firms can manage exchange rate exposure by hedging.<br />
1. Explain the difference between market capitalism, centrally planned capitalism, centrally<br />
planned socialism, and market socialism. Give an example of a country that illustrates each<br />
type of system.<br />
2. The seven criteria for describing a nation’s economy introduced at the beginning of this<br />
chapter can be combined in a number of different ways. For example, the United States can<br />
be characterized as follows:<br />
� Type of economy: Advanced industrial state<br />
� Type of government: Democracy with a multi-party system<br />
� Trade and capital flows: Incomplete free trade and part of trading bloc<br />
� The commanding heights: Mix of state and private ownership<br />
� Services provided by the state and funded through taxes: Pensions and education but<br />
not health care<br />
� Institutions: Transparency, standards, corruption is absent, a free press and strong courts<br />
� Markets: Free market system characterized by high risk/high reward entrepreneurial<br />
dynamism<br />
Use the seven criteria found on pp. 42–43 to develop a profile of one of the BRIC<br />
nations, or any other country that interests you. What implications does this profile have<br />
for marketing opportunities in the country?<br />
3. Why are Brazil, Russia, India, and China (BRIC) highlighted in this chapter? Identify the<br />
current stage of economic development for each BRIC nation.<br />
4. Turn to the Index of Economic Freedom (Table 2-3) and identify where the BRIC nations<br />
are ranked. What does the result tell you in terms of the relevance of the index to global<br />
marketers?<br />
5. The Heritage Foundation’s Index of Economic Freedom is not the only ranking that<br />
assesses countries in terms of successful economic policies. For example, the World<br />
<strong>Global</strong> <strong>Marketing</strong>, Sixth Edition, by Warren J. Keegan and Mark C. Green. Copyright © 2011 by Warren J. Keegan. Published by Prentice Hall.
68 PART 2 • THE GLOBAL MARKETING ENVIRONMENT<br />
Economic Forum (WEF; www.weforum.org) publishes an annual <strong>Global</strong> Competitiveness<br />
Report; in the 2006–2007 report, the United States ranks in sixth place according to the<br />
WEF’s metrics. By contrast, Sweden is in third place. According to the Index of<br />
Economic Freedom’s rankings, the United States and Sweden are in sixth and twentysixth<br />
place, respectively. Why are the rankings so different? What criteria does each index<br />
consider?<br />
6. When the first edition of this textbook was published in 1996, the World Bank defined “lowincome<br />
country” as one with per capita income of less than $501. In 2003, when the third<br />
edition of <strong>Global</strong> <strong>Marketing</strong> appeared, “low income” was defined as $785 or less in per capita<br />
income. As shown in Table 2-4 of this chapter, $935 is the current “low income” threshold.<br />
The other stages of development have been revised in a similar manner. How do you explain<br />
the upward trend in the definition of income categories during the past 15 years?<br />
7. A manufacturer of satellite dishes is assessing the world market potential for his products.<br />
He asks you if he should consider developing countries as potential markets. How would<br />
you advise him?<br />
8. A friend is distressed to learn that America’s merchandise trade deficit hit $819 billion in<br />
2007. You want to cheer your friend up by demonstrating that the trade picture is not as<br />
bleak as it sounds. What do you say?<br />
<strong>Global</strong> <strong>Marketing</strong>, Sixth Edition, by Warren J. Keegan and Mark C. Green. Copyright © 2011 by Warren J. Keegan. Published by Prentice Hall.<br />
000200010270740623
000200010270740623<br />
Case 2-1 Continued (refer to page 38)<br />
The <strong>Global</strong> Economic Crisis: The Assignment<br />
Singapore and the Philippines rely heavily on exports of electronics.<br />
As U.S. consumer spending slowed in 2007–2008, exports<br />
from these nations began to slump. Moreover, Singapore’s<br />
ambitious goal to reinvent itself as a regional financial and entertainment<br />
destination had attracted a massive influx of bankers,<br />
lawyers, and other professionals from all over the world. The<br />
resulting housing boom turned out to be short-lived; with the<br />
global economic crisis deepening, thousands of foreign workers<br />
departed and Singapore’s real estate market collapsed<br />
By contrast, Indonesia, Malaysia, and Thailand were experiencing<br />
strong demand for exports of crude oil, natural gas, and other<br />
commodities. Thailand and Malaysia are key sources of palm oil,<br />
which can be used both for cooking and as a biodiesel fuel. Who<br />
was buying? Simply put, China’s booming economy continued to<br />
exhibit strong demand.<br />
Japan, the world’s second-largest economy, became less<br />
dependent on exports to the United States during the first decade<br />
of the twenty-first century. Although Europe and the United States<br />
were still key markets for HDTVs and luxury cars, a weak yen and<br />
strong demand in emerging markets for Japanese-built machine<br />
tools and construction equipment meant that companies such as<br />
Komatsu booked increased sales to China and Southeast Asia that<br />
offset slowing sales elsewhere.<br />
However, the weak yen also meant that many Japanese<br />
manufacturers operated production facilities at home rather than<br />
shifting production abroad. For example, Sharp manufactured all<br />
the display panels for its LCD TVs in Japan. However, as the yen<br />
strengthened from 123¥ to $1 in July 2007 to about 100¥ to<br />
$1 over the next 18 months, exports declined sharply. As Sharp’s<br />
CFO said early in 2009, “The past way of using our own money to<br />
build all our factories in Japan and exporting to overseas markets is<br />
something that we have to rethink.”<br />
The ripple effect from the global recession was felt especially<br />
strongly in Canada, America’s top trading partner. As the U.S.<br />
housing market collapsed, exports of Canadian hardwood fell.<br />
With U.S. homeowners feeling pinched and credit terms tightening,<br />
auto sales took a nosedive. GM, Ford, and Chrysler announced<br />
production slowdowns in their Canadian assembly plants; however,<br />
industry observers noted that it was small auto parts makers<br />
in Ontario and elsewhere that would be particularly vulnerable.<br />
The pain is being felt in other industry sectors as well. Nortel<br />
Networks, once the most valuable company listed on the Toronto<br />
Stock Exchange, filed for bankruptcy. Accounting scandals diverted<br />
management’s attention while aggressive competitors and new<br />
technologies changed the industry landscape.<br />
Compounding Canada’s problem was the fact that its currency,<br />
the “loonie,” had strengthened considerably against the<br />
U.S. dollar. That meant that auto parts shipped to the United<br />
States—$18.1 billion worth in 2007—were more expensive. Not<br />
surprisingly, many Canadian firms are diversifying geographically<br />
to reduce their dependence on the U.S. market. For example,<br />
Samco Machinery, an automotive equipment maker, has won<br />
orders from India’s Tata Motors. Samco sells 20-ton machines that<br />
represent cutting-edge metal-bending technology.<br />
Europe’s economy was also mired in recession; some observers<br />
noted that the lack of ambitious stimulus proposals in the region<br />
meant that a recovery would take more time than in the United<br />
States or Asia. As in other parts of the world, credit restrictions<br />
and tighter lending policies meant that it was harder for retailers<br />
and distributors to finance inventories.<br />
As the economic crisis deepened in the fall of 2008, world<br />
leaders offered a variety of perspectives and proposals. Some<br />
denounced “American-style capitalism” at the annual General<br />
Assembly meeting at the United Nations. French president Nicolas<br />
Sarkozy called for greater oversight of the global financial system.<br />
“Let us rebuild together a regulated capitalism in which whole<br />
swatches of financial activity are not left to the sole judgment of<br />
market operators,” he said. Brazilian president Luiz Inácio Lula da<br />
Silva, a former labor leader, called for the global community to create<br />
a new foundation for the world economic system that would<br />
prevent abuses and shrink the gap between the rich and poor.<br />
Mahmoud Ahmadinejad, president of Iran, told the Assembly that<br />
the financial crisis was a sign that the American empire is “reaching<br />
the end of its road.”<br />
Case 2-1 Discussion Questions<br />
1. Does the global economic crisis signal that the American<br />
model of free market capitalism is fundamentally flawed?<br />
2. Policymakers in Japan, the world’s second-largest economy,<br />
must transition their nation away from a manufacturingdependent<br />
model for growth. What industry sectors might<br />
emerge as the new drivers of economic growth?<br />
3. Do you think that the economic stimulus programs in the<br />
United States, Asia, and elsewhere are the right approach to<br />
pulling the world out of recession?<br />
Sources: Yuka Hayashi and John Murphy, “As Factories Vanish, Japan Seeks<br />
to Fashion a New Economy,” The Wall Street Journal (April 14, 2009), p. A8;<br />
Jason Dean and Marcus Walker, “Crisis Stirs Critics of Free Markets,” The<br />
Wall Street Journal (September 25, 2008), p. A3; Jay Solomon, “Leaders<br />
Seek <strong>Global</strong> Response to Financial Crisis,” The Wall Street Journal<br />
(September 24, 2008), p. A10; James Hookway, “Commodities Exporters<br />
Look to China for Growth as the West Sags,” The Wall Street Journal (June 5,<br />
2008), p. A12; Marcus Walker, James Hookway, John Lyons, and James T.<br />
Areddy, “U.S. Slump Takes Toll Across Globe,” The Wall Street Journal<br />
(April 3, 2008), pp. A1, A13; David J. Lynch, “Woe, Canada: Catching<br />
Canada’s Economic Chill,” USA Today (February 26, 2008), p. 1B; Peter S.<br />
Goodman, “Trading Partners Fear U.S. Consumers Won’t Continue Free-<br />
Spending Ways,” The New York Times (January 25, 2008), pp. C1, C4; Keith<br />
Bradsher, “Throughout Asia, Exporters Brace for Tremors from a U.S.<br />
Pullback,” (January 25, 2008), pp. C1, C4.<br />
<strong>Global</strong> <strong>Marketing</strong>, Sixth Edition, by Warren J. Keegan and Mark C. Green. Copyright © 2011 by Warren J. Keegan. Published by Prentice Hall.<br />
69
70<br />
Case 2-2<br />
One Laptop Per Child<br />
As director of the prestigious Media Lab at the Massachusetts<br />
Institute of Technology (MIT), Nicolas Negroponte had a unique<br />
opportunity to immerse himself in cutting-edge technology development<br />
projects. Robotic design, artificial intelligence, holographic<br />
video, and educational applications for PCs were just some of the<br />
areas the Lab’s various departments explored. In 2005, after<br />
20 years at the Lab, Negroponte announced he was leaving to<br />
pursue an ambitious vision: bridging the digital divide between<br />
developed and developing nations by providing powerful PCs to<br />
schoolchildren in sub-Saharan Africa and other impoverished parts<br />
of the world. Negroponte named his initiative One Laptop Per<br />
Child (OLPC); his goal was to develop a $100 laptop that governments<br />
could buy in large quantities and distribute to schools. As<br />
Negroponte said, “My goal is not selling laptops. OLPC is not in<br />
the laptop business. It’s in the education business.” In April 2007,<br />
Negroponte announced that he hoped to have between 50 and<br />
150 million children using the new computer by the end of 2008.<br />
“We do not view kids as a market, but as a mission.”<br />
Nicolas Negroponte, founder OLPC<br />
The OLPC design team, which included Media Lab veteran<br />
Walter Bender, created a computer known as the XO that is<br />
rugged enough to stand up to heavy use and abuse. The XO is<br />
dust- and waterproof; a small solar panel can be used to recharge<br />
the battery. The laptop’s high-resolution screen displays bright<br />
images even in sunlight; other features include a built-in video<br />
camera. Wi-Fi connectivity is provided by two small antennas on<br />
either side of the screen; some observers have commented that the<br />
antennas look like ears on a friendly alien-type creature.<br />
To keep the cost down, each computer is loaded with an<br />
open-source operating system known as Linux. Linux is nonproprietary;<br />
that is, it is available for free to anyone who wants to<br />
use it. Moreover, Linux users are encouraged to make improvements<br />
to it. The user interface, dubbed Sugar, can also be modified<br />
by the children using the computers. As described by its creators,<br />
Sugar captures students’ “world of fellow learners and teachers as<br />
collaborators, emphasizing the connections within the community,<br />
among people, and their activities.” The design team believes that<br />
Linux and Sugar will foster collaborative learning among schoolchildren,<br />
in line with OLPC’s core mission. The laptops are powered<br />
by microprocessors from Advanced Micro Devices (AMD); these<br />
cost less than components from Intel.<br />
Another factor affecting the final cost is the volume of production.<br />
Negroponte needs firm purchase commitments so that production<br />
can be scaled up quickly. Government officials in Libya and<br />
Nigeria pledged to buy about one million computers each for their<br />
respective citizens; however, by mid-2007 both countries had<br />
backed off those pledges. As a result, the manufacturer, Taiwan’s<br />
Quanta Computer, only achieved an initial production volume of<br />
300,000 units. The lower volume, plus microprocessor upgrades,<br />
translated into a higher per-unit cost. The $100 price—a key<br />
selling point—would have to be abandoned. The new price target<br />
would be in the $180 to $190 range.<br />
The higher price was one reason that initial enthusiasm for<br />
OLPC did not translate into firm commitments for orders. Other<br />
issues surfaced as well. For example, some potential buyers<br />
worried about the lack of Microsoft’s Windows operating system.<br />
Meanwhile, OLPC had attracted the attention of several industry<br />
heavyweights. In 2006, Intel officials demonstrated a laptop prototype<br />
called the Classmate that was designed to sell for $230 to<br />
$300. The Classmate features Microsoft’s Windows XP operating<br />
system, has four hours of battery life, and uses a solid-state flash<br />
drive. In 2007, Microsoft chairman Bill Gates announced that his<br />
company would offer developing countries a $3 software package<br />
that includes Windows, Office, and educational software. The<br />
low-priced software was offered through Unlimited Potential<br />
Group, the Microsoft unit that targets developing countries; early<br />
customers included the governments of Libya and Egypt.<br />
Negroponte accused Intel officials of trying to undermine his<br />
nonprofit’s efforts; for example, reports surfaced that Intel’s sales<br />
force had made head-to-head comparisons between the Classmate<br />
and the OLPC laptop during presentations in Mongolia and Nigeria.<br />
Even so, Intel made a substantial financial contribution to OLPC and<br />
an Intel official joined the organization’s board.<br />
In November 2007, in an effort to increase production, OLPC<br />
announced a promotion called “Give One. Get One.” Consumers<br />
in the United States and Canada were offered the opportunity to<br />
buy two OLPC computers for $399. Each buyer would keep one<br />
laptop; the second would go to a student in Haiti or another developing<br />
country.<br />
Nicolas Negroponte has travelled the globe promoting his One Laptop<br />
Per Child initiative.<br />
Source: William B. Plowman/AP Wide World Photos.<br />
<strong>Global</strong> <strong>Marketing</strong>, Sixth Edition, by Warren J. Keegan and Mark C. Green. Copyright © 2011 by Warren J. Keegan. Published by Prentice Hall.<br />
000200010270740623
000200010270740623<br />
In 2008, faced with disappointing sales, Negroponte struck a<br />
deal with Microsoft. Starting in 2010, the OLPC laptops would be<br />
delivered with both the Microsoft Windows operating system and<br />
the nonproprietary Linux OS. Microsoft would provide the software<br />
for about $3 per computer, bringing the total selling price of<br />
each laptop to $199.<br />
Discussion Questions<br />
1. Why are Microsoft, Intel, and other leading for-profit companies<br />
interested in low-cost computers for the developing world?<br />
2. Do you agree with Negroponte’s decision to partner with<br />
Microsoft?<br />
Case 2-3<br />
From Communism to Capitalism: Vietnam’s Economic Transformation<br />
In October 2001, U.S. President George Bush signed an agreement<br />
that created a U.S.–Vietnam free trade area. The signing<br />
marked yet another milestone along Vietnam’s path toward a<br />
more open market, the timeline for which includes the following:<br />
� In February 1994, U.S. President Bill Clinton ended America’s<br />
19-year economic embargo of Vietnam and opened the door<br />
for U.S. companies to target the world’s twelfth most populous<br />
country.<br />
� In July 1995, President Clinton reestablished diplomatic relations<br />
with Vietnam. In the absence of diplomatic relations,<br />
many Vietnamese manufactured exports to the United States<br />
faced prohibitive tariffs.<br />
� In 1995, Vietnam joined the Association of Southeast Asian<br />
Nations (ASEAN).<br />
� In 1998, the White House announced that it would exempt<br />
Vietnam from the Jackson-Vanik amendment. The exemption<br />
meant that, pending congressional approval, American<br />
companies investing in Vietnam could apply for financial<br />
assistance from the Overseas Private Investment Corporation<br />
(OPIC) and the Export-Import Bank.<br />
� In July 2000, U.S. President Bill Clinton signed a trade pact<br />
with Vietnam.<br />
� The Asia-Pacific Economic Cooperation (APEC) Summit was<br />
held in Hanoi in November 2006.<br />
� Vietnam joined the World Trade Organization in 2007.<br />
After being ratified by Congress, President Clinton’s actions in<br />
the mid-1990s established normal trading relations (NTR) between<br />
the two countries. In particular, Vietnam benefited from an immediate<br />
lowering of duties on a number of goods produced by its<br />
light industry sector (see Figure 1). Vietnamese tariffs and quotas<br />
on imports from the United States would be lowered more gradually.<br />
U.S. companies immediately seized the opportunity. As Brian<br />
Watson, a Hong Kong–based deputy regional director for the<br />
McCann-Erickson advertising agency, said in the mid-1990s,<br />
“Vietnam is the next great frontier. There is an enormous amount<br />
of interest among clients. Every meeting starts with a question<br />
about going into Vietnam.”<br />
3. Assess the thinking behind the “give one, get one” promotion.<br />
Do you think this is a good marketing tactic?<br />
Sources: Steve Stecklow, “Laptop Program for Kids in Poor Countries Teams<br />
Up with Microsoft’s Windows,” The Wall Street Journal (May 16, 2008),<br />
pp. B1, B2; Steve Stecklow and James Bandler, “A Little Laptop with Big<br />
Ambitions: How a Computer for the Poor Got Stomped by Tech Giants,” The<br />
Wall Street Journal (November 24–25, 2007), pp. A1, A7; David Pogue,<br />
“$100 Laptop a Bargain at $200,” The New York Times (October 4, 2007),<br />
pp. C1, C8; Kevin Maney, “The Latest Cool Tool You Can’t Have: Laptops<br />
So Cheap They’re Disposable,” USA Today (February 28, 2007), p. B8; John<br />
Markoff, “At Davos, the Squabble Resumes on How to Wire the Third<br />
World,” The New York Times (January 29, 2007), pp. C1, C2.<br />
Duty Rates (%)<br />
75<br />
70<br />
65<br />
60<br />
55<br />
50<br />
45<br />
40<br />
35<br />
30<br />
25<br />
20<br />
15<br />
10<br />
5<br />
0<br />
70%<br />
6.8%<br />
Toys<br />
With NTR<br />
Without NTR<br />
8.4%<br />
60%<br />
Artificial<br />
flowers<br />
Exports<br />
35% 35%<br />
16.9%<br />
10.5%<br />
Clothing Sport<br />
shoes<br />
FIGURE 1<br />
Duty Rates on Vietnamese Exports<br />
to the United States with and<br />
Without NTR<br />
Source: Based on Vietnam Economic Times.<br />
While the U.S. business community hailed Washington’s initiatives,<br />
many American firms found themselves playing catch up;<br />
by the early 1990s, many non-U.S. global companies had preceded<br />
the Americans into Vietnam. For example, South Korean industrial<br />
giant Daewoo was a key investor; other companies with major<br />
commitments included Sony, Toshiba, Honda, Peugeot, and British<br />
Petroleum. Carrier was among the first U.S. companies to legally<br />
market in Vietnam in 1994; the company’s window air conditioners<br />
appeared in stores in Hanoi and Ho Chi Minh City. Gillette<br />
<strong>Global</strong> <strong>Marketing</strong>, Sixth Edition, by Warren J. Keegan and Mark C. Green. Copyright © 2011 by Warren J. Keegan. Published by Prentice Hall.<br />
71
Source: Vietnam Embassy.<br />
began shipping razor blades and disposable razors, and AT&T<br />
began selling home and office telephone products through a<br />
distributor in Taiwan. Mobil began exploring for oil, Caterpillar set<br />
up equipment-leasing operations, and the Otis Elevator division of<br />
United Technologies joined in the construction boom. J. Walter<br />
72<br />
LAOS<br />
THAILAND<br />
Gulf of<br />
Thailand<br />
Hanoi<br />
Mekong R.<br />
0 Miles 200<br />
CHINA<br />
Gulf of<br />
Tonkin<br />
HAINAN<br />
Hue South<br />
China Sea<br />
VIETNAM<br />
CAMBODIA<br />
Ho Chi<br />
Minh City<br />
(Saigon)<br />
Vung Tau<br />
Thompson, Ogilvy & Mather, and Backer Spielvogel Bates<br />
Worldwide became the first Western ad agencies to open liaison<br />
offices in Vietnam.<br />
Considering that 60 percent of Vietnam’s population is under<br />
the age of 25, it is no surprise that PepsiCo and the Coca-Cola<br />
Company also responded proactively to the new market opportunity.<br />
At the time of the official announcement about ending the<br />
embargo, McCann-Erickson had already produced a TV commercial<br />
for Coca-Cola that included the global slogan “Always”; likewise,<br />
Ogilvy & Mather had a Pepsi ad ready for TV. Coca-Cola announced<br />
plans for a $20 million bottling plant outside of Hanoi, but was<br />
denied permission to build in Ho Chi Minh City (formerly Saigon).<br />
Pepsi’s joint venture with a Vietnamese firm in Ho Chi Minh City is<br />
bottling Pepsi; local production began within hours of President<br />
Clinton’s 1994 announcement. To supply the market in the south,<br />
Coca-Cola imported canned soda from Singapore. For a short period<br />
of time, a can of Coke cost twice as much as a bottle of Pepsi.<br />
Experts agree that the Vietnamese market holds tremendous<br />
potential over the long term. It may be two decades before Vietnam<br />
reaches the level of economic development found in Thailand today.<br />
Meanwhile, the country’s location in the heart of Asia and the<br />
presence of an ample low-wage workforce are powerful magnets<br />
for foreign companies. By the end of 1999, France ranked first in<br />
foreign investment while Japan was the top trading partner. Overall<br />
foreign direct investment peaked at about $3.1 billion in 1997 after<br />
rising steadily since the early 1990s (see Figure 2). After falling to<br />
about $2.1 billion in 1999, investment rebounded to $2.3 billion in<br />
2002. As encouraging as those figures are, however, investment<br />
levels in China are much higher.<br />
There are still many challenges for companies seeking to invest<br />
in Vietnam. The population is very poor, with 2006 annual per<br />
capita GNI of only about $700. However, urbanites with savings<br />
estimated at $1 to $2 billion comprise one quarter of the population.<br />
The infrastructure is undeveloped: Only 10 percent of roads<br />
are paved, electricity sources are unreliable, there is less than one<br />
telephone per 100 people, and the banking system is undeveloped.<br />
The Communist Party of Vietnam (CPV) is struggling to<br />
adapt to the principles of a market economy, and the layers of<br />
bureaucracy built up over decades of communist rule slow the<br />
pace of change. A key agency is the State Committee for<br />
Cooperation and Investment (SCCI); as Vu Tien Phuc, a deputy<br />
director of the agency, explained, “Every authority would like to<br />
have the last say. We have to improve the investment climate.”<br />
William Ratliff, an analyst with the Hoover Institute, points out that<br />
the question for Vietnam is “whether it’s possible to carry on freemarket<br />
reforms and maintain absolute political power.”<br />
Yvonne Gupwell, a business consultant who was born in<br />
Vietnam, believes that “The biggest mistake companies make is they<br />
think because the Vietnamese are so polite, they’re a little bit dim.<br />
The Vietnamese are poor, but they are not mentally poor at all.”<br />
Statistics support this view; for example, adult literacy is nearly<br />
$3 billion<br />
2<br />
1<br />
0<br />
'92 '93 '94 '95 '96 '97 '98 '99 '00 '01 '02<br />
FIGURE 2<br />
Foreign Direct Investment in<br />
Vietnam, 1992–2002<br />
<strong>Global</strong> <strong>Marketing</strong>, Sixth Edition, by Warren J. Keegan and Mark C. Green. Copyright © 2011 by Warren J. Keegan. Published by Prentice Hall.<br />
000200010270740623
000200010270740623<br />
90 percent. In fact, an emerging entrepreneurial class has developed<br />
a taste for expensive products such as Nikon cameras and Ray-Ban<br />
sunglasses, both of which are available in stores. Notes Do Duc Dinh<br />
of the Institute on the World Economy, “There is a huge unofficial<br />
economy. For most people, we can live only 5 days or 10 days a<br />
month on our salary. But people build houses. Where does the<br />
money come from? Even in government ministries, there are two<br />
sets of books—one for the official money and one for unofficial.”<br />
“In 1996, you were told where to invest, and you also had<br />
to build the road, the school, the hospital. You said, ‘Thank<br />
you very much; my new address is Malaysia.’“<br />
A foreign businessman in Vietnam<br />
Euphoria over Vietnam’s potential showed signs of waning at<br />
the end of the 1990s. Part of the problem was the “currency contagion”<br />
that struck Asia in mid-1997; Asian countries that had<br />
been major investors were forced to scale back their activities in<br />
Vietnam. More generally, many companies were finding it difficult<br />
to make a profit. Cross-border smuggling from Thailand depressed<br />
legitimate sales of products produced locally by Procter & Gamble,<br />
Unilever, American Standard, and other companies. Foreign companies<br />
were also frustrated by the shallow pool of qualified local<br />
managers. It was also clear that China was attracting a great deal<br />
of foreign investment away from other countries in the region.<br />
Today, many companies are discovering that Vietnam is an<br />
excellent source of low-cost labor. Burgeoning apparel and textile<br />
exports to the United States led to an agreement on export quotas<br />
in 2003. The fledgling tech sector also appears to hold great<br />
promise. Vietnam’s universities turn out graduates who are highly<br />
trained in information technology. One company, Glass Egg Digital<br />
Media, provides software-writing services to leading global videogame<br />
developers such as France’s Infogames and U.S.-based<br />
Electronic Arts. Glass Egg founder Phil Tran pays programmers<br />
annual salaries of about $4,000, tens of thousands less than programmers<br />
in the United States are paid.<br />
Although still strongly influenced by Communist hard-liners, the<br />
bureaucrats in Hanoi have demonstrated an increased willingness to<br />
adopt much-needed reforms to foreign investment laws. In January<br />
2000, for example, the regulatory environment improved with the<br />
enactment of an enterprise law that streamlined the process of<br />
market entry and setting up a business; a stock market was also<br />
opened. Increasingly, decisions about foreign investment are being<br />
made at the provincial level, and local officials are offering incentives<br />
and issuing import licenses more quickly. Investors in many industry<br />
sectors are now able to set up wholly foreign-owned firms; previously,<br />
the government rarely approved such arrangements. Instead, foreign<br />
companies were encouraged to form joint ventures with state-owned<br />
enterprises. The improved investment climate helps explain why a<br />
number of foreign carmakers, including Ford, GM, and Toyota, have<br />
established operations in Vietnam. Noted one local businessman<br />
approvingly, “In the past, it was absolutely horrendous to set up a<br />
private company. Now 99 percent of the difficulties are gone.”<br />
“The reform is definitely irreversible. Any attempt to come<br />
back to a centrally planned economy, to overplay the state<br />
sector, is economically irrational, inefficient and,<br />
psychologically, is counterproductive.”<br />
Le Dang Doanh, advisor to the government of Vietnam<br />
Vietnam’s free trade area agreement with the United States<br />
entered into force in December 2001. The effect was immediate: The<br />
value of U.S. imports from Vietnam more than doubled in 2002, to<br />
nearly $2.4 billion. At the end of 2003, the two nations signed an air<br />
services agreement that made it easy for travelers to book flights to<br />
Vietnam. The agreement came as Vietnam’s government began<br />
marketing the country as an attractive vacation destination. Despite<br />
such positive news, however, many problems remain. For example,<br />
Vietnam’s legal system is still bewildering, and regulations can<br />
change on a moment’s notice. Relations between the new trading<br />
partners have shown some signs of strain, as evidenced by U.S.<br />
charges that Vietnam has been dumping catfish in the U.S. market at<br />
artificially low prices.<br />
Visit the Web site<br />
www.vietnam-ustrade.org<br />
Discussion Questions<br />
1. Assess the market opportunities in Vietnam for both<br />
consumer products companies and industrial-products<br />
companies. What is the nature of the opportunity?<br />
2. Nike and several other well-known American companies are<br />
sourcing some of their production in Vietnam, thereby taking<br />
advantage of a labor force that is paid the equivalent of $2<br />
per day or less. Are goods labeled “Made in Vietnam” likely<br />
to find widespread acceptance among American consumers?<br />
3. Some critics have argued that Cuba is more deserving of diplomatic<br />
and trade relations with the United States than Vietnam.<br />
What are some of the factors behind this argument?<br />
An excellent video overview is found in “Visions of a New<br />
Vietnam.” The program was originally aired on the Nightly<br />
Business Report; we recommend viewing the DVD in conjunction<br />
with the case discussion.<br />
Sources: Keith Bradsher, “Vietnam’s Roaring Economy Is Set for World<br />
Stage,” The New York Times (October 25, 2006), pp. A1, C4; Joseph Erlich,<br />
“Vietnam’s Trade-War Wounds,” The Wall Street Journal (August 26, 2005),<br />
p. A10; Dan Reed, “Ex-Enemies Make a Deal,” USA Today (December 9,<br />
2003), p. 5B; Reginald Chua and Margot Cohen, “Vietnamese Tiger Growls<br />
Again; Investors Want a Change of Stripes,” The Wall Street Journal (March<br />
13, 2003), p. A10; Margot Cohen, “Foreign Investors Take New Look at<br />
Vietnam and Like What They See,” The Wall Street Journal (January 28,<br />
2003), p. A14; Amy Kamzin, “Vietnam’s Change of Heart,” Financial Times<br />
(August 28, 2002), p. 13; Bruce Knecht, “Vietnam Taps Videogame Talent,”<br />
The New York Times (October 21, 2001), p. B5; Frederik Balfour, “Back on<br />
the Radar Screen,” Business Week (November 20, 2000), pp. 56–57; Wayne<br />
Arnold, “Clearing the Decks for a Trade Pact’s Riches,” The New York Times<br />
(August 27, 2000), sec. 3, pp. 1, 12; Samantha Marshall, “Vietnam Pullout:<br />
This Time, Investors Pack Up Gear, Stymied by Bureaucracy, Lack of<br />
Reforms,” The Wall Street Journal (June 30, 1998), p. A15; Marshall, “P&G<br />
Squabbles with Vietnamese Partner,” The Wall Street Journal (February 27,<br />
1998), p. A10; Reginald Chua, “Vietnam Frustrates Foreign Investors as<br />
Leaders Waffle on Market Economy,” The Wall Street Journal (November<br />
25, 1996), p. A10; “Vietnam,” The Economist (July 8, 1995), pp. 1–18 (survey);<br />
William J. Ardrey, Anthony Pecotich, and Clifford J. Schultz,<br />
“American Involvement in Vietnam, Part II: Prospects for U.S. Business in a<br />
New Era,” Business Horizons 38 (March/April 1995), pp. 21–27; Edward A.<br />
Gargan, “For U.S. Business, a Hard Road to Vietnam,” The New York Times<br />
(July 14, 1995), p. C1; Marilyn Greene, “Very Soon, Vietnam Will Be Very<br />
Good,” USA Today (April 1, 1994), p. 8A; Robert Keatley, “Vietnam,<br />
Despite Promise, Faces Climb,” The Wall Street Journal (August 18, 1994),<br />
p. A8; Philip Shenon, “Vietnam: Behind a Red-Tape Curtain,” The New York<br />
Times (November 13, 1994), sec. 3, p. 6; James Cox, “Vietnamese Look<br />
Forward to Trade, Jobs,” USA Today (July 12, 1995), pp. 1A, 2A; Kevin<br />
Goldman, “Agencies Get Ready for Vietnam Business,” The Wall Street<br />
Journal (February 7, 1994), p. B10.<br />
<strong>Global</strong> <strong>Marketing</strong>, Sixth Edition, by Warren J. Keegan and Mark C. Green. Copyright © 2011 by Warren J. Keegan. Published by Prentice Hall.<br />
73