Physiological Basis of the Electrocardiogram
Physiological Basis of the Electrocardiogram
Physiological Basis of the Electrocardiogram

You also want an ePaper? Increase the reach of your titles
YUMPU automatically turns print PDFs into web optimized ePapers that Google loves.
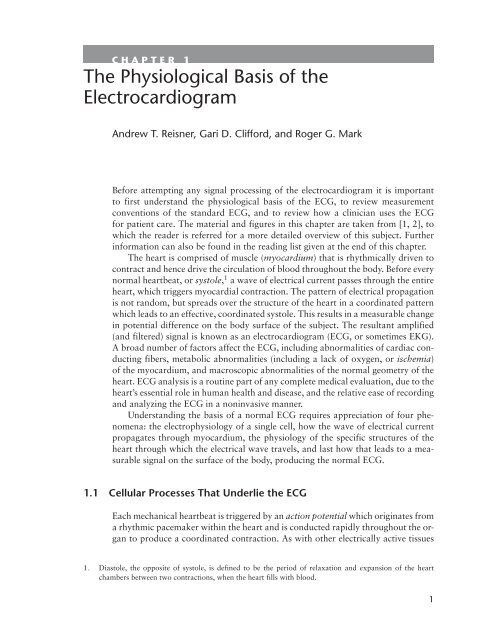
CHAPTER 1<br />
The <strong>Physiological</strong> <strong>Basis</strong> <strong>of</strong> <strong>the</strong><br />
<strong>Electrocardiogram</strong><br />
Andrew T. Reisner, Gari D. Clifford, and Roger G. Mark<br />
Before attempting any signal processing <strong>of</strong> <strong>the</strong> electrocardiogram it is important<br />
to first understand <strong>the</strong> physiological basis <strong>of</strong> <strong>the</strong> ECG, to review measurement<br />
conventions <strong>of</strong> <strong>the</strong> standard ECG, and to review how a clinician uses <strong>the</strong> ECG<br />
for patient care. The material and figures in this chapter are taken from [1, 2], to<br />
which <strong>the</strong> reader is referred for a more detailed overview <strong>of</strong> this subject. Fur<strong>the</strong>r<br />
information can also be found in <strong>the</strong> reading list given at <strong>the</strong> end <strong>of</strong> this chapter.<br />
The heart is comprised <strong>of</strong> muscle (myocardium) that is rhythmically driven to<br />
contract and hence drive <strong>the</strong> circulation <strong>of</strong> blood throughout <strong>the</strong> body. Before every<br />
normal heartbeat, or systole, 1 a wave <strong>of</strong> electrical current passes through <strong>the</strong> entire<br />
heart, which triggers myocardial contraction. The pattern <strong>of</strong> electrical propagation<br />
is not random, but spreads over <strong>the</strong> structure <strong>of</strong> <strong>the</strong> heart in a coordinated pattern<br />
which leads to an effective, coordinated systole. This results in a measurable change<br />
in potential difference on <strong>the</strong> body surface <strong>of</strong> <strong>the</strong> subject. The resultant amplified<br />
(and filtered) signal is known as an electrocardiogram (ECG, or sometimes EKG).<br />
A broad number <strong>of</strong> factors affect <strong>the</strong> ECG, including abnormalities <strong>of</strong> cardiac conducting<br />
fibers, metabolic abnormalities (including a lack <strong>of</strong> oxygen, or ischemia)<br />
<strong>of</strong> <strong>the</strong> myocardium, and macroscopic abnormalities <strong>of</strong> <strong>the</strong> normal geometry <strong>of</strong> <strong>the</strong><br />
heart. ECG analysis is a routine part <strong>of</strong> any complete medical evaluation, due to <strong>the</strong><br />
heart’s essential role in human health and disease, and <strong>the</strong> relative ease <strong>of</strong> recording<br />
and analyzing <strong>the</strong> ECG in a noninvasive manner.<br />
Understanding <strong>the</strong> basis <strong>of</strong> a normal ECG requires appreciation <strong>of</strong> four phenomena:<br />
<strong>the</strong> electrophysiology <strong>of</strong> a single cell, how <strong>the</strong> wave <strong>of</strong> electrical current<br />
propagates through myocardium, <strong>the</strong> physiology <strong>of</strong> <strong>the</strong> specific structures <strong>of</strong> <strong>the</strong><br />
heart through which <strong>the</strong> electrical wave travels, and last how that leads to a measurable<br />
signal on <strong>the</strong> surface <strong>of</strong> <strong>the</strong> body, producing <strong>the</strong> normal ECG.<br />
1.1 Cellular Processes That Underlie <strong>the</strong> ECG<br />
Each mechanical heartbeat is triggered by an action potential which originates from<br />
a rhythmic pacemaker within <strong>the</strong> heart and is conducted rapidly throughout <strong>the</strong> organ<br />
to produce a coordinated contraction. As with o<strong>the</strong>r electrically active tissues<br />
1. Diastole, <strong>the</strong> opposite <strong>of</strong> systole, is defined to be <strong>the</strong> period <strong>of</strong> relaxation and expansion <strong>of</strong> <strong>the</strong> heart<br />
chambers between two contractions, when <strong>the</strong> heart fills with blood.<br />
1
2 The <strong>Physiological</strong> <strong>Basis</strong> <strong>of</strong> <strong>the</strong> <strong>Electrocardiogram</strong><br />
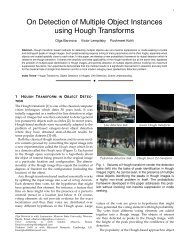
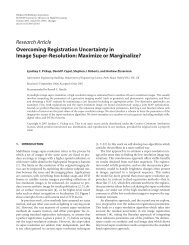
Figure 1.1 A typical action potential from a ventricular myocardial cell. Phases 0 through 4 are<br />
marked. (From: [2]. c○ 2004 MIT OCW. Reprinted with permission.)<br />
(e.g., nerves and skeletal muscle), <strong>the</strong> myocardial cell at rest has a typical transmembrane<br />
potential, V m, <strong>of</strong> about −80 to −90 mV with respect to surrounding<br />
extracellular fluid. 2 The cell membrane controls permeability to a number <strong>of</strong> ions,<br />
including sodium, potassium, calcium, and chloride. These ions pass across <strong>the</strong><br />
membrane through specific ion channels that can open (become activated) and<br />
close (become inactivated). These channels are <strong>the</strong>refore said to be gated channels<br />
and <strong>the</strong>ir opening and closing can occur in response to voltage changes (voltage<br />
gated channels) or through <strong>the</strong> activation <strong>of</strong> receptors (receptor gated channels).<br />
The variation <strong>of</strong> membrane conductance due to <strong>the</strong> opening and closing <strong>of</strong> ion<br />
channels generates changes in <strong>the</strong> transmembrane (action) potential over time. The<br />
time course <strong>of</strong> this potential as it depolarizes and repolarizes is illustrated for a ventricular<br />
cell in Figure 1.1, with <strong>the</strong> five conventional phases (0 through 4) marked.<br />
When cardiac cells are depolarized to a threshold voltage <strong>of</strong> about −70 mV (e.g.,<br />
by ano<strong>the</strong>r conducted action potential), <strong>the</strong>re is a rapid depolarization (phase 0 —<br />
<strong>the</strong> rapid upstroke <strong>of</strong> <strong>the</strong> action potential) that is caused by a transient increase<br />
in fast sodium channel conductance. Phase 1 represents an initial repolarization<br />
that is caused by <strong>the</strong> opening <strong>of</strong> a potassium channel. During phase 2 <strong>the</strong>re is an<br />
approximate balance between inward-going calcium current and outward-going<br />
potassium current, causing a plateau in <strong>the</strong> action potential and a delay in repolarization.<br />
This inward calcium movement is through long-lasting calcium channels<br />
that open up when <strong>the</strong> membrane potential depolarizes to about −40 mV. Repolarization<br />
(phase 3) is a complex process and several mechanisms are thought to<br />
be important. The potassium conductance increases, tending to repolarize <strong>the</strong> cell<br />
via a potassium-mediated outward current. In addition, <strong>the</strong>re is a time-dependent<br />
2. Cardiac potentials may be recorded by means <strong>of</strong> microelectrodes.
1.1 Cellular Processes That Underlie <strong>the</strong> ECG 3<br />
decrease in calcium conductivity which also contributes to cellular repolarization.<br />
Phase 4, <strong>the</strong> resting condition, is characterized by open potassium channels and <strong>the</strong><br />
negative transmembrane potential. After phase 0, <strong>the</strong>re are a parallel set <strong>of</strong> cellular<br />
and molecular processes known as excitation-contraction coupling: <strong>the</strong> cell’s depolarization<br />
leads to high intracellular calcium concentrations, which in turn unlocks<br />
<strong>the</strong> energy-dependent contraction apparatus <strong>of</strong> <strong>the</strong> cell (through a conformational<br />
change <strong>of</strong> <strong>the</strong> troponin protein complex).<br />
Before <strong>the</strong> action potential is propagated, it must be initiated by pacemakers,<br />
cardiac cells that possess <strong>the</strong> property <strong>of</strong> automaticity. That is, <strong>the</strong>y have <strong>the</strong> ability<br />
to spontaneously depolarize, and so function as pacemaker cells for <strong>the</strong> rest <strong>of</strong> <strong>the</strong><br />
heart. Such cells are found in <strong>the</strong> sino-atrial node (SA node), in <strong>the</strong> atrio-ventricular<br />
node (AV node) and in certain specialized conduction systems within <strong>the</strong> atria and<br />
ventricles. 3 In automatic cells, <strong>the</strong> resting (phase 4) potential is not stable, but shows<br />
spontaneous depolarization: its transmembrane potential slowly increases toward<br />
zero due to a trickle <strong>of</strong> sodium and calcium ions entering through <strong>the</strong> pacemaker<br />
cell’s specialized ion channels. When <strong>the</strong> cell’s potential reaches a threshold level,<br />
<strong>the</strong> cell develops an action potential, similar to <strong>the</strong> phase 0 described above, but<br />
mediated by calcium exchange at a much slower rate. Following <strong>the</strong> action potential,<br />
<strong>the</strong> membrane potential returns to <strong>the</strong> resting level and <strong>the</strong> cycle repeats. There are<br />
graded levels <strong>of</strong> automaticity in <strong>the</strong> heart. The intrinsic rate <strong>of</strong> <strong>the</strong> SA node is<br />
highest (about 60 to 100 beats per minute), followed by <strong>the</strong> AV node (about 40 to<br />
50 beats per minute), <strong>the</strong>n <strong>the</strong> ventricular muscle (about 20 to 40 beats per minute).<br />
Under normal operating conditions, <strong>the</strong> SA node determines heart rate, <strong>the</strong> lower<br />
pacemakers being reset during each cardiac cycle. However, in some pathologic<br />
circumstances, <strong>the</strong> rate <strong>of</strong> lower pacemakers can exceed that <strong>of</strong> <strong>the</strong> SA node, and<br />
<strong>the</strong>n <strong>the</strong> lower pacemakers determine overall heart rate. 4<br />
An action potential, once initiated in a cardiac cell, will propagate along <strong>the</strong><br />
cell membrane until <strong>the</strong> entire cell is depolarized. Myocardial cells have <strong>the</strong> unique<br />
property <strong>of</strong> transmitting action potentials from one cell to adjacent cells by means <strong>of</strong><br />
direct current spread (without electrochemical synapses). In fact, until about 1954<br />
<strong>the</strong>re was almost general agreement that <strong>the</strong> myocardium was an actual syncytium<br />
without separate cell boundaries. But <strong>the</strong> electron microscope identified definite cell<br />
membranes, showing that adjacent cells separate. They are tightly coupled, however,<br />
to transmit both tension and electric current from cell to cell. The low-resistance<br />
connections are known as gap junctions. Ionic currents flow from cell to cell via<br />
<strong>the</strong>se intercellular connections, and <strong>the</strong> heart behaves electrically as a functional syncytium.<br />
Thus, an impulse originating anywhere in <strong>the</strong> myocardium will propagate<br />
throughout <strong>the</strong> heart, resulting in a coordinated mechanical contraction. An artificial<br />
cardiac pacemaker, for example, introduces depolarizing electrical impulses via<br />
an electrode ca<strong>the</strong>ter usually placed within <strong>the</strong> right ventricle. Pacemaker-induced<br />
action potentials excite <strong>the</strong> entire ventricular myocardium resulting in effective<br />
mechanical contractions.<br />
3. This is true for normal operating conditions. In pathological conditions, any myocardial cell may act as a<br />
pacemaker.<br />
4. Pacemakers o<strong>the</strong>r than <strong>the</strong> SA node may also take over <strong>the</strong> regulation <strong>of</strong> <strong>the</strong> heart rate when faster pacemakers<br />
are not effective, such as during episodes <strong>of</strong> AV block; see Section 1.3.3.
4 The <strong>Physiological</strong> <strong>Basis</strong> <strong>of</strong> <strong>the</strong> <strong>Electrocardiogram</strong><br />
However, key structures intended to modify propagation <strong>of</strong> <strong>the</strong> action potential<br />
are interspersed throughout <strong>the</strong> heart. First, <strong>the</strong>re are bands <strong>of</strong> specialized conducting<br />
fibers across which <strong>the</strong> action potential travels more rapidly compared to <strong>the</strong><br />
conduction through <strong>the</strong> myocardium. It is by traveling across a combination <strong>of</strong><br />
conducting fibers and myocardium that <strong>the</strong> action potential can propagate to all<br />
regions <strong>of</strong> <strong>the</strong> ventricles in less than 100 milliseconds. In subjects with conduction<br />
system disease, <strong>the</strong> propagation time is prolonged because <strong>the</strong> action potential only<br />
spreads through <strong>the</strong> myocardium itself. This unsynchronized squeezing motion <strong>of</strong><br />
various parts <strong>of</strong> <strong>the</strong> heart can cause a mild impairment <strong>of</strong> pumping efficacy. In<br />
addition to specialized conducting fibers, <strong>the</strong>re are tissues that electrically insulate<br />
<strong>the</strong> ventricles from <strong>the</strong> atria. In a normal heart, <strong>the</strong> only way <strong>the</strong> action potential<br />
passes from <strong>the</strong> atria to <strong>the</strong> ventricles is through ano<strong>the</strong>r specialized structure called<br />
<strong>the</strong> AV node, whose function is to provide a delay in conduction, so that <strong>the</strong> atria<br />
can contract completely before <strong>the</strong> ventricles begin contracting. The function and<br />
structure <strong>of</strong> <strong>the</strong> normal heart are discussed in more detail below.<br />
It should be noted that, through decades <strong>of</strong> investigation, much detail is available<br />
about <strong>the</strong> electrophysiologic activity <strong>of</strong> <strong>the</strong> heart and <strong>the</strong> preceding text is<br />
<strong>the</strong>refore only a highly abbreviated summary. Interested readers are referred to<br />
more detailed texts such as [2, 3].<br />
1.2 The Physical <strong>Basis</strong> <strong>of</strong> Electrocardiography<br />
As a result <strong>of</strong> <strong>the</strong> electrical activity <strong>of</strong> <strong>the</strong> cells, current flows within <strong>the</strong> body and potential<br />
differences are established on <strong>the</strong> surface <strong>of</strong> <strong>the</strong> skin, which can be measured<br />
using suitable equipment (see Chapter 2). The graphical recording <strong>of</strong> <strong>the</strong>se body surface<br />
potentials as a function <strong>of</strong> time produces <strong>the</strong> electrocardiogram. The simplest<br />
ma<strong>the</strong>matical model for relating <strong>the</strong> cardiac generator to <strong>the</strong> body surface potentials<br />
is <strong>the</strong> single dipole model. This simple model is extremely useful in providing<br />
a framework for <strong>the</strong> study <strong>of</strong> clinical electrocardiography and vectorcardiography,<br />
though <strong>of</strong> course much more complex treatments have been developed. 5 The descriptions<br />
in this chapter are <strong>the</strong>refore simplifications to aid <strong>the</strong> understanding <strong>of</strong><br />
<strong>the</strong> surface potential signal that manifests as an ECG.<br />
The dipole model has two components, a representation <strong>of</strong> <strong>the</strong> electrical activity<br />
<strong>of</strong> <strong>the</strong> heart (<strong>the</strong> dipole itself), and <strong>the</strong> geometry and electrical properties <strong>of</strong> <strong>the</strong><br />
surrounding body. First, consider <strong>the</strong> representation <strong>of</strong> <strong>the</strong> electrical activity <strong>of</strong> <strong>the</strong><br />
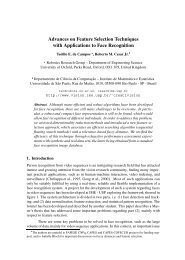
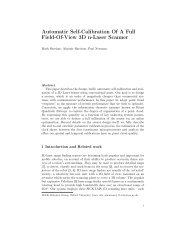
heart: as an action potential propagates through a cell (i.e., in <strong>the</strong> myocardium),<br />
<strong>the</strong>re is an associated intracellular current generated in <strong>the</strong> direction <strong>of</strong> propagation,<br />
at <strong>the</strong> interface <strong>of</strong> resting and depolarizing tissue. This is <strong>the</strong> elementary electrical<br />
source <strong>of</strong> <strong>the</strong> surface ECG, referred to as <strong>the</strong> current dipole. There is also an equal<br />
extracellular current flowing against <strong>the</strong> direction <strong>of</strong> propagation, and so charge is<br />
conserved. All current loops in <strong>the</strong> conductive media close upon <strong>the</strong>mselves, forming<br />
a dipole field (see Figure 1.2). The heart’s total electrical activity at any instant <strong>of</strong><br />
5. Models include multiple dipole models, cable models and statistical models. Fur<strong>the</strong>r information can also<br />
be found in [3–5] and Chapter 4.
1.2 The Physical <strong>Basis</strong> <strong>of</strong> Electrocardiography 5<br />
Figure 1.2 The dipole field due to current flow in a myocardial cell at <strong>the</strong> advancing front <strong>of</strong><br />
depolarization. Vm is <strong>the</strong> transmembrane potential. (From: [2]. c○ 2004 MIT OCW. Reprinted with<br />
permission.)<br />
time may be represented by a distribution <strong>of</strong> active current dipoles. In general, <strong>the</strong>y<br />
will lie on an irregular surface corresponding to <strong>the</strong> boundary between depolarized<br />
and polarized tissue.<br />
If <strong>the</strong> heart were suspended in a homogeneous isotropic conducting medium<br />
and were observed from a distance sufficiently large compared to its size, <strong>the</strong>n all<br />
<strong>of</strong> <strong>the</strong>se individual current dipoles may be assumed to originate at a single point<br />
in space and <strong>the</strong> total electrical activity <strong>of</strong> <strong>the</strong> heat may be represented as a single<br />
equivalent dipole whose magnitude and direction is <strong>the</strong> vector summation <strong>of</strong> all<br />
<strong>the</strong> minute dipoles. The net equivalent dipole moment is commonly referred to<br />
as <strong>the</strong> (time-dependent) heart vector M(t). As each wave <strong>of</strong> depolarization spreads<br />
through <strong>the</strong> heart, <strong>the</strong> heart vector changes in magnitude and direction as a function<br />
<strong>of</strong> time.<br />
The resulting surface distribution <strong>of</strong> currents and potentials depends on <strong>the</strong><br />
electrical properties <strong>of</strong> <strong>the</strong> torso. As a reasonable approximation, <strong>the</strong> dipole model<br />
ignores <strong>the</strong> known anisotropy and inhomogeneity <strong>of</strong> <strong>the</strong> torso and treats <strong>the</strong> body<br />
as a linear, isotropic, homogeneous, spherical conductor <strong>of</strong> radius, R, and conductivity,<br />
σ . The source is represented as a slowly time-varying single current dipole<br />
located at <strong>the</strong> center <strong>of</strong> <strong>the</strong> sphere. The static electric field, current density, and<br />
electric potential everywhere within <strong>the</strong> torso (and on its surface) are nondynamically<br />
related to <strong>the</strong> heart vector at any given time (i.e., <strong>the</strong> model is quasi-static).<br />
The reactive terms due to <strong>the</strong> tissue impedance can be neglected. Laplace’s equation<br />
(which holds within <strong>the</strong> idealized homogenous isotropic conducting spherical torso)<br />
may <strong>the</strong>n be solved to give <strong>the</strong> potential distribution on <strong>the</strong> torso as<br />
�(t) = cosθ(t)3|M(t)|/4πσR 2<br />
(1.1)
6 The <strong>Physiological</strong> <strong>Basis</strong> <strong>of</strong> <strong>the</strong> <strong>Electrocardiogram</strong><br />
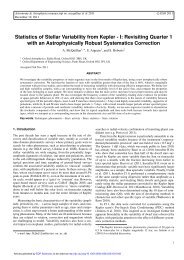
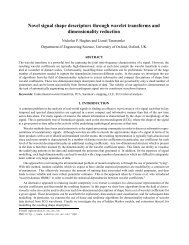
Figure 1.3 The idealized spherical torso with <strong>the</strong> centrally located cardiac source. (From: [2].<br />
c○ 2004 MIT OCW. Reprinted with permission.)<br />
where θ(t) is <strong>the</strong> angle between <strong>the</strong> direction <strong>of</strong> <strong>the</strong> heart vector M(t), and OA <strong>the</strong><br />
lead vector joining <strong>the</strong> center <strong>of</strong> <strong>the</strong> sphere, O, to <strong>the</strong> point <strong>of</strong> observation, A (see<br />
Figure 1.3). |M| is <strong>the</strong>refore <strong>the</strong> magnitude <strong>of</strong> <strong>the</strong> heart vector. More generally, <strong>the</strong><br />
potential difference between <strong>the</strong> two points on <strong>the</strong> surface <strong>of</strong> <strong>the</strong> torso would be<br />
VAB(t) = M(t) · LAB(t) (1.2)<br />
where LAB is known as <strong>the</strong> lead vector connecting points A and B on <strong>the</strong> torso. It is<br />
useful to define a reference central terminal (CT) by averaging <strong>the</strong> potentials from<br />
<strong>the</strong> three limb leads (see Section 1.2.1):<br />
�CT(t) = �RA(t) + �LA(t) + �LL(t) (1.3)<br />
where RA indicates right arm, LA indicates left arm, and LL indicates left leg.<br />
Note that �CT should be zero at all times. The next section describes <strong>the</strong> clinical<br />
derivation <strong>of</strong> <strong>the</strong> normal ECG.<br />
1.2.1 The Normal <strong>Electrocardiogram</strong><br />
The performance <strong>of</strong> <strong>the</strong> heart as a pump is dependent primarily upon <strong>the</strong> contraction<br />
and relaxation properties <strong>of</strong> <strong>the</strong> myocardium. O<strong>the</strong>r factors that must also be considered<br />
include: <strong>the</strong> geometric organization <strong>of</strong> <strong>the</strong> myocardial cells, <strong>the</strong> properties <strong>of</strong>
1.2 The Physical <strong>Basis</strong> <strong>of</strong> Electrocardiography 7<br />
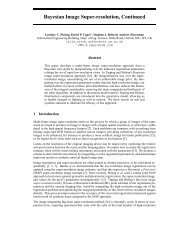
Figure 1.4 Trajectory <strong>of</strong> a normal cardiac vector. (From: [2]. c○ 2004 MIT OCW. Reprinted with<br />
permission.)<br />
<strong>the</strong> cardiac tissue, <strong>the</strong> heart’s electrical rhythm, valvular function, and <strong>the</strong> adequacy<br />
<strong>of</strong> delivery <strong>of</strong> oxygenated blood via <strong>the</strong> coronary arteries to meet <strong>the</strong> metabolic<br />
demands <strong>of</strong> <strong>the</strong> myocardium. The heart has four cavitary chambers whose walls<br />
consist <strong>of</strong> a mechanical syncytium <strong>of</strong> myocardial cells. At <strong>the</strong> exit <strong>of</strong> each chamber<br />
is a valve that closes after its contraction, preventing significant retrograde flow<br />
when <strong>the</strong> chamber relaxes and downstream pressures exceed chamber pressures.<br />
The right heart includes a small atrium leading into a larger right ventricle. 6 The<br />
right atrium receives blood from most <strong>of</strong> <strong>the</strong> body and feeds it into <strong>the</strong> right ventricle.<br />
When <strong>the</strong> right ventricle contracts, it propels blood to <strong>the</strong> lungs, where <strong>the</strong><br />
blood is oxygenated and relieved <strong>of</strong> carbon dioxide. 7 The left atrium receives blood<br />
from <strong>the</strong> lungs and conducts it into <strong>the</strong> left ventricle. 8 The forceful contractions <strong>of</strong><br />
<strong>the</strong> left ventricle propel <strong>the</strong> blood through <strong>the</strong> aorta to <strong>the</strong> rest <strong>of</strong> <strong>the</strong> body, with<br />
sufficient pressure to perfuse <strong>the</strong> brains <strong>of</strong> even <strong>the</strong> tallest humans. 9 The left atrium<br />
and left ventricle form <strong>the</strong> left heart. As noted earlier, under normal conditions <strong>the</strong><br />
atria finish contracting before <strong>the</strong> ventricles begin contracting.<br />
Figure 1.4 illustrates <strong>the</strong> normal heart’s geometry and resultant instantaneous<br />
electrical heart vectors throughout <strong>the</strong> cardiac cycle. The figure shows <strong>the</strong> origination<br />
<strong>of</strong> <strong>the</strong> heart beat (at <strong>the</strong> SA node), a delay at <strong>the</strong> AV node (so that <strong>the</strong><br />
6. With a valve known as <strong>the</strong> tricuspid valve.<br />
7. Its valve is <strong>the</strong> pulmonic valve.<br />
8. Its valve is <strong>the</strong> mitral valve.<br />
9. Its valve is <strong>the</strong> aortic valve.
8 The <strong>Physiological</strong> <strong>Basis</strong> <strong>of</strong> <strong>the</strong> <strong>Electrocardiogram</strong><br />
atria, teleologically, finish contraction before <strong>the</strong> ventricles begin), and accelerated<br />
conduction <strong>of</strong> <strong>the</strong> depolarization wave via specialized conducting fibers (so that<br />
disparate parts <strong>of</strong> <strong>the</strong> heart are depolarized in a more synchronized fashion). Nine<br />
different temporal states are shown. The dotted line below each illustrated state<br />
summarizes <strong>the</strong> preceding trajectory <strong>of</strong> heart vectors. First, atrial depolarization<br />
is illustrated. As <strong>the</strong> wave <strong>of</strong> depolarization descends throughout both atria, <strong>the</strong><br />
summation vector is largely pointing down (to <strong>the</strong> subject’s toes), to <strong>the</strong> subject’s<br />
left, and slightly anterior. Next <strong>the</strong>re is <strong>the</strong> delay at <strong>the</strong> AV node, discussed above,<br />
during which time <strong>the</strong>re is no measurable electrical activity at <strong>the</strong> body surface unless<br />
special averaging techniques are used. After activity emerges from <strong>the</strong> AV node<br />
it depolarizes <strong>the</strong> His 10 bundle, followed by <strong>the</strong> bundle branches. Next, <strong>the</strong>re is <strong>the</strong><br />
septal depolarization. The septum is <strong>the</strong> wall between <strong>the</strong> ventricles, and a major<br />
bundle <strong>of</strong> conducting fibers runs along <strong>the</strong> left side <strong>of</strong> <strong>the</strong> septum. As <strong>the</strong> action potential<br />
wave enters <strong>the</strong> septal myocardium it tends to propagate left to right, and so<br />
<strong>the</strong> resultant heart vector points to <strong>the</strong> subject’s right. Next <strong>the</strong>re is apical depolarization,<br />
and <strong>the</strong> wave <strong>of</strong> depolarization moving left is balanced by <strong>the</strong> wave moving<br />
right. The resultant vector points towards <strong>the</strong> apex <strong>of</strong> <strong>the</strong> heart, which is largely<br />
pointing down, to <strong>the</strong> subject’s left, and slightly anterior. In left ventricular depolarization<br />
and late left ventricular depolarization, <strong>the</strong>re is also electrical activity in <strong>the</strong><br />
right ventricle, but since <strong>the</strong> left ventricle is much more massive its activity dominates.<br />
After <strong>the</strong> various portions <strong>of</strong> myocardium depolarize, <strong>the</strong>y contract via <strong>the</strong><br />
process <strong>of</strong> excitation-contraction coupling described above (not illustrated). There<br />
is a plateau period during which <strong>the</strong> myocardium has depolarized (ventricles depolarized)<br />
where no action potential propagates, and hence <strong>the</strong>re is no measurable<br />
cardiac vector. Finally, <strong>the</strong> individual cells begin to repolarize and ano<strong>the</strong>r wave <strong>of</strong><br />
charge passes through <strong>the</strong> heart, this time originating from <strong>the</strong> dipoles generated at<br />
<strong>the</strong> interface <strong>of</strong> depolarized and repolarizing tissue (i.e., ventricular repolarization).<br />
The heart <strong>the</strong>n returns to its resting state (such that <strong>the</strong> ventricles are repolarized),<br />
awaiting ano<strong>the</strong>r electrical stimulus that starts <strong>the</strong> cycle anew. Note that both <strong>the</strong><br />
polarity and <strong>the</strong> direction <strong>of</strong> propagation <strong>of</strong> <strong>the</strong> repolarizing phase are reversed from<br />
those <strong>of</strong> depolarization. As a result, repolarization waves on <strong>the</strong> ECG are generally<br />
<strong>of</strong> <strong>the</strong> same polarity as depolarization waves.<br />
To complete <strong>the</strong> review <strong>of</strong> <strong>the</strong> basis <strong>of</strong> <strong>the</strong> surface ECG, a description <strong>of</strong> how<br />
<strong>the</strong> trajectory <strong>of</strong> <strong>the</strong> cardiac vector (detailed in Figure 1.4) results in <strong>the</strong> pattern <strong>of</strong> a<br />
normal scalar ECG is now described. The cardiac vector, which expands, contracts,<br />
and rotates in three-dimensional space, is projected onto 12 different lines <strong>of</strong> welldefined<br />
orientation (for instance, lead I is oriented directly to <strong>the</strong> patient’s left). Each<br />
lead reveals <strong>the</strong> magnitude <strong>of</strong> <strong>the</strong> cardiac vector in <strong>the</strong> direction <strong>of</strong> that lead at each<br />
instant <strong>of</strong> time. The six precordial leads report activity in <strong>the</strong> horizontal plane. In<br />
practice, this requires that six electrodes are placed around <strong>the</strong> torso (Figure 1.5),<br />
and <strong>the</strong> ECG represents <strong>the</strong> difference between each <strong>of</strong> <strong>the</strong>se electrodes (V1–6) and<br />
<strong>the</strong> central terminal [as in (1.3)].<br />
10. The His bundle is a collection <strong>of</strong> heart muscle cells specialized for electrical conduction that transmits<br />
electrical impulses from <strong>the</strong> AV node, between <strong>the</strong> atria and <strong>the</strong> ventricles to <strong>the</strong> Purkinje fibers, which<br />
innervate <strong>the</strong> ventricles.
1.2 The Physical <strong>Basis</strong> <strong>of</strong> Electrocardiography 9<br />
Figure 1.5 The six standard chest leads. (From: [2]. c○ 2004 MIT OCW. Reprinted with permission.)<br />
Figure 1.6 Frontal plane limb leads. (From: [2]. c○ 2004 MIT OCW. Reprinted with permission.)
10 The <strong>Physiological</strong> <strong>Basis</strong> <strong>of</strong> <strong>the</strong> <strong>Electrocardiogram</strong><br />
Figure 1.7 The temporal pattern <strong>of</strong> <strong>the</strong> heart vector combined with <strong>the</strong> geometry <strong>of</strong> <strong>the</strong> standard<br />
frontal plane limb leads. (From: [2]. c○ 2004 MIT OCW. Reprinted with permission.)<br />
Additional electrodes, <strong>the</strong> limb leads, are placed on each <strong>of</strong> <strong>the</strong> subject’s four<br />
extremities and <strong>the</strong> central terminal is <strong>the</strong> average <strong>of</strong> <strong>the</strong> potentials from <strong>the</strong> limb<br />
leads. Potential differences between <strong>the</strong> limb electrodes and <strong>the</strong> central terminal are<br />
<strong>the</strong> bases for <strong>the</strong> o<strong>the</strong>r three standard ECG leads, as illustrated (Figure 1.6): (1)<br />
Lead I, <strong>the</strong> difference between left arm (LA) and right arm (RA); (2) Lead II, <strong>the</strong><br />
difference between <strong>the</strong> left leg (LL) and <strong>the</strong> RA; (3) Lead III, <strong>the</strong> difference between<br />
<strong>the</strong> LL and <strong>the</strong> LA. Note also that <strong>the</strong> augmented limb leads (denoted by “a”) represent<br />
<strong>the</strong> potential at a given limb with respect to <strong>the</strong> average <strong>of</strong> <strong>the</strong> potentials<br />
<strong>of</strong> <strong>the</strong> o<strong>the</strong>r two limbs. 11 aVF is <strong>the</strong> difference between <strong>the</strong> LL and average <strong>of</strong> <strong>the</strong><br />
arm leads; aVR is <strong>the</strong> difference between <strong>the</strong> RA and <strong>the</strong> average <strong>of</strong> LL and LA,<br />
and aVL is <strong>the</strong> difference between <strong>the</strong> LA and <strong>the</strong> average <strong>of</strong> <strong>the</strong> RA and LL. Since<br />
<strong>the</strong>re are 12 leads to image three-dimensional activity, <strong>the</strong>re exists considerable information<br />
redundancy in this configuration. However, this spatial “oversampling”<br />
by projecting <strong>the</strong> cardiac vector into nonorthogonal axes, tends to yield an easier<br />
representation for human interpretation and compensates for minor inconsistencies<br />
in electrode placement (after all, human forms lack geometric consistency, thus electrode<br />
placement varies with subject and with technician). Fur<strong>the</strong>rmore, <strong>the</strong> body is<br />
not a homogenous sphere.<br />
The temporal pattern <strong>of</strong> <strong>the</strong> heart vector is combined with <strong>the</strong> geometry <strong>of</strong> <strong>the</strong><br />
standard frontal plane limb leads in Figure 1.7. In black, <strong>the</strong> temporal trajectory<br />
<strong>of</strong> <strong>the</strong> heart vector, from Figure 1.4, is recreated. The frontal ECG leads are superimposed<br />
in <strong>the</strong>ir conventional orientation (from Figure 1.6). The resultant pattern<br />
11. That is, <strong>the</strong> central terminal with <strong>the</strong> limb lead disconnected that corresponds to <strong>the</strong> augmented lead you are<br />
measuring. The vector is <strong>the</strong>refore longer and <strong>the</strong> signal amplitude consequently higher, hence, augmented.
1.2 The Physical <strong>Basis</strong> <strong>of</strong> Electrocardiography 11<br />
Figure 1.8 Normal features <strong>of</strong> <strong>the</strong> electrocardiogram. (From: [2]. c○ 2004 MIT OCW. Reprinted<br />
with permission.)<br />
for three surface ECG leads, I, II, and III, are shown. Note that <strong>the</strong> QRS axis is<br />
perpendicular to <strong>the</strong> isoelectric lead (<strong>the</strong> lead with equal forces in <strong>the</strong> positive and<br />
negative direction). Significant changes in <strong>the</strong> QRS axis can be indicative <strong>of</strong> cardiac<br />
problems.<br />
Figure 1.8 illustrates <strong>the</strong> normal clinical features <strong>of</strong> <strong>the</strong> electrocardiogram,<br />
which include wave amplitudes and interwave timings. The locations <strong>of</strong> different<br />
waves on <strong>the</strong> ECG are arbitrarily marked by <strong>the</strong> letters P, Q, R, S, and T 12 (and<br />
sometimes U, although this wave is <strong>of</strong>ten hard to identify, as it may be absent,<br />
have a low amplitude, or be masked by a subsequent beat). The interbeat timing<br />
(RR interval) is not marked. Note that <strong>the</strong> illustration uses <strong>the</strong> typical graph-paper<br />
presentation format, which stems from <strong>the</strong> early clinical years <strong>of</strong> electrocardiography,<br />
where analysis was done by hand measurements <strong>of</strong> hard copies. Each box is<br />
1mm 2 and <strong>the</strong> ECG paper is usually set to move at 25 mm/s. Therefore, each box<br />
represents 0.04 second in time. The amplitude scale is set to be 0.1 mV per square,<br />
although <strong>the</strong>re is <strong>of</strong>ten a larger grid overlaid at every five squares (0.20 second/<br />
12. Einthoven, who received <strong>the</strong> Nobel Prize in 1924 for his development <strong>of</strong> <strong>the</strong> first ECG, named <strong>the</strong> prominent<br />
ECG waves alphabetically, P, Q, R, S, and T. The prominent deflections were first labeled A, B, C, and<br />
D, in his preceding work with a capillary electrometer, which did not record negative deflections. The<br />
new nomenclature was to distinguish <strong>the</strong> superior signal produced by a string galvanometer. For more<br />
information, see [6].
12 The <strong>Physiological</strong> <strong>Basis</strong> <strong>of</strong> <strong>the</strong> <strong>Electrocardiogram</strong><br />
0.5 mV). 13 The values for <strong>the</strong> clinical features indicated on <strong>the</strong> graph in Figure 1.8<br />
are typical, although <strong>the</strong>y can vary based upon gender, age, activity, and health (see<br />
Chapter 3 and [7]).<br />
1.3 Introduction to Clinical Electrocardiography:<br />
Abnormal Patterns<br />
The clinician who uses <strong>the</strong> electrocardiogram as a diagnostic test wishes to determine<br />
cardiac abnormalities from <strong>the</strong> body surface potentials. As a rough framework, it is<br />
worth thinking <strong>of</strong> <strong>the</strong> heart as three separate systems: a functional electrical system,<br />
a functional system <strong>of</strong> coronary (or cardiac) arteries to channel nourishing blood to<br />
every cell <strong>of</strong> <strong>the</strong> myocardium, and a culmination in an effective mechanical pump.<br />
First we consider how an ECG is used to assess electrical abnormalities <strong>of</strong><br />
<strong>the</strong> heart. The surface ECG has inherent limitations as a diagnostic tool: Given<br />
a distribution <strong>of</strong> body surface potentials, we cannot precisely specify <strong>the</strong> detailed<br />
electrophysiologic behavior <strong>of</strong> <strong>the</strong> source since this inverse problem does not have a<br />
unique solution (as demonstrated in 1853 by Hermann von Helmholz). It is not, in<br />
general, possible to uniquely specify <strong>the</strong> characteristics <strong>of</strong> a current generator from<br />
<strong>the</strong> external potential measurements alone. Therefore, an exacting assessment <strong>of</strong><br />
<strong>the</strong> electrical activity <strong>of</strong> <strong>the</strong> heart involves an invasive electrode study. Despite <strong>the</strong>se<br />
inherent limitations, <strong>the</strong> surface ECG is extremely useful in clinical assessments <strong>of</strong><br />
electrical pathologies and an invasive electrophysiologic study is indicated in only<br />
a small fraction <strong>of</strong> cases.<br />
To a first approximation, electrical problems come in two forms: those which<br />
make <strong>the</strong> heart pump too slowly or infrequently (bradycardias), and those with<br />
make <strong>the</strong> heart pump too quickly (tachycardias). If <strong>the</strong> pumping is too slow, <strong>the</strong><br />
cardiac output <strong>of</strong> life-sustaining blood can be dangerously low. If too quick, <strong>the</strong><br />
cardiac output can also be too low since <strong>the</strong> heart does not have time to fill, and<br />
also because <strong>the</strong> heart can suffer damage (e.g., demand ischemia) when it tries to<br />
pump too rapidly.<br />
1.3.1 The Normal Determinants <strong>of</strong> Heart Rate: The Autonomic<br />
Nervous System<br />
One class <strong>of</strong> heart rate abnormalities arises from abnormal function <strong>of</strong> <strong>the</strong> control<br />
system for heart rate. As discussed in Section 1.2.2, <strong>the</strong>re are specialized cells in <strong>the</strong><br />
SA node whose function is to act as <strong>the</strong> heart’s pacemaker, rhythmically generating<br />
action potentials and triggering depolarization for <strong>the</strong> rest <strong>of</strong> <strong>the</strong> heart (recall<br />
that once any portion <strong>of</strong> <strong>the</strong> heart depolarizes, <strong>the</strong> wavefront tends to propagate<br />
throughout <strong>the</strong> entire myocardium). The SA node has an intrinsic rate <strong>of</strong> firing, but<br />
ordinarily this is modified by <strong>the</strong> central nervous system, specifically, <strong>the</strong> autonomic<br />
nervous system (ANS). 14 The decision-making for autonomic functions occurs in<br />
13. In this chapter, this larger amplitude scale was used for Figures 1.9 through 1.23 and Figure 1.26.<br />
14. The part <strong>of</strong> <strong>the</strong> nervous system that functions without conscious thought, taking care <strong>of</strong> such tasks as<br />
breathing while you sleep, <strong>the</strong>rmoregulation, and optimizing heart rate.
1.3 Introduction to Clinical Electrocardiography: Abnormal Patterns 13<br />
<strong>the</strong> medulla in <strong>the</strong> brain stem and <strong>the</strong> hypothalamus. Instructions from <strong>the</strong>se centers<br />
are communicated via nerves that connect <strong>the</strong> brain to <strong>the</strong> heart. There are two<br />
main sets <strong>of</strong> nerves serving <strong>the</strong> sympa<strong>the</strong>tic and <strong>the</strong> parasympa<strong>the</strong>tic portions <strong>of</strong> <strong>the</strong><br />
autonomic nervous system, which both innvervate <strong>the</strong> heart. The sympa<strong>the</strong>tic nervous<br />
system is activated during stressful times. It increases <strong>the</strong> rate <strong>of</strong> SA node firing<br />
(hence raising heart rate) and also innervates <strong>the</strong> myocardium itself, increasing <strong>the</strong><br />
propagation speed <strong>of</strong> <strong>the</strong> depolarization wavefront, mainly through <strong>the</strong> AV node,<br />
and increasing <strong>the</strong> strength <strong>of</strong> mechanical contractions. These effects are all consequences<br />
<strong>of</strong> changes to ion channels and gates that occur when <strong>the</strong> cells are exposed<br />
to <strong>the</strong> messenger chemical from <strong>the</strong> nerves. The time necessary for <strong>the</strong> sympa<strong>the</strong>tic<br />
nervous system to actuate <strong>the</strong>se effects is on <strong>the</strong> order <strong>of</strong> 15 seconds.<br />
The sympa<strong>the</strong>tic system works in tandem with <strong>the</strong> parasympa<strong>the</strong>tic system. For<br />
<strong>the</strong> body as a whole, <strong>the</strong> parasympa<strong>the</strong>tic system controls quiet-time functions like<br />
food digestion. The nerve through which <strong>the</strong> parasympa<strong>the</strong>tic system communicates<br />
with <strong>the</strong> heart is named <strong>the</strong> vagus. 15 The parasympa<strong>the</strong>tic branch’s major effect is<br />
on heart rate and <strong>the</strong> velocity <strong>of</strong> propagation <strong>of</strong> <strong>the</strong> action potential through <strong>the</strong> AV<br />
node. 16 Fur<strong>the</strong>rmore, in contrast with <strong>the</strong> sympa<strong>the</strong>tic system, <strong>the</strong> parasympa<strong>the</strong>tic<br />
nerves act quickly, decreasing <strong>the</strong> velocity through <strong>the</strong> AV node and slowing <strong>the</strong><br />
heart rate within a second when <strong>the</strong>y activate. Most organs are innervated by both<br />
<strong>the</strong> sympa<strong>the</strong>tic and <strong>the</strong> parasympa<strong>the</strong>tic branches <strong>of</strong> <strong>the</strong> ANS and <strong>the</strong> balance<br />
between <strong>the</strong>se competing effects determines function.<br />
The sympa<strong>the</strong>tic and parasympa<strong>the</strong>tic systems are rarely totally <strong>of</strong>f or on; instead,<br />
<strong>the</strong> body adjusts <strong>the</strong>ir levels <strong>of</strong> activation, known as tone, as is appropriate<br />
to its needs. If a medication that inactivates <strong>the</strong> sympa<strong>the</strong>tic system (e.g., propranolol)<br />
is used on a healthy resting subject with a heart rate <strong>of</strong> 60 bpm, <strong>the</strong> classic<br />
response is to slow <strong>the</strong> heart rate to about 50 bpm. If a medication that inactivates<br />
<strong>the</strong> parasympa<strong>the</strong>tic system (e.g., atropine) is used, <strong>the</strong> classic response is an elevation<br />
<strong>of</strong> <strong>the</strong> heart rate to about 120 bpm. If you administer both medications and<br />
inactivate both systems (parasympa<strong>the</strong>tic and sympa<strong>the</strong>tic withdrawal), <strong>the</strong> heart<br />
rate rises to 100 bpm. Therefore, in this instance for normal subjects at rest, <strong>the</strong><br />
effects <strong>of</strong> <strong>the</strong> heart rate’s “brake” are greater than <strong>the</strong> effects <strong>of</strong> <strong>the</strong> “accelerator,”<br />
although it is <strong>the</strong> balance <strong>of</strong> both systems that dictates <strong>the</strong> heart rate. The body’s<br />
normal reaction when vagal tone is increased (<strong>the</strong> brake) is to simultaneously reduce<br />
sympa<strong>the</strong>tic tone (<strong>the</strong> accelerator). Similarly, when sympa<strong>the</strong>tic tone is increased,<br />
parasympa<strong>the</strong>tic tone is usually withdrawn. Indeed, if a person is suddenly startled,<br />
<strong>the</strong> earliest increase in heart rate will simply be due to parasympa<strong>the</strong>tic withdrawal<br />
ra<strong>the</strong>r than <strong>the</strong> slower-acting sympa<strong>the</strong>tic activation.<br />
On what basis does <strong>the</strong> autonomic system make heart rate adjustments? There<br />
are a series <strong>of</strong> sensors throughout <strong>the</strong> body sending information back to <strong>the</strong> brain<br />
(afferent nerves, bringing information to <strong>the</strong> central nervous system). Those<br />
parameters sensed by afferent nerves include <strong>the</strong> blood pressure in <strong>the</strong> arteries<br />
(baroreceptors), <strong>the</strong> acid-base conditions in <strong>the</strong> blood (chemoreceptors), and <strong>the</strong><br />
pressure within <strong>the</strong> heart’s walls (mechanoreceptors). Based on this feedback, <strong>the</strong><br />
brain unconsciously adjusts heart rate. The system is predicated on <strong>the</strong> fact that,<br />
15. Parasympa<strong>the</strong>tic activity is <strong>the</strong>refore sometimes termed vagal activity.<br />
16. It has little effect on cardiac contractility.
14 The <strong>Physiological</strong> <strong>Basis</strong> <strong>of</strong> <strong>the</strong> <strong>Electrocardiogram</strong><br />
Figure 1.9 Normal sinus rhythm. (From: [2]. c○ 2004 MIT OCW. Reprinted with permission.)<br />
as heart rate increases, cardiac pumping and blood output should increase, and so<br />
increase arterial blood pressure, blood flow and oxygen delivery to <strong>the</strong> peripheral<br />
tissues, carbon dioxide clearance from <strong>the</strong> peripheral tissues, and so on.<br />
When <strong>the</strong> heart rate is controlled by <strong>the</strong> SA node’s rate <strong>of</strong> firing, <strong>the</strong> sequence<br />
<strong>of</strong> beats is known as a sinus rhythm (see Figure 1.9). When <strong>the</strong> SA node fires<br />
more quickly than usual (for instance, as a normal physiologic response to fear, or<br />
an abnormal response due to a cocaine intoxication), <strong>the</strong> rhythm is termed sinus<br />
tachycardia (see Figure 1.10). When <strong>the</strong> SA node fires more slowly than usual (for<br />
instance, ei<strong>the</strong>r as a normal physiologic response in a very well-conditioned athlete,<br />
or an abnormal response in an older patient taking too much heart-slowing medication),<br />
<strong>the</strong> rhythm is known as sinus bradycardia (see Figure 1.11). There may<br />
be cyclic variations in heart rate due to breathing, known as sinus arrhythmia (see<br />
Figure 1.12). This nonpathologic pattern is caused by activity <strong>of</strong> <strong>the</strong> parasympa<strong>the</strong>tic<br />
system (<strong>the</strong> sympa<strong>the</strong>tic system responds too slowly to alter heart rate on this<br />
time scale), which is responding to subtle changes in arterial blood pressure, cardiac<br />
filling pressure, and <strong>the</strong> lungs <strong>the</strong>mselves, during <strong>the</strong> respiratory cycle.<br />
Figure 1.10 Sinus tachycardia. (From: [2]. c○ 2004 MIT OCW. Reprinted with permission.)<br />
Figure 1.11 Sinus bradycardia. (From: [2]. c○ 2004 MIT OCW. Reprinted with permission.)<br />
Figure 1.12 Sinus arrhythmia. (From: [2]. c○ 2004 MIT OCW. Reprinted with permission.)
1.3 Introduction to Clinical Electrocardiography: Abnormal Patterns 15<br />
1.3.2 Ectopy, Tachycardia, and Fibrillation<br />
An arrhythmia is any abnormal cardiac rhythm. One category <strong>of</strong> arrhythmias occurs<br />
when <strong>the</strong> trigger to depolarize originates outside <strong>of</strong> <strong>the</strong> SA node, in ano<strong>the</strong>r part<br />
<strong>of</strong> <strong>the</strong> myocardium (known as ectopic depolarization, leading to ectopic beats).<br />
Common causes <strong>of</strong> ectopy include a drug effect (e.g., caffeine) or a viral infection<br />
<strong>of</strong> <strong>the</strong> myocardium, or o<strong>the</strong>r inflammation or damage <strong>of</strong> part <strong>of</strong> <strong>the</strong> heart (e.g.,<br />
ischemia). When <strong>the</strong> ectopic beat originates in <strong>the</strong> atria, it leads to a premature<br />
atrial beat, also known as an atrial premature contraction (APC) (see Figure 1.13).<br />
When it originates in <strong>the</strong> ventricles, it leads to a premature ventricular beat or<br />
ventricular premature contraction (VPC); see Figure 1.14.<br />
Note in Figure 1.14 that <strong>the</strong> ectopic ventricular beat looks very different from<br />
<strong>the</strong> o<strong>the</strong>r sinus beats. The spread <strong>of</strong> <strong>the</strong> wavefront for a VPC can be backwards, such<br />
as when <strong>the</strong> action potential starts at <strong>the</strong> apex <strong>of</strong> <strong>the</strong> heart ra<strong>the</strong>r than <strong>the</strong> septum.<br />
The depolarization wavefront can move in very different directions than <strong>the</strong> typical<br />
sinus-driven heart vector. Compare Figure 1.15 with <strong>the</strong> wavefront trajectory in<br />
Figure 1.13 Atrial premature contractions (indicated by arrowheads). (From: [2]. c○ 2004 MIT<br />
OCW. Reprinted with permission.)<br />
Figure 1.14 Ventricular premature contractions. (From: [2]. c○ 2004 MIT OCW. Reprinted with<br />
permission.)<br />
Figure 1.15 Wavefront trajectory in a ventricular premature contraction. (From: [2]. c○ 2004 MIT<br />
OCW. Reprinted with permission.)
16 The <strong>Physiological</strong> <strong>Basis</strong> <strong>of</strong> <strong>the</strong> <strong>Electrocardiogram</strong><br />
Figure 1.16 Ventricular bigeminy. (From: [2]. c○ 2004 MIT OCW. Reprinted with permission.)<br />
Figure 1.17 Three episodes <strong>of</strong> nonsustained ventricular tachycardia. There are two normal sinus<br />
beats in between each episode <strong>of</strong> VT. (From: [2]. c○ 2004 MIT OCW. Reprinted with permission.)<br />
Figure 1.4. Fur<strong>the</strong>rmore, <strong>the</strong> ectopic beat is typically wider because its wavefront<br />
propagates slowly through <strong>the</strong> myocardium ra<strong>the</strong>r than through <strong>the</strong> high-speed<br />
Purkinji system.<br />
After an ectopic wavefront has propagated to all portions <strong>of</strong> <strong>the</strong> heart, <strong>the</strong> myocardium<br />
is left temporarily depolarized. After a pause, <strong>the</strong> tissue repolarizes and<br />
<strong>the</strong> regular sinus mechanism can instigate a subsequent beat. The conditions that<br />
caused <strong>the</strong> ectopic beat might persist (e.g., still too much caffeine leading to an<br />
excitable myocardium), but <strong>the</strong> ectopic beat itself is left behind in <strong>the</strong> past. Sometimes,<br />
a semistable pattern <strong>of</strong> sinus beats and ectopic beats develops. For instance,<br />
a repeating pattern <strong>of</strong> “sinus beat – VPC – sinus beat – VPC – and so forth.”<br />
can occur, termed ventricular bigeminy (see Figure 1.16). There can be so many ectopic<br />
beats ongoing that <strong>the</strong> overall heart rate is driven much higher than normal. 17<br />
The potential for serious problems is higher for those less common conditions<br />
in which a wavefront continues to propagate in a quasi-stable state, circulating<br />
repeatedly through <strong>the</strong> heart leading to repeated waves <strong>of</strong> tissue depolarization at<br />
an abnormally high rate. 18 When this cyclic, quasi-stable phenomenon occurs in<br />
<strong>the</strong> heart, it is called a reentrant arrhythmia. A classic example <strong>of</strong>ten caused by a<br />
reentrant pattern is ventricular tachycardia (VT) (see Figure 1.17). These states are<br />
extremely pathologic and can be rapidly fatal, because <strong>the</strong> rate <strong>of</strong> depolarization<br />
can be incompatible with effective cardiac pumping. At one extreme (rapid VT in<br />
an older frail heart) VT can be fatal in seconds to minutes. At <strong>the</strong> o<strong>the</strong>r extreme<br />
17. For instance, multifocal atrial tachycardia (MAT) is an arrhythmia in which two or more ectopic atrial<br />
sites generate ectopic beats leading to heart rates greater than 100 bpm. The classic MAT finding on ECG<br />
is three or more P wave morphologies, due to <strong>the</strong> normal sinus beats plus two or more atrial ectopic foci.<br />
18. To understand this, it is useful to describe <strong>the</strong> process in terms <strong>of</strong> “excitable media” models [4, 5]. Consider<br />
<strong>the</strong> analogy <strong>of</strong> <strong>the</strong> wavefront acting like a wildfire propagating through a landscape. If <strong>the</strong> vegetation grew<br />
back quickly (in a matter <strong>of</strong> minutes), one could envision a state in which <strong>the</strong> fire rotated through <strong>the</strong> forest<br />
in a large circle in a sustained fashion, and continued to “burn” vegetation just as it grew back. It might<br />
also be intuitive that this state would be more stable if <strong>the</strong>re was a large fire barrier at <strong>the</strong> center <strong>of</strong> this<br />
rotation.
1.3 Introduction to Clinical Electrocardiography: Abnormal Patterns 17<br />
Figure 1.18 Atrial fibrillation -------two examples. (From: [2]. c○ 2004 MIT OCW. Reprinted with permission.)<br />
(slow VT in a younger healthy heart) <strong>the</strong> cardiac output 19 can remain at a lifesustaining<br />
level. The ECG criteria for VT are three or more consecutive ectopic<br />
ventricular beats at a rate over 100 bpm. If <strong>the</strong> VT terminates within 15 seconds<br />
(or 30 seconds, by some conventions) it is known as nonsustained VT; o<strong>the</strong>rwise<br />
it is sustained VT. Because <strong>of</strong> <strong>the</strong> grave medical consequences <strong>of</strong> VT and related<br />
reentrant arrhythmias, <strong>the</strong>y have been well investigated experimentally, clinically,<br />
and <strong>the</strong>oretically.<br />
In some cases, <strong>the</strong> unified wavefront <strong>of</strong> depolarization can break down into<br />
countless smaller wavefronts which circulate quasi-randomly over <strong>the</strong> myocardium.<br />
This leads to a total breakdown <strong>of</strong> coordinated contraction, and <strong>the</strong> myocardium<br />
will appear to quiver. This is termed fibrillation.Inatrial fibrillation (see Figure 1.18)<br />
<strong>the</strong> AV node will still act as a gatekeeper for <strong>the</strong>se disorganized atrial wavefronts,<br />
maintaining organized ventricular depolarization distal to <strong>the</strong> AV node with normal<br />
QRS complexes. The ventricular rhythm is generally quite irregular and <strong>the</strong> rate will<br />
<strong>of</strong>ten be elevated. Often atrial fibrillation is well tolerated, provided <strong>the</strong> consequent<br />
ventricular rate is not excessive. AF can lead to a minor impairment in cardiac<br />
output due to reduced ventricular filling. In <strong>the</strong> long term, <strong>the</strong>re can be regions in<br />
a fibrillating atrium where, because <strong>of</strong> <strong>the</strong> absence <strong>of</strong> contractions, <strong>the</strong> blood sits<br />
in stasis, and this can lead to blood clot formation within <strong>the</strong> heart. These clots<br />
can reenter <strong>the</strong> circulation and cause acute arterial blockages (e.g., cerebrovascular<br />
strokes) and <strong>the</strong>refore patients with atrial fibrillation are <strong>of</strong>ten anticoagulated. In<br />
contrast to atrial fibrillation, untreated ventricular fibrillation (see Figure 1.19) is<br />
fatal in seconds to minutes: The appearance <strong>of</strong> fibrillating ventricles has been likened<br />
to a “bag <strong>of</strong> worms” and this causes circulatory arrest, <strong>the</strong> termination <strong>of</strong> blood<br />
flow through <strong>the</strong> cardiovascular circuit.<br />
19. The volume <strong>of</strong> blood pumped by <strong>the</strong> heart per minute, calculated as <strong>the</strong> product <strong>of</strong> <strong>the</strong> stroke volume<br />
(SV) and <strong>the</strong> heart rate. The SV is <strong>the</strong> amount <strong>of</strong> blood pushed into <strong>the</strong> aorta with each heart beat. Stroke<br />
volume = end-diastolic volume (EDV) minus end-systolic volume (ESV).
18 The <strong>Physiological</strong> <strong>Basis</strong> <strong>of</strong> <strong>the</strong> <strong>Electrocardiogram</strong><br />
Figure 1.19 Ventricular fibrillation -------three examples. (From: [2]. c○ 2004 MIT OCW. Reprinted with<br />
permission.)<br />
1.3.3 Conduction Blocks, Bradycardia, and Escape Rhythms<br />
The o<strong>the</strong>r category <strong>of</strong> arrhythmias is related to excessively slow rhythms, and abnormal<br />
blockages <strong>of</strong> wavefront propagation. For instance, an aging SA node may<br />
pace <strong>the</strong> heart too slowly, leading to low blood pressure and weakness or fainting.<br />
Assuming this is not a result <strong>of</strong> excessive medication, <strong>the</strong>se symptoms might require<br />
that an artificial pacemaker be implanted. The AV node may also develop conduction<br />
pathologies which slow <strong>the</strong> ventricular heart rate: It may fail to conduct some<br />
atrial wavefronts (termed second-degree AV block; see Figure 1.20), or it may fail<br />
to conduct all atrial wavefronts (termed third-degree AV block; see Figure 1.21).<br />
Assuming this is not a result <strong>of</strong> excessive medication, most third-degree AV block,<br />
and some second-degree AV block, require pacemaker <strong>the</strong>rapy. In first-degree AV<br />
block, <strong>the</strong> AV node conducts atrial wavefronts with an abnormal delay, but because<br />
<strong>the</strong> atrial wavefronts are eventually propagated to <strong>the</strong> ventricles, first-degree AV<br />
block does not slow <strong>the</strong> overall ventricular rate.<br />
Sections <strong>of</strong> <strong>the</strong> specialized conducting fibers in <strong>the</strong> ventricles can also fail, such<br />
that depolarization waves must reach some portions <strong>of</strong> <strong>the</strong> ventricles via slower<br />
Figure 1.20 Second-degree AV block. In this subtype <strong>of</strong> second-degree AV block, termed Wenckebach,<br />
also termed Mobitz Type I, <strong>the</strong>re is a characteristic leng<strong>the</strong>ning <strong>of</strong> <strong>the</strong> delay between <strong>the</strong> atrial<br />
P wave and <strong>the</strong> ventricular QRS, and ultimately <strong>the</strong>re is a failure to conduct a P wave. Then this cycle<br />
repeats. In <strong>the</strong> example illustrated, <strong>the</strong>re are three P waves (indicated by small gray arrowheads)<br />
followed by ventricular beats (indicated by large white arrowheads), and <strong>the</strong>n <strong>the</strong> AV node fails to<br />
conduct <strong>the</strong> fourth P wave in each cycle (small gray arrowheads without a subsequent large white<br />
arrowheads). (From: [2]. c○ 2004 MIT OCW. Reprinted with permission.)
1.3 Introduction to Clinical Electrocardiography: Abnormal Patterns 19<br />
Figure 1.21 Third-degree AV block. There is a failure <strong>of</strong> <strong>the</strong> AV node to conduct any wavefronts<br />
from <strong>the</strong> atria to <strong>the</strong> ventricles. The ventricular beats are escape beats, originating electrically from<br />
<strong>the</strong> specialized conducting fibers just below <strong>the</strong> AV node. The ability to generate escape beats is <strong>the</strong><br />
heart’s fail-safe mechanism for what would o<strong>the</strong>rwise cause fatal cardiac (e.g., ventricular) arrest.<br />
Notice <strong>the</strong>re is no relationship between <strong>the</strong> atrial P waves (indicated by small gray arrowheads)<br />
and <strong>the</strong> junctional escape beats (indicated by large white arrowheads). Also see Figure 1.23 for an<br />
example <strong>of</strong> a ventricular escape beat. (From: [2]. c○ 2004 MIT OCW. Reprinted with permission.)<br />
muscle-to-muscle propagation. There are a classic set <strong>of</strong> changes associated with<br />
failures <strong>of</strong> different conduction bundles (e.g., right bundle branch block and left<br />
bundle branch block; see Figure 1.22). These blocks usually have a minimal effect<br />
on pumping efficacy. However, <strong>the</strong>y can dramatically change <strong>the</strong> cardiac vector’s<br />
trajectory and hence <strong>the</strong> surface ECG. They can mask o<strong>the</strong>r ECG changes indicative<br />
<strong>of</strong> disease (e.g., ischemia). In some cases, <strong>the</strong>se conduction abnormalities indicate<br />
some o<strong>the</strong>r underlying pathology <strong>of</strong> great importance (for instance, a pulmonary<br />
embolism can cause a new right bundle branch block, and acute anterior ischemia<br />
can cause a new left bundle branch block).<br />
The topic <strong>of</strong> bradyarrhythmias and heart blocks leads to <strong>the</strong> topic <strong>of</strong> escape<br />
beats (see Figures 1.21 and 1.23). An escape beat is similar to an ectopic beat, in that<br />
it is <strong>the</strong> initiation <strong>of</strong> a depolarization wavefront outside <strong>of</strong> <strong>the</strong> SA node. However,<br />
<strong>the</strong> difference is that <strong>the</strong> escape beat is a normal, compensatory response, a normal<br />
fail-safe functionality <strong>of</strong> <strong>the</strong> heart: There is a network <strong>of</strong> cardiac cells able to initiate<br />
Figure 1.22 Classic ECG pattern <strong>of</strong> left bundle branch block. (From: [2]. c○ 2004 MIT OCW.<br />
Reprinted with permission.)
20 The <strong>Physiological</strong> <strong>Basis</strong> <strong>of</strong> <strong>the</strong> <strong>Electrocardiogram</strong><br />
Figure 1.23 Ventricular escape beat. Note <strong>the</strong> atrial P wave (black arrowhead) followed by an<br />
evident pause, indicating a failure to conduct through <strong>the</strong> AV node. The ventricular escape beat<br />
(white arrowhead) is a fail-safe mechanism so that conduction blocks do not cause ventricular cardiac<br />
arrest. Also see Figure 1.21. (From: [2]. c○ 2004 MIT OCW. Reprinted with permission.)<br />
heart beats, so that a key life-sustaining function (e.g., pacing <strong>the</strong> heart) is not<br />
exclusively relegated to a microscopic collection cells in <strong>the</strong> SA node. The cells in<br />
<strong>the</strong> backup system have intrinsic rates <strong>of</strong> firing that are slower than <strong>the</strong> SA node.<br />
So while <strong>the</strong> SA node is given <strong>the</strong> opportunity to pace <strong>the</strong> heart, <strong>the</strong> o<strong>the</strong>r regions<br />
will initiate heart beats if <strong>the</strong>re has been an excessively long pause in <strong>the</strong> SA node.<br />
Therefore, a ventricular beat which occurs in <strong>the</strong> setting <strong>of</strong> third-degree heart block<br />
is termed a ventricular escape beat, and it represents an appropriate healthy response<br />
to <strong>the</strong> lack <strong>of</strong> any o<strong>the</strong>r pacemaker trigger. When nonsinus beats appear on <strong>the</strong><br />
ECG, it is important to differentiate ectopic beats (where <strong>the</strong> pathology is aberrant<br />
automaticity) from escape beats (where <strong>the</strong> pathology is abnormal conduction),<br />
because <strong>the</strong> treatments are quite different. Note that ectopic beats are generally<br />
premature, and escape beats terminate a prolonged RR interval.<br />
1.3.4 Cardiac Ischemia, O<strong>the</strong>r Metabolic Disturbances,<br />
and Structural Abnormalities<br />
The ECG can reveal metabolic abnormalities <strong>of</strong> <strong>the</strong> myocardium. The most medically<br />
significant abnormality is ischemia, when part <strong>of</strong> <strong>the</strong> myocardium is not<br />
receiving enough blood flow, <strong>of</strong>ten caused by disease <strong>of</strong> <strong>the</strong> coronary arteries (ischemia<br />
will ultimately progress to myocardial cell death). Recording a 12-lead ECG<br />
is a standard-<strong>of</strong>-care diagnostic test in any evaluation <strong>of</strong> possible cardiac ischemia.<br />
Ischemia <strong>of</strong>ten changes <strong>the</strong> appearance <strong>of</strong> <strong>the</strong> T wave and <strong>the</strong> ST interval. This is<br />
because <strong>of</strong> a current <strong>of</strong> injury between <strong>the</strong> ischemic and nonischemic myocardium,<br />
which alters <strong>the</strong> main cardiac vector. There are classic patterns <strong>of</strong> ischemia, which<br />
are seen in only a minority <strong>of</strong> ischemic events (see Figure 1.24). In most ischemic<br />
events, <strong>the</strong>re are “nonspecific” ECG changes, such as changes in <strong>the</strong> T wave that<br />
may or may not be caused by ischemia. In a small percentage <strong>of</strong> cases, <strong>the</strong>re can be<br />
ischemia without any grossly evident ECG changes. Overall, <strong>the</strong> ECG is not highly<br />
sensitive nor specific for cardiac ischemia, but larger regions <strong>of</strong> cardiac ischemia<br />
are associated with more substantial ECG changes (as well as a higher mortality<br />
rate), so this information is very useful in decision-making. For example, a patient<br />
with classic changes <strong>of</strong> acute ischemia is <strong>of</strong>ten a good candidate for powerful thrombolytic<br />
(clot dissolving) medication. Whereas patients without those classic changes<br />
are not considered good candidates for <strong>the</strong>se drugs because, on average, <strong>the</strong> risks<br />
<strong>of</strong> <strong>the</strong> <strong>the</strong>rapy, including intracranial hemorrhage and internal bleeding, outweigh<br />
<strong>the</strong> benefits.
1.3 Introduction to Clinical Electrocardiography: Abnormal Patterns 21<br />
Figure 1.24 Acute myocardial infarction. Large areas <strong>of</strong> ischemic anterior myocardium <strong>of</strong>ten produce<br />
ST-segment elevation in multiple contiguous precordial ECG leads (or in all <strong>the</strong> precordial leads,<br />
in this dramatic example). Also note <strong>the</strong>re is minor ST-segment depression in <strong>the</strong> inferior lead III,<br />
which in this context is referred to as a ‘‘reciprocal change.” (From: [9]. c○ 2001–2006 Beth Israel<br />
Deaconess Medical Center. Reprinted with permission.)<br />
O<strong>the</strong>r metabolic abnormalities which cause characteristic changes in <strong>the</strong> ECG<br />
include electrolyte abnormalities. The classic indicators <strong>of</strong> high serum potassium<br />
levels (hyperkalemia) include a high, pointed T wave, and ultimately, loss <strong>of</strong> <strong>the</strong><br />
P wave and distortion <strong>of</strong> <strong>the</strong> QRS (see Figure 1.25). Hypokalemia causes an undulation<br />
after <strong>the</strong> T wave called a U wave. Calcium and magnesium disturbances, and<br />
Figure 1.25 Hyperkalemia (moderate/severe). The K + was 10.5 mEq/L in a patient with renal<br />
failure. Note <strong>the</strong> loss <strong>of</strong> P waves and <strong>the</strong> widening <strong>of</strong> <strong>the</strong> QRS complex. There are numerous classic<br />
ECG morphologies associated with hyperkalemia. This example shows what Marriott [8] has termed a<br />
‘‘dumping pattern’’ because ‘‘it looks as though a rotund body has been dumped in <strong>the</strong> hammock<br />
<strong>of</strong> <strong>the</strong> ST segment ...making <strong>the</strong> ST segment sag horizontally ...and verticalizing <strong>the</strong> proximal limb<br />
<strong>of</strong> <strong>the</strong> upright T wave.’’ (From: [9]. c○ 2001–2006 Beth Israel Deaconess Medical Center. Reprinted<br />
with permission.)
22 The <strong>Physiological</strong> <strong>Basis</strong> <strong>of</strong> <strong>the</strong> <strong>Electrocardiogram</strong><br />
Figure 1.26 An R-on-T ventricular premature beat initiations polymorphic ventricular tachycardia.<br />
(From: [2]. c○ MIT OCW. Reprinted with permission.)<br />
also extreme cold body temperature, are o<strong>the</strong>r causes <strong>of</strong> ST–T wave abnormalities.<br />
Therapeutic drugs can also alter <strong>the</strong> appearance <strong>of</strong> <strong>the</strong> ECG. One alteration <strong>of</strong> significance<br />
is a delay in <strong>the</strong> T wave relative to <strong>the</strong> QRS, so-called QT prolongation.<br />
A prolonged 20 QT indicates a myocardium at risk for triggered activity, in which a<br />
cardiac cell will rapidly and repeatedly depolarize, associated with a kind <strong>of</strong> dangerous<br />
ventricular tachycardia called torsades des pointes. In <strong>the</strong> so-called R-on-T<br />
phenomenon, <strong>the</strong> heart depolarizes in <strong>the</strong> midst <strong>of</strong> its repolarization and can trigger<br />
a life-threatening tachyarrhythmia (see Figure 1.26). R-on-T can occur because <strong>the</strong><br />
QT interval is abnormally long. It also can occur because <strong>of</strong> a mechanical blow to<br />
<strong>the</strong> chest during repolarization (e.g., a young hockey player struck in <strong>the</strong> chest). And<br />
relevant to signal processors, it can occur if a patient receives electrical cardioversion<br />
in <strong>the</strong> middle <strong>of</strong> repolarization when <strong>the</strong> T wave occurs (hence <strong>the</strong>se devices are<br />
imbued with a synchronization mode in which <strong>the</strong> QRS complex is automatically<br />
identified, and <strong>the</strong> device is prevented from discharging in <strong>the</strong> temporal vicinity <strong>of</strong><br />
<strong>the</strong> following T wave).<br />
The ECG can reveal abnormalities <strong>of</strong> <strong>the</strong> geometry <strong>of</strong> <strong>the</strong> heart. This refers to<br />
pathologies in which part <strong>of</strong> <strong>the</strong> heart has become enlarged (too much myocardium),<br />
or when part <strong>of</strong> <strong>the</strong> heart has undergone cell death and scarring (electrically absent<br />
myocardium). Noninvasive echocardiography is now <strong>the</strong> standard method by<br />
which such abnormalities are diagnosed, and so in general, <strong>the</strong> ECG has been<br />
relegated to a convenient if imperfect screening test for structural abnormalities<br />
<strong>of</strong> <strong>the</strong> heart. Examples <strong>of</strong> conditions which are <strong>of</strong>ten apparent in <strong>the</strong> surface ECG<br />
include:<br />
• Thickening <strong>of</strong> <strong>the</strong> ventricular walls caused by years <strong>of</strong> beating against high<br />
arterial blood pressure (hypertrophy);<br />
• Ballooning <strong>of</strong> <strong>the</strong> ventricular walls caused by accommodating large volumes<br />
<strong>of</strong> blood regurgitated from upstream when <strong>the</strong>re is a leaky, incompetent valve;<br />
• Ventricular wall aneurysms which form after heart attacks;<br />
• Scars in <strong>the</strong> heart (after heart attacks) which cause part <strong>of</strong> <strong>the</strong> heart to be<br />
electrically silent;<br />
• Abnormal fluid collecting around <strong>the</strong> heart (termed an effusion) which can impair<br />
<strong>the</strong> heart’s ability to fill and hence pump effectively (cardiac<br />
tamponade).<br />
20. It is important to allow for <strong>the</strong> shortening <strong>of</strong> <strong>the</strong> QT interval due to increases in heart rate, and so a corrected<br />
QT interval, QTc, is usually used. See Chapter 3 for more details.
1.3 Introduction to Clinical Electrocardiography: Abnormal Patterns 23<br />
These conditions change <strong>the</strong> trajectory and/or magnitude <strong>of</strong> <strong>the</strong> normal heart<br />
vector, which can distort <strong>the</strong> normal ECG morphology. A review <strong>of</strong> all <strong>the</strong>se conditions<br />
and <strong>the</strong>ir resultant ECG appearance is beyond <strong>the</strong> scope <strong>of</strong> this chapter, and<br />
introductory or advanced textbooks focused solely on <strong>the</strong> clinical interpretation <strong>of</strong><br />
<strong>the</strong> ECG are plentiful. However, in <strong>the</strong> following section a brief overview <strong>of</strong> how<br />
clinicians analyze <strong>the</strong> ECG is presented. This should not be taken as a definitive<br />
guide, but as a general strategy that may prove useful in designing an ECG analysis<br />
algorithm.<br />
1.3.5 A Basic Approach to ECG Analysis<br />
In analyzing <strong>the</strong> clinical electrocardiogram, it is important to use a systematic approach.<br />
The following overview, which illustrates a clinical approach, should not be<br />
considered completely thorough, but simply a guide to understanding how clinicians<br />
identify abnormalities in <strong>the</strong> ECG.<br />
1. Identify <strong>the</strong> QRS complexes. The following observations should be made:<br />
• What is <strong>the</strong> ventricular rate?<br />
• Are <strong>the</strong> QRS complexes spaced at regular intervals? If not, what is <strong>the</strong><br />
nature <strong>of</strong> <strong>the</strong> irregularity?<br />
• Are <strong>the</strong> QRS complexes identical in shape in a given lead? Are <strong>the</strong>y <strong>of</strong><br />
normal size and morphology?<br />
2. Identify <strong>the</strong> P waves. In some cases this will require careful observation, and<br />
more than one lead axis may be necessary. The following questions should<br />
be explored:<br />
• Is <strong>the</strong>re a one-to-one relationship between P-waves and QRS complexes?<br />
If not, is <strong>the</strong>re a definable pattern?<br />
• Is <strong>the</strong> PR interval <strong>of</strong> normal duration?<br />
• What is <strong>the</strong> atrial rate?<br />
• Are <strong>the</strong> P waves identical in shape in a given lead? Are <strong>the</strong>y <strong>of</strong> normal size<br />
and shape?<br />
Based on <strong>the</strong> above analysis, it should be possible to identify <strong>the</strong> mechanism<br />
<strong>of</strong> <strong>the</strong> rhythm in most cases. See Chapter 3 for more information.<br />
3. Examine <strong>the</strong> QRS complex in each lead. Is <strong>the</strong> QRS axis normal? Overall,<br />
are <strong>the</strong> QRS widths and amplitudes normal? Often, <strong>the</strong> QRS complexes are<br />
viewed in several “groups” that are specific to a particular region <strong>of</strong> <strong>the</strong><br />
heart. 21 The waveform patterns should also be checked for signs <strong>of</strong> intraventricular<br />
conduction block, significant amplitude Q waves and precordial<br />
R-wave pattern normality.<br />
4. Examine <strong>the</strong> ST-T segments. Are <strong>the</strong>re abnormalities (such as elevation or<br />
depression; see Chapter 10)? Is <strong>the</strong> abnormality suggestive <strong>of</strong> ischemia, infarction,<br />
or hypo<strong>the</strong>rmia?<br />
21. The basic lead groups are: <strong>the</strong> inferior leads (II, III, and aVF), <strong>the</strong> anterior leads (V2, V3, and V4), <strong>the</strong><br />
lateral precordial leads (V4, V5, and V6), and <strong>the</strong> high lateral leads (I and aVL).
24 The <strong>Physiological</strong> <strong>Basis</strong> <strong>of</strong> <strong>the</strong> <strong>Electrocardiogram</strong><br />
5. Examine <strong>the</strong> T waves. Are <strong>the</strong>ir shapes normal? In each lead, are <strong>the</strong>y<br />
oriented in <strong>the</strong> same direction as <strong>the</strong> QRS complex? If not, is it suggestive<br />
<strong>of</strong> ischemia or ventricular conduction abnormalities, or a potassium<br />
abnormality?<br />
6. Examine <strong>the</strong> QT interval. Is it over half <strong>the</strong> RR interval? (See Chapters 3<br />
and 11.)<br />
Once an abnormality is identified, <strong>the</strong>re are <strong>of</strong>ten several potential explanations,<br />
many <strong>of</strong> which lead to several ECG pathologies and it may not be possible to<br />
determine <strong>the</strong> significance <strong>of</strong> <strong>the</strong> abnormality with certainty. To confirm a potential<br />
diagnosis from <strong>the</strong> ECG, o<strong>the</strong>r characteristic abnormalities are <strong>of</strong>ten sought. For a<br />
given individual, comparing a new ECG with a prior ECG provides an invaluable<br />
reference, particularly if trying to ascertain when ECG abnormalities are acute or<br />
not. For instance, for a patient with chest pain, abnormal ST-T wave patterns are<br />
much more concerning for ischemia when <strong>the</strong>y are new (e.g., not present in an<br />
ECG recorded 1 year earlier). If <strong>the</strong> ST-T wave patterns existed long before <strong>the</strong> new<br />
symptoms, one may deduce that <strong>the</strong>se patterns are not directly related to <strong>the</strong> acute<br />
pathology.<br />
1.4 Summary<br />
References<br />
This chapter has presented a brief summary <strong>of</strong> <strong>the</strong> etiology <strong>of</strong> <strong>the</strong> electrocardiogram,<br />
toge<strong>the</strong>r with an overview <strong>of</strong> <strong>the</strong> mechanisms that lead to <strong>the</strong> manifestation<br />
<strong>of</strong> both normal and abnormal morphologies on <strong>the</strong> many different vectors that constitute<br />
<strong>the</strong> clinical ECG leads. After an overview <strong>of</strong> <strong>the</strong> variables to be considered<br />
in any ECG data collection exercise (Chapter 2), Chapters 3 and 4 provide a more<br />
ma<strong>the</strong>matical analysis <strong>of</strong> <strong>the</strong> normal and abnormal waveforms that may be encountered,<br />
and some empirical models available for describing <strong>the</strong>se waveforms (or <strong>the</strong>ir<br />
underlying processes). It is hoped that <strong>the</strong>se introductory chapters will provide <strong>the</strong><br />
reader with <strong>the</strong> relevant framework in which to apply numerical analysis techniques<br />
to <strong>the</strong> ECG.<br />
[1] Mark, R. G., “Biological Measurement: Electrical Characteristics <strong>of</strong> <strong>the</strong> Heart,” in Systems<br />
& Control Encyclopedia, Singh, M. G., (ed.), Oxford, U.K.: Permagon Press, 1990, pp. 450–<br />
456.<br />
[2] Mark, R. G., HST.542J/2.792J/BE.371J/6.022J Quantitative Physiology: Organ Transport<br />
Systems, Lecture notes from HST/MIT Open Courseware 2004, available at http://<br />
ocw.mit.edu/OcwWeb/Health-Sciences-and-Technology/HST-542JSpring-2004/Course<br />
Home/.<br />
[3] Malmivuo, J., and R. Plonsey, Bioelectromagnetism: Principles and Applications <strong>of</strong><br />
Bioelectric and Biomagnetic Fields, Oxford, U.K.: Oxford University Press, 1995, available<br />
at http://butler.cc.tut.fi/∼malmivuo/bem/bembook/.<br />
[4] Barkley, D., M. Kress, and S. Tucherman, “Spiral-Wave Dynamics in a Simple Model <strong>of</strong><br />
Excitable Media: Transition from Simple to Compound Rotation,” Phys. Rev. A., Vol. 42,<br />
1990, pp. 2489–2491.
1.4 Summary 25<br />
[5] Ito, H., and L. Glass, “Spiral Breakup in a New Model <strong>of</strong> Discrete Excitable Media,”<br />
Phys. Rev. Lett., Vol. 66, No. 5, 1991, pp. 671–674.<br />
[6] Katz, A. M., Physiology <strong>of</strong> <strong>the</strong> Heart, 4th ed., Philadelphia, PA: Lippincott Williams &<br />
Wilkins, 2006.<br />
[7] Fletcher, G. F., et al., “Exercise Standards; A Statement for Healthcare Pr<strong>of</strong>essionals from<br />
<strong>the</strong> American Heart Association,” Circulation, Vol. 91, 2001, p. 580.<br />
[8] Marriott, H. J. L., Emergency Electrocardiography, Naples: Trinity Press, 1997.<br />
[9] Nathanson, L. A., et al., “ECG Wave-Maven: Self-Assessment Program for Students and<br />
Clinicians,” http://ecg.bidmc.harvard.edu.<br />
Selected Bibliography<br />
Alexander, R. W., R. C. Schlant, and V. Fuster, (eds.), Hurst’s The Heart, 9th ed., Vol. 1, Arteries<br />
and Veins, New York: McGraw-Hill, Health Pr<strong>of</strong>essions Division, 1998.<br />
El-Sherif, N., and P. Samet, Cardiac Pacing and Electrophysiology, 3rd ed., Philadelphia, PA:<br />
Harcourt Brace Jovanovich, Inc., W. B. Saunders Company, 1991.<br />
Gima, K., and Y. Rudy, “Ionic Current <strong>Basis</strong> <strong>of</strong> Electrocardiographic Waveforms: A Model Study,”<br />
Circulation, Vol. 90, 2002, pp. 889–896.<br />
Katz, E., Willem Einthoven; A Biography, 2005, available at http://chem.ch.huji.ac.il/<br />
∼eugeniik/history/einthoven.html.<br />
Lilly, L. S., Pathophysiology <strong>of</strong> Heart Disease, 3rd ed., Philadelphia, PA: Lippincott Williams &<br />
Wilkins, 2002.<br />
Marriott, H. J., Rhythm Quizlets: Self Assessment, 2nd ed., Baltimore, MD: Williams & Wilkins,<br />
1996.<br />
Massie, E., and T. J. Walsh, Clinical Vectorcardiography and Electrocardiography, Chicago, IL:<br />
The Year Book Publishers, Inc., 1960.<br />
Netter, F. H., A Compilation <strong>of</strong> Paintings on <strong>the</strong> Normal and Pathologic Anatomy and Physiology,<br />
Embryology, and Diseases <strong>of</strong> <strong>the</strong> Heart, edited by Fredrick F. Yonkman, Volume 5 <strong>of</strong> The<br />
Ciba Collection <strong>of</strong> Medical Illustrations, Summit, NJ: Ciba Pharmaceutical Company, 1969.<br />
Wagner, G. W., Marriott’s Practical Electrocardiography, 9th ed., Baltimore, MD: Williams &<br />
Wilkins, 1994.<br />
Wellens, H. J., K. I. Lie, and M. J. Janse, (eds.), The Conduction System <strong>of</strong> <strong>the</strong> Heart, The Hague:<br />
Martinus Nijh<strong>of</strong>f Medical Division, 1978.<br />
Zipes, D. P., and J. Jalife, (eds.), Cardiac Electrophysiology: From Cell to Bedside, 4th ed.,<br />
Philadelphia, PA: W.B. Saunders and Company, 2004.<br />
Zipes, D. P., et al., (eds.), Braunwald’s Heart Disease, 7th ed., Oxford, U.K.: Elsevier, 2004.