document - Cosmo
document - Cosmo
document - Cosmo

You also want an ePaper? Increase the reach of your titles
YUMPU automatically turns print PDFs into web optimized ePapers that Google loves.
1 Working Group on Data Assimilation 7<br />
refractivity values are based on a collocation and interpolation procedure (COMEDIE software<br />
package, Troller et. al., 2000) using the operationally available meteorological ground<br />
station data (ANETZ, MeteoSwiss).<br />
The least-squares adjustment of the tomographic equation system yields the matrices of<br />
the cofactors of the unknown parameters from the inverted normal matrices (e.g. Mikhail,<br />
1976). The comparison of the two cofactor matrices of the two solutions reveals the impact on<br />
quality of the two different types of solution. The a priori calculation takes no measurements<br />
into account. It assesses the geometry and the weighting of the measurements, only. The<br />
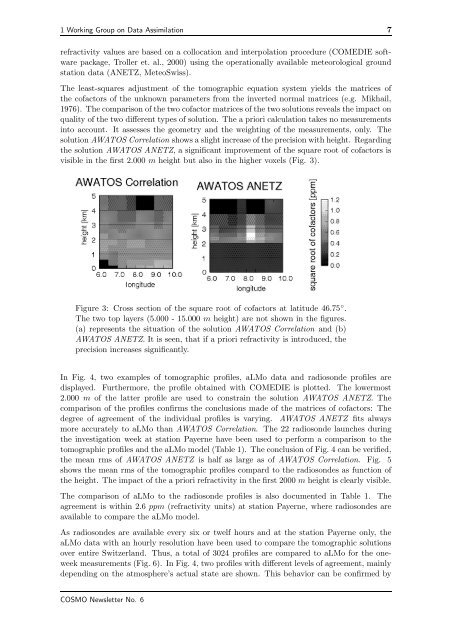
solution AWATOS Correlation shows a slight increase of the precision with height. Regarding<br />
the solution AWATOS ANETZ, a significant improvement of the square root of cofactors is<br />
visible in the first 2.000 m height but also in the higher voxels (Fig. 3).<br />
Figure 3: Cross section of the square root of cofactors at latitude 46.75 ◦ .<br />
The two top layers (5.000 - 15.000 m height) are not shown in the figures.<br />
(a) represents the situation of the solution AWATOS Correlation and (b)<br />
AWATOS ANETZ. It is seen, that if a priori refractivity is introduced, the<br />
precision increases significantly.<br />
In Fig. 4, two examples of tomographic profiles, aLMo data and radiosonde profiles are<br />
displayed. Furthermore, the profile obtained with COMEDIE is plotted. The lowermost<br />
2.000 m of the latter profile are used to constrain the solution AWATOS ANETZ. The<br />
comparison of the profiles confirms the conclusions made of the matrices of cofactors: The<br />
degree of agreement of the individual profiles is varying. AWATOS ANETZ fits always<br />
more accurately to aLMo than AWATOS Correlation. The 22 radiosonde launches during<br />
the investigation week at station Payerne have been used to perform a comparison to the<br />
tomographic profiles and the aLMo model (Table 1). The conclusion of Fig. 4 can be verified,<br />
the mean rms of AWATOS ANETZ is half as large as of AWATOS Correlation. Fig. 5<br />
shows the mean rms of the tomographic profiles compard to the radiosondes as function of<br />
the height. The impact of the a priori refractivity in the first 2000 m height is clearly visible.<br />
The comparison of aLMo to the radiosonde profiles is also <strong>document</strong>ed in Table 1. The<br />
agreement is within 2.6 ppm (refractivity units) at station Payerne, where radiosondes are<br />
available to compare the aLMo model.<br />
As radiosondes are available every six or twelf hours and at the station Payerne only, the<br />
aLMo data with an hourly resolution have been used to compare the tomographic solutions<br />
over entire Switzerland. Thus, a total of 3024 profiles are compared to aLMo for the oneweek<br />
measurements (Fig. 6). In Fig. 4, two profiles with different levels of agreement, mainly<br />
depending on the atmosphere’s actual state are shown. This behavior can be confirmed by<br />
COSMO Newsletter No. 6