Basic UV-Vis Theory, Concepts and Applications
Basic UV-Vis Theory, Concepts and Applications
Basic UV-Vis Theory, Concepts and Applications

You also want an ePaper? Increase the reach of your titles
YUMPU automatically turns print PDFs into web optimized ePapers that Google loves.
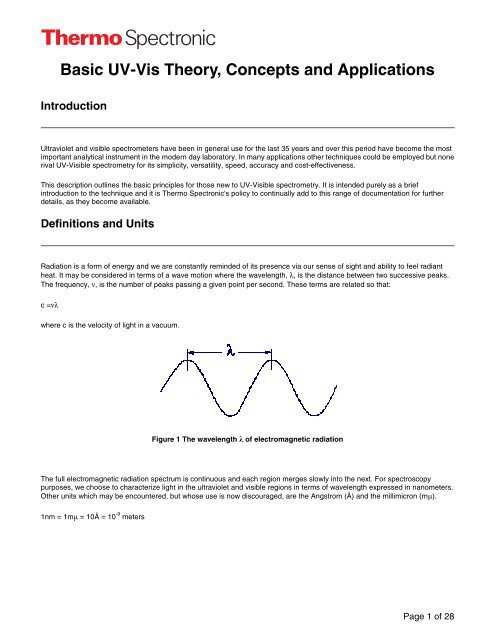
<strong>Basic</strong> <strong>UV</strong>-<strong>Vis</strong> <strong>Theory</strong>, <strong>Concepts</strong> <strong>and</strong> <strong>Applications</strong><br />
Introduction<br />
Ultraviolet <strong>and</strong> visible spectrometers have been in general use for the last 35 years <strong>and</strong> over this period have become the most<br />
important analytical instrument in the modern day laboratory. In many applications other techniques could be employed but none<br />
rival <strong>UV</strong>-<strong>Vis</strong>ible spectrometry for its simplicity, versatility, speed, accuracy <strong>and</strong> cost-effectiveness.<br />
This description outlines the basic principles for those new to <strong>UV</strong>-<strong>Vis</strong>ible spectrometry. It is intended purely as a brief<br />
introduction to the technique <strong>and</strong> it is Thermo Spectronic's policy to continually add to this range of documentation for further<br />
details, as they become available.<br />
Definitions <strong>and</strong> Units<br />
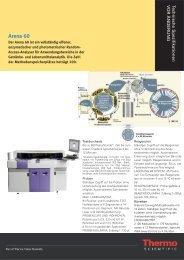
Radiation is a form of energy <strong>and</strong> we are constantly reminded of its presence via our sense of sight <strong>and</strong> ability to feel radiant<br />
heat. It may be considered in terms of a wave motion where the wavelength, λ, is the distance between two successive peaks.<br />
The frequency, ν, is the number of peaks passing a given point per second. These terms are related so that:<br />
c =νλ<br />
where c is the velocity of light in a vacuum.<br />
Figure 1 The wavelength λ of electromagnetic radiation<br />
The full electromagnetic radiation spectrum is continuous <strong>and</strong> each region merges slowly into the next. For spectroscopy<br />
purposes, we choose to characterize light in the ultraviolet <strong>and</strong> visible regions in terms of wavelength expressed in nanometers.<br />
Other units which may be encountered, but whose use is now discouraged, are the Angstrom (Å) <strong>and</strong> the millimicron (mµ).<br />
1nm = 1mµ = 10Å = 10 -9 meters<br />
Page 1 of 28
<strong>Basic</strong> <strong>UV</strong>-<strong>Vis</strong> <strong>Theory</strong>, <strong>Concepts</strong> <strong>and</strong> <strong>Applications</strong><br />
For convenience of reference, definitions of the various spectral regions have been set by the Joint Committee on Nomenclature<br />
in Applied Spectroscopy:<br />
Region Wavelength (nm)<br />
Far ultraviolet 10-200<br />
Near ultraviolet 200-380<br />
<strong>Vis</strong>ible 380-780<br />
Near infrared 780-3000<br />
Middle infrared 3000-30,000<br />
Far infrared 30,000-300,000<br />
Microwave 300,000-1,000,000,000<br />
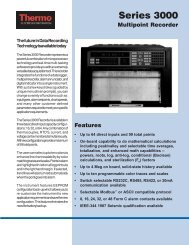
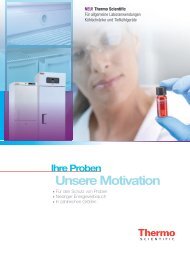
The human eye is only sensitive to a tiny proportion of the total electromagnetic spectrum between approximately 380 <strong>and</strong> 780<br />
nm <strong>and</strong> within this area we perceive the colors of the rainbow from violet through to red. If the full electromagnetic spectrum<br />
shown in Figure 2 was redrawn on a linear scale <strong>and</strong> the visible region was represented by the length of one centimeter, then<br />
the boundary between radio <strong>and</strong> microwaves would have to be drawn approximately 25 kilometers away!<br />
Radiation Sources<br />
Figure 2 The electromagnetic spectrum<br />
Besides the sun, the most conveniently available source of visible radiation with which we are familiar is the tungsten lamp. If<br />
the current in the circuit supplying such a lamp is gradually increased from zero, the lamp filament at first can be felt to be<br />
emitting warmth, then glows dull red <strong>and</strong> the gradually brightens until it is emitting an intense white light <strong>and</strong> a considerable<br />
amount of heat.<br />
Page 2 of 28
<strong>Basic</strong> <strong>UV</strong>-<strong>Vis</strong> <strong>Theory</strong>, <strong>Concepts</strong> <strong>and</strong> <strong>Applications</strong><br />
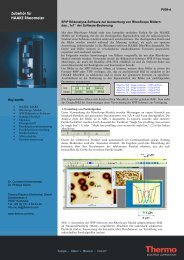
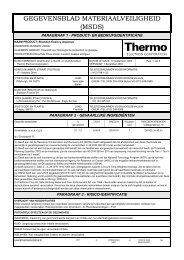
The radiation from normal hot solids is made up of many wavelengths <strong>and</strong> the energy emitted at any particular wavelength<br />
depends largely on the temperature of the solid <strong>and</strong> is predictable from probability theory. The curves in Figure 3 show the<br />
energy distribution for a tungsten filament at three different temperatures. Such radiation is known as 'black body radiation'. Note<br />
how the emitted energy increases with temperature <strong>and</strong> how the wavelength of maximum energy shifts to shorter wavelengths.<br />
More recently it has become common practice to use a variant of this - the tungsten-halogen lamp. The quartz envelope<br />
transmits radiation well into the <strong>UV</strong> region. For the <strong>UV</strong> region itself the most common source is the deuterium lamp <strong>and</strong> a <strong>UV</strong>-<br />
<strong>Vis</strong>ible spectrometer will usually have both lamp types to cover the entire wavelength range.<br />
Quantum <strong>Theory</strong><br />
Figure 3 Tungsten filament radiation<br />
To gain an underst<strong>and</strong>ing of the origins of practical absorption spectrometry, a short diversion into quantum theory is necessary.<br />
For this purpose, it is best to think of radiation as a stream of particles known as photons instead of the waves considered<br />
earlier. Atoms <strong>and</strong> molecules exist in a number of defined energy states or levels <strong>and</strong> a change of level requires the absorption<br />
or emission of an integral number of a unit of energy called a quantum, or in our context, a photon.<br />
The energy of a photon absorbed or emitted during a transition from one molecular energy level to another is given by the<br />
equation<br />
e=hν<br />
where h is known as Planck's constant <strong>and</strong> ν is the frequency of the photon. We have already seen that c= νλ ,<br />
therefore, E= hc/λ<br />
Page 3 of 28
<strong>Basic</strong> <strong>UV</strong>-<strong>Vis</strong> <strong>Theory</strong>, <strong>Concepts</strong> <strong>and</strong> <strong>Applications</strong><br />
Thus, the shorter the wavelength, the greater the energy of the photon <strong>and</strong> vice versa.<br />
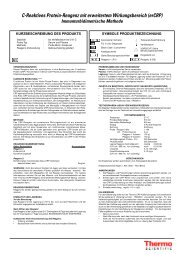
A molecule of any substance has an internal energy which can be considered as the sum of the energy of its electrons, the<br />
energy of vibration between its constituent atoms <strong>and</strong> the energy associated with rotation of the molecule.<br />
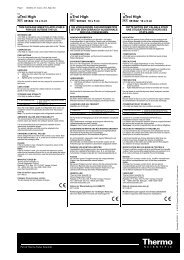
The electronic energy levels of simple molecules are widely separated <strong>and</strong> usually only the absorption of a high energy photon,<br />
that is one of very short wavelength, can excite a molecule from one level to another.<br />
Figure 4 Energy levels of a molecule<br />
In complex molecules the energy levels are more closely spaced <strong>and</strong> photons of near ultraviolet <strong>and</strong> visible light can effect the<br />
transition. These substances, therefore, will absorb light in some areas of the near ultraviolet <strong>and</strong> visible regions.<br />
The vibrational energy states of the various parts of a molecule are much closer together than the electronic energy levels <strong>and</strong><br />
thus protons of lower energy (longer wavelength) are sufficient to bring about vibrational changes. Light absorption due to only<br />
to vibrational changes occurs in the infrared region. The rotational energy states of molecules are so closely spaced that light in<br />
the far infrared <strong>and</strong> microwave regions of the electromagnetic spectrum has enough energy to cause these small changes.<br />
Page 4 of 28
<strong>Basic</strong> <strong>UV</strong>-<strong>Vis</strong> <strong>Theory</strong>, <strong>Concepts</strong> <strong>and</strong> <strong>Applications</strong><br />
Figure 5 Idealized absorption spectrum<br />
For ultraviolet <strong>and</strong> visible wavelengths, one should expect from this discussion that the absorption spectrum of a molecule (i.e.,<br />
a plot of its degree of absorption against the wavelength of the incident radiation) should show a few very sharp lines. Each line<br />
should occur at a wavelength where the energy of an incident photon exactly matches the energy required to excite an<br />
electronic transition.<br />
In practice it is found that the ultraviolet <strong>and</strong> visible spectrum of most molecules consists of a few humps rather than sharp lines.<br />
These humps show than the molecule is absorbing radiation over a b<strong>and</strong> of wavelengths. One reason for this b<strong>and</strong>, rather than<br />
line absorption is that an electronic level transition is usually accompanied by a simultaneous change between the more<br />
numerous vibrational levels. Thus, a photon with a little too much or too little energy to be accepted by the molecule for a 'pure'<br />
electronic transition can be utilized for a transition between one of the vibrational levels associated with the lower electronic<br />
state to one of the vibrational levels of a higher electronic state.<br />
If the difference in electronic energy is 'E' <strong>and</strong> the difference in vibrational energy is 'e', then photons with energies of E, E+e,<br />
E+2e, E-e, E-2e, etc. will be absorbed.<br />
Furthermore, each of the many vibrational levels associated with the electronic states also has a large number of rotational<br />
levels associated with it. Thus a transition can consist of a large electronic component, a smaller vibrational element <strong>and</strong> an<br />
even smaller rotational change. The rotational contribution to the transition has the effect of filling in the gaps in the vibrational<br />
fine structure.<br />
In addition, when molecules are closely packed together as they normally are in solution, they exert influences on each other<br />
which slightly disturb the already numerous, <strong>and</strong> almost infinite energy levels <strong>and</strong> blur the sharp spectral lines into b<strong>and</strong>s. These<br />
effects can be seen in the spectra of benzene as a vapor <strong>and</strong> in solution. In the vapor, the transitions between the vibration<br />
levels are visible as b<strong>and</strong>s superimposed on the main electronic transition b<strong>and</strong>s.<br />
In solution they merge together <strong>and</strong> at high temperature or pressure even the electronic b<strong>and</strong>s can blur to produce single wide<br />
b<strong>and</strong> such as that enclosed by the dotted line in Figure 6.<br />
Page 5 of 28
<strong>Basic</strong> <strong>UV</strong>-<strong>Vis</strong> <strong>Theory</strong>, <strong>Concepts</strong> <strong>and</strong> <strong>Applications</strong><br />
General Chemical Origins<br />
Figure 6 Vapor <strong>and</strong> solution spectra of Benzene<br />
When white light falls upon a sample, the light may be totally reflected, in which case the substance appears white or the light<br />
may be totally absorbed, in which case the substance will appear black. If, however, only a portion of the light is absorbed <strong>and</strong><br />
the balance is reflected, the color of the sample is determined by the reflected light. Thus, if violet is absorbed, the sample<br />
appears yellow-green <strong>and</strong> if yellow is absorbed, the sample appears blue. The colors are described as complementary.<br />
However, many substances which appear colorless do have absorption spectra. In this instance, the absorption will take place in<br />
the infra-red or ultraviolet <strong>and</strong> not in the visible region. Table 1 illustrates the relationship between light absorption <strong>and</strong> color.<br />
Page 6 of 28
<strong>Basic</strong> <strong>UV</strong>-<strong>Vis</strong> <strong>Theory</strong>, <strong>Concepts</strong> <strong>and</strong> <strong>Applications</strong><br />
Table 1 Relationship between light absorption <strong>and</strong> color<br />
Color absorbed Color observed Absorbed radiation(nm)<br />
Violet Yellow-green 400-435<br />
Blue Yellow 435-480<br />
Green-blue Orange 480-490<br />
Blue-green Red 490-500<br />
Green Purple 500-560<br />
Yellow-green Violet 560-580<br />
Yellow Blue 580-595<br />
Orange Green-blue 595-605<br />
Red Blue-green 605-750<br />
A close relationship exists between the color of a substance <strong>and</strong> its electronic structure. A molecule or ion will exhibit absorption<br />
in the visible or ultraviolet region when radiation causes an electronic transition within its structure. Thus, the absorption of light<br />
by a sample in the ultraviolet or visible region is accompanied by a change in the electronic state of the molecules in the sample.<br />
The energy supplied by the light will promote electrons from their ground state orbitals to higher energy, excited state orbitals or<br />
antibonding orbitals.<br />
Potentially, three types of ground state orbitals may be involved:<br />
i) σ (bonding) molecular as in<br />
ii) π (bonding) molecular orbital as in<br />
Page 7 of 28
<strong>Basic</strong> <strong>UV</strong>-<strong>Vis</strong> <strong>Theory</strong>, <strong>Concepts</strong> <strong>and</strong> <strong>Applications</strong><br />
iii) n (non-bonding) atomic orbital as in<br />
In addition, two types of antibonding orbitals may be involved in the transition:<br />
i) σ* (sigma star) orbital<br />
ii) π* (pi star) orbital<br />
(There is no such thing as an n* antibonding orbital as the n electrons do not form bonds).<br />
A transition in which a bonding s electron is excited to an antibonding σ orbital is referred to as σ to σ* transition. In the same<br />
way π to π* represents the transition of one electron of a lone pair (non-bonding electron pair) to an antibonding π orbital. Thus<br />
the following electronic transitions can occur by the absorption of ultraviolet <strong>and</strong> visible light:<br />
σ to σ*,<br />
n to σ*<br />
n to π*<br />
π to π*.<br />
Figure 7 illustrates the general pattern of energy levels <strong>and</strong> the fact that the transitions are brought about by the absorption of<br />
different amounts of energy.<br />
Figure 7 Energy <strong>and</strong> molecular transitions<br />
Both s to σ* <strong>and</strong> n to σ* transitions require a great deal of energy <strong>and</strong> therefore occur in the far ultraviolet region or weakly in the<br />
region 180-240nm. Consequently, saturated groups do not exhibit strong absorption in the ordinary ultraviolet region. Transitions<br />
of the n to π* <strong>and</strong> π to π* type occur in molecules with unsaturated centers; they require less energy <strong>and</strong> occur at longer<br />
Page 8 of 28
<strong>Basic</strong> <strong>UV</strong>-<strong>Vis</strong> <strong>Theory</strong>, <strong>Concepts</strong> <strong>and</strong> <strong>Applications</strong><br />
wavelengths than transitions to σ* antibonding orbitals. Table 2 illustrates the type of transition <strong>and</strong> the resulting maximum<br />
wavelength.<br />
Table 2 Examples of transitions <strong>and</strong> resulting λmax<br />
It will be seen presently that the wavelength of maximum absorption <strong>and</strong> the intensity of absorption are determined by<br />
molecular structure. Transitions to π* antibonding orbitals which occur in the ultraviolet region for a particular molecule may well<br />
take place in the visible region if the molecular structure is modified. Many inorganic compounds in solution also show<br />
absorption in the visible region. These include salts of elements with incomplete inner electron shells (mainly transition metals)<br />
whose ions are complexed by hydration e.g. [Cu(H204)] 2+ . Such absorptions arise from a charge transfer process, where<br />
electrons are moved from one part of the system to another by the energy provided by the visible light.<br />
Page 9 of 28
<strong>Basic</strong> <strong>UV</strong>-<strong>Vis</strong> <strong>Theory</strong>, <strong>Concepts</strong> <strong>and</strong> <strong>Applications</strong><br />
Correlation of Molecular Structure <strong>and</strong> Spectra Conjugation<br />
π to π * transitions, when occurring in isolated groups in a molecule, give rise to absorptions of fairly low intensity. However,<br />
conjugation of unsaturated groups in a molecule produces a remarkable effect upon the absorption spectrum. The wavelength of<br />
maximum absorption moves to a longer wavelength <strong>and</strong> the absorption intensity may often increase.<br />
Figure 8 The effect of increasing conjugation on the absorption spectrum<br />
The same effect occurs when groups containing n electrons are conjugated with a π electron group; e.g.,<br />
Aromatic systems, which contain p electrons, absorb strongly in the ultraviolet:<br />
Page 10 of 28
<strong>Basic</strong> <strong>UV</strong>-<strong>Vis</strong> <strong>Theory</strong>, <strong>Concepts</strong> <strong>and</strong> <strong>Applications</strong><br />
In general, the greater the length of a conjugated system in a molecule, the nearer the λmax comes to the visible region.<br />
Thus, the characteristic energy of a transition <strong>and</strong> hence the wavelength of absorption is a property of a group of atoms rather<br />
than the electrons themselves. When such absorption occurs, two types of groups can influence the resulting absorption<br />
spectrum of the molecule: chromophores <strong>and</strong> auxochromes.<br />
Chromophores<br />
A chromophore (literally color-bearing) group is a functional group, not conjugated with another group, which exhibits a<br />
characteristic absorption spectrum in the ultraviolet or visible region. Some of the more important chromophoric groups are:<br />
If any of the simple chromophores is conjugated with another (of the same type or different type) a multiple chromophore is<br />
formed having a new absorption b<strong>and</strong> which is more intense <strong>and</strong> at a longer wavelength that the strong b<strong>and</strong>s of the simple<br />
chromophores.<br />
This displacement of an absorption maximum towards a longer wavelength (i.e. from blue to red) is termed a bathochromic shift.<br />
The displacement of an absorption maximum from the red to ultraviolet is termed a hypsochromic shift.<br />
Auxochromes<br />
The color of a molecule may be intensified by groups called auxochromes which generally do not absorb significantly in the 200-<br />
800nm region, but will affect the spectrum of the chromophore to which it is attached. The most important auxochromic groups<br />
are OH, NH2, CH3 <strong>and</strong> NO2 <strong>and</strong> their properties are acidic (phenolic) or basic.<br />
The actual effect of an auxochrome on a chromophore depends on the polarity of the auxochrome, e.g. groups like CH3-,<br />
CH3CH2 - <strong>and</strong> Cl - have very little effect, usually a small red shift of 5-10nm. Other groups such as -NH2 <strong>and</strong> -NO2 are very<br />
popular <strong>and</strong> completely alter the spectra of chromophores such as:<br />
Page 11 of 28
<strong>Basic</strong> <strong>UV</strong>-<strong>Vis</strong> <strong>Theory</strong>, <strong>Concepts</strong> <strong>and</strong> <strong>Applications</strong><br />
In general it should be possible to predict the effect of non-polar or weakly polar auxochromes, but the effect of strongly polar<br />
auxochromes is difficult to predict. In addition, the availability of non-bonding electrons which may enter into transitions also<br />
contributes greatly to the effect of an auxochrome.<br />
Steric Effects<br />
Steric hindrance will also affect the influence of an auxochrome on a chromophore. Electron systems conjugate best when the<br />
molecule is planar in configuration. If the presence of an auxochrome prevents the molecule from being planar then large effects<br />
will be noticed in the spectrum; e.g., m- <strong>and</strong> p-methyl groups in the diphenyls have predictable but slight effects on the spectra<br />
compared with that of diphenyl itself. However, methyl groups in the o-position alter the spectrum completely.<br />
Cis <strong>and</strong> trans isomers of linear polyenes also show differences in their spectra. The all-trans isomer has the longer conjugated<br />
system. λ max is at a longer wavelength <strong>and</strong> ε max (molar absorptivity or molar extinction coefficient) is higher than for the all cis or<br />
mixed isomer.<br />
<strong>Vis</strong>ible Spectra<br />
In general a compound will absorb in the visible region if it contains at least five conjugated chromophoric <strong>and</strong> auxochromic<br />
groups; e.g.,<br />
The ability to complex many metals, particularly the transition elements, with complex organic <strong>and</strong> inorganic molecules which<br />
absorb in the visible region provides the basis for their quantitative spectrometric analysis. The absorptions are due to<br />
movement of electrons between energy levels of the organo-metal complex. These complexing systems are termed<br />
spectrometric reagents. The most common are dithizone, azo reagents (PAN, thoron, zincon), dithiocarbamate, 8hydroxyquinoline,<br />
formaldoxime <strong>and</strong> thiocyanate. In addition, many inorganic ions in solution also absorb in the visible region<br />
e.g. salts of Ni, Co, Cu, V etc. <strong>and</strong> particularly elements with incomplete inner electron shells whose ions are complexed by<br />
hydration e.g. (Cu(H2O)4) 2+ . Such absorptions arise from a charge transfer process where electrons are moved from one part of<br />
the system to another due to the energy provided by the visible light.<br />
Page 12 of 28
<strong>Basic</strong> <strong>UV</strong>-<strong>Vis</strong> <strong>Theory</strong>, <strong>Concepts</strong> <strong>and</strong> <strong>Applications</strong><br />
Solvents<br />
The effect on the absorption spectrum of a compound when diluted in a solvent will vary depending on the chemical structures<br />
involved. Generally speaking, non-polar solvents <strong>and</strong> non-polar molecules show least effect. However, polar molecules exhibit<br />
quite dramatic differences when interacted with a polar solvent. Interaction between solute <strong>and</strong> solvent leads to absorption b<strong>and</strong><br />
broadening <strong>and</strong> a consequent reduction in structural resolution <strong>and</strong> ε max. Ionic forms may also be created in acidic or basic<br />
conditions. Thus care must be taken to avoid an interaction between the solute <strong>and</strong> the solvent.<br />
Figure 9 illustrates the effect of iso-octane <strong>and</strong> ethanol on the spectrum of phenol, a change from hydrocarbon to hydroxylic<br />
solvent. The loss of fine structure in the latter is due to broad b<strong>and</strong> h-bonded solvent-solute complexes replacing the fine<br />
structure present in the iso-octane. The fine structure in the latter solvent illustrates the principle that non-solvating or nonchelating<br />
solvents produce a spectrum much closer to that obtained in the gaseous state.<br />
Figure 9 Spectra of Phenol in Iso-octane <strong>and</strong> in Ethanol<br />
Commercially available solvents of 'spectroscopic purity' are listed in Table 3 accompanied by their cut-off wavelengths, based<br />
on a 10mm pathlength. Water <strong>and</strong> 0.1N solutions of hydrochloric acid <strong>and</strong> sodium hydroxide are commonly used solvents for<br />
absorption spectrometry. Again care has to be taken to avoid interaction. Where methodology requires buffering, solutions have<br />
to be non-absorbing <strong>and</strong> generally both the composition <strong>and</strong> pH will be specified. However, if this information is not available<br />
lists can be found in the literature. For reactions in the 4.2 to 8.8 pH region, mixtures of 0.1N dihydrogen sodium phosphate <strong>and</strong><br />
0.1N hydrogen disodium phosphate are generally used.<br />
Page 13 of 28
<strong>Basic</strong> <strong>UV</strong>-<strong>Vis</strong> <strong>Theory</strong>, <strong>Concepts</strong> <strong>and</strong> <strong>Applications</strong><br />
Table 3 Commonly used solvents <strong>and</strong> their 'cut-off' wavelengths<br />
Solvent Cut-off (nm)<br />
Iso-octane 202<br />
Ethyl alcohol 205<br />
Cyclohexane 200<br />
Acetone 325<br />
Tetrachloroethylene 290<br />
Benzene 280<br />
Carbon tetrachloride 265<br />
Chloroform 245<br />
Ethyl ether 220<br />
Isopropyl alcohol 210<br />
Methyl alcohol 210<br />
General Interactions of Light <strong>and</strong> Matter<br />
When a beam of radiation strikes any object it can be absorbed, transmitted, scattered, reflected or it can excite fluorescence.<br />
These processes are illustrated in Figure 10. With scattering it can be considered that the radiation is first absorbed then almost<br />
instantaneously completely re-emitted uniformly in all directions, but otherwise unchanged. With fluorescence a photon is first<br />
absorbed <strong>and</strong> excites the molecule to a higher energy state, but the molecule then drops back to an intermediate energy level<br />
by re-emitting a photon. Since some of the energy of the incident photon is retained in the molecule (or is lost by a non-radiative<br />
process such as collision with another molecule) the emitted photon has less energy <strong>and</strong> hence a longer wavelength than the<br />
absorbed photon. Like scatter, fluorescent radiation is also emitted uniformly in all directions.<br />
Page 14 of 28
<strong>Basic</strong> <strong>UV</strong>-<strong>Vis</strong> <strong>Theory</strong>, <strong>Concepts</strong> <strong>and</strong> <strong>Applications</strong><br />
Figure 10 Interaction of light <strong>and</strong> matter<br />
The processes concerned in absorption spectrometry are absorption <strong>and</strong> transmission. Usually the conditions under which the<br />
sample is examined are chosen to keep reflection, scatter <strong>and</strong> fluorescence to a minimum. In the ultraviolet <strong>and</strong> visible regions<br />
of the electromagnetic spectrum, the b<strong>and</strong>s observed are usually not specific enough to allow a positive identification of an<br />
unknown sample, although this data may be used to confirm its nature deduced from its infrared spectrum or by other<br />
techniques. Ultraviolet <strong>and</strong> visible spectrometry is almost entirely used for quantitative analysis; that is, the estimation of the<br />
amount of a compound known to be present in the sample. The sample is usually examined in solution.<br />
Lambert's (or Bouguer's) Law<br />
Lambert's Law states that each layer of equal thickness of an absorbing medium absorbs an equal fraction of the radiant energy<br />
that traverses it.<br />
The fraction of radiant energy transmitted by a given thickness of the absorbing medium is independent of the intensity of the<br />
incident radiation, provided that the radiation does not alter the physical or chemical state of the medium.<br />
If the intensity of the incident radiation is Io <strong>and</strong> that of the transmitted light is l, then the fraction transmitted is:<br />
l/lo = T<br />
The percentage transmission is<br />
%T = l/lo x 100<br />
Page 15 of 28
<strong>Basic</strong> <strong>UV</strong>-<strong>Vis</strong> <strong>Theory</strong>, <strong>Concepts</strong> <strong>and</strong> <strong>Applications</strong><br />
If a series of colored glass plates of equal thickness are placed in parallel, each sheet of which absorbs one quarter of the light<br />
incident upon it, then the amount of the original radiation passed by the first sheet is:<br />
(1 - 1/4)/1 x 100 = 75%<br />
<strong>and</strong> by the second sheet is 56.25%, i.e. 75% of 75%, <strong>and</strong> by the third sheet is 42.19%, i.e. 75% of 56.25%, <strong>and</strong> by the nth sheet<br />
is (0.75)^n x 100%.<br />
Now imagine a container with parallel glass walls 10mm apart filled with an absorbing solution. If monochromatic light is incident<br />
on one face <strong>and</strong> 75% of the light is transmitted, Lambert's Law states that if a similar cell is put next to the first the light<br />
transmitted will be reduced to 56.25%. If the contents of the two containers are evaporated to half their volume, thereby doubling<br />
their concentration, <strong>and</strong> then measured in a single container, it will be found that the transmission will again be reduced to<br />
56.25%.<br />
It can be immediately seen that to determine the concentration of an unknown sample the percentage transmittance of a series<br />
of solutions of known concentration or 'st<strong>and</strong>ards' can be plotted <strong>and</strong> the concentration or the unknown read from the graph. It<br />
will be found that the graph is an exponential function which is obviously inconvenient for easy interpolation.<br />
The Beer-Lambert Law<br />
The Beer-Lambert Law states that the concentration of a substance in solution is directly proportional to the 'absorbance ', A, of<br />
the solution.<br />
Absorbance A = constant x concentration x cell length<br />
The law is only true for monochromatic light, that is light of a single wavelength or narrow b<strong>and</strong> of wavelengths, <strong>and</strong> provided<br />
that the physical or chemical state of the substance does not change with concentration.<br />
When monochromatic radiation passes through a homogeneous solution in a cell, the intensity of the emitted radiation depends<br />
upon the thickness (l) <strong>and</strong> the concentration (C) of the solution.<br />
Io is the intensity of the incident radiation <strong>and</strong> I is the intensity of the transmitted radiation. The ratio I/Io is called transmittance.<br />
This is sometimes expressed as a percentage <strong>and</strong> referred to as %transmittance.<br />
Page 16 of 28
<strong>Basic</strong> <strong>UV</strong>-<strong>Vis</strong> <strong>Theory</strong>, <strong>Concepts</strong> <strong>and</strong> <strong>Applications</strong><br />
Mathematically, absorbance is related to percentage transmittance T by the expression:<br />
A = log10(Io/I) = log10(100/T) = kcL<br />
where L is the length of the radiation path through the sample, c is the concentration of absorbing molecules in that path, <strong>and</strong> k<br />
is the extinction coefficient - a constant dependent only on the nature of the molecule <strong>and</strong> the wavelength of the radiation.<br />
Now, in the example above, the transmittance of our sample fell from 75 to 56.25% when the concentration doubled. What<br />
happens to the absorbance in the same circumstance?<br />
A = log10(100/T) = log10(100) - log10 (T) = 2 - log10 (T)<br />
When T = 75%, A = 2 - 1.875 = 0.125<br />
When T = 56.25% A = 2 - 1.750 = 0.250<br />
Quite clearly as the absorbance doubles for twice the concentration, it is far more convenient to work in absorbance than<br />
transmittance for the purposes of quantitative analysis.<br />
It is useful to remember that<br />
0%T = ∞ A<br />
0.1% = 3.0A<br />
1.0%T = 2.0A<br />
10%T = 1.0A<br />
100% = 0A<br />
Absorbance in older literature is sometimes referred to as 'extinction' or 'optical density' (OD).<br />
Figure 11 (a) %T vs concentration (b) Absorbance vs concentration<br />
Page 17 of 28
<strong>Basic</strong> <strong>UV</strong>-<strong>Vis</strong> <strong>Theory</strong>, <strong>Concepts</strong> <strong>and</strong> <strong>Applications</strong><br />
If, in the expression A = kcl, c is expressed in molar -1 <strong>and</strong> l in m, then k is replaced by the symbol τ <strong>and</strong> is called the molar<br />
absorption coefficient. The units of τ are mol -1 m 2 . τ was formerly called the molar extinction coefficient <strong>and</strong> concentrations were<br />
often expressed as mol l -1 , mol dm -3 or M <strong>and</strong> the cell length in cm to give units mol -1 lcm- 1 , mol -1 dm 3 cm -1 <strong>and</strong> M -1 cm -1<br />
respectively.<br />
Alternatively, if the relative molecular mass (molecular weight) of the substance is unknown, then a 1% w/v solution is prepared<br />
<strong>and</strong> the absorbance is measured in a 1 cm cell. In this case, k is replaced by E 1% Sometimes the wavelength is included:<br />
E 1% (325 nm).<br />
C Sometimes is expressed in g dm -3 (gl -1 ) <strong>and</strong> l in cm. In this case, k is replaced by A (sometimes E). A is known as the specific<br />
absorption coefficient.<br />
General <strong>Applications</strong><br />
Having looked, albeit very briefly, at the theory <strong>and</strong> origins of <strong>UV</strong>-<strong>Vis</strong>ible spectra, let us now investigate how we can apply the<br />
technique to chemical analysis starting with consideration of sample state.<br />
With solid sample it is usually found that the material is in a condition unsuitable for direct spectrometry. The refractive index of<br />
the material is high <strong>and</strong> a large proportion of the radiation may be lost by r<strong>and</strong>om reflection or refraction at the surface or in the<br />
mass. Unless the sample can be easily made as an homogenous polished block or film, it is usual to eliminate these interfaces<br />
by dissolving it in a transparent solvent.<br />
Liquids may be contained in a vessel made of transparent material such as silica, glass or plastic, known as a cell or cuvette.<br />
The faces of these cells through which the radiation passes are highly polished to keep reflection <strong>and</strong> scatter losses to a<br />
minimum. Gases may be contained in similar cells which are sealed or stoppered to make them gas tight. With the sample now<br />
ready for measurement, the Io (incident intensity) can be set by moving the sample out of the beam <strong>and</strong> letting the light fall<br />
directly on the detector. On today's modern instrumentation, Io setting is generally accomplished by an 'autozero' comm<strong>and</strong>. In<br />
practice, such a method does not account for the proportion of radiation which is reflected or scattered at the cell faces. It also<br />
does not account for the radiation which is absorbed by any solvent <strong>and</strong> thus does not effectively pass through the sample.<br />
Therefore it is usual to employ a reference or blank cell, identical to that containing the sample, but filled only with solvent <strong>and</strong> to<br />
measure the light transmitted by this reference as a true or practical Io.<br />
Having established the Io or reference position, the procedure adopted for the analysis will depend on the analytical information<br />
required. In general terms there are two major measurement techniques; how much analyte is in the sample (quantitative<br />
analysis) <strong>and</strong> which analyte is in the sample (qualitative analysis).<br />
Quantitative Analysis<br />
For quantitative analysis, it is normally chosen to use radiation of a wavelength at which k, the extinction coefficient, is a<br />
maximum, i.e. at the peak of the absorption b<strong>and</strong>, for the following reasons:<br />
The change in absorbance for a given concentration change is greater, leading to greater sensitivity <strong>and</strong> accuracy in<br />
measurement<br />
Page 18 of 28
<strong>Basic</strong> <strong>UV</strong>-<strong>Vis</strong> <strong>Theory</strong>, <strong>Concepts</strong> <strong>and</strong> <strong>Applications</strong><br />
The relative effect of other substances or impurities is smaller.<br />
The rate of change of absorbance with wavelength is smaller, <strong>and</strong> the measurement is not so severely effected by<br />
small errors in the wavelength setting.<br />
The extinction coefficient must have units relating to the units used for concentration <strong>and</strong> pathlength of the sample.<br />
It is usually written as:<br />
or<br />
the value of k for a 1% sample concentration of 1 cm thickness.<br />
ε the molar absorptivity previously described as the molar<br />
extinction coefficient; the value of k for a sample concentration of<br />
1 gram molecule per liter <strong>and</strong> a 1 cm thickness.<br />
To carry out an analysis of a known material it should be possible in theory to measure the absorption of a sample at its<br />
absorption maximum, measure the thickness, obtain values of e from tables <strong>and</strong> calculate the concentration. In practice, values<br />
of E depend on instrumental characteristics, so published values from tables are not accurate enough, <strong>and</strong> a reliable analyst will<br />
usually plot the absorbance values of a series of st<strong>and</strong>ards of known concentration; the concentrations of actual samples can<br />
then be read directly from the calibration graph. Using today's modern software driven instruments, the analyst will usually only<br />
require one 'top' st<strong>and</strong>ard which can be used to calibrate the instrument so that it displays the concentration of subsequent<br />
samples directly in the required units. If the calibration curve is non-linear due to either instrumental or chemistry considerations,<br />
then some instruments will automatically construct a 'best fit' calibration when presented with a number of st<strong>and</strong>ards.<br />
Rate Measurements<br />
Rate studies involve the measurement of the change in concentration of a participant in the reaction as a function of time.<br />
Whereas we have previously considered the measurement of a sample whose absorption characteristics are constant,<br />
spectrometric rate measurement involves the measurement of a fall or rise in absorption at a fixed wavelength. This<br />
measurement provides information on the change in concentration of either the reactants or products. The most widely<br />
encountered application of spectrometric rate measurements is for study of enzymes (proteins that are present in all living<br />
tissue). Enzymes cannot be measured directly but their catalytic properties allow their estimation from the speed of the reactions<br />
which they catalyse. Enzymes have many uses as reagents or as labels that can be attached to other molecules to permit their<br />
indirect detection <strong>and</strong> measurement. However, their widest use is in the field of clinical diagnostics as an indicator of tissue<br />
damage. When cells are damaged by disease, enzymes leak into the bloodstream <strong>and</strong> the amount present indicates the severity<br />
of the tissue damage. The relative proportions of different enzymes can be used to diagnose disease, say of the liver, pancreas<br />
or other organs which otherwise exhibit similar symptoms. The reaction most used in these clinical assays is the reduction of<br />
nicotinamide adenine dinucleotide (NAD) to NADH2. The spectra of NAD <strong>and</strong> NADH2 are shown in Figure 12 <strong>and</strong> it can be seen<br />
that if the absorbance is monitored at the NADH2 peak at 340nm the reading will increase as the reaction progresses towards<br />
NADH2.<br />
Page 19 of 28
<strong>Basic</strong> <strong>UV</strong>-<strong>Vis</strong> <strong>Theory</strong>, <strong>Concepts</strong> <strong>and</strong> <strong>Applications</strong><br />
Figure 12 Absorption spectra of NAD <strong>and</strong> NADH<br />
Other reactions can be monitored by coupling them together so that the product of one reaction feeds the next which can then<br />
be optically monitored.<br />
The general equation for an enzyme reaction is:<br />
In this reaction enzyme X catalyses the conversion of compound A to B. A coupled reaction utilises NAD in a secondary<br />
reaction, the completion of which depends on the concentration of a product of the primary reaction. e.g.<br />
This equation, however, will only hold true when the reaction between B <strong>and</strong> NADH2 is virtually instantaneous. Consider the<br />
following coupled reaction:<br />
Reaction 1<br />
The initial reaction is the conversion of L-alanine <strong>and</strong> a-ketoglutarate to pyruvate in the presence of alanine transaminase. The<br />
indicator reaction is the conversion of pyruvate (<strong>and</strong> NADH2) to lactate which is catalysed by the enzyme lactate<br />
dehydrogenase.<br />
Page 20 of 28
<strong>Basic</strong> <strong>UV</strong>-<strong>Vis</strong> <strong>Theory</strong>, <strong>Concepts</strong> <strong>and</strong> <strong>Applications</strong><br />
The effect of this reaction on absorbance is illustrated in Figure 13. The actual decrease in absorbance caused by the oxidation<br />
of NADH2 can be seen in Figure 12. The rate of the reaction is determined by the average drop in absorbance over a short<br />
period of time following the addition of a-ketoglutarate. Other reactions involve the reduction of NAD to NADH2 with a resultant<br />
increase in absorbance.<br />
Figure 13 Enzyme reaction based on oxidation of NADH to NAD<br />
The conversion of glucose-6-phosphate to 6-phosphogluconalactone (a reaction catalysed by glucose-6-phosphate<br />
dehydrogenase in the presence of NADH2) is an example of this type of reaction.<br />
The equation for this reaction would be as follows:<br />
Figure 14 Enzyme reaction based on reduction of NAD to NADH<br />
Reaction 2<br />
Page 21 of 28
<strong>Basic</strong> <strong>UV</strong>-<strong>Vis</strong> <strong>Theory</strong>, <strong>Concepts</strong> <strong>and</strong> <strong>Applications</strong><br />
The change on absorbance is shown as in Figure 14. In case of reaction 1, i.e. alanine transaminase, the rate of reaction is<br />
calculated by measuring the average decrease in absorbance over a period of time <strong>and</strong> expressing it as an average drop in<br />
absorbance per minute. With reaction 2, the increase in absorbance is measured.<br />
A variety of parameters will influence the rate of reaction. The majority of these i.e. substrate concentration, enzyme<br />
concentration <strong>and</strong> pH have to be accounted for in the chemistry. However, one of the most important is temperature <strong>and</strong> it is<br />
important to precisely control the temperature of the sample <strong>and</strong> reagents immediately prior to <strong>and</strong> during measurement. For<br />
this requirement, a whole range of thermostatted cell holders <strong>and</strong> temperature control systems is available.<br />
Analysis of Mixtures<br />
It is relatively rare to find a practical problem in which one has a mixture to be analysed with only one component which absorbs<br />
radiation. When there are several such components which absorb at the same wavelength their absorbances add together, <strong>and</strong><br />
it is no longer true that the absorbance of the sample is proportional to the concentration of one component (see Figure 15).<br />
In these cases, several approaches can be adopted with the most important being chemical reaction <strong>and</strong> multi-wavelength<br />
measurements.<br />
Chemical Reaction<br />
Figure 15 Error caused by superimposed absorption in a mixture<br />
A common method of analysis is to change the required component by adding a chemical reagent which reacts with it<br />
specifically to form a highly absorbing compound. An example of this is shown in Figure 16. A quantity of the reagent added to<br />
the mixture reacts only with one component <strong>and</strong> both increases its absorption <strong>and</strong> changes the wavelength of the absorption<br />
maximum so that there is no longer interference between the components. The analysis is then reduced to a simple case <strong>and</strong> its<br />
Page 22 of 28
<strong>Basic</strong> <strong>UV</strong>-<strong>Vis</strong> <strong>Theory</strong>, <strong>Concepts</strong> <strong>and</strong> <strong>Applications</strong><br />
sensitivity is improved. Many hundreds of such specific reagents are now available for all sorts of analyses <strong>and</strong> sample matrices<br />
<strong>and</strong> are thoroughly detailed in the literature.<br />
Multiwavelength Measurements<br />
Figure 16 Improving sensitivity by adding a chemical reagent<br />
In a mixture of components, the observed absorption at any wavelength is the sum of the individual absorption spectra of the<br />
components thus:<br />
Measure absorbance at wavelength 1<br />
A1 = EAaL + EBbL + ECcL ...<br />
Similarly at a wavelength 2<br />
A' = E'AaL + E'BbL + E'CcL ...<br />
where EA <strong>and</strong> E'A are the absorptivity of components A at wavelength 1 <strong>and</strong> wavelength 2 <strong>and</strong> A is its concentration, etc.<br />
The cell pathlength L is generally constant <strong>and</strong> therefore cancels. If we then take measurements at a number of different<br />
wavelengths equal to the number of components, <strong>and</strong> if the value of the absorptivities are known by measurements of the pure<br />
components at each of the wavelengths concerned, we can solve the simultaneous equations to find the required<br />
concentrations.<br />
The multi-wavelength or multicomponents analysis technique has seen a resurgence of interest over the last few years. This<br />
has been due to data processing techniques. A variety of algorithms is available <strong>and</strong> the analyst is generally required to input<br />
the number of components, measurement wavelengths <strong>and</strong> concentration values of the st<strong>and</strong>ards. Having measured the<br />
Page 23 of 28
<strong>Basic</strong> <strong>UV</strong>-<strong>Vis</strong> <strong>Theory</strong>, <strong>Concepts</strong> <strong>and</strong> <strong>Applications</strong><br />
st<strong>and</strong>ards, samples can be processed <strong>and</strong> results presented appropriately. Programs of this type, including measurement<br />
parameters, can then be stored on disk <strong>and</strong> recalled <strong>and</strong> run with a minimum of operator intervention, providing results on<br />
complex mixtures containing up to ten components.<br />
Instrumentation<br />
In earlier sections we have seen that the purpose of a spectrophotometer is to provide a beam of monochromatic radiation to<br />
illuminate a sample <strong>and</strong> so measure the ratio I / Io. Any spectrophotometer will consist of the component parts illustrated in<br />
Figure 17.<br />
Figure 17 Schematic diagram of a spectrophotometer<br />
There are many combinations of sources, monochromators, measuring systems etc. which can be assembled to form<br />
integrated spectrophotometers with varying degrees of accuracy <strong>and</strong> suitability for particular applications. The various optical<br />
components which comprise a spectrometer will not be discussed here.<br />
Page 24 of 28
<strong>Basic</strong> <strong>UV</strong>-<strong>Vis</strong> <strong>Theory</strong>, <strong>Concepts</strong> <strong>and</strong> <strong>Applications</strong><br />
Definitions<br />
Absorbance Accuracy<br />
Absorbance accuracy is the agreement between the absorbance displayed on the spectrometer <strong>and</strong> the true absorbance value<br />
as given by a st<strong>and</strong>ard solution or calibration gauze.<br />
Absorbance Reproducibility<br />
This is the agreement (concordance) of a series of absorbance values obtained when the same solution is scanned, i.e. it is how<br />
closely the absorbance values agree.<br />
Accuracy<br />
The accuracy of a determination may be defined as the agreement (concordance) between it <strong>and</strong> the true or most probable<br />
value.<br />
Black body Radiation<br />
A black body is a hypothetical body or surface which will absorb all radiation incident upon it. Conversely, this black body<br />
radiates electromagnetic energy proportional to the fourth power of its absolute temperature. The hotter the body the shorter the<br />
wavelengths of its radiation; thus the colour of a glowing body depends on its temperature.<br />
Bond<br />
A bond is an interaction between two or more atoms or groups of atoms which holds the atoms together. This interaction results<br />
from the sharing of electrons in (normally) incomplete shells of adjacent atoms.<br />
The predicted paths (orbitals) of the bonding electrons about the nucleus give each atom a particular shape which affects the<br />
way it bonds with the adjacent atoms. These different bond orientations (orbitals) are termed:<br />
σ (sigma)<br />
σ* (sigma star)<br />
π (pi)<br />
π* (pi star)<br />
n<br />
A molecule can have a combination of different types of bond orientations.<br />
Bonding occurs where there is a single electron in an orbital intended for two electrons. Antibonding occurs where both<br />
electrons are present in an orbital <strong>and</strong> this inhibits bonding.<br />
Chelate<br />
A substance which incorporates molecules or ions bonded to a metal ion.<br />
Page 25 of 28
Complex<br />
<strong>Basic</strong> <strong>UV</strong>-<strong>Vis</strong> <strong>Theory</strong>, <strong>Concepts</strong> <strong>and</strong> <strong>Applications</strong><br />
A type of compound in which molecules or ions form bonds with a metal atom or ion.<br />
Conjugation<br />
Conjugated compounds are compounds with alternating double <strong>and</strong> single bonds.<br />
Enzyme<br />
An enzyme is a protein which catalyses a specific biochemical reaction. It mediates the conversion of one or more substances<br />
(the substrate(s)) to another by combining with the substrate(s) to form an intermediate complex.<br />
Extinction Coefficient<br />
The expression of the absorptivity of a compound of a st<strong>and</strong>ard concentration measured in a 10 mm pathlength cuvette. It can<br />
be expressed as either:<br />
Or<br />
or This is the Absorbance of a 1% w/v solution of a compound<br />
measured in 10 mm pathlength. It is related to molar absorptivity<br />
by: = 100 x e /M<br />
Ε the molar absorptivity coefficient. This is the Absorbance of a<br />
molar solution in a 10 mm pathlength cuvette. See Molar<br />
absorptivity.<br />
Hydration<br />
To cause to take up or combine with water or the elements of water.<br />
Ion<br />
An atom or group of atoms which carries an electrical charge as a result of having gained or lost an electron.<br />
Isomer<br />
Any one of the possible compounds arising from the different ways of grouping the atoms in a given molecular formula.<br />
Compounds can have the same formula but different spatial arrangements of atoms.<br />
Page 26 of 28
<strong>Basic</strong> <strong>UV</strong>-<strong>Vis</strong> <strong>Theory</strong>, <strong>Concepts</strong> <strong>and</strong> <strong>Applications</strong><br />
Molar Absorptivity (e)<br />
Cis isomer<br />
Groups attached on the same side of a bond; e.g.,<br />
Trans isomer<br />
Groups attached on opposite sides; e.g.,<br />
The absorbance at a specified wavelength of a solution of a compound of unit molar concentration measured in a 10 mm<br />
pathlength.<br />
It has dimensions of M -1 cm -1.<br />
Monochromator<br />
This is a device which isolates a very narrow b<strong>and</strong> of wavelengths of the light coming from a source.<br />
Noise<br />
Noise is the general term used to describe the irregular or r<strong>and</strong>om trace obtained when the signal from a spectrophotometer is<br />
recorded.<br />
Orbital<br />
An orbital is a region round a nucleus where there is a high probability of finding an electron.<br />
Polar<br />
This is a condition where a molecule has no net electrical charge <strong>and</strong> yet it exhibits polarity - it is more negative at one end than<br />
the other. This comes about because some elements bind their outer electrons more tightly than others: with a large atom, the<br />
inner shells of electrons shield the core charge to some extent <strong>and</strong> the outer electrons tend to be further away from the core with<br />
a large atom than with a small one.<br />
Precision<br />
Precision may be defined as the agreement (concordance) of a series of measurements of the same quantity; i.e., precision<br />
expresses the reproducibility or repeatability of a measurement.<br />
Page 27 of 28
<strong>Basic</strong> <strong>UV</strong>-<strong>Vis</strong> <strong>Theory</strong>, <strong>Concepts</strong> <strong>and</strong> <strong>Applications</strong><br />
Probability <strong>Theory</strong><br />
It is not possible to specify the location <strong>and</strong> trajectory of an electron in the region of an atom since any attempt to observe the<br />
electron will change its location or movement. It is, however, possible to state a probability that the electron will be in a particular<br />
region. This probability theory allows the orbitals of the various electrons in a shell to be specified.<br />
Reactant<br />
A compound taking part in a chemical reaction.<br />
Reagent<br />
A solvent or solution which reacts with another. The term is usually applied to common laboratory chemicals used for<br />
experiment <strong>and</strong> analysis, e.g. sodium hydroxide <strong>and</strong> hydrochloric acid.<br />
Refractive Index<br />
A measure of the amount by which a substance refracts a wave. It is equal to the ratio of the speed of transmission of the wave<br />
in a reference medium or vacuum to its velocity in the substance.<br />
Rotational Energy States<br />
Just as a fixed quantum of energy is required to change the energy level of an electron, so also is a fixed quantum of energy<br />
required to change the rotation of a molecule. The allowed energy quanta for a given molecule depend on bond lengths <strong>and</strong><br />
angles within the molecule.<br />
Steric<br />
This relates to the effect which the shape of a molecule has on its reactions. A particular example occurs in molecules<br />
containing large groups which hinder the approach of a reactant (steric hindrance).<br />
Stray Light<br />
This is the measurable radiation, at the detector, of any wavelength outside the narrow b<strong>and</strong> expected to be transmitted by the<br />
monochromator.<br />
Vibrational Energy States<br />
Just as a fixed quantum of energy is required to change the energy level of an electron, so also is a fixed quantum of energy<br />
required to change the vibration of an atom in a molecule. The allowed energy quanta for a given molecule depend on bond<br />
forces <strong>and</strong> atomic masses within the molecule.<br />
Wavelength Accuracy<br />
This is the agreement between the value displayed on the spectrophotometer <strong>and</strong> the true value.<br />
Wavelength Reproducibility<br />
This is the agreement (concordance) of a series of wavelength values obtained when a spectrum is repeatedly scanned.<br />
Page 28 of 28