Evaluation of two Sysmex XE-2100 analyzers in an HST-302 ...
Evaluation of two Sysmex XE-2100 analyzers in an HST-302 ...
Evaluation of two Sysmex XE-2100 analyzers in an HST-302 ...

Create successful ePaper yourself
Turn your PDF publications into a flip-book with our unique Google optimized e-Paper software.
INTRODUCTION<br />
In cl<strong>in</strong>ical chemistry laboratories, a trend towards further<br />
automation c<strong>an</strong> be observed, especially <strong>in</strong> large cl<strong>in</strong>ical<br />
centers. The <strong>in</strong>creas<strong>in</strong>g workload <strong>an</strong>d the necessity to<br />
decrease the turn around time (TAT) imposes the need<br />
for automation. New <strong>in</strong> this field is the <strong>Sysmex</strong> <strong>HST</strong>-<br />
<strong>302</strong>. The <strong>HST</strong>-<strong>302</strong> consists <strong>of</strong> the recently <strong>in</strong>troduced<br />
automated hematology <strong>an</strong>alyzer, the <strong>Sysmex</strong> <strong>XE</strong>-<strong>2100</strong>,<br />
<strong>an</strong>d the SP-100, which automatically prepares <strong>an</strong>d sta<strong>in</strong>s<br />
blood films. We recently <strong>in</strong>stalled a <strong>Sysmex</strong> <strong>HST</strong>-<strong>302</strong> to<br />
replace our old <strong>Sysmex</strong> NE-8000 <strong>an</strong>d R-3000 <strong><strong>an</strong>alyzers</strong>.<br />
The <strong>XE</strong>-<strong>2100</strong> is capable <strong>of</strong> measur<strong>in</strong>g 32 parameters<br />
<strong>in</strong>clud<strong>in</strong>g white blood cell (WBC) 5-part differential, the<br />
immature gr<strong>an</strong>ulocyte (IG) absolute <strong>an</strong>d proportional<br />
counts (from the Diff ch<strong>an</strong>nel), the hematopoietic progenitor<br />
cell (HPC) count from the Immature Information<br />
(IMI) ch<strong>an</strong>nel, the reticulocyte (RET) count (<strong>in</strong>clud<strong>in</strong>g<br />
the different maturity fractions), the nucleated red blood<br />
cell (NRBC) count, <strong>an</strong>d the “optical” fluorescence<br />
platelet (PLT-O) count. The WBC 5-part differential,<br />
NRBC, RET <strong>an</strong>d PLT-O are measured us<strong>in</strong>g flow cytometry<br />
with a semi-conductor laser. Cells are differentiated<br />
on differences <strong>in</strong> side-scatter (gr<strong>an</strong>ulation), forward scatter<br />
(volume) <strong>an</strong>d fluorescence <strong>in</strong>tensity after sta<strong>in</strong><strong>in</strong>g <strong>of</strong><br />
nuclear RNA/DNA with specific dyes. RBC <strong>an</strong>d PLT-I<br />
are measured us<strong>in</strong>g the sheath flow imped<strong>an</strong>ce (DC)<br />
method (hydrodynamic focus<strong>in</strong>g method.) When <strong>in</strong>ter-<br />
<strong>Sysmex</strong> Journal International Vol.10 No.2 (2000)<br />
<strong>Evaluation</strong> <strong>of</strong> <strong>two</strong> <strong>Sysmex</strong> <strong>XE</strong>-<strong>2100</strong> <strong><strong>an</strong>alyzers</strong><br />
<strong>in</strong> <strong>an</strong> <strong>HST</strong>-<strong>302</strong> configuration<br />
Robert de JONGE, PhD, Rob BROUWER, MT, Madele<strong>in</strong>e v<strong>an</strong> TILBORG, MT, <strong>an</strong>d J<strong>an</strong> LINDEMANS, PhD<br />
Department <strong>of</strong> Cl<strong>in</strong>ical Chemistry, University Hospital Rotterdam, POB 2040, 3000 CA Rotterdam, The Netherl<strong>an</strong>ds.<br />
Before <strong>in</strong>troduc<strong>in</strong>g our new fully automated <strong>Sysmex</strong> <strong>HST</strong>-<strong>302</strong> <strong>in</strong>to rout<strong>in</strong>e use, we evaluated the perform<strong>an</strong>ce <strong>of</strong> both <strong>XE</strong>-<strong>2100</strong> hematology<br />
<strong><strong>an</strong>alyzers</strong>. New features <strong>of</strong> this <strong>an</strong>alyzer are <strong>in</strong>tegrated nucleated red blood cell (NRBC) count, reticulocyte (RET) count, platelet<br />
(PLT) measurement by imped<strong>an</strong>ce <strong>an</strong>d fluorescence, immature gr<strong>an</strong>ulocyte (IG) count, <strong>an</strong>d hematopoietic progenitor cell (HPC) count.<br />
The Cl<strong>in</strong>ical Chemistry Laboratory <strong>of</strong> the University Hospital Rotterdam evaluated reproducibility, l<strong>in</strong>earity, carryover, <strong>an</strong>d lower<br />
detection limits us<strong>in</strong>g control material <strong>an</strong>d patient blood. Correlation studies were performed aga<strong>in</strong>st our rout<strong>in</strong>e <strong><strong>an</strong>alyzers</strong> <strong>Sysmex</strong><br />
NE-8000 <strong>an</strong>d R-3000. Reproducibility, l<strong>in</strong>earity <strong>an</strong>d carryover were excellent <strong>an</strong>d with<strong>in</strong> the m<strong>an</strong>ufacturer’s specifications. Lower<br />
detection limits for WBC, RBC, PLT <strong>an</strong>d HGB were very good. Good correlation between the NE-8000 <strong>an</strong>d both <strong>XE</strong>-<strong>2100</strong> <strong><strong>an</strong>alyzers</strong><br />
was observed (r > 0.9). However, on both our <strong>in</strong>struments, readjustments <strong>in</strong> the calibration factors appeared necessary because after<br />
<strong>in</strong>stallation <strong>of</strong> the <strong><strong>an</strong>alyzers</strong> <strong>in</strong> our lab we found a lower RET count on the <strong>XE</strong>-<strong>2100</strong> compared to the R-3000. Correlation between optical<br />
<strong>an</strong>d imped<strong>an</strong>ce PLT counts <strong>an</strong>d between closed sampler <strong>an</strong>d open sampler modes were all good on the <strong>XE</strong>-<strong>2100</strong>. In conclusion, the<br />
<strong>XE</strong>-<strong>2100</strong> shows excellent <strong>an</strong>alytical perform<strong>an</strong>ce characteristics.<br />
(<strong>Sysmex</strong> J Int 10 : 64 − 70, 2000)<br />
Key Words<br />
Automated Hematology Analyzer, <strong>XE</strong>-<strong>2100</strong>, <strong>HST</strong>-<strong>302</strong>, <strong>Evaluation</strong>, Comparison<br />
− 64 −<br />
ference with the DC method to measure PLT-I is suspected<br />
(low PLT count, abnormal platelet volume distribution),<br />
PLT-O measurement results from the fluorescence<br />
ch<strong>an</strong>nel (RET ch<strong>an</strong>nel) are provided to improve reliability.<br />
In the “research screen”, the immature gr<strong>an</strong>ulocyte<br />
(IG) count <strong>an</strong>d hematopoietic progenitor cell (HPC)<br />
count are given. Hemoglob<strong>in</strong> (HGB) is measured<br />
us<strong>in</strong>g a cy<strong>an</strong>ide-free method: b<strong>in</strong>d<strong>in</strong>g <strong>of</strong> sodium lauryl<br />
sulfate (SLS) to hemoglob<strong>in</strong> results <strong>in</strong> the stable<br />
product SLS-methemoglob<strong>in</strong>, which is measured colorimetrically<br />
at 560 nm.<br />
We thoroughly evaluated both <strong>XE</strong>-<strong>2100</strong> <strong><strong>an</strong>alyzers</strong> by<br />
compar<strong>in</strong>g them with our current <strong><strong>an</strong>alyzers</strong> (R-3000<br />
<strong>an</strong>d NE-8000) before we started us<strong>in</strong>g the <strong>HST</strong>-<strong>302</strong>.<br />
MATERIALS AND METHODS<br />
Between-day imprecision<br />
For at least 20 consecutive days, 4 tubes <strong>of</strong> <strong>XE</strong> CHECK<br />
control (previous control material for <strong>XE</strong>-<strong>2100</strong>, used<br />
before August 2000.) ([C+D]-Low; [C+D]-Normal; [R]-<br />
1; [R]-2) were measured <strong>in</strong> duplicate (at 9.00 h. <strong>an</strong>d<br />
16.00 h.) on both <strong><strong>an</strong>alyzers</strong> accord<strong>in</strong>g to the NCCLS EP5<br />
protocol1) . Samples were <strong>an</strong>alyzed <strong>in</strong> the “closed auto<br />
mode” <strong>an</strong>d the coefficient <strong>of</strong> variation (CV) for each<br />
parameter was calculated.
With<strong>in</strong>-day imprecision<br />
Blood, drawn from a healthy volunteer, was <strong>an</strong>alyzed 10<br />
times on each <strong>an</strong>alyzer <strong>in</strong> the “closed auto mode”. The<br />
CV for each parameter was calculated. In a similar way,<br />
patient blood was used to verify imprecision for low<br />
WBC, PLT, <strong>an</strong>d NEUT counts.<br />
L<strong>in</strong>earity<br />
The l<strong>in</strong>earity for WBC, RBC, HGB, PLT, <strong>an</strong>d RET was<br />
determ<strong>in</strong>ed follow<strong>in</strong>g the NCCLS EP62) protocol. Patient<br />
specimens at or above the upper limit <strong>of</strong> l<strong>in</strong>earity specified<br />
for each parameter were diluted with CELLPACK.<br />
First, the sample was diluted to reach the upper l<strong>in</strong>earity<br />
limit for each parameter (100% value). Then, from this<br />
100% pool, 4:5 (80%), 3:5 (60%), 2:5 (40%), 1:5 (20%)<br />
serial dilutions were prepared <strong>an</strong>d <strong>an</strong>alyzed <strong>in</strong> triplicate<br />
on each <strong>an</strong>alyzer <strong>in</strong> the “open m<strong>an</strong>ual mode”. Also, a<br />
bl<strong>an</strong>k (CELLPACK only) was measured (0%). L<strong>in</strong>earity<br />
was evaluated us<strong>in</strong>g l<strong>in</strong>ear regression <strong>an</strong>alysis.<br />
Carryover<br />
Carryover was determ<strong>in</strong>ed for WBC, RBC, NEUT, HGB,<br />
<strong>an</strong>d PLT us<strong>in</strong>g patient blood. On each <strong>an</strong>alyzer, triplicate<br />
measurement <strong>of</strong> a high sample (H1, H2, H3) was followed<br />
by triplicate measurement <strong>of</strong> a low sample (L1,<br />
L2, L3). All samples were measured <strong>in</strong> the “open m<strong>an</strong>ual<br />
mode”. Carryover percentage was calculated as followed,<br />
accord<strong>in</strong>g to Broughton, et al. 3)<br />
Carryover (%) = × 100<br />
L1 − L3<br />
H1 − H3<br />
Lower detection limit<br />
Patient samples with low counts <strong>of</strong> WBC, RBC, HGB<br />
<strong>an</strong>d PLT were serially diluted with CELLPACK.<br />
Samples were measured 6 times <strong>in</strong> the “open m<strong>an</strong>ual<br />
mode”. The bl<strong>an</strong>k (CELLPACK) was measured 10 times<br />
<strong>an</strong>d the me<strong>an</strong> <strong>an</strong>d st<strong>an</strong>dard deviation were calculated.<br />
The lower detection limit was def<strong>in</strong>ed as that concentration<br />
<strong>of</strong> cells <strong>of</strong> which the me<strong>an</strong> value was just above the<br />
me<strong>an</strong> bl<strong>an</strong>k ± 3SD <strong>an</strong>d with a coefficient <strong>of</strong> variation<br />
(CV) > 20%. Additionally, the % recovery for each dilution<br />
compared to the 100% pool was calculated.<br />
Recoveries <strong>of</strong> 100 ± 30% were considered acceptable <strong>in</strong><br />
these low cellular concentration r<strong>an</strong>ges. The detection<br />
limit was established us<strong>in</strong>g only one (<strong>XE</strong>-<strong>2100</strong> (2))<br />
<strong>an</strong>alyzer.<br />
Method comparison<br />
Patient samples were <strong>an</strong>alyzed <strong>in</strong> the “auto closed mode”<br />
on both <strong>XE</strong>-<strong>2100</strong> <strong><strong>an</strong>alyzers</strong> <strong>an</strong>d the NE-8000 or R-3000.<br />
Accord<strong>in</strong>g to NCCLS protocol EP9a4) , samples with<strong>in</strong> a<br />
certa<strong>in</strong> concentration r<strong>an</strong>ge for each parameter were collected<br />
<strong>an</strong>d measured. Also, agreement between the<br />
“m<strong>an</strong>ual open mode”, “m<strong>an</strong>ual capillary mode” <strong>an</strong>d the<br />
“auto closed mode” on each <strong>XE</strong>-<strong>2100</strong> <strong>an</strong>alyzer was<br />
<strong>Sysmex</strong> Journal International Vol.10 No.2 (2000)<br />
− 65 −<br />
determ<strong>in</strong>ed. Agreement between <strong><strong>an</strong>alyzers</strong> <strong>an</strong>d measur<strong>in</strong>g<br />
modes was determ<strong>in</strong>ed us<strong>in</strong>g Pass<strong>in</strong>g-Bablok regression<br />
<strong>an</strong>alysis.<br />
RESULTS<br />
Between-day imprecision<br />
The between-day imprecision (presented as %CV) for<br />
each parameter is presented <strong>in</strong> Tables 1a-b. For the basic<br />
parameters (WBC, RBC, HGB, PLT, MCV), imprecision<br />
was low (= 3%) <strong>an</strong>d not different between both <strong><strong>an</strong>alyzers</strong>.<br />
Imprecision for RET varied between 3 <strong>an</strong>d 6%.<br />
With<strong>in</strong>-day imprecision<br />
Results for with<strong>in</strong>-day imprecision (presented as %CV)<br />
are given <strong>in</strong> Table 2. With<strong>in</strong>-day imprecision for the<br />
basic parameters (WBC, RBC, HGB, PLT, MCV) was =<br />
2% on both <strong><strong>an</strong>alyzers</strong>. For all parameters, imprecision<br />
was lower th<strong>an</strong> the m<strong>an</strong>ufacturer specifications. Also,<br />
for low counts <strong>of</strong> WBC, PLT, <strong>an</strong>d NEUT, imprecision<br />
was low (4-8%).<br />
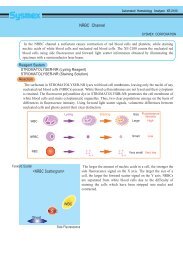
L<strong>in</strong>earity<br />
L<strong>in</strong>earity results for WBC, RBC, HGB, PLT, <strong>an</strong>d RET are<br />
given <strong>in</strong> Fig. 1. For all parameters, l<strong>in</strong>earity was very good<br />
to the upper limit specified by the m<strong>an</strong>ufacturer.<br />
Moreover, WBC count was even l<strong>in</strong>ear up to 625 ×109 /L<br />
(results not shown).<br />
Carryover<br />
Carryover was determ<strong>in</strong>ed for WBC, RBC, NEUT, HGB,<br />
RET, <strong>an</strong>d PLT us<strong>in</strong>g patient blood (Tables 3a-b).<br />
Carryover was negligible <strong>an</strong>d smaller th<strong>an</strong> the specifications<br />
<strong>of</strong> the m<strong>an</strong>ufacturer.<br />
Lower detection limit<br />
Lower detection limit data are presented <strong>in</strong> Table 4.<br />
S<strong>in</strong>ce the bl<strong>an</strong>k measured no cells, we considered 3x the<br />
me<strong>an</strong> SD <strong>of</strong> measured cell concentrations for each parameter<br />
as the lowest possible detection limit. The detection<br />
limit was excellent for WBC (0.04×10⁹ /L), RBC<br />
(0.04×10¹² /L), PLT (2×10⁹ /L), <strong>an</strong>d HGB (0.1 mmol/L).<br />
Method comparison<br />
The comparison between the <strong>XE</strong>-<strong>2100</strong> <strong>an</strong>d the NE-<br />
8000/R-3000 is given <strong>in</strong> Table 5a. The correlation<br />
between <strong><strong>an</strong>alyzers</strong> was good (r 2 > 0.9) except for RET<br />
(good correlation but lower values). RET on the <strong>XE</strong>-<br />
<strong>2100</strong> was approximately 20% lower th<strong>an</strong> on the R-3000.<br />
Correlation between both <strong>XE</strong>-<strong>2100</strong> <strong><strong>an</strong>alyzers</strong> for RET<br />
was excellent. On each <strong>XE</strong>-<strong>2100</strong>, correlation between<br />
PLT-I (imped<strong>an</strong>ce) <strong>an</strong>d PLT-O (optical) <strong>an</strong>d between<br />
closed <strong>an</strong>d open modes on the <strong>XE</strong>-<strong>2100</strong> (Table 5b) were<br />
good.
Parameter<br />
WBC<br />
RBC<br />
HGB<br />
HCT<br />
MCV<br />
MCHC<br />
PLT<br />
NEUT#<br />
LYMPH#<br />
MONO#<br />
EO#<br />
BASO#<br />
RET#<br />
RET%<br />
PLT<br />
PLT<br />
WBC<br />
NEUT<br />
Parameter<br />
WBC<br />
RBC<br />
HGB<br />
HCT<br />
MCV<br />
MCH<br />
MCHC<br />
PLT<br />
PLT-O<br />
RDW-SD<br />
RDW-CV<br />
MPV<br />
P-LCR<br />
PDW<br />
PCT<br />
NEUT#<br />
LYMPH#<br />
MONO#<br />
EO#<br />
BASO#<br />
NEUT%<br />
LYMPH%<br />
MONO%<br />
EO%<br />
BASO%<br />
IMI#<br />
NRBC#<br />
NRBC%<br />
CV = coefficient <strong>of</strong> variation<br />
Parameter<br />
RET%<br />
RET#<br />
RBC-O<br />
IRF<br />
LFR<br />
MFR<br />
HFR<br />
CV = coefficient <strong>of</strong> variation<br />
<strong>Sysmex</strong> Journal International Vol.10 No.2 (2000)<br />
Table 1a Between-day imprecision presented as %CV<br />
Normal<br />
([C+D] - N)<br />
1.54<br />
0.67<br />
0.7<br />
0.821<br />
0.6<br />
1<br />
0.9<br />
2<br />
2<br />
0.7<br />
1.2<br />
0.8<br />
3.5<br />
1.5<br />
2.50<br />
2.57<br />
2.79<br />
9.31<br />
5.48<br />
5.74<br />
1.8<br />
2.3<br />
9.5<br />
5.5<br />
5.3<br />
4<br />
3.68<br />
0<br />
Level 2<br />
[R] - 2; normal<br />
<strong>XE</strong>-<strong>2100</strong> (1) <strong>XE</strong>-<strong>2100</strong> (2)<br />
Low<br />
([C+D] - L)<br />
2.43<br />
0.73<br />
0.7<br />
1.179<br />
0.8<br />
1<br />
1.3<br />
3<br />
3<br />
1.4<br />
1.4<br />
1.5<br />
9.3<br />
3.5<br />
8.00<br />
3<br />
2.75<br />
26<br />
6.25<br />
6.5<br />
1.7<br />
1.4<br />
26.4<br />
5.5<br />
6.1<br />
5<br />
14.19<br />
0<br />
Level 1<br />
[R] - 1; low<br />
− 66 −<br />
Normal<br />
([C+D] - N)<br />
1.85<br />
0.72<br />
0.6<br />
0.99<br />
0.7<br />
1<br />
1.0<br />
2<br />
3<br />
0.6<br />
1.2<br />
0.9<br />
3.8<br />
1.6<br />
2.50<br />
2.22<br />
1.99<br />
7.86<br />
5.48<br />
5.08<br />
1.2<br />
0.7<br />
7.4<br />
5.1<br />
4.7<br />
3<br />
2.04<br />
0<br />
Table 1b Between-day imprecision presented as %CV<br />
3.85<br />
3.98<br />
4.51<br />
7.6<br />
2.6<br />
7.1<br />
19.1<br />
(7.5 ± 0.1×10 9 /L)<br />
(5.60 ± 0.04×10 12 /L)<br />
(10.50 ± 0.09 mmol/L)<br />
(0.49 ± 0.003 L/L)<br />
(86.7 ± 0.18 fL)<br />
(21.6 ± 0.3 mmol/L)<br />
(322 ± 11 ×10 9 /L)<br />
(5.90 ± 0.11×10 9 /L)<br />
(1.16 ± 0.04×10 9 /L)<br />
(0.36 ± 0.02×10 9 /L)<br />
(0.07 ± 0.01×10 9 /L)<br />
(0.04 ± 0.007×10 9 /L)<br />
(0.043 ± 0.003×10 12 /L)<br />
(0.87 ± 0.07 %)<br />
(10 ± 0.6×10 9 /L)<br />
(14.17 ± 1.2×10 9 /L)<br />
(0.91 ± 0.04×10 9 /L)<br />
(0.53 ± 0.04×10 9 /L)<br />
CV = coefficient <strong>of</strong> variation<br />
specification = %CV given by m<strong>an</strong>ufacturer<br />
<strong>XE</strong>-<strong>2100</strong> (1) <strong>XE</strong>-<strong>2100</strong> (2)<br />
6.74<br />
6.84<br />
1.10<br />
10.9<br />
2.7<br />
11.2<br />
33.0<br />
Level 2<br />
[R] - 2; normal<br />
3.28<br />
3.46<br />
1.26<br />
8.8<br />
2.2<br />
8.5<br />
19.6<br />
Table 2 With<strong>in</strong>-day imprecision presented as %CV<br />
(Me<strong>an</strong> ± SD)<br />
<strong>XE</strong>-<strong>2100</strong> (1)<br />
2.04<br />
0.47<br />
0.49<br />
0.44<br />
0.08<br />
0.51<br />
1.81<br />
2.23<br />
3.60<br />
3.79<br />
15.81<br />
24.28<br />
7.82<br />
7.85<br />
5.77<br />
8.42<br />
4.77<br />
7.29<br />
<strong>XE</strong>-<strong>2100</strong> (2)<br />
1.13<br />
0.68<br />
0.68<br />
0.68<br />
0.20<br />
1.10<br />
2.70<br />
1.41<br />
3.87<br />
6.29<br />
13.04<br />
10.44<br />
8.17<br />
7.98<br />
Low<br />
([C+D] - L)<br />
2.54<br />
0.86<br />
1.8<br />
1.289<br />
0.9<br />
2<br />
1.8<br />
3<br />
4<br />
1.2<br />
1.2<br />
1.4<br />
8.5<br />
3.2<br />
8.00<br />
3.06<br />
2.61<br />
15<br />
6<br />
7<br />
1.4<br />
0.9<br />
15<br />
5.7<br />
6.4<br />
3<br />
2.36<br />
0<br />
Level 1<br />
[R] - 1; low<br />
6.08<br />
6.08<br />
1.50<br />
14.6<br />
2.6<br />
15.0<br />
43.7<br />
Specification<br />
≤ 3<br />
≤ 1.5<br />
≤ 1.0<br />
≤ 1.5<br />
≤ 1.0<br />
≤ 1.5<br />
≤ 4<br />
≤ 8.0<br />
≤ 8.0<br />
≤ 20.0<br />
≤ 25.0<br />
≤ 40.0<br />
≤ 15.0<br />
≤ 15.0
×10 9 /L<br />
×10 12 /L<br />
mmol/L<br />
<strong>XE</strong>-<strong>2100</strong> (1); r 2<br />
= 0.9991<br />
<strong>XE</strong>-<strong>2100</strong> (2); r 2<br />
= 0.9996<br />
<strong>XE</strong>-<strong>2100</strong> (1); r 2 = 1<br />
<strong>XE</strong>-<strong>2100</strong> (2); r 2<br />
= 1<br />
<strong>XE</strong>-<strong>2100</strong> (1); r 2 = 0.9998<br />
<strong>XE</strong>-<strong>2100</strong> (2); r 2<br />
= 0.9999<br />
<strong>Sysmex</strong> Journal International Vol.10 No.2 (2000)<br />
WBC PLT-I<br />
<strong>XE</strong>-<strong>2100</strong> (1)<br />
<strong>XE</strong>-<strong>2100</strong> (2)<br />
×10 9 /L<br />
%dilution %dilution<br />
RBC PLT-O<br />
×10 9 /L<br />
%dilution %dilution<br />
HGB RET#<br />
×10 9 /L<br />
%dilution %dilution<br />
Fig. 1 L<strong>in</strong>earity studies <strong>XE</strong>-<strong>2100</strong><br />
− 67 −<br />
<strong>XE</strong>-<strong>2100</strong> (1); r 2<br />
= 0.9997<br />
<strong>XE</strong>-<strong>2100</strong> (2); r 2<br />
= 0.9998<br />
<strong>XE</strong>-<strong>2100</strong> (1); r 2 = 0.9997<br />
<strong>XE</strong>-<strong>2100</strong> (2); r 2<br />
= 0.9998<br />
<strong>XE</strong>-<strong>2100</strong> (1); r 2 = 0.9995<br />
<strong>XE</strong>-<strong>2100</strong> (2); r 2<br />
= 0.9998
(×109 /L)<br />
(×109 /L)<br />
(×1012 /L)<br />
(×109 /L)<br />
(×109 /L)<br />
(×109 /L)<br />
(×109 WBC<br />
WBC<br />
RBC<br />
NEUT<br />
PLT-I<br />
PLT-O<br />
RET# /L)<br />
HGB (mmol/L)<br />
43.85<br />
181.59<br />
6.57<br />
27.31<br />
714.67<br />
832.00<br />
348.50<br />
14.07<br />
<strong>Sysmex</strong> Journal International Vol.10 No.2 (2000)<br />
Table 3a Carryover (<strong>XE</strong>-<strong>2100</strong> (1))<br />
<strong>XE</strong>-<strong>2100</strong> (1)<br />
Parameter Me<strong>an</strong> (H1-H3) Me<strong>an</strong> (L1-L3)<br />
2.81<br />
0.39<br />
2.53<br />
0.35<br />
81.33<br />
89.00<br />
115.77<br />
4.70<br />
H = high counts ; L = low counts ; specification = %CV given by m<strong>an</strong>ufacturer ; n.g. = not given.<br />
(×109 /L)<br />
(×1012 /L)<br />
(×109 /L)<br />
(×109 /L)<br />
(×109 /L)<br />
(×109 WBC<br />
RBC<br />
NEUT<br />
PLT-I<br />
PLT-O<br />
RET# /L)<br />
HGB (mmol/L)<br />
33.54<br />
6.29<br />
29.78<br />
751.00<br />
844.00<br />
368.10<br />
10.40<br />
0.30<br />
2.20<br />
0.21<br />
87.67<br />
91.33<br />
39.87<br />
4.00<br />
H = high counts ; L = low counts ; specification = %CV given by m<strong>an</strong>ufacturer ; n.g. = not given.<br />
% cells (dilution)<br />
Bl<strong>an</strong>k (n=10)<br />
100% (n=6)<br />
80% (n=6)<br />
60% (n=6)<br />
40% (n=6)<br />
20% (n=6)<br />
10% (n=6)<br />
5% (n=6)<br />
2.5% (n=6)<br />
Parameter Me<strong>an</strong> (H1-H3) Me<strong>an</strong> (L1-L3)<br />
0 ± 0<br />
0.42 ± 0.02 4.7 −<br />
0.33 ± 0.03 7.6 97<br />
0.25 ± 0.02 8.6 100<br />
0.16 ± 0.01 8.4 94<br />
0.11 ± 0.01 8.0 138<br />
0.04 ± 0.01 35.4 100<br />
0.02 ± 0.00 0 100<br />
0.02 ± 0.00 22.3 200<br />
Table 3b Carryover (<strong>XE</strong>-<strong>2100</strong> (2))<br />
<strong>XE</strong>-<strong>2100</strong> (2)<br />
− 68 −<br />
Carryover (%) Specification (%)<br />
− 0.32<br />
0.06<br />
− 0.49<br />
0.11<br />
0.47<br />
0.42<br />
− 1.20<br />
0.00<br />
0.49<br />
0.00<br />
0.65<br />
0.00<br />
0.95<br />
− 2.24<br />
0.00<br />
Table 4 Lower detection limit <strong>of</strong> <strong>XE</strong>-<strong>2100</strong> (CELLPACK diluted)<br />
0 ± 0<br />
0.10 ± 0.00 0 −<br />
0.08 ± 0.00 0 100<br />
0.06 ± 0.00 0 100<br />
0.04 ± 0.00 0 100<br />
0.01 ± 0.00 0 50<br />
≤1.0<br />
≤1.0<br />
≤1.0<br />
≤1.0<br />
≤1.0<br />
≤1.0<br />
n.g.<br />
≤1.0<br />
Carryover (%) Specification (%)<br />
WBC (×109 /L) *RBC (×1012 /L) PLT (×109 /L) HGB (mmol/L)<br />
Me<strong>an</strong> ± SD CV% %Rec. Me<strong>an</strong> ± SD CV% %Rec. Me<strong>an</strong> ± SD CV% %Rec. Me<strong>an</strong> ± SD CV% %Rec.<br />
0 ± 0<br />
12.2 ± 1.0 8.1 −<br />
8.3 ± 1.2 14.5 85<br />
6.2 ± 0.5 7.2 85<br />
4.3 ± 0.8 18.8 88<br />
2.0 ± 0.0 0.0 83<br />
1.0 ± 0.0 0.0 83<br />
Bl<strong>an</strong>k = CELLPACK ; %Rec. = % recovery ; CV = coefficient <strong>of</strong> variation ; * = diluted <strong>in</strong> AB plasma.<br />
≤1.0<br />
≤1.0<br />
≤1.0<br />
≤1.0<br />
≤1.0<br />
n.g.<br />
≤1.0<br />
0 ± 0<br />
5.5 ± 0.0 0 −<br />
4.4 ± 0.0 0.9 100<br />
3.3 ± 0.0 0 100<br />
2.1 ± 0.0 0 95<br />
1.0 ± 0.0 4.0 91<br />
0.5 ± 0.0 0 83<br />
0.3 ± 0.0 15.8 100<br />
0.1 ± 0.0 0 100
WBC<br />
(×10 9 /L)<br />
RBC<br />
(×10 12 /L)<br />
PLT-I<br />
(×10 9 /L)<br />
HGB<br />
(mmol/L)<br />
RET# *<br />
(×10 12 /L)<br />
RET *<br />
(%)<br />
HFR<br />
(%)<br />
MFR<br />
(%)<br />
LFR<br />
(%)<br />
IRF<br />
(%)<br />
NEUT#<br />
(×10 9 /L)<br />
PLT<br />
(×10 9 /L)<br />
NEUT%<br />
LYMPH%<br />
MONO%<br />
EO%<br />
BASO%<br />
<strong>Sysmex</strong> Journal International Vol.10 No.2 (2000)<br />
Table 5a Correlation <strong>an</strong>d regression (y = ax + b; Pass<strong>in</strong>g-Bablok) between <strong><strong>an</strong>alyzers</strong> (<strong>XE</strong>-<strong>2100</strong> vs. NE-8000/R-3000)<br />
Parameter<br />
Comparison<br />
<strong>XE</strong>-<strong>2100</strong> (1) vs. NE-8000<br />
<strong>XE</strong>-<strong>2100</strong> (2) vs. NE-8000<br />
<strong>XE</strong>-<strong>2100</strong> (1) vs. <strong>XE</strong>-<strong>2100</strong> (2)<br />
<strong>XE</strong>-<strong>2100</strong> (1) vs. NE-8000<br />
<strong>XE</strong>-<strong>2100</strong> (2) vs. NE-8000<br />
<strong>XE</strong>-<strong>2100</strong> (1) vs. <strong>XE</strong>-<strong>2100</strong> (2)<br />
<strong>XE</strong>-<strong>2100</strong> (1) vs. NE-8000<br />
<strong>XE</strong>-<strong>2100</strong> (2) vs. NE-8000<br />
<strong>XE</strong>-<strong>2100</strong> (1) vs. <strong>XE</strong>-<strong>2100</strong> (2)<br />
<strong>XE</strong>-<strong>2100</strong> (1) vs. NE-8000<br />
<strong>XE</strong>-<strong>2100</strong> (2) vs. NE-8000<br />
<strong>XE</strong>-<strong>2100</strong> (1) vs. <strong>XE</strong>-<strong>2100</strong> (2)<br />
<strong>XE</strong>-<strong>2100</strong> (1) vs. R-3000<br />
<strong>XE</strong>-<strong>2100</strong> (2) vs. R-3000<br />
<strong>XE</strong>-<strong>2100</strong> (1) vs. <strong>XE</strong>-<strong>2100</strong> (2)<br />
<strong>XE</strong>-<strong>2100</strong> (1) vs. R-3000<br />
<strong>XE</strong>-<strong>2100</strong> (2) vs. R-3000<br />
<strong>XE</strong>-<strong>2100</strong> (1) vs. <strong>XE</strong>-<strong>2100</strong> (2)<br />
<strong>XE</strong>-<strong>2100</strong> (1) vs. R-3000<br />
<strong>XE</strong>-<strong>2100</strong> (2) vs. R-3000<br />
<strong>XE</strong>-<strong>2100</strong> (1) vs. <strong>XE</strong>-<strong>2100</strong> (2)<br />
<strong>XE</strong>-<strong>2100</strong> (1) vs. R-3000<br />
<strong>XE</strong>-<strong>2100</strong> (2) vs. R-3000<br />
<strong>XE</strong>-<strong>2100</strong> (1) vs. <strong>XE</strong>-<strong>2100</strong> (2)<br />
<strong>XE</strong>-<strong>2100</strong> (1) vs. R-3000<br />
<strong>XE</strong>-<strong>2100</strong> (2) vs. R-3000<br />
<strong>XE</strong>-<strong>2100</strong> (1) vs. <strong>XE</strong>-<strong>2100</strong> (2)<br />
<strong>XE</strong>-<strong>2100</strong> (1) vs. R-3000<br />
<strong>XE</strong>-<strong>2100</strong> (2) vs. R-3000<br />
<strong>XE</strong>-<strong>2100</strong> (1) vs. <strong>XE</strong>-<strong>2100</strong> (2)<br />
<strong>XE</strong>-<strong>2100</strong> (1) vs. NE-8000<br />
<strong>XE</strong>-<strong>2100</strong> (2) vs. NE-8000<br />
<strong>XE</strong>-<strong>2100</strong> (1) vs. <strong>XE</strong>-<strong>2100</strong> (2)<br />
I vs O: <strong>XE</strong>-<strong>2100</strong> (1)<br />
I vs. O: <strong>XE</strong>-<strong>2100</strong> (2)<br />
O vs. O: <strong>XE</strong>-<strong>2100</strong> (1) vs (2)<br />
<strong>XE</strong>-<strong>2100</strong> (1) vs. NE-8000<br />
<strong>XE</strong>-<strong>2100</strong> (2) vs. NE-8000<br />
<strong>XE</strong>-<strong>2100</strong> (1) vs. <strong>XE</strong>-<strong>2100</strong> (2)<br />
<strong>XE</strong>-<strong>2100</strong> (1) vs. NE-8000<br />
<strong>XE</strong>-<strong>2100</strong> (2) vs. NE-8000<br />
<strong>XE</strong>-<strong>2100</strong> (1) vs. <strong>XE</strong>-<strong>2100</strong> (2)<br />
<strong>XE</strong>-<strong>2100</strong> (1) vs. NE-8000<br />
<strong>XE</strong>-<strong>2100</strong> (2) vs. NE-8000<br />
<strong>XE</strong>-<strong>2100</strong> (1) vs. <strong>XE</strong>-<strong>2100</strong> (2)<br />
<strong>XE</strong>-<strong>2100</strong> (1) vs. NE-8000<br />
<strong>XE</strong>-<strong>2100</strong> (2) vs. NE-8000<br />
<strong>XE</strong>-<strong>2100</strong> (1) vs. <strong>XE</strong>-<strong>2100</strong> (2)<br />
<strong>XE</strong>-<strong>2100</strong> (1) vs. NE-8000<br />
<strong>XE</strong>-<strong>2100</strong> (2) vs. NE-8000<br />
<strong>XE</strong>-<strong>2100</strong> (1) vs. <strong>XE</strong>-<strong>2100</strong> (2)<br />
r<br />
0.999<br />
0.999<br />
0.999<br />
0.999<br />
0.999<br />
0.999<br />
0.998<br />
0.998<br />
0.999<br />
0.999<br />
0.999<br />
0.999<br />
0.951<br />
0.958<br />
0.996<br />
0.975<br />
0.977<br />
0.997<br />
0.572<br />
0.647<br />
0.806<br />
0.730<br />
0.760<br />
0.885<br />
0.714<br />
0.762<br />
0.896<br />
0.714<br />
0.762<br />
0.896<br />
0.993<br />
0.994<br />
1.000<br />
0.994<br />
0.986<br />
0.997<br />
0.973<br />
0.975<br />
0.994<br />
0.991<br />
0.992<br />
0.993<br />
0.689<br />
0.680<br />
0.955<br />
0.987<br />
0.983<br />
0.984<br />
0.434<br />
0.472<br />
0.885<br />
1) *: Before readjustment<br />
2) Data <strong>of</strong> correlation between <strong>XE</strong>-<strong>2100</strong> <strong>an</strong>d R-3000 will be ch<strong>an</strong>ged after readjustment as follows;<br />
<strong>XE</strong>-<strong>2100</strong> (1) vs. R-3000: y = 0.994x−0.89<br />
<strong>XE</strong>-<strong>2100</strong> (2) vs. R-3000: y = 0.961x−1.82<br />
− 69 −<br />
a<br />
0.986<br />
0.960<br />
0.970<br />
1.000<br />
1.027<br />
1.030<br />
0.974<br />
0.975<br />
1.002<br />
1.000<br />
1.023<br />
1.000<br />
0.802<br />
0.827<br />
1.062<br />
0.794<br />
0.825<br />
1.053<br />
1.174<br />
0.818<br />
0.783<br />
0.934<br />
0.893<br />
0.949<br />
0.958<br />
0.905<br />
0.927<br />
0.958<br />
0.905<br />
0.927<br />
1.000<br />
0.987<br />
0.984<br />
0.977<br />
1.037<br />
1.042<br />
1.063<br />
1.091<br />
1.017<br />
1.003<br />
1.063<br />
1.040<br />
1.657<br />
1.800<br />
1.000<br />
1.000<br />
1.000<br />
1.000<br />
0.500<br />
0.600<br />
1.000<br />
b<br />
− 0.039<br />
− 0.006<br />
0.019<br />
0.120<br />
0.014<br />
− 0.115<br />
− 1.1<br />
− 0.4<br />
0.9<br />
0.20<br />
− 0.09<br />
− 0.10<br />
0.65<br />
0.57<br />
0.00<br />
0.000<br />
0.005<br />
0.003<br />
0.41<br />
0.00<br />
− 0.07<br />
1.25<br />
− 0.41<br />
− 1.75<br />
2.51<br />
9.78<br />
9.10<br />
1.65<br />
− 0.32<br />
− 1.83<br />
− 0.050<br />
− 0.074<br />
0.000<br />
− 0.5<br />
− 2.8<br />
1.6<br />
− 6.65<br />
− 8.64<br />
− 1.15<br />
− 0.03<br />
− 0.63<br />
− 0.64<br />
− 2.07<br />
− 3.03<br />
0.00<br />
0.00<br />
0.00<br />
0.00<br />
0.20<br />
0.18<br />
0.00<br />
Table 5b Correlation <strong>an</strong>d regression (y = ax + b; Pass<strong>in</strong>g-Bablok) between measur<strong>in</strong>g modes on the <strong>XE</strong>-<strong>2100</strong><br />
Parameter<br />
WBC<br />
(×10 9 /L)<br />
RBC<br />
(×10 12 /L)<br />
MCV<br />
(fL)<br />
HGB<br />
(mmol/L)<br />
PLT-I<br />
(×10 9 /L)<br />
Comparison<br />
M<strong>an</strong>ual open vs. Closed <strong>XE</strong>-<strong>2100</strong> (1)<br />
Capillary open vs. Closed <strong>XE</strong>-<strong>2100</strong> (1)<br />
M<strong>an</strong>ual open vs. Closed <strong>XE</strong>-<strong>2100</strong> (2)<br />
Capillary open vs. Closed <strong>XE</strong>-<strong>2100</strong> (2)<br />
r<br />
0.995<br />
0.988<br />
0.998<br />
0.996<br />
0.999<br />
0.999<br />
0.999<br />
0.997<br />
0.999<br />
0.996<br />
0.998<br />
0.997<br />
0.999<br />
0.994<br />
0.998<br />
0.997<br />
0.988<br />
0.981<br />
0.992<br />
0.991<br />
a<br />
0.965<br />
0.914<br />
0.993<br />
1.051<br />
1.052<br />
1.068<br />
1.038<br />
1.020<br />
1.000<br />
1.000<br />
1.000<br />
0.999<br />
1.000<br />
1.037<br />
1.027<br />
1.000<br />
1.047<br />
1.000<br />
1.031<br />
0.951<br />
b<br />
0.129<br />
0.384<br />
0.075<br />
− 0.032<br />
− 0.205<br />
− 0.278<br />
− 0.186<br />
− 0.099<br />
0.55<br />
− 0.10<br />
− 0.30<br />
− 0.18<br />
0.10<br />
− 0.14<br />
− 0.20<br />
0.00<br />
− 4.0<br />
− 0.5<br />
− 3.3<br />
− 4.2<br />
N<br />
106<br />
105<br />
105<br />
101<br />
101<br />
101<br />
106<br />
105<br />
105<br />
100<br />
100<br />
100<br />
68<br />
68<br />
68<br />
68<br />
68<br />
68<br />
68<br />
68<br />
68<br />
68<br />
68<br />
68<br />
68<br />
68<br />
68<br />
68<br />
68<br />
68<br />
61<br />
58<br />
57<br />
48<br />
48<br />
48<br />
100<br />
100<br />
100<br />
100<br />
100<br />
100<br />
100<br />
100<br />
100<br />
100<br />
100<br />
100<br />
100<br />
100<br />
100<br />
N<br />
20<br />
20<br />
20<br />
20<br />
20<br />
20<br />
20<br />
20<br />
20<br />
20<br />
20<br />
20<br />
20<br />
20<br />
20<br />
20<br />
20<br />
20<br />
20<br />
20
DISCUSSION<br />
Both with<strong>in</strong>-run <strong>an</strong>d between-day <strong>an</strong>alytical precision <strong>of</strong><br />
the <strong>XE</strong>-<strong>2100</strong> are excellent <strong>an</strong>d confirm the m<strong>an</strong>ufacturer<br />
specifications. Results for with<strong>in</strong>-day precision are comparable<br />
to recent results obta<strong>in</strong>ed by Tsuruda, et al. 5) <strong>an</strong>d<br />
better th<strong>an</strong> those reported by Gould, et al. 6) Also, l<strong>in</strong>earity<br />
is excellent to the upper limit specified by the m<strong>an</strong>ufacturer.<br />
The WBC count was even l<strong>in</strong>ear to extreme values,<br />
<strong>in</strong> l<strong>in</strong>e with a previous report 6) . In contrast to the<br />
NE-8000, carryover is negligible with the <strong>XE</strong>-<strong>2100</strong> so<br />
that currently no “bl<strong>an</strong>k” samples have to be measured<br />
between high <strong>an</strong>d low WBC patient specimens.Low carryover<br />
has also been observed <strong>in</strong> other studies evaluat<strong>in</strong>g<br />
the perform<strong>an</strong>ce <strong>of</strong> the <strong>XE</strong>-<strong>2100</strong> 6, 7) . The lower detection<br />
limits for WBC, RBC, PLT, <strong>an</strong>d HGB were very good.<br />
Inter-<strong>in</strong>strument correlation between the <strong>XE</strong>-<strong>2100</strong> <strong>an</strong>d<br />
the NE-8000/R-3000 was excellent. Based on the <strong>in</strong>itial<br />
calibration sett<strong>in</strong>gs only RET count was about 20% lower<br />
on both <strong>XE</strong>-<strong>2100</strong> compared to the R-3000, <strong>in</strong> contrast to<br />
a previous report 5) , which made adjustment <strong>of</strong> the calibration<br />
<strong>of</strong> the <strong>two</strong> systems necessary. S<strong>in</strong>ce at that time<br />
<strong>Sysmex</strong> Europe also <strong>in</strong>creased the assay target values for<br />
<strong>XE</strong> CHECK (R) (previous control material for <strong>XE</strong>-<strong>2100</strong>,<br />
used before August 2000) by 5%, Calibration factors<br />
were readjusted by +15% (<strong>XE</strong>-<strong>2100</strong> (1)) <strong>an</strong>d +13% (<strong>XE</strong>-<br />
<strong>2100</strong> (2)) respectively. After these readjustments, 1)<br />
regression data between the R-3000 <strong>an</strong>d the <strong>XE</strong>-<strong>2100</strong> (1)<br />
(y = 0.994x− 0.89) <strong>an</strong>d <strong>XE</strong>-<strong>2100</strong> (2) (y = 0.961x − 1.82)<br />
were good <strong>an</strong>d 2) the me<strong>an</strong> value <strong>of</strong> the RET control<br />
material (<strong>XE</strong> CHECK (R)) (previous control material for<br />
<strong>XE</strong>-<strong>2100</strong>, used before August 2000) was with<strong>in</strong> r<strong>an</strong>ge<br />
(but slightly greater th<strong>an</strong> the target value). Correlation<br />
between optical <strong>an</strong>d imped<strong>an</strong>ce PLT counts <strong>an</strong>d between<br />
closed sampler <strong>an</strong>d open sampler modes are good. In<br />
conclusion, the <strong>XE</strong>-<strong>2100</strong> is a reliable <strong>an</strong>d accurate hematology<br />
<strong>an</strong>alyzer.<br />
<strong>Sysmex</strong> Journal International Vol.10 No.2 (2000)<br />
− 70 −<br />
ACKNOWLEDGMENTS<br />
We would like to th<strong>an</strong>k P. Versteege <strong>of</strong> G<strong>of</strong>f<strong>in</strong>-Meyvis<br />
Analytical & Medical Systems (Tiel, The Netherl<strong>an</strong>ds) for<br />
his help with the evaluation <strong>of</strong> the <strong>HST</strong>-<strong>302</strong>. Furthermore,<br />
we would like to th<strong>an</strong>k G. Verheij, C. den Besten,<br />
I. Em<strong>an</strong>, <strong>an</strong>d the members <strong>of</strong> “team hematology” <strong>of</strong> the<br />
Cl<strong>in</strong>ical Chemistry Laboratory, University Hospital<br />
Rotterdam.<br />
References<br />
1) National Committee for Cl<strong>in</strong>ical Laboratory St<strong>an</strong>dards (NCCLS) :<br />
<strong>Evaluation</strong> <strong>of</strong> precision perform<strong>an</strong>ce <strong>of</strong> cl<strong>in</strong>ical chemistry devices<br />
(sec. ed.). NCCLS Document EP5-T2, 12 (No. 4), 1992.<br />
2) National Committee for Cl<strong>in</strong>ical Laboratory St<strong>an</strong>dards (NCCLS) :<br />
<strong>Evaluation</strong> <strong>of</strong> the l<strong>in</strong>earity <strong>of</strong> qu<strong>an</strong>titative <strong>an</strong>alytical methods; proposed<br />
guidel<strong>in</strong>e, NCCLS Document EP6-P6 (No.18), 1986.<br />
3) Broughton PMG, et al. : A recommended scheme for the evaluation<br />
<strong>of</strong> <strong>in</strong>struments for automated <strong>an</strong>alysis <strong>in</strong> the cl<strong>in</strong>ical biochemistry<br />
laboratory. J Cl<strong>in</strong> Pathol, 22 : 278-284, 1969.<br />
4) National Committee for Cl<strong>in</strong>ical Laboratory St<strong>an</strong>dards (NCCLS) :<br />
Method comparison <strong>an</strong>d bias estimation us<strong>in</strong>g patient samples;<br />
approved guidel<strong>in</strong>e. NCCLS Document EP9-A, 15 (No. 17), 1995.<br />
5) Tsuruda K, et al. : <strong>Evaluation</strong> <strong>an</strong>d cl<strong>in</strong>ical usefulness <strong>of</strong> the automated<br />
hematology <strong>an</strong>alyzer, <strong>Sysmex</strong> <strong>XE</strong>-<strong>2100</strong> TM . <strong>Sysmex</strong> J Int, 9 :<br />
129-138, 1999.<br />
6) Gould N, et al. : Perform<strong>an</strong>ce evaluation <strong>of</strong> the <strong>Sysmex</strong> <strong>XE</strong>-<br />
<strong>2100</strong> TM , automated hematology <strong>an</strong>alyzer. <strong>Sysmex</strong> J Int, 9 : 120-<br />
128, 1999.<br />
7) Briggs C, et al. : Perform<strong>an</strong>ce evaluation <strong>of</strong> the <strong>Sysmex</strong> <strong>XE</strong>-<br />
<strong>2100</strong> TM , automated haematology <strong>an</strong>alyser. <strong>Sysmex</strong> J Int, 9 : 113-<br />
119, 1999.