Temperature & Humidity in Ocean Containers
Temperature & Humidity in Ocean Containers
Temperature & Humidity in Ocean Containers

You also want an ePaper? Increase the reach of your titles
YUMPU automatically turns print PDFs into web optimized ePapers that Google loves.
<strong>Temperature</strong> & <strong>Humidity</strong><br />
<strong>in</strong> <strong>Ocean</strong> Conta<strong>in</strong>ers<br />
Results from a one year study of ocean conta<strong>in</strong>er<br />
temperature and humidity conditions for shipments<br />
between Asia, Europe and North America. Highlights<br />
<strong>in</strong>clude port, sea, rail transport and storage conditions,<br />
as well as a number of unexpected conditions.<br />
David Le<strong>in</strong>berger, CPP, CPLP<br />
Senior Packag<strong>in</strong>g Eng<strong>in</strong>eer<br />
Xerox Corporation<br />
26600 SW Parkway Avenue, MS: 7063-201<br />
Wilsonville, OR 97070 USA<br />
Tel: 503-685-3717<br />
Email: david.le<strong>in</strong>berger@xerox.com<br />
Education: BS and MS from Michigan State University.<br />
Activities: Member of ISTA, IoPP, ASTM, Western Packag<strong>in</strong>g<br />
Association.<br />
Achievements: IoPP CPP, ISTA CPLP-Professional.
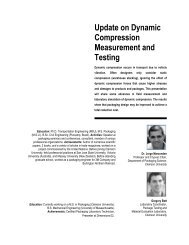
Abstract<br />
<strong>Ocean</strong> Conta<strong>in</strong>er <strong>Temperature</strong> and <strong>Humidity</strong> Study<br />
David A. Le<strong>in</strong>berger, 2/27/2006<br />
This paper summarizes the results from a twenty-month study of ocean conta<strong>in</strong>er<br />
temperature and humidity conditions for shipments between Asia, Europe and North America.<br />
While this study focused on ocean conta<strong>in</strong>ers, the recorded conditions <strong>in</strong>clude sea, truck and rail<br />
transportation as well as periods of storage that may occur dur<strong>in</strong>g a normal conta<strong>in</strong>er shipment.<br />
A distribution of all data along with a detailed look at the extreme conditions is provided. Effects of<br />
conta<strong>in</strong>er position on the ship and recorder position with<strong>in</strong> the conta<strong>in</strong>er are presented. The<br />
effect of the conta<strong>in</strong>er contents is also discussed.<br />
Routes<br />
The goal of this study was to understand the temperature and humidity conditions for<br />
three of our common transportation routes. We monitored shipments from a facility just south of<br />
Nagoya, Japan to a facility near Portland, Oregon USA and to another facility <strong>in</strong> Oostrum, The<br />
Netherlands. The route from Japan to Portland is a rather direct route across the Pacific <strong>Ocean</strong>.<br />
The route from Japan to The Netherlands weaves around S<strong>in</strong>gapore near the equator, around<br />
India, through the Suez Cannel, through the Mediterranean Sea, <strong>in</strong>to the Atlantic <strong>Ocean</strong> and<br />
f<strong>in</strong>ally up the English channel to the Netherlands. There can be a number of stops at ports along<br />
this route. We also monitored a third route between a facility south of Yokohama, Japan to a<br />
facility <strong>in</strong> Memphis, Tennessee, USA. This route <strong>in</strong>cludes tra<strong>in</strong> transportation from a west coast<br />
port to Memphis. All three routes are outl<strong>in</strong>ed <strong>in</strong> figure 1.<br />
Figure 1. Rout<strong>in</strong>g Map<br />
Dest<strong>in</strong>ations:<br />
Netherlands<br />
Memphis<br />
Portland<br />
<strong>Ocean</strong> Conta<strong>in</strong>er <strong>Temperature</strong> and <strong>Humidity</strong> Study<br />
Dave Le<strong>in</strong>berger – Dimensions.06
Seasons<br />
Date record<strong>in</strong>g began <strong>in</strong> April 2004 and cont<strong>in</strong>ued through January 2006. 160 shipments<br />
are <strong>in</strong>cluded <strong>in</strong> the analysis. The record<strong>in</strong>gs are broken down by month for each route <strong>in</strong> figure 2.<br />
While we recorded throughout the year, some months have more recorded data than others.<br />
Recorded Days<br />
600<br />
500<br />
400<br />
300<br />
200<br />
100<br />
0<br />
Equipment / Setup<br />
Figure 2: Distribution of Record<strong>in</strong>gs - Three Dest<strong>in</strong>ations<br />
Netherlands<br />
Memphis<br />
Portland<br />
Jan Feb Mar Apr May Jun Jul Aug Sep Oct Nov Dec<br />
Month<br />
HOBO U12-011 data loggers from Onset Computer Corporation were used for this<br />
study. They have a temperature range of -4º to 158ºF [-20º to 70ºC] with an accuracy of ±0.6ºF<br />
[±0.35ºC] from 32º to 122ºF [0º to 50ºC]. The relative <strong>Humidity</strong> Measurement range is 5% to 95%<br />
RH, with an accuracy of ±2.5% from 10% to 90% RH. (1) Recorders were programmed to capture<br />
temperature and humidity read<strong>in</strong>gs every 10 m<strong>in</strong>utes. This allowed for up to 113 days of<br />
record<strong>in</strong>g which exceeded the longest trip length.<br />
The recorders where mounted to the outside of corrugated boxes us<strong>in</strong>g an adhesive<br />
pouch. A portion of the pouch was removed around the recorder to allow unrestricted airflow.<br />
Operators were <strong>in</strong>structed to <strong>in</strong>stall the recorder as high as possible on the top box of the last row<br />
at the door of the conta<strong>in</strong>er dur<strong>in</strong>g the load<strong>in</strong>g process. Recorders where <strong>in</strong>stalled away from the<br />
sidewalls, but fac<strong>in</strong>g the conta<strong>in</strong>er door. See figure 3 for data logger <strong>in</strong>stallation. The recorders<br />
where removed as part of the unload<strong>in</strong>g process and returned for data collection and reuse.<br />
<strong>Ocean</strong> Conta<strong>in</strong>er <strong>Temperature</strong> and <strong>Humidity</strong> Study<br />
Dave Le<strong>in</strong>berger – Dimensions.06
Figure 3: Diagram of Data Recorder Location<br />
Typical Conditions<br />
A normal shipment consists of three dist<strong>in</strong>ct stages. The first stage <strong>in</strong>cludes the time<br />
from conta<strong>in</strong>er fill<strong>in</strong>g until the conta<strong>in</strong>er is loaded onto a ship. This <strong>in</strong>cludes road transportation<br />
and brief periods of storage. Daily cycles of temperature and humidity are common. For<br />
example, figure 4 <strong>in</strong>cludes temperature sw<strong>in</strong>gs of 40° F [22°C] dur<strong>in</strong>g the first stage of a shipment<br />
from Japan to Portland.<br />
<strong>Temperature</strong> F and<br />
Relative <strong>Humidity</strong> %<br />
120<br />
110<br />
100<br />
90<br />
80<br />
70<br />
60<br />
50<br />
40<br />
30<br />
20<br />
10-May-<br />
05<br />
15-May-<br />
05<br />
Figure 4: Typical Shipment<br />
Japan to Portland<br />
Japan <strong>Ocean</strong> Netherlands<br />
20-May-<br />
05<br />
<strong>Temperature</strong><br />
Relative <strong>Humidity</strong><br />
J<br />
25-May-<br />
05<br />
Date<br />
30-May-<br />
05<br />
<strong>Ocean</strong> Conta<strong>in</strong>er <strong>Temperature</strong> and <strong>Humidity</strong> Study<br />
Dave Le<strong>in</strong>berger – Dimensions.06<br />
Recorder<br />
04-Jun-05 09-Jun-05<br />
48<br />
43<br />
38<br />
33<br />
28<br />
23<br />
18<br />
13<br />
8<br />
3<br />
-2<br />
-7<br />
<strong>Temperature</strong> C
The second stage is the actual time at sea or aboard a ship. This may or may not be the<br />
longest stage dur<strong>in</strong>g the conta<strong>in</strong>er’s journey. Dur<strong>in</strong>g this stage, daily cycles of temperature and<br />
humidity are usually very m<strong>in</strong>or or completely non-existent. <strong>Temperature</strong> changes are gradual,<br />
often occurr<strong>in</strong>g over days rather than hours. Occasionally, a s<strong>in</strong>gle temperature/ humidity cycle<br />
occurs as the ship makes stops along the route, however extreme conditions are rare. Figure 5<br />
<strong>in</strong>cludes a slow temperature rise and fall as a w<strong>in</strong>ter route takes the ship near the equator and<br />
then north to The Netherlands.<br />
The f<strong>in</strong>al stage beg<strong>in</strong>s when the conta<strong>in</strong>er is removed from the ship and cont<strong>in</strong>ues until<br />
the recorder is removed dur<strong>in</strong>g the freight unload<strong>in</strong>g process. This may <strong>in</strong>clude vary<strong>in</strong>g periods<br />
of time spent <strong>in</strong> customs, on tra<strong>in</strong>s, on trucks, and <strong>in</strong> storage. Daily temperature and humidity<br />
cycles are common and may be extreme.<br />
Temperture F and Relative<br />
<strong>Humidity</strong> %<br />
90<br />
80<br />
70<br />
60<br />
50<br />
40<br />
30<br />
20<br />
Japan<br />
Figure 5: Typical W<strong>in</strong>ter Shipment<br />
Japan to The Netherlands<br />
<strong>Temperature</strong><br />
Relative <strong>Humidity</strong><br />
J<br />
<strong>Ocean</strong><br />
10<br />
-12<br />
01-Dec-05 11-Dec-05 21-Dec-05 31-Dec-05 10-Jan-06<br />
Date<br />
<strong>Ocean</strong> Conta<strong>in</strong>er <strong>Temperature</strong> and <strong>Humidity</strong> Study<br />
Dave Le<strong>in</strong>berger – Dimensions.06<br />
Netherlands<br />
28<br />
23<br />
18<br />
13<br />
8<br />
3<br />
-2<br />
-7<br />
<strong>Temperature</strong> C
Distribution of Data:<br />
The distribution of maximum and m<strong>in</strong>imum shipment temperatures is <strong>in</strong>cluded for each<br />
route <strong>in</strong> Figure 6. Each shipment is represented on this graph by one po<strong>in</strong>t at the highest and<br />
lowest recorded temperatures. An example from the graph; 85% of the shipments to Memphis<br />
had a maximum temperature below 120° F [48° C]. Also, 70% of the shipments to Memphis had<br />
m<strong>in</strong>imum temperatures above 32° F [0° C].<br />
<strong>Temperature</strong> F<br />
Figure 6: Distribution of Maximum and M<strong>in</strong>imum Shipment<br />
<strong>Temperature</strong>s<br />
140<br />
130<br />
56<br />
120<br />
110<br />
46<br />
100<br />
90<br />
36<br />
80<br />
70<br />
26<br />
60<br />
50<br />
16<br />
40<br />
6<br />
30<br />
20<br />
10<br />
0<br />
-10<br />
-20<br />
Netherlands:Highest<br />
Netherlands: lowest<br />
Memphis: Highest<br />
Memphis: Lowest<br />
Portland:Highest<br />
Portland:Lowest<br />
-4<br />
-14<br />
-24<br />
-30<br />
-34<br />
0% 10% 20% 30% 40% 50% 60% 70% 80% 90% 100%<br />
Cumulative % of Shipments<br />
<strong>Ocean</strong> Conta<strong>in</strong>er <strong>Temperature</strong> and <strong>Humidity</strong> Study<br />
Dave Le<strong>in</strong>berger – Dimensions.06<br />
<strong>Temperature</strong> C
Extreme Conditions:<br />
Some of the most <strong>in</strong>terest<strong>in</strong>g record<strong>in</strong>gs are the extreme conditions. The highest<br />
recorded temperature occurred on July 25, 2005 dur<strong>in</strong>g a shipment from Japan to Memphis. The<br />
temperature reached 135° F [57° C] dur<strong>in</strong>g the third stage of this shipment (figure 7).<br />
<strong>Temperature</strong> F and<br />
Relative <strong>Humidity</strong> %<br />
140<br />
120<br />
100<br />
80<br />
60<br />
40<br />
20<br />
Figure 7: Hottest Shipment 135 F [57 C]<br />
Japan to Memphis<br />
<strong>Temperature</strong><br />
Relative <strong>Humidity</strong><br />
04-Jul-05 09-Jul-05 14-Jul-05 19-Jul-05 24-Jul-05<br />
Date<br />
The lowest recorded temperature occurred on January 15, 2005 also along the<br />
Japan to Memphis route (figure 8). The temperature dropped to –21° F [-29° C], which is slightly<br />
beyond the recorder’s published temperature range.<br />
<strong>Temperature</strong> F and<br />
Relative <strong>Humidity</strong> %<br />
100<br />
80<br />
60<br />
40<br />
20<br />
0<br />
-20<br />
-40<br />
21-Dec-<br />
2004<br />
26-Dec-<br />
2004<br />
Figure 8: Coldest Shipment -21 F [-29 C]<br />
Japan to Memphis<br />
<strong>Temperature</strong><br />
Relative <strong>Humidity</strong><br />
31-Dec-<br />
2004<br />
5-Jan-<br />
2005<br />
10-Jan-<br />
2005<br />
Date<br />
15-Jan-<br />
2005<br />
<strong>Ocean</strong> Conta<strong>in</strong>er <strong>Temperature</strong> and <strong>Humidity</strong> Study<br />
Dave Le<strong>in</strong>berger – Dimensions.06<br />
20-Jan-<br />
2005<br />
25-Jan-<br />
2005<br />
53<br />
43<br />
33<br />
23<br />
13<br />
3<br />
-7<br />
30<br />
20<br />
10<br />
0<br />
-10<br />
-20<br />
-30<br />
-40<br />
<strong>Temperature</strong> C<br />
<strong>Temperature</strong> C
The shipment with the highest relative humidity occurred dur<strong>in</strong>g a trip from Japan to<br />
Portland. The relative humidity was recorded at 96% on August 5, 2005 while the conta<strong>in</strong>er was<br />
on land. Figure 9 shows the detailed temperature and humidity profile. The most extreme<br />
humidity conditions are seen dur<strong>in</strong>g periods of large daily temperature changes. In this example,<br />
as the temperature slowly drops from 88° F [31° C] to 67° F [19° C] over 9 days, the humidity<br />
<strong>in</strong>creases to 88% before return<strong>in</strong>g to 79%. However, start<strong>in</strong>g on August 4 as the temperature<br />
dropped from 121° F [49° C] to 68° F [20° C] over a 16 hour period, the relative humidity rose<br />
from 32% to 96%. The corrugated boxes seem to absorb moisture fast enough to temper<br />
humidity dur<strong>in</strong>g slow changes <strong>in</strong> temperature while at sea. However, rapid temperature changes<br />
seen on land seem to exceed the rate at which the corrugated boxes can absorb moisture.<br />
<strong>Temperature</strong> F and Relative <strong>Humidity</strong> %<br />
140<br />
120<br />
100<br />
80<br />
60<br />
40<br />
Figure 9: Highest Relative <strong>Humidity</strong> 96%<br />
Japan to Portland<br />
<strong>Temperature</strong><br />
Relative <strong>Humidity</strong><br />
20<br />
-7<br />
11-Jul-05 16-Jul-05 21-Jul-05 26-Jul-05 31-Jul-05 05-Aug-05<br />
Date<br />
<strong>Ocean</strong> Conta<strong>in</strong>er <strong>Temperature</strong> and <strong>Humidity</strong> Study<br />
Dave Le<strong>in</strong>berger – Dimensions.06<br />
58<br />
53<br />
48<br />
43<br />
38<br />
33<br />
28<br />
23<br />
18<br />
13<br />
8<br />
3<br />
-2<br />
<strong>Temperature</strong> C
Effect of Position on Ship:<br />
As part of our study, we measured the conditions <strong>in</strong> multiple ocean conta<strong>in</strong>ers travel<strong>in</strong>g<br />
on the same voyage. The temperature profiles were usually very close to identical. However, on<br />
a few shipments, there were clear differences <strong>in</strong> temperature between the different ocean<br />
conta<strong>in</strong>ers. The largest difference was recorded between two conta<strong>in</strong>ers travel<strong>in</strong>g from Japan to<br />
The Netherlands. Figure 10 shows how conta<strong>in</strong>er #2 had a gradual temperature variation along<br />
the ocean voyage. Conta<strong>in</strong>er #1 shows a much larger variation each day. This conta<strong>in</strong>er may<br />
have been loaded above deck where the sunlight could affect the conta<strong>in</strong>er temperature. It is<br />
important to note that the temperature variations while at sea are more moderate than those seen<br />
before and after the ocean voyage.<br />
<strong>Temperature</strong> F<br />
110<br />
100<br />
90<br />
80<br />
70<br />
60<br />
50<br />
40<br />
Figure 10: Conta<strong>in</strong>er <strong>Temperature</strong> Differences From Same Ship<br />
Conta<strong>in</strong>er 1<br />
Conta<strong>in</strong>er 2<br />
30<br />
-1<br />
02-Sep-04 12-Sep-04 22-Sep-04 02-Oct-04 12-Oct-04<br />
Date<br />
<strong>Ocean</strong> Conta<strong>in</strong>er <strong>Temperature</strong> and <strong>Humidity</strong> Study<br />
Dave Le<strong>in</strong>berger – Dimensions.06<br />
39<br />
34<br />
29<br />
24<br />
19<br />
14<br />
9<br />
4<br />
<strong>Temperature</strong> C
Effect of Position With<strong>in</strong> Conta<strong>in</strong>er:<br />
As the study cont<strong>in</strong>ued, we wanted to understand how temperatures are distributed with<strong>in</strong><br />
an ocean conta<strong>in</strong>er. We ran a controlled experiment with data recorders at various positions<br />
with<strong>in</strong> a partially filled ocean conta<strong>in</strong>er. Figure 11 details the recorder position along with the<br />
temperature profiles over a three-day period. The temperature recorded at the top of the ocean<br />
conta<strong>in</strong>er was over 35° F [19° C] higher dur<strong>in</strong>g the afternoon than the temperature recorded near<br />
the bottom. Also, the temperature from a recorder surrounded by the mass of packaged products<br />
was more moderate than the temperatures <strong>in</strong> the empty area of the conta<strong>in</strong>er and the<br />
temperature outside.<br />
<strong>Temperature</strong> F<br />
110<br />
100<br />
90<br />
80<br />
70<br />
60<br />
50<br />
Figure 11: Conta<strong>in</strong>er <strong>Temperature</strong> by Location<br />
40<br />
30<br />
20<br />
1: 9" down- tail<br />
2: 48" down- tail<br />
3: 88" down- tail<br />
Outside<br />
A: 5" down- middle<br />
C: 48" down- middle<br />
D: 88" down- middle<br />
B: 26" down- middle<br />
9/26/05 14:24 9/27/05 14:24 9/28/05 14:24<br />
1<br />
2<br />
3<br />
Date/Time<br />
A<br />
B<br />
C<br />
<strong>Ocean</strong> Conta<strong>in</strong>er <strong>Temperature</strong> and <strong>Humidity</strong> Study<br />
Dave Le<strong>in</strong>berger – Dimensions.06<br />
D<br />
43<br />
38<br />
33<br />
28<br />
23<br />
18<br />
13<br />
8<br />
3<br />
-2<br />
-7<br />
<strong>Temperature</strong> C
Effect of Conta<strong>in</strong>er Contents:<br />
In our record<strong>in</strong>gs, a typical shipment will see an <strong>in</strong>crease <strong>in</strong> humidity as the temperature<br />
drops with<strong>in</strong> a conta<strong>in</strong>er. However, at some po<strong>in</strong>t, humidity stabilizes and eventually falls even as<br />
the temperature cont<strong>in</strong>ues to drop. We believe the corrugated boxes <strong>in</strong> the conta<strong>in</strong>er slowly<br />
absorbed the moisture from the air prevent<strong>in</strong>g condensation at the lower ocean temperatures.<br />
To test this theory, we recreated these ocean conditions us<strong>in</strong>g an environmental chamber<br />
and large sealed jars to simulate an ocean conta<strong>in</strong>er. One jar held fiberboard boxes, while the<br />
other held plastic boxes of the same volume. The jars were exposed to 86° F [30°C], 75%<br />
humidity for 48 hours before be<strong>in</strong>g sealed. As Figure 12 shows, the simulated conta<strong>in</strong>er with the<br />
fiberboard boxes had a much lower relative humidity. Clearly the contents can change the<br />
relative humidity.<br />
<strong>Temperature</strong> F and Relative<br />
<strong>Humidity</strong> %<br />
100<br />
90<br />
80<br />
70<br />
60<br />
50<br />
40<br />
Figure 12: Simulated Conta<strong>in</strong>er Test<br />
<strong>Temperature</strong><br />
<strong>Humidity</strong>-Jar with Plastic Boxes<br />
<strong>Humidity</strong>- Jar with Fiberboard Boxes<br />
0:00:00 48:00:00 96:00:00 144:00:00 192:00:00 240:00:00<br />
Time<br />
Conclusion:<br />
We now have a much greater understand<strong>in</strong>g of the temperature and humidity conditions<br />
<strong>in</strong> an ocean conta<strong>in</strong>er for some of our common shipp<strong>in</strong>g routes. While we learned much about<br />
our distribution environment, we also raised a number of questions. Further study focused on<br />
quantify<strong>in</strong>g the affect of certa<strong>in</strong> variables may be useful. Some areas that could be further<br />
explored <strong>in</strong>clude: conta<strong>in</strong>er color and design, position on the ship, type of load, positions along<br />
the length, width and height of the conta<strong>in</strong>er, position at port, rout<strong>in</strong>g differences.<br />
References<br />
(1) Onset computer website:<br />
http://www.onsetcomp.com/Products/Product_Pages/hobo_u12_loggers/u12_logger_specs.html<br />
<strong>Ocean</strong> Conta<strong>in</strong>er <strong>Temperature</strong> and <strong>Humidity</strong> Study<br />
Dave Le<strong>in</strong>berger – Dimensions.06<br />
34<br />
29<br />
24<br />
19<br />
14<br />
9<br />
4<br />
<strong>Temperature</strong> C