Canton - Baltimore City Health Department
Canton - Baltimore City Health Department
Canton - Baltimore City Health Department

You also want an ePaper? Increase the reach of your titles
YUMPU automatically turns print PDFs into web optimized ePapers that Google loves.
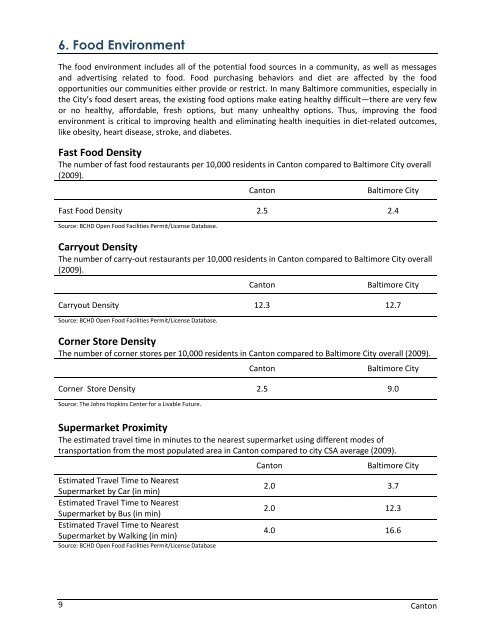
6. Food Environment<br />
The food environment includes all of the potential food sources in a community, as well as messages<br />
and advertising related to food. Food purchasing behaviors and diet are affected by the food<br />
opportunities our communities either provide or restrict. In many <strong>Baltimore</strong> communities, especially in<br />
the <strong>City</strong>’s food desert areas, the existing food options make eating healthy difficult—there are very few<br />
or no healthy, affordable, fresh options, but many unhealthy options. Thus, improving the food<br />
environment is critical to improving health and eliminating health inequities in diet-related outcomes,<br />
like obesity, heart disease, stroke, and diabetes.<br />
Fast Food Density<br />
The number of fast food restaurants per 10,000 residents in <strong>Canton</strong> compared to <strong>Baltimore</strong> <strong>City</strong> overall<br />
(2009).<br />
9<br />
<strong>Canton</strong> <strong>Baltimore</strong> <strong>City</strong><br />
Fast Food Density 2.5 2.4<br />
Source: BCHD Open Food Facilities Permit/License Database.<br />
Carryout Density<br />
The number of carry-out restaurants per 10,000 residents in <strong>Canton</strong> compared to <strong>Baltimore</strong> <strong>City</strong> overall<br />
(2009).<br />
<strong>Canton</strong> <strong>Baltimore</strong> <strong>City</strong><br />
Carryout Density 12.3 12.7<br />
Source: BCHD Open Food Facilities Permit/License Database.<br />
Corner Store Density<br />
The number of corner stores per 10,000 residents in <strong>Canton</strong> compared to <strong>Baltimore</strong> <strong>City</strong> overall (2009).<br />
<strong>Canton</strong> <strong>Baltimore</strong> <strong>City</strong><br />
Corner Store Density 2.5 9.0<br />
Source: The Johns Hopkins Center for a Livable Future.<br />
Supermarket Proximity<br />
The estimated travel time in minutes to the nearest supermarket using different modes of<br />
transportation from the most populated area in <strong>Canton</strong> compared to city CSA average (2009).<br />
Estimated Travel Time to Nearest<br />
Supermarket by Car (in min)<br />
Estimated Travel Time to Nearest<br />
Supermarket by Bus (in min)<br />
Estimated Travel Time to Nearest<br />
Supermarket by Walking (in min)<br />
Source: BCHD Open Food Facilities Permit/License Database<br />
<strong>Canton</strong> <strong>Baltimore</strong> <strong>City</strong><br />
2.0 3.7<br />
2.0 12.3<br />
4.0 16.6<br />
<strong>Canton</strong>