Canton - Baltimore City Health Department
Canton - Baltimore City Health Department
Canton - Baltimore City Health Department

You also want an ePaper? Increase the reach of your titles
YUMPU automatically turns print PDFs into web optimized ePapers that Google loves.
1<br />
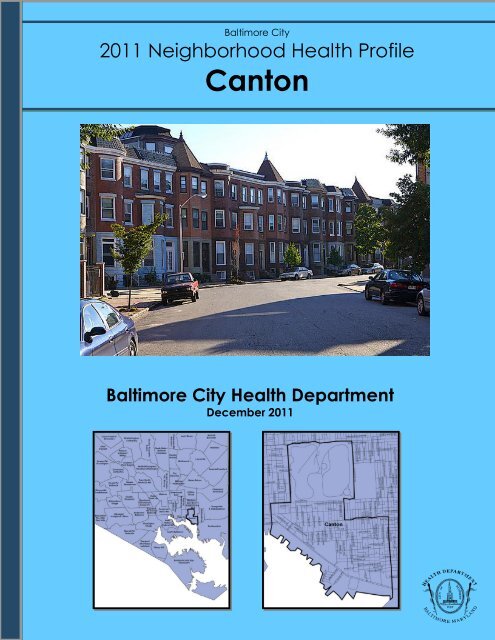
<strong>Baltimore</strong> <strong>City</strong><br />
2011 Neighborhood <strong>Health</strong> Profile<br />
<strong>Canton</strong><br />
<strong>Baltimore</strong> <strong>City</strong> <strong>Health</strong> <strong>Department</strong><br />
December 2011<br />
<strong>Canton</strong>
Table of Contents<br />
1. Introduction ..........................................................................................................2<br />
2. Demographics .......................................................................................................3<br />
3. Socioeconomic Characteristics ..............................................................................4<br />
4. Education …… ........................................................................................................5<br />
5. Community Built and Social Environment …… .......................................................6<br />
6. Housing ……… ........................................................................................................8<br />
7. Food Environment ................................................................................................9<br />
8. <strong>Health</strong> Outcomes ..................................................................................................10<br />
9. Neighborhood Summary .......................................................................................14<br />
10. Technical Notes ...................................................................................................16<br />
Authors<br />
Office of Policy and Planning<br />
Alisa Ames, MHS<br />
Mark Evans<br />
Laura Fox, MPH<br />
Adam J. Milam, MHS<br />
Ryan J. Petteway, MPH<br />
Regina Rutledge, MPH<br />
Acknowledgements<br />
This report was developed by Ryan Petteway, Alisa Ames, and Caroline Fichtenberg of the <strong>Baltimore</strong> <strong>City</strong><br />
<strong>Health</strong> <strong>Department</strong> with the assistance of Nicole Robinson, a master’s geography student at UMD. The<br />
report was completed by Mark Evans, Adam Milam, Regina Rutledge, and Laura Fox. The authors would<br />
like to thank the following individuals and organizations for providing data and/or contributing analyses:<br />
Matthew Kachura of the <strong>Baltimore</strong> Neighborhood Indicators Alliance, Anne Palmer and Amanda Behrens<br />
of the Johns Hopkins Center for a Livable Future, Jeanetta Churchill of <strong>Baltimore</strong> <strong>City</strong> Public Schools, the<br />
<strong>Baltimore</strong> Police <strong>Department</strong>, the Maryland <strong>Department</strong> of the Environment, Robert Hayman, Dr.<br />
Isabelle Horon, Hal Sommers of Maryland Vital Statistic Administration, Travis Pate of the <strong>Baltimore</strong> <strong>City</strong><br />
Planning <strong>Department</strong>, and Mark Dennis of the Mayor’s Office.<br />
Suggested citation<br />
Ames, A., Evans, M., Fox, L., Milam, A., Petteway, R., Rutledge, R.. 2011 Neighborhood <strong>Health</strong> Profile:<br />
<strong>Canton</strong>. <strong>Baltimore</strong> <strong>City</strong> <strong>Health</strong> <strong>Department</strong>, December 2011<br />
Electronic Source<br />
This report is available at http://www.baltimorehealth.org/dataresearch.html<br />
1<br />
<strong>Canton</strong>
Introduction<br />
In the fall of 2008, the <strong>Baltimore</strong> <strong>City</strong> <strong>Health</strong> <strong>Department</strong> released its first iteration of the<br />
Neighborhood <strong>Health</strong> Profiles. The 2008 Profiles were developed in an effort to provide<br />
residents information regarding the health status of their specific communities, as well as to<br />
facilitate identification of priority health areas and inspire collaborative action. These Profiles<br />
revealed stark inequities in health outcomes between our <strong>City</strong>’s neighborhoods. The most<br />
harrowing of these inequities was a 20 year gap in life expectancy between two neighborhoods<br />
that are less than five miles apart.<br />
The new 2011 Neighborhood <strong>Health</strong> Profiles build on the 2008 Profiles by looking at the<br />
underlying factors that affect health in each neighborhood—the social determinants of health.<br />
The social determinants of health are the conditions in which residents live, learn, work, and<br />
play, and include factors like access to healthy food, healthy housing, quality schools, and safe<br />
places to be active. According to the world’s leading public health authority, the World <strong>Health</strong><br />
Organization, “The social determinants of health are mostly responsible for health inequities.”<br />
The 2011 Profiles will thus allow residents to not only identify priority health issues, but also to<br />
identify underlying conditions that are more immediately actionable. Residents are presented<br />
with data on lung cancer mortality, for example, as well as data on tobacco retail density.<br />
Each 2011 Neighborhood <strong>Health</strong> Profile is divided into 10 sections. The first section provides an<br />
overview of demographic information—the total population, age, gender, and race and<br />
ethnicity of neighborhood residents. Sections Two through Six provide data on the social<br />
determinants of health by neighborhood—the conditions in which residents live, learn, work,<br />
and play that affect health. These include data on: socioeconomic factors, education, the<br />
community built and social environment, housing, and the food environment. The seventh<br />
section provides data on health outcomes, including data on life expectancy, mortality and<br />
causes of death, and maternal and child health outcomes. The eighth section summarizes how<br />
each neighborhood compares to the other neighborhoods for the social determinants of health<br />
indicators. The ninth section summarizes how each neighborhood compares to the other<br />
neighborhoods for health outcomes. Technical notes in section ten provide details on how the<br />
data were collected and tabulated. In this report, the terms “neighborhood” and “Community<br />
Statistical Area” are used interchangeably.<br />
The 2011 Neighborhood <strong>Health</strong> Profiles provide <strong>Baltimore</strong> citizens with objective data that<br />
accurately reflect local health issues. They clearly illustrate that neighborhoods have distinct<br />
health issues that must be addressed with full participation of affected communities. The 2011<br />
Profiles can help communities shift how they think about health to incorporate a robust<br />
spectrum of the social determinants of health. They are intended to be used in conjunction<br />
with <strong>Health</strong>y <strong>Baltimore</strong> 2015, the city’s health policy agenda. <strong>Health</strong>y <strong>Baltimore</strong> 2015 outlines<br />
the health priorities that account for the greatest amount of preventable disease, disability and<br />
death in <strong>Baltimore</strong> city. The 2011 Profiles move us in our growing efforts to eliminate health<br />
inequities and achieve health equity for all <strong>Baltimore</strong> communities.<br />
2<br />
<strong>Canton</strong>
1. Demographics<br />
Neighborhood: <strong>Canton</strong> at a Glance<br />
Total population in <strong>Baltimore</strong> <strong>City</strong> in 2010 616,802<br />
Total population in <strong>Canton</strong> in 2010 8,100<br />
Age<br />
The age distribution of <strong>Canton</strong> compared to <strong>Baltimore</strong> <strong>City</strong> overall (2010).<br />
3<br />
<strong>Canton</strong> <strong>Baltimore</strong> <strong>City</strong><br />
0-17 years 7.1% 21.6%<br />
18-24 years 10.5% 12.5%<br />
25-44 years 53.0% 28.8%<br />
45-64 years 18.5% 25.2%<br />
65+ years 10.9% 11.8%<br />
Source: 2010 US Census.<br />
Gender<br />
The percent of men and women in <strong>Canton</strong> compared to <strong>Baltimore</strong> <strong>City</strong> overall (2010).<br />
<strong>Canton</strong> <strong>Baltimore</strong> <strong>City</strong><br />
Men 49.5% 46.7%<br />
Women 50.5% 53.3%<br />
Source: 2010 US Census.<br />
Race/Ethnicity<br />
The race and ethnicity distribution of <strong>Canton</strong> compared to <strong>Baltimore</strong> <strong>City</strong> overall (2010).<br />
<strong>Canton</strong> <strong>Baltimore</strong> <strong>City</strong><br />
Black or African American 4.1% 63.6%<br />
White 88.9% 29.7%<br />
Asian 3.4% 2.4%<br />
Some Other Race 1 1.9% 2.2%<br />
Two or More Races 1.7% 2.1%<br />
Hispanic or Latino 2 5.0% 4.2%<br />
1 Hispanic or Latino ethnicity overlaps with other race categories.<br />
2 Some other race includes American Indian or Alaska Native, Native Hawaiian or Other Pacific Islander, and choosing other races as an option<br />
on the census.<br />
Source: 2010 US Census.<br />
<strong>Canton</strong>
2. Socioeconomic Characteristics<br />
Median Household Income<br />
The household income distribution of <strong>Canton</strong> compared to <strong>Baltimore</strong> <strong>City</strong> overall (2010).<br />
4<br />
<strong>Canton</strong> <strong>Baltimore</strong> <strong>City</strong><br />
Median Household Income $77,222 $37,395<br />
Less than $25,000 14.9% 33.3%<br />
$25,000-$39,999 7.8% 18.1%<br />
$40,000-$59,999 14.3% 17.1%<br />
$60,000-$74,999 11.4% 9.1%<br />
$75,000 and over 51.6% 22.5%<br />
Source: American Community Survey, 2005-2009.<br />
Unemployment<br />
The percent of the <strong>Canton</strong> population 16 years of age and older that are unemployed in the civilian<br />
labor force.<br />
<strong>Canton</strong> <strong>Baltimore</strong> <strong>City</strong><br />
Percent Unemployed 3.1% 11.1%<br />
Source: American Community Survey, 2005-2009.<br />
Family Poverty Rate<br />
The percent of families in <strong>Canton</strong> that have an income below the poverty level compared to <strong>Baltimore</strong><br />
<strong>City</strong> overall (2010).<br />
<strong>Canton</strong> <strong>Baltimore</strong> <strong>City</strong><br />
Percent of Families in Poverty 1.6% 15.2%<br />
Source: American Community Survey, 2005-2009.<br />
Percent of Single-Parent Households<br />
The percent of households with children
3. Education<br />
Educational attainment is one of the most critical determinants of health around the world. The World<br />
<strong>Health</strong> Organization has indicated that the single most important step in improving health and<br />
eliminating health inequities is making a greater investment in early childhood development and<br />
ensuring that all children can attain their full education potential. In <strong>Baltimore</strong>, many of the largest<br />
documented health inequities are between residents with differing levels of educational attainment. For<br />
example, residents with only a high school education or less have an all-cause death rate that is almost<br />
three times higher than that for residents with a bachelor’s degree or higher. Ensuring all residents can<br />
achieve their full education potential is essential to efforts to improve community health and eliminate<br />
health inequities.<br />
School Readiness and 3 rd and 8 th Grade Reading Proficiency<br />
The percent of kindergartners assessed as “fully ready” in <strong>Canton</strong> compared to <strong>Baltimore</strong> <strong>City</strong> overall<br />
(in school years 2007-2008 and 2008-2009). The percent of 3 rd and 8 th graders who are reading at<br />
“Proficient or Advanced” level in <strong>Canton</strong> compared to <strong>Baltimore</strong> <strong>City</strong> overall (school year 2008-2009).<br />
5<br />
<strong>Canton</strong> <strong>Baltimore</strong> <strong>City</strong><br />
Percent of Kindergartners<br />
“Fully Ready” to Learn 1<br />
47.8% 65.0%<br />
3 rd Graders at “Proficient or<br />
Advanced” Reading Level 2 79.2% 77.6%<br />
8 th Graders at “Proficient or<br />
Advanced” Reading Level 2 75.7% 58.6%<br />
1<br />
Source: <strong>Baltimore</strong> <strong>City</strong> Public Schools-Work Sampling System (WSS) of the Maryland Model for School Readiness (MMSR).<br />
2<br />
Source: <strong>Baltimore</strong> Neighborhood Indicators Alliance (BNIA) from the <strong>Baltimore</strong> <strong>City</strong> Public Schools<br />
School Absenteeism<br />
The percent of elementary, middle, and high school students who missed 20 or more days of school in<br />
<strong>Canton</strong> compared to <strong>Baltimore</strong> <strong>City</strong> overall (school year 2008-2009).<br />
Percent of Elementary School<br />
Students Missing 20+ Days<br />
Percent of Middle School<br />
Students Missing 20+ Days<br />
Percent of High School<br />
Students Missing 20+ Days<br />
Source: <strong>Baltimore</strong> Neighborhood Indicators Alliance (BNIA) from the <strong>Baltimore</strong> <strong>City</strong> Public Schools.<br />
<strong>Canton</strong> <strong>Baltimore</strong> <strong>City</strong><br />
9.9% 10.1%<br />
14.7% 16.3%<br />
33.3% 39.2%<br />
Adult Educational Attainment<br />
Educational attainment among residents 25 years and older in <strong>Canton</strong> compared to <strong>Baltimore</strong> <strong>City</strong><br />
overall.<br />
Percent of residents 25 years<br />
and older with a high school<br />
degree or less<br />
Percent of residents 25 years<br />
and older with a bachelors<br />
degree or more<br />
Source: American Community Survey, 2005-2009.<br />
<strong>Canton</strong> <strong>Baltimore</strong> <strong>City</strong><br />
25.8% 52.6%<br />
58.9% 25.0%<br />
<strong>Canton</strong>
4. Community Built and Social Environment<br />
A neighborhood’s built environment includes its physical attributes and structures, like buildings and<br />
lots, parks and green space, streets and sidewalks, hazardous waste sites, and businesses and retail<br />
shops. The built environment affects how people use space and interact with one another and has<br />
impacts on health. For example, clean and safe parks and green space allow for social interaction and<br />
opportunities to be physically active, whereas dirty streets and alleys may restrict or deter engaging in<br />
such opportunities. Having a selection of businesses and shops in a neighborhood also promotes social<br />
interaction and encourages more walking—things that are good for community and individual health.<br />
On the other hand, the presence of alcohol stores is strongly associated with crime and community<br />
violence, which deter outdoor activity and impose physical and mental health burdens.<br />
A neighborhood’s social environment includes factors related to the living, working, learning, and<br />
playing conditions of its residents. The social environment includes social institutions (cultural and<br />
religious institutions, economic systems, and political structures), social surroundings (workplace and<br />
school environments), and how its residents interact with one another, as well as how they interact with<br />
and within the contexts of their social institutions and surroundings. General socioeconomic conditions,<br />
such as poverty, income, employment, and educational attainment, as well as factors like discrimination,<br />
crime, and incarceration rates all impact a neighborhood’s social environment. These elements interact<br />
to shape opportunities for individual and community health in many ways.<br />
Alcohol Store Density<br />
The number of alcohol stores (Class A) per 10,000 residents of <strong>Canton</strong> compared to <strong>Baltimore</strong> <strong>City</strong><br />
overall (2009).<br />
6<br />
<strong>Canton</strong> <strong>Baltimore</strong> <strong>City</strong><br />
Alcohol Store Density 4.9 4.6<br />
Source: <strong>Baltimore</strong> <strong>City</strong> Liquor Board.<br />
Tobacco Store Density<br />
The number of tobacco stores per 10,000 residents of <strong>Canton</strong> compared to <strong>Baltimore</strong> <strong>City</strong> overall<br />
(2009).<br />
<strong>Canton</strong> <strong>Baltimore</strong> <strong>City</strong><br />
Tobacco Store Density 23.5 21.8<br />
Source: <strong>Baltimore</strong> <strong>City</strong> Comptroller.<br />
Juvenile Arrest Rate<br />
The number of arrests per 1,000 10-17 year olds in <strong>Canton</strong> compared to <strong>Baltimore</strong> <strong>City</strong> overall (2005-<br />
2009).<br />
<strong>Canton</strong> <strong>Baltimore</strong> <strong>City</strong><br />
Juvenile Arrest Rate 179.3 145.1<br />
Source: <strong>Baltimore</strong> Neighborhood Indicators Alliance (BNIA) from the <strong>Baltimore</strong> <strong>City</strong> Police <strong>Department</strong>.<br />
<strong>Canton</strong>
Domestic Violence Rate<br />
The number of incidents reported per 1,000 residents in <strong>Canton</strong> compared to <strong>Baltimore</strong> <strong>City</strong> overall<br />
(2005-2009).<br />
7<br />
<strong>Canton</strong> <strong>Baltimore</strong> <strong>City</strong><br />
Domestic Violence Rate 18.7 40.6<br />
Source: <strong>Baltimore</strong> Neighborhood Indicators Alliance (BNIA) from the <strong>Baltimore</strong> <strong>City</strong> Police <strong>Department</strong>.<br />
Non-Fatal Shooting Rate<br />
The number of non-fatal shootings per 10,000 residents in <strong>Canton</strong> compared to <strong>Baltimore</strong> <strong>City</strong> overall<br />
(2005-2009).<br />
<strong>Canton</strong> <strong>Baltimore</strong> <strong>City</strong><br />
Non-Fatal Shooting Rate 2.5 46.5<br />
Source: <strong>Baltimore</strong> <strong>City</strong> Police <strong>Department</strong>.<br />
Homicide Incidence Rate<br />
The number of homicides that occurred per 10,000 residents in <strong>Canton</strong> compared to <strong>Baltimore</strong> <strong>City</strong><br />
overall (2005-2009). Based on the location of the incident, not residence of the victim.<br />
<strong>Canton</strong> <strong>Baltimore</strong> <strong>City</strong><br />
Homicide Incidence Rate 2.5 20.9<br />
Source: <strong>Baltimore</strong> <strong>City</strong> Police <strong>Department</strong>.<br />
<strong>Canton</strong>
5. Housing<br />
Housing affects health in many ways. Lead-free homes minimize the likelihood of childhood lead<br />
poisoning. Housing with structural deficiencies or inadequately maintained housing can increase the<br />
risk of injury and fires. Housing that is not energy efficient can make heating and cooling costs high and<br />
difficult to manage for low-income residents: this can increase the risk of illness and death in extremely<br />
hot or cold weather; alternatively, paying disproportionately high energy bills reduces money available<br />
for food, medicine, and other health-related needs. Like other indicators of the built environment, the<br />
presence of a high number of vacant buildings and vacant lots is strongly associated with crime and<br />
community violence.<br />
Lead Paint Violation Rate<br />
The number of lead paint violations per year, per 10,000 households in <strong>Canton</strong> compared <strong>Baltimore</strong><br />
<strong>City</strong> overall (2000-2008).<br />
8<br />
<strong>Canton</strong> <strong>Baltimore</strong> <strong>City</strong><br />
Lead Paint Violation Rate 1.3 11.8<br />
Source: Mayor’s Office of Information Technology from the <strong>Baltimore</strong> <strong>City</strong> Real Property Systems.<br />
Energy Cut-off Rate<br />
The number of energy cut-offs per 10,000 households each month in <strong>Canton</strong> compared to <strong>Baltimore</strong><br />
<strong>City</strong> overall (2009-2010).<br />
<strong>Canton</strong> <strong>Baltimore</strong> <strong>City</strong><br />
Energy Cut-off Rate 7.2 39.1<br />
Source: <strong>Baltimore</strong> Gas and Electric<br />
Vacant Building Density<br />
The number of vacant buildings per 10,000 housing units in <strong>Canton</strong> compared to <strong>Baltimore</strong> <strong>City</strong> overall<br />
(2009).<br />
<strong>Canton</strong> <strong>Baltimore</strong> <strong>City</strong><br />
Vacant Building Density 94.5 567.2<br />
Source: Mayor’s Office of Information Technology from the <strong>Baltimore</strong> <strong>City</strong> Housing <strong>Department</strong>.<br />
Vacant Lot Density<br />
The number of vacant lots per 10,000 housing units in <strong>Canton</strong> compared to <strong>Baltimore</strong> <strong>City</strong> overall<br />
(2009).<br />
<strong>Canton</strong> <strong>Baltimore</strong> <strong>City</strong><br />
Vacant Lot Density 110.6 593.1<br />
Source: Mayor’s Office of Information Technology from the Real Property Dataset.<br />
<strong>Canton</strong>
6. Food Environment<br />
The food environment includes all of the potential food sources in a community, as well as messages<br />
and advertising related to food. Food purchasing behaviors and diet are affected by the food<br />
opportunities our communities either provide or restrict. In many <strong>Baltimore</strong> communities, especially in<br />
the <strong>City</strong>’s food desert areas, the existing food options make eating healthy difficult—there are very few<br />
or no healthy, affordable, fresh options, but many unhealthy options. Thus, improving the food<br />
environment is critical to improving health and eliminating health inequities in diet-related outcomes,<br />
like obesity, heart disease, stroke, and diabetes.<br />
Fast Food Density<br />
The number of fast food restaurants per 10,000 residents in <strong>Canton</strong> compared to <strong>Baltimore</strong> <strong>City</strong> overall<br />
(2009).<br />
9<br />
<strong>Canton</strong> <strong>Baltimore</strong> <strong>City</strong><br />
Fast Food Density 2.5 2.4<br />
Source: BCHD Open Food Facilities Permit/License Database.<br />
Carryout Density<br />
The number of carry-out restaurants per 10,000 residents in <strong>Canton</strong> compared to <strong>Baltimore</strong> <strong>City</strong> overall<br />
(2009).<br />
<strong>Canton</strong> <strong>Baltimore</strong> <strong>City</strong><br />
Carryout Density 12.3 12.7<br />
Source: BCHD Open Food Facilities Permit/License Database.<br />
Corner Store Density<br />
The number of corner stores per 10,000 residents in <strong>Canton</strong> compared to <strong>Baltimore</strong> <strong>City</strong> overall (2009).<br />
<strong>Canton</strong> <strong>Baltimore</strong> <strong>City</strong><br />
Corner Store Density 2.5 9.0<br />
Source: The Johns Hopkins Center for a Livable Future.<br />
Supermarket Proximity<br />
The estimated travel time in minutes to the nearest supermarket using different modes of<br />
transportation from the most populated area in <strong>Canton</strong> compared to city CSA average (2009).<br />
Estimated Travel Time to Nearest<br />
Supermarket by Car (in min)<br />
Estimated Travel Time to Nearest<br />
Supermarket by Bus (in min)<br />
Estimated Travel Time to Nearest<br />
Supermarket by Walking (in min)<br />
Source: BCHD Open Food Facilities Permit/License Database<br />
<strong>Canton</strong> <strong>Baltimore</strong> <strong>City</strong><br />
2.0 3.7<br />
2.0 12.3<br />
4.0 16.6<br />
<strong>Canton</strong>
7. <strong>Health</strong> Outcomes<br />
Life Expectancy and Premature Mortality<br />
Life expectancy is a measure that summarizes health over the entire lifespan. Life expectancy at birth is<br />
the average number of years a newborn can expect to live, assuming she or he experiences the<br />
currently prevailing rates of death throughout her or his lifespan. The mortality rate is the rate at which<br />
individuals in a population die, expressed in terms of deaths per 10,000 residents per year, and is ageadjusted.<br />
Age-adjusted mortality reflects all deaths from all causes, taking into account differences in<br />
population size and age distribution. Years of potential life lost (YPLL) is a measure of the impact of<br />
premature mortality on a population. Premature mortality is death before the age of 75. YPLL is<br />
calculated by adding together the years of life that were not lived because people died before age 75.<br />
Both life expectancy and YPLL are heavily influenced by deaths in the first few decades of life.<br />
10<br />
<strong>Canton</strong> <strong>Baltimore</strong> <strong>City</strong><br />
Life Expectancy at birth (in years) 76.9 71.8<br />
Age-adjusted mortality (Deaths per<br />
10,000 residents) 86.7 110.4<br />
Total Annual Years of Potential Life Lost<br />
(Years per 10,000 residents) 506.6 1372.3<br />
Sources: Maryland State Vital Statistics Administration 2005-2009 & the 2010 US Census.<br />
Avertable Deaths<br />
Avertable deaths are deaths that could have been avoided if all <strong>Baltimore</strong> communities had the same<br />
opportunity at health. Data presented here are based on the assumption that the death rates achieved<br />
in the five communities with the highest incomes should be achievable in every community, regardless<br />
of income. A positive percentage indicates the percentage of deaths that could have been avoided if a<br />
particular neighborhood had the same death rates as the five highest-income neighborhoods. A negative<br />
percentage indicates that a particular neighborhood has lower death rates than those of the five<br />
highest-income neighborhoods.<br />
<strong>Canton</strong> <strong>Baltimore</strong> <strong>City</strong><br />
Avertable Deaths 16.1% 36.1%<br />
Sources: Maryland State Vital Statistics Administration 2005-2009 & the 2010 US Census.<br />
<strong>Canton</strong>
Top Ten Causes of Death<br />
These are the 10 causes of death that account for the greatest number of deaths in <strong>Baltimore</strong> <strong>City</strong>. They<br />
can help determine where efforts and resources should be directed to best prevent premature deaths.<br />
The following table displays mortality rates, percent of total deaths, and percent of premature deaths by<br />
cause for the citywide top 10 causes of death, comparing <strong>Canton</strong> to <strong>Baltimore</strong>. The percent of<br />
premature deaths indicates the percent of all premature deaths that each specific cause accounts for.<br />
The mortality rate for each cause provides an absolute measure of the impact of each cause on<br />
residents. The percents of total deaths and percent of YPLL indicate the impact of a particular cause<br />
relative to others.<br />
11<br />
Cause of Death<br />
Rate 1<br />
(Deaths<br />
per<br />
10,000)<br />
<strong>Canton</strong> <strong>Baltimore</strong> <strong>City</strong><br />
Percent<br />
of Total<br />
Deaths<br />
Percent of<br />
YPLL<br />
Rate 1<br />
(Deaths<br />
per<br />
10,000)<br />
Percent<br />
of Total<br />
Deaths<br />
Percent of<br />
YPLL<br />
1. Heart Disease 22.8 27.0% 18.2% 28.4 25.8% 15.4%<br />
2. Cancer 25.1 27.0% 20.6% 23.1 20.8% 14.8%<br />
Lung Cancer 6.5 7.2% 3.9% 6.9 6.3% 4.2%<br />
Colon Cancer 3.0 3.3% 2.2% 2.3 2.1% 1.3%<br />
Breast Cancer 2 2.8 3.4% 0.8% 3.3 3.2% 2 4.1%<br />
Prostate Cancer 2<br />
2.8 3.2% 1.5% 3.1 2.5% 2 0.6%<br />
3. Stroke 3.5 4.5% 3.9% 5.2 4.7% 2.6%<br />
4. HIV/AIDS 0.5 0.6% 2.4% 3.9 3.5% 7.6%<br />
5. Chronic Lower<br />
Respiratory<br />
Disease 3<br />
4.5 5.1% 2.3% 3.9 3.5% 1.6%<br />
6. Homicide 0.3 0.3% 2.8% 3.5 3.4% 12.5%<br />
7. Diabetes 3.2 3.6% 2.9% 3.5 3.2% 2.0%<br />
8. Septicemia (Blood<br />
Poisoning)<br />
9. Drug-induced<br />
Deaths of<br />
Undetermined<br />
Manner 4<br />
2.2 2.4% 3.0% 3.5 3.1% 2.1%<br />
0.7 0.9% 5.3% 3.2 2.8% 6.9%<br />
10. Injury 2.9 3.6% 6.4% 2.8 2.5% 4.8%<br />
Sources: Maryland State Vital Statistics Administration & the 2010 US Census.<br />
1 Rates are annual averages for 2005-2009 and are age-adjusted.<br />
2 The statistics accounted for by breast and prostate cancers are based only among deaths and populations of women or for men, respectively.<br />
3 These are deaths due to chronic diseases that affect the lower respiratory tract (which includes the lungs); includes Chronic Obstructive<br />
Pulmonary Disease (COPD), emphysema, chronic bronchitis, and asthma.<br />
4 These are deaths due to legal or illegal drug poisoning that are not accidents, suicides, or homicides.<br />
<strong>Canton</strong>
Mortality by Age<br />
Examining mortality rates in different age groups allows the identification of the age groups with the<br />
highest rates of death.<br />
12<br />
Age group <strong>Canton</strong> <strong>Baltimore</strong> <strong>City</strong><br />
Less than 1 year old 1 6.0 12.1<br />
1-14 years old 6.8 1.8<br />
15-24 years old 15.3 28.9<br />
25-44 years old 40.3 43.6<br />
45-64 years old 143.5 115.0<br />
65-84 years old 471.1 489.9<br />
85 and up 1632.0 1333.3<br />
Source: Maryland State Vital Statistics Administration & the 2010 US Census<br />
All rates are deaths per 10,000 residents in that age group. Rates are annual averages for 2005-2009.<br />
1 This measure is the Infant Mortality Rate(IMR) which is the most universally measured and stable mortality indicator. Infant Mortality Rates<br />
are measured by calculating the number of infant deaths (babies 10µg/dL) 1<br />
Source: Maryland <strong>Department</strong> of Environment, Lead Poisoning Prevention Program.<br />
1 There were 85 children ages 0-6 tested in <strong>Canton</strong> in 2008.<br />
<strong>Canton</strong> <strong>Baltimore</strong> <strong>City</strong><br />
1.2% 3.4%<br />
<strong>Canton</strong>
Birth Outcomes<br />
The health of mothers and their babies is one of the most sensitive measures of a community's health.<br />
Women who receive early prenatal care have greater access to important medical and social services<br />
that support healthy pregnancies and deliveries. Women who do not space their pregnancies healthfully<br />
and report smoking during pregnancy have a greater risk of delivering babies who are preterm and low<br />
birth weight. Babies who are born full term and at a healthy weight are more likely to reach their first<br />
birthday.<br />
Birth Rate (live births per 1,000 persons)<br />
Teen Birth Rate (Live births to females<br />
ages 15-19 per 1,000 persons 15-19<br />
years old)<br />
Percent of Live Births with Inadequate<br />
Spacing<br />
Percent of Women Receiving Prenatal<br />
Care in the First Trimester<br />
Percent of Births to Women Who<br />
Reported Smoking While Pregnant<br />
Percent of live births occurring preterm<br />
(Less than 37 weeks gestation)<br />
Percent of Births Classified as Low<br />
Birthweight (LBW,
8. Neighborhood Summary: Social Determinants of <strong>Health</strong><br />
The summary table below shows how <strong>Canton</strong> compares to the other 54 <strong>Baltimore</strong> neighborhoods in<br />
terms of underlying factors that affect health and health opportunities—the social determinants of<br />
health. These indicators do not represent all factors that affect health. Rather, they comprise a snapshot<br />
of the conditions that determine whether residents will have a fair chance at living long, healthy lives.<br />
14<br />
Social Determinants<br />
Rank of 55<br />
(1=Best)<br />
<strong>Health</strong> Score<br />
Kindergarten Readiness 51 <br />
3rd Grade Reading 23 <br />
8th Grade Reading 6 <br />
Elementary School Absenteeism 29 <br />
Middle School Absenteeism 27 <br />
High School Absenteeism 18 <br />
Adults w/ High School or Less 6 <br />
Adults w/ Bachelor's or More 5 <br />
Community Built Environment <br />
Liquor Store Density 33 <br />
Tobacco Retail Density 29 <br />
Community Social Environment <br />
Juvenile Arrests Rate 34 <br />
Domestic Violence Rate 7 <br />
Non-Fatal Shooting Rate 5 <br />
Homicide Incidence Rate 3 <br />
Housing <br />
Lead Paint Violation Rate 11 <br />
Energy Cutoff Rate 6 <br />
Vacant Building Density 20 <br />
Vacant Lot Density 3 <br />
Food Environment <br />
Fast Food Density 36 <br />
Carryout Density 30 <br />
Corner Store Density 11 <br />
Supermarket Proximity (Driving) 6 <br />
Supermarket Proximity (Bus) 2 <br />
Supermarket Proximity (Walking) 4 <br />
<strong>Health</strong> Score Key<br />
Below Average<br />
(Least <strong>Health</strong>y Third)<br />
Average<br />
(Middle Third)<br />
Above Average<br />
(<strong>Health</strong>iest Third)<br />
<br />
<br />
<br />
<strong>Canton</strong>
9. Neighborhood Summary: <strong>Health</strong> Outcomes<br />
The summary table below shows how <strong>Canton</strong> compares to the other 54 <strong>Baltimore</strong> neighborhoods in<br />
terms of key health outcomes. These outcomes are not exhaustive or representative of all meaningful<br />
health outcomes in <strong>Canton</strong>. Rather, these indicators are just a snapshot of overall health and longevity<br />
in <strong>Canton</strong> that will help identify potential priority areas for action.<br />
15<br />
<strong>Health</strong> Outcomes Rank of 55 (1=Best) <strong>Health</strong> Score<br />
Life Expectancy 7 <br />
Avertable Deaths 7 <br />
YPLL (Per 10,000 Residents) 4 <br />
Mortality<br />
All Causes 7 <br />
Heart Disease 9 <br />
Cancer (all) 35 <br />
Lung Cancer 19 <br />
Colon Cancer 43 <br />
Breast Cancer 21 <br />
Prostate Cancer 22 <br />
Stroke 8 <br />
HIV/AIDS 4 <br />
Chronic Lower Respiratory Disease 34 <br />
Homicide 3 <br />
Diabetes 22 <br />
Septicemia 9 <br />
Drug-Induced (of undetermined manner) 7 <br />
Injury (Accidents) 33 <br />
Maternal and Child <strong>Health</strong><br />
Infant Mortality 6 <br />
Low Birthweight 19 <br />
Prenatal Care in First Trimester 4 <br />
Births to Mothers Who Smoke 11 <br />
<strong>Health</strong> Score Key<br />
Below Average<br />
(Least <strong>Health</strong>y Third)<br />
Average<br />
(Middle Third)<br />
Above Average<br />
(<strong>Health</strong>iest Third)<br />
<br />
<br />
<br />
<strong>Canton</strong>
10. Technical Notes<br />
Estimated life expectancy at birth<br />
Defined as the average number of years a person born today would live if he/she experienced the mortality rates observed in<br />
this report over the course of his/her life. The life expectancy estimate in this report reflects the mortality rates among people<br />
living in <strong>Canton</strong> from 2005 to 2009. Babies born today in <strong>Canton</strong> would only experience this life expectancy only if the current<br />
age-specific mortality rates remained constant over the course of their lives. Life expectancy was calculated using a life table<br />
calculator for small area estimates developed by the South East Public <strong>Health</strong> Observatory in England<br />
(http://www.sepho.org.uk/viewResource.aspx?id=8943). The calculator uses an abridged life table methodology, with five-year<br />
age groups (except for under 5 and above 85 which were treated as under 1, 1-4 and above 85) and combines the Chiang and<br />
Silcocks methodologies. Some inaccuracy will result due to the use of age groups rather than single year age categories, as well<br />
as due to small numbers of deaths in certain age groups. For more information on this methodology, please refer to: Williams E,<br />
Dinsdale H, Eayres D, and Tahzib F. Technical Report – Calculating Life Expectancy in Small Areas. Oxford, England: Southeast<br />
England Public <strong>Health</strong> Observatory, 2005 (available at<br />
http://www.sepho.org.uk/Download/Public/9847/1/Life%20Expectancy%20Nov%2005.pdf).<br />
Avertable deaths<br />
Avertable deaths are deaths that could have been avoided if all neighborhoods in <strong>Baltimore</strong> had the same opportunities at<br />
health. Data presented here are based on the assumption that the death rates experienced in the five communities with the<br />
highest median incomes are achievable in every community. Age-sex-specific mortality rates were calculated for ten-year age<br />
groups (except for under 5 and above 85 which were treated as under 1, 1-4 and above 85) for the five CSA’s with the highest<br />
median household incomes. These age-sex-specific reference mortality rates were then applied to the populations of all 55<br />
CSA’s and <strong>Baltimore</strong> <strong>City</strong> as a whole to generate a projected number of deaths for each area. The avertable deaths thus<br />
represents an estimate of the percent of area deaths that would have been avoided if they had experienced the same mortality<br />
rates as the highest income communities for years 2005-2009. A negative percentage means that the area experienced a lower<br />
mortality rate than the top 5 neighborhoods.<br />
Age-adjusted mortality<br />
This represents the number of deaths per 10,000 people per year assuming that each neighborhood had the same age structure<br />
(number of people in each age group). Age adjustment is done so that a neighborhood with a proportionally large number of<br />
elderly people (who are more likely to die because of their age) does not show a higher mortality rate simply because of the<br />
older age of its inhabitants. Age-adjustment was based on 10-year age groups and the 2000 projected US population<br />
distribution #1 (from: Klein RJ, Schoenborn CA. Age-adjustment using the 2000 projected US population. <strong>Health</strong>y People<br />
Statistical Notes, no. 20. Hyattsville, Maryland: National Center for <strong>Health</strong> Statistics. January 2001). Breast and prostate cancer<br />
mortality rates used the sex-specific 2000 projected US Population with the same age groups (from: Day, Jennifer Cheeseman,<br />
Population Projections of the United States by Age, Sex, Race, and Hispanic Origin: 1995 to 2050, US Bureau of the Census,<br />
Current Population Reports, P25-1130, US Government Printing Office, Washington, DC, 1996).<br />
Years of potential life lost (YPLL)<br />
The number of years of life lost due to death before age 75. For example, a person dying at age 74 accrues 1 YPLL, while a<br />
person dying at age 30 accrues 45 YPLL. YPLL provide a measure of the impact of premature mortality on a population. Deaths<br />
that occur earlier in life contribute more years of life lost than deaths later in life, capturing the value society places on young<br />
lives. At the neighborhood level, the YPLL was based on the sum of years of life lost for all the residents of that neighborhood<br />
who died in 2005-2009.<br />
Cause of death<br />
The top ten causes of death are those that accounted for the largest number of deaths in <strong>Baltimore</strong> in 2005-2009.<br />
Built and social environment<br />
Data for juvenile arrests and domestic violence are from the <strong>Baltimore</strong> Neighborhood Indicator’s Alliance (BNIA). The rate was<br />
calculated using the rate provided by BNIA and was divided by 1,000 and then multiplied by the 2010 US Census data to get the<br />
raw values. The densities were then calculated based on 2010 US Census data.<br />
Maternal and child health<br />
Lead poisoning: lead poisoning is when a person has elevated lead in his/her body. This can be determined based on the<br />
amount of lead in the blood. The lead poisoning percentages represent the percentage of <strong>Baltimore</strong> <strong>City</strong> children age 0-6 years<br />
who had an elevated blood-lead level ( 10 g/dL) in 2008 out of all children who were tested. The elevated blood level was<br />
based on the highest venous or, in the absence of a venous test, the highest capillary test. Venous tests, which require a blood<br />
draw, are considered more reliable; however, in their absence, a capillary test (based on a finger stick) can indicate the<br />
presence of lead poisoning. In <strong>Baltimore</strong> <strong>City</strong>, children are required to receive a blood test for lead at 12 and 24 months of age,<br />
but, not all children present for testing.<br />
16<br />
<strong>Canton</strong>
Birth Outcomes: the birth rate is defined as the number of live births per 1,000 persons. The teen birth rate is the number of<br />
live births to females between 15-19 years of age per 1,000 females in the population in that age range. Adequate birth spacing<br />
is defined as spacing of births of greater than 27 months for women. Smoking during pregnancy was reported on the birth<br />
certificate. Preterm births are live births occurring before 37 weeks gestation. Low birth weight is defined as live births weighing<br />
less than 2500g (5 lbs 8oz) at delivery. Infant morality rate: Number of infant deaths (babies less than 1 year of age) per 1,000<br />
live births in a given year.<br />
Aggregation to the Community Statistical Areas (CSAs): all data were aggregated first to the Census tract of residence. Since<br />
CSAs are groupings of census tracts, CSA data were obtained by aggregating Census tract-level data.<br />
Data Sources and Notes<br />
Demographics and socioeconomics<br />
The total population of the city does not include the incarcerated population. The analysis was done excluding the incarcerated<br />
population. Data for the Community Statistical Areas and the city as a whole are from the 2010 Census, the American<br />
Community Survey, or were provided by the <strong>Baltimore</strong> Neighborhood Indicators Alliance—Jacob France Institute<br />
(http://www.bniajfi.org/). The American Community Survey (ACS), administered to a representative sample by the US Census<br />
Bureau, replaced the long form of the decennial census. Annual data is updated through monthly samples across the United<br />
States. Five years of samples are required for small-area data (e.g. census tracts); one year and three year estimates are<br />
available for larger areas (e.g. county-level). The 2010 Census was the short form and for this report provided the information<br />
for the neighborhood population, age, gender, race and ethnicity, family poverty rate, and single-parent household. The<br />
definition of Unemployment from the US Census is as follows: all civilians 16 years old and over are classified as unemployed if<br />
they were neither "at work" nor "with a job but not at work" during the reference week (the calendar week preceding the date<br />
on which the respondents completed their questionnaires or were interviewed), were actively looking for work during the last 4<br />
weeks, and were available to start a job. Also included as unemployed are civilians who did not work at all during the reference<br />
week, were waiting to be called back to a job from which they had been laid off, and were available for work except for<br />
temporary illness.<br />
Education<br />
Kindergarten readiness data are from <strong>Baltimore</strong> <strong>City</strong> Public Schools for school years 2007-2008 and 2008-2009. School<br />
readiness was computed based on the Maryland Model for School Readiness Working Sampling System (WSS). Each year,<br />
teachers use seven domains of learning to assess students’ readiness. The seven domains include: language and literacy,<br />
physical development, social studies, scientific thinking, mathematical thinking, the Arts, and social/personal development.<br />
School absenteeism and reading level data are from the <strong>Baltimore</strong> Neighborhood Indicators Alliance for school year 2008-2009.<br />
BNIA obtained their data from the <strong>Baltimore</strong> <strong>City</strong> School System. Adult educational attainment data are from the American<br />
Community Survey. Maryland School Assessments are scored using a three level system. “Proficient” is a realistic and rigorous<br />
level of achievement indicating proficiency in meeting the needs of students. “Advanced” is a highly challenging and exemplary<br />
level of achievement indicating outstanding accomplishment in meeting the needs of students. The reading levels of the<br />
students are based on where the students live, not the CSA where the students go to school.<br />
Built and social environment<br />
Vacant building and vacant lot data are from the Mayor’s Office of Information Technology, updated December 2009. The<br />
Mayor’s Office of Information Technology obtained the data on vacant buildings from the <strong>Baltimore</strong> <strong>City</strong> Housing <strong>Department</strong><br />
and the data on vacant lots from the Real Property Management Database. Liquor store data are from the <strong>City</strong> liquor Board and<br />
include only Class “A” licenses, updated May 2009. Tobacco data are from the <strong>City</strong> Comptroller, updated April 2009. The<br />
Comptroller maintains data on tax revenue, licensure, regulation, and other-related items related to alcohol and tobacco<br />
outlets. These data were geocoded by BCHD and used to calculate CSA-level densities. Data for juvenile arrests and domestic<br />
violence calls for service are from the <strong>Baltimore</strong> Neighborhood Indicator's Alliance (BNIA).BNIA obtained the data from the<br />
<strong>Baltimore</strong> <strong>City</strong> Police <strong>Department</strong>. BNIA calculated the rates for domestic violence and juvenile arrests based on population<br />
statistics from the 2000 US Census. The <strong>Baltimore</strong> <strong>City</strong> <strong>Health</strong> <strong>Department</strong> transformed the rates from BNIA back into counts<br />
using population statistics from the 2000 Census. We then calculated new rates for juvenile arrests and domestic violence<br />
based on newly available population statistics from the 2010 US Census. The juvenile arrest rate reflects the number of<br />
individuals who were arrested (e.g. apprehended, taken into custody or detention, held for investigation, arrested, charged<br />
with, indicted or tried for any offense). The arrest rate differs from the rate of conviction (not included here), which would<br />
reflect the number of persons found guilty and convicted of an offense.<br />
Housing<br />
Lead paint violation data are from the Mayor’s Office of Information Technology, updated December 2009. Only lead paint<br />
violations for years 2000-2008 were used to calculate rates for this report. The Mayor’s Office of Information Technology<br />
obtained the information from the <strong>Baltimore</strong> <strong>City</strong> Real Property Systems (BITs). Energy cutoff data are from <strong>Baltimore</strong> Gas and<br />
Electricity, as provided to BCHD from 9/1/2010 through 8/31/2010. Cutoffs were geocoded by BCHD and used to calculate CSA-<br />
17<br />
<strong>Canton</strong>
level rates. These data include only unduplicated complaints made to or fulfilled by <strong>Baltimore</strong> Housing and Community<br />
Development and grouped under “Housing Code Enforcement,” regardless of the outcome of the complaint (e.g. violation,<br />
citation, no action etc).<br />
Food environment<br />
Fast food and carryout data are from the BCHD open food facilities permit/license database, updated June 2009. These data<br />
were geocoded and used to calculate CSA-level densities. The <strong>Baltimore</strong> <strong>City</strong> <strong>Health</strong> <strong>Department</strong> identifies the establishments<br />
as a carryout and then separates the carryouts into chain fast food restaurants and carryouts. Fast food restaurants were<br />
categorized as the following: Blimpie, Burger King, California Tortilla, Chipotle, Dunkin’ Donuts, Five Guys, KFC, Long John<br />
Silver’s, McDonald’s, Popeye’s, Potbelly’s, Quizno’s, Subway, Taco Bell, and Wendy’s. Carryout data in this report reflect<br />
establishments coded as a “carryout” in the database, as well as establishments that were not coded as a carryout but had<br />
“carryout” either 1) in their restaurant name, or 2) on their restaurant signage (verified via Google Street View). Corner store<br />
data are from the Center for a Livable Future and include corner stores, convenience stores, dollar stores, and gas stations with<br />
minimarts. These data were updated January 2011 and used as provided. The travel time to the nearest supermarket was<br />
calculated by Nicole Robinson. To calculate this time, the center of population was calculated for each CSA by identifying the<br />
Census Block Group with the highest population. The geographic center of the most highly populated Census Block Group (i.e.<br />
the center of population) was used as the starting point for each CSA. ArcMap was used to identify the closest supermarket to<br />
the center of population. Google Maps was then used to determine the time it takes to arrive at the nearest grocery store from<br />
the center of population. Google Maps estimates travel time for multiple modes of transportation including walking, driving,<br />
and using public transportation (based on public transportation schedule). A food desert is an area that lacks access to healthy<br />
and affordable foods.<br />
Life expectancy, years of potential life lost, avertable deaths, and mortality rates<br />
Life expectancy, years of potential life lost, avertable deaths, and mortality rates were computed based on death records for<br />
2005-2009 provided by the Vital Statistics Administration at the Maryland <strong>Department</strong> of <strong>Health</strong> and Mental Hygiene, and<br />
population denominators obtained from the Census 2010 Summary File 1 for <strong>Baltimore</strong> <strong>City</strong>, Maryland.<br />
Maternal and child health<br />
Lead poisoning: 2008 lead poisoning data were from the Maryland <strong>Department</strong> of the Environment, Lead Poisoning Prevention<br />
Program.<br />
Birth outcomes: 2005-2009 <strong>Baltimore</strong> <strong>City</strong> birth outcomes were computed from birth records provided by the Vital Statistics<br />
Administration of the Maryland <strong>Department</strong> of <strong>Health</strong> and Mental Hygiene.<br />
Limitations<br />
Small numbers<br />
Because neighborhoods can have small population sizes in certain age groups, there is the possibility that small differences<br />
could produce large differences in rates. We addressed this potential issue by grouping years together and thereby estimating<br />
rates using larger numbers. Despite this, there is some uncertainty associated with these estimates due to the small population<br />
sizes involved.<br />
Data availability<br />
These reports only contain data on a select set of indicators of health and the social determinants of health among many other<br />
possible indicators. Data were not included for smoking and healthcare-seeking behaviors, diet, exercise, the prevalence of<br />
chronic diseases, disability, drug addiction, and mental illness, air quality measures, stress, and a range of other individual- and<br />
community-level social determinants such as language ability, health literacy, social support, social capital, and social cohesion.<br />
18<br />
<strong>Canton</strong>